oil markets outlook - latest oil, energy & metals news, … · · 2013-09-24oil prices rise...
TRANSCRIPT

© 2013 Platts, McGraw Hill Financial. All rights reserved.
Oil Markets Outlook
Esa Ramasamy Editorial Director Singapore, September 18 2013
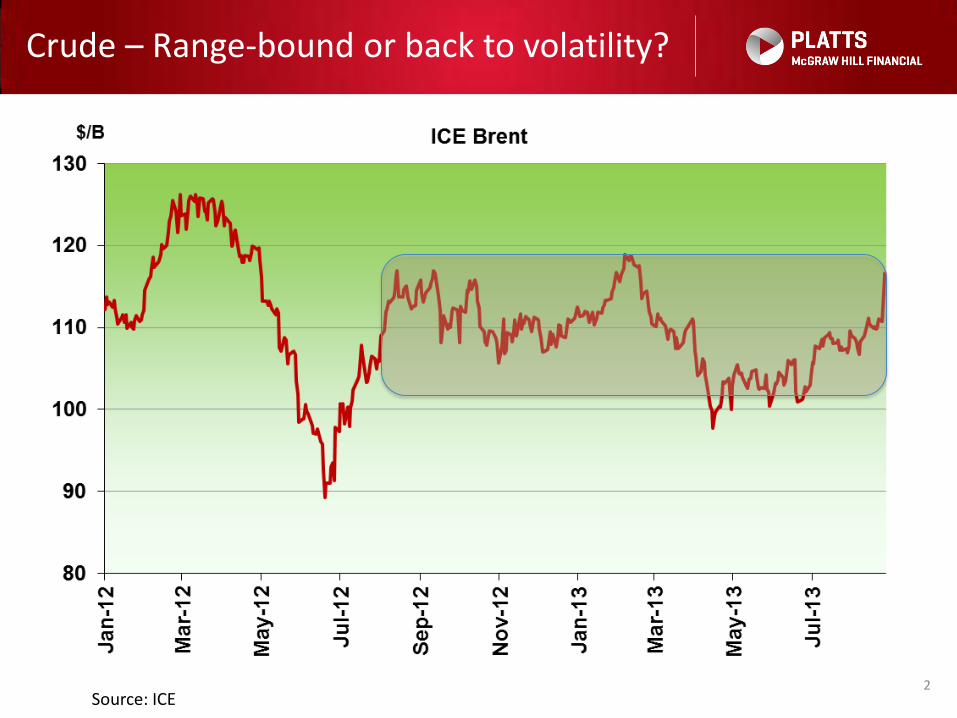
Crude – Range-bound or back to volatility?
2 Source: ICE

Making sense of the fundamentals…
• The US is awash with crude oil and refined products
• US oil demand is almost flat year on year and declining in some sectors
• Europe oil use continues to decline
• China, India consumption growth moderating
• OPEC is pumping above its 30 mil b/d ceiling
So why are oil prices high?
3
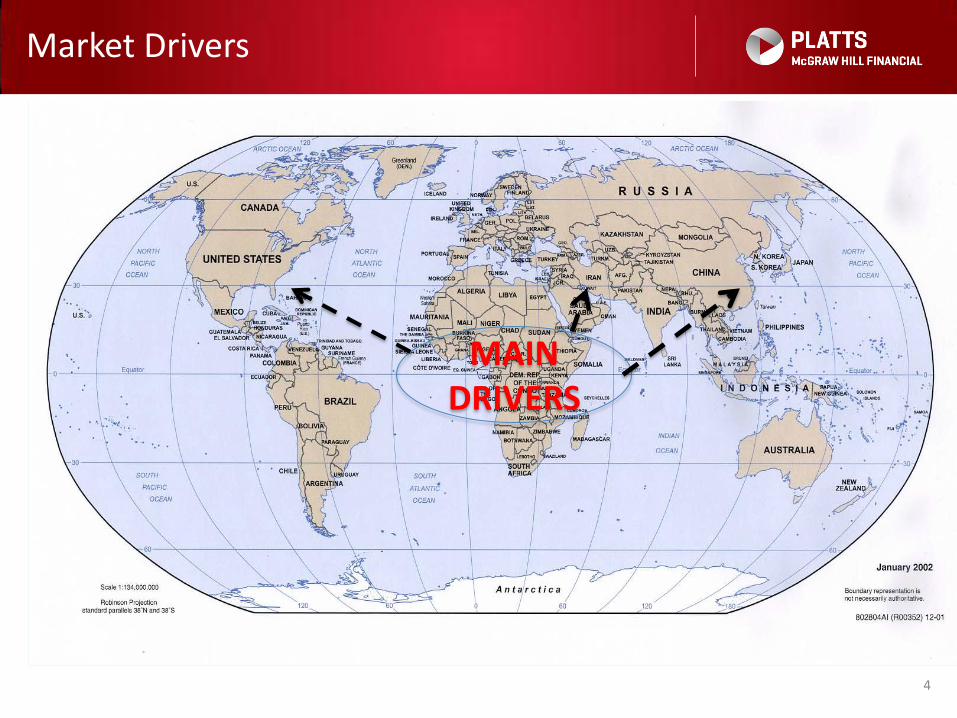
Market Drivers
4
MAIN DRIVERS
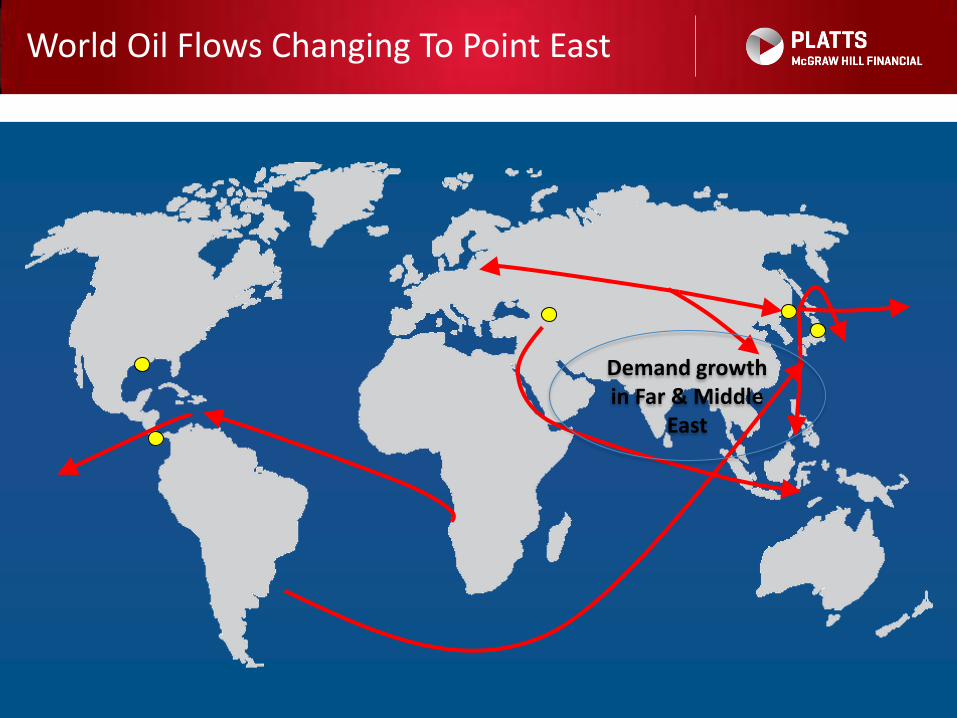
World Oil Flows Changing To Point East
Demand growth in Far & Middle
East
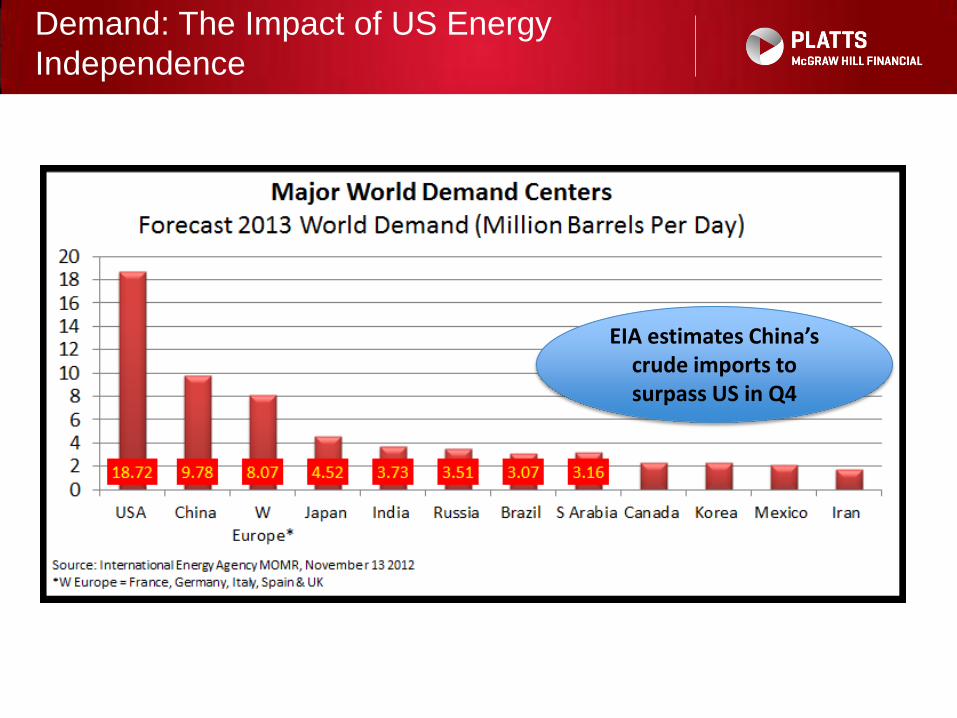
Demand: The Impact of US Energy
Independence
EIA estimates China’s crude imports to surpass US in Q4

Consumption Growth From Asia Pacific
7 Source: World Oil Outlook, OPEC
• Asia Pacific to see largest demand growth, but also largest refinery capacity increase
• Europe and Africa both facing steady diesel demand growth, coupled with limited capacity growth, or even reversal
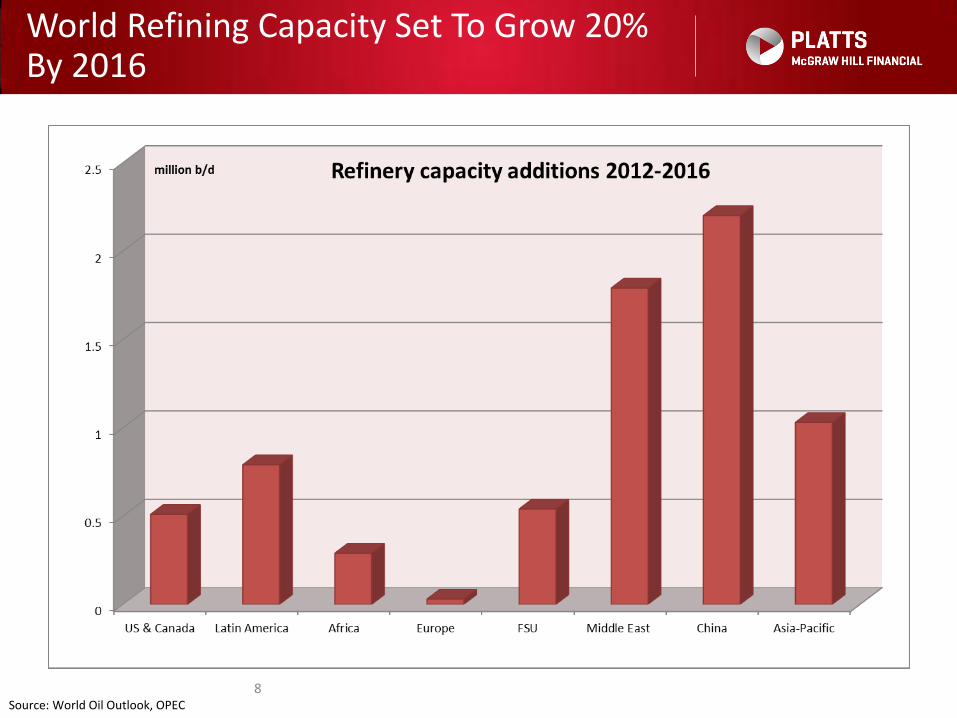
World Refining Capacity Set To Grow 20% By 2016
8 Source: World Oil Outlook, OPEC
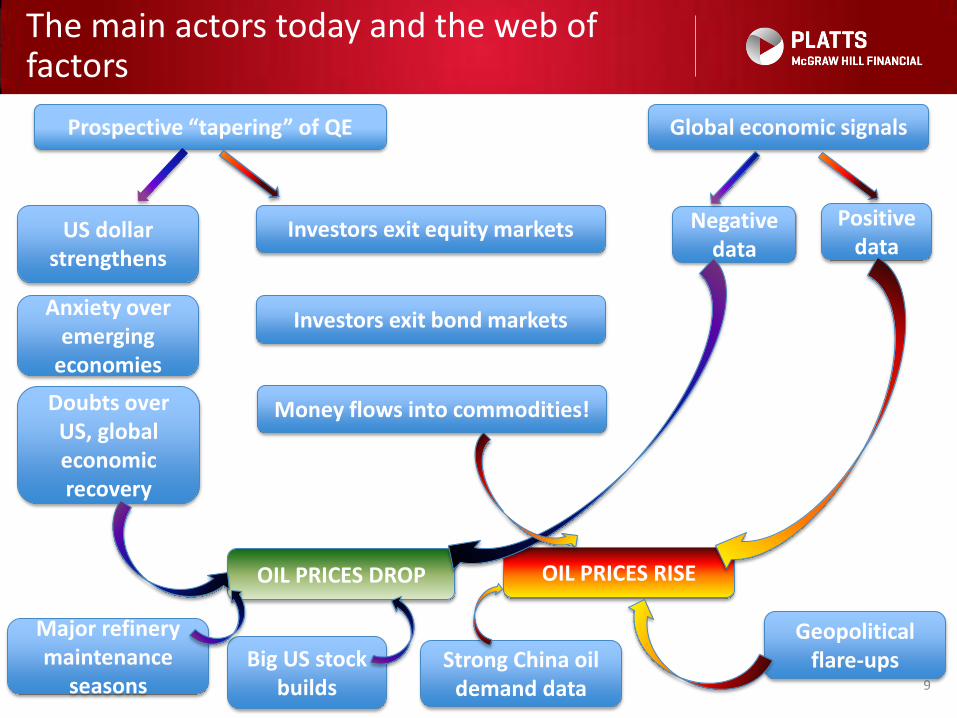
The main actors today and the web of factors
9
Prospective “tapering” of QE
US dollar strengthens
OIL PRICES DROP
Anxiety over emerging
economies
Doubts over US, global economic recovery
Investors exit equity markets
Money flows into commodities!
OIL PRICES RISE
Investors exit bond markets
Global economic signals
Negative data
Positive data
Geopolitical flare-ups Strong China oil
demand data
Major refinery maintenance
seasons Big US stock
builds
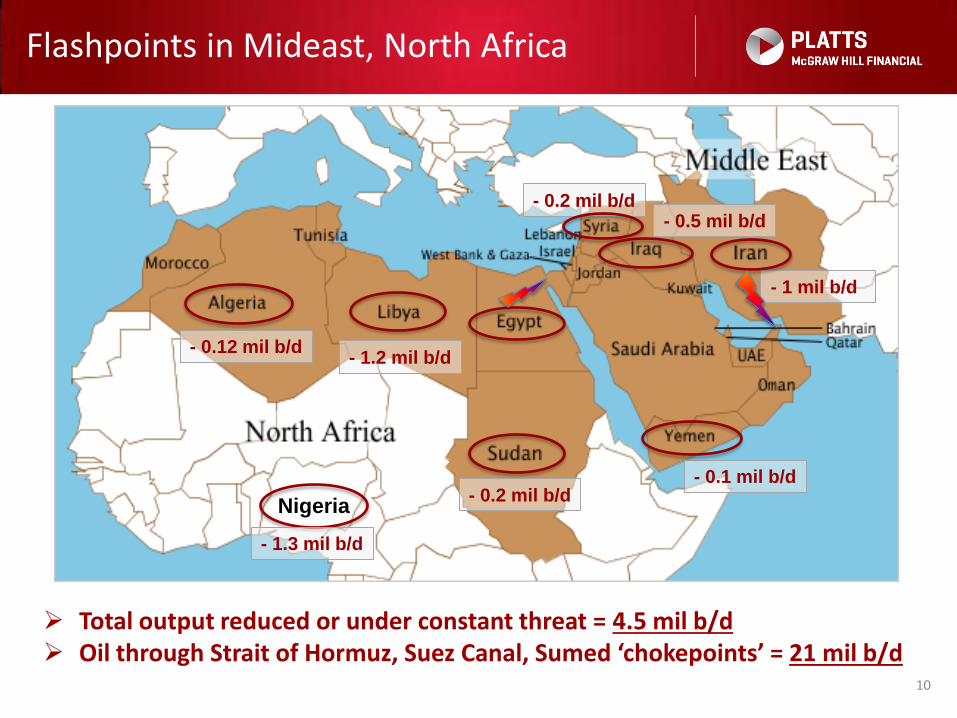
Flashpoints in Mideast, North Africa
10
- 1.2 mil b/d
- 1 mil b/d
- 0.5 mil b/d
- 0.2 mil b/d - 0.1 mil b/d
- 0.2 mil b/d
- 0.12 mil b/d
Nigeria
- 1.3 mil b/d
Total output reduced or under constant threat = 4.5 mil b/d Oil through Strait of Hormuz, Suez Canal, Sumed ‘chokepoints’ = 21 mil b/d
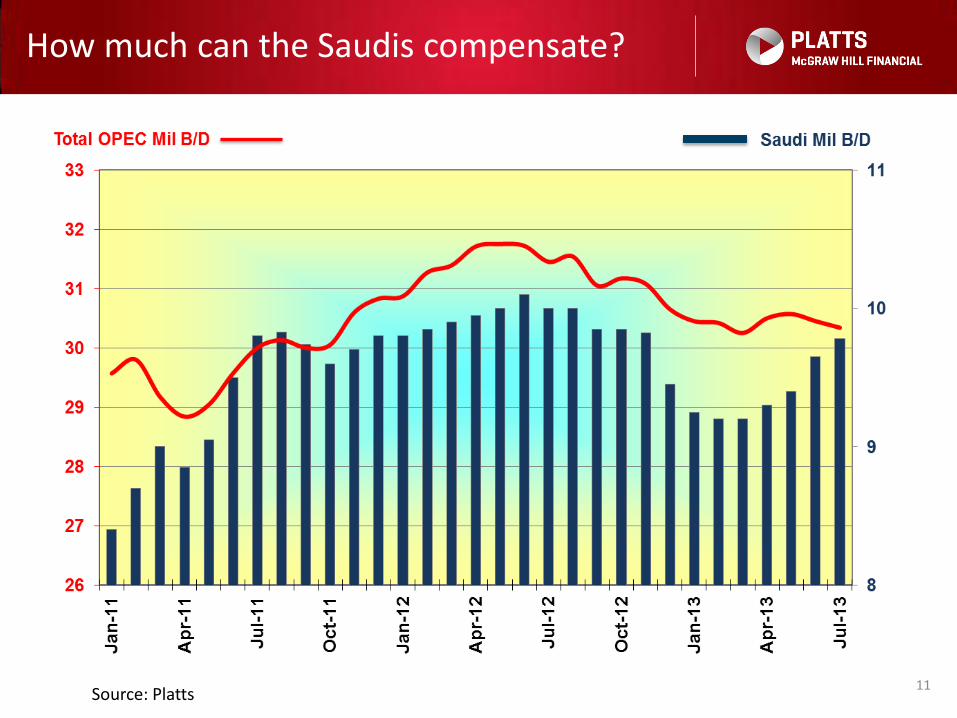
How much can the Saudis compensate?
11 Source: Platts
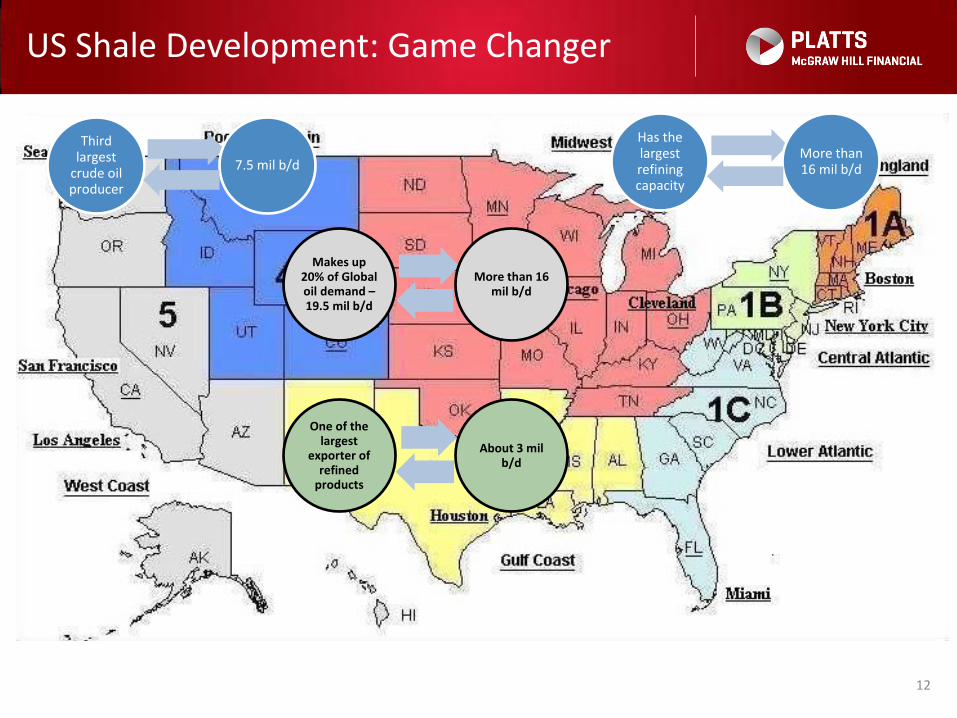
US Shale Development: Game Changer
12
Third largest
crude oil producer
7.5 mil b/d
Has the largest refining capacity
More than 16 mil b/d
Makes up 20% of Global oil demand – 19.5 mil b/d
More than 16 mil b/d
One of the largest
exporter of refined
products
About 3 mil b/d
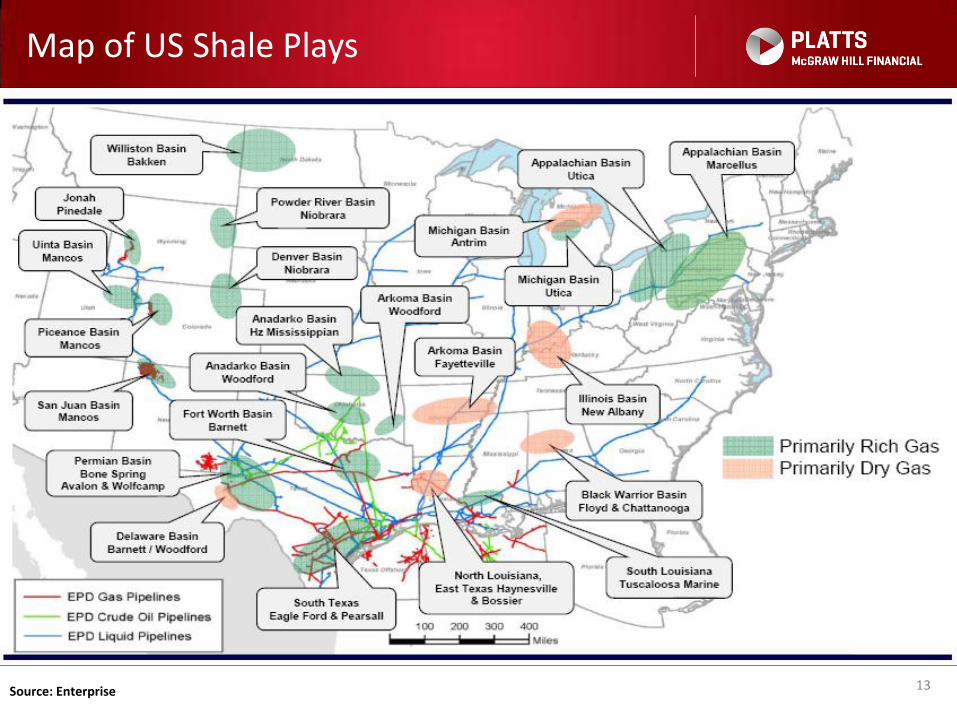
Map of US Shale Plays
13 Source: Enterprise
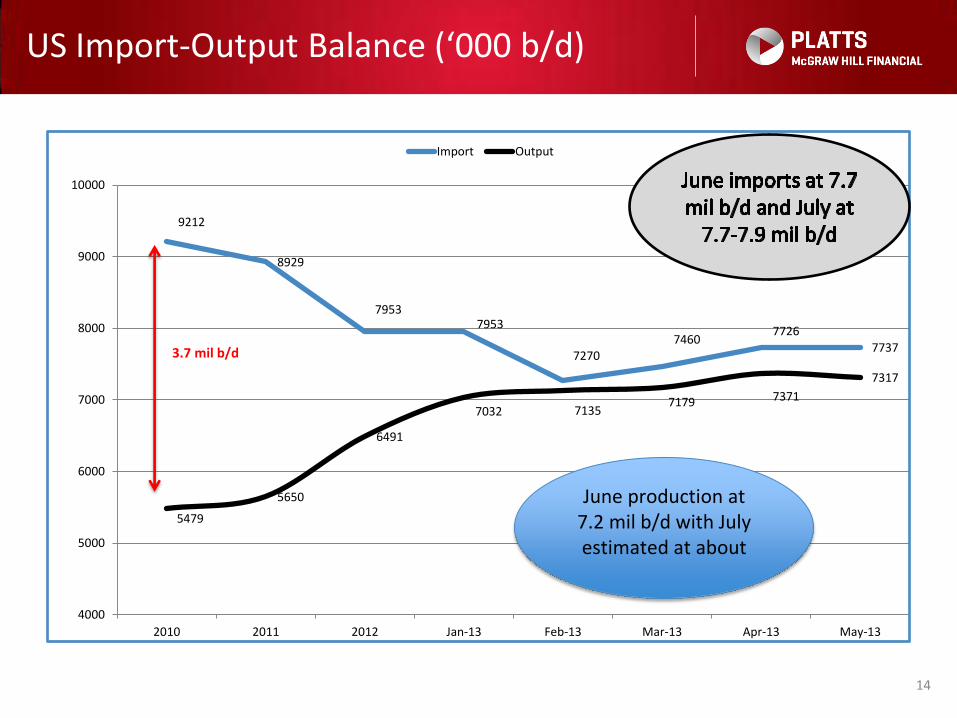
US Import-Output Balance (‘000 b/d)
14
9212
8929
7953 7953
7270 7460
7726 7737
5479
5650
6491
7032 7135 7179 7371
7317
4000
5000
6000
7000
8000
9000
10000
2010 2011 2012 Jan-13 Feb-13 Mar-13 Apr-13 May-13
Import Output
3.7 mil b/d
June production at 7.2 mil b/d with July estimated at about
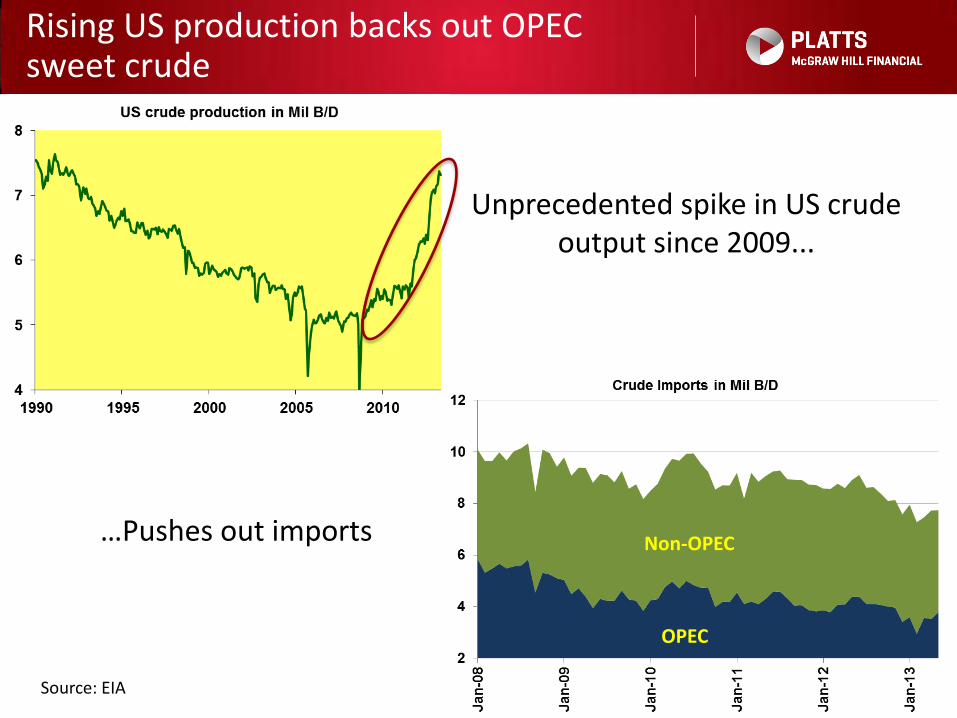
Rising US production backs out OPEC sweet crude
15
Unprecedented spike in US crude output since 2009...
…Pushes out imports
OPEC
Non-OPEC
Source: EIA
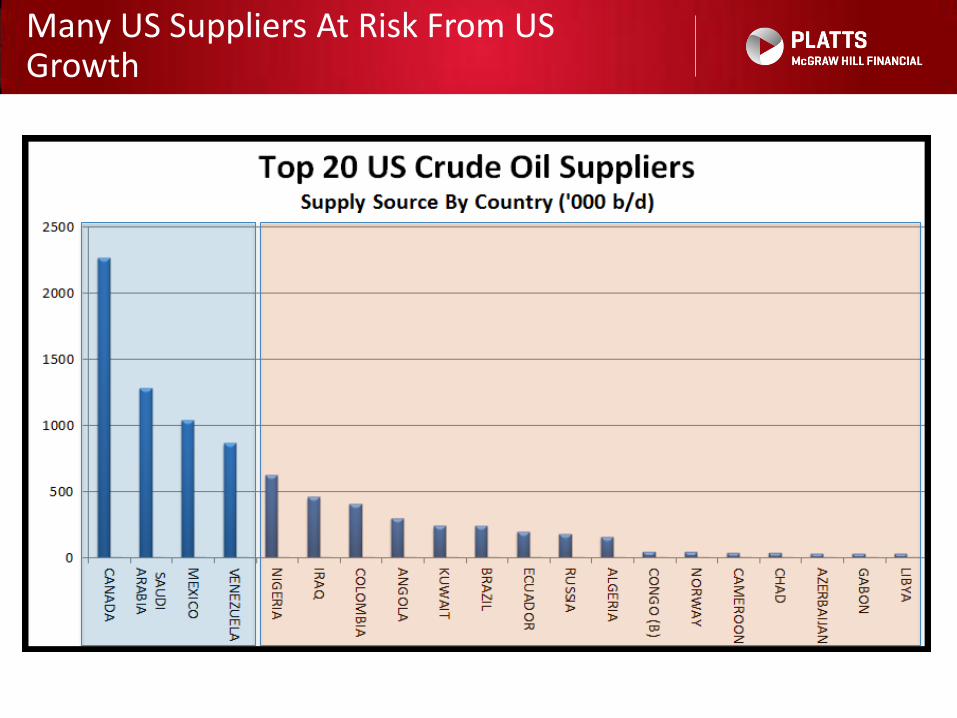
Many US Suppliers At Risk From US Growth
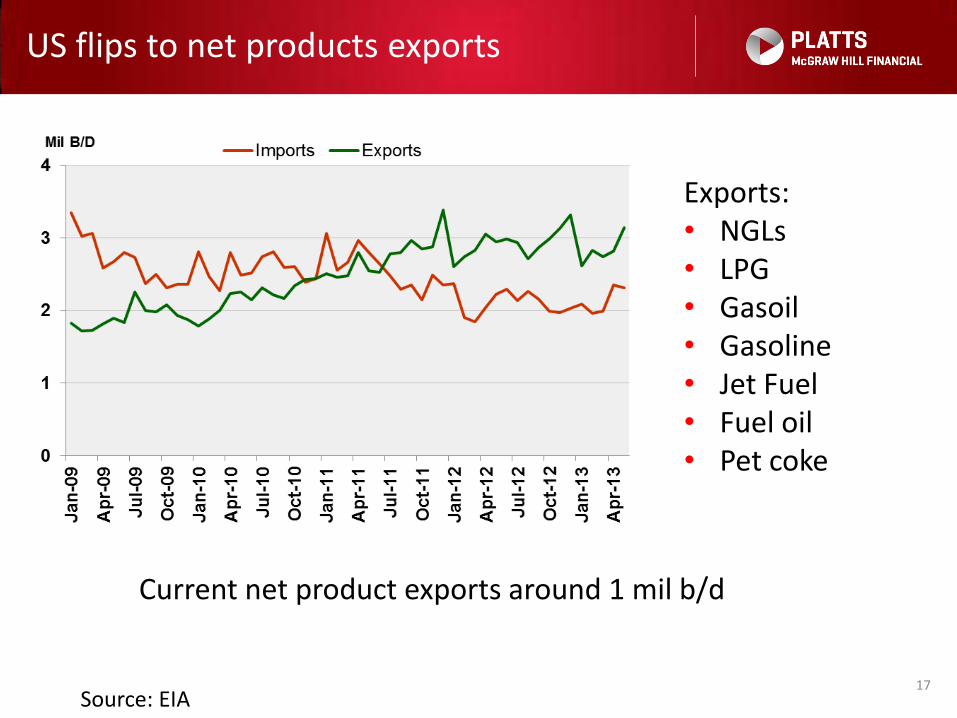
US flips to net products exports
17
Current net product exports around 1 mil b/d
Exports: • NGLs • LPG • Gasoil • Gasoline • Jet Fuel • Fuel oil • Pet coke
Source: EIA
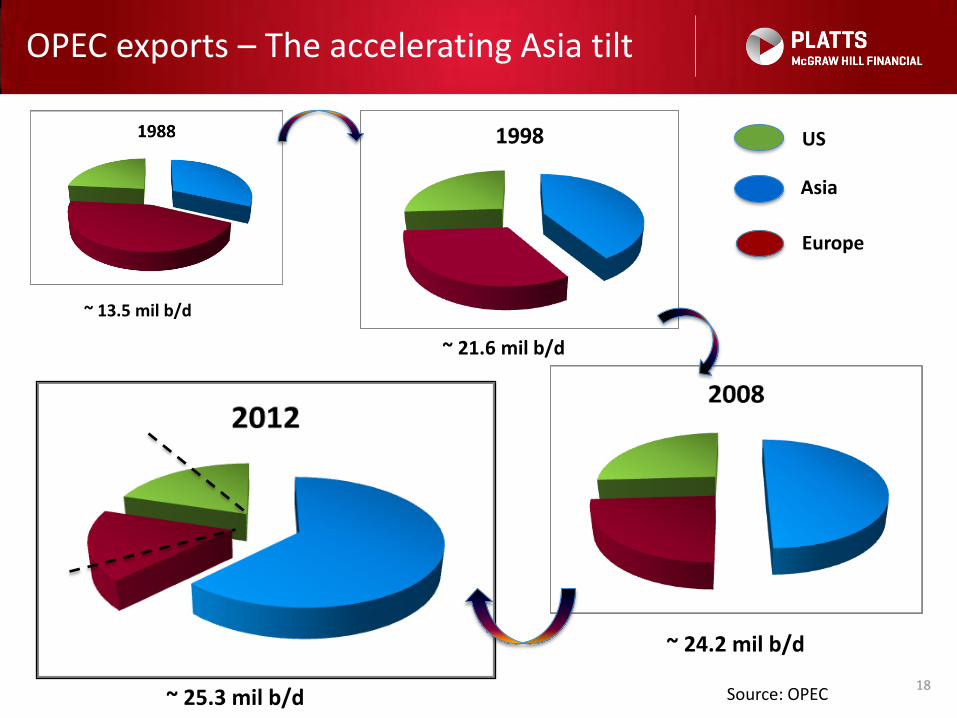
OPEC exports – The accelerating Asia tilt
18
US
Asia
Europe
~ 13.5 mil b/d
~ 21.6 mil b/d
~ 24.2 mil b/d
~ 25.3 mil b/d Source: OPEC
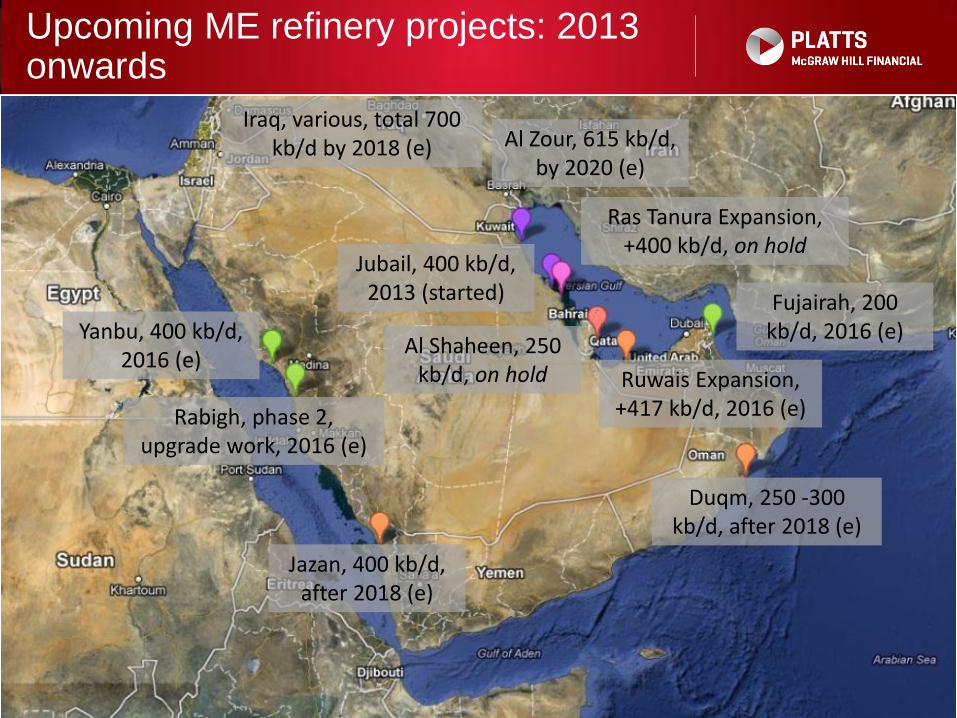
Upcoming ME refinery projects: 2013 onwards
19
19
Yanbu, 400 kb/d, 2016 (e)
Rabigh, phase 2, upgrade work, 2016 (e)
Jazan, 400 kb/d, after 2018 (e)
Duqm, 250 -300 kb/d, after 2018 (e)
Fujairah, 200 kb/d, 2016 (e)
Ruwais Expansion, +417 kb/d, 2016 (e)
Al Shaheen, 250 kb/d, on hold
Jubail, 400 kb/d, 2013 (started)
Ras Tanura Expansion, +400 kb/d, on hold
Al Zour, 615 kb/d, by 2020 (e)
Iraq, various, total 700 kb/d by 2018 (e)
Chinese refining growth – There’s no stopping
20
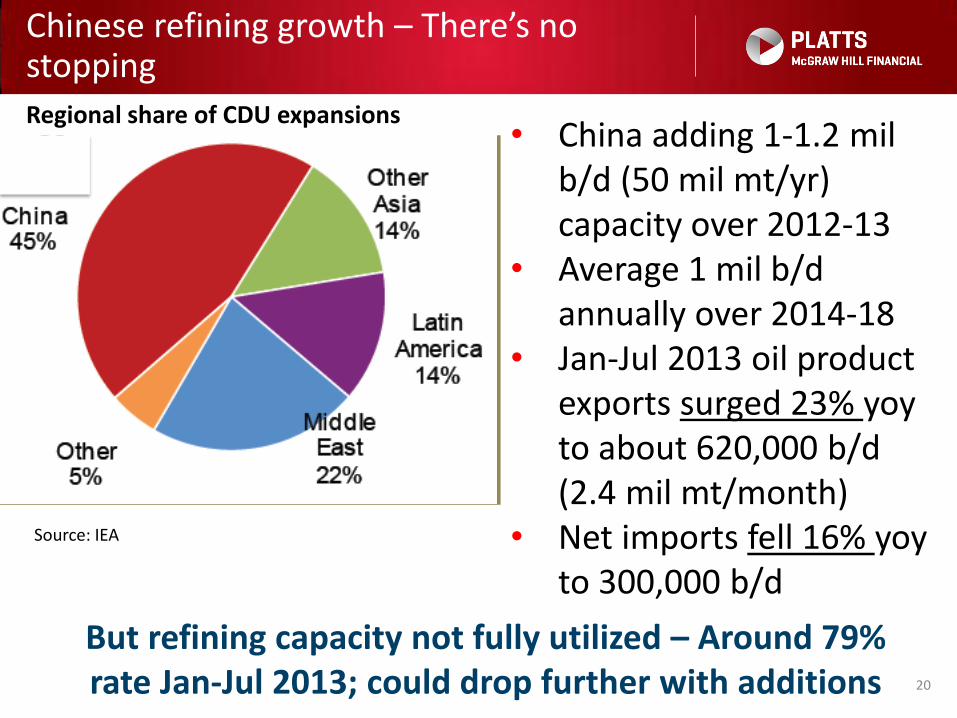
Regional share of CDU expansions • China adding 1-1.2 mil
b/d (50 mil mt/yr) capacity over 2012-13
• Average 1 mil b/d annually over 2014-18
• Jan-Jul 2013 oil product exports surged 23% yoy to about 620,000 b/d (2.4 mil mt/month)
• Net imports fell 16% yoy to 300,000 b/d
But refining capacity not fully utilized – Around 79% rate Jan-Jul 2013; could drop further with additions
Source: IEA
Korean refiners left with few options
21
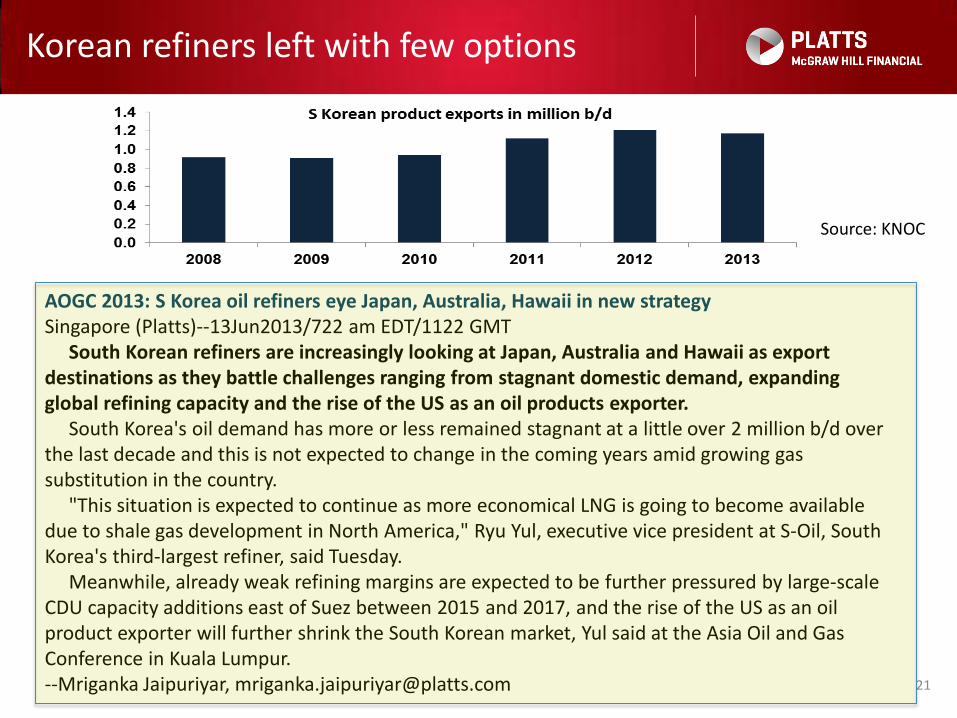
AOGC 2013: S Korea oil refiners eye Japan, Australia, Hawaii in new strategy Singapore (Platts)--13Jun2013/722 am EDT/1122 GMT South Korean refiners are increasingly looking at Japan, Australia and Hawaii as export destinations as they battle challenges ranging from stagnant domestic demand, expanding global refining capacity and the rise of the US as an oil products exporter. South Korea's oil demand has more or less remained stagnant at a little over 2 million b/d over the last decade and this is not expected to change in the coming years amid growing gas substitution in the country. "This situation is expected to continue as more economical LNG is going to become available due to shale gas development in North America," Ryu Yul, executive vice president at S-Oil, South Korea's third-largest refiner, said Tuesday. Meanwhile, already weak refining margins are expected to be further pressured by large-scale CDU capacity additions east of Suez between 2015 and 2017, and the rise of the US as an oil product exporter will further shrink the South Korean market, Yul said at the Asia Oil and Gas Conference in Kuala Lumpur. --Mriganka Jaipuriyar, [email protected]
Source: KNOC
Indian refined product exports steady – so far
• Indian private sector oil product exports averaged just over 4 mil mt/month (about 1 mil b/d) Jan-Jul 2013, flat from 2012 despite rise in Essar capacity – Exports comprise nearly 60% diesel, 15% gasoline
• Another 1.3-1.5 mil mt/month from PSU refiners – Predominantly naphtha and fuel oil
• Around 27.5 mil mt/year (553,000 b/d) capacity addition over 2011-2013
• Plans and projects to add another 36.7 mil mt/year (734,000 b/d) over 2014-2016
22
India’s product surplus to rise – dramatically – if domestic demand growth stalls
23
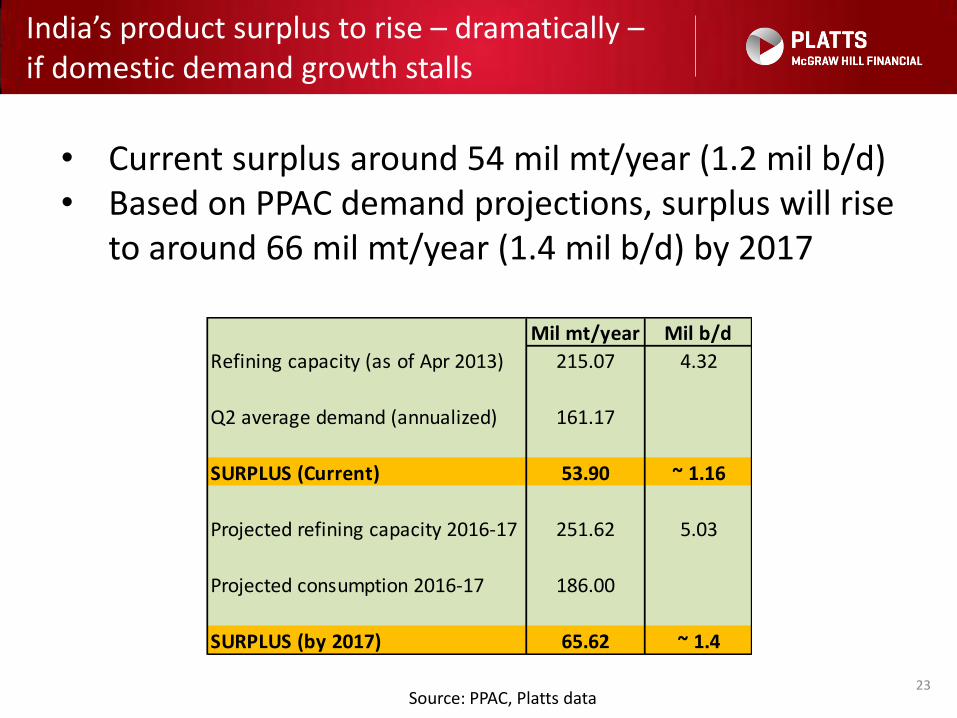
• Current surplus around 54 mil mt/year (1.2 mil b/d) • Based on PPAC demand projections, surplus will rise
to around 66 mil mt/year (1.4 mil b/d) by 2017
Source: PPAC, Platts data
Mil mt/year Mil b/d
Refining capacity (as of Apr 2013) 215.07 4.32
Q2 average demand (annualized) 161.17
SURPLUS (Current) 53.90 ~ 1.16
Projected refining capacity 2016-17 251.62 5.03
Projected consumption 2016-17 186.00
SURPLUS (by 2017) 65.62 ~ 1.4
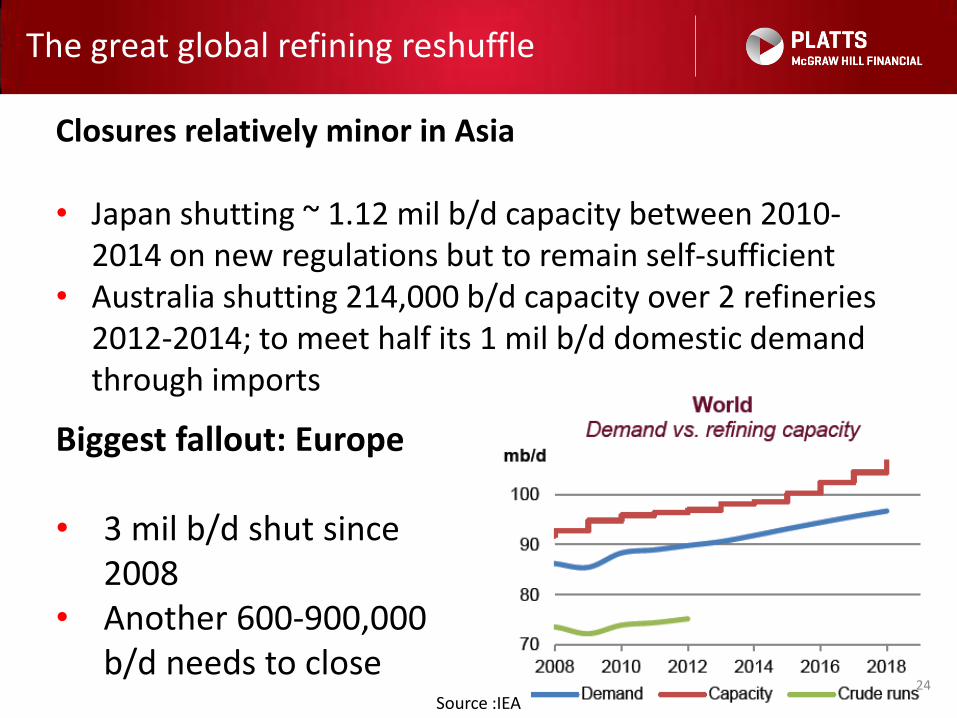
The great global refining reshuffle
24
Closures relatively minor in Asia • Japan shutting ~ 1.12 mil b/d capacity between 2010-
2014 on new regulations but to remain self-sufficient • Australia shutting 214,000 b/d capacity over 2 refineries
2012-2014; to meet half its 1 mil b/d domestic demand through imports
Biggest fallout: Europe • 3 mil b/d shut since
2008 • Another 600-900,000
b/d needs to close Source :IEA
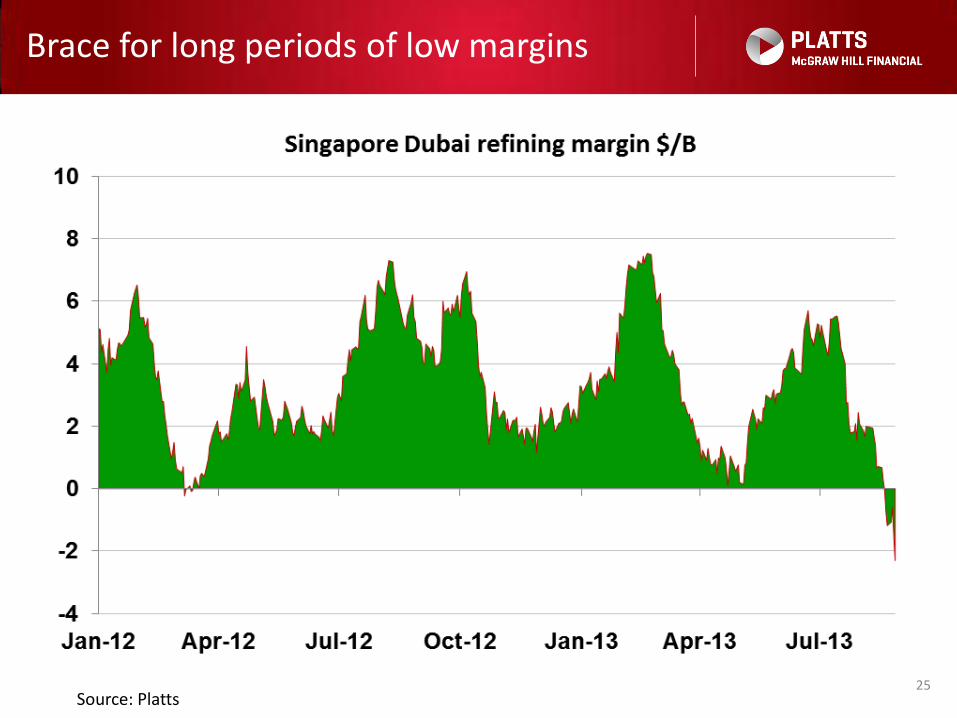
Brace for long periods of low margins
25 Source: Platts
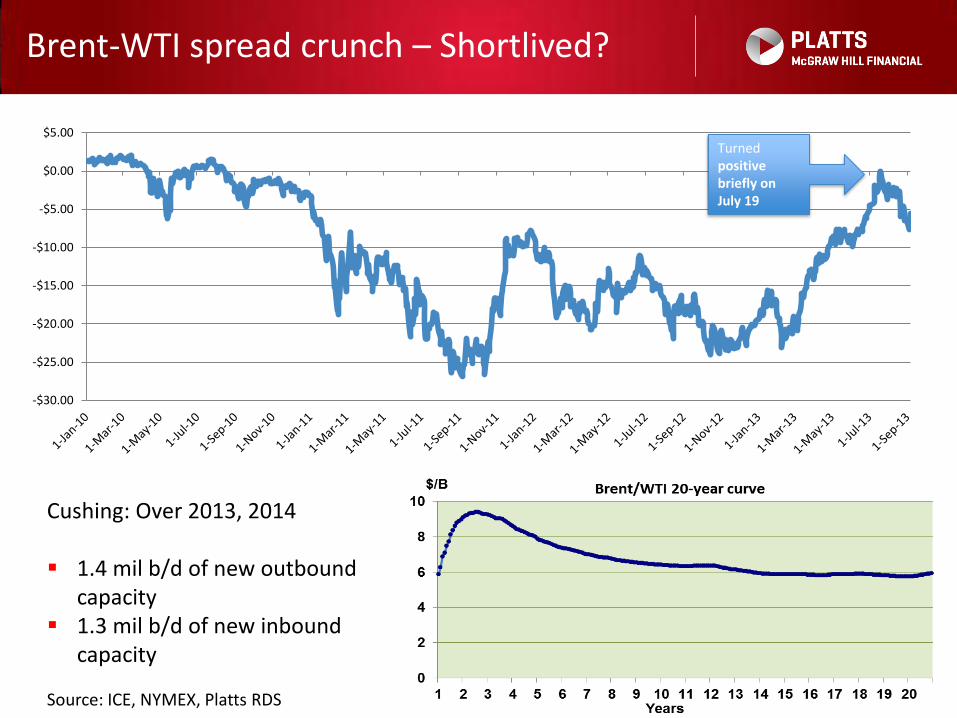
Brent-WTI spread crunch – Shortlived?
26 Source: ICE, NYMEX, Platts RDS
Cushing: Over 2013, 2014 1.4 mil b/d of new outbound
capacity 1.3 mil b/d of new inbound
capacity
-$30.00
-$25.00
-$20.00
-$15.00
-$10.00
-$5.00
$0.00
$5.00Turned positive briefly on July 19
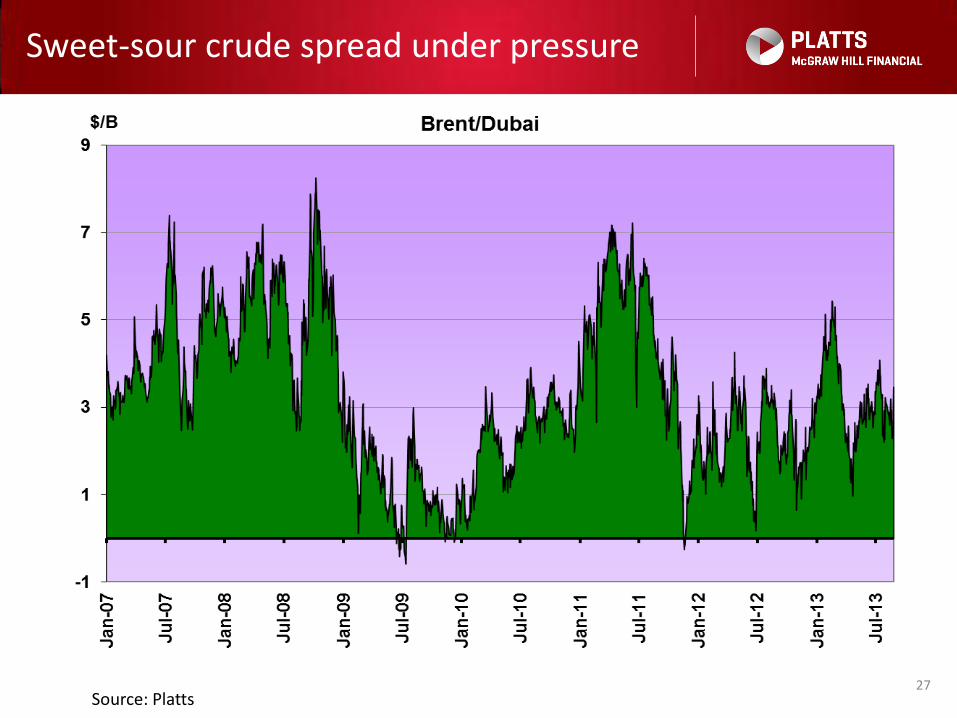
Sweet-sour crude spread under pressure
27 Source: Platts