oil & natural gas technology library/research/oil-gas/methane... · 2. accomplishments . ......
TRANSCRIPT

Oil & Natural Gas Technology
DOE Award No.: DE- FE0013961
Quarterly Research Performance Progress Report (Period ending 12/31/2014)
Borehole Tool for the Comprehensive Character-ization of Hydrate-Bearing Sediments
Project Period (10/1/2013 to 9/30/2016)
Submitted by: J. Carlos Santamarina
Georgia Institute of Technology
DUNS #: 097394084 505 10th street
Atlanta , GA 30332 e-mail: [email protected]
Phone number: (404) 894-7605
Prepared for: United States Department of Energy
National Energy Technology Laboratory
Submission date: 1/29/2015
Office of Fossil Energy
1
DISCLAIMER: This report was prepared as an account of work sponsored by an agency of the United States Government. Neither the United States Government nor any agency thereof, nor any of their employees, makes any warranty, express or implied, or assumes any legal liability or responsibility for the accuracy, completeness, or usefulness of any information, apparatus, product, or process disclosed, or represents that its use would not infringe privately owned rights. Reference herein to any specific commercial product, process, or service by trade name, trademark, manufacturer, or otherwise does not necessarily constitute or imply its endorsement, rec-ommendation, or favoring by the United States Government or any agency thereof. The views and opinions of authors expressed herein do not nec-essarily state or reflect those of the United States Government or any agency thereof.
2

ACCOMPLISHMENTS
Context – Goals. The determination of physical properties for hydrate bearing sediments relies
on correlations with geophysical measurements, and experimental data gathered on
conventional and pressure cores; however, there is intrinsic uncertainty in correlations and
inherent sampling disturbance and testing difficulties when hydrate bearing sediments are
involved. This research focuses on the development of a robust borehole tool for the
comprehensive characterization of hydrate bearing sediments in-situ, complemented with an IT
tool for the selection of appropriate material parameters.
Accomplishments
The main accomplishments for this period include:
• IT tool (sub-task 2.1: Update database of hydrate-bearing sediment properties)
o Uncertainty analysis
o Improved interface
o Database management system
• Borehole tool (sub-task 4.1: Electronics)
o Impedance analyzer: Measurement errors analyzed
• Borehole tool (sub-task 4.2: Lab Testing)
o Sampler (cont.)
o Temperature dependency on the tip module (re-run test)
3

Plan - Next reporting period
Improve the interface and database management system, and finish user’s manual. Contact
industry to finalize connector design and to build the body of the tool (attachment with borehole
drilling string).
Research in Progress
Borehole Tool: General description
The borehole tool is a train of modules, machined in stainless steel 316. The tool couples to the
drill string and bottom hole assembly BHA. Penetration is based on the weight of the drilling
rods (either actively pushing or passive reaction).
Force module: temperature delay
The penetration module consists of three parts: the penetration body, tip and sleeve. The sleeve
houses strain gauges and thermocouples (Figure 1-a). The thermocouples are located inside the
sleeve, and not in direct contact with the medium, therefore a time delay between the external
temperature and the temperature reading is expected.
The first mock-up of the force module used wax to immobilize the thermocouples during
assembly. The wax created an undesirable medium with relatively low thermal conductivity,
showing a time delay of 2.6 min during cooling and 1.0 min during heating (see Report nr. 3 –
July 2014).
This test was re-run removing the wax and using high conductivity grease instead. Results are
shown in Figure 1-b.
4

Figure 1: Force module temperature test re-run. a) Force module; b) Temperature delay test re-sults.
Sampler
The in-situ device includes two samplers next to it (60cm long, diameter OD = 25mm). A new
field test was conducted on the fine grained soils of Georgia Tech campus, to compare its
performance to complete the field test in coarse grained soil (sandy beach, Lake Acworth, GA;
September Report 2014). Tests involve steady state continuous push and dynamic penetration
(Figure 2-a and 2-b).
Similar observations to the one reported in previous reports are as follows (Figure 2-d):
• The dynamic driving allows for higher sample length without plugging.
• The internal diameter reduction hinders/delays the development of friction against the
internal wall: soil removal/cleaning is simpler and faster
5

Figure 2: Experimental study: a) continuous push schematics; b) hammering; c) samplers di-mensions; d) compilation of results of coarse grained and fine grained soil.
6

Electronics
A direct comparison of the impedance analyzer chip was performed. With a 10 kOhm
comparison resistor, it was possible to measure impedances from approximately 6 kOhms to 200
kOhms with error less than 5%. Below 6 kOhms the error increases dramatically (amplifier in the
chip reaching its maximum output). Above 200 kOhms the error increases linearly (Figure 3).
Errors below 6 kOhms (not shown in the figure) increase quickly: 300% at 1k, 800% at 500
Ohms. A new impedance analyzer chip is being considered for comparison.
Figure 3: Impedance analyzer comparison test: Error respect to measured resistance.
IT Tool
Uncertainty analysis for the IT tool
Most correlations are based on deterministic models. However, all predictions have certain
degree of uncertainty. Uncertainty may be due to the structure of the model, errors in the data set,
and/or measurements (Figure 4). Furthermore uncertainty in the input is propagated across
models. Finally, a better prediction can be obtained by comparing uncertainties of alternative
models (McBratney et al., 2002). In this study, the framework related to the uncertainty analysis
for the IT tool is based on least squares method (Rawlings et al., 1998; Cook and Weisberg,
1999; Coleman and Steele, 1999; Fuller, 1987; Buonaccorsi, 1995).
7
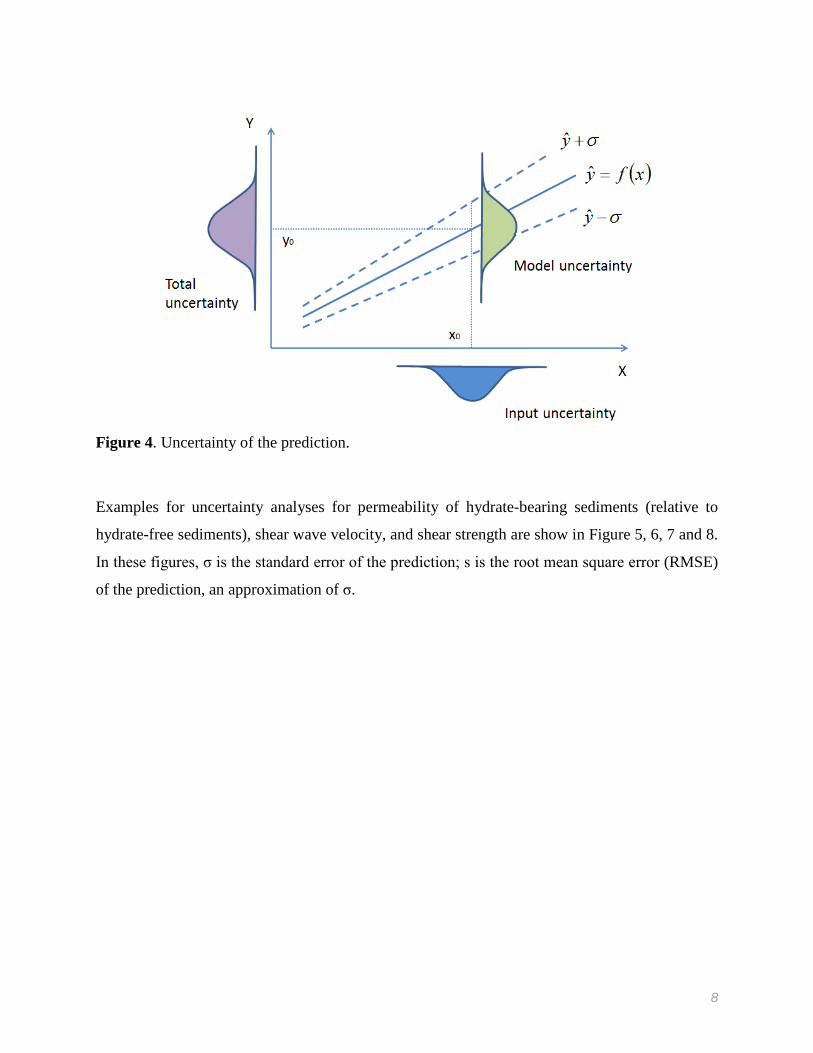
Figure 4. Uncertainty of the prediction.
Examples for uncertainty analyses for permeability of hydrate-bearing sediments (relative to
hydrate-free sediments), shear wave velocity, and shear strength are show in Figure 5, 6, 7 and 8.
In these figures, σ is the standard error of the prediction; s is the root mean square error (RMSE)
of the prediction, an approximation of σ.
8

Figure 5. Permeability of HBS (relative to hydrate-free sediments) versus hydrate saturation. The model used here is log10khbs=alog10(1-Sh).
Figure 6. Examples for uncertainty analysis for shear wave velocity. The error bar in this plot represents 1 standard error of the prediction. Model used here is from Santamarina and Rupple (2008), and the data are from Priest et al. (2009).
0
100
200
300
400
500
600
700
0 100 200 300 400 500 600 700
Pred
icte
d v s
[m/s
]
Measured vs [m/s]
9

Figure 7. Examples for uncertainty analysis for shear strength. Model used here is from Miya-zaki et al. (2012) and data are from Miyazaki et al. (2011).
Figure 8. Summary of uncertainty analysis for shear strength of HBS. The error bar in this plot represents 1 standard error of the prediction. Model used here is from Miyazaki et al. (2012).
0
1
2
3
4
5
6
7
0 0.1 0.2 0.3 0.4 0.5 0.6 0.7
q f[M
Pa]
Sh [ ]
3MPa
2MPa
1MPa
0.5MPa
prediction
prediction+s
prediction-s
0
2
4
6
8
10
0 2 4 6 8 10
Pred
icte
d q f
[MPa
]
Measured qf [MPa]
10

Improved Interface
Current Mathcad-based IT tool is updated as an E-book form, which is readable, editable, and
efficient. As shown in Figure 9, this E-book consists of four Mathcad files: IT_Tool_Code,
IT_Tool_Main, IT_Tool_Reference and Quick_Calculation.
IT_Tool_Code includes most functions for hydrate-bearing sediments properties inference;
IT_Tool_Main is the main interface in which users can enter inputs and calculate sediments
physical properties;
IT_Tool_Reference is a complement for the previous and includes methods to estimate inputs
values in IT_Tool_Main.
Quick_Calculation is the calculation worksheet.
Figure 9. Structure for the IT tool.
Database Management System
A database management system for physical properties of hydrate-bearing sediments is being
developed. This system is based on Microsoft Access. This database management system will
facilitate the processes to store, organize, retrieve, query, analyze, and report data. Microsoft
Access allows to link databases: which helps to store and maintain information more efficiently.
Figure 10 shows the relationship among 5 tables in this system.
11

Figure 10. Relationship among tables for general soil information, large-strain properties, small-strain properties, thermal properties, and hydraulic properties. Reference
Buonaccorsi, J. P. (1995). Prediction in the presence of measurement error: General discussion and an example predicting defoliation. Biometrics, 1562-1569.
Coleman, W. H., & Steele, J. R. WG (1999). Experimentation and Uncertainty Analysis for En-gineers.
Cook, R. D., & Weisberg, S. (1999). Applied regression including computing and graphics (Vol. 488). John Wiley & Sons.
Fuller, W. A. (1987). Measurement error models (Vol. 305). John Wiley & Sons.
McBratney, A. B., Minasny, B., Cattle, S. R., & Vervoort, R. W. (2002). From pedotransfer functions to soil inference systems. Geoderma, 109(1), 41-73.
Miyazaki, K., Masui, A., Sakamoto, Y., Aoki, K., Tenma, N., & Yamaguchi, T. (2011). Triaxial compressive properties of artificial methane‐hydrate‐bearing sediment. Journal of Geophysical Research: Solid Earth (1978–2012), 116(B6).
Miyazaki, K., Tenma, N., Aoki, K., & Yamaguchi, T. (2012). A Nonlinear Elastic Model for Triaxial Compressive Properties of Artificial Methane-Hydrate-Bearing Sediment Sam-ples. Energies, 5(10), 4057-4075.
12

Priest, J. A., Rees, E. V., & Clayton, C. R. (2009). Influence of gas hydrate morphology on the seismic velocities of sands. Journal of Geophysical Research: Solid Earth (1978–2012), 114(B11).
Rawlings, J. O., Pantula, S. G., & Dickey, D. A. Applied regression analysis: a research tool. 1998. Wadsworth and Brooks.
Santamarina, J. C., & Ruppel, C. (2008, July). The impact of hydrate saturation on the mechani-cal, electrical, and thermal properties of hydrate-bearing sand, silts, and clay. In Proceed-ings of the 6th International Conference on Gas Hydrates, Vancouver, BC Canada, July (pp. 6-10).
13

MILESTONE LOG
Milestone Completion Date Comments
Title Planned Date
Verification method
Completion PMP November 2013 Report
11/2013
Title Planned Date
Verification method
Insertion – Tool design September 2014 Report
9/2014
Title Planned Date
Verification method
Database and IT tool September 2014 Report
9/2014 Paper in preparation
Title Planned Date
Verification method
Electronics in operation January 2015 Report
12/2014 Additional progress expected in coming quarters
Title Planned Date
Verification method
Lab testing of prototype September 2015 Report
In progress
Title Planned Date
Verification method
Tool deployment Before September 2016 Report
PRODUCTS
• Publications – Presentations: None at this point
• Website: Publications and key presentations are included in http://pmrl.ce.gatech.edu/.
(for academic purposes only)
• Technologies or techniques: None at this point.
• Inventions, patent applications, and/or licenses: None at this point.
• Other products: None at this point.
14

PARTICIPANTS & OTHER COLLABORATING ORGANIZATIONS
Research Team: The current team is shown next. We anticipate including external collaborators
as the project advances
IMPACT
None at this point.
CHANGES/PROBLEMS:
None at this point.
SPECIAL REPORTING REQUIREMENTS:
We are progressing towards all goals for this project.
BUDGETARY INFORMATION:
As of the end of this research period, expenditures are summarized in the following table (Note:
in our academic cycle, higher expenditures typically take place during the summer quarter):
PI: J. Carlos San-tamarina
Admin. Support: Rebecca Colter
PhD #1 Marco Terzariol
PhD #2 Zhonghao Sun
URA David Rhodes
15

Q1
Cum
ulat
ive
Tota
lQ
2Cu
mul
ativ
e To
tal
Q3
Cum
ulat
ive
Tota
lQ
4Cu
mul
ativ
e To
tal
Q1
Cum
ulat
ive
Tota
lQ
2Cu
mul
ativ
e To
tal
Q3
Base
line
Cost
Pla
nFe
dera
l Sha
re34
,736
34
,736
34,7
36
69
,472
34
,736
104,
208
34,7
36
13
8,94
4
30
,000
16
8,94
4
30,0
00
198,
944
30,0
0
Non
-Fed
eral
Sha
re13
,326
13
,326
13,3
27
26
,653
13
,327
39,9
80
-
39,9
80
10,4
95
50,4
75
10,4
95
60,9
70
10,4
9
To
tal P
lann
ed48
,062
48
,062
48,0
63
96
,125
48
,063
144,
188
34,7
36
17
8,92
4
40
,495
21
9,41
9
40,4
95
259,
914
40,4
9
Actu
al In
curr
ed C
ost
Fede
ral S
hare
-
-
20
,865
20,8
65
45,1
09
69
,650
55
,929
125,
579
64,7
46
190,
325
N
on-F
eder
al S
hare
-
-
-
-
39,9
80
39
,980
-
39
,980
10
,601
50
,580
To
tal I
ncur
red
Cost
s-
-
20,8
65
20
,865
85
,089
109,
630
55,9
29
16
5,55
8
75
,347
24
0,90
5
Varia
nce
Fede
ral S
hare
-34,
736
-34,
736
-13,
871
-48,
607
10,3
73-3
4,55
821
,193
-13,
365
34,7
4621
,381
Non
-Fed
eral
Sha
re-1
3,32
6-1
3,32
6-1
3,32
7-2
6,65
326
,653
00
010
610
5To
tal V
aria
nce
-48,
062
-48,
062
-27,
198
-75,
260
37,0
26-3
4,55
821
,193
-13,
366
34,8
5221
,486
10/1
/13
- 12/
31/1
31/
1/14
- 3/
31/1
44/
1/14
- 6/
30/1
47/
1/14
- 9/
30/1
4Ba
selin
e Re
port
ing
Qua
rter
DE-F
E001
3961
Budg
et P
erio
d 1
Q1
Q2
Q3
Q4
10/1
/14
- 12/
31/1
4
Budg
et P
erio
d 2
Q1
Q2
1/1/
15 -
3/31
/15
4/1/
1
16

17

National Energy Technology Laboratory 626 Cochrans Mill Road P.O. Box 10940 Pittsburgh, PA 15236-0940 3610 Collins Ferry Road P.O. Box 880 Morgantown, WV 26507-0880 13131 Dairy Ashford Road, Suite 225 Sugar Land, TX 77478 1450 Queen Avenue SW Albany, OR 97321-2198 Arctic Energy Office 420 L Street, Suite 305 Anchorage, AK 99501 Visit the NETL website at: www.netl.doe.gov Customer Service Line: 1-800-553-7681
18