o'keeffe b rsa annual conference 2016
TRANSCRIPT
Local development, service provision and rural vibrancy – Endogenous responses and perspectives
Presentation to RSA Annual Conference Planning for Regional Development:
The National Planning Framework as a Roadmap for Ireland’s Future
Brendan O’Keeffe September 2016
Contents
1. Context
a. Literature
b. The National Spatial Strategy Baseline
2. The Study Area
3. Methodology
4. Survey Findings
5. Analysis and Recommendations
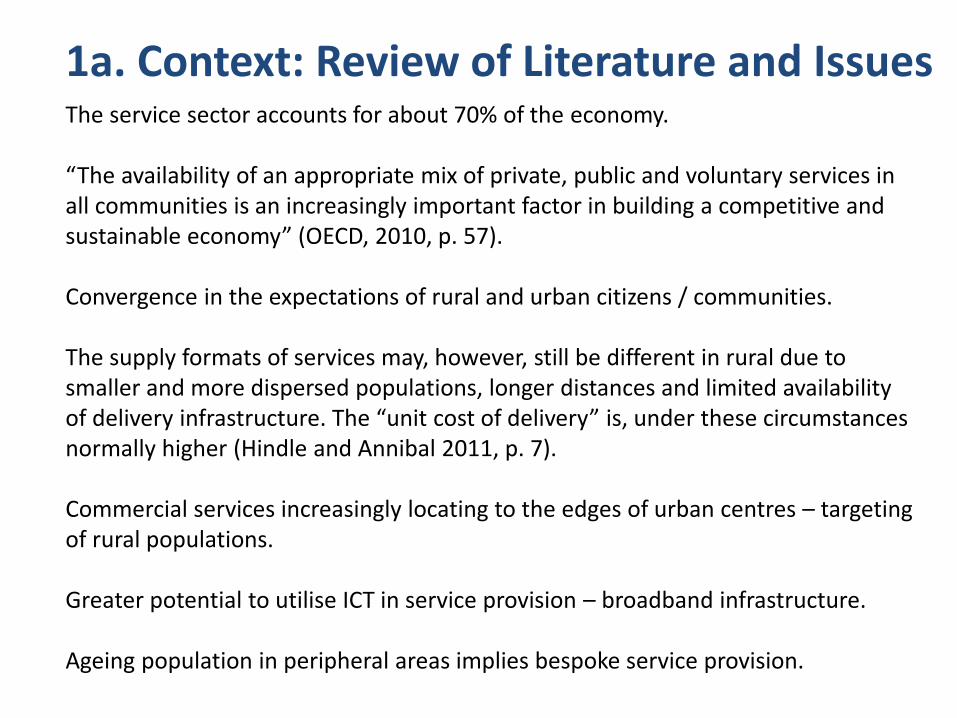
The service sector accounts for about 70% of the economy. “The availability of an appropriate mix of private, public and voluntary services in all communities is an increasingly important factor in building a competitive and sustainable economy” (OECD, 2010, p. 57). Convergence in the expectations of rural and urban citizens / communities. The supply formats of services may, however, still be different in rural due to smaller and more dispersed populations, longer distances and limited availability of delivery infrastructure. The “unit cost of delivery” is, under these circumstances normally higher (Hindle and Annibal 2011, p. 7). Commercial services increasingly locating to the edges of urban centres – targeting of rural populations. Greater potential to utilise ICT in service provision – broadband infrastructure. Ageing population in peripheral areas implies bespoke service provision.
1a. Context: Review of Literature and Issues
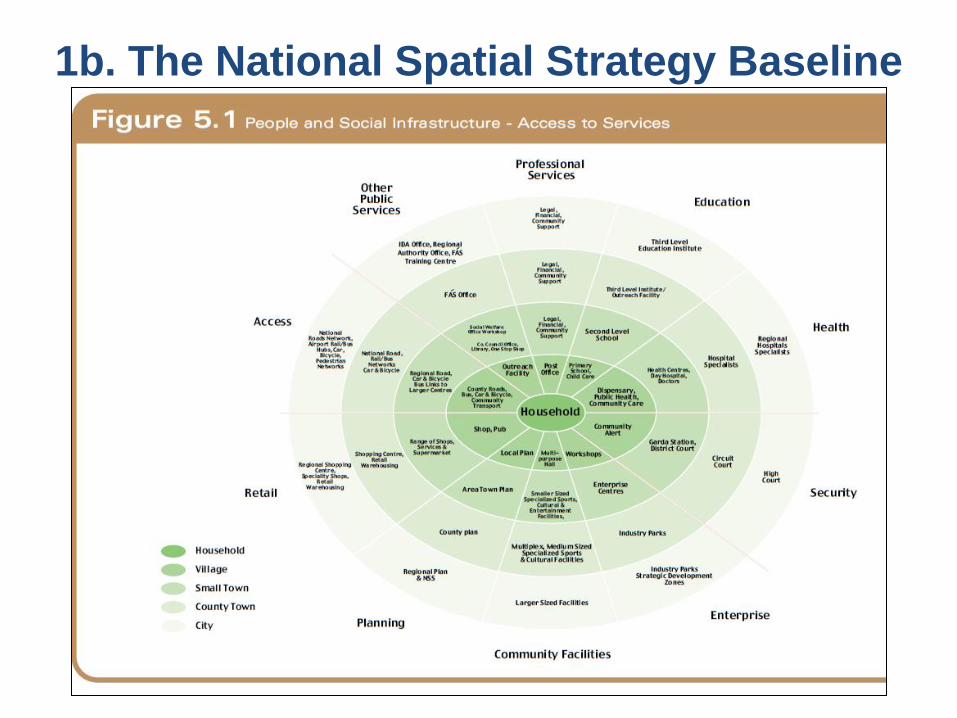
1b. The National Spatial Strategy Baseline
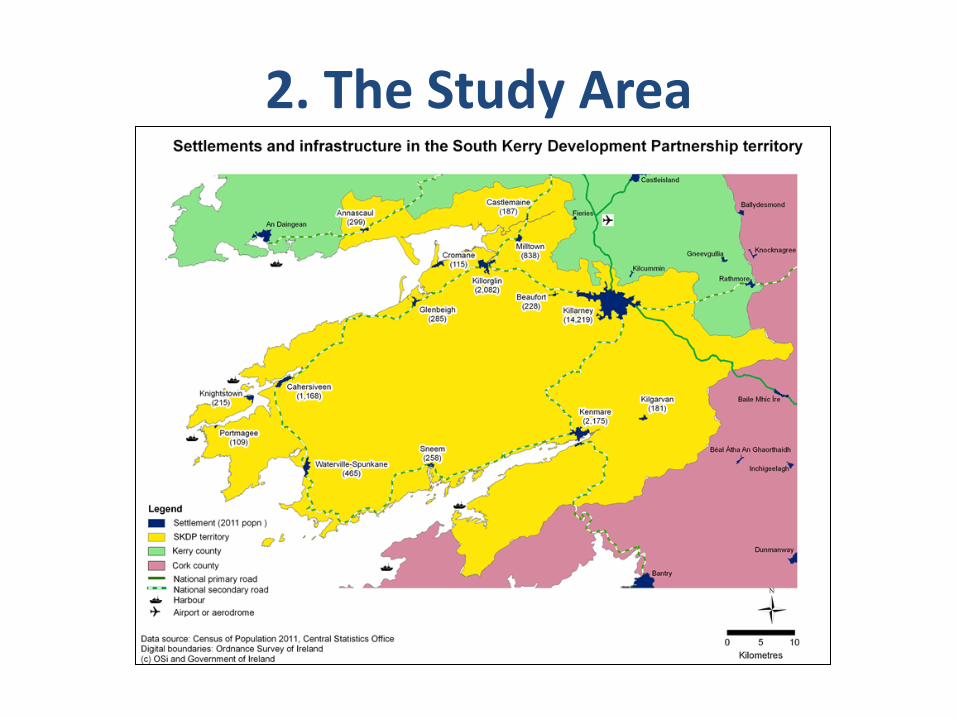
2. The Study Area
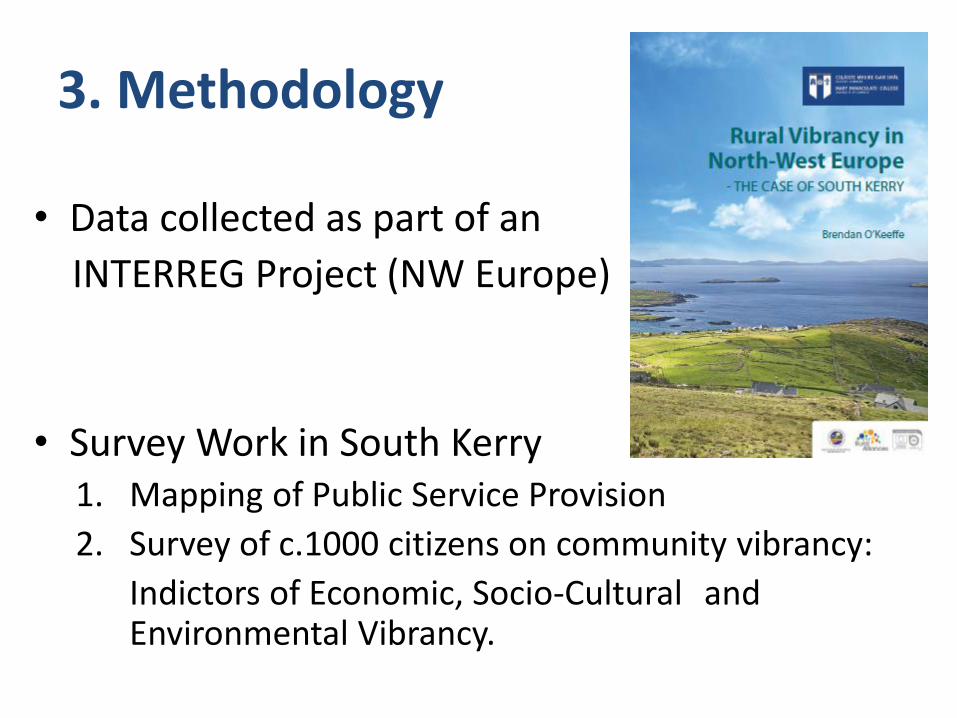
3. Methodology
• Data collected as part of an
INTERREG Project (NW Europe)
• Survey Work in South Kerry 1. Mapping of Public Service Provision
2. Survey of c.1000 citizens on community vibrancy:
Indictors of Economic, Socio-Cultural and Environmental Vibrancy.
4. Survey Findings
A. Levels of Service Provision
B. Perceptions of Rural Vibrancy
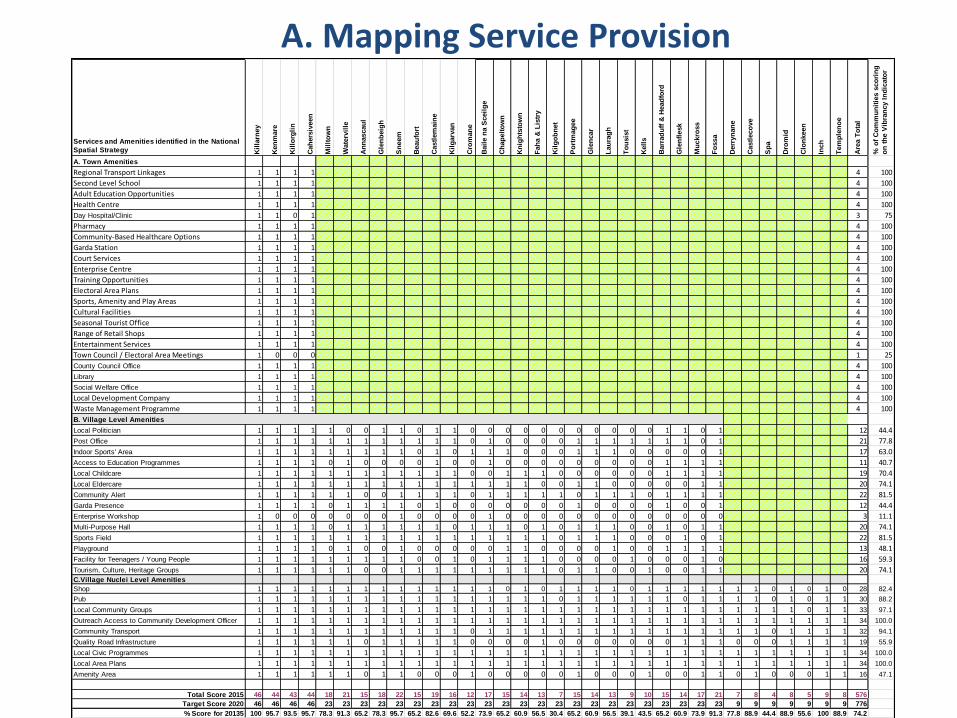
Services and Amenities identified in the National
Spatial Strategy Kil
larn
ey
Ken
mare
Kil
lorg
lin
Cah
ers
iveen
Mil
lto
wn
Wate
rvil
le
An
nascau
l
Gle
nb
eig
h
Sn
eem
Beau
fort
Castl
em
ain
e
Kil
garv
an
Cro
man
e
Bail
e n
a S
ceil
ge
Ch
ap
elt
ow
n
Kn
igh
tsto
wn
Fah
a &
Lis
try
Kil
go
bn
et
Po
rtm
ag
ee
Gle
ncar
Lau
rag
h
To
usis
t
Kell
s
Barr
ad
uff
& H
ead
ford
Gle
nfl
esk
Mu
ckro
ss
Fo
ssa
Derr
yn
an
e
Castl
eco
ve
Sp
a
Dro
mid
Clo
nkeen
Inch
Tem
ple
no
e
Are
a T
ota
l
% o
f C
om
mu
nit
ies s
co
rin
g
on
th
e V
ibra
ncy I
nd
icato
r
A. Town Amenities
Regional Transport Linkages 1 1 1 1 4 100
Second Level School 1 1 1 1 4 100
Adult Education Opportunities 1 1 1 1 4 100
Health Centre 1 1 1 1 4 100
Day Hospital/Clinic 1 1 0 1 3 75
Pharmacy 1 1 1 1 4 100
Community-Based Healthcare Options 1 1 1 1 4 100
Garda Station 1 1 1 1 4 100
Court Services 1 1 1 1 4 100
Enterprise Centre 1 1 1 1 4 100
Training Opportunities 1 1 1 1 4 100
Electoral Area Plans 1 1 1 1 4 100
Sports, Amenity and Play Areas 1 1 1 1 4 100
Cultural Facilities 1 1 1 1 4 100
Seasonal Tourist Office 1 1 1 1 4 100
Range of Retail Shops 1 1 1 1 4 100
Entertainment Services 1 1 1 1 4 100
Town Council / Electoral Area Meetings 1 0 0 0 1 25
County Council Office 1 1 1 1 4 100
Library 1 1 1 1 4 100
Social Welfare Office 1 1 1 1 4 100
Local Development Company 1 1 1 1 4 100
Waste Management Programme 1 1 1 1 4 100
B. Village Level Amenities
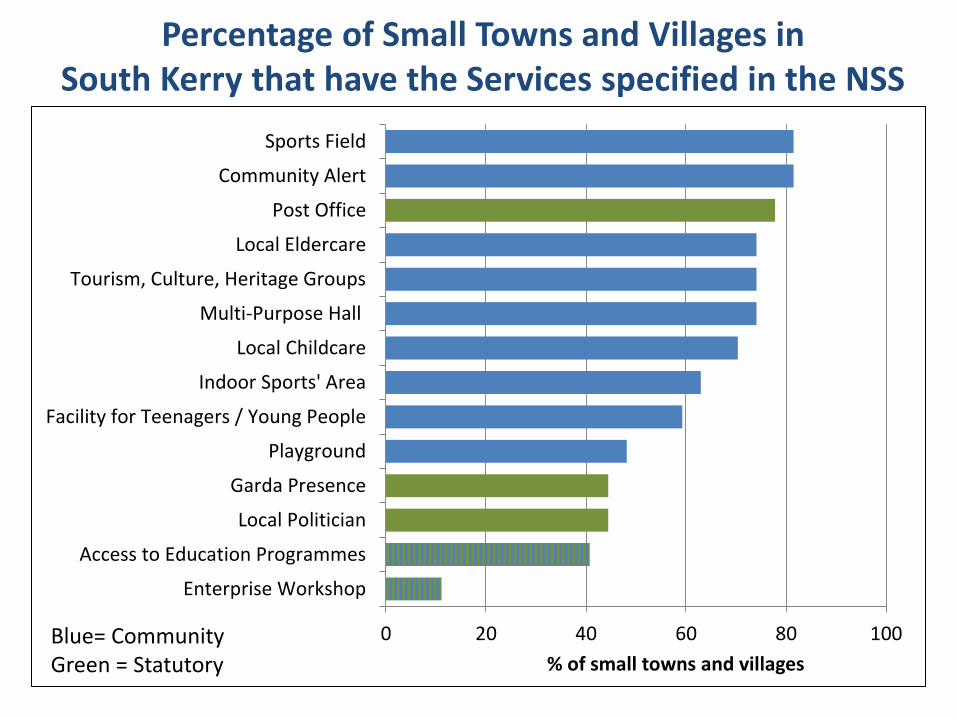
Local Politician 1 1 1 1 1 0 0 1 1 0 1 1 0 0 0 0 0 0 0 0 0 0 0 1 1 0 1 12 44.4
Post Office 1 1 1 1 1 1 1 1 1 1 1 1 0 1 0 0 0 0 1 1 1 1 1 1 1 0 1 21 77.8
Indoor Sports' Area 1 1 1 1 1 1 1 1 1 0 1 0 1 1 1 0 0 0 1 1 1 0 0 0 0 0 1 17 63.0
Access to Education Programmes 1 1 1 1 0 1 0 0 0 0 1 0 0 1 0 0 0 0 0 0 0 0 0 1 1 1 1 11 40.7
Local Childcare 1 1 1 1 1 1 1 1 1 1 1 1 0 0 1 1 1 0 0 0 0 0 0 1 1 1 1 19 70.4
Local Eldercare 1 1 1 1 1 1 1 1 1 1 1 1 1 1 1 1 0 0 1 1 0 0 0 0 0 1 1 20 74.1
Community Alert 1 1 1 1 1 1 0 0 1 1 1 1 0 1 1 1 1 1 0 1 1 1 0 1 1 1 1 22 81.5
Garda Presence 1 1 1 1 0 1 1 1 1 0 1 0 0 0 0 0 0 0 1 0 0 0 0 1 0 0 1 12 44.4
Enterprise Workshop 1 0 0 0 0 0 0 0 1 0 0 0 0 1 0 0 0 0 0 0 0 0 0 0 0 0 0 3 11.1
Multi-Purpose Hall 1 1 1 1 0 1 1 1 1 1 1 0 1 1 1 0 1 0 1 1 1 0 0 1 0 1 1 20 74.1
Sports Field 1 1 1 1 1 1 1 1 1 1 1 1 1 1 1 1 1 0 1 1 1 0 0 0 1 0 1 22 81.5
Playground 1 1 1 1 0 1 0 0 1 0 0 0 0 0 1 1 0 0 0 0 1 0 0 1 1 1 1 13 48.1
Facility for Teenagers / Young People 1 1 1 1 1 1 1 1 1 0 0 1 0 1 1 1 1 0 0 0 0 1 0 0 0 1 0 16 59.3
Tourism, Culture, Heritage Groups 1 1 1 1 1 1 0 0 1 1 1 1 1 1 1 1 1 0 1 1 0 0 1 0 0 1 1 20 74.1C.Village Nuclei Level Amenities
Shop 1 1 1 1 1 1 1 1 1 1 1 1 1 1 0 1 0 1 1 1 1 0 1 1 1 1 1 1 1 0 1 0 1 0 28 82.4
Pub 1 1 1 1 1 1 1 1 1 1 1 1 1 1 1 1 1 0 1 1 1 1 1 1 0 1 1 1 1 0 1 0 1 1 30 88.2
Local Community Groups 1 1 1 1 1 1 1 1 1 1 1 1 1 1 1 1 1 1 1 1 1 1 1 1 1 1 1 1 1 1 1 0 1 1 33 97.1
Outreach Access to Community Development Officer 1 1 1 1 1 1 1 1 1 1 1 1 1 1 1 1 1 1 1 1 1 1 1 1 1 1 1 1 1 1 1 1 1 1 34 100.0
Community Transport 1 1 1 1 1 1 1 1 1 1 1 1 0 1 1 1 1 1 1 1 1 1 1 1 1 1 1 1 1 0 1 1 1 1 32 94.1
Quality Road Infrastructure 1 1 1 1 1 1 0 1 1 1 1 1 0 0 0 0 1 0 0 0 0 0 0 0 1 1 1 0 0 0 1 1 1 1 19 55.9
Local Civic Programmes 1 1 1 1 1 1 1 1 1 1 1 1 1 1 1 1 1 1 1 1 1 1 1 1 1 1 1 1 1 1 1 1 1 1 34 100.0
Local Area Plans 1 1 1 1 1 1 1 1 1 1 1 1 1 1 1 1 1 1 1 1 1 1 1 1 1 1 1 1 1 1 1 1 1 1 34 100.0
Amenity Area 1 1 1 1 1 1 0 1 1 0 0 0 1 0 0 0 0 0 1 0 0 0 1 0 0 1 1 0 1 0 0 0 1 1 16 47.1
Total Score 2015 46 44 43 44 18 21 15 18 22 15 19 16 12 17 15 14 13 7 15 14 13 9 10 15 14 17 21 7 8 4 8 5 9 8 576
Target Score 2020 46 46 46 46 23 23 23 23 23 23 23 23 23 23 23 23 23 23 23 23 23 23 23 23 23 23 23 9 9 9 9 9 9 9 776
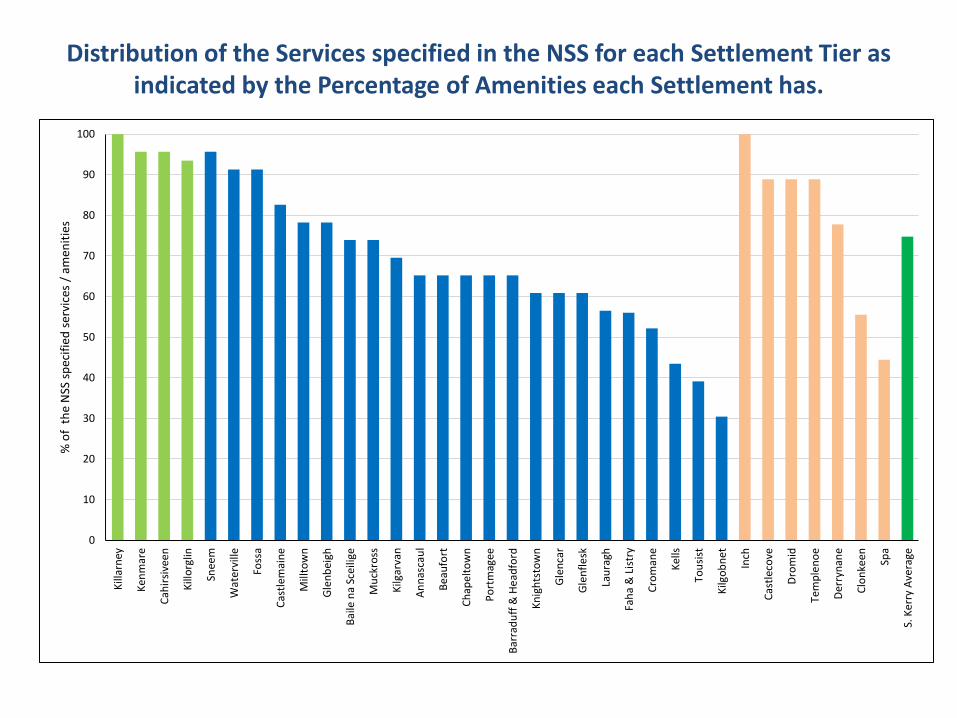
% Score for 20135 100 95.7 93.5 95.7 78.3 91.3 65.2 78.3 95.7 65.2 82.6 69.6 52.2 73.9 65.2 60.9 56.5 30.4 65.2 60.9 56.5 39.1 43.5 65.2 60.9 73.9 91.3 77.8 88.9 44.4 88.9 55.6 100 88.9 74.2
A. Mapping Service Provision
0 20 40 60 80 100
Enterprise Workshop
Access to Education Programmes
Local Politician
Garda Presence
Playground
Facility for Teenagers / Young People
Indoor Sports' Area
Local Childcare
Multi-Purpose Hall
Tourism, Culture, Heritage Groups
Local Eldercare
Post Office
Community Alert
Sports Field
% of small towns and villages
Percentage of Small Towns and Villages in South Kerry that have the Services specified in the NSS
Blue= Community Green = Statutory

0 20 40 60 80 100
Amenity Area
Quality Road Infrastructure
Shop
Pub
Community Transport
Local Community Groups
Outreach Access to Community…
Local Civic Programmes
Local Area Plans
% of Communities
Percentage of Small Towns and Villages in South Kerry that have the Services specified in the NSS
Blue= Community Green = Statutory
0
10
20
30
40
50
60
70
80
90
100
Kill
arn
ey
Ken
mar
e
Cah
irsi
vee
n
Kill
org
lin
Snee
m
Wat
ervi
lle
Foss
a
Cas
tlem
ain
e
Mill
tow
n
Gle
nb
eigh
Bai
le n
a Sc
eilig
e
Mu
ckro
ss
Kilg
arva
n
An
nas
cau
l
Bea
ufo
rt
Ch
apel
tow
n
Po
rtm
agee
Bar
rad
uff
& H
ead
ford
Kn
igh
tsto
wn
Gle
nca
r
Gle
nfl
esk
Lau
ragh
Fah
a &
Lis
try
Cro
man
e
Kel
ls
Tou
sist
Kilg
ob
net
Inch
Cas
tlec
ove
Dro
mid
Tem
ple
no
e
Der
ryn
ane
Clo
nke
en Spa
S. K
err
y A
vera
ge
% o
f t
he
NSS
sp
ecif
ied
ser
vice
s /
amen
itie
s Distribution of the Services specified in the NSS for each Settlement Tier as
indicated by the Percentage of Amenities each Settlement has.
0
10
20
30
40
50
60
70
80
90
100
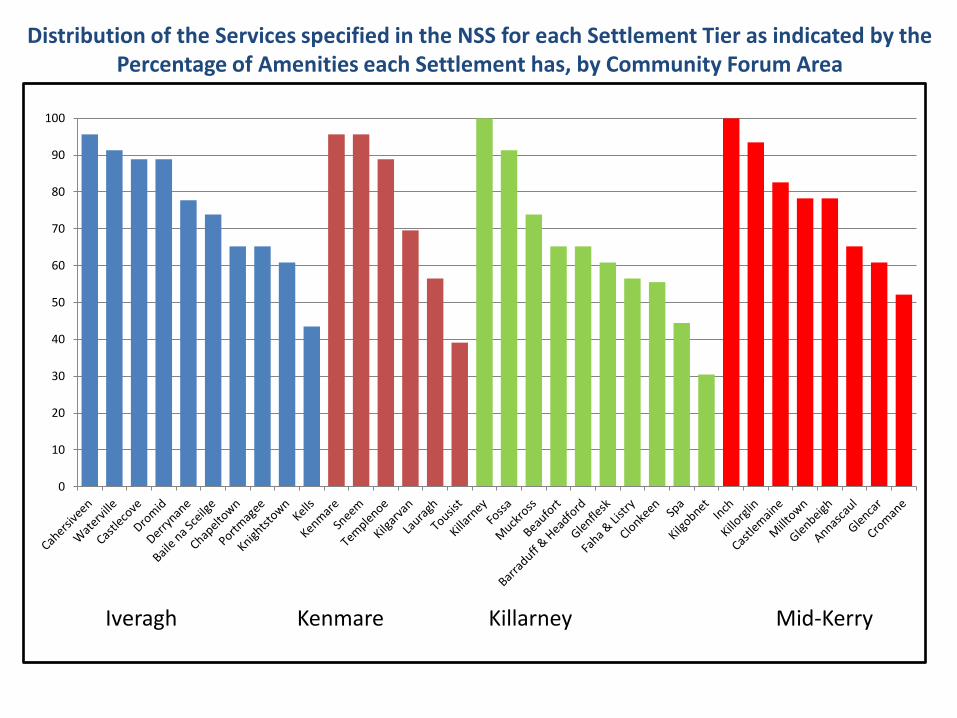
Distribution of the Services specified in the NSS for each Settlement Tier as indicated by the Percentage of Amenities each Settlement has, by Community Forum Area
Iveragh Kenmare Killarney Mid-Kerry
0% 10% 20% 30% 40% 50% 60% 70% 80% 90% 100%
Public Transport Services are sufficient to meet local needs.
Local Government provides good value for money.
Local Government services here are good.
Local middle-income earners can afford to buy a house.
We have good public services in this community.
This locality attracts investment.
Most people in this community have decent jobs.
The local policing service is satisfactory
The local economy is as strong here as in other rural areas.
Innovation is valued and recognized in the community.
This community produces entrepreneurs and self-starters.
People with business ideas can get support and advice…
People in this community have a good standard of living.
Local people are good to support local businesses.
Local businesses appreciate local custom.
Strongly Agree Agree Unsure / No Opinion Disagree Strongly Disagree
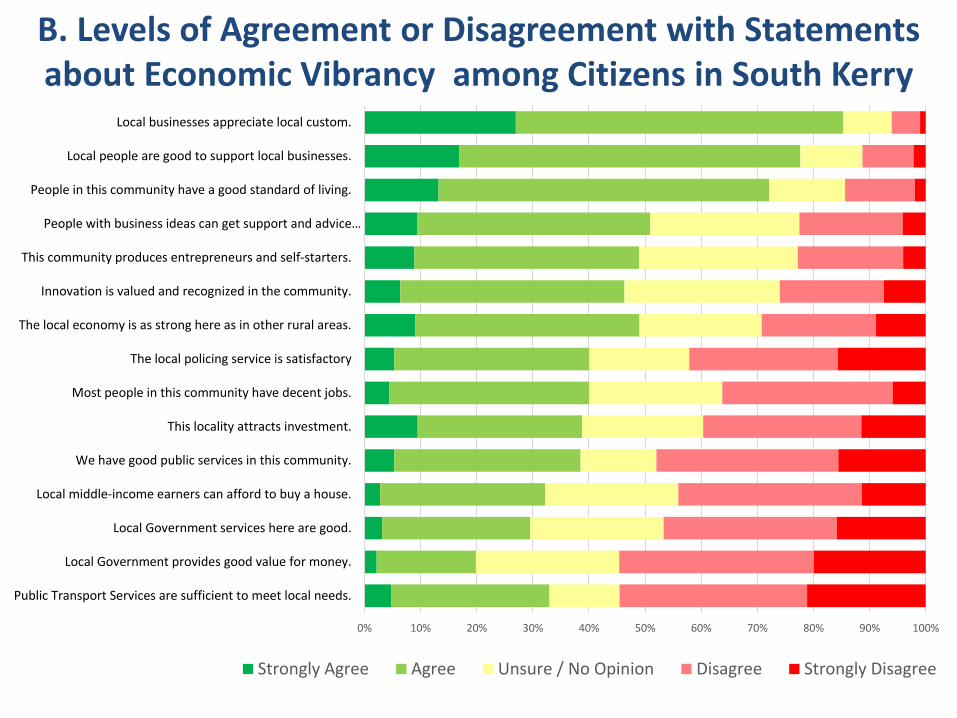
B. Levels of Agreement or Disagreement with Statements about Economic Vibrancy among Citizens in South Kerry
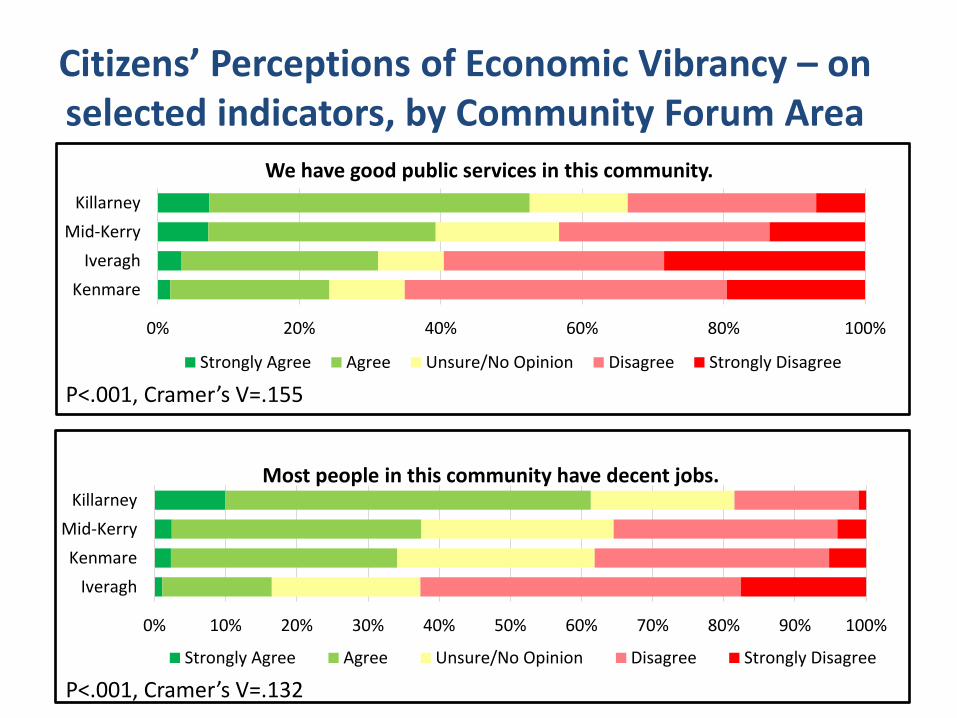
Citizens’ Perceptions of Economic Vibrancy – on selected indicators, by Community Forum Area
0% 20% 40% 60% 80% 100%
Kenmare
Iveragh
Mid-Kerry
Killarney
We have good public services in this community.
Strongly Agree Agree Unsure/No Opinion Disagree Strongly Disagree
P<.001, Cramer’s V=.155
0% 10% 20% 30% 40% 50% 60% 70% 80% 90% 100%
Iveragh
Kenmare
Mid-Kerry
Killarney
Most people in this community have decent jobs.
Strongly Agree Agree Unsure/No Opinion Disagree Strongly Disagree
P<.001, Cramer’s V=.132
2.4
2.6
2.8
3.0
3.2
3.4
3.6
Foss
a
Mu
ckro
ss
Kill
arn
ey
& E
nvi
ron
s
Kill
org
lin
Bla
ckw
ater
/ T
em
ple
no
e
List
ry
Lau
ragh
/ T
ou
sist
Gle
nfl
esk
& H
ead
ford
Ke
nm
are
Val
enti
a
S. K
err
y M
ean
An
nas
cau
l
Bo
nan
e
Cah
erd
anie
l
Bar
rad
uff
Dro
mid
Kilg
arva
n
Gle
nb
eigh
/ G
len
car
Mill
tow
n
Po
rtm
agee
Inch
& K
eel
Ke
lls /
Fo
ilmo
re
Cro
man
e
Bea
ufo
rt &
Bla
ck V
alle
y
Sne
em
Cah
ersi
veen
Bai
le n
a Sc
eilg
e
Cas
tle
mai
ne
Wat
erv
ille
Vib
ran
cy S
core
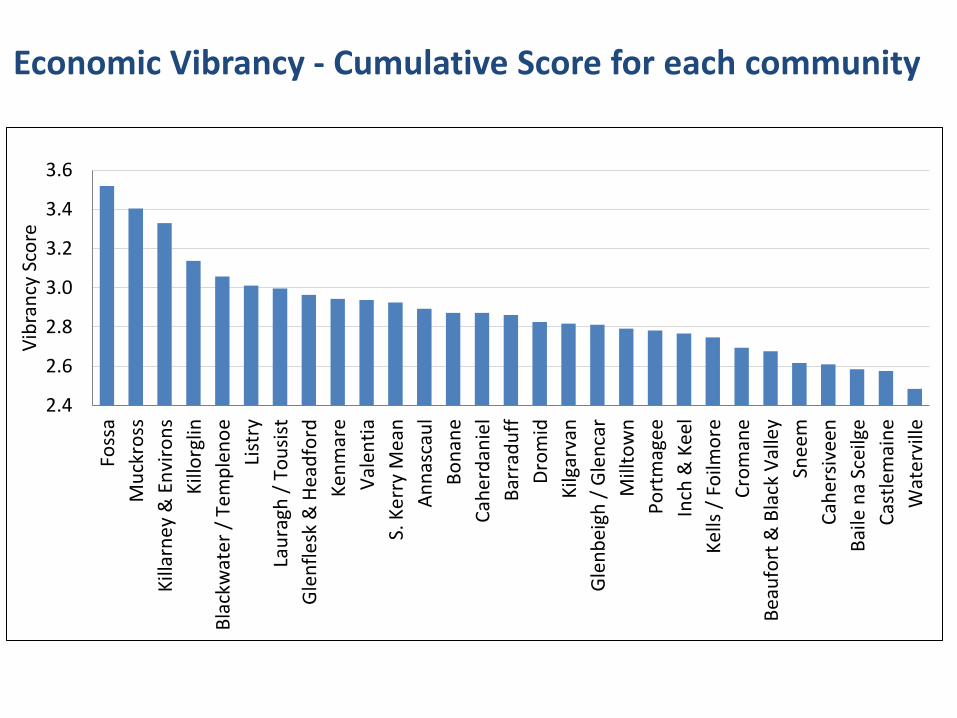
Economic Vibrancy - Cumulative Score for each community
2.5
2.6
2.7
2.8
2.9
3.0
3.1
3.2
3.3
3.4
3.5
Kenmare Killarney Iveragh Mid-Kerry
Mea
n V
ibra
ncy
Sco
res
Economic Vibrancy Socio-Cultural Vibrancy Environmental Vibrancy
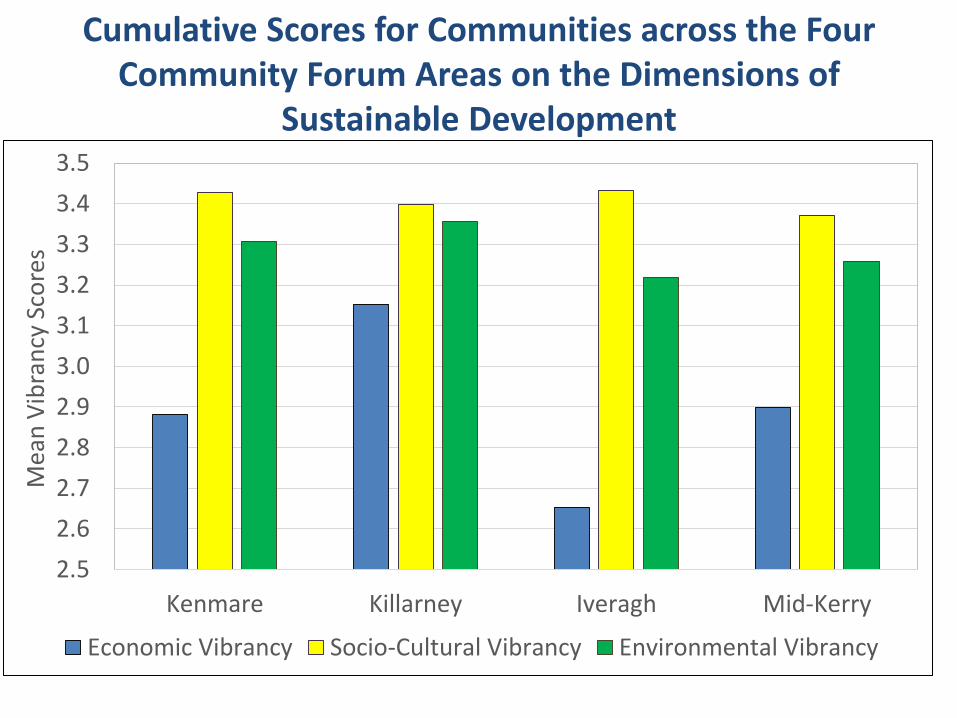
Cumulative Scores for Communities across the Four Community Forum Areas on the Dimensions of
Sustainable Development
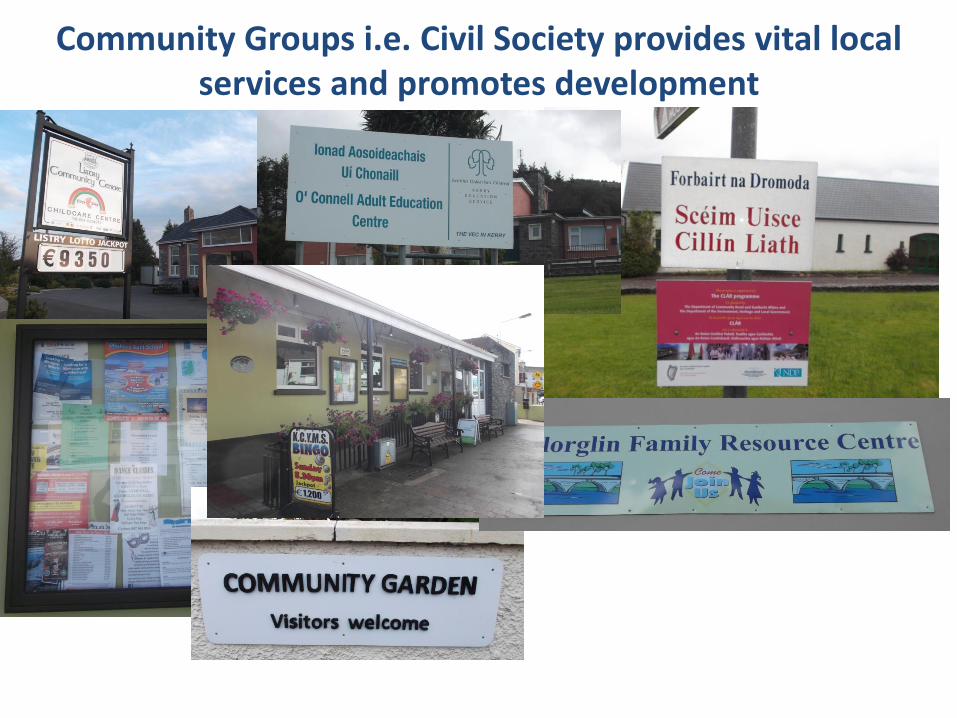
Community Groups i.e. Civil Society provides vital local services and promotes development
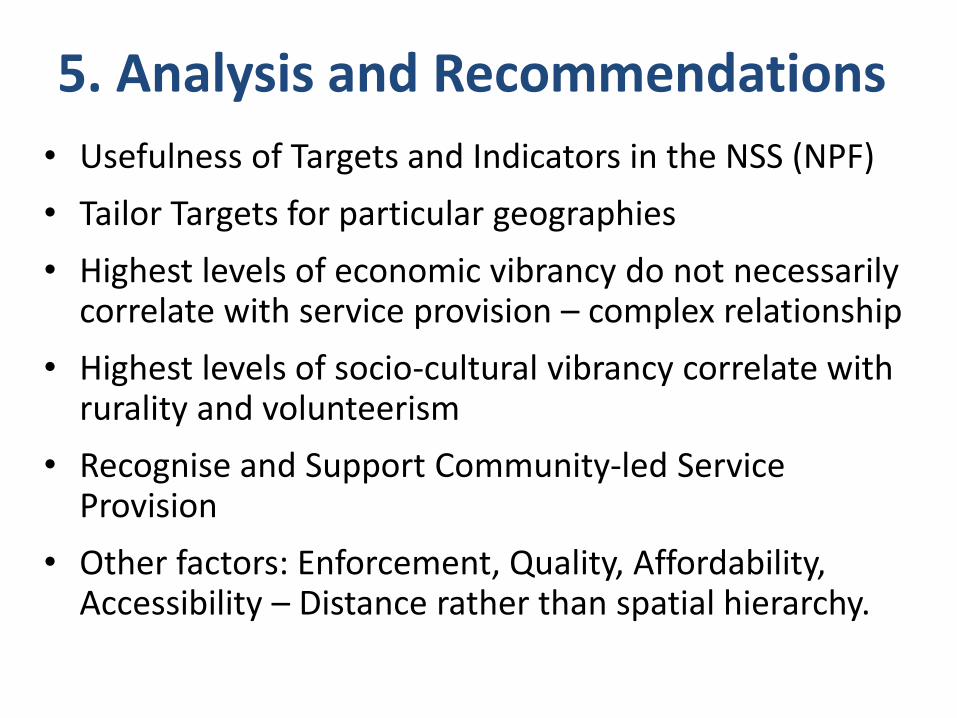
5. Analysis and Recommendations
• Usefulness of Targets and Indicators in the NSS (NPF)
• Tailor Targets for particular geographies
• Highest levels of economic vibrancy do not necessarily correlate with service provision – complex relationship
• Highest levels of socio-cultural vibrancy correlate with rurality and volunteerism
• Recognise and Support Community-led Service Provision
• Other factors: Enforcement, Quality, Affordability, Accessibility – Distance rather than spatial hierarchy.
References Department of Environment, Heritage and Local Government (2002) Ireland’s National Spatial Strategy.
Hindle, R. and Annibal, I., 2011. Developing collaborative and innovative approaches to the delivery of rural services. Rural Innovation. http://randd.defra.gov.uk/Document.aspx?Document=RE0239.pdf
Meredith, D. and Van Egeraat, C. (2013) ‘Revisiting the National Spatial Strategy ten years on.’ Administration, vol. 60, no. 3, pp. 3–9
OECD, 2010. Strategies to Improve Rural Service Delivery. OECD, Paris.