oklahoma school testing program - home |...
TRANSCRIPT

Oklahoma School Testing ProgramOklahoma Core Curriculum Tests (OCCT)
End-of-InstructionACE Biology I
Parent, Student, and teacher Guide

Acknowledgment
Photograph of student using a microscope by Richard Hutchings/Digital Light, copyright © by McGraw-Hill Education.

Dear Parent/Guardian and Student:
Soon students will be participating in the ACE Biology I End-of-Instruction Oklahoma Core Curriculum Test. This test is designed to measure knowledge of ACE Biology I competencies contained in the Oklahoma Academic Standards, the basis of Oklahoma’s core curriculum.
You will receive a report about your child’s performance on the test. If your student does not attain at least a proficient score on this test, retake opportunities will be available.
This guide provides practice questions, objectives covered in the test, and a list of test-taking tips. Discuss these materials with your child ahead of time to encourage test preparedness. During the test week, it is very important for students to get plenty of sleep, eat a good breakfast, and arrive at school on time.
If you have any questions about the ACE Biology I End-of-Instruction Test, please contact your local school or the State Department of Education.
Sincerely,Your State Superintendent of Public Instruction
OKLAHOMA STATE DEPARTMENT OF EDUCATION
2500 NORTH LINCOLN BOULEVARD, OKLAHOMA CITY, OK 73105-4599(405) 521-3301, FAX: (405) 521-6205
www.sde.ok.gov

Table of Contents
TESTING DATES . . . . . . . . . . . . . . . . . . . . . . . . . . . . . . . . . . . . . . . . . . INSIDE FRONT COVER
THE OKLAHOMA CORE CURRICULUM TESTS . . . . . . . . . . . . . . . . . . . . . . . . . . . . . . . . . . . . .1
TEST-TAKING TIPS . . . . . . . . . . . . . . . . . . . . . . . . . . . . . . . . . . . . . . . . . . . . . . . . . . . . . . . . . . . . .3
THE ACE BIOLOGY I TEST . . . . . . . . . . . . . . . . . . . . . . . . . . . . . . . . . . . . . . . . . . . . . . . . . . . . . .4
Oklahoma Academic Standards . . . . . . . . . . . . . . . . . . . . . . . . . . . . . . . . . . . . . . .5
End-of-Instruction ACE Biology I . . . . . . . . . . . . . . . . . . . . . . . . . . . . . . . . . . . . .5
Alignment Blueprint . . . . . . . . . . . . . . . . . . . . . . . . . . . . . . . . . . . . . . . . . . . . . . . .9
ACE BIOLOGY I PRACTICE TEST . . . . . . . . . . . . . . . . . . . . . . . . . . . . . . . . . . . . . . . . . . . . . . . .11
ANSWER KEY . . . . . . . . . . . . . . . . . . . . . . . . . . . . . . . . . . . . . . . . . . . . . . . . . . . . . . . . . . . . . . . . .23
ANSWER DOCUMENT . . . . . . . . . . . . . . . . . . . . . . . . . . . . . . . . . . . . . . . . INSIDE BACK COVER

Testing Dates
Please reference the Oklahoma State Department of Education Web site for the most current
testing dates:
http://ok.gov/sde/assessment-administrator-resources-administrators

1
The Oklahoma Core Curriculum Tests
The Governor, state legislators, and other Oklahoma elected officials have committed themselves to ensuring that all Oklahoma students receive the opportunity to learn the skills required to succeed in school and in the workplace. To achieve this goal, schools must prepare every Oklahoma student for colleges, universities, and careers that require new and different skills.
Under the direction of the Legislature, Oklahoma teachers, parents, and community leaders met to agree upon the skills that students are expected to master by the end of each grade. The results of their efforts, the Oklahoma Academic Standards, provide the basis for Oklahoma’s core curriculum.
In addition, the Legislature established the criterion-referenced test component of the Oklahoma School Testing Program to measure students’ progress in mastering the Oklahoma Academic Standard Tests have been developed by national test publishers that specifically measure the standards and objectives of the Oklahoma Academic Standard at the end-of-instruction levels. Teachers from throughout Oklahoma have been involved in the review, revision, and approval of the questions that are included in the tests.
In contrast to a norm-referenced testing program, the Oklahoma Core Curriculum Tests compare student performance with performance standards established by the State Board of Education. The performance standards are based upon recommendations from groups of Oklahoma educators who evaluated the test and recommended the performance standards for the different levels of performance for each test. The Oklahoma Performance Index, or OPI, is a scaled score earned by a student that places the student into one of the four performance levels (Advanced, Proficient, Limited Knowledge, Unsatisfactory).
The state statute reads as follows: “Each student who completes the instruction for English II, English III, United States History, Biology I, Algebra I, Geometry, and Algebra II at the secondary level shall complete an end-of-instruction test, to measure for attainment in the appropriate state academic content standards in order to graduate from a public high school with a standard diploma.”
All students shall take the tests prior to graduation, unless otherwise exempt by law.
Beginning with students entering the ninth grade in the 2008–2009 school year, every student shall demonstrate mastery of the state academic content standards in the following subject areas in order to graduate from a public high school with a standard diploma: Algebra I, English II, and two of the following five: Algebra II, Biology I, English III, Geometry, and United States History.
To demonstrate mastery, the student shall attain at least a proficient score on the end-of-instruction criteria. Students who do not attain at least a proficient score on any end-of-instruction test shall be provided remediation or intervention and the opportunity to retake the test until at least a proficient score is attained on the tests of Algebra I, English II, and two of the following five: Algebra II, Biology I, English III, Geometry, and United States History or may demonstrate mastery of the state academic content standards by alternative methods as approved by the State Board of Education.
Students who do not meet these requirements may graduate from a public high school with a standard diploma by demonstrating mastery of state academic content standards by alternative methods as approved by the State Board of Education.
Students who score ten percent (10%) above the cut scores approved by the State Board of Education for the ACT, SAT, ACT PLAN, or PSAT alternate tests shall be deemed to have satisfactorily demonstrated mastery of the state academic content standards in the subject areas for which alternative tests have been approved and shall be exempt from taking the EOI tests in the subject areas of Algebra II, English III, Geometry, or U.S. History.

2
Students who have a score that is equal to or above the cut scores approved by the State Board of Education for the Advanced Placement course exams, ACT Workkeys, College-Level Examination Program (CLEP), or International Baccalaureate (IB) alternate tests shall be deemed to have satisfactorily demonstrated mastery of the state academic content standards in the subject areas for which alternative tests have been approved and shall be exempt from taking the EOI tests in the subject areas of Algebra II, English III, Geometry, or U.S. History. The State Board of Education shall adopt rules providing for implementation of the use of these alternate tests.
This guide provides an opportunity for parents, students, and teachers to become familiar with this test. It presents general test-taking tips, lists the Oklahoma Academic Standard objectives that could be assessed in a statewide testing program, and provides practice multiple-choice questions.

3
Test-Taking Tips
General test-taking tipsDO . . . read this guide carefully and complete the practice test.
DO . . . make sure you understand all test directions. If you are uncertain about any of the directions, raise your hand to ask questions before testing has started.
DO . . . make notes or work problems on your scratch paper if needed.
DO . . . read each question and every answer choice carefully. Choose the best answer for each question.
DO . . . be sure that you have seen all four answer choices before making your selection. On an online test, this may require you to use the scroll bar on the right side of the test question.
DO . . . check your work if you finish a test session early. Use the extra time to answer any questions that you skipped in that section.
DO . . . remember that if you cannot finish the test within the time allotted, you will be given additional time to complete the test.
DON’T . . . wait until the last minute to study for the test. The test covers a lot of material, and you cannot learn it all in a short amount of time.
DON’T . . . worry about the test. Students who are calm and sure of themselves do better on tests.
DON’T . . . spend too much time on any one question. If a question takes too long to answer, skip it and answer the other questions. You can return to any questions you skipped after you have finished all other questions in the section.
DON’T . . . attempt to leave the online testing system by clicking the Stop Test tab. Doing so will result in ending that section of the test.
The following tips provide effective strategies for taking the Oklahoma Core Curriculum Tests. Test-taking skills cannot replace study based on the standards and objectives of the Oklahoma Academic Standards, which serve as the foundation for the tests.

4
The ACE Biology I Test
This online multiple-choice test is administered in two sections, each approximately 60 minutes in length, with up to an additional 20 minutes for testing directions. The test is not strictly timed. Testing sessions for students who need more time can be extended. However, some studies have shown that more than one hour of additional time can contribute to a decrease in student scores. This additional time is available as an immediate extension of the testing session; it is not available as a separate session at another time.
Students who finish a test section early should make sure their work is complete and are encouraged to check and verify their answers within that section prior to closing their test booklets or saving and exiting an online test. Once a test section has been completed, students will not be allowed to return to that section.
Calculators may be used on the ACE Algebra II End-of-Instruction Assessment.
Subject-specific Requirements• ACE Algebra I, ACE Geometry, and ACE Biology I:
o Scientific Calculators meeting general requirements may be used on all/specified sections.• ACEAlgebraII:
o Graphing Calculators meeting general requirements may be used on all/specified sections.
General Requirements • Calculatorsarepermittedbutarenotrequired.• Calculatorcapabilitiesdescribedforaspecificsubjectgivethe maximum capabilities allowed; calculators with
less capability are acceptable.• Studentsmaynotsharecalculators.• Studentsmayusetheirowncalculatorsorthoseprovidedbytheschool.• Calculatorsthatmakenoisemusthavethesoundfeatureturnedoff.• Calculatorsthathavepapertapemusthavethetaperemoved.• Calculatorswithpowercordsmusthavethecordremoved.• Allcalculatorsmusthavethememoryclearedbeforeandafterthetestsession.• Anyprogramsorapplicationsmustberemovedpriortothetestsession.
Prohibited Calculators• Pocketorganizers• Handheldorlaptopcomputers• Electronicwritingpadsorpen-inputdevices• Calculatorsbuiltintocellularphonesorotherelectroniccommunicationdevices• Calculatorswithatypewriterkeypad(QWERTYformat)• Calculators with programs or applications that cannot be removed or disabled
(e.g., Polynomial Root-Finder and Simultaneous Equation Solver on TI-86)• Calculatorswithbuilt-incomputeralgebrasystems,suchas,butnotlimitedto:
o Casio: Algebra fx 2.0, ClassPad 300, and all model numbers that begin with CFX-9970Go Texas Instruments: All model numbers that begin with TI-89, TI-92, or TI-Nspire CASo Hewlett-Packard: HP-48GII and all model numbers that begin with HP-40G or HP-49G
Test Security and Validity • Usingacalculatorthatdoesnotmeettheaboverequirements invalidates the test results and is a violation of
test security and test validity. Any violation will be reported to the State Superintendent and may result in revocation of teaching and/or administrative certificates.
The following sections of this guide:
• listtheOklahoma Academic Standards that are covered on the ACE Biology I End-of-Instruction test.• reproducethestudentdirections.• presentpracticetestquestions.

5
Oklahoma academic Standards (2011 revision)The Oklahoma Academic Standards measured in the End-of-Instruction ACE Biology I multiple-choice test are presented below. They represent the portion of the Oklahoma core curriculum that can be assessed in a statewide testing program. The Oklahoma Academic Standards for Biology I are grouped into standards with specific objectives listed under each one. Student performance on the multiple-choice test will be reported at the standard and the objective level for process and inquiry and at the standard level for content. Each question on the test will measure one process/inquiry objective and one content objective, with the exception of questions on process objective 3.5, which are process/inquiry only.
end-of-instruction ace Biology i
Science Process and inquiry Standards high School
Process Standard 1: Observe and Measure—Observing is the first action taken by the learner to acquire new information about an organism or event. Opportunities for observation are developed through the use of a variety of scientific tools. Measurement allows observations to be quantified. The student will accomplish these objectives to meet this process standard.
1. Identify qualitative and quantitative changes in cells, organisms, populations, and ecosystems given conditions (e.g., temperature, mass, volume, time, position, length, quantity) before, during, and after an event.
2. Use appropriate tools with accuracy and precision (e.g., microscope, pipette, metric ruler, graduated cylinder, thermometer, balance, stopwatch) when measuring cells, organisms, populations, and ecosystems.
3. Use appropriate International System of Units (SI) (i.e., grams, meters, liters, degrees Celsius, and seconds) and SI prefixes (i.e., micro-, milli-, centi-, and kilo-) when measuring objects and/or events.
Process Standard 2: Classify—Classifying establishes order. Organisms and events are classified based on similarities, differences, and interrelationships. The student will accomplish these objectives to meet this process standard.
1. Using observable properties, place cells, organisms, and/or events into a biological classification system (e.g., dichotomous keys, taxonomy charts, cladograms).
2. Identify the properties by which a biological classification system is based.
Process Standard 3: Experimental Design—Understanding experimental design requires that students recognize the components of a valid experiment. The student will accomplish these objectives to meet this process standard.
1. Evaluate the design of a biology laboratory investigation. 2. Identify the independent variables, dependent variables, controlled variables, and control set-up
in an experiment. 3. Use mathematics to show relationships within a given set of observations (e.g., population
studies, biomass, probability). 4. Identify a hypothesis for a given problem in biology investigations. 5. Recognize potential hazards and practice safety procedures in all biology activities.

6
Process Standard 4: Interpret and Communicate—Interpreting is the process of recognizing patterns in collected data by making inferences, predictions, or conclusions. Communicating is the process of describing, recording, and reporting experimental procedures and results to others. Communication may be oral, written, or mathematical and includes organizing ideas, using appropriate vocabulary, graphs, other visual representations, and mathematical equations. The student will accomplish these objectives to meet this process standard.
1. Select appropriate predictions based on previously observed patterns of evidence. *2. Report and display data using appropriate-technology and other media. 3. Interpret data tables, line, bar, trend, and/or circle graphs from existing science research or
student experiments. 4. Determine if results of biological science investigations support or do not support hypotheses. 5. Evaluate experimental data to draw the conclusion that is best supported by the evidence. *6. Routinely prepare a written report describing the sequence, results, and interpretation of a
biological investigation or event.a. Establish and maintain a formal style and objective tone.b. When appropriate or possible, utilize technology to produce, publish, or revise writing
products.c. Gather relevant information from multiple authoritative print and digital sources and
follow a standard format for citation, avoiding plagiarism. *7. Communicate or defend scientific thinking that results in conclusions.
a. Read, comprehend, and present evidence from a range of sources (e.g., texts, experiments, or simulations) to support conclusions.
b. Recognize bias in observation/research. 8. Identify and/or create an appropriate graph or chart from collected data, tables, or written
description (e.g., population studies, plant growth, heart rate).a. Translate quantitative information expressed in words into visual form (e.g., a table or
chart).b. Translate information expressed visually or mathematically (e.g., a table, chart or equation)
into words.
Process Standard 5: Model—Modeling is the active process of forming a mental or physical representation from data, patterns, or relationships to facilitate understanding and enhance prediction. The student will accomplish these objectives to meet this process standard.
1. Interpret a biological model which explains a given set of observations. 2. Select predictions based on models (e.g., pedigrees, life cycles) and when appropriate, apply
mathematical reasoning to make a prediction. *3. Compare a given model to the living world.
Process Standard 6: Inquiry—Inquiry can be defined as the skills necessary to carry out the process of scientific or systemic thinking. In order for inquiry to occur students must have the opportunity to make observation, pose questions, formulate testable hypotheses, carry out experiments, and make conclusions based on evidence. The student will accomplish these objectives to meet this process standard.
*1. Ask a scientific question, formulate a testable hypothesis, and design an appropriate experiment relating to the living world.
*2. Design and conduct biological investigations in which variables are identified and controlled. *3. Use a variety of technologies (e.g., probes, handheld digital devices, electrophoresis equipment,
digital cameras, software, calculators, digital balances, microscopes, measuring instruments, and computers) to collect, analyze and display data.

7
*4. Inquiries should lead to the formulation of explanations or models (physical, conceptual, and mathematical). In answering questions, students should engage in research and discussions (based on scientific knowledge, the use of logic, and evidence from the investigation) and arguments that encourage the revision of their explanations, leading to further inquiry.
content Standards high School
Standard 1: The Cell—Cells are the fundamental unit of life, composed of a variety of structures that perform functions necessary to maintain life. The student will engage in investigations that integrate the process standards and lead to the discovery of the following objectives:
1. Cells are composed of a variety of structures, such as the nucleus, cell/plasma membrane, cell wall, cytoplasm, ribosomes, mitochondria, and chloroplasts. a. The cell/plasma membrane functions (i.e., active transport, passive transport, diffusion,
osmosis, and surface area to volume ratio) to maintain homeostasis.b. Differentiate between hypotonic, hypertonic, and isotonic conditions.c. Compare and contrast prokaryotic and eukaryotic cells.
2. In multicellular organisms, cells have levels of organization (i.e., cells, tissues, organs, organ systems, organisms).
3. Specialized cells enable organisms to monitor what is going on in the world around them (e.g., detect light, sound, specific chemicals, gravity, plant tropism, sense organs, homeostasis).
Standard 2: The Molecular Basis of Heredity—DNA determines the characteristics of organisms. The student will engage in investigations that integrate the process standards and lead to the discovery of the following objectives:
1. Cells function according to the information contained in the master code of DNA (i.e., cell cycle, DNA replication and transcription.) Transfer RNA and protein synthesis will be taught in life science courses with rigor greater than Biology I.
2. A sorting and recombination of genes during sexual reproduction results in a great variety of possible gene combinations from the offspring of any two parents (i.e., Punnett squares and pedigrees). Students will understand concepts in a single trait cross (e.g., alleles, dominant trait, recessive trait, phenotype, genotype, homozygous, heterozygous, incomplete dominance, and sex-linked traits).
Standard 3: Biological Diversity—Diversity of species is developed through gradual processes over many generations. The student will engage in investigations that integrate the process standards and lead to the discovery of the following objectives:
1. Different species might look dissimilar, but the unity among organisms becomes apparent from an analysis of internal structures, the similarity of their chemical processes, and the evidence of common ancestry (e.g., homologous and analogous structures, embryology, fossil record, genetic data).
2. Characteristics of populations change through the mechanism of natural selection. These biological adaptations, including changes in structures, behaviors, and/or physiology, may enhance or limit survival and reproductive success within a particular environment.
3. Broad patterns of behavior exhibited by animals have changed over time to ensure reproductive success. Responses to external stimuli can result from interactions with the organism’s own species and others, as well as environmental changes; these responses can be either innate or learned.

8
Standard 4: The Interdependence of Organisms—Interdependence of organisms in an environment includes the interrelationships and interactions between and among organisms. The student will engage in investigations that integrate the process standards and lead to the discovery of the following objectives:
1. Organisms both cooperate and compete in ecosystems (e.g., symbiotic relationships). 2. Living organisms have the capacity to produce populations of infinite size, but environments and
resources limit population size (i.e., carrying capacity, limiting factors, ecological succession).
Standard 5: Matter, Energy, and Organization in Living Systems—Living systems require a continuous input of energy to maintain their chemical and physical organizations. The student will engage in investigations that integrate the process standards and lead to the discovery of the following objectives:
1. The complexity and organization of organisms accommodate the need for obtaining, transforming, transporting, releasing, and eliminating the matter and energy used to sustain the organism (i.e., photosynthesis and cellular respiration).
2. As matter and energy flow through different levels of organization of living systems and between living systems and the physical environment, chemical elements are recombined in different ways by different structures. Matter and energy are conserved in each change (i.e., water cycle, carbon cycle, nitrogen cycle, food webs, and energy pyramids).
3. Matter on the earth cycles among the living (biotic) and nonliving (abiotic) components of the biosphere.
NOTE: Asterisks (*) have been used to identify standards and objectives that must be assessed by the local school district. All other skills may be assessed by the Oklahoma School Testing Program (OSTP).

9
Page 1 of 2
Oklahoma School Testing Program
ACE Biology I EOI – Test Blueprint School Years 2014-2015 and 2015-2016
The blueprint describes the content and structure of an assessment and defines the ideal number of test items by standard and objective of the Priority Academic Student Skills/ Oklahoma Academic Standards (PASS-2011/OAS).
Process/Inquiry Standards and Objectives
Ideal Number of Items
Ideal Percentage
of Items
P1.0 Observe and Measure 6 10%
1.1 Qualitative/Quantitative Observations/Changes 4
1.2 Appropriate Tools and 1.3 Use Appropriate System International SI (metric) Units
2
P2.0 Classify 7 - 8 12% - 13%
2.1 Use Observable Properties to Classify 4
2.2 Identify Properties of a Classification System 3 - 4
P3.0 Experimental Design 16 - 19 27% - 32%
3.1 Evaluate the Design of Investigations 4 - 5
3.2 Identify Controlled Variables and Experimental Controls in an Experiment and 3.4 Identify a Testable Hypothesis in a Biology Investigation
5 - 6
3.3 Use Mathematics to Show Relationships 4 - 6
3.5 Identify Potential Hazards and Practice Safety Procedures in all Science Activities
3
P4.0 Interpret and Communicate 20 - 24 33% - 40%
4.1 Select Predictions Based on Observed Patterns of Evidence
4 - 5
4.3 Interpret Line, Bar, Trend, and Circle Graphs 4 - 5
4.4 Accept or Reject a Hypothesis 4 - 5
4.5 Make Logical Conclusions Based on Experimental Data 4 - 5
4.8 Identify an Appropriate Graph or Chart 4
P5.0 Model 8 13%
5.1 Interpret a Model which Explains a Given Set of Observations
4
5.2 Select Predictions Based on Models, Using Mathematics When Appropriate
4
Total Test 60
100%
(Please note this blueprint does not include items that may be field-tested.)
A minimum of 6 items is required to report a standard, and a minimum of 4 items is required to report results for an objective.

10
Oklahoma School Testing Program
ACE Biology I EOI – Test Blueprint School Years 2014-2015 and 2015-2016
Content Standards and Objectives Ideal
Number of Items
Ideal Percentage
of Items
C1.0 The Cell 12 - 15 21% - 27%
1.1 Cell Structures and Functions 4 - 6
1.2 Differentiation of Cells 4 - 6
1.2 Specialized Cells 4
C2.0 The Molecular Basis of Heredity 12 - 15 21% - 27%
2.1 DNA Structure and Function in Heredity 6 - 8
2.2 Sorting and Recombination of Genes 6 - 7
C3.0 Biological Diversity 12 - 15 21% - 27%
3.1 Variation Among Organisms 4 - 6
3.2 Natural Selection and Biological Adaptations 4 - 6
3.3 Behavior Patterns Can Be Used To Ensure Reproductive Success
4
C4.0 The Interdependence of Organisms 8 - 10 14% - 18%
4.1 Organisms Both Cooperate and Compete 4 - 6
4.2 Population Dynamics 4 - 6
C5.0 Matter/Energy/Organization in Living Systems 12 21%
5.1 Complexity and Organization Used For Survival 4
5.2 Matter and Energy Flow in Living and Nonliving Systems 4
5.3 Earth Cycles Including Abiotic and Biotic Factors 4
Total Test 571
100%
(Please note this blueprint does not include items that may be field-tested.)
1
Each test item aligns to both a Process Standard/Objective and a Content Standard/Objective, except for Safety Items which only align to P3.5.
A minimum of 6 items is required to report a standard, and a minimum of 4 items is required to report results for an objective.

11
Note for students:
The practice test in the following section is a shortened version of a test similar to the End-of-Instruction ACE Biology I test you will take.
Follow the instructions below as you take the practice test.
ACE Biology I Practice Test
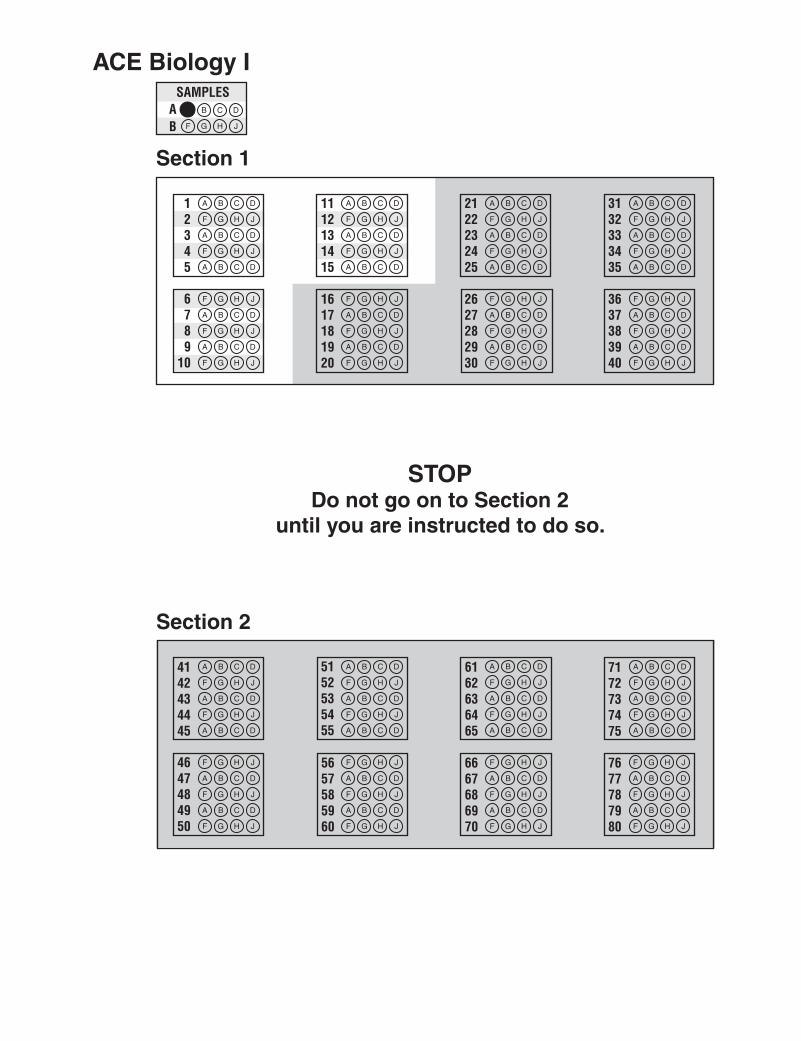
Practice test directions1. Mark your answers to the practice test questions on the inside back cover of this guide.
2. Look at the ACE Biology I Practice Test on the next page. Read the directions at the top of the page.
3. Look at Sample A in the box. Read it to yourself and think of the answer. Then look at the answer document. The correct answer to Sample A has been filled in. This shows you how to mark your answers.
4. Read Sample B of the ACE Biology I Practice Test. Mark your answer to Sample B. Next answer the remaining practice questions. Fill in the circle for each answer completely, as shown in the sample. You may underline, mark, make notes, or work out problems in your test booklet. However, make sure you mark your answers on your answer document.
5. When you are finished, check your answers against the answer key printed on page 23 of this guide. The objectives for each question are also shown.
12
Section 1DirectionsRead each question and choose the best answer. Find the question number on the answer document that matches the question number in the ACE Biology I Practice Test. Then mark your answer on the answer document.
The correct answer for Sample A has been filled in on the answer document to show you how to mark your answers. Mark your answer for Sample B.
Sample A
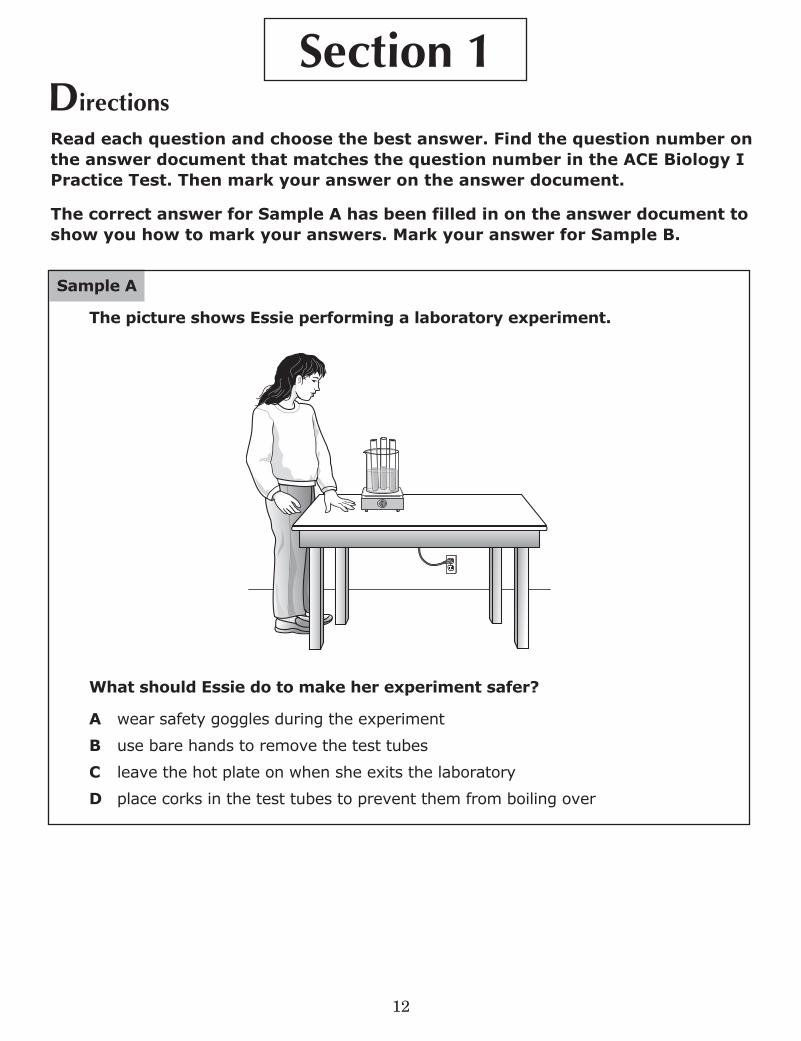
The picture shows Essie performing a laboratory experiment.
OFF
H
M
L
What should Essie do to make her experiment safer?
A wear safety goggles during the experiment
B use bare hands to remove the test tubes
C leave the hot plate on when she exits the laboratory
D place corks in the test tubes to prevent them from boiling over

13
Section 1
Sample B
In a certain plant species, red flowers (R) are dominant to white flowers (r). The Punnett square below shows a cross between two of these plants.
Rr Rr
Rr
r
r Rr
R R
What percent of the offspring are expected to have white flowers?
F 0%
G 25%
H 75%
J 100%
14
Section 1
1 What is the dependent variable in this experiment?
A the salt concentration
B the number of cells in the sample
C the type of animal that the cells come from
D the movement of water across the cell membrane
2 What will most likely happen to the cells when they are placed in distilled water?
F The cells will shrink and shrivel up.
G The cells will enlarge until they burst.
H The cell membranes will thicken.
J The cells will remain unchanged.
3 The student observed that the cells in the 20% salt solution changed in size.
Which statement best explains what is causing this change?
A Water from the solution is moving into the cells.
B Water is moving out of the cells into the surrounding solution.
C Salts from the solution are moving into the cells.
D Salts are moving out of the cells into the surrounding solution.
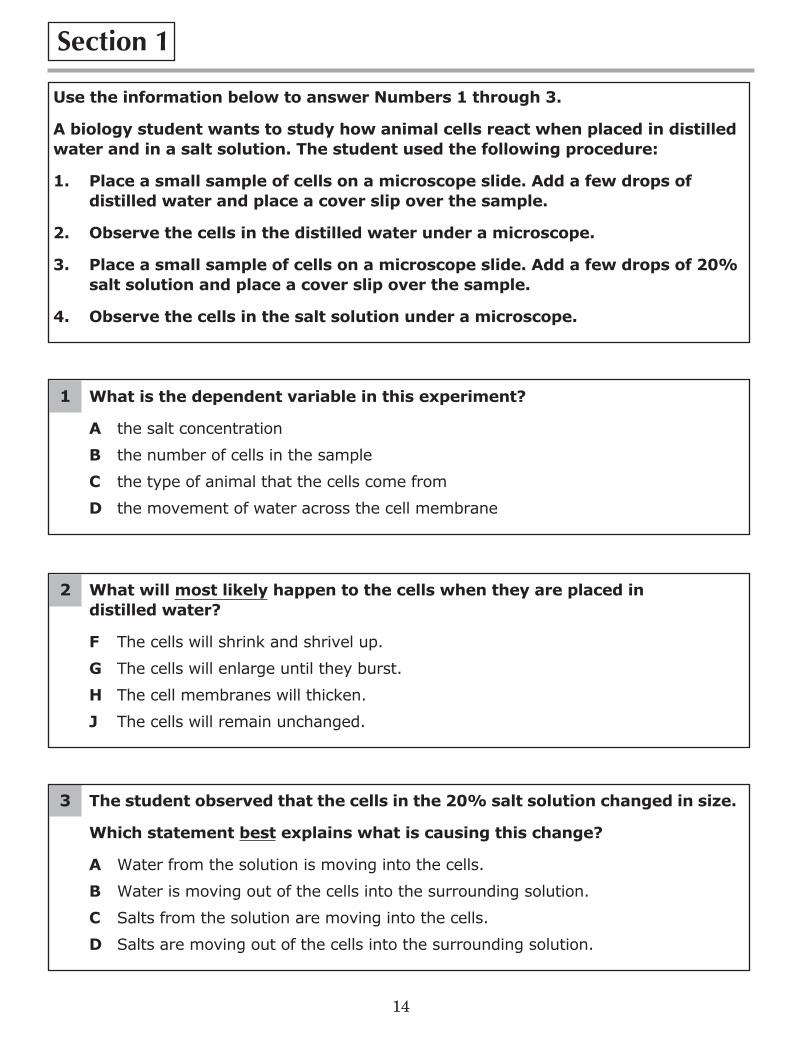
Use the information below to answer Numbers 1 through 3.
A biology student wants to study how animal cells react when placed in distilled water and in a salt solution. The student used the following procedure:
1. Place a small sample of cells on a microscope slide. Add a few drops of distilled water and place a cover slip over the sample.
2. Observe the cells in the distilled water under a microscope.
3. Place a small sample of cells on a microscope slide. Add a few drops of 20% salt solution and place a cover slip over the sample.
4. Observe the cells in the salt solution under a microscope.

15
Section 1
4 The diagram below is an energy pyramid that groups the organisms of an ecosystem into four levels.
12
3
4
What will happen to the energy in level number 2 of the pyramid?
F Some of it will be passed to level 1, but most will be lost to the environment.
G Most of it will be passed to level 1, but some will be lost to the environment.
H Some of it will be passed to level 3, but most will be lost to the environment.
J Most of it will be passed to level 3, but some will be lost to the environment.
5 A student wanted to find out whether tall stem height or dwarf stem height was dominant in pea plants. She crossed a tall pure-breeding pea plant with a dwarf pure-breeding pea plant. She collected 100 seeds from this cross and planted them in rich garden soil. All of the seeds grew into tall pea plants.
Tall Pea Plant Dwarf Pea Plant
How should the student interpret the results of her experiment?
A Pure-breeding plants always grow into tall plants.
B Seeds grown in rich soil always grow into tall plants.
C Dwarf stem height is dominant to tall stem height in pea plants.
D Tall stem height is dominant to dwarf stem height in pea plants.

16
Section 1
6 Latosha performed an experiment on four equal-sized tomato plants. She placed each tomato plant in a separate container. Latosha gave each plant the same amount of light and nutrients, different amounts of water, and frequently measured the amount of oxygen produced by each tomato plant.
Which hypothesis was Latosha most likely studying in this experiment?
F If the amount of light is increased, then the rate of photosynthesis will increase.
G If the amount of nutrients is increased, then the rate of cellular respiration will increase.
H If the amount of water is increased, then the rate of cellular respiration will increase.
J If the amount of water is increased, then the rate of photosynthesis will increase.
7 Scientists are studying the mating behavior of hanging flies. Female hanging flies typically require their male mates to bring them a gift, such as a moth to eat. The scientists raised a group of female and male hanging fly larvae in isolation from adult hanging flies. When these larvae became adults, the females also required a gift from their mates.
Which statement is the best explanation for this behavior?
A The behavior is acquired randomly.
B The behavior is inherited through genes.
C The behavior is learned through experience.
D The behavior is inherited through imprinting.

17
Section 1
8 Ned finished an experiment and still had some unused chemical solution.
What should Ned do with the extra solution?
F pour it down the sink
G pour it back into its original container
H dispose of it as directed by his teacher
J put it in a beaker and place it under a fume hood
9 The data table shows the relationship of glucose molecules used to gas molecules released during cellular respiration.
6
12
18
24
1
2
3
4
Number of GlucoseMolecules Used During
Respiration
Number of Gas MoleculesReleased During
Respiration
Which cellular process would result in a cell releasing 120 gas molecules?
A the mitochondria converting 20 glucose molecules into carbon dioxide
B the chloroplasts converting 30 glucose molecules into carbon dioxide
C the mitochondria converting 30 glucose molecules into oxygen
D the chloroplasts converting 20 glucose molecules into oxygen

18
Section 1
10
NativeRange
Numberof
Toes OrganismMost Active
Day or Night?Number ofBony Horns
Mountain Goat
Grevy's Zebra
2
1
2
3 to 5
7
7
7
7
2
0
2
0
ReticulatedGiraffe
AsianElephant
NorthAmerica
Number ofNeck
Vertebrae
Africa
Africa
Asia
Day
Day
Day
Day
Characteristics of Four Animals
Scientists have classified the reticulated giraffe and the mountain goat as the most closely related animals in the table.
What two properties best support the classification of the reticulated giraffe and the mountain goat?
F the number of toes and the number of bony horns
G the time they are most active and the native range
H the number of neck vertebrae and the number of toes
J the number of neck vertebrae and the number of bony horns

19
Section 1
11 Students in a class drew pyramids to represent the number of organisms, the amount of energy available, and the amount of energy lost as heat in a specific ecosystem. The pyramid relating the amount of energy lost as heat was left incomplete.
TertiaryconsumersSecondaryconsumers
Primaryconsumers
Producers
Number of organisms
1,000,000
10,000
100
1
10,000
1,000
100
10
?
?
?
?
Energy available Energy lost as heat
Which pyramid illustrates the most likely values for the “Energy lost as heat” pyramid?
A
Energy lost as heat
1,000
100
10
1
B
Energy lost as heat
990,000
9,000
0
9
C
Energy lost as heat
1,010,000
11,000
200
11
D
Energy lost as heat
9,000
900
90
9

20
Section 1
12 Male bowerbirds collect colorful objects such as berries, feathers, and flower petals. A male bowerbird then displays his collections in his territory and sings to attract females. Male bowerbird 1 has a large collection of berries and feathers while male bowerbird 2 has a small collection of flower petals.
Which graph shows the most likely reproductive success of these two birds?
F ReproductiveSuccess of
Birds 1 and 2
Offspringof Bird 1
Offspringof Bird 2
G
Bird 1 Bird 2
ReproductiveSuccess of
Birds 1 and 2
Nu
mb
er
of
Off
spri
ng
H
Bird 1 Bird 2
ReproductiveSuccess of
Birds 1 and 2
Nu
mb
er
of
Off
spri
ng
J
Time
ReproductiveSuccess of
Birds 1 and 2
Nu
mb
er
of
Off
spri
ng
Bird 1Bird 2

21
Section 1
13 The niches of two insects, Species X and Species Y, are nearly identical except that they live on different continents. A population of Species Y was recently introduced into the native range of Species X.
What would most likely occur if Species X and Species Y lived together in the same ecosystem for a long period of time?
A Both species would adapt until they merged into one species occupying a single niche.
B One or both species would adapt until they no longer occupied the same niche.
C The presence of Species Y would cause mutations in Species X that would allow it to adapt to a new niche.
D Individuals of Species X and Species Y would develop new adaptations, causing the two species to adapt to different niches.
14 In a species of wildflower, some plants produce pink flowers while other plants produce white flowers. In a cross between two pink wildflowers, 77% of the offspring produced pink flowers and 23% produced white flowers.
If two wildflower plants with white flowers were crossed, what percentage of their offspring would most likely produce pink flowers?
F 0%
G 25%
H 50%
J 75%

22
Section 1
15 Jill wanted to find out how adding nitrogen to water would affect the growth of aquatic plants. She added plants to two jars of water. She added nitrate to the water in Jar 1 but made no changes to Jar 2. She left the jars in a sunny location for two weeks.
Which table shows the best procedure and the most likely result for this experiment?
A Procedure Result
Use a graduated cylinder to measure the volume of the entire contents of each jar.
Jar 1 has the greatest biomass.
B Procedure Result
Use a graduated cylinder to measure the volume of the entire contents of each jar.
Jar 2 has the greatest biomass.
C Procedure Result
Use a net to strain the plants out of each jar and use a balance to determine their mass.
Jar 1 has the greatest biomass.
D Procedure Result
Use a net to strain the plants out of each jar and use a balance to determine their mass.
Jar 2 has the greatest biomass.

23
Answer Key
Number Answer
Sample A A 3.5 N/A
Sample B F 3.3 2.2
11 D 3.2 1.1 12 G 4.1 1.1 13 B 4.5 1.1 14 H 5.2 5.2 15 D 4.5 2.2 16 J 3.4 5.1 17 B 2.2 3.3 18 H 3.5 N/A 19 A 1.1 1.1
10 F 2.2 3.1
11 D 3.3 5.2
12 H 4.8 3.3
13 B 5.2 3.2
14 F 4.1 2.2
15 C 1.2 5.3
ACE Biology I
Item Correct ContentObjective
Process/InquiryObjective

Section 1
1112131415
1617181920
2122232425
2627282930
3132333435
StOPdo not go on to Section 2
until you are instructed to do so.
Section 2
4142434445
4647484950
5152535455
5657585960
6162636465
6667686970
6789
10
12345
7172737475
SAMPLESAB
3637383940
7677787980
ace Biology i