oled – evaluation and clarification of the new organic ...18218/fulltext01.pdf · 1.2.1 the...
TRANSCRIPT
Department of Science and Technology Institutionen för teknik och naturvetenskap Linköping University Linköpings Universitet SE-601 74 Norrköping, Sweden 601 74 Norrköping
Examensarbete LITH-ITN-MT-EX--02/08--SE
OLED – Evaluation and
clarification of the new Organic Light Emitting Display technology
Patrik Stark Daniel Westling
2002-03-11

LITH-ITN-MT-EX--02/08--SE
OLED – Evaluation and clarification of the new Organic
Light Emitting Display technology
Examensarbete utfört i Medieteknik vid Linköpings Tekniska Högskola, Campus Norrköping
Patrik Stark Daniel Westling
Handledare: Fredrik Mattinson Saab Avionics, Stockholm Examinator: Reiner Lenz, ITN Norrköping
Norrköping den 2002-03-11

Rapporttyp Report category Licentiatavhandling Examensarbete C-uppsats D-uppsats Övrig rapport _ ________________
Språk Language Svenska/Swedish Engelska/English _ ________________
Titel Title OLED – Evaluation and clarification of the new Organic Light Emitting Display technology Författare Author Patrik Stark Daniel Westling
Sammanfattning Abstract Organic Light Emitting Displays (OLEDs) are a new type of thin emissive displays predicted to possess superior properties to existing techniques e.g. Liquid Crystal Display (LCD). The main advantages are low power consumption and a thin display structure. This report contains an explanation of the emissive OLED technology, its functionality and the physics of the organic layer structure in an OLED. The technology is described with respect to the two classes of organic materials used in displays, small molecules and conjugated polymers. The information is derived from a study of literature and from different measurements performed on a full-colour OLED microdisplay, based on colour filters. The evaluation of the OLED revealed the main disadvantage of an unsatisfactory lifetime of approximately only one week. The results of the measurements and study are furthermore compared to the traditional LCD technology. A conclusion with the advantages and drawbacks with the OLED technology summarises the report together with a short analysis of the future for OLEDs, partly achieved through a written enquiry sent to approximately 20 possible OLED manufactures.
ISBN _____________________________________________________ ISRN LITH-ITN-MT-EX--02/08--SE _________________________________________________________________ Serietitel och serienummer ISSN Title of series, numbering ___________________________________
Nyckelord Keyword OLED, microdisplays, HMD
Datum Date 2002-03-11
URL för elektronisk version
Avdelning, Institution Division, Department Institutionen för teknik och naturvetenskap Department of Science and Technology
Abstract Organic Light Emitting Displays (OLEDs) are a new type of thin emissive displays predicted to possess superior properties to existing techniques e.g. Liquid Crystal Display (LCD). The main advantages are low power consumption and a thin display structure. This report contains an explanation of the emissive OLED technology, its functionality and the physics of the organic layer structure in an OLED. The technology is described with respect to the two classes of organic materials used in displays, small molecules and conjugated polymers. The information is derived from a study of literature and from different measurements performed on a full-colour OLED microdisplay, based on colour filters. The evaluation of the OLED revealed the main disadvantage of an unsatisfactory lifetime of approxi-mately only one week. The results of the measurements and study are furthermore compared to the traditional LCD technology. A conclusion with the advantages and drawbacks with the OLED technology summarises the report together with a short analysis of the future for OLEDs, partly achieved through a written enquiry sent to approximately 20 possible OLED manufactures.
______________________________________________________________________________________
- i -

______________________________________________________________________________________
- ii -

Preface and acknowledgements This report is the concluding document of our completed master thesis at SAAB Avionics in Kista, Sweden. The thesis work is a part of our Master degree in Media Technology at the University of Linköping, Campus Norrköping. During our thesis work we have received support from a number of persons and we would like to thank: Our supervisor Fredrik Mattinson at SAAB Avionics for tremendous support and assistance. Göte Svedenkrans at SAAB Avionics for all knowledge concerning displays in general, measurements on displays and optical solutions for HMDs. Our examiner Reiner Lenz at ITN, Linköping University. Odd Romell, Rikard Isby, Jari Ilkkala and the rest of the people we have met at SAAB Avionics. Thomas Granlund, at Saab Avionics in Linköping, for a wider knowledge concerning OLEDs. Stockholm 2002-03-07 Patrik Stark and Daniel Westling
______________________________________________________________________________________
- iii -

______________________________________________________________________________________
- iv -
Table of Contents 1 INTRODUCTION 1
1.1 Background 1
1.2 The thesis assignment 1 1.2.1 The assignment background and motivation 2
1.3 The disposition of the thesis work 3
1.4 The disposition of the report 4 2 DISPLAY TECHNOLOGY 5
2.1 Introduction to displays 5
2.2 LCD - Liquid Crystal Display 5 2.2.1 Background 5 2.2.2 Technique 6
2.3 OLED - Organic Light Emitting Display 9 2.3.1 Introduction 9 2.3.2 The composition of an OLED 11 2.3.3 Fabrication of OLED devices 14 2.3.4 Full-colour approaches in manufacturing 15 2.3.5 Power efficiency in an OLED 17 2.3.6 OLED Lifetime 20
2.4 Pixel addressing 24 2.4.1 Introduction 24 2.4.2 Passive matrix addressing 24 2.4.3 Active matrix addressing 26
3 MEASUREMENTS 28
3.1 Definitions of fundamental display properties 28 3.1.1 Photometric properties 28 3.1.2 Colorimetric properties 29 3.1.3 Gamma distribution 30
3.2 Equipment used for the measurements 31 3.2.1 Displays 31 3.2.2 Photoresearch PR-714 SpectraScan 32 3.2.3 Photoresearch Spectra-Pritchard Photometer PR-1980A 33 3.2.4 RKE Eyepeice ocular 34 3.2.5 DSS 90 34
3.3 Measurements 36 3.3.1 Calibration of the OLED 36 3.3.2 Maximum luminance 38 3.3.3 Contrast 40 3.3.4 Chromaticity 41 3.3.5 Luminance uniformity 42 3.3.6 Power consumption 45 3.3.7 Viewing angle 46
______________________________________________________________________________________
- v -

3.3.8 Lifetime 51 3.3.9 Measurement with oculars 53
4 DISCUSSION AND CONCLUSION 56
4.1 OLED – Advantages and drawbacks 56
4.2 An OLED LCD comparison 57 4.2.1 Brightness 57 4.2.2 Power efficiency 57 4.2.3 Colour representation 57 4.2.4 Manufacturing 57 4.2.5 Resolution 58 4.2.6 Ruggedness 58 4.2.7 Size 58 4.2.8 Viewing angle 58 4.2.9 Temperature 59 4.2.10 Response time 59
4.3 OLED future 59 5 REFERENCES 61
APPENDIX A – OLED PHYSICS 64
A.1 Theory of physics 64 A.1.1 Introduction 64 A.1.2 The semiconductor 65 A.1.3 Physics of an OLED device 67
A.2 The OLED device 70 A.2.1 The OLED composite 71
APPENDIX B – DEFINITIONS AND EQUATIONS 75
B.1 Derivation of the wavelength 75 B.2 Definition of CIE Chromaticity co-ordinates 75
B.2.1 1931 (x, y) - CIE Chromaticity values 75 B.2.2 1976 (u’, v’) - Uniformity Chromaticity Scale 76 B.2.3 Definition of the reference illuminant E (white point) 76 B.2.4 Definition of dominating wavelength 76 B.2.5 Definition of excitation purity 76
APPENDIX C – ADDITIONAL FIGURE 77 APPENDIX D – ABBREVIATIONS 80
______________________________________________________________________________________
- vi -

1 Introduction
1.1 Background Saab Avionics, division for Airborne Displays in Kista, Stockholm, is developing display systems for aircrafts mainly JAS Gripen. The introduction of a new business area, Head Mounted Display (HMD) for the civilian market, made it possible to participate in the EC founded project, Augmented Round Table for Architecture and Urban planning (ARTHUR). As the name of the project implies, the main application for the system is architecture and urban planning. Saab Avionics part is to supply an HMD that fulfils the demands of the application. In order to realise the demands, SAAB Avionics wanted to investigate other alternative display technologies than Liquid Crystal Display (LCD) such as Organic Light Emitting Diodes (OLED). The OLEDs are based on organic materials, which emit light when they are subjected to an electrical field. The OLED technology is a new and only a few products are on the market at the moment. It is believed that when the technology is fully mature it will drive the LCD out of the market due to the expected superior properties of this new technol-ogy, e.g. a thinner structure, cheaper manufacturing and wider viewing angle. The property that prevents the OLEDs to be more frequently used today is the insufficient lifetime of the device. OLED devices can be divided in two classes depending on the technology used, conjugated polymers or small molecules. The first approach was the small molecules and it was developed at Eastman Kodak. Together with Sanyo Electric, Eastman Kodak has formed a joint venture to produce OLEDs, mainly focusing on 1-6 inch lower resolution active matrix displays. Several companies have based their research and production on the Eastman Kodak patent, e.g. eMagin, Lite Array, Osram and Rohm. The researchers in the Cavendish Group at Cambridge University discovered the emitting properties of conjugated polymers. They later formed the company Cambridge Display Technology Ltd (CDT), which is the leading research company on conjugated polymer displays today. For future display production CDT started collaborations with a number of manufactures, e.g. Philips, Micro Emissive Displays Ltd (MED) and AU Optronics. The advantages of using an OLED in an HMD instead of an LCD are mainly due to the emissive properties of this new technology. This would eliminate the need for an external light source as in the LCD case. The removal of the backlight would yield a more compact optical solution with fewer lenses and filters and consequently leading to lower weight, smaller size, lower cost and better brightness efficiency through the system.
1.2 The thesis assignment The purpose of the master thesis was to evaluate if the OLED technology was appropri-ate for an implementation into an HMD application.
______________________________________________________________________________________
- 1 -
An OLED was purchased from the US company eMagin and evaluated through measurements. The measurements of interest were e.g. luminance, colour representation and contrast. The lifetime of the device was of special interest, but also response time, resolution, power efficiency and viewing angle were analysed and compared with properties of an LCD. A literature study concerning the OLED technology was done in order to understand the results of the measurements. A complete list of references was also of interest for SAAB Avionics. The literature study collected information about the advantages and drawbacks of the OLED technology. The basic physics concerning the light emission from organic materials was also summarised. A forecast was done to investigate when a suitable HMD display could be for sale and which properties that prevents the OLED to be commercial-ised. The master thesis is concluded in a written report and an oral presentation at SAAB Avionics and the University of Linköping.
1.2.1 The assignment background and motivation HMDs HMDs can be used in a wide variety of applications but since the systems are rather expensive the applications today are mainly focused on military use. Since personal computers become faster and their ability to display more advanced graphics is enhanced, HMDs will become more widely used on the non-military market. An HMD consists in its simplest form of a microdisplay placed in front of a collimating lens yielding in parallel rays from the display to the eye. For more advanced systems, e.g. with see-through ability, the construction becomes more complex and a wide variety of lenses and filters have to be used [1]. This contributes to a higher weight and size, which is not suitable in a comfortable HMD. An important issue for many applications when constructing HMDs is to accomplish a wide Field Of View (FOV). By using different lens system layouts a sufficient FOV can be achievable. The brightness to the user depends on the brightness of the display and also on the absorption of the different lenses and filters between the display and the eye. The demands are higher in a see-through application under “real world” illumination conditions. In Virtual Reality (VR) applications the demand for high brightness is not primarily of importance. The first versions of HMDs had displays based on CRT technology. The thinner LCDs soon replaced the CRT displays and lead to smaller and more comfortable HMDs. It is believed that OLEDs will replace the LCDs used today when the technology is mature enough. The advantages with OLEDs in HMDs are mainly due to the thinner display format and the absence of an external light source.
______________________________________________________________________________________
- 2 -

The ARTHUR project, a possible future OLED application The European Community (EC) funded ARTHUR project aims at enabling collaborative discussion with several persons around a table enhanced with virtual objects in an augmented reality. This should enhance ordinary table meetings with a new way of interaction. The project is a joint collaboration between several companies and universi-ties in Europe, where SAAB Avionics part is to supply an HMD. The project started at 1st of August 2001 and will run for three years. The system should be user-friendly, allow intuitive interaction and should not require prior knowledge. The areas in which the system could be used are focused at architecture and urban planning, but also disaster control and event planning are proposed as possible fields of application. The interaction with the virtual objects, e.g. houses, would be performed by superimpos-ing virtual images on real objects, e.g. pencil-sharpener. Moving the real object would then result in a movement of the virtual object. The communication with the system should be performed through different gestures. The tracking of the objects and the gestures would be achieved through computer vision leading to a local independent system. The HMD is therefore supplied with a small lightweight video camera. The HMD, for the ARTHUR project, is an enhancement of a prior product made at SAAB Avionics, the Addvisor 100. The Addvisor 100 is a high-end display with very good resolution, FOV and image quality properties. The new ARTHUR HMD will combine the advantages from the prior model with a less expensive and more lightweight solution. The HMD supplied should allow stereoscopic 3D images and have see-through ability. One way to make the HMD more lightweight and cheaper is to use an OLED instead of the LCD originally used. OLEDs are also believed to be more power efficient compared to LCDs. For the use in HMDs high power efficiency is important in order to make the connecting cable thinner and more flexible. Better power efficiency will also enable battery driven HMDs and consequently HMDs with lower weight. The display used in the HMD should have a resolution of SXGA (1280 *1024) and a diagonal size of approximately 0,9 inch. 1.3 The disposition of the thesis work The OLED technology is rather novel and the information in the literature study, according to the assignment, had to be retrieved from research papers. A large number of papers were studied and relevant information obtained. Details of the technology and research in the area were discussed in a meeting with Ph.D. Thomas Granlund at SAAB Avionics in Linköping. Thomas Granlund has made a Ph.D. dissertation in the subject of OLED and was a great source of information during the thesis work. An evaluation of the eMagin OLED kit was done through measurements, which later could be related and compared to the results reported in the literature.
______________________________________________________________________________________
- 3 -

To investigate the future OLED market and its main problems, a written inquiry was sent to approximately twenty display manufactures that were regarded as potential future OLED providers. The purpose of this investigation was to obtain a forecast on when a suitable microdisplay for the ARTHUR HMD could be available. 1.4 The disposition of the report The report consists of five chapters. The first chapter is an Introduction that also the reader the motivation, description and purpose for the assignment. The chapter gives further a brief overview over subject. Information on how the assignments were carried out and the structure of the report are also included. The second chapter, Display technology, presents the LCD and OLED technology in a general manner. The different methods for pixel addressing are also introduced to the reader. Appendix A is a complement to this chapter and should be read for a more complete knowledge. Measurements, a comparison between LCD and OLED is the third chapter, which is based on the measurements of the eMagin OLED and CRL LCD display. A comparison between LCD and OLED is done concerning the most important display properties. The main purpose for this chapter is to highlight these properties and give a technical background to the differences between OLED and LCD. The fourth chapter, Conclusions, consists of a summary of the results obtained based on measurements and the research papers studied. A discussion and conclusion of the main advantages and disadvantages of the technology is presented here. The References, marked by [X] in the report, refer to books, personal communication, research papers and websites. To facilitate the study of this report additional references (X.X.X) related to chapters, figures and tables are stated in the report. The appendix A gives the reader a deeper and the more comprehensive knowledge in OLED technology and especially its physics. Appendix B lists definitions and equations and appendix C shows additional figures. Appendix D consists of a list of abbreviations that are relevant to the subject.
______________________________________________________________________________________
- 4 -
2 Display technology
2.1 Introduction to displays The main objectives for constructing a display are to achieve lightweight and flexibility together with high brightness, contrast and resolution suitable for the application. A wide viewing angle, low power consumption and low manufacturing costs are also desirable. In recent years focus have been made on producing flat panel displays to replace the bulkier Cathode Ray Tube (CRT) displays in computer monitors and television sets. There are two main classes among the displays used today, emissive and non-emissive. The main difference is that the non-emissive displays need external light sources which light is modulated to show information. In comparison with emissive displays, which have no need for an external light source. Examples of non-emissive displays are LCD and among the emissive displays are CRT (Cathode Ray Cathode) and LED (Light Emitting Diode) the most common and also the new OLED technology is of emissive type. The definition of the term microdisplay is a display with a size not larger than 1 inch diagonal and is often combined with an optical system. Microdisplays are commonly used in different projective display systems and also as the displays in HMDs.
2.2 LCD - Liquid Crystal Display
2.2.1 Background LCDs are widely used and hold approximately 47 % of the total display market. CRT displays hold 50 % and the remaining 3 % consist of various display types e.g. plasma displays [2]. LCDs are based on the unique properties of liquid crystals. Liquid crystals are an intermediate form between disordered molecules in a liquid and the ordered molecules in a crystalline solid form, yielding a liquid with a crystalline behaviour. The phenomena of the liquid crystals have been known for over 50 years. The liquid crystals where not used in displays until the discovery of the properties of twisted nematic in 1971, which lead to the start of a new display era. Today the LCD technology is used in a wide range of applications, e.g. computer monitors and cell phone displays. Because of the advantages of the LCD technology compared to the properties of CRT, the LCD will expand on the market at the expense of CRT. The advantages compared to CRT are e.g. lower power consumption, thinner structure and less flickering. The disadvantages on the other hand consist of a poor viewing angle, more expensive manufacturing and not reliable colour performance. Researchers think that when the OLED technology will be fully mature for mass production the LCD market will be reduced on the behalf on OLED.
______________________________________________________________________________________
- 5 -

2.2.2 Technique An LCD works as a light modulator through affecting the polarisation angle of a liquid crystal using an electrical field. The display does not emit any light by itself and must therefore be illuminated reflectively or by background lighting. The unique property of the liquid crystal is that they can be used as polarisation filters. The molecule structures are like rods arranged in a parallel manner in liquid form. The LCD consists of a number of liquid crystal cells that compose the different pixels in the display. The thin glass layers that encapsulating the liquid have a very thin row like patterning allowing the rods only to be placed in the same orientation as the patterning. When placing the glass layers with a 90° difference, they affect the rods in the liquid to be twisted 90°. This configuration is called Twisted Nematic (TN) and can be envisaged in figure 2.1.
Figure 2.1 Liquid crystal cell in a white mode Twisted Nematic LCD.
When an electrical field is applied to the liquid crystal cell the rods orient randomly and no twist of the polarising angle is achieved. Two polarisation filters are placed at each side of the liquid crystal layer. The two polarisation filters can be arranged in a parallel or a crossed manner depending on function wanted. If they are placed parallel, the LCD is considered to be in black mode and only allow light to pass if a voltage is applied. In white mode, the display allows the light to emit through if there is no voltage and block the light when a voltage is applied (figure 2.1). Due to the parallel filter arrangement a small light leakage is apparent even when the display should be dark. This leading to a lower contrast ratio for black mode displays compared to white mode displays. Different greyscale levels are achieved through modulating an analogue driving voltage to change the amount of twist of the rods.
______________________________________________________________________________________
- 6 -
An LCD can modulate the light from the external light source in two different ways, resulting in two main-classes among LCDs, reflective or transmissive displays. The transmissive LCD is illuminated by a backlight behind the display panel. The backlight is often a fluorescent tube or a panel of LEDs that is positioned in such arrangement that it covers as large area as possible. A prism can also be used to enhance the distribution of light. One common method to display full-colour is achieved through splitting each pixel into three side by side placed subpixels, one for each RGB colour, red, green and blue. The subpixels contain band pass filters that are filtering the white light from the backlight to achieve the right coloured wavelength. A reflective LCD uses the light from an external light source, which the panel reflects towards the beholder. It is also possible to use reflective display without an external light source in environments with a high surrounding illumination, e.g. for the use in mobile phones. Colours are represented through sequentially flash the external light source in the different RGB colours during the time of one frame. One drawback for reflective LCDs is that the field-sequential colour representation results in a three times faster refresh rate needed, compared to transmissive LCDs. To avoid field-sequential colour representation a rotating colour scheme can be used. This works by dividing the screen into three equal parts, one for each colour, which continu-ously moves over the display surface resulting in a three times better frame rate [3]. Another drawback is that the position of the reflective light source can limit the viewing angle, allowing the display only to be used in near-eye or projection applications. Reflective LCDs have although other advantages compared to transmissive displays. The addressing components can be hidden under the panel resulting in a larger active area on the display. The pixels do not have to be that tight patterned compared to transmissive displays, where the pixels must be three times tighter patterned due to the subpixel colour representation. Better pixel addressing properties that can be seen in a voltage/transmission curve (figure 2.7) can be achieved in LCDs by twisting the rods even more (2.4.7). The most common twist for displays is 270°, the LCD is then said to be of Super Twisted Nematic type (STN). Another type of LCD is the Ferroelectric LCD (FELCD). FELCDs are based on a bi-stable liquid that does not require a continuous electrical field. This makes the display faster through not having a need to address the pixel during the whole active phase, only a need to activate it and then address the next pixel. This result in a typical response time less than 50 µs compared to tens of milliseconds for nematic displays [4]. The bi-stable property of the liquid makes the display unsuitable for analogue driving for greyscales and instead a time multiplexed greyscale representation must be used [5]. Time multiplexed greyscale or time dithering works by switching the different pixels on and off according to their greyscale values. Because of the fast frequency used the eye is not capable to notice the flickering pixels and only sees a constant lighting greyscale level. The FELCD are more difficult and expensive to produce than ordinary nematic LCDs but are widely used when there are higher demands on response time.
______________________________________________________________________________________
- 7 -

For an LCD is the brightness dependent on the brightness of the external light source and on how much of the light that is reduced by the colour and polarisation filters in the display. A typical colour AMLCD is considered to possess a transmission ratio between 5% and 9% [6], which leads to high demands for the backlight. To compensate the losses a more powerful light source can be used but with extra weight and thermal problems as a consequence. The lifetime of an LCD is mainly equal to the lifetime of the external light source. Lifetimes more than sufficient for most applications have been achieved and lifetime is therefore not considered to be a problem for the LCD technology.
______________________________________________________________________________________
- 8 -

2.3 OLED - Organic Light Emitting Display
2.3.1 Introduction The solid-state physics is generally considered to contain three different groups, metals, semiconductors and isolators. Metals have no bandgap and the outer electrons can move easily to the conduction band and yield a good conductivity. The isolators have a too large energy gap to move electrons to the conduction band. The semiconductors behave like isolators but with a smaller energy gap (A.1.1). During the last fifty years, the semiconductor physics have played a major role in the industrial and technical development and are used in countless of applications, e.g. diodes and transistors. The solid-state semiconductor materials are referred to the IV-group in the periodic system in figure D.4. Compound materials with combinations of the III– and V-groups also possess semiconductor properties. The derivation of light when applying an electrical field to a semiconductor material is known as electroluminescence. This master thesis is focusing on electroluminescence and the term will be mentioned as luminescence in the following part of the report. A LED constructed of semiconductor materials is based on this luminescence-phenomenon and has been mass-produced the last thirty years. The applications for the LED are found in several areas including optical communication and dot matrix displays. The LEDs are furthermore commonly used as external backlight illumination for LCD displays, because of their ability to emit intensive light. In spite of the fact that the organic material carbon (C) is positioned in the IV-group as the semiconductors materials, it is considered as an isolator. Apart from that fact, Hideki Shirakawa discovered a conducting ability of the organic material in 1977. This discovery resulted in the Nobel Prize in chemistry in 2000 and started a new era of the semiconductor technology resulting in new applications, e.g. polymer-based storage of data. In 1987, the group of Tang and Van Slyke at Eastman-Kodak presented luminescence from an organic material [7]. The group constructed an efficient OLED, which was driven by a rather small voltage. The technique they used to emit light was to vacuum deposit small molecules to form a layered structure. The layered structure is sandwiched between to electrodes. The thin layer (<1 µm) of organic material permits a high electrical field at low voltage. Thus, light from thin film organic materials is usually produced at low voltage. High quality thin molecular layers were an important condition for the development of OLEDs. In 1990, a group at the Cavendish Laboratories at Cambridge University presented the first LED using polymers as active material. The active polymer was a conjugated polymer [8]. In comparison to the traditional solid state LED, the new organic ap-proaches were believed to be much more efficient. In nature organic materials are in some cases able to perform in a chemical way a 100% relationship of energy consump-
______________________________________________________________________________________
- 9 -

tion versus emission of light, e.g. the fireflies. Unfortunately is such high efficiency unrealistic in fabricated electroluminescence devices. The conjugated polymers and small molecules are considered as the two classes for OLED. Despite of the fact that the two approaches only emitted a small amount of light that lasted only a few minutes, it caused a major interest among other researchers and companies. Much because of the predicted features of the organic displays would overcome the advantages for other display techniques, e.g. low voltage, low weight and wide viewing angle. The two classifications of light-emitting organic layers in the OLED devices both possess luminescent and conductive properties. To achieve accurate functions of the material, a modification of the specific characteristics of the material are often done. Small molecules have molecular structures of relatively short characteristics and consequently low molecular weights. The most commonly used material with the most explored properties among the small molecules is hydroxyquinoline aluminium (Alq3) (figure A.10) The conjugated polymers are composed of a long repeating chain of similar smaller molecules, called monomers. They possess consequently, compared to small molecules, a molecular weight twenty to fifty times higher. A frequently used conjugated polymer is the poly paraphenylene vinylene (PPV). Luminescence of organic materials Organic materials refer to a base of the IV-material carbon and with additional elements such as hydrogen (H), nitrogen (N), oxygen (O), phosphorus (P) and sulphur (S). Since polymers and organic materials are not referred as conducting materials because of the large band gap, a very high electrical field has to be applied. When applying an electrical field, the charge injections result in geometrical defects on the symmetric organic structure and exhibit a lower bandgap Eg according to figure 2.2. The charged carriers move along the structure and the attraction between the carriers results in an exciton with a possibility to emit light as photons. The exciton is either in singlet or in triplet-state according to the Pauli’s principle [9]. The exciton will form two new energy bands inside the bandgap. Upon relaxation of the exciton, heat and photons will be emitted with an energy set by the energy difference between the energy bands that represent the exciton. The singlet-state is regarded as the light forming state, while triplet-state is not. In some special cases the triplet-state produces light as well. The energy of the photons refers to the wavelength of the light shown in Appendix B. The backbone of the organic materials is made up of strongly localised bonds between the carbon atoms. The conductivity is enabled through bonds that are orthogonal to the backbone. The length of the conjugation, i.e. the conjugation length, set certain characteristics of the molecule. The conjugation length defines the length where the electron is free to move within. Naturally, small molecules tend to have short conjugation length, while longer conjugated molecules, polymers, may have a longer. Longer conjugation length results in a smaller bandgap. It is therefore easier to produce red light
______________________________________________________________________________________
- 10 -

with conjugated polymers compared to small molecules, and consequently small molecules can more easily produce blue light. If the conjugation length of a molecule increases to infinity, the bandgap is closely to zero, which could be compared to the conductivity for a metal structure. This may be done by doping, i.e. introducing ions to the conjugated molecule, or by changing the side chains of the conjugated molecule.
2.3.2 The composition of an OLED The mono-layered-device OLED devices could basically be described in the same manner as semiconductors, which could be studied in Appendix A. The simplest OLED, a mono-layered device, is constructed of a thin layer of organic material sandwiched between two electrodes. The function of the anode is to supply positively charged holes and a frequently used material, due to its transparency, is the Indium Tin Oxide (ITO). The cathode electrode supplies electrons to the organic layers. The electrodes are further used to address specific pixels in the device and could be studied in chapter 2.3.5. The charged carriers of electrons and holes are injected into the thin emitting layer material where they form an exciton. The fact of the singlet and triplet states of the excitons has a certain influence and limitation on the quantum efficiency of the device (2.3.4). A long lifetime of an exciton opens up many ways to destroy the exciton. Because of the disordered structure in organic materials, it is more difficult to conduct the charge carriers to the emitting zone where the excitons are formed. Another problem related to mono-layered devices is that the charge carriers tend to remain at one of the electrodes and creating space charges that prevent further hole- and electron injections (A.2). Furthermore, if charges form an exciton near a metal, quenching could destroy the exciton. The double-layered device A minimisation of the energy barrier between the electrodes and the organic material is another approach is to enhance the injection of the carriers. The mono-layered device is then upgraded to a double-layered device. Instead of one organic layer, two layers, a hole- and an electron layer, are placed between two electrodes according to figure 2.2. By choosing the material according to their properties of mobility, bandgap, the charged carriers could be injected and transported in an easier manner into the zone where an emission of light takes place [10]. The energy of the materials could through the double-layered construction become more matched to the specific electrode and result in improved equilibrium of the currents of holes and electrons. The electrical field could consequently be decreased, which increases the efficiency and lifetime of the device (2.3.5). The difference in energy levels between the two organic layers creates a potential barrier at the interface. The barrier confines the holes and electrons and contributes to an increased recombination probability [11].
______________________________________________________________________________________
- 11 -

Holes
Electrons
Eg
LUMO
HOMO
Ener
gy E
HTL Anode Cathode ETL
Figure 2.2 The organic p-n junction in a double-layered device where a recombination in the ETL emits light.
The multi-layered device The functionality of the double-layered device and its components could be further dispersed over several layers and minimal potential barriers. The greatest advantage of a multi-layered structure, compared to a double-layered, is the possibility to separate transport regions from the emitting region, i.e., optimising the different zones of the diode to increase the efficiency. This multi-layered structure accomplishes a better performance and an increased range of colours of the emitted light. By tuning the voltage over the electrodes a proper placement of the emitting zone could be achieved, which may improve the efficiency of the device many folds. (A.2). The composite in figure 2.3 is a general exemplification of a down-emitting device, which has its light emitted through the transparent anode. Composition The substrate upon which the OLED composite is build consists of a material with a rigid or a flexible structure, e.g. glass or plastics. The substrate is deposited on top of the construction to enable emission of light from the device. Compared to flexible substrates, rigid materials are more advantageous because of their ability to prevent the device from moisture and air. An outer exposure of moisture and air without any protection significantly degrades the lifetime and perform-ance of the device (2.3.5). To enhance the injections from the anode, according to the figure 2.3, a Hole Injection Layer (HIL) is introduced for control and an enhancement of the injection of the holes into the Hole Transport Layer (HTL). An effective HTL of p-type material transports the holes effectively to the emitting zone. The excitons are expected to be formed in the Emitting layer (EML) and eventually emit light. Equilibrium between the carriers is difficult to achieve and to confine the charged carriers a blocking layer could be used to perform a maximum recombination.
______________________________________________________________________________________
- 12 -

The Electron Transport Layer (ETL) is of n-type doped material and transports the electrons to the EML. This will lead to an enhancement of the mobility of the charge carriers. The layer has also a function of hole blocking and is suitable to control specific charged carries layer (2.3.3). The ETL could, similar to the HTL, be used as an emitting layer. Similar to the holes, an organic Electron Injection Layer (EIL) is used to help the electrons to cross the barrier between the cathode and the ETL. Due to the better transports of electrons, which is a critical issue, the multi-layered device requires a lower electrical field and leads to a more power efficient OLED device. It is furthermore possible to use the same material for the two electrodes, but to the cost of reduced efficiency.
Light
Cathode 150 nm Electron Injection Layer (EIL) 200 nm Electron Transport Layer (ETL) 35 nm Emitting Layer (EML) Hole Transport Layer (HTL) 50 nm
Hole Injection Layer (HIL) 20 nm Anode 100 nm
Substrate
Figure 2.3 The OLED multi-layered down emitting composite. Glass transition temperature The glass transition temperature Tg, for the polymer materials is also an important issue when choosing material for the device. Each polymer material has a Tg where the materials change its state. When a material is used below this temperature the materials tend to be more hard and fragile, like glass. If the materials are used over their Tg, they posses more soft and flexible rubber like structure. In OLEDs the conjugated polymers have a very high Tg approximately 90-95 °C that results in a hard glasslike structure when used in room temperature. When used in temperatures over Tg the display does not obtain a proper functionality and the lifetime is reduced. By finding polymer materials with a higher Tg the upper limit of the tempera-ture range can be improved [12]. The problem of the Tg does not affect OLEDs based on small molecules; instead does the evaporation temperature affect the high temperature resistance. A high temperature used in the evaporation manufacturing process yields a high temperature resistance.
______________________________________________________________________________________
- 13 -

Modifications A down-emitting device has a transparent substrate according to figure 2.3. A silicon backplane could be used as the substrate and with a different combination of the electrodes and the organic layers; an up-emitting device could be accomplished. The up-emitting device is less power efficient, but presently more advantageous for some microdisplays applications such as eMagin [13]. When using a transparent cathode in the down-emitting device, the device has become a Transparent OLED (TOLED). The transparency of the device then is nearly as transpar-ent as the chosen substrate. For advanced multi-stacked OLED devices, e.g. Stacked OLED (SOLED), the transparent device is a demand (2.3.3). It is also possible to apply the OLED on a flexible material to make thin bendable or foldable displays, called FOLED. This possibility enables a completely new era of display types, e.g. displays directly deposited on the windshield or the helmet visor. FOLEDs also bring a more rugged structure due to no need for the glass substrate and their bendable nature. Although more research has to be done in order to make the non-glass encapsulation efficient against humidity and oxidation that reduces lifetime of the device. Standard OLED uses a cathode of a metallic material. When ambient light passes through the display approximately 75% is reflected back [6] and when reaching the metallic surface it causes a poor contrast. The use of a TOLED in combination with an absorber or an optical interference structure would improve the contrast, e.g. Luxell’s black layer cause a 180° face shift and cancelling out the ambient radiation [14].
2.3.3 Fabrication of OLED devices Techniques for patterning The difference of the small molecules and conjugated polymers is mainly the fabrication and patterning process. All processing need a pure deposition of the organic material on a cleaned substrate. Moisture and UV-light have a certain effect on the degradation mechanism of the device during manufacturing [15]. Patterning small molecules Small molecule layers are deposited through a vacuum evaporation process to coat a substance to form thin films. The evaporation process results in parallel surfaces, which is important for the lifetime of the device. A disadvantage is the unsuitability for mass production. Another vacuum technique is the sputtering process, which exhibit a good uniformity and purity result for an achievement of a functional device. Into a vacuum chamber the organic material is sputtered as a thin film on the substrate by a bombard-ment with ions that eject atoms and molecules from the organic solution. These atoms and molecules will then form a thin film at the substrate. Patterning polymers Conjugated polymers can be either applied to a surface through dip-coating or spin-coating. Dip-coating is a method where the substrate is slowly dipped into the polymer, which results in a cover of polymers at both sides.
______________________________________________________________________________________
- 14 -

The spin-coating method is approached in room temperature with a drop of polymer solution placed onto a rotated plate where the polymer solution is spread out to form a uniform thin film. The thickness of the layers is dependent on the composition of the polymer and the concentration of the polymer solution. Drops can be formed resulting in non-smooth and non-parallel surfaces. This would cause a degradation of the device, because of the different distances between the electrodes. An advantage compared to the vacuum deposition is the simplicity of the method, but it is also a more wasteful process and this has to be taken into account when manufacturing large series of display, causing much higher costs. A drawback of spin-coating is the requirement of the removal of water and oxygen before the metal deposition [16]. The low-work function metal cathode is unable to deposit through spin-coating and vacuum deposition is therefore needed. Alternating patterning techniques for polymers Patterning of pixels could be done through photolithography but it is not applicable to all polymer based application, because of the degradation of the polymers by UV –light [15]. Ink-jet printing is better in this purpose, but not proper since the pixel pitch at 28 µm is considered too large for microdisplays [17][8][18]. This problem will in the future be overcome considering the development of printers. Soft-lithography is a proposed technique when using conventional lithography basics as patterning. [19] Suggestions have been made to use a shadow mask when depositing the different coloured pixel, which could lead to a simplification and enhanced precision in the deposition process [20].
2.3.4 Full-colour approaches in manufacturing In a similar manner for organic and small molecules, suggestions to achieve better and more pure colours have been made. The synthesising and doping of organic materials have modified their chain structure and colour characteristics. For emission of several colours, a host material can be doped with dye and new luminescent properties are then accomplished (Appendix A.1) [12]. According to chapter 3.1.4, a good colour representa-tion spans with the three additive primary colours a large colour gamut. White light OLED combined with a colour-filter This approach is commonly used with LCD-displays. The main advantage with this method is that there is no need to pattern the bottom substrate with different types of diodes and therefore only one white type of diode is used over the whole surface. The different colours are then obtained through a band-pass filtering. This technique gives the device a high-energy consumption, which affects lifetime of the diode (2.3.5) [21]. The eMagin OLED has a reduction of 88 % because of the colour-filters [22]. Side-by-side The Side-by-Side (SxS) approach, shown in figure 2.5a, is used to achieve colours without an additional colour filter. Each pixel is divided into three parts called subpixels. The three SxS primary coloured subpixels present, assuming a favourable and small pixel pitch, an arbitrary colour. A drawback is in high-resolution, when the subpixels need a patterning three times tighter to achieve a similar resolution compared to other colour
______________________________________________________________________________________
- 15 -

systems. For an achievement of high-resolution, the patterning process is considered to be a difficulty for a small pixel pitch. It has been proposed a patterning technique called shadow masking to reduce this problem. To enhance the colour gamut it is proposed to combine the emitting subpixel with an additional colour filter [15]. SOLED The best approach to achieve full-colour is through the SOLED device (figure 2.4) and is only possible for small molecules, due to the fact that complicated a multi-layer structure is not appropriate for OLED devices based on conjugated polymers [23]. Instead of SxS positioning, three separately addressed devices are placed on top of each other. The bottom and the middle device are TOLEDs, allowing down emitting light from the top layer. An SxS approach with a poor pixel pitch requires a certain viewing distance for an accurate colour representation, which is not the fact for SOLED. SOLED is therefore suitable for helmet-mounted and head-up displays that have demands for a short eye relief and high-resolution [24]. The ability to tune specific colours is further an advantage of the SOLED compared to the SxS approach. Another advantage can be observed in the fabrication process, since the pixel pitch is minimised and maximum fill factor and consequently result in a three times higher resolution [24]. The entire SOLED can be as thin as 500 nm, but a lack of proper efficiency makes the method not attractive at present [24].
GR B
Bottom TOLED
Middle TOLED
Thick Mg/Ag Electrode 1 (Reflector)
Top OLED
Thin Mg/Ag Electrode 3 (Partial reflector /absorber)
ITO Electrode 4
Sputtered ITO Electrode 2
Down conversion of blueEmission of blue light froThe method, envisaged indirectly converts blue to reThe energy of the blue lenergy in a red light. Thesimilar way as red [25].
__________________________
Figure 2.4 A
light m a layer cou
figure 2.5b, cospectively coloight is absorbe method to ac
______________
Glass substrate
n example of SOLED
ld be filtered and produce red, green and blue. nverts blue to green and further green to red or ur. d by a red fluorescent layer that releases the hieve green light is consequently made in the
______________________________________________
- 16 -

Full-colour with a hole blocking layer As earlier described, a hole blocking layer could be used to alternate recombination between the transport layers. A proposal is by blocking the holes and confine recombina-tions in the HTL, which results in an emission of blue light. A removal of the blocking layers provides green light emission from the ETL. As shown in figure 2.5c, an emissive layer is further integrated with the purpose to emit red light [21].
Hol
e bl
ocki
ng la
yer
Green ETL
HIL
ITO
Blue HTL
Cathode
Substrate
B G
B
B
B
G R
Substrate
B G
R G a)
B
B G R Substrate
R G B G R B c) b) Figure 2.5 a) Different full-colour approaches. a) SxS, b) Down conversion of blue light, c) A suggestion
of using hole blocking layer.
2.3.5 Power efficiency in an OLED The definition of power efficiency is the ratio between the power the display is subjected to and the amount of emitted light. For OLEDs the power efficiency are of great concern due to that an improved efficiency leads to a better lifetime (2.3.6). The power efficiency for an OLED device is the same as the external quantum efficiency. The external efficiency includes the internal efficiency but also takes outer factors as light emission from the side of the device and internal refraction into consideration Internal quantum efficiency is defined as the amount of emitted photons in comparison to the amount of charges injected into the emitting layer. The internal quantum efficiency for OLEDs depends on the electron-hole recombination in the emitting layer, where an increased amount of recommendations leads to a better efficiency. It is therefore important to choose a material with good recombination property, which could be studied in appendix A.1. Even if all electrons and holes form an excited state the quantum efficiency can not be theoretically better than approximately 50%. This depends on that it is only the singlet excited states that contribute to the light emission (A.4). In conjugated polymers there are
______________________________________________________________________________________
- 17 -

approximately 50% singlet and 50% triplet excited states. Instead of emitting light the triplet state emit heat that contributes to the degradation of the device. For small molecules there are about 25% singlet state and the small molecule materials therefore inhabit theoretically lower power efficiency compared to conjugated polymers. To enhance the efficiency for small molecules doping with a phosphorescent-material can be used [6]. Phosphorescent and fluorescent doping can be studied further in appendix A.1.3. In real devices the internal quantum is efficiency much lower than the theoretical value but doping of the materials does enhance their performance. The reduction of the internal efficiency is mainly due to the absorption of the emitted light due to Stokes shift (A.1.3). Table 2.1 shows the internal quantum efficiencies for phosphorecent and fluorescent doped small molecules compared to a conjugated polymer material at certain colour co-ordinates. As can be seen in figure 2.6 the phosphorescent doping results in much lower power consumption compared to the more traditional fluorescent doping. The figure 2.6 shows furthermore the power efficiency when using active matrix addressing instead of passive. RED GREEN BLUE Phosphorescent doped small molecules 6.0% @ (0.71, 0.29) 10.0%@ (0.28, 0.64) In development
Fluorescent doped small molecules 2.6% @ (0.62, 0.38) 4.4% @ (0.28, 0.67) 4.5% @ (0.14, 0.12)
Polymer OLED 3.0% @ (0.67, 0.33) 5.0% @ (0.39, 0.57) 2.0% @ (0.19, 0.24)
Table 2.1 Comparison of external quantum efficiency and CIE1931 co-ordinates of doped small molecules and non-doped Polymer LEDs. (Printed by permission from J. K. Mahon, Universal Display Group )[6] .
______________________________________________________________________________________
- 18 -

Power consumption for different types of OLEDs.
0
200
400
600
800
0 25 50 75 100 125 150 175 200
Brightness (cd/m2)
Pow
er (m
W) PM - Flourescent
PM - PhosphorescentAM - PhosphorescentAM - FlourescentAMLCD
Figure 2.6 Differences in power consumption for doped and non-doped respective active and passive matrix addressed devices. The power consumption for an AMLCD is also shown in comparison to OLEDs.
(Printed by permission from J. K. Mahon, Universal Display Group [6]).
______________________________________________________________________________________
- 19 -

2.3.6 OLED Lifetime The lifetime of a display states how many hours the display is functional. Similar to CRTs, the OLEDs are more sensitive due to their emissive nature and to that the emitted light decreases over time [13]. The lifetime can be divided into storage lifetime and operational lifetime. Storage lifetime or shelf lifetime, denote that it should be possible to store the display without any input current for a long period of time and that its functions should be unaffected by the passed time. The storage lifetime should be much longer than the operational lifetime, up to several years for some applications. There are two types of operational lifetimes, differential ageing and useful lifetime. Differential ageing denote that different pixels have different luminosity values at the same greyscale level addressed, i.e. if the same current is used at every pixels. The faster degradation process for some pixels is the result of that some pixel have been active during a longer period of time and with a higher current density compared to other pixels. The differential ageing can be noticed at displays where a similar image is displayed during a long time e.g. radar images. Differential ageing can be measured by a uniformity test, see chapter 3.3.5. For LCDs the entire display are lit by the backlight or reflective light source and the differential ageing does not affect the LCDs in such degree as for OLEDs. Useful lifetime is commonly stated as only lifetime in display specifications. This will also be the case in the following part of this report. The degradation of an OLED device is mainly observable through the reduction of light intensity as a function of operation time i.e. the higher brightness used the faster intensity reduction. The lifetime of a display corresponds to the time in hours before the overall display luminance have been decreased below a given threshold value, often 50% of the initial luminance value. For OLEDs the lifetime of the display is strongly linked to the power efficiency and as a consequence to brightness level of the display. High brightness yields in a deteriorated lifetime and vice versa depending on the linear relationship to the enhanced current density the display is subjected to. A good measure that combines them both is the lifetime pro luminance measure, stated as e.g. 107 h cd/m2 and resulting in a lifetime of 100.000 h when producing a luminance of 100 cd/m2. The achievable brightness level from an OLED is very high; more than 100,000 cd/m2 have been obtained [26]. OLEDs have been reported to have lifetimes of more than 100.000 h when producing a lumi-nance of 100 cd/m2, equal to a desktop monitor [13]. For displays used in HMDs the demand for a high brightness level is important. A monochrome microdisplays suitable for HMDs with a brightness of 1000 cd/m2 and a lifetime of 5000 h have been produced by the US company eMagin. The degradation process for OLEDs The mechanisms affecting the degradation process are strongly linked to the physical properties of the materials used and result therefore in different degradation properties between inorganic and organic LEDs [12]. The degradation mechanisms for OLEDs are
______________________________________________________________________________________
- 20 -

not fully clarified in comparison to inorganic LEDs where the processes are more widely understood and the lifetime is much longer. Although the development of the OLED technology has resulted in a better lifetime, it is still much lower than for the inorganic LEDs. The difference is that the nature of the organic materials makes them more sensitive to environmental changes and degradation. In OLEDs with poor power efficiency a high current density is needed in order to produce light. Only a few percentage of the power applied to the display results in an emission of photons, the rest is converted to heat. The heat developed in the device causes degradation of the display. The increase of heat has been found to be proportional to the input current of the display. The development of more power efficient displays would yield a reduction of the developed heat and a longer lifetime. The degradation process is different depending on which colour the material emits. To emit a blue colour a material with a larger bandgap is needed, which makes it harder to inject charged carriers into display and consequently more energy is needed. The high amount of current density makes the display more fragile and causes therefore a faster degradation for blue than for red and green emitting materials. The problem of high luminance value and lifetime is more evident when constructing colour displays than monochrome displays. The large reduction of the light for colour displays is a result of the colour filter used and reduces up to 90% of the display light intensity [22]. At the interfaces of the different materials diffusion of the atoms from materials can occur leading to a decline in effectiveness and lifetime. To prevent the diffusion an intermediate protective layer can be used, separating the two layers without affecting the electric transport between them. Another way is to choose a material with more stable properties in order to stop the diffusion of atoms. Some materials used for intermediate layers can even enhance the carrier transport by smoothing the barrier. The most widely used layer materials for intermediate layer purpose is polymers, carbon or a thin layer of oxide (A.3.1) [12]. An important factor that affects the lifetime is the encapsulation of the display. An OLED exposed to air is degraded in hours due to the oxidation. An encapsulation in an inert atmosphere has to be used in order to protect the display from oxygen and humidity diffusing into the layers. The drawback of efficient encapsulation is the increased weight and the reduced flexibility of the display. There are a several indications for the ongoing degradation of a display [12]. As mentioned above, the emitted light from the display can be reduced over time and instead must the applied current density on the device increase to maintain the original emission intensity. The decrease in brightness can occur in two different ways, either directly as the voltage is applied resulting in a short-term decrease or as slow decrease in brightness during the whole operating period of the display. The degradation can also be noticed as black non-emissive spots on the surface of the
______________________________________________________________________________________
- 21 -
display. The phenomena of black spot can appear in both displays based on small molecules or conjugated polymers. The black spots are areas on the displays, which not emit any light and contributes to an overall decrease in light emission from the display. The spots are commonly situated at the interfaces between the different materials often between the metallic electrode and the organic layer. The position of the spots also reduces the interface effectiveness leading to the need of a larger input current. The derivation of the spots is an almost unknown process but some suggestions of their origin have been made. There are different types of black spots depending on the materials they appear on and the reason for their appearance. It is generally believed that some types of spots occur as a result of an electrical short, often with its origin at one of the two electrodes. The shorts appear as a result of defects and impurities in the different materials. These spots have a circular shape and can reach a size of 300 µm in diameter. Observations have been made in polymer based diodes where small black dots first appear on the periphery of a white dot in the centre. The black dots continue to grow until the whole region within the periphery is covered with black spots, only leaving the initial white dot in the centre. In other cases the spots shows a bubblelike structure. These spots appear suddenly and do not grow as in the case with the spots mentioned above. It has been made suggestions that these spots are a result of gases, mostly water, trapped in the spot [12]. The crystallisation of some materials like the Alq3 is also assumed to be the source of black spots. Crystallisation is overall believed to be a parameter that decreases lifetime due to changes in morphology and in some cases causing unwanted diffusion of the interfaces in the layered structure. The crystallisation is believed to be a result of moderate heating during long operation periods or as a result of humidity in the device. Factors that reduce and prevent the degradation in OLEDs When finding more power efficient organic materials it is possible to reduce the degradation process. Various types of doping the organic materials can result in a better power efficiency and a longer lifetime [23]. As mentioned in chapter 2.3.4 through phosphorescent doping the triplet excited states are enabled to emit light instead of heat. This not only yields a better power efficiency; it also reduces the time spent in the excited state. In the excited state the molecules could be considered more reactive and can cause a degradation of the emitting layer due to unwanted chemical reactions. The reduction of triplet excited states would also lead to less heat generated and consequently to a better lifetime of the device. Better multilayer structures can also bring a longer lifetime [23]. Depending on how the different layers is designed and in which order they are placed the lifetime can be extended. The EML plays a great role by affecting the lifetime as a result of its position. The addition of a HTL layer enhances the lifetime by function as a stabiliser for the flow of holes and also in an overall better power efficiency due to more recombinations. The both transport-layers do not only functioning as transport medium but also in some case function as buffers preventing humidity and oxygen to diffuse into the active emitting layer. Due to the fact that OLEDs degrade under high temperatures cooling may some cases be used in order to achieve a longer lifetime.
______________________________________________________________________________________
- 22 -

How the displays are fabricated is a big factor in the desire of enhancing the lifetime, the process could be undertaken in vacuum or under great pressure or in some cases at low pressure, depending on materials used. During manufacturing the conjugated polymers and the small molecules are very sensitive to UV-light in combination with humidity. The manufacturing has to be precise due to that asymmetry and varying thickness of the layers are sources for local heating leading to damages on the display (2.3.3)[15].
______________________________________________________________________________________
- 23 -

2.4 Pixel addressing
2.4.1 Introduction For OLEDs the intensity of the emitted light is proportional to the current density the display is subjected to. Different greyscale values can be obtained by changing the current. LCDs are on the other hand voltage driven where the voltage affects the twist of the rods and consequently the different greyscale value. Although different types of display driver i.e. Integrated Circuit (IC) has to be used depending on the different driving technique, the same methods of pixel addressing with small modifications can be applied for both LCDs and OLEDs. The method of pixel addressing can be done in two different manners, direct driven segment display or multiplex driven dot matrix display. The direct driven method is the simpler, containing one contact wire to each emitting segment in the display. When constructing high-resolution displays the number of segments increase and the manufacturing of all the different wires become complex. The segment driven method of addressing is therefore only used in low-resolution displays like calculators and watches. To overcome the complex driving scheme and reduce the number of wires for higher resolution displays a matrix of wires is used connecting the different dots in the display. The multiplex driven dot matrix display is often build upon a glass surface on which a number of transparent columns are placed, working as anodes for the different pixels, often build out of the material ITO. Upon the columns a layer of the active material, liquid crystal or organic substance is positioned and enables each pixel to have contact with each column. By placing a final layer on top of the emitting pixels, consisting of rows of cathodes a complete matrix display is constructed. The IC then drives the rows and the columns. The difference in voltage between the rows and the columns is applied directly to the pixel allowing it to emit light during the time the pixel is addressed. This arrangement reduces the electrical connections to each pixel from M*N wires to all pixels for a direct driven segment display (with M rows and N columns) to M+N for a multiplex driven dot matrix display. To avoid that all pixels in the same row or column are affected when one pixel is addressed it is necessary with a time divided addressing. Only addressing one row at the time during the time of one time frame. This concept is called multiplexing and can be done in either a passive or an active manner.
2.4.2 Passive matrix addressing A passive matrix addressing consists of a simpler connection scheme compared to the active matrix addressing scheme. The simple scheme although results in limitations when it comes to high-resolution displays. For a single timeframe each row can only be addressed once. This allows each pixel in the column to emit light for a short period of time, similar to the way pixels emits light in CRTs. Each pixel is active only for a very short period of time; i.e. the total appearance of all the pixels is that they all emit light at
______________________________________________________________________________________
- 24 -
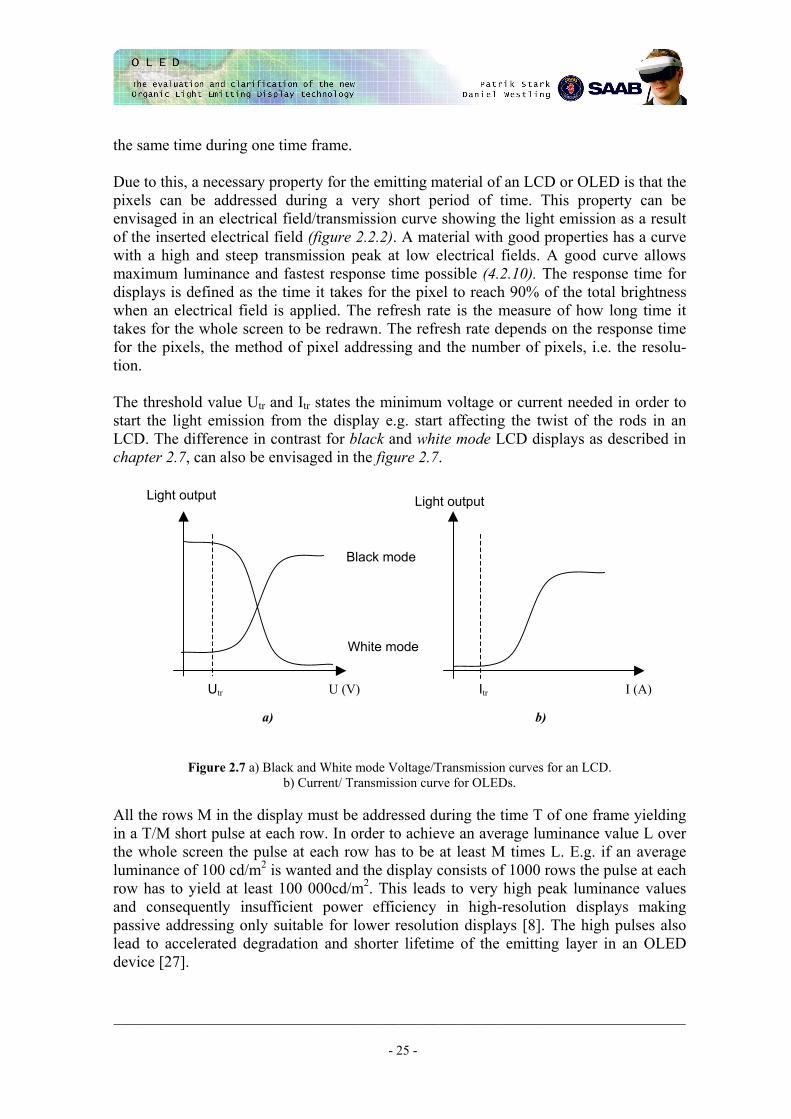
the same time during one time frame. Due to this, a necessary property for the emitting material of an LCD or OLED is that the pixels can be addressed during a very short period of time. This property can be envisaged in an electrical field/transmission curve showing the light emission as a result of the inserted electrical field (figure 2.2.2). A material with good properties has a curve with a high and steep transmission peak at low electrical fields. A good curve allows maximum luminance and fastest response time possible (4.2.10). The response time for displays is defined as the time it takes for the pixel to reach 90% of the total brightness when an electrical field is applied. The refresh rate is the measure of how long time it takes for the whole screen to be redrawn. The refresh rate depends on the response time for the pixels, the method of pixel addressing and the number of pixels, i.e. the resolu-tion. The threshold value Utr and Itr states the minimum voltage or current needed in order to start the light emission from the display e.g. start affecting the twist of the rods in an LCD. The difference in contrast for black and white mode LCD displays as described in chapter 2.7, can also be envisaged in the figure 2.7.
Figure 2.7 a) Black and White mode Voltage/Transmission curves for an LCD. b) Current/ Transmission curve for OLEDs.
b) a)
I (A)
Light output
Utr
White mode
Black mode
U (V)
Light output
Itr
All the rows M in the display must be addressed during the time T of one frame yielding in a T/M short pulse at each row. In order to achieve an average luminance value L over the whole screen the pulse at each row has to be at least M times L. E.g. if an average luminance of 100 cd/m2 is wanted and the display consists of 1000 rows the pulse at each row has to yield at least 100 000cd/m2. This leads to very high peak luminance values and consequently insufficient power efficiency in high-resolution displays making passive addressing only suitable for lower resolution displays [8]. The high pulses also lead to accelerated degradation and shorter lifetime of the emitting layer in an OLED device [27].
______________________________________________________________________________________
- 25 -

If the light intensity curve is not steep enough the pixel cannot be addressed without affecting the neighbouring pixels leading to crosstalk between the pixels. The crosstalk yields a smeared image and with a lower contrast as result. The problem of crosstalk is more evident in displays with a large number of lines since the addressing pulse must be shorter and with a higher magnitude. As a result of the crosstalk, passive addressing is only suitable for smaller low-resolution displays with a small number of lines. One way to enhance the refresh rate and reduce the crosstalk of the passive matrix addressing method is to split the display into two matrixes and address them separately. This method is called dual scan and is commonly used.
2.4.3 Active matrix addressing In an active matrix display the pixels are placed at the intersection between the rows and columns as in the passively display. The difference is that the active addressing scheme uses a transistor at the intersection between the rows and the columns. The transistor works as a switch determining whether the pixel is active or not and at which brightness. When the pixels are active the transistor enables the pixels to continuously emit light driven by a capacitor. This method makes it possible to address and activate other pixel during the time the first pixel is lit, on the contrary to passive matrixes where the addressing have to wait until the first pixel is supposed to stop emit light. In active matrix addressing there are no needs for the high peak luminance levels as in passive displays leading to a better lifetime for the OLED material. Due to that OLEDs are current driven, an extra transistor is needed in order to drive the OLED pixel, yielding in a minimum of two transistors per pixel a switching and drive transistor [28]. In LCD devices only the switching transistor is needed. Except for the extra transistor the active addressing is done in similar ways both in OLEDs and in LCDs. Differences in the transistor characteristics can cause the pixels to emit different intensities of light and consequently leading to an inaccurate uniformity (3.3.5). This can be avoided by splitting the transistors into a number of smaller transistors reducing the affect of an incorrect transistor, with better uniformity as result. There are two main methods for producing the active matrix addressing scheme depending on the size and refresh rate wanted. The most common method is to make a thin film of transistors of silicon and place them upon the glass substrate. This technique is called TFT depending on the Thin Film Transistors used and is common for computer monitors. A drawback with this method is that the addressing scheme cannot be made small enough for high-resolution microdisplays. Instead the entire addressing scheme must be made upon a silicon backplane. The drawback of using silicon backplane is that the backplane is not transparent and this prevents making transmissive LCDs, instead the LCDs must be reflectively lit. This makes microdisplays based on LCD technology larger in size and more complicated to use in optical system e.g. HMDs. The US company Kopin has although constructed transparent silicon backplane for microdisplay by slicing the silicon into a very thin layer after deploying the addressing parts and then place the remaining parts at a glass layer [29]. The silicon transistors are made of a thin layer of amorphous-silicon or crystal-line/polycrystalline-silicon depending on the display size and the resolution needed.
______________________________________________________________________________________
- 26 -

Crystalline or polycrystalline (intermediate crystalline stage [30]) silicon is more difficult and expensive to produce but inhabits better electron mobility making them more suitable for high-resolution displays. Although active matrix addressing requires a more complex patterning, the advantage of improved update time overcomes the disadvantage. The use of active matrix addressing also results in better contrast ratio due to no crosstalk and in an additional number of addressable lines. Another benefit of using active matrix addressing instead of passive is that the power efficiency is also enhanced (figure 2.6) [8].
______________________________________________________________________________________
- 27 -

3 Measurements
3.1 Definitions of fundamental display properties
3.1.1 Photometric properties The estimation of the electromagnetic radiation, e.g. visible light or heat, from an object was of interest during the measurements. Radiometry is the science for the measurement of the total amount of radiation from an object over the wavelength spectra from UV- to IR-light (10-8 m – 10-3 m). The visible part of the spectra ranging from 380 nm to 780 nm is a special section of radiometry known as photometry. Photometry limiting the spectra to the visible part and is the science for measuring a quantity of light based on the response of a human eye. The fundamental vision terms of scotopic and photopic are adapted in low and normal illuminated environments respectively. The terms are connected to the characteristics of human eye, where the cones are sensitive in the photopic vision and colours. The sensitivities for different wavelengths are shown in figure 3.1. The scotopic vision is sensitive to the rods in the human eye [31].
Green
Blue
Red
Frac
tion
of li
ght
abso
rbed
by
a co
ne
Wavelength (nm) 780560530430
0,2
0 380
Figure 3.1 The absorbed light by a cone in the human eye. When measuring a light source, the light source is said to emit a luminous flux. The luminous flux, derived from equation 3.1, is the total amount of emitted light from the source expressed in the unit lumen (lm). The equation is initially derived from a radiation flux equation with difference of a conversion constant and an approximation of the sensitivity function of the human eye.
∫∞
=Φ0
)()( λλλ dVSk
Equation 3.1 The luminous flux over the wavelength spectra.
The )(λS term is the spectral radiant flux with respect to the wavelength λ and )(λV is the spectral luminous efficiency for photopic vision based on 1931 CIE standard and is weighted with respect to the human vision. The constant k is 683 lm/W and is the conversion factor from watt to lumen. The integral spans over the whole spectra where
)(λV allows no contribution to the luminous flux outside the visible spectra.
______________________________________________________________________________________
- 28 -

The term brightness is commonly used as an expression for the intensity of light from an object. It is defined as the human eye perception of light intensity and can therefore be different for person to person. Brightness is a more subjective estimation of the light compared to the physical quantity luminance. The quantity luminance is although constructed in order to be as equal to the human perception of brightness as possible. Luminance The luminous intensity is the luminous flux of the light source in a certain direction with the unit lumen per steradian (lm/sr) or candela (cd). The consideration of the luminous intensity with respect to the direction and area is known as luminance. Luminance is the most commonly used photometric quantity to determine how bright an object appears to the human eye and it is measured in candela per square meter (cd/m2) derived from the SI unit for luminous intensity [32][33]. Contrast The ratio between the luminance of the brightest and the darkest pixel possible to achieve on a display could be referred as the contrast ratio. Contrast can be measured either in photopical or spectral manner. The photopical contrast is mathematically defined as a division, where the numerator contains the maximum value of white from the display and the minimum value of black is found in the denominator. The spectral contrast is of special interest when investigating the variation of contrast at different wavelengths in the visible spectra. For the calculation of spectral contrast, the entire spectral distribution curve for white is divided with the spectral distribution curve for black.
3.1.2 Colorimetric properties Colorimetry is a term that represents the technique of the measurement of colours. To achieve saturated colours and the correct colours on a display; a large size of the colour gamut is necessary. The colour gamut spans over the area of the displayable colours of the display. An insufficient colour gamut could result in incorrect representation of colours and consequently generate false information to the user. To obtain an accurate psychological estimation of colours, the 1931 CIE (Commission Internationale de l'Eclairage) standard was introduced. The standard is based on colour matching functions representing an approximation of the human eye perception. The 1931 standard presents (x, y) co-ordinates plotted in a chromaticity diagram. The chromaticity diagram has a colour space according to figure B.1 and the wavelength in nm along the colour space boundary. To perform comparisons of the colour gamut of different displays, the chromaticity diagram is usually applied. There exist several CIE standards, the 1976 (u’, v’) standard is together with the CIE 1931 standard widely used. Similar to the 1931 standard, the co-ordinates in 1976 are plotted into a diagram, with the difference that the distances in the diagram correspond more to the perception of the difference between the colours. The definition of equations of the CIE standard could be further studied in the appendix B.2.
______________________________________________________________________________________
- 29 -

3.1.3 Gamma distribution The gamma curve corresponds to how the luminance differs over a greyscale from black to white, i.e. how the input current varies over the different intensity levels of the instrument, e.g. a display or camera. The main purpose of the gamma curve is to achieve a linear reproduction from real world to eye. A good gamma curve enables the display to present all greyscale levels and consequently a better contrast. An example of an ideal gamma curve can be seen in figure 3.6. Due to the fact that many cameras possess a non-linear curve, the CRT is adjusted to compensate the non-linearity by having a curve that possesses a reversed non-linearity. The ideal gamma curve is linear, with a low luminance value at a low greyscale level or black. With increasing greyscale levels the luminance should increase linearly and result in a high luminance value at the highest greyscale level. The ideal curve results in a good contrast. If the curve were non-linear, an input electrical field corresponding to a luminance value of 1 cd/m2 would not automatically result in a 2 cd/m2 when the electrical field is doubled. The non-linearity leads to colours that appear darker or brighter than they should. When the display is in type of separated colour pixels each colour has its own gamma curve, as in the case with the eMagin OLED. This is because of the fact that each subpixel can be individually driven and therefore possesses an individual curve of how the input current affects the resulted colour luminance. In the case of where the same pixels is used to show all the different colours the current applied to modulate the colour luminance is the same for each colour and the different RGB colours therefore possess the same curve as a reflective LCD.
______________________________________________________________________________________
- 30 -

3.2 Equipment used for the measurements
3.2.1 Displays eMagin OLED The evaluated OLED display was an active matrix addressed display based on small molecules placed on a silicon backplane. The resolution was 852x600 pixels SVGA+ with an active area of 12,8 x 9,0 mm (0,6”). The extra 52 columns are used for the 16:9 entertainment wide screen format (852x480 pixels) and are the reason for the SVGA plus sign. The display was purchased from the US Company eMagin and it was delivered as a development kit including all necessary interfaces for PC-VGA connection. The interface allowed adjustments of different parameters of the display e.g. offset and gain settings to control the gamma curve of the display (3.5.1). Each pixel in the display consists of three subpixels with a colour filter for each primary colour mounted in a vertical stripe enabling a full-colour display. One drawback of this approach is that the filters consume approximately 88% of the light produced by the OLED and therefore leads to a decrease in lifetime (3.5.9)[22]. Due to the non-emissive borders between the primary coloured subpixels is the fill factor as low as 66%.
Figure 3.2 The eMagin OLED SVGA+.
CRL Opto LCOS display The LCD used to compare with the OLED, was a full-colour 1280x1024 SXGA display with an active area of 17,4 x 14,0 mm (0,88”) based on a silicon backplane. The display was obtained from CRL Opto (former Micropix) [34]. The display is build of a FELC material, which results in a better response time in comparison to the more traditional twisted nematic construction (2.2.2). Time division multiplexing of the different pixels yields the different greyscale levels. Full-colour is achieved through sequential RGB order of the emitted light from the LED backlight (2.2.2).
______________________________________________________________________________________
- 31 -

Figure 3.3 The CRL Opto LCOS evaluation kit. The evaluation kit was purchased with the purpose to find a new display that can substitute the one presently used in the Addvisor 100. The display was considered to become the display in the ARTHUR HMD. It could also be replaced in the future by an OLED if the new organic technique is found appropriate for HMD purpose. Display specifications Specifications of the displays are shown in table 3.1, e.g. contrast and chromaticity were not included due to their difference between measured values and the stated in the specifications.
Display Emagin OLED CRL Opto /MicroPix
Type Active matrix, small molecules OLED. Active matrix, Ferroelectric Crystal, Reflective LCD.
Resolution 852x600 SVGA+ 1280x1024 SXGA
Pixel Pitch and Fill Factor 15 µm, 66% 13,62 µm , 90%
Colour representation Three subpixels in a vertical strip with RGB colour filters. Field sequential R G B
Active Area 12,8 x 9,0 mm 17,4 x 14,0 mm
Operating/ Storage Temperature -40 to 85 °C / -51 to 90°C 10 to 60 °C / -10 to 75°C
Frame Rate Up to 85 Hz Up to 120 Hz
Driving voltage (including interfaces) 5 V 5 V
Colour Depth 256 per RGB colour (24 bit) 256 per RGB colour (24 bit)
Table 3.1. Specifications of the two displays [35][36].
3.2.2 Photoresearch PR-714 SpectraScan The radiation from the display could be measured with a spectroradiometer. This instrument handles radiometry and photometry, which could be studied in chapter 3.1. The user is able to view the measured field through the view eyepiece and perform an appropriate adjustment of the instrument on the display. The measurement is done in two sequences. The first step measures the radiation of light from the display. The second implies a dark measurement inside the instrument to eliminate errors and perform a
______________________________________________________________________________________
- 32 -

calibration. The intensity of light from the display decides the measuring time and the size of aperture. The spectroradiometer has a MS-55 objective lens with focusing range 44 mm to infinity. The light passes through the lens and through an optional aperture. The options are a round aperture 1/8° or a rectangular {1 1/2° x 1/2° } aperature and are defined as +/- angles orthogonal from the origin of the spectroradiometer lens. The 1/8 ° aperture works in the range of 110-370 000 cd/m2 compared to the {11/2° x 1/2°} that works for 2,1−7100 cd/m2 [37]. The selection of aperture is dependent on the position, size and the intensity of light, where a high intensity prefers the narrower 1/8° aperture. At a shortest working distance of 44 mm using the MS-55 lens and the narrower aperture, the instrument provides a coverage of approximately 6 pixels vertically on the eMagin OLED. The wider and rectangular aperture is preferred when measuring a low luminance. The white light includes a spectrum of colours and to analyse the consistent the light need to be dispersed. This is achieved through a diffraction grating that gives divergent rays of light. A focusing lens gives parallel rays, which further are analysed in a silicon diode detector or 256 elements Charged Coupled Device (CCD) -array. The array detects the contribution from the wavelengths in an accuracy of 4 nm, assuming a sensitivity range of the range 380 up to 1070 nm. The measurement data is presented with the SpectraView software that is connected to the device and provides a presentation of the measured values, e.g. luminance, colour temperature, saturation and dominating wavelength. SpectraView calculates as well the CIE co-ordinates and plot CIE-diagrams alternatively a spectral-distribution. Processing of data is further possible to be analysed using the SpectraWin software on a regular PC.
3.2.3 Photoresearch Spectra-Pritchard Photometer PR-1980A The photometer PR-1980 performs a measurement in a narrower wavelength spectrum than the spectroradiometer. The photometer measures the light from the display by combining different filters of photopic and colorimetric characteristics (3.1). The light from the display passes through a 7 inch OL-7 objective lens with a focusing range of 1,22 m to infinity. The size of the measuring field is defined with an aperture, which has five options, 2’, 6’, 20’, 1° and 3°. One minute is defined as 1/60 of a degree. To have a proper measurement, the desired ranges were found to 20’ and 1°. These options had a range of luminance for 10-2 to 106 cd/m2 and 10-3 to 105 cd/m2, respectively. The light is transported through the aperture and reaches two chosen filters that process the light. The first filter provides attenuation of the density of the incoming radiation. The second accomplishes an option of colorimetric- or photopic processing. In this case, the first filter was set to be open, because no attenuation was necessary. The second filter was set in photopic-mode, because of a need to match the spectral response curve of human eye.
______________________________________________________________________________________
- 33 -
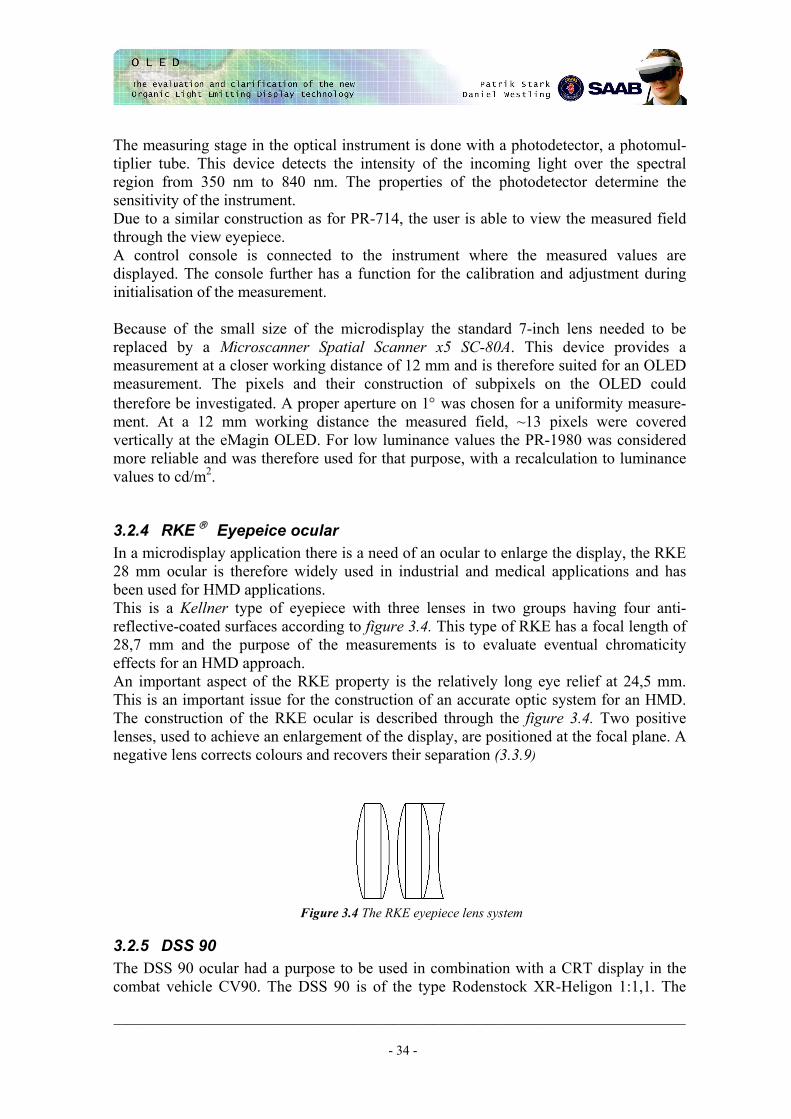
The measuring stage in the optical instrument is done with a photodetector, a photomul-tiplier tube. This device detects the intensity of the incoming light over the spectral region from 350 nm to 840 nm. The properties of the photodetector determine the sensitivity of the instrument. Due to a similar construction as for PR-714, the user is able to view the measured field through the view eyepiece. A control console is connected to the instrument where the measured values are displayed. The console further has a function for the calibration and adjustment during initialisation of the measurement. Because of the small size of the microdisplay the standard 7-inch lens needed to be replaced by a Microscanner Spatial Scanner x5 SC-80A. This device provides a measurement at a closer working distance of 12 mm and is therefore suited for an OLED measurement. The pixels and their construction of subpixels on the OLED could therefore be investigated. A proper aperture on 1° was chosen for a uniformity measure-ment. At a 12 mm working distance the measured field, ~13 pixels were covered vertically at the eMagin OLED. For low luminance values the PR-1980 was considered more reliable and was therefore used for that purpose, with a recalculation to luminance values to cd/m2.
3.2.4 RKE Eyepeice ocular In a microdisplay application there is a need of an ocular to enlarge the display, the RKE 28 mm ocular is therefore widely used in industrial and medical applications and has been used for HMD applications. This is a Kellner type of eyepiece with three lenses in two groups having four anti-reflective-coated surfaces according to figure 3.4. This type of RKE has a focal length of 28,7 mm and the purpose of the measurements is to evaluate eventual chromaticity effects for an HMD approach. An important aspect of the RKE property is the relatively long eye relief at 24,5 mm. This is an important issue for the construction of an accurate optic system for an HMD. The construction of the RKE ocular is described through the figure 3.4. Two positive lenses, used to achieve an enlargement of the display, are positioned at the focal plane. A negative lens corrects colours and recovers their separation (3.3.9)
Figure 3.4 The RKE eyepiece lens system
3.2.5 DSS 90 The DSS 90 ocular had a purpose to be used in combination with a CRT display in the combat vehicle CV90. The DSS 90 is of the type Rodenstock XR-Heligon 1:1,1. The
______________________________________________________________________________________
- 34 -

advantages over the RKE are that the DSS 90 possesses a better virtual view due to the fact that the virtual image plan does not bend as much as in the RKE. Another advantage is that the better and larger optic provides a “static positioned” virtual image independent of movement of the viewer. The smaller optics in RKE leads to a closer viewing position, which could result in collisions between the head and the optic in a moving environment.
RKE DSS90 Effective focal length: 28.7 mm 75 mm Field stop diameter 23.3 mm 68 mm Apparent field: 45° 15°
Table 3.2 A comparison between the data of the oculars.
The relative distance between the object and the oculars are of special interest. The object is not always placed in the focal point of the oculars depending on function wanted. A placement of the display between the ocular and the focal point results in a virtual image plane closer than infinity, which is an important issue in HMD applications. A diopter is an instrument used to measure the distance to the virtual image.
______________________________________________________________________________________
- 35 -

3.3 Measurements All measurements were done directly on the display and performed with the instrument positioned perpendicular to the centre of the display, if not stated other in the specific measurement. Measurements with combinations of the eMagin OLED and oculars were also done to estimate their functionality. The eMagin OLED and the CRL LCOS will be further mentioned as OLED and LCOS respectively.
3.3.1 Calibration of the OLED A calibration of the display was possible for the eMagin OLED depending on the interface, which allowed modifications of the gain and offset values for each primary colour. These parameters control the current input in the device, where the gain value affects the display and its presentation of higher greyscale levels. The offset values affect in a similar way the lower greyscale levels. Adjustment of the white point The additive colour representation in displays may contribute to a not correct white “achromatic colour” for the viewer of the display. The CIE 1931 chromaticity diagram has a white point E defined as CIE (x,y) = (0.33,0.33). The correspondence with a displayed white image and E was therefore investigated. To perceive an accurate white, the contribution from each primary colour needed to be adjusted correctly for a minimal discrepancy from E with a remaining maximal luminance. A measurement of the white point of the OLED, using the eMagin default settings, resulted in a value positioned 11 % from E, where 0 % is the position of point E in the chromaticity diagram (A.2.5). The three offset and gain values were adjusted and this resulted in CIE 1931 co-ordinates (0.29, 0.35) of less than 7 % from E. Gamma curve To accomplish a good visual property of the display according to chapter 3.3.7, the gamma curves for each colour needed to be investigated. If a non-linear curve is discovered, an adjustment of the gain and offset parameters through the eMagin-interface was necessary. 17 images of greyscale-levels were fabricated and the measurement of luminance for each of them resulted in a gamma distribution curve. The factory default settings resulted in a gamma curve with properties of non-linearity depending on the low luminance values for the lower regions of the greyscale levels according to figure 3.5.
______________________________________________________________________________________
- 36 -

0
10
20
30
40
50
60
70
80
90
0 15 31 47 63 79 95 111 127 143 159 175 191 207 223 239 255
Level
Lum
inan
ce c
d/m
2
white F
red F
green F
blue F
Gamma distribution
Figure 3.5 Gamma distribution curve for the eMagin default settings after the adjustment of white point.
The modification of the lower region and the offset values were needed because of the low luminance levels in the beginning of the curve as seen in figure 3.5. An adjustment would also affect the white point of the display and the discrepancy value from E and therefore needed to be considered. The result of the offset adjustment is shown in figure 3.6. The new gamma curve has a peak luminance at nearly 111 cd/m2, which results in a photopical contrast of 52:1. The discrepancy from E for white had increased to 12,6 %, but could be considered in the range of acceptance. The saturation of specific colour is presented through the excitation purity value in the figure 3.6. 100% is full saturation and exhibit a co-ordinate along the boundary of the colour space in the CIE chromaticity diagram.
______________________________________________________________________________________
- 37 -

Gammma distribution
0
20
40
60
80
100
120
0 15 31 47 63 79 95 111 127 143 159 175 191 207 223 239 255
Level
Lum
inan
ce c
d/m
2
whiteredgreenblue
Offset: 0x00 0x0F 0x22 Gain: 0xBF 0xAF 0x97 Contrast: 52:1White (FFFFFF) Luminance: 110,8 cd/m2 CIE1931 x: 0,29 y: 0,35 Ex. Purity: 12,6 % from E (x: 0,33 y:0,33)Red (FF0000) Luminance: 34,7 cd/m2 CIE1931 x: 0,56 y: 0,34 Ex. Purity: 71, 2 % from E Peak: 606 nmGreen (00FF00) Luminance: 94,4 cd/m2 CIE1931 x: 0,29 y: 0,56 Ex. Purity: 55,1 % from E Peak: 543 nmBlue (0000FF) Luminance: 24,4 cd/m2 CIE1931 x: 0,15 y: 0,14 Ex. Purity: 81,9 % from E Peak: 476 nm
Figure 3.6 Gamma distribution curve final adjustment.
The colours were observed and subjective considerations of the primary colours, black and white were done. Especially properties of black and white were critical, due to the possible fact of unwanted dominating primary colours. Proper colours were represented through the adjustments and the initial state of measurement was accepted.
3.3.2 Maximum luminance Background The importance of achieving a high luminance mostly depends on the application. For avionic applications a high brightness is needed in order to make the display readable under bright sunlight conditions, e.g. a display brightness of approximately 50-800 cd/m2 is considered to be required [6]. For the use in indoor application the brightness level is not that critical due to the environment brightness. In an HMD it is important that the display emits enough brightness to compensate the different lenses and filters, which reduces the brightness along the transport from the display to the eye (chapter 2.2). The OLED is current driven and the variance of maximum luminance could differ when displaying different sizes of white areas, i.e. the current density varies with the amount of addressed pixels. The emitted light from some types of displays, e.g. LCD, inhabits a significant polarisa-tion dependency. When placing a polarisation filter in front of the display, the intensity of the emitted light is reduced. The OLED devices are considered to produce emission of non-polarised light and a measurement could verify the non-dependency.
______________________________________________________________________________________
- 38 -
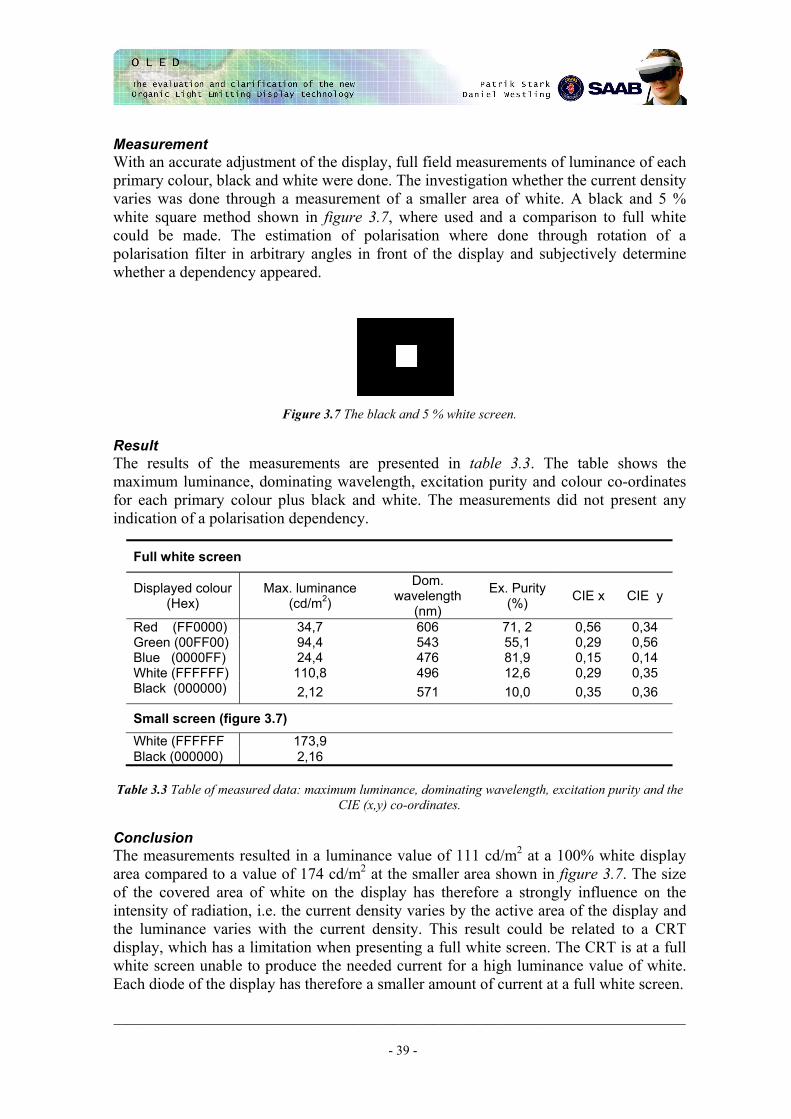
Measurement With an accurate adjustment of the display, full field measurements of luminance of each primary colour, black and white were done. The investigation whether the current density varies was done through a measurement of a smaller area of white. A black and 5 % white square method shown in figure 3.7, where used and a comparison to full white could be made. The estimation of polarisation where done through rotation of a polarisation filter in arbitrary angles in front of the display and subjectively determine whether a dependency appeared.
Figure 3.7 The black and 5 % white screen.
Result The results of the measurements are presented in table 3.3. The table shows the maximum luminance, dominating wavelength, excitation purity and colour co-ordinates for each primary colour plus black and white. The measurements did not present any indication of a polarisation dependency.
Full white screen
Displayed colour (Hex)
Max. luminance (cd/m2)
Dom. wavelength
(nm)
Ex. Purity (%) CIE x CIE y
Red (FF0000) 34,7 606 71, 2 0,56 Green (00FF00) 94,4 543 55,1 0,29 Blue (0000FF) 24,4 476 81,9 0,15 White (FFFFFF) 110,8 496 12,6 0,29
0,34 0,56 0,14 0,35
Black (000000) 2,12 571 10,0 0,35 0,36
Small screen (figure 3.7) White (FFFFFF 173,9 Black (000000) 2,16
Table 3.3 Table of measured data: maximum luminance, dominating wavelength, excitation purity and the
CIE (x,y) co-ordinates. Conclusion The measurements resulted in a luminance value of 111 cd/m2 at a 100% white display area compared to a value of 174 cd/m2 at the smaller area shown in figure 3.7. The size of the covered area of white on the display has therefore a strongly influence on the intensity of radiation, i.e. the current density varies by the active area of the display and the luminance varies with the current density. This result could be related to a CRT display, which has a limitation when presenting a full white screen. The CRT is at a full white screen unable to produce the needed current for a high luminance value of white. Each diode of the display has therefore a smaller amount of current at a full white screen.
______________________________________________________________________________________
- 39 -

Due to the construction of the LCOS did the measurement of luminance present an inaccurate result depending on the nonuniformity according to chapter 3.3.5. A comparison between the OLED and LCOS in maximum luminance would therefore not be representative. The OLED did not show any polarisation dependency. This result points out the need for pre-polarisers when integrating the OLED into a system based on polarising filters e.g. an HMD. Source of errors and improvements of the measurement The measurements were done in a dark room and the environmental illumination could be considered minimal. The inaccuracy of 20 % in the instrument and for an accurate measurement it needs a stabilisation through a warm up period. The presence of stray light and its influence in the ocular of the instrument could also affects the measurement.
3.3.3 Contrast Background The definition of contrast can be studied in chapter 3.1.3. High contrast and brightness is of importance to make a display viewable even at very high ambient illuminated environments. In order to receive a good contrast, the reflections from the surrounding ambient light on the display must be eliminated or reduced. The elimination is done by using various filters and anti-reflective coatings but with expense of reduced efficiency, luminance and higher cost. Measurement A full field luminance of a white and a black image was measured to achieve the photopical and spectral contrast (3.1.3). The spectral contrast enables a verification of dissimilarities in contrast according to different wavelengths in spectral distribution. Result The photopic contrast with an accurate adjustment of the display resulted a contrast of 52:1 (table 3.3). When measuring a smaller white area on the display (figure 3.7) a contrast ratio of 81:1 was accomplished (table 3.3). The result of the calculation of the spectral contrast can be envisaged in figure C.5 and shows a nearly constant contrast in the visible spectrum. Conclusion A measurement of black in the figure 3.7 image could have been affected by the white radiation and produced a higher value of luminance for black according to table 3.3. The contrast ratio is better for the smaller image than full field measurement, because of the increased value of white luminance. The values for black are shown in table 3.3 and could be considered as similar. Because of the unsatisfactory uniformity of the LCOS (3.3.5) the contrast measurements were not done. Due to the phenomena of straylight and difference of white maximum luminance for different sizes of area, the values of contrast are dependent on the measuring methodol-ogy. Comparisons to technical specification and values must therefore be considered
______________________________________________________________________________________
- 40 -

carefully. Apart from full field measurement, black and white square methods, e.g. 4- and 16 square chessboards are widely used.
3.3.4 Chromaticity Background For full-colour displays the three primary colours must obtain good colour co-ordinates in the CIE diagram in order to span a large colour gamut as possible (3.1.4). The colours should also be stable over time and luminance levels. Measurement The chromaticity co-ordinates of the OLED and the LCOS were measured using a full-field maximum luminance of the three primary colours and white. Result The measurement for white and the three primary colours resulted in CIE-co-ordinates according to table 3.4.
OLED CIE x CIE y White 0,29 0,35 Red 0,56 0,34 Green 0,29 0,56 Blue 0,15 0,14 LCOS CIE x CIE y White 0,27 0,28 Red 0,65 0,31 Green 0,18 0,66 Blue 0,15 0,07
Table 3.4 Chromaticity co-ordinates for of a full-screen measurement. Further results of the OLED
chromaticity measurement can be studied in table 3.3. Conclusion The properties of the displayed colours are dependent on the size of the colour gamut. The measured data showed a better colour gamut for the LCOS-device compared to the OLED device. The difference is envisaged in the CIE-chromaticity diagram (figure 3.8). The result of the difference in size for the colour gamuts could be referred to the use of colour filters on the OLED (2.3.3). The spectral distribution curves in figure 3.7 show the distributions of the primary colours for a proper white achromatic colour. Their characteristics could not be considered as peaked at certain wavelengths.
______________________________________________________________________________________
- 41 -

Figure 3.7 The spectral distributions of the primary colours for full-screen white OLED.
CRL LCOS
eMagin OLED
Figure 3.8 A comparison between OLED and LCOS of the achieved CIE 1931 chromaticity co-ordinates.
3.3.5 Luminance uniformity Background. The uniformity is the value of how the maximum luminance differs over the display surface. The uniformity can differ in a large magnitude depending on used type of display technology. LCDs are known to suffer from poor uniformity due to the difficulty to produce a uniform backlight or reflective-light. The comparison between the OLED and the LCD technology was therefore of interest. 100 % uniformity states a perfect display where no difference in luminance occurs over the surface. There is also possible to state the uniformity in a nonuniformity value where the value instead states the difference of the luminance across the screen, example 10 % nonuniformity corresponds to a 90 % uniformity value. Generally is uniformity the term used but the nonuniformity
______________________________________________________________________________________
- 42 -

is the value given in many display specifications. Similar measurements can be done for colour and contrast uniformity. Due to that the eyes possess a good sensitivity for differences in luminance a rule of thumb is that the nonuniformity should not be larger than 2-3 % for still images and 5-8 % for video applications [13]. It is also important that the uniformity does not change too much in magnitude at a small area because of that the human eye is sensitive to large differences in luminance. This is measured on larger displays were the uniformity is not allowed to change more than e.g. 5% at a circular area with a diameter of 1 inch.
Figure 3.9 Measurement positions according to the VESA recommendation.
Measurement Nine positions were chosen according to the VESA recommendation [32] to confirm the nonuniformity and the location of the positions are shown in figure 3.9. For each point measured luminance value was obtained using the PR 714 spectroradiometer. There are several methods to calculate and measure the uniformity. The formulas and measurement methods e.g. number of measuring location and their position can vary. It is therefore important to always state the applied method and always make sure to use the same method when comparing different values. The luminance values were expressed as percentage difference according to a nonuni-formity formula (equation 3.2).
Positiveaverage
average
LLL
ityNonuniform−
= max%100
Negativeaverage
average
LLL
ityNonuniform−
= min%100
Equation 3.2 Nonuniformity formula. Lmax is the maximum luminance value of the 9 measurements. Lmin is
the minimal value and Laverage is the average. This formula was chosen so that the result could be compared to equal measurements on LCDs made earlier at SAAB Avionics. Result The luminance values were measured on the OLED and the resulting uniformity values can be envisaged in table 3.5.
______________________________________________________________________________________
- 43 -

Point nr: Luminance (cd/m2 )1 110.3 2 108.3 3 102.1 4 109.4 5 107.9 6 103.7 7 111.4 8 107.3 9 99.9
Lmax 111.4 Lmin 99.9
Laverage 106.7 Positive Nonuniformity 4.40% Negative Nonuniformity -6.37%
Table 3.5 Measured luminance and calculated uniformity values for the eMagin OLED microdisplay. The measurements on the OLED resulted in a nonuniformity of 4 % and –6 %. For the LCOS microdisplay the measurements showed a very poor nonuniformity as a result of the reflective light, which did not illuminate the whole surface with a uniform light contribution (table 3.6).
Point nr: Luminance (cd/m2 )
1 126.2 2 115.3 3 84.5 4 142 5 227.80 6 79.00 7 24.5 8 30.90 9 29.00
Lmax 95.47 Lmin 227.80
Laverage 24.50 Positive Nonuniformity 138.62% Negative Nonuniformity -74.34%
Table 3.6 Measured luminance and calculated nonuniformity values for the CRL Opto LCOS micro-
display. Conclusion Due to that the external light source for the LCOS LCD was either insufficient in size or incorrectly positioned relative to the LCD-plate, a not appropriate uniformity was
______________________________________________________________________________________
- 44 -

obtained. Because of that the measurements on the LCOS did not represent the LCDs in general. Instead measurement results from previous LCD tests at SAAB Avionics could be used to compare with the OLED results. Measurements of uniformity at the transmis-sive LCD used in the JAS Cockpit, resulted in a ± 13 % [38]. This display is backlit and can only be used as a hint of in which magnitude the values range for reflective microdisplays of LCD type. Typical nonuniformity values for AMLCDs, including the nonuniformity of the backlight are said to be about 30 %. Compared to the numbers stated above, the nonuniformity of 4 % and -6 % was very good results and prove that the eMagin OLED inhabits a good uniformity compared to LCDs. The results were also below the human sensibility guidance value of 5-8 % for video application as stated above. The reason for the better uniformity is due to the absence of backlight or reflective light source, which is hard to construct with a perfect uniform illuminated area. Instead the uniformity for OLEDs is only dependent on the difference in the pixel elements. As stated in chapter 2.3.5, differential lifetime can cause lack of uniformity for OLEDs but this is not a problem for LCDs where the whole area is illuminated by the light source.
3.3.6 Power consumption Background The display device needs a power supply for the IC and for the display, independently if considering an OLED or LCD. According to chapter 2.3.4 a low power effort is preferred and related to the specific technology approached. The difference in construc-tion of the LCOS and OLED technology has a possible effect to the power consumption and needs to be investigated. Measurement The technical specifications were studied instead of a measurement of the displays. The ICs for OLED and the LCOS were approximated to consume a similar amount of power. The fact that the LCOS has a complex construction and a higher luminance compared to OLED was taken into account. The power supply to the LED was assumed linear to the luminance. An assumption of similar displayed images and frame rates for the specifica-tion was done. Result The power consumption of the OLED and LCOS is presented in the table 3.7.
______________________________________________________________________________________
- 45 -

LCOS Power dissipation (mW) Comment
Display 600 1280*1024 pixels
LED backlight 1000 Luminance of 500 cd/m2
LED backlight 200 Luminance of 100 cd/m2 Display+LED 800 1280*1024 pixels, luminance of 100 cd/m2
OLED
Display 150 852*600 pixels, luminance of 100 cd/m2
Table 3.7 The power supply for the OLED and LCOS according to eMagin and CRL opto [34][39]. Conclusion According to table 3.7 the typical power consumption is of 150 mW for the OLED compared to the LCOS with a power consumption of 800 mW. When the different resolutions of the displays are taken into consideration, it results in approximately 50 % lower power effort per pixel for the OLED compared to the LCOS. The property of power consumption could be further investigated in chapter 2.3.4.
3.3.7 Viewing angle Background The viewing angle is an important property for displays used in applications where many people are supposed to watch the same display. A good viewing angle allows people at a not perpendicular angle to the display, to receive a proper image with correct colours and brightness levels. Two numbers describing the total viewing angle in both horizontal and vertical direction often state the viewing angle. According to the VESA standard, a horizontal viewing angle of 140° states that the maximum luminance has decreased to half the initial luminance value perpendicular to the display at a lateral angle of 70° [32]. The maximum viewing angle can also be stated as the value where contrast has decreased to the initial contrast measured perpendicular to the display. Colour change at different angles is a common problem for LCDs. This could also be considered as a measure for the viewing angle. A certain discrepancy from a colour co-ordinate could be considered as the maximum viewing angle. The emitted light from the OLED is of a quasi-Lambertian type, emitting light in all directions and OLEDs therefore have a very wide viewing angle compared to LCD. LCDs only emit light in one direction, which leads to a narrower viewing angle. The narrow and more direct light emission angle is the result of the modulating structure of LCDs, which modulates the light from the external light source through polarising filters. The narrow viewing angle for LCDs can be noticed on older Laptop computers.
______________________________________________________________________________________
- 46 -

______________________________________________________________________________________
- 47 -
Measurement Measurement of the maximum luminance as a function of viewing angle was done and also an evaluation on whether the colour co-ordinates depend on the angle. Both horizontal and vertical measurements were performed to verify possible symmetrical properties. The measurements were done by placing the PR-714 perpendicular to the display and turn the display in a number of angles in both directions using a protractor. The angles chosen ranged from –80° to 80° with a step length of 10°. A positive sign states a counter-clockwise direction and vice versa, when observing the display from above. The small 1/8° aperture was used in order to cover only the smallest possible part of the display when turning it in a wide angle. For the vertical measurement the display was tilted 90° and the measurements were done in a similar manner. It was important that the display remained in focus and that the measurements were done at the same position on the display surface and at the equal distance when turning the display, followed by the focus. The measurements were completed for both white luminance and for the three primary colour channels. The colour co-ordinates for each colour were also measured. This was done in order to evaluate possible differences due to interference [15]. Due to the position of the beamsplitter and the backlight a measurement in such wide angles as for the OLED was impossible to achieve for the LCOS. Instead were results from a similar measurement on a transmissive LCD used to compare the viewing angle results with the OLED.
Result The results of the measurements on the eMagin OLED are shown in figure 3.10, figure 3.11 and figure C.2. Figure 3.10 shows the magnitude of the normalised luminance value as a function of the vertical viewing angle and figure 3.11 as a function of the horizontal viewing angle. The luminance value is normalised with respect to the perpendicular maximum luminance value. The measurements in the vertical direction did not show any signs of interference phenomena depending on the arrangement of the subpixels. As a result the vertical measurements were only performed for maximum white luminance. A 50% threshold of the luminance value would result in a viewing angle of 120° horizontal and 150° degrees vertically for the OLED according to figure 3.10 and 3.11.

Viewing Angle Vertical
0
0.2
0.4
0.6
0.8
1
1.2
-80 -70 -60 -50 -40 -30 -20 -10 0 10 20 30 40 50 60 70 80
Angle in degrees
Dev
iatio
n
Figure 3.10 Vertical viewing angle for maximum luminance white for the OLED.
Horizontal Viewing Angle
0
0.25
0.5
0.75
1
1.25
-80 -60 -40 -20 0 20 40 60 80
Angle in degrees
Dev
iatio
n WhiteRedGreenBlue
Figure 3.11 Horizontal Viewing Angle for maximum luminance white and the three primary colours measured at the OLED.
______________________________________________________________________________________
- 48 -

As a comparison the luminance values of the white and the primary colours where plotted in a graph (figure C.2). To illustrate how the different colour co-ordinates moved as a result of the viewing angle the CIE 76 diagram was used (3.1.3). The colour co-ordinates are shown in figure 3.12.
Figure 3.12 The position of the colour co-ordinates for different viewing angles in the CIE 76 diagram. To easier illustrate the effect of the movement of the colour co-ordinates, the colour gamut for the perpendicular 0° angle and the + 80° and –80° angles, can be envisaged in a CIE 1931 diagram (figure C.4).
______________________________________________________________________________________
- 49 -

OLED vs. LCD
0
0.25
0.5
0.75
1
1.25
-80 -60 -40 -20 0 20 40 60 80
Angle in degrees
Dev
iatio
n
LCDOLED
Figure 3.13 The eMagin OLED compared to a general transmissive LCD [40].
Conclusion In comparison to LCDs, the OLED showed a superior viewing angle. The poor angle in LCDs is a result of the one-directional nature of the emitted light compared to OLED where light distribution is of a Lambertian type emitting light in all angles. Also when comparing these two displays it is important to keep in mind that the OLED microdisplay is constructed for near-eye application where the viewing angle is not so evident as for multi-user applications. When comparing the two display technologies for the intent to use in a multi-user application it is therefore important to perform the measurement again with display constructed for this purpose. Still it is interesting to see that the OLED microdisplays inhabit a better viewing angle than the general transmissive LCDs, which is shown in figure 3.13. The normalised difference in luminance for the different colours and white can be envisaged in figure 3.11. A larger value at an adjacent angle than the perpendicular was noticed at 20° for the blue colour and a similar property for the green appeared on the 20° deviation. The peaks can also be noticed on the white curve depending on the influence of the primary colours. The green curve has a larger influence on the white curve depending on the higher luminance value (figure C.2). The different peaks on the colour curves are believed to be the result of interference between the different side-by-side positioned red, green and blue pixels [15]. Source of errors and improvements of the measurement Due to the method used to achieve the measuring result, an inaccuracy in the order of a few degrees is easily obtained. A method where the manually use of a protractor could be avoided would be preferable i.e. a system using a mechanical computer manoeuvrable rig. Also for displays with an inappropriate uniformity as the CRL LCD, the importance
______________________________________________________________________________________
- 50 -

of measuring the same spot is evident. This is, in the case of measuring the OLED, of minor importance as a consequence of the good uniformity it possesses. Another important source of error is whether the measured point is in the right distance from the measurement equipment. This is controlled by always be sure that the point is in focus, leading to the same distance. This is although a subjective judgement which can lead to an inaccurate distance to the display. Further error sources that occur when measuring luminance is stated in chapter 3.3.2.
3.3.8 Lifetime Background The OLED technology lack of insufficient lifetime and this is one of the reasons to investigate the degradation of the device and the decrease of maximum displayable luminance (2.3.5). The lifetime of a monochrome eMagin OLED device has been considered to approximately 5000 h. Due to the fact that it is easier to achieve a longer lifetime for a monochrome display; the lifetime of the full-colour display would intuitively be shorter (2.3.5). Measurement The measurement of lifetime was started after that the display had been operated for approximately 50 h during various measurements. The initial 50 h of usage are not taken into account in the lifetime measurements. The test screen was divided into two parts; one white and one black according to figure 3.14. Figure 3.14 The test screen for lifetime measurement. The marks indicate the position of the spectroradi-
ometer. Through the use of a divided screen, the lower part of the display was full white and its diodes were activated, while the upper area was black and with hopefully nearly unused diodes. The consequence of full white in the half part of the display, a higher current is applied at the diodes and therefore an increase of the initial luminance level (3.3.2). In the final step of the lifetime measurement the degradation of lower and upper part of the display should be compared. The test screen was then rotated 180° to achieve the correct proportion of the current density when measuring the displays. Result The results are shown in table 3.8 and table 3.9. Table 3.8 shows the luminance value for white in relation to the time passed. The colour co-ordinates for the white colour are also stated, although no difference in co-ordinates as a result of the degradation could be found.
______________________________________________________________________________________
- 51 -

Time (h)
Luminance white (cd/m2) (% of initial value) CIE x CIE y
0 134,3 (100%) 0,29 0,35 168 67,4 (50%) 0,27 0,34 336 37,8 (28%) 0,27 0,34 480 26,8 (20%) 0,28 0,34 576 20,4 (15%) 0,27 0,34
Table 3.8 The results of the maximum luminance measurements on the white half of the display.
Table 3.9 shows the maximum luminance values for black and white for both the black and white area as shown in figure 3.14 after a elapsed time of 576 h. As seen in the table does also the black area contribute to the degradation in spite of the fact that the pixels have been subjected to a very low current density. The degradation of the black area is though approximately 5 times slower than the degradation of the white area.
Luminance white (cd/m2) (% of initial value)
Luminance black (cd/m2) (% of initial value)
Contrast
White area 20,4 (15%) 0,3 (16%) 68:1 Black area 107,5 (80%) 1,4 (76%) 77:1
Table 3.9 The results of the final measurement of the white and black area for an elapsed time of
576h.
Lifetime
134.3
67.4
37.8
26.8
0
40
80
120
0 200 400 600
Time (h)
Lum
inan
ce (c
d/m
2)
140
Figure 3.15 The curve of white luminance with respect to time, measured at the white area.
______________________________________________________________________________________
- 52 -

Conclusion According to figure 3.15, the degradation of the device resulted in an exponential decrease of the luminance. According to the 50 % definition of lifetime (2.3.5), 168 h of operation presented a value that corresponded to the definition. As shown in table 3.8, the final maximum luminance value was 15% of the initial value earlier than a month of continuous operation. The upper part had although the low greyscale level, according to table 3.8, a decrease of the luminance of the diodes. The fact of degradation of the both areas makes a conclusion of a very sensitive device in a lifetime perspective. According to the half-field measurement the current density were increased with a result of increased degradation. A full field measurement would have resulted in a better lifetime due to a lower light intensity. The application has therefore a strong influence of the degradation. This fact could be considered critically for military applications since e.g. secret scales, maps and numbers have a possibility to be permanently visible through the degraded pixels. Even if the full-colour display had reached the stated lifetime for the monochrome eMagin display, the lifetime is still insufficient for most applications. The method of lifetime estimation could have been carried out by displaying a dynamic content, which would result in an extended lifetime.
3.3.9 Measurement with oculars Background Microdisplays are commonly used with oculars that often imply a decrease of the intensity and negative effects on the system. The intended use of the OLED in a system including the RKE or the DSS 90 makes an evaluation of the ocular relevant. Some lenses suffer from a phenomenon called chromatic aberration and it was therefore important to investigate whether this was evident in the oculars. Chromatic aberration appears when the emitted light from the display travels through the ocular and the light is focused at different distances from the lens seen in figure 3.16. The different focal lengths are due to that the light consists of components of the different wavelengths and that the lens has different focal points depending on wavelength as envisaged in. The negative visual artefacts could be avoided by adding an extra lens that possesses a different refraction index for different colours and wavelengths. The efficiency is the measure of the emitted light from the display that reaches the exit of the ocular. The efficiency is dependent on the quantity of the emitted light that enters the ocular and the amount that is converted to straylight in the ocular system. Using an anti-reflective coating will increase the transmission through the ocular and reduce the amount of straylight.
Figure 3.16 Diverge of white light caused by chromatic aberration.
BlueGreen
RedWhite light
______________________________________________________________________________________
- 53 -

Measurement To determine whether the maximum luminance differs along the gamma curve for different greyscale levels, a measurement of the luminance for each greyscale level for the two oculars was of importance. The values of contrast and the efficiency could be obtained by evaluating the luminance values measured. The appearance of straylight in the ocular could affect the luminance and contrast by reducing the white luminance and affecting the black luminance negatively. It was therefore an interesting approach to measure the contrast for the two oculars compared to the initial contrast. The display was placed close to the focal point of the ocular to achieve a virtual image at a distance of about 2 m. The placement of the virtual image plane was achieved using the diopter instrument. By observing the display through the attached oculars, a subjective estima-tion concerning chromaticity abbreviation was done. Result The black and white luminance values for the contrast calculations were taken from the gamma curves luminance values at the first and the last level and the photopical contrast values where calculated. The efficiency was calculated by dividing the new maximum luminance value with the original maximum value without ocular. The measured luminance values for the different greyscale levels and gamma curves are shown in table 3.10 and in figure 3.9, respectively. Table 3.10 shows the luminance values for the different oculars and without ocular with respect to the different greyscale level. The efficiency is calculated through division of the ocular luminance value with respect to the value without ocular, this was done for all greyscale levels.
Greyscale-level RKE (cd/m2)
DSS –90 (cd/m2)
Without (cd/m2)
Eff. RKE(%)
Eff. DSS 90 (%)
0 1.8 2.1 2.1 85 98 15 9.6 10.2 11.3 85 90 31 18.5 19.4 21.4 86 91 47 26.7 28.1 30.8 87 91 63 34.5 36.2 39.2 88 92 79 41.8 43.8 47.3 88 93 95 48.6 50.8 54.9 89 93
111 54.7 57.2 61.8 88 93 127 60.6 63.2 68.2 89 93 143 66.2 68.8 74.3 89 93 159 71.2 74.1 79.9 89 93 175 76.3 79.3 85.5 89 93 191 81 84.2 90.9 89 93 207 85.7 89.2 96.1 89 93 223 90.3 94.0 101.2 89 93 239 94.7 98.7 105.9 89 93 255 99.3 103.3 110.8 90 93
Average eff. (%) 88 93 Contrast 55:1 50:1 52:1
Table 3.10 Measured luminance and calculated contrast and efficiency value for different greyscale
levels.
______________________________________________________________________________________
- 54 -

______________________________________________________________________________________
- 55 -
Figure 3.17 shows the gamma curves for the oculars and without ocular. The effi-ciency of the oculars can be seen as the difference between the gamma curves with and without ocular.
Comparision between without ocular, RKE and DCS-90
0
20
40
60
80
100
120
0 15 31 47 63 79 95 111 127 143 159 175 191 207 223 239 255
Grey Level
Lum
inan
ce c
d/m
2
whiteRKEDCS -90
Figure 3.17 A comparative plot of the luminance and efficiency values. As stated in the table 3.10 and figure 3.17 luminance without ocular was measured to 111 cd/m2 and resulted in an efficiency of 88% when using the RKE. The DSS 90 with a luminance value of 103 cd/m2 resulted in an efficiency of 93%. The black value for the DSS 90 was 2,1 cd/m2 and resulted in a contrast ratio of 50:1. The black luminance value using the RKE was measured to 1,8 cd/m2 with a contrast ratio of 55:1 as result. The contrast ratio was 52:1 without any ocular. The colours and their distribution showed no artefacts or chromatic aberration due to the use of the RKE or the DSS 90 oculars.
Conclusion According to the decrease of luminance efficiency the curve was lowered when using the RKE and the DSS 90. According to the curves, the efficiencies for the two oculars were nearly constant and independent of the greyscale level. The results of the efficiencies of 88% and 93% were considered as acceptable. The contrast values for the two oculars are equal to the initial in the range of measurement error. Due to the subjective nature of the estimation of chromatic aberration, a human error of the estimation could not be fully neglected.

4 Discussion and conclusion
4.1 OLED – Advantages and drawbacks
The study of the OLED technology and the measurement on the eMagin OLED contributed to different aspects of the advantages and disadvantages for the OLED technology.
There are several reasons why OLED is an interesting new display type, the thin format that also leads to lower weight, the wide viewing angle that allows multi-user capabili-ties, cheap manufacturing for future developed manufacturing processes and a believed good power efficiency. The OLED technology is also believed to possess good chroma-ticity properties that will enable correct and good visual presentation of data.
The two classifications have their drawbacks and advantages and the industry has not yet agreed upon which one that is best suited as an industrial standard. The first approach, small molecules, is believed to have a leading position due to the earlier discovery (2.3.1). The conjugated polymer based OLED are considered to possess a higher power efficiency compared to the small molecules due to better internal efficiency of the emitting layer (2.3.4). Through doping of the small molecule materials the efficiency can be enhanced (2.3.4). Another considerable difference between the two material groups is the manufacturing method. Small molecules are manufactured through vacuum evaporation. The conjugated polymers are spin-coated, which is cheaper than evaporation but more wasteful. To accomplish the best features of an OLED device, a combination of the two classes is according to some the best approach for future displays [41].
A substantial disadvantage with the new technology is that the displays have not yet proved a lifetime sufficient for the demands of the market. This was found in the paper study (2.3.5) and also confirmed when measuring the OLED device (3.3.8). When and if the problem with the lifetime will be solved the OLEDs will surely take large portions of the display market.
The low lifetime of the OLED is caused by the degradation of emitting material. The two main contributors to the degradation process in an OLED are a high current density and bad encapsulation of the organic layers. The high current density is needed due to the poor power efficiency of the emitting layer in order to produce a light emission. The lifetime is consequently proportional to the brightness level of the display.
Lowering the resolution of the displays does not necessary contribute to a longer lifetime instead the main concern is to decrease the current density of which the display is subjected to.
______________________________________________________________________________________
- 56 -
4.2 An OLED LCD comparison
4.2.1 Brightness The brightness level of an OLED device is inversely proportional to the lifetime of the display. Due to the bad lifetime of OLEDs the maximum brightness level is an important issue. As a result of the fact that brightness is inverted proportional to lifetime it is better to try to achieve a high contrast in some situations and also because of that the human eye is more sensible to contrast ratio than to brightness [6]. The measurements showed a rather low brightness considering the low lifetime, mainly due to the colour filters that reduce the brightness with approximately 90% (3.3.2).
4.2.2 Power efficiency It is believed that the OLED technology possesses a better power efficiency compared to the LCD technology for a number of reasons. Compared to LCD, the OLED construction does not use any polarises, which reduce the efficiency of the emitted light. OLEDs are also more efficient due to the fact that the pixel is only turned on when it is supposed to emit light. This is not the case for LCD where the backlight always emits light over the whole surface regardless whether the pixels are active or not, which is very power inefficient.
For LCDs the backlight consumes as much as up to 75% of the total power of the display but only a few percent of the light from the backlight reach the beholder. OLED has shown an external quantum efficiency of 10% for some specific colours and materials (2.3.5). In order to compete with TFT-LCDs it is believed that at least 7.5 % external quantum efficiency is needed [42]. The eMagin OLED microdisplay used in the measurements inhabited lower power consumption compared to a similar LCD according to the display specification (3.3.6).
4.2.3 Colour representation The use of colour filters causes a reduction of the light emitted in both OLED and LCD devices. It is also hard to make filters that efficient span the colour gamut. The colour gamut for LCDs and OLEDs with colour filters is believed to be equal. For reflective LCDs the colour gamut is superior compared to devices with colour filters due to the good colour properties of the external LED. It is believed that when the OLED materials are fully developed, it will be possible to place materials that emits RGB colours side by side in an array resulting in a colour gamut as good as for the reflective LCDs or even better. It has been shown that OLED have a stable chromaticity over time and over luminance levels, which is not the case with inorganic LED used to illuminate LCDs [1]. The measurement yielded in a colour gamut for the OLED comparative to a transmissive LCD, due to the colour filters. The reflective LCD showed much better gamut properties according to above (3.3.4).
4.2.4 Manufacturing It is important that the manufacturing is cheap and not wasteful in order to make the production profitable and the displays cheap. As with all new technologies, the develop-ment and production costs are larger in the initial state. Manufacturers believe that when
______________________________________________________________________________________
- 57 -

the manufacturing of OLEDs is fully developed in maturity and mass production the process will be up to 20% - 50% cheaper than LCD manufacturing [43]. The more expensive LCD manufacturing is due to the need of expensive components e.g. colour filters, polarisers and backlight. The complexity when combining the different parts of the display also brings extra costs compared to OLED manufacturing.
4.2.5 Resolution It is generally believed that the OLED technology will result in even better resolution compared to LCDs. Today OLED microdisplays with SVGA resolution with a very small pixel pitch have been constructed. This could be compared to the LCD technology where displays with the same size are capable of showing SXGA resolution images. The problems of achieving high resolution are due to the tight patterning of the pixels and the driving scheme. The driving schemes for both LCDs and OLEDs are generally the same and would not be an obstacle for the OLED technology development. Instead the capability to manufacture tight patterned organic pixels an issue. As a result of more precise patterning methods being developed, higher resolution OLEDs will be achieved (3.3.1). New approaches of OLEDs like the SOLED will also generate a higher resolution (2.3.4). The highest resolution for OLED microdisplays today is 852*600 SVGA+ for the eMagin OLED (3.2.1).
4.2.6 Ruggedness The OLED possesses a much more rugged structure due to the fact that no liquids or gases are part of the technology in comparison to LCD. Contact pressure and vibrations on the contrary to OLED affect the LCD.
4.2.7 Size Because of the fact the OLED is a self-emitting device there is no need to use any backlight such as in the LCD. This leading to an even thinner display compared to LCD, where the thickness of the OLED is instead mainly dependent on the thickness of the substrate on which it is fabricated.
Samsung together with NEC have made prototype AMOLEDs in sizes up to 15.1 inch XGA with a calculated commercial production start by 2005 [44]. The largest commer-cial OLED available today placed in a Pioneer car stereo and is 5,2 inch [45]. It is believed that the manufactures first aim on the small low-resolution display market for displays in Personal Digital Assistant (PDA) and mobile phones. There are only one microdisplay based on OLED technology available today, the eMagin SVGA evaluation kit.
LCDs on the other hand have been commercially available in 15 inch for several years and are estimated to take over the computer monitor market in a couple of years. The largest available LCD is about 24 inch and is also manufactured by Samsung.
4.2.8 Viewing angle OLEDs possess a very good viewing angle due to the quasi-Lambertian emission distribution. An improvement of this property for LCD could be achieved through a method called in plane switching, which contains both of the addressing lines in the
______________________________________________________________________________________
- 58 -
bottom of the display. Instead of applying the current in a top to bottom direction as in a regular fashion [54]. The good viewing angle for OLEDs was confirmed in the measure-ment (3.3.7).
4.2.9 Temperature For OLEDs there can be difficulties at low temperatures depending on the dissimilar temperature expansion of the different materials in the diverse layers of the display, resulting in deterioration of the layer interfaces. This problem occurs mainly at the metal electrode to organic layer interface. The glass transition temperature Tg also affects the temperature range for conjugated polymer materials (2.3.2). The small molecule materials are not affected by Tg instead the evaporation temperature used during manufacturing is an upper limit (2.3.2).
The effect of extreme heat is that the emitted light from the OLED is reduced, e.g. a temperature of 110° C results in a 50% decrease of the luminance efficiency in a specific device [12]. The change of temperature of the OLED can also be noticed as a difference in the colour of the emitted light.
LCDs are badly affected by high temperatures, by destroying the twisting properties of the liquid at temperatures larger than 90°C [6]. The temperature also affects AMLCDs, causing a higher response time at low temperatures, a property that not affects OLEDs [6]. Brightness and chromaticity are also to some extent dependent on temperature [47]. The OLED used during the measurements had an operating temperature range from -40 to 85 °C compared to 10 to 60 °C for the LCOS (3.2.1).
4.2.10 Response time A fast response time is important in order to address more lines during the time of one frame resulting in high-resolution displays. The response time for OLEDs is shorter than 1 µs, in comparison to 25 ms for active matrix LCDs and 300 ms for passive addressed LCDs [48][16]. The relatively long response time for LCDs have been a limiting problem and several new approaches have been made in effort to enhance the response time, such as FE and STN (2.2.2). FELCDs possess a response time less than 50 µs, which is much faster than STN but more complicated to manufacture. The fast response time for OLEDs make them possible to be used in video application even when using a passive matrix addressing, something that is not possible for LCDs.
4.3 OLED future There are two products available on the market today, which are based on the OLED technology, the display for the Motorola TimePort [27] mobile phone and a car stereo display from Pioneer [45]. Both displays are based on small molecules probably depending on the earlier discovery. Due to the novel technology of OLED the first products on the market are and will be the nearest couple of years mainly mid-size low-resolution displays for the use in PDA and mobile phones.
According to the enquiry sent to approximately twenty companies, several companies like Kodak Sanyo, Rohm Electronics and AU Optronics claim to have commercial products based on the OLED technology around year 2003.
______________________________________________________________________________________
- 59 -

There are only two companies that are exclusively focusing their work on microdisplays suitable for the ARTHUR HMD. The Scottish company Micro Emissive Displays is working on microdisplays based on conjugated polymers but have not at this stage any available prototypes or want to share their research status. The US company eMagin, base their microdisplays on small molecules and have today evaluation kit of their SVGA+ microdisplays available. The measurements performed on this microdisplay showed some promising properties but with a measured lifetime less than one week makes the display not useful in most applications. eMagin has recently been awarded a patent for a new type of stacked OLED with claimed better power efficiency [49]. This would result in an improvement of the lifetime for the microdisplays. eMagin has also been contracted to supply approximately 40.000 SVGA+ microdisplays to the US army for the use in HMDs. The order shows that the modifications on the microdisplays have resulted in longer lifetimes and makes the display suitable for the ARTHUR HMD. Although measurements on the new modified display have to be done in order verify the longer lifetime.
It is believed that the development of the OLED technology will progress faster than it did for the LCD technology. This is due to that many of the OLED problems like pixel addressing already have been solved for the LCD technology and now just have to be adjusted to suite the OLED technology.
The main obstacle preventing OLEDs on the market is the bad lifetime of the organic emitting layers. The research of improving the lifetime is focused on finding better encapsulation and new materials with better power efficiency. The most critical material is the blue emitting layer. The difficulties to produce blue emitting materials with a long lifetime are due to the high energy needed in order to achieve a blue light.
Other areas of research are to find emitting materials that possess better colour properties that better span the colour gamut. It is wanted in order to avoid colour filters that reduce the light emitted and consequently the lifetime. Newer classes of OLEDs, e.g. FOLED, TOLED and SOLED, are also interesting due to the enabling of new application areas and more efficient devices (2.3.2). Cheaper and more efficient ways of production is important if the technology aims at mass production. Better manufacturing methods furthermore enable a better pixel pitch and higher resolution. TFT for the pixel address-ing made of polymer material would result in an all polymer device. Today Philips has a commercial LCD available that has an active matrix addressing on polymer TFT.
To reduce the degradation of colour displays with RGB filters it is important to find filters that have a low consumption of the emitted light.
The capability to make transparent displays can yield in a high number of new display applications. Therefore is the possibility to make transparent OLEDs into a large benefit in comparison to LCDs. LCDs can not be manufactured transparent due to their transmissive or reflective nature. The TOLEDs made today exhibit a transparency of up to 85% when turned off. Although the TOLED technology is not yet fully developed there are many applications for transparent displays in the future, such as in combination with the FOLED technology, e.g. a head up display on a windshield.
______________________________________________________________________________________
- 60 -

5 References [1] James E. Melzer and Kirk Moffitt, 1997, Head Mounted Displays – Designing for the User (USA:
McGraw-Hill) [2] Elektronik i Norden, nr 20, 2001 [3] Jeffrey A. Shimizu, 2000, Single Panel Reflective LCD Optics (Philips Research) [4] http://www.crlopto.com/wop/technology/ferroelcdispl.htm [5] http://www.microvue.com/ [6] Mahon, J.K., Brown, J.J., Hack, M., Hewitt, R., OLED displays for military applications, SPIE,
vol. 4022, pp. 233-240. [7] Tang, C.W., Van Slyke, S.A., 1987, Organic Electroluminscent Diodes, Applied Physics Letters,
51, p.913. [8] Johnson, M.T, Sempel, A., 2000, Information display Polymer-LED matrix displays, 2, pp. 12-15. [9] Krane, K, 1983, Modern physics (New York: Wiley & Sons), pp.149-428. [10] Hägg, G, 1989, Allmän och oorganisk kemi (Uppsala: Almqvist & Wiksell). [11] Tang, C.W., 1997, An overview of organic electroluminescent materials and devices, Journal of
the SID, 5/1, pp. 11-14. [12] Nguyen, T.P., Molinie, P., Destruel, P., 2001, Handbook of advanced electronic and photonic
materials and devices vol 10. Organic and polymer-based light emitting diodes, edited by H. Sing Nalwa, (San Diego: Academic press), pp. 3-42.
[13] Prache, O., 2001, Active matrix molecular OLED microdisplays, Displays ???, 22, pp. 49-56. [14] http://www.luxell.com/LayerPages/firefly.htm [15] Granlund, T., 2001, Personal communication. [16] Pichler, K., Howard, W.E., Prache, O., 1999, Design and manufacturing of active-matrix organic
light-emitting microdisplays on silicon, SPIE, vol. 3797, pp. 258-265. [17] Sturm, J.C., et al., 1999, Printing approaches for large-area color organic LED displays, SPIE, vol.
3797, pp. 266-273. [18] Grove, M., Hayes, D., Cox, R., Wallace, D., 1999, Color Flat Panel Manufacturing Using Ink Jet
Technology, Display Works '99. [19] Granlund, T., et al., 2000, Patterning of polymer light-emitting diodes with soft lithography,
Advanced materials, 12, No. 4, pp. 269-273. [20] Miyaguchi, S., et al, 1999, Organic LED full color passive-matrix display, Journal of the SID, 7/3,
pp. 221-225. [21] Tamura, S., et al., 1999, RGB materials for organic light emitting displays, SPIE, vol. 3797, pp.
120-128.
______________________________________________________________________________________
- 61 -

[22] Prache, O., Vice President, eMagin Product Development, 2002, Personal communication. [23] Saini, G.S., Hopper, D.G., 1998, Approach of organic light emitting displays to technology status,
SPIE, vol. 3363, pp. 288-298. [24] Burrows, P.E., Gu, G., Forrest, S.R., 1998, Stacked organic light emitting devices for full color
flat panel displays, SPIE, vol. 3363, pp. 269-277. [25] Burrows, P.E., Forrest, S.R., et al., 1997, SOLED: a new type of organic device for achieving
high-resolution full color displays, Synthetic metals, 91, pp. 9-13. [26] http://www.CDTltd.com [27] Tohma, T., et al., 2001, The Future of Active-Matrix Organic LEDs, Information Display, No. 11,
pp. 20-23. [28] http://jerg.ee.psu.edu/Publications/1998/Jackson-1998-1/ [29] http://www.kopin.com/ [30] http://www.pctechguide.com/07panels.htm [31] Smith, W.J., 2000, Modern optical engineering, 3rd edition, (USA: McGraw-Hill) [32] Flat Panel Display Measurements Standard. Version 1.0 VESA, Video Electronics Standards
Association [33] Taylor, B.N., 1995, Guide for the Use of the International System of Units (SI), NIST Special
Publication, vol 811. [34] http://www.crlopto.com/ [35] SXGA Display Evaluation Kit (Rev C) User manual Micropix Technology, Limited Version 1.1,
Feb-2001,Ref 5039-64001 [36] SVGA+ OLED Microdisplay, Developer Kit User manual, eMagin Corporation, EMA –100046 [37] PR 714 Manual, PhotoResearch [38] Provnings protokoll FMI [39] http://www.emagin.com/ [40] Arai, M. et al, 1997, Passive matrix display of organic LED, Synthetic metals, 91, pp. 21-25. [41] Kido, J., 1999, Organic displays, Physics World, March 1999, pp. 27-30. [42] He, Y. et al., 1999, High performance organic polymer light-emitting heterostructure devices,
Applied physics letter, Vol. 74, no. 16, pp. 2265-2267 [43] http://komar.cs.stthomas.edu/qm425/01s/Tollefsrud2.htm [44] http://www.samsung.com [45] http://www.pioneer.co.jp/
______________________________________________________________________________________
- 62 -

[46] http://www.elis.rug.ac.be/ELISgroups/lcd/research/angle.html [47] http://www.sanyo.com/industrial/semiconductors/lcd/tm150xg_26l07.pdf [48] http://www.litearray.com/Movie7.html [49] Jones et al, United State Patent, No.6337492, January 2002. [50] Kittel, C, 1986, Introduction to Solid State Physics (Wiley & Sons). [51] Friend, R.H., Greenham, N.C., 1998, Electroluminescence in Conjugated Polymers, In Handbook
of Conducting Polymers, Edited by Skotheim, T.A., Elsenbaumer, R.L, Reynolds, J.R, (New York: Marcel Dekker Inc.), pp. 823-840.
[52] http://rkb.home.cern.ch/rkb/PH14pp/node178.html [53] Baldo, M.A., Thompson, M.E., Forrest, S.R., 1999, Phosphorescent materials for application to
organic light emitting devices, Pure Appl. Chem., vol. 71, No. 11, pp. 2095-2106. [54] http://www.cdtltd.co.uk [55] Yakovlev, Yu.O., Zolin, V.F., 1997, Principles of material selection for thin-film organic light-
emitting diodes, Synthetic metals, 91, pp. 205-206. [56] Friend, R., Burroughes, J., Shimoda, T., 1999, Polymer diodes, Physics World, June 1999, pp. 35
–40. [57] Yoshiharu, S., et al., 1999, Interface and material considerations of OLEDs, SPIE, vol. 3797, pp.
198-207. [58] Granlund, T., Pettersson, L.A.A., Ingenäs, O., Determination of emission zone in a single-layer
polymer light-emitting diode through optical measurements,
______________________________________________________________________________________
- 63 -

Appendix A – OLED physics A.1 Theory of physics A.1.1 Introduction The atomic model According to the Bohr model, a core of an atom consists of positive protons, neutral neutrons and subatomic particles [9]. The atom has a certain quantity of bands with a discrete amount of negatively charged electrons. The outermost is called the valence band. The amount of bands from the core is equal to the principal quantum number n and the angular momentum quantum number l, which is defined as 0≤ l ≤ (n-1). For each l there exist a magnetic quantum number ml with values of ± 1,± 2,...,± l. The fourth quantum number is the intrinsic angular momentum or spin quantum number ms which has values of ±1/2 (spin up/spin down). The Pauli’s principle proclaims that every electron has a different quantum number [9]. The fourth quantum number, spin up or spin down, has a contribution to the characteristic of the electronic state of the electron. A paired set of electrons with changed spin quantum number in a band of the atom is the singlet ground state according to figure A.1. Beyond the valence band there is a conduction band B*. Electrons are not allowed to have a similar state and unpaired in the same band and excite therefore in these cases to B*. This is called a triplet state. Although a singlet state electron is possible to excite to the conduction band through external stimulus. Conduction band B*
Valence band B a) b) b)
Figure A.1 The electronic states of the electron, a) ground singlet state b) excited singlet state c) excited triplet state.
Each band has subshells which have the notation s, p, d… with a maximal capacity of 2(2l + 1) electrons. If n = 2, the 2s subshell with l =0 has a capacity of 2 electrons. The 2p subshell is divided into three directional parts (px, py, pz), and has with l =1 a capacity of 6 electrons which lead to a total sum of 8 electrons in the second band [9]. As an example, the carbon (C) atom has a total amount of 6 electrons, where 2 of them are positioned in the innermost band, n = 1 (figure C.3). The other four are positioned in n = 2. The contribution to the configuration from n = 1 would be 1s2. The contribution from the valence band, n = 2, would be 2s22p2. With the 1s and 2s subshells filled, they accomplish the 1s2s2p2 configuration for carbon. The 2p subshell with its 2 electrons is the outermost band, which is the mostly considered band when atoms and materials interact.
The bandtheory When adding with one atomic orbital each, a molecule with two molecular bands or orbitals is formed. The outermost band and its configuration of electrons are the main
______________________________________________________________________________________
- 64 -

reason of the formation of molecules. Because of electrons wave functions overlap, one band is a bonding orbital that possesses lower energy Ev than one of the original atomic orbitals with a purpose to stabilise the whole molecule. This is the valence band or Highest Occupied Molecular Orbital (HOMO). The second orbital is antibonding conduction orbital or Lowest Unoccupied Molecular Orbital (LUMO). This orbital works destabilising and has an increased and higher energy Ec than Ev. When several molecules interact, electrons fill the valence band primarily according to the Pauli’s principle. The interaction yields also rotational and vibrational energies in the molecule [9]. The gap between HOMO and LUMO forms a bandgap with certain energy Eg, which is fundamental for conductivity. These energies are dependent on the temperature and at a temperature of 0 K none of the electrons is positioned in the conduction band. At this temperature all states are set and the energy level is called Fermi energy Ef [9]. To excite an electron to the conduction band an effort Eg is needed. A temperature over 0 K will increase the intrinsic thermal distribution and enhance the energy at the electrons (figure A.2). To define the stability or efficiency of a material different terms could be used, e.g. electron mobility that is another expression for the conductivity property in different materials and is expressed in cm2/Vs [10]. According to figure A.9 supplementary terms are envisaged. Electron affinity is the ability for an atom to absorb electrons, i.e. the required energy to excite an electron from the conduction band to the vacuum level expressed in electron volt (eV) [10]. The vacuum level is defined as the level where no external forces are applied to the material. The energy an electron would have at rest outside the material. To remove an electron from an atom, a certain energy is needed, ionisation energy that is expressed in eV. An electron is bound in a metal with certain energy, which is the work function of a material expressed in eV. The work function changes when doping the material and electron affinity is therefore better suited to characterise a material. A.1.2 The semiconductor Solid-state physics is divided into three different parts, isolators, conductors and semiconductors. An isolator is e.g. organic materials, where the electrons are not able to “absorb” the required energy Eg. This is because of a too large band gap to the outer conduction band, which is unoccupied. Electrons will therefore not transfer through the band gap, which is considered as a “forbidden area”. The conductors have on the contrary its conduction band partially filled and the energy bandgap does not exist. This fact facilitates the possibility for an electron to reach an unoccupied band during exposure of an electrical field and enable the material to conduct. When the electrons transfer to the conduction band, the vacancy of the electrons leaves a hole. The hole is seen as a positive charge, which also attract electrons from adjacent atoms, which consequently leaves holes unoccupied. These attract other electrons and leave new holes etc.
______________________________________________________________________________________
- 65 -

The semiconductors refer to the III-V- and IV-groups in the periodic system in figure C.3. The materials possess an energy gap that is smaller than isolators do; otherwise it is similar compared to the structure of isolators. At 0 K and low temperatures, the semiconductor behaves similar to the isolator. Through an increasing temperature the conductivity increases by the intrinsic thermal contribu-tion, which yields more excited electrons. This procedure migrates through the whole solid material and because of the thermal input the conductivity is improved. Electronic properties of a pure semiconductor are not satisfactory and the material is therefore doped. The doping lowering the conduction band through an impurity or dopant. The bandgap Eg decreases further and changing the property of the semiconductor or isolator. A doping procedure would result in an either p- or n-type material. A combination of a 4-electron host, with four electrons in its outermost band, with a 5-electron dopant results in a full valence band and an electron in the conduction band. This n-type-doped semiconductor, known as donor, lowers the conduction band to the donor state according to figure A.2 [9]. When instead adding a 3-electron impurity the process results in an acceptor and an increase of the energy level of the valence band to an acceptor state (figure A.2). Undoped conductors have a lower ability to conduct at high temperatures while semiconductors behave in the opposite manner.
Figure A.2 Molecular orbitals with the energy levels for n
Bandgap
Acceptor state
Ec
Ev
Eg
Ener
gy
Donor state
Conduction band B* (LUMO)
LED A general LED is constructed of semiconductors. The matetype, which separated exhibit a lower and higher Ef respecmaterials, the different energies Ef accomplish equilibriumequilibrium generates a potential difference of the work interface between the materials in the LED (figure A.9). The diodes work generally only when applying a forward bthe anode is connected to the p-type material and the catmaterial. The p-type barrier is then lowered and the negathe cathode are able to easily reach the higher energy levholes, seen as positive charged carriers, wander more easlower energy level. As envisaged in the figure A.3, the attraction between anelectron-hole pair particle, known as an exciton with a hi
_________________________________________________________
- 66 -
Valence band B (HOMO)
- and p-type materials.
rials are doped p-type and n-tively. When combining two according to figure A.3. The functions or a barrier at the
ias over two electrodes, where hode is applied to the n-type tively charged electrons from el at the p-type material. The ily from the anode towards a
electron and a hole forms a gher energy compared to the
_____________________________

valence band. After elapsed lifetime of the exciton, it has its energy released as photons and light. The singlet state excitons possess a short lifetime and consequently a fast time of decay (in order of a few ns) compared to the triplet state excitons that possess a relatively longer time (1 ms – 1 s). Fluorescence is identified and related to the emission of light and the short lifetime of the singlet excited state. The triplet state excitons possess a long and non-emission of light decay to initial ground state due to the conservation require-ment of the spin. The energy is in this case released often in heat. When applying a reverse bias, the barriers are increased and result in a decrease of the amount of recombination [9].
s
Electrons Conduction band LUMO
-
Valence band
Ef
Ec
Light emission
Light emission Ev
Ener
gy E
A.1.3 Physics of an OThe organic molecule The electrons are distriprobability functions. Tmolecules that strive forutes to a lower energy ofis therefore searched. When the orbitals for thorbital around its bond aof rotational symmetry through the overlap of twhich also is the case fotwo atoms. The double type σ- bond. The overpresence π-bonds. This main part of the moleculin the organic molecules
________________________
Hole
p-ty
Figure A
LED de
buted rouhe outerm the lowe the syste
e electroxis, a σ- could be he electrr σ- bondbond is thlap betwcontribute; the orb.
_________
-----
pe
.3
vic
ndos
st em
ns bonco
on s. πer
eenes ita
___
Force on
A forward bi
e
the core t electronnergy as p
and the ma
overlap ind could be
nsidered aorbitals wh- bonds ar
efore alwa the adjacto an overls are cons
__________
- 67 -
+++++
d
Electrical fielHOMO
n-type
ased p-n junction.
of the atom according to their electron orbitals in the atom interact and form ossible. A bond to another atom contrib-ximal amount of bonds to adjacent atoms
a formation of a symmetrical rotational considered. An overlap with the absence s a π- bond [10]. The bonds are formed ere a large overlap is a strong bonding, e a requirement for double bond between ys of type σπ-bond and a single bond of ent electron orbitals is increased with a lap between orbitals in the whole or the idered delocalised, which often is the fact
________________________________________

An example of the formation of an organic molecule that includes carbon and hydrogen (H) is followed in this part. This is caused through a hybridisation and accomplishes strong and stable covalent bonds between the carbon atoms in the molecule [10]. The molecular orbitals are therefore not possible to associate with the s- or p-atomic orbitals specifically. An atom with a configuration of 1s2s22pn results in a hybrid 1s2s12pn+1, due to that an electron excites from 2s to 2p subshell [9]. The outermost atomic orbitals 2s and 2p are hybridised according to figure A.4. If a carbon atom bond to three other atoms a sp2-hybridisation is probable, which results in one p along the z-direction and three sp2 orbitals along x-y plane for each atom in the molecule. The pz orbital is unaffected during the hybridisation according to figure A.4.
Hybridisation
Y X
Z
YX
Z
X Y Y
Z Z
X
Figure A.4 Electron probability distributions of the atomic 2s, 2p orbitals and the pz and sp2 molecular orbitals.
The three sp2 orbitals lie in a plane structure with a bond angle of 120 ° to other atoms. Two of three bonds are bonded with two other carbon atoms and construct the strongly localised σ- bonds in the backbone of the molecule. The third sp2 orbital has a σ- bond to a H atom. The pz electron orbital appears orthogonal to the backbone-plane of the molecule. The overlap of the pz orbitals with the neighbouring atoms forms π-bonds according to figure A.5. The delocalisation of the π-bonds along the boundary of the molecule enables the mobility of charges through the molecule. The four orbitals give an alternating sequence of single and double bonds between the atoms according to figure A.6. The alternation, also known as conjugation, is not symmetric in organic materials as in metals. The alternation could be seen as a difference in length of the π- bonds at the overlap of the pz orbitals.
Figure A.5 Electrons move through the π-bonds in the overlap of the orthogonal pz-orbitals.
______________________________________________________________________________________
- 68 -

Figure A.6 The alternation of double- and single bonds between the carbon atoms. The polymers are considered as macromolecules that consist of a long chain of smaller molecules or monomers. The length of the alternating sequence of bonds in the structure is referred as the conjugation length, which set the properties of the molecule. The length of conjugation is reciprocal to the bandgap Eg of the molecule. The small conjugated molecules have a shorter length and therefore it is easier to emit light with a higher energy from small molecules than a longer conjugated molecule, e.g. a polymer. The structure of the backbone contributes mainly to the properties of the molecule. The backbone is twisted in a minor degree and presents a long conjugation length, which is related to a smaller bandgap. With an enhancement of the twisting of the structure, a larger bandgap is accomplished. The size of the bandgap will not only change the energy and colour of the light but also the conductivity. A too large twisted structure would consequently result in non-conductivity, because of the absence of the pz orbital overlap. Luminescence in organic materials When applying an electrical field, charge carriers are injected from the electrodes into the organic layer respectively. The injection of the charged carriers, on to the organic chain, results through electron-phonon coupling in geometrical defects on the alternating structure, seen as polarons. A phonon is considered as a particle, which is the quantity term of the vibrational energy between the atoms in the molecule. The term electron-phonon coupling could be regarded as the “glue” between the bonding electrons of different atoms in the molecule [50]. Depending on the injected charged carrier, hole-and electron-polarons move along the polymer towards the opposite electrode and the emitting layer. The polarons exhibit two new states of energy between the HOMO and LUMO that lower the bandgap Eg. The attractions of the polarons of positive and negative character perform a formation to an exciton-polaron [51]. The exciton-polaron has a spin and a property of singlet- or triplet-state. The energy level of the exciton-polaron is below the conduction band and the released energy is emitted as photons. The states of the exciton-polaron have certain influence of the emission of light and quantum efficiency since the singlet states release its energy as an emission of photons. The amount of the emitted light could be reduced and then primarily by the triplet states. If the emission of light takes place at a too close distance to a metal cathode, the light could be reduced through quenching of exciton-polarons(A.2). Doping in organic materials A material has properties of absorption and emission of light where the separation of the spectra is referred as the Stokes’ shift [52]. Conjugated polymers have, with their long
______________________________________________________________________________________
- 69 -
conjugation length, its absorption and emission wavelength spectra separated according to small molecules have shorter conjugation length and the emission tends to become absorbed because of a too small shift. But the side chains of a polymer could prohibit the polymer to stretch, the Stokes’ shift could due to that be considered as small even if the conjugation is long. To enhance the properties of the organic materials and a larger Stokes’ shift, the materials can be modified through doping and side-chain manipulation. The quantum efficiency could through this is performance become improved. According to the limitation of the quantum efficiency, due to the triplet excited state, an approach of improvement could be through doping with phosphorescent materials. The contribution of a phosphorescent dye, e.g. platinum, accomplishes a mixture of the singlet- and triplet excited states, which generates a higher speed of the emission of light, known as phosphorescence [53]. The conjugated polymers are considered to hold a better quantum efficiency due to the 1:1 singlet-triplet state ratio compared to small molecules with a singlet-triplet ratio of 1:3. It is considered that the conjugated polymers due to that not have any particular need for doping [54]. A.2 The OLED device The quenching phenomena There is a great difficulty to transport charge carriers to the emission zone without an appearance of unbalanced amounts of hole-polarons and electron-polarons [12]. Therefore, there is always one dominant charge carrier that moves through the material without recombining with the opposite charge carrier. At potential barriers the charges will accumulate and may destroy the excitons. This phenomenon is known as quenching, which consequently reduces the emitted light. The device will because of that process result in a decreased efficiency of the production of light, which could be overcome through a minimisation of the electrode/organic barriers, e.g. a use of double- or multi-layered structure. This would consequently lead to an increase of equilibrium of the carriers and consequently increase probability of recombination. A proper placement of the emitting zone by tuning the voltage is another solution to decrease quenching. The behaviours of the charged carriers are not similar in organic materials compared to metal, because of the localisation in different parts of the material depending whether carriers are hole-polarons or electron-polarons. This fact impedes a recombination and decreases its probability [55].
______________________________________________________________________________________
- 70 -

A.2.1 The OLED composite
Undoped Alq3 35nm
Mg/Ag 200nm
Emitted light Light
L
EML
ETL
e
EIL
HTL
Alq3 + dopant 35 nm Figure A.8 The OLED multi-layered down emitting compo
is stated with an example o
ΦA LUMO
HOMO
Vacuum level
∆Eh
Anode Organic layer
Eg
χ
Ei
Figure A.9 The energy level diagram for a mono-layeredand ΦA the counterpart for the anode. ∆Eh and ∆Ee is the
respectively. Ef is the vacuum level, Eg the bandgap betwelectron affinity, which is the ability to absorb electrons. E
further in Append Substrate The OLED is built on a substrate that protects tand therefore prevents eventual degradation. Tnature, e.g. glass or plastics. For up-emitting micsubstrate with an additional substrate on the top o
_______________________________________________
- 71 -
Anode
Cathod
Substrate
site. An indication f used materials.
ΦC ∆Ee
Cathode
device. ΦC is the wobarriers for the injeceen the conduction i is the ionisation pix A.1.
he organic layerhe material is orodisplays is a sif the device (2.3
________________
ITO 100nm
CuPc 20nm
NPB 50nm
HI
Substrate
of the thickness of the layers
rk function for the cathode tions of holes and electrons and valence band. χis the otential. The term is defined
s from moisture and air f a rigid or a flexible licon backplane used as ).
_______________________

Anode The high-work function ΦA metal anode is generally formed on the substrate. The work function is given in figure A.9, which summarise other relevant terms. By using a transparent anode, the radiated light is capable to leave the device. Properly chosen anode materials produce positively charged holes, which are injected into organic layers. The hole-polarons are relatively easy to produce and this often lead to an unbalanced relationship between the two types of charged carriers. The anode is fabricated as a function of rows that span the addressing matrix, together with the cathode to provide an effective pixel addressing (2.4). By modifying the structure of the down-emitting device, an up-emitting device is achieved. A high-work function metal anode is used instead of the original ITO anode. A transparent cathode is followed by an additional transparent ITO layer replaces the cathode [24]. Hole Injection Layer (HIL) An organic p-type HIL at the anode interface controls and enhance the injection of the holes from the anode. The layer has a high mobility of hole-polarons, which means a low LUMO, and a low ionisation potential Ei and a high HOMO. These facts lower the barrier ∆Eh between anode and the adjacent organic layer and holes can easily be injected into the layer. Properties that match the purposes of layer are found in small molecules copper phthalocyanine (CuPc) and perylenetetracarboxylic-dianitride (PTCDA)[12]. Among the polymer material poly ethylenedioxy thiophene (PEDOT) is suggested as appropriate for HIL [56]. Hole Transport Layer (HTL) An effective organic HTL needs to transport hole-polarons effectively to the emitting zone and in some cases also a function of blocking negatively charged carriers from the cathode. The material of the HTL requires therefore a high mobility of the hole-polarons but also a low ionisation potential Ei. For the small molecules the aromatic amines are suitable and are commonly used prior to other small molecules. A p-type material is used in HTL, where suited and mostly used types are the diphenyl diamines (TPD) and (NPB) (figure A.10ab), because of their high stability in a thermal exposure [11][12]. Among conjugated polymers a frequently used material is the poly paraphenylene vinylene (PPV) (figure A.10e). A soluble polymer is easily fabricated without any thermal treatment and is because of that an attractive material.
e)
d)
a) b) c)
Figure A.10 Molecular structures of organic materials. a) TPD, b) alfa-NPD, c) Alq3, d) PPP, e) PPV.
______________________________________________________________________________________
- 72 -
Emitting Layer (EML) The EML is generally one of the organic transport layers and a hole blocking layer (2.3.3) is then suitable to control specific charged carries. By using a proper material of the hole blocking layer an improvement of the blue light spectra and the luminous efficiency has been done [57]. If using the transport layers as the emitting layer, the placement of the recombination zone is critical. A minimal distance is optimal consider-ing radiation, but a too short distance from the cathode would cause quenching of the excitons and consequently reduce the emitted light [58]. According to the attempt to block the hole-polarons, quenching is also probable, since the charged carriers have a possibility to cluster at the hole blocking layer. Electron Transport Layer (ETL) The ETL is an n-type doped organic material that transports the electron-polarons. An effective material has a low LUMO and a high ionisation potential. The ETL needs to become good matched with the HTL to accomplish equilibrium of the amount of charged carriers in the EML. To improve the efficiency of the electron transport, most hosts are doped with fluorescent molecules. This will lead to an enhancement of the mobility of the charge carriers, a higher probability to recombine and better achievement of colour and luminance of the emitted light. It has been proposed that phosphorescent molecules, e.g. iridium (Ir) and Pt, allow a better external quantum efficiency compared to fluores-cent, which have lower internal quantum efficiency (2.3.4). The organic metal complex hydroxyquinoline aluminium (Alq) has been studied since the first OLED experiments. The compound provides several important advantages compared to other metallic based chelates and is because of that the most used organic material in small molecules OLED. Especially the compound-relative Alq3 (figure A.10) with its high molecular symmetry holds high quantum efficiency and is further advanta-geous in the fabrication process and enables a production of thin and smooth layers [12]. It also verifies a good stability at different temperatures and is possible to deposit on diverse substrates. Because of the property of high mobility of electron-polarons compared to hole-polarons, Alq3 is often used as n-type material in ETL in multi-layered and stacked OLED. Other classes of organic materials prove similar efficiency of the emission of blue light compared to Alq-based chelates. For example the boron (B)-ligands that are more covalent compared to aluminium, which will lead to more stability in a compound. This fact could make the boron-atom more attractive to use in lumines-cent materials [12]. As in the HTL, a conjugated polymer material such as derivatives of the PPV could be used in the ETL. Electron Injection Layer (EIL) As for the holes, an organic injection layer for the electrons EIL is used to help the electrons from the cathode to the ETL. An example of host material in the EIL is Alq3. For a high mobility, a high HOMO and low LUMO is required. An improvement of the conductivity of the layer could be through doping the host with low-work function metal or with reactive metal [12]. Better transports of the charged carriers accomplish a lower required electrical field, which leads to a more power efficient OLED device. Conse-quently the amount of developed heat is reduced which could lead to a device with a better lifetime.
______________________________________________________________________________________
- 73 -
Cathode The cathode is a low-work function ΦC metal and widely used materials are the metals calcium (Ca) and magnesium (Mg). Aluminium (Ag) is often used to cover the electrode to prevent oxidation. An effective cathode produces a large amount of electrons and has in a down-emitting device also a function to reflect the emitted light. The choice of material has a purpose to minimise the barrier ∆Ee between the electrode and the adjacent organic layer. It is possible to use the same electrodes for the two approaches, with a higher cost of efficiency. A suggestion to replace the metal with ITO and an underlying protection layer has been made, which gives the device a better performance [24]. The choice of an effective material for the production of the negatively charged is considered critical. The adjacent organic layer is considered to possess similar magnitude of the electron affinity χ as the difference in work function of the low-work function cathode (figure A.9) [50]. Improvements of the efficiency of the cathode are therefore needed and are an area of research.
______________________________________________________________________________________
- 74 -

Appendix B - Definitions and equations B.1 Derivation of the wavelength The colour of the emitted light is dependent on the energy of the photons and connection could be studied in equation B.1.
λhchvE == Jsh 341063.6 −×=
smc /103 8×=
Equation B.1 Electromagnetic energy formula due to the wavelength of light. The relationship between is shown in equation B.1, where E is the electromagnetic energy in joule J, h Plank’s constant in Js, is the frequency in hertz (Hz), c is the speed of light in m/s and
vλ the wavelength of light in nm.
B.2 Definition CIE Chromaticity co-ordinates B.2.1 1931 (x, y) - CIE Chromaticity values The tristimulus values X, Y, Z, which are needed before calculating CIE (x,y) values, are calculated according to equation B.2.
∫=nm
nm
dxSkX830
360
)()( λλλ ∫=nm
nm
dzSkZ830
360
)()( λλλ ∫=nm
nm
dySkY830
360
)()( λλλ
∫= nm
nm
dySk 830
360
)()(
100
λλλ
Equation B.3 The formulas for the derivation of the tristimulus values.
The equation B.3 shows the derivation of tristimulus values, where X is the wavelength integral of a measured illumination spectral density )(λS weighted by the visual sensitivity curve )(λx of the and multiplied with a constant k that is calculated for Y=100. The range of the integral is the relevant part of the spectra. The (x, y) chromaticity co-ordinates are derived from the equation B.2.
ZYX
Xx++
=ZYX
Yy++
=ZYX
Zz++
=
Equation B.2 The derivation of CIE 1931 co-ordinates from the tristimulus values X, Y and Z.
______________________________________________________________________________________
- 75 -

B.2.2 1976 (u’, v’) - Uniformity Chromaticity Scale Through linear operations the tristimulus values are transformed into a new colour space. The transformations are according to the following formulas:
ZYXXu
3154
++=′
ZYXYv
3159
++=′
Equation B.4 The derivation of the CIE 1976 chromaticity co-ordinates from the tristimulus values X, Y
and Z. B.2.3 Definition of the reference illuminant E (white point) The white point E, identified as D65, is defined as the stimulus value with equal energy:
)(λS = 1 (luminous flux equation definition properties). The defined (x,y) co-ordinates in the CIE 1931 are (0,33; 0,33) according to figure B.1. B.2.4 Definition of dominating wavelength The dominating wavelength (nm) is the wavelength calculated from the reference illuminant, in this case E, and through the measured colour and towards the colour space boundary (figure B.1). B.2.5 Definition of excitation purity The excitation purity is analogous with the saturation of a measured colour and is expressed in percentage (%). The quantity is defined as the distance from the reference illuminant, in this case E, to the measured colour co-ordinates divided by the distance from reference illuminant to the boundary of the colour space, multiplied with 100.
520 nm
Figure B.1 The defini
____________________________________
Reference Illuminant point E CIE (x,y)
570
tions express
___________
- 76 -
Measured colour CIE (x, y)
)
nm
ed in a
______
Dominating wavelength (nm
620 nm
CIE 1931 chromaticity diagram.
_________________________________

Appendix C - Additional figures
Figure C.1 Colour gamut at different angles on the eMagin OLED shown in the CIE 76 diagram.
Horizontal Luminance Values
0
20
40
60
80
100
120
-80 -60 -40 -20 0 20 40 60 80
Angle in degrees
cd/m
2
WhiteRedGreenBlue
Figure C.2 Luminance values at different angles for white and the three primary colours measured on the
eMagin OLED.
______________________________________________________________________________________
- 77 -

Figure C.3 The periodic system
______________________________________________________________________________________
- 78 -
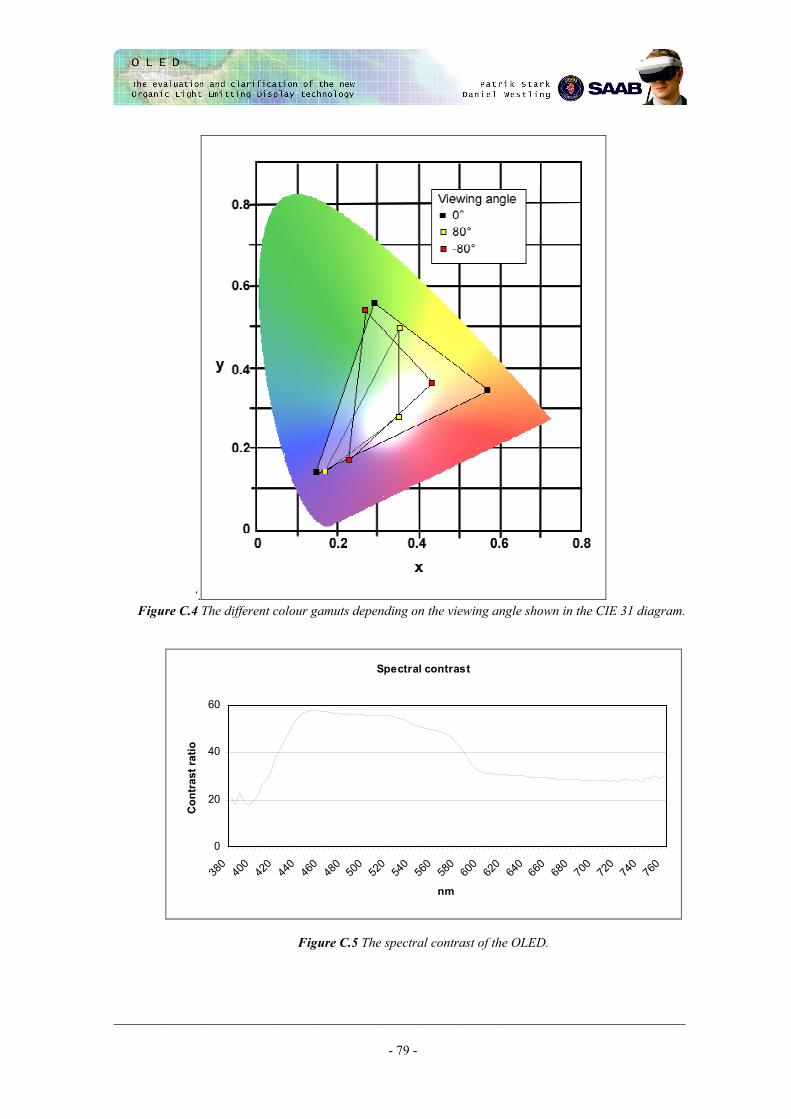
‘. Figure C.4 The different colour gamuts depending on the viewing angle shown in the CIE 31 diagram.
Spectral contrast
0
20
40
60
380
400
420
440
460
480
500
520
540
560
580
600
620
640
660
680
700
720
740
760
nm
Con
tras
t rat
io
Figure C.5 The spectral contrast of the OLED.
______________________________________________________________________________________
- 79 -

Appendix D - Abbreviations
CIE - Commission Internationale de l'Eclairage CRT - Cathode Ray Tube EIL - Electron Injection Layer EL - Electroluminescence ETL - Electron Transport Layer FELCD - Ferroelectric LCD FOLED - Flexible OLED HIL - Hole Injection Layer HMD - Head Mounted Display HOMO - Highest Occupied Molecular Orbital HTL - Hole Transport Layer IC - Integrated Circuit ITO - Indium Tin Oxide LCD - Liquid Crystal Display LCOS - Liquid Crystal On Silicon LED - Light Emitting Diode LEP - Light Emitting Polymer LUMO - Lowest Unoccupied Molecular Orbital OEL - Organic Electroluminescence OLED - Organic Light Emitting Display PDA - Personal Digital Assistant PLED - Polymer Light Emitting Diode QVGA - Quarter VGA 320x240 pixels RGB - Red, Green and Blue colour representation SOLED - Stacked OLED STN - Super Twisted Nematic SVGA - Super VGA 800x600 pixels SXGA - Super XGA 1280x1024 pixels TN - Twisted Nematic TOLED - Transparent OLED UXGA - Ultra XGA 1600x1200 pixels VGA - Video Graphics Array 640x480 pixels XGA - eXtended Graphics Array 1024x768 pixels
______________________________________________________________________________________
- 80 -