olympic games & tourism: the greek experience mr. georgios drakopoulos director general, sete -...
TRANSCRIPT

Olympic Games & Tourism: The Greek Experience
Mr. Georgios DrakopoulosDirector General, SETE - Association of Greek Tourism Enterprises
Vice Chairman, UNWTO Affiliate Members
International Tourism ConferenceTourism as Inducer of Development, Social Inclusion and Regional Integration
28 and 29 November 2011, Fortaleza, Brazil

•Hosting the Olympic Games -Communication issues•Media interest•Capacity•Readiness•Safety & Security•Hotel prices•Destination overload
•New tourism policy
•Greek tourism today
•Recommendations
Contents

Rio 2016 121st IOC Session, Copenhagen, 2 October 2009
Round 1 2 3
Rio de Janeiro 26 46 66
Madrid 28 29 32
Tokyo 22 20
Chicago 18

Pre Games Period
•Increased media interest
•Organizing issues Capacity?
Readiness?Safety & Security?
Hosting the Olympic Games - Communication issues
Year of the GamesFears for:
•Price increases •Very busy at destination

Mass media exposure
1997 2007GR
2009 2016 2019BR
2004

Mass media content focus
1997 2004 2007
2009 2016 2019BR
GR
General information
Infrastructure,Safety…
Olympic Games
Tourist information
Overload,Prices…

Capacity
Sports venues needed 33
Non-sport venues needed 13
Total 46
Existing 12
New 34
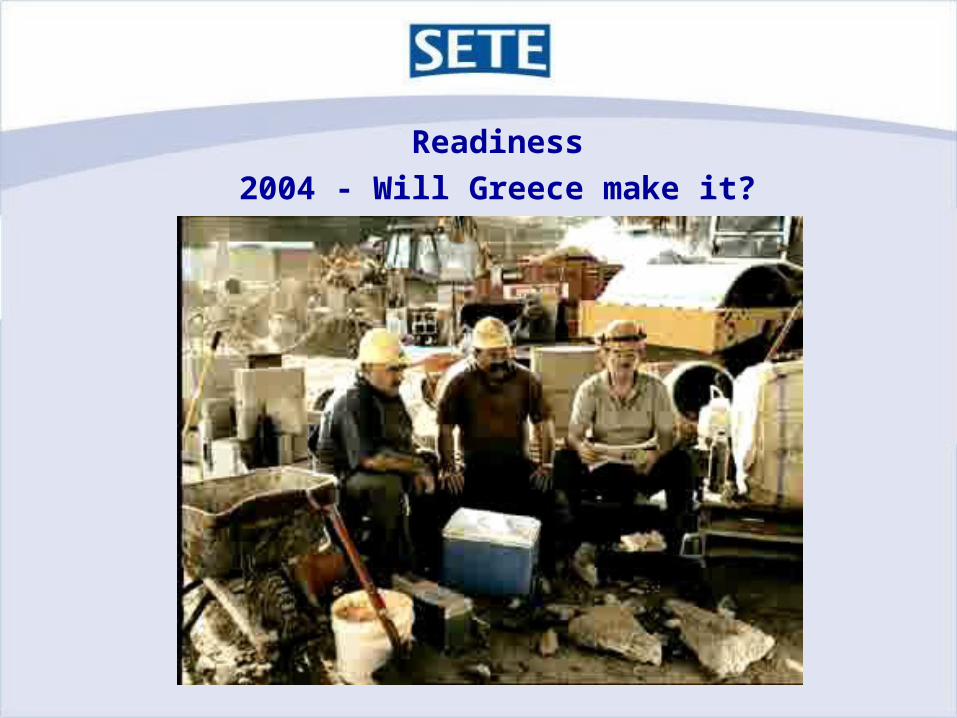
Readiness
2004 - Will Greece make it?

March 2004, 5 months before the Games
Greece has a new government
Please remind me when is the starting date of the Games?
1st meeting of the cabinet…PM asks the Sports and Culture Minister (SCM):
13th of August!
Oh! It is tomorrow! And we have so many projects pending! The opening ceremony is in the morning or in the evening?
Fantastic! Plenty of time! The projects will be ready!
Late in the evening Mr. PM, 21:30.
PMSCM

Safety
By the 1980s, violence and crime plagued the country, and Rio was perceived as the sort of place where walking down the street was asking for a mugging. Cariocas began to fear for the future of their city.
Rio remains a deeply, deeply disturbing place. Three million of the city's 14 million live in favelas, beyond government control, under the medieval-style governance of drug lords. In 2008, there were some 5,000 murders.

Security
•C4I,CCTV, GIS…65 interrelated systems
•Cost: €650 mi.
•Security staff: 41.000
•205 special security trainings
•11 operational readiness exercises

Prices increase?Athens hotels (3* to 5*)

Very busy at the destination?Athens hotels (3* to 5*)

Very busy at the destination?Athens hotels (3* to 5*)

Year Arrivals %
Receipts
mi. €%
2003 12.468.411 9.495,30
2004 11.735.556 -5,88% 10.347,80 8,98%
2004 - Greek Tourism Performance

2004 - Greece: European football champion


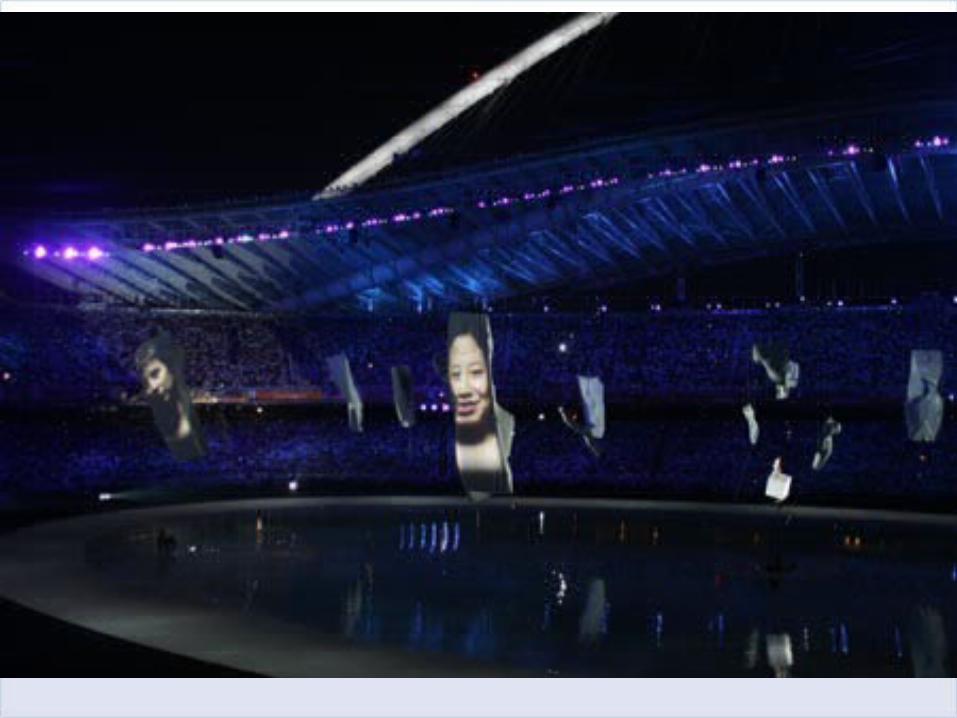


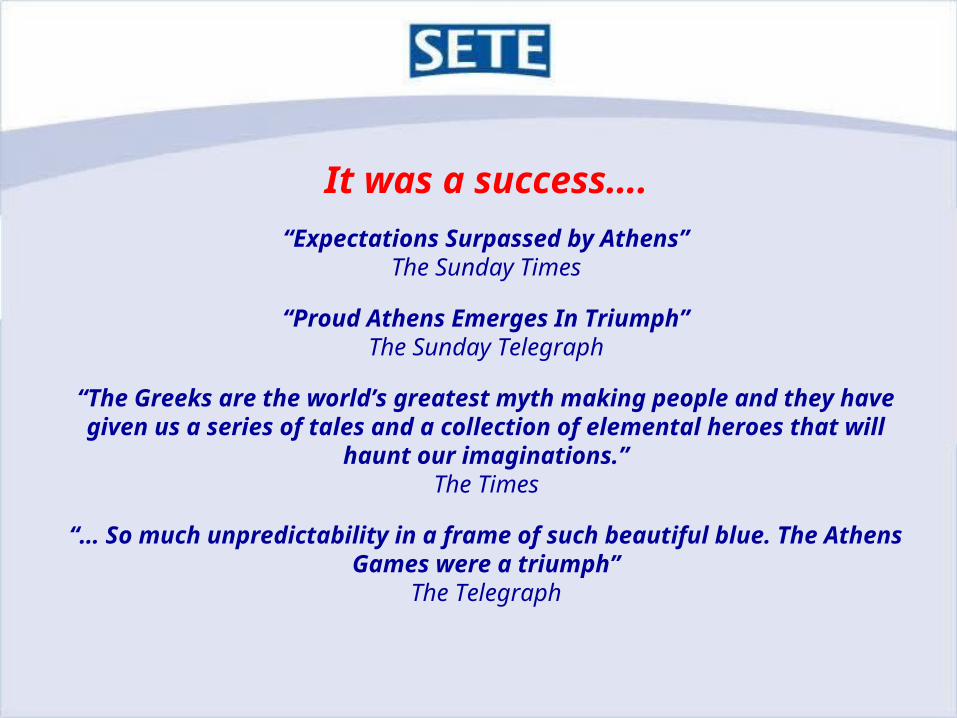
It was a success….
“Expectations Surpassed by Athens”The Sunday Times
“Proud Athens Emerges In Triumph”The Sunday Telegraph
“The Greeks are the world’s greatest myth making people and they have given us a series of tales and a collection of elemental heroes that will haunt our imaginations.”
The Times
“… So much unpredictability in a frame of such beautiful blue. The Athens Games were a triumph”The Telegraph
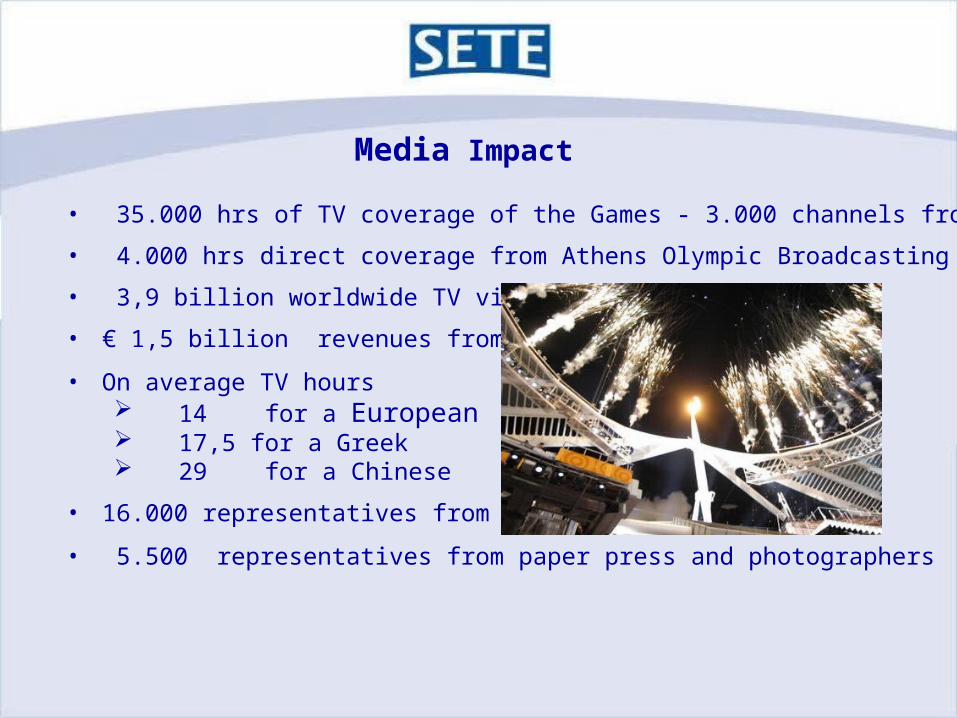
Media Impact
• 35.000 hrs of TV coverage of the Games - 3.000 channels from 203 countries
• 4.000 hrs direct coverage from Athens Olympic Broadcasting
• 3,9 billion worldwide TV viewers
• € 1,5 billion revenues from TV
• On average TV hours 14 for a European 17,5 for a Greek 29 for a Chinese
• 16.000 representatives from radio
• 5.500 representatives from paper press and photographers

Greek brand: 5 yrs ahead
Increase in visits & exports
New patterns for tourismUrban improvementCreation of new attractionsNew attitude of the operatorsStructuring efficient management
More impact

Greece as a tourist destination
???

Olympic Games and Evolution of Awareness
100%
25%
Olympic Games Year
1 2 Year-1 3
Awareness of the brand

New Policies
• Product
• Marketing
• Branding
• Communication
Short term long term
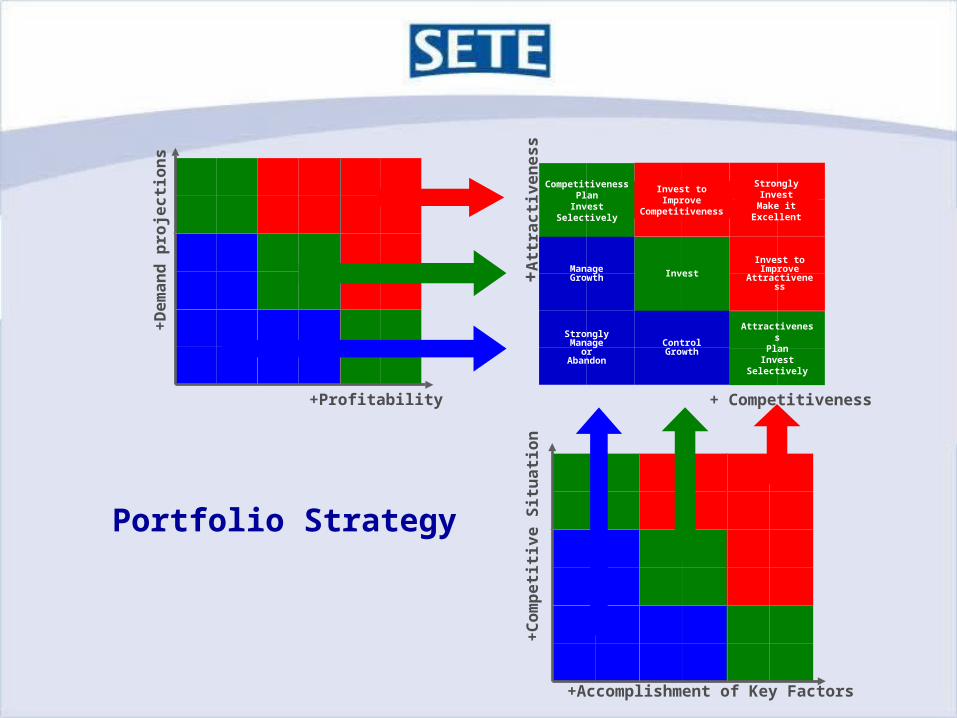
+Accomplishment of Key Factors
+Com
petit
ive
Situ
atio
n
+Dem
and
proj
ectio
ns
+Profitability
Strongly InvestMake it
Excellent
Invest to ImproveCompetitiveness
Invest to ImproveAttractiveness
Competitiveness Plan
Invest Selectively
Invest
AttractivenessPlan
Invest Selectively
Manage Growth
Control Growth
Strongly Manage or Abandon
+Attr
activ
enes
s
+ Competitiveness
Portfolio Strategy

Sea & Sun
Wellness Tourism
Touring
City Breaks
Conference
Nautical
Countryside
Cultural
Gastronomy
9 Product - Specific Marketing Plans

Greek tourism - Post Olympic Results
Arrivals %Receipts (mi. €) %
2004 11.735.556 -5,88% 10.347,80 8,98%
2005 12.902.048 9,94% 10.729,50 3,69%
2006 13.993.371 8,46% 11.356,70 5,85%
2007 16.165.265 15,52% 11.319,20 -0,33%
2008 15.938.806 -1,40% 11.635,90 2,80%
2009 14.914.534 -6,43% 10.400,20 -10,62%
2010 15.007.490 0,62% 9.611,30 -7,59%
2011(est.) 16.500.000 9,95% 10.572,43 10,00%

Recommendations
Design Olympic Strategies
for 3 periods:
Olympic yearPre Olympic Post Olympic
Establish Olympic Unit
within EMBRATUR

Thank you for your attention
I wish you a fantastic Olympic experience!