omnia at a glance financial overview
TRANSCRIPT
Agriculture overview Mining overview
Chemicals overview Prospects
Omnia at a glance
Financial overview
AGENDA
Page 2
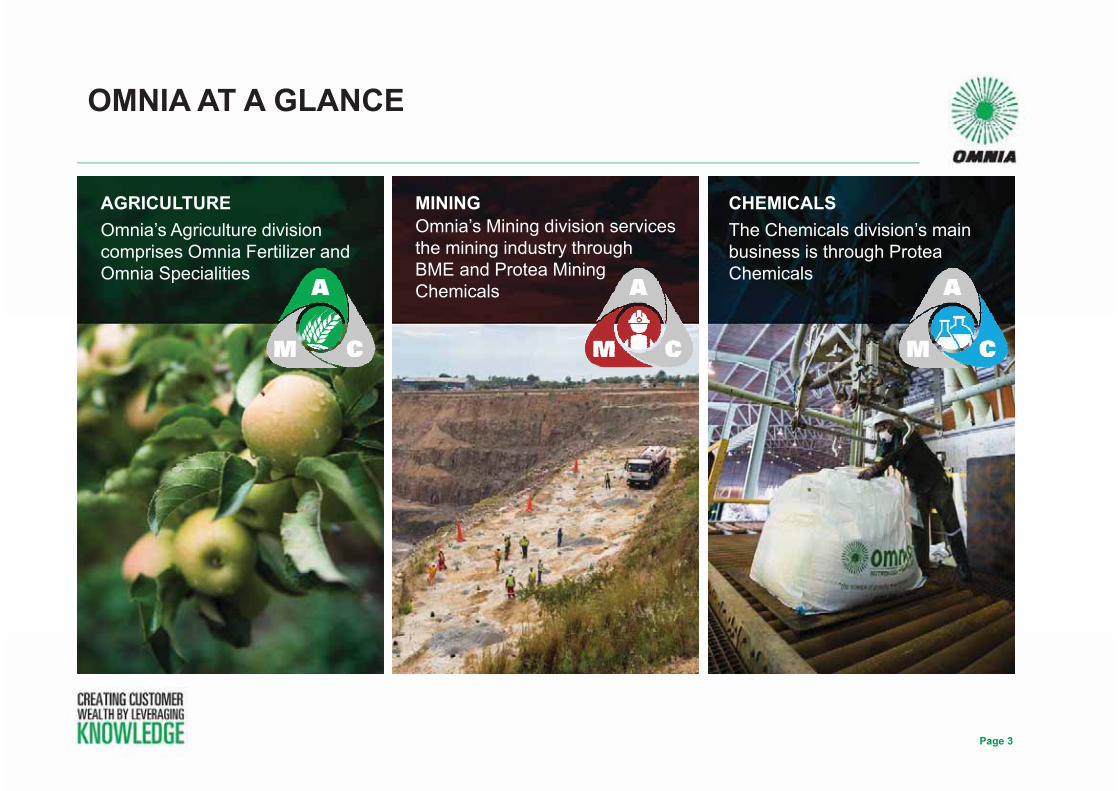
OMNIA AT A GLANCE
Page 3
AGRICULTUREOmnia’s Agriculture division comprises Omnia Fertilizer and Omnia Specialities
MININGOmnia’s Mining division services the mining industry through BME and Protea Mining Chemicals
CHEMICALSThe Chemicals division’s main business is through ProteaChemicals
Vision‘Creating customer wealth by leveraging knowledge’
Strategy• Providing specialised solutions to the agriculture, mining and chemicals markets• Focusing on unique market offerings that create value and, in so doing, earn a premium• Diversifying geographically beyond South Africa, primarily focused on Africa with a growing
presence in other international countries• Identifying and implementing strategic acquisitions to build on the strengths of each division• Improving on cost competitiveness across all divisions, particularly in the Chemicals division• Continuously improving on health, safety and environmental practices by following the guiding principles
of Responsible Care®
• Building a culturally diverse business that respects and promotes the rights of its people• Building a learning organisation• Leverage our intellectual property, systems and technology to create value for customers and shareholders
OUR VISION AND STRATEGY
Page 4

• We differentiate ourselves from othercommodity chemical suppliers by applyingour intellectual capital and technologies toall key points along our supply andservice chains
• This enables Omnia to create valuethroughout by tailoring our products andservices to the specific and changingneeds of our customers
• Our business model has been tried andtested over many years, and continues tobe fine-tuned as our markets andcustomers evolve
OUR VALUE PROPOSITION
Page 5
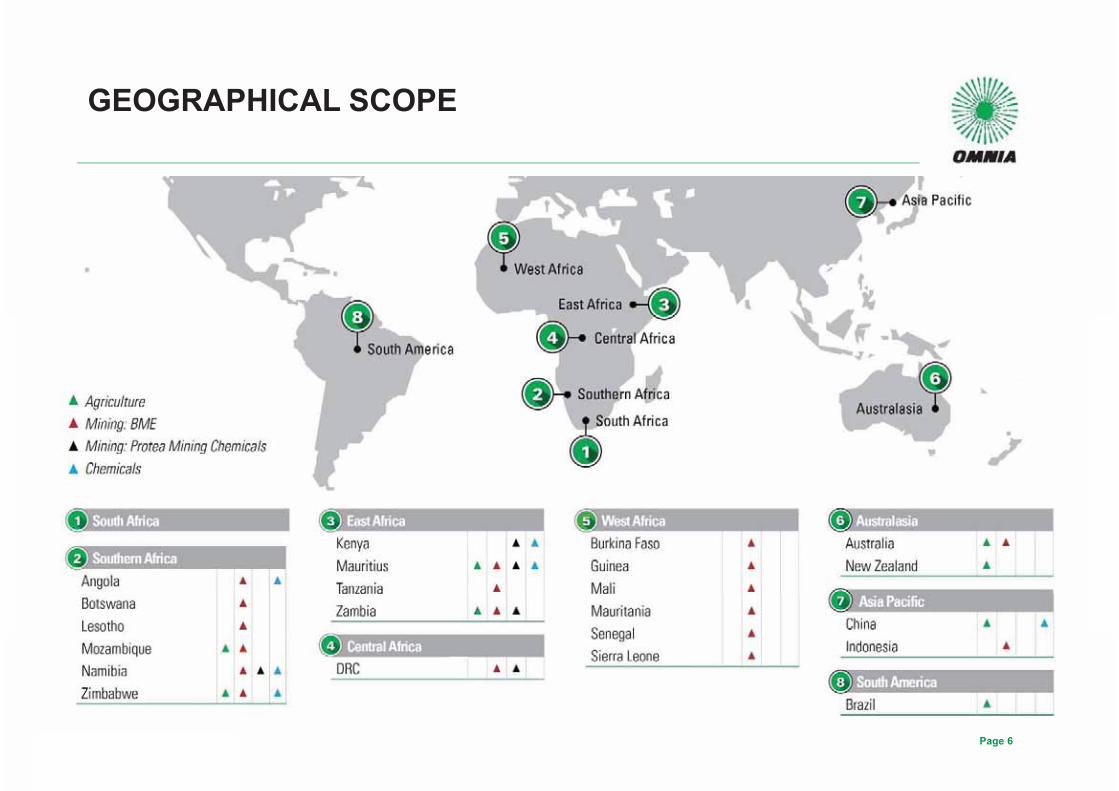
GEOGRAPHICAL SCOPE
Page 6
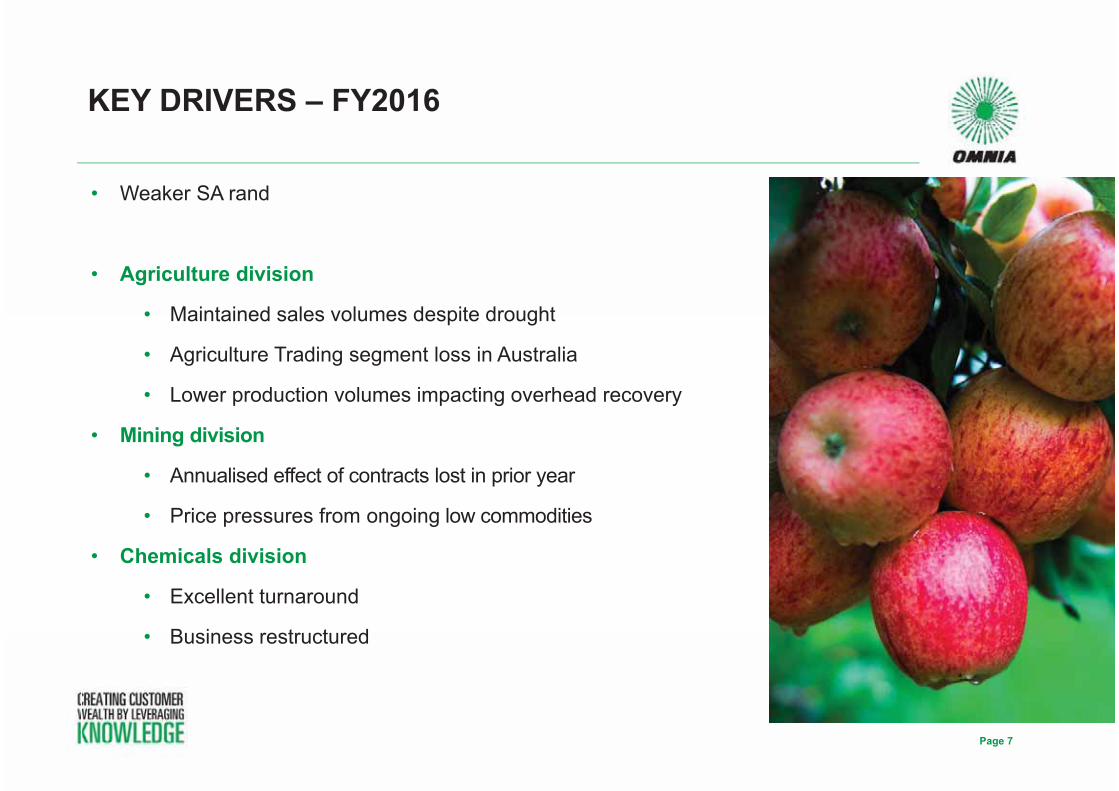
• Weaker SA rand
• Agriculture division
• Maintained sales volumes despite drought
• Agriculture Trading segment loss in Australia
• Lower production volumes impacting overhead recovery
• Mining division
• Annualised effect of contracts lost in prior year
• Price pressures from ongoing low commodities
• Chemicals division
• Excellent turnaround
• Business restructured
KEY DRIVERS – FY2016
Page 7
OVERVIEW OF RESULTS
Page 8
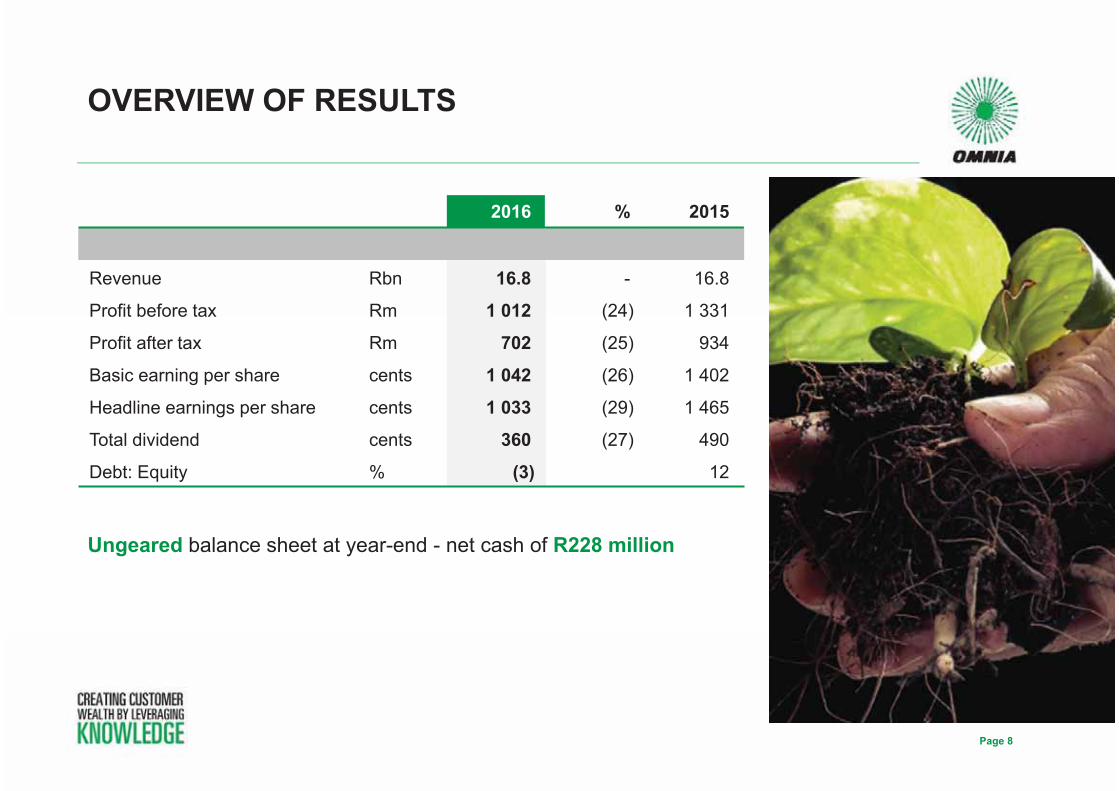
2016 % 2015
Revenue Rbn 16.8 - 16.8
Profit before tax Rm 1 012 (24) 1 331
Profit after tax Rm 702 (25) 934
Basic earning per share cents 1 042 (26) 1 402
Headline earnings per share cents 1 033 (29) 1 465
Total dividend cents 360 (27) 490
Debt: Equity % (3) 12
Ungeared balance sheet at year-end - net cash of R228 million

• Revenue remained flat at R16.8 billion
• Operating profit down 19% to R1 189 million
• Profit after tax of R702 million down 25%
• Cash generated from operations increased to R2.3 billion,up R1.3 billion year-on-year
• Headline earnings per share down 29% to 1 033 cents per share
• Credit rating affirmed in July 2015 as A- (long-term) and A1- (short-term), with a positive ratings outlook
• Safety - recordable case rate of 0.83 - below target of 1.0
OTHER KEY FEATURES
Page 9
AGRICULTURE OVERVIEW
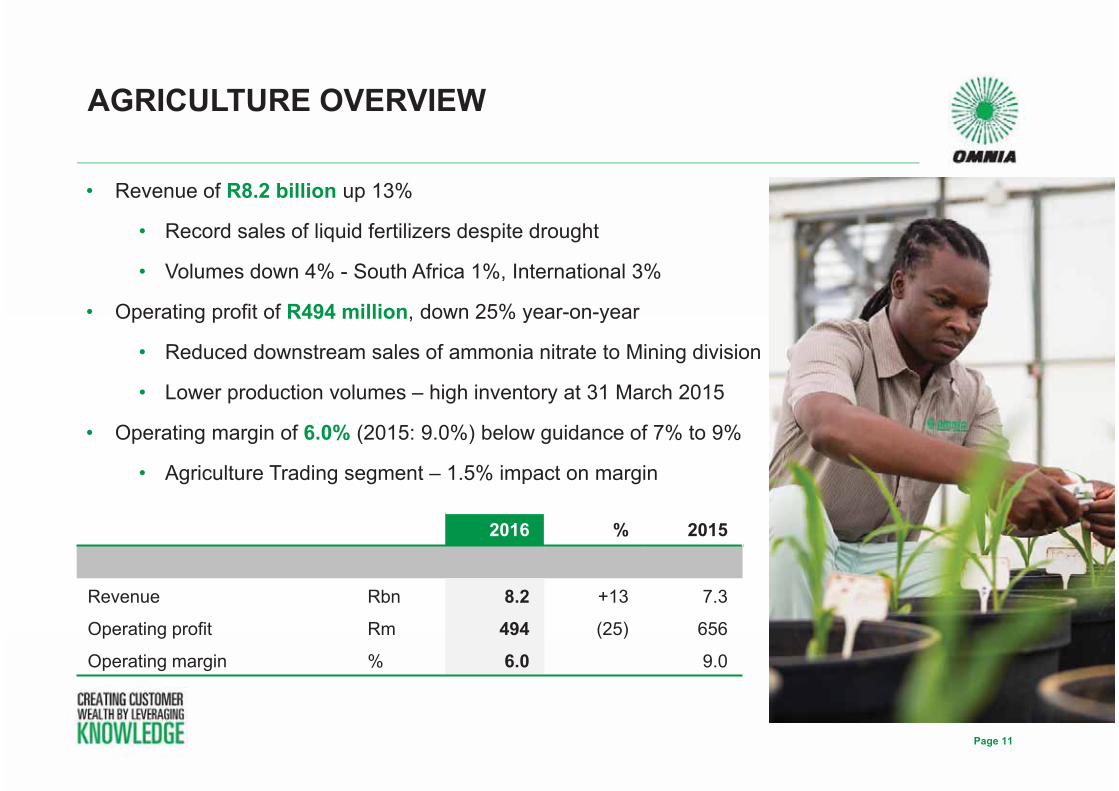
• Revenue of R8.2 billion up 13%
• Record sales of liquid fertilizers despite drought
• Volumes down 4% - South Africa 1%, International 3%
• Operating profit of R494 million, down 25% year-on-year
• Reduced downstream sales of ammonia nitrate to Mining division
• Lower production volumes – high inventory at 31 March 2015
• Operating margin of 6.0% (2015: 9.0%) below guidance of 7% to 9%
• Agriculture Trading segment – 1.5% impact on margin
AGRICULTURE OVERVIEW
Page 11
2016 % 2015
Revenue Rbn 8.2 +13 7.3
Operating profit Rm 494 (25) 656
Operating margin % 6.0 9.0
$ 0
$ 100
$ 200
$ 300
$ 400
$ 500
$ 600
$ 700
$ 0
$ 50
$ 100
$ 150
$ 200
$ 250
$ 300
$ 350
$ 400
Mar 2011 Mar 2012 Mar 2013 Mar 2014 Mar 2015 Mar 2016
Soya
Mai
ze a
nd W
heat
Maize Wheat Soya
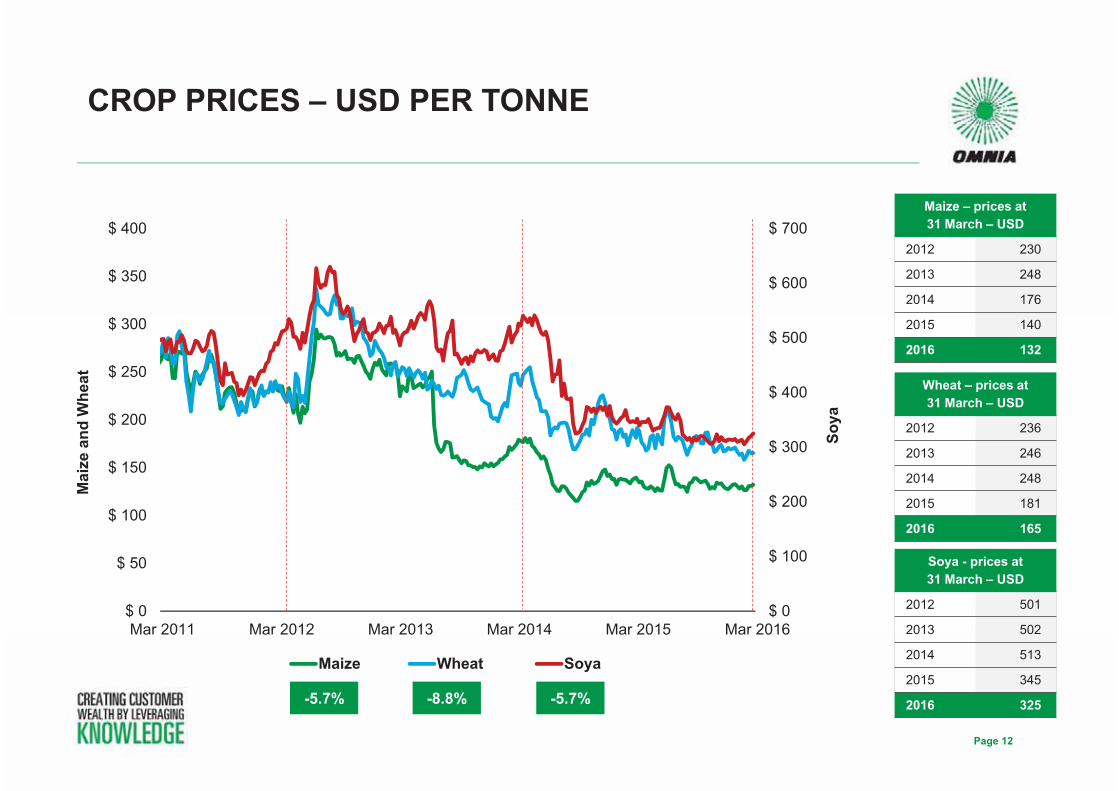
-5.7%-8.8%-5.7%
CROP PRICES – USD PER TONNE
Page 12
Maize – prices at 31 March – USD
2012 230
2013 248
2014 176
2015 140
2016 132
Wheat – prices at 31 March – USD
2012 236
2013 246
2014 248
2015 181
2016 165
Soya - prices at 31 March – USD
2012 501
2013 502
2014 513
2015 345
2016 325
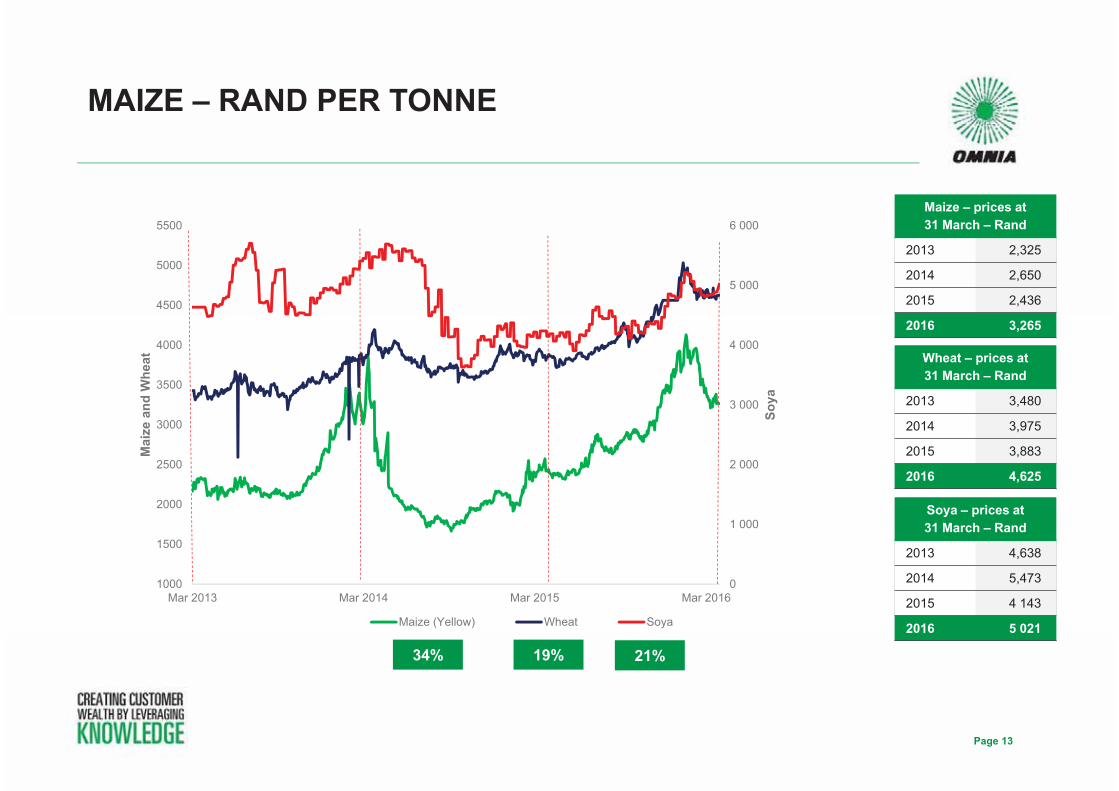
MAIZE – RAND PER TONNE
Page 13
19%
Maize – prices at 31 March – Rand
2013 2,325
2014 2,650
2015 2,436
2016 3,265
Wheat – prices at 31 March – Rand
2013 3,480
2014 3,975
2015 3,883
2016 4,625
Soya – prices at 31 March – Rand
2013 4,638
2014 5,473
2015 4 143
2016 5 021
21%34%
0
1 000
2 000
3 000
4 000
5 000
6 000
1000
1500
2000
2500
3000
3500
4000
4500
5000
5500
Mar 2013 Mar 2014 Mar 2015 Mar 2016
Soya
Mai
ze a
nd W
heat
Maize (Yellow) Wheat Soya
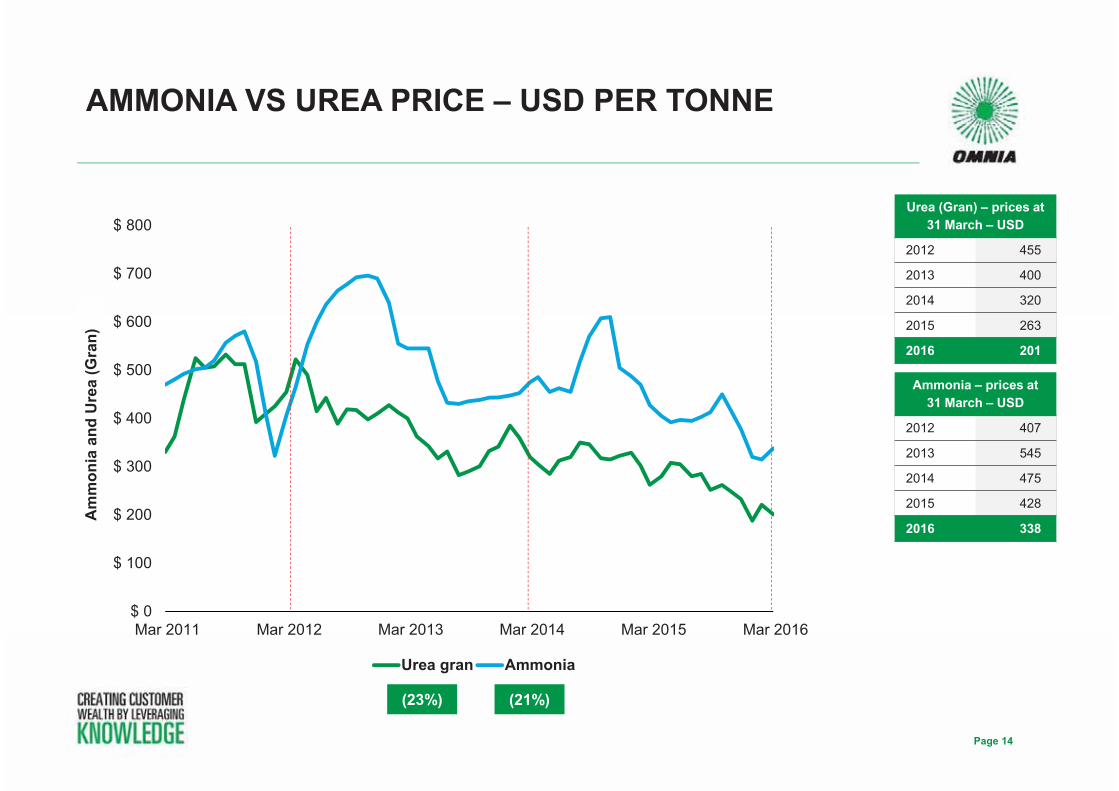
AMMONIA VS UREA PRICE – USD PER TONNE
Page 14
$ 0
$ 100
$ 200
$ 300
$ 400
$ 500
$ 600
$ 700
$ 800
Mar 2011 Mar 2012 Mar 2013 Mar 2014 Mar 2015 Mar 2016
Urea gran Ammonia
Urea (Gran) – prices at 31 March – USD
2012 455
2013 400
2014 320
2015 263
2016 201
Ammonia – prices at 31 March – USD
2012 407
2013 545
2014 475
2015 428
2016 338
(23%) (21%)
Am
mon
ia a
nd U
rea
(Gra
n)
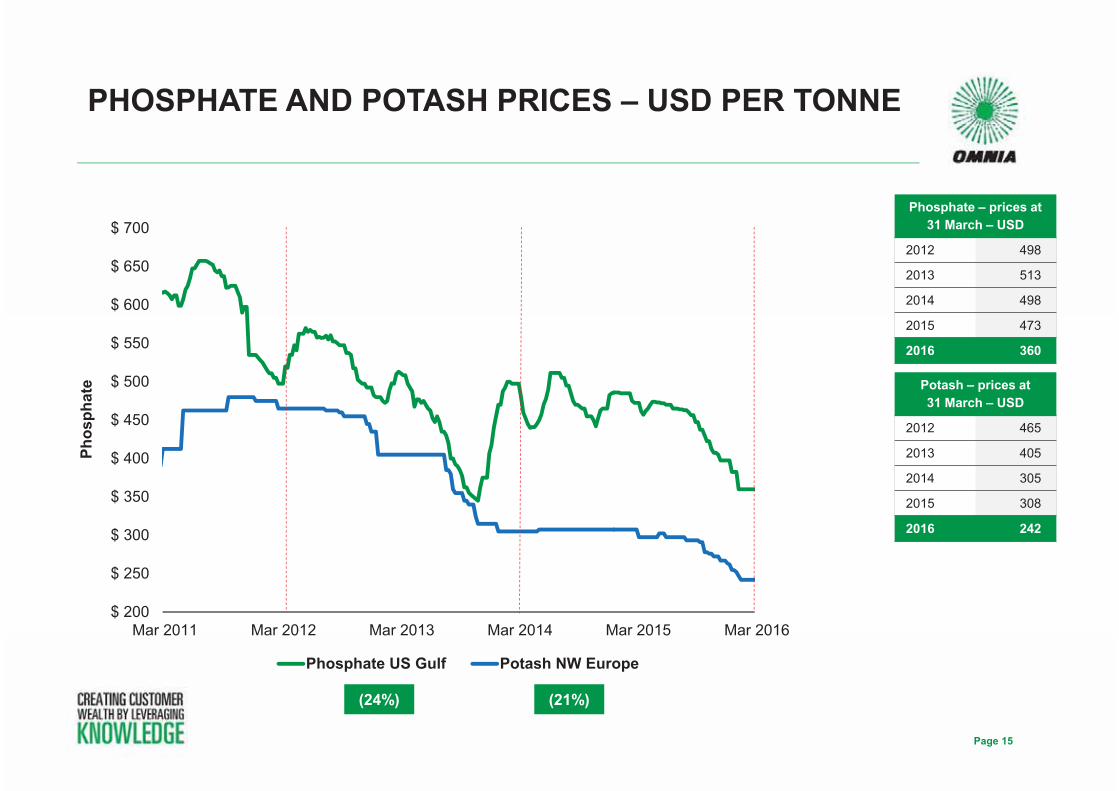
PHOSPHATE AND POTASH PRICES – USD PER TONNE
Page 15
$ 200
$ 250
$ 300
$ 350
$ 400
$ 450
$ 500
$ 550
$ 600
$ 650
$ 700
Mar 2011 Mar 2012 Mar 2013 Mar 2014 Mar 2015 Mar 2016
Phos
phat
e
Phosphate US Gulf Potash NW Europe
(24%) (21%)
Phosphate – prices at 31 March – USD
2012 498
2013 513
2014 498
2015 473
2016 360
Potash – prices at 31 March – USD
2012 465
2013 405
2014 305
2015 308
2016 242

SOUTH AFRICA RAINFALL
Page 16
Approximate mm rainfall per year
2009 620
2010 620
2011 660
2012 590
2013 580
2014 570
2015 403

SOUTH AFRICA RAINFALL: 403 MM IN 2015
Page 17
Annual total rain <500 mm per annum
Year mm
2015 403
1945 437
1992 440
2003 446
1935 451
1919 451
1965 452
1926 468
1916 476
1927 488
1912 493
1982 496
1941 496
13 years when the total rainfall for South Africa was less than 500 mm per annum
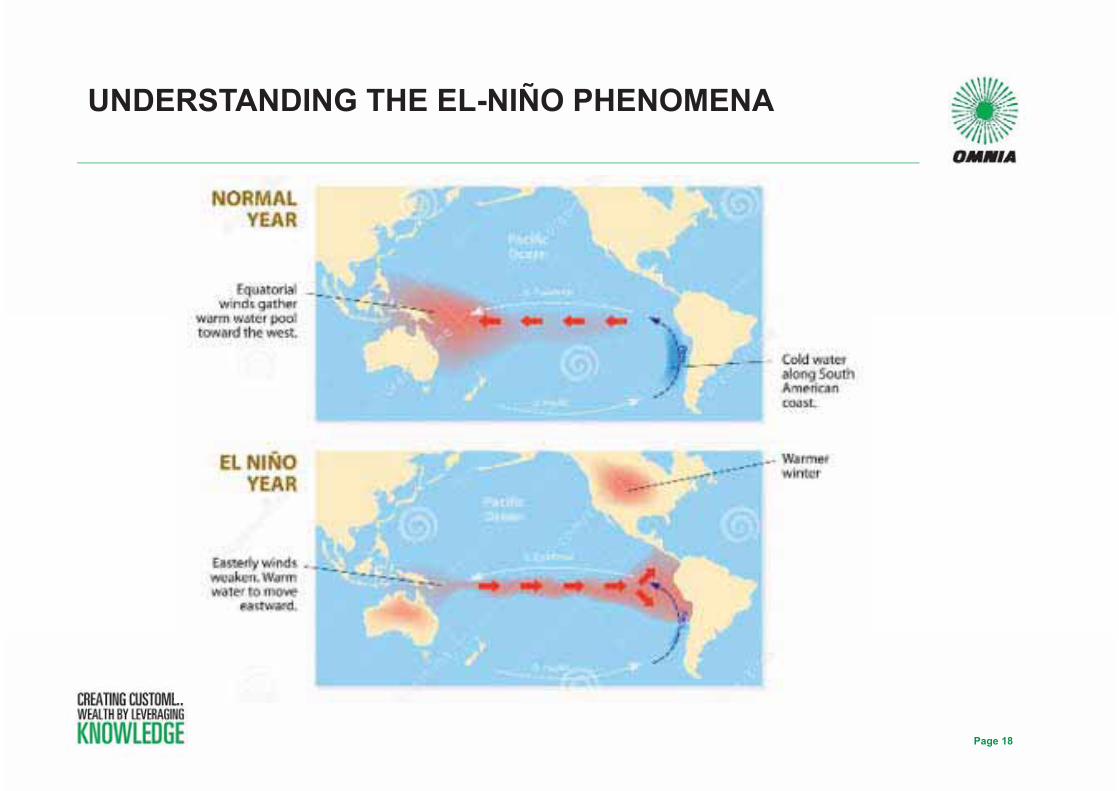
UNDERSTANDING THE EL-NIÑO PHENOMENA
Page 18

RSA - COMMERCIAL MAIZE PRODUCTION
Page 19
0
2
4
6
8
10
12
14
16
1995
/96
1996
/97
1997
/98
1998
/99
1999
/00
�200
0/01
�200
1/02
�200
2/03
�200
3/04
�200
4/05
�200
5/06
�200
6/07
�200
7/08
�200
8/09
�200
9/10
�201
0/11
�201
1/12
�201
2/13
�201
3/14
�201
4/15
2015
/16
Tons�produ
ced�(m
illions)
Production�year
El�Niño Neutral La�Niña
• El-Niño has a variable effect on crop production – currently dissipating• Start of La-Niña conditions predicted for 2016/2017
MINING OVERVIEW
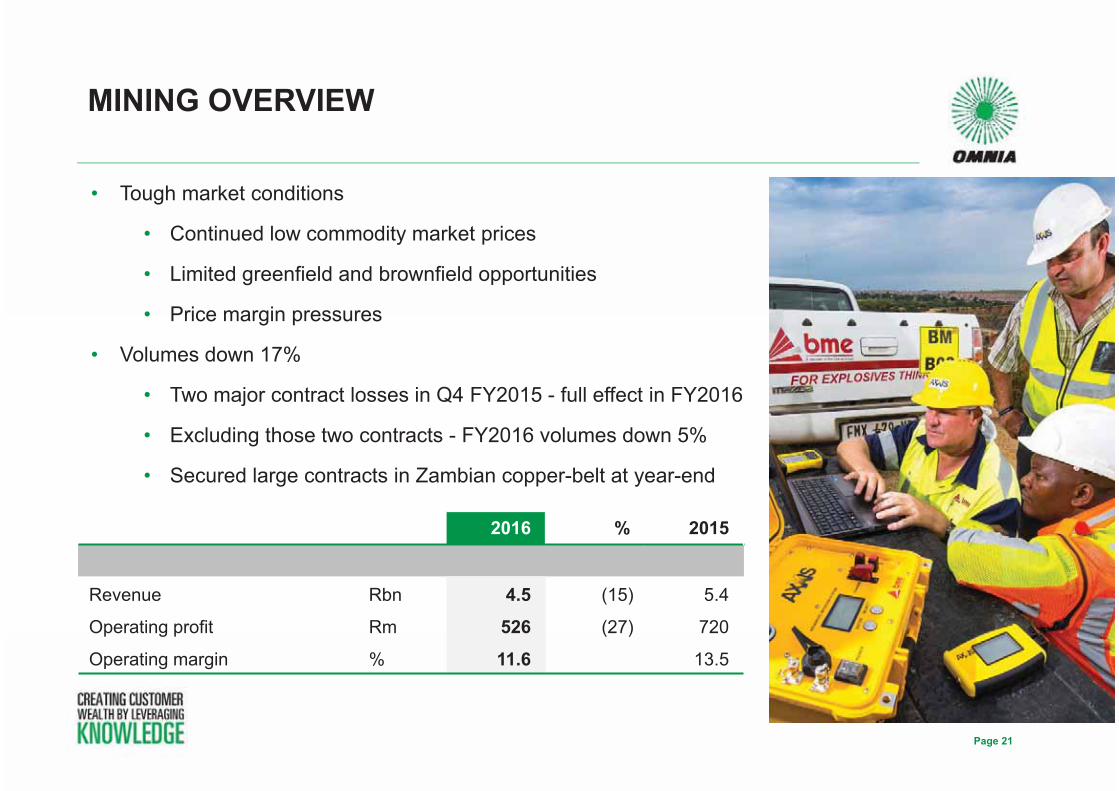
• Tough market conditions
• Continued low commodity market prices
• Limited greenfield and brownfield opportunities
• Price margin pressures
• Volumes down 17%
• Two major contract losses in Q4 FY2015 - full effect in FY2016
• Excluding those two contracts - FY2016 volumes down 5%
• Secured large contracts in Zambian copper-belt at year-end
MINING OVERVIEW
Page 21
2016 % 2015
Revenue Rbn 4.5 (15) 5.4
Operating profit Rm 526 (27) 720
Operating margin % 11.6 13.5
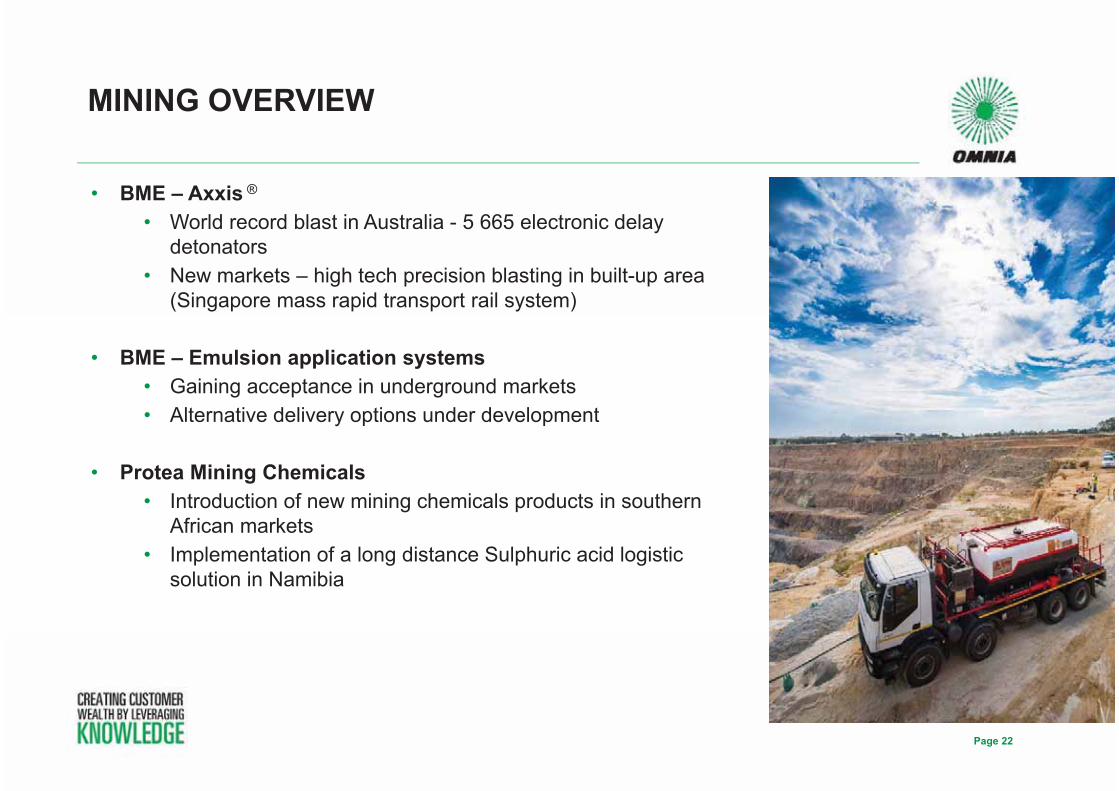
• BME – Axxis ®
• World record blast in Australia - 5 665 electronic delay detonators
• New markets – high tech precision blasting in built-up area (Singapore mass rapid transport rail system)
• BME – Emulsion application systems• Gaining acceptance in underground markets• Alternative delivery options under development
• Protea Mining Chemicals• Introduction of new mining chemicals products in southern
African markets• Implementation of a long distance Sulphuric acid logistic
solution in Namibia
MINING OVERVIEW
Page 22
Page 23
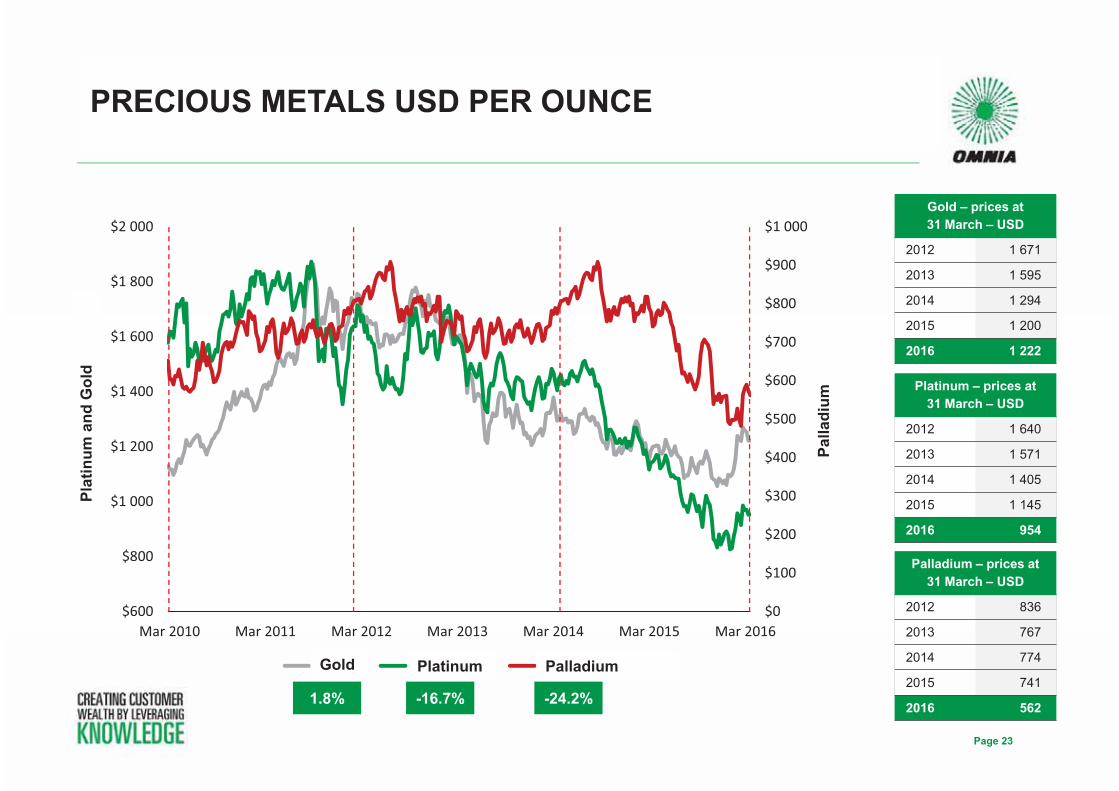
PRECIOUS METALS USD PER OUNCE
$0
$100
$200
$300
$400
$500
$600
$700
$800
$900
$1�000
$600
$800
$1�000
$1�200
$1�400
$1�600
$1�800
$2�000
�Mar�2010 �Mar�2011 �Mar�2012 �Mar�2013 �Mar�2014 �Mar�2015 �Mar�2016
Palladium
Platinum
�and
�Gold
GOLD PLATINUM PALLADIUM
Gold – prices at 31 March – USD
2012 1 671
2013 1 595
2014 1 294
2015 1 200
2016 1 222
Platinum – prices at 31 March – USD
2012 1 640
2013 1 571
2014 1 405
2015 1 145
2016 954
Palladium – prices at 31 March – USD
2012 836
2013 767
2014 774
2015 741
2016 5621.8% -16.7% -24.2%
PalladiumPlatinumGold
Plat
inum
and
Gol
d
Palla
dium
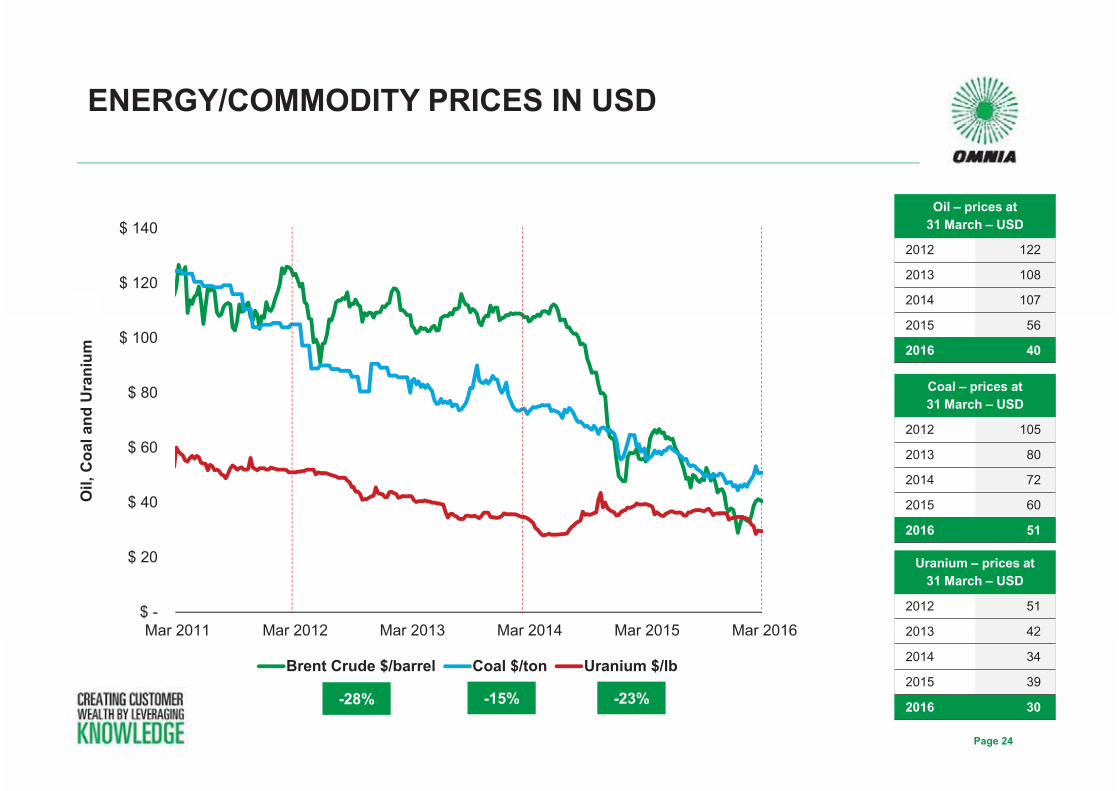
ENERGY/COMMODITY PRICES IN USD
Page 24
$ -
$ 20
$ 40
$ 60
$ 80
$ 100
$ 120
$ 140
Mar 2011 Mar 2012 Mar 2013 Mar 2014 Mar 2015 Mar 2016
Brent Crude $/barrel Coal $/ton Uranium $/lb
-23%
Oil – prices at 31 March – USD
2012 122
2013 108
2014 107
2015 56
2016 40
Coal – prices at 31 March – USD
2012 105
2013 80
2014 72
2015 60
2016 51
Uranium – prices at 31 March – USD
2012 51
2013 42
2014 34
2015 39
2016 30-28% -15%
Oil,
Coa
l and
Ura
nium

Page 25
METAL COMMODITY PRICES IN USD PER TONNE
$0
$20
$40
$60
$80
$100
$120
$140
$160
$180
$200
$0
$2�000
$4�000
$6�000
$8�000
$10�000
$12�000
Mar�2010 Mar�2011 Mar�2012 Mar�2013 Mar�2014 Mar�2015 Mar�2016
Iron�ore
Copp
er
COPPER IRON�ORE�CHINA
Copper – prices at 31 March – USD
2012 8 480
2013 7 469
2014 6 730
2015 6 105
2016 4 754
Iron ore – prices at 31 March – USD
2012 145
2013 140
2014 112
2015 57
2016 53
-22% -7%
Copper Iron ore China
Cop
per
Iron
ore

CHEMICALS OVERVIEW
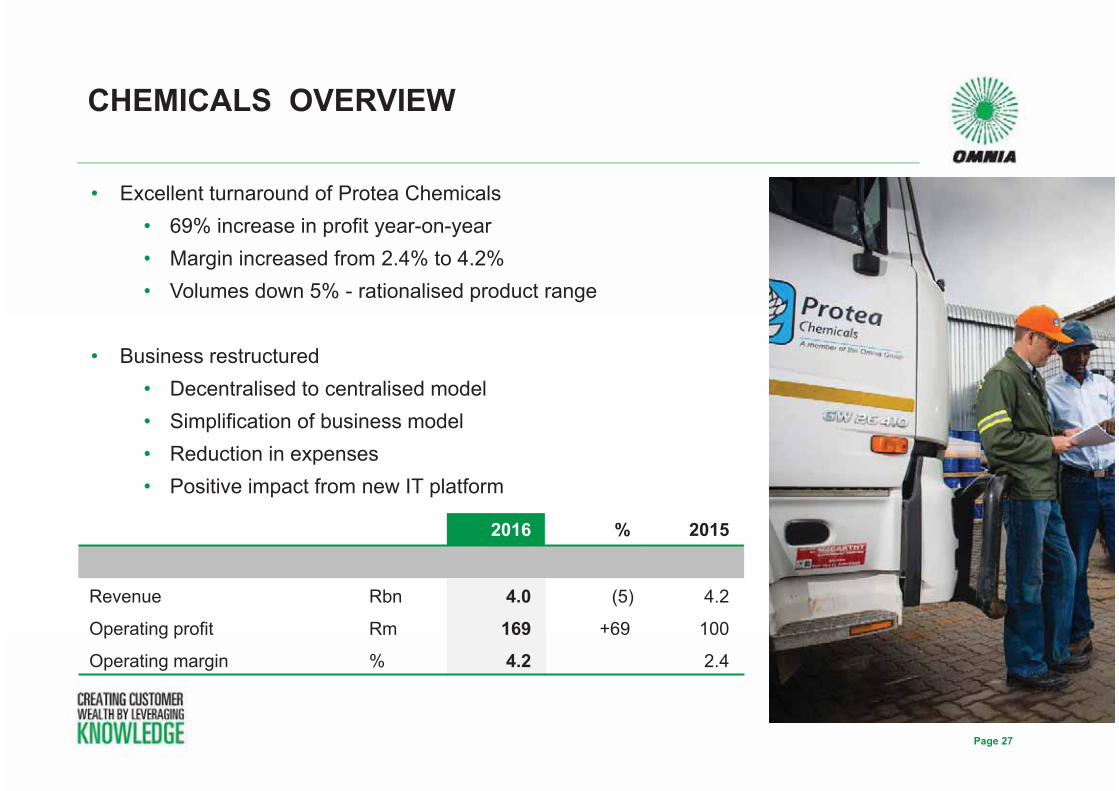
• Excellent turnaround of Protea Chemicals• 69% increase in profit year-on-year• Margin increased from 2.4% to 4.2% • Volumes down 5% - rationalised product range
• Business restructured • Decentralised to centralised model• Simplification of business model • Reduction in expenses• Positive impact from new IT platform
CHEMICALS OVERVIEW
Page 27
2016 % 2015
Revenue Rbn 4.0 (5) 4.2
Operating profit Rm 169 +69 100
Operating margin % 4.2 2.4
Page 28
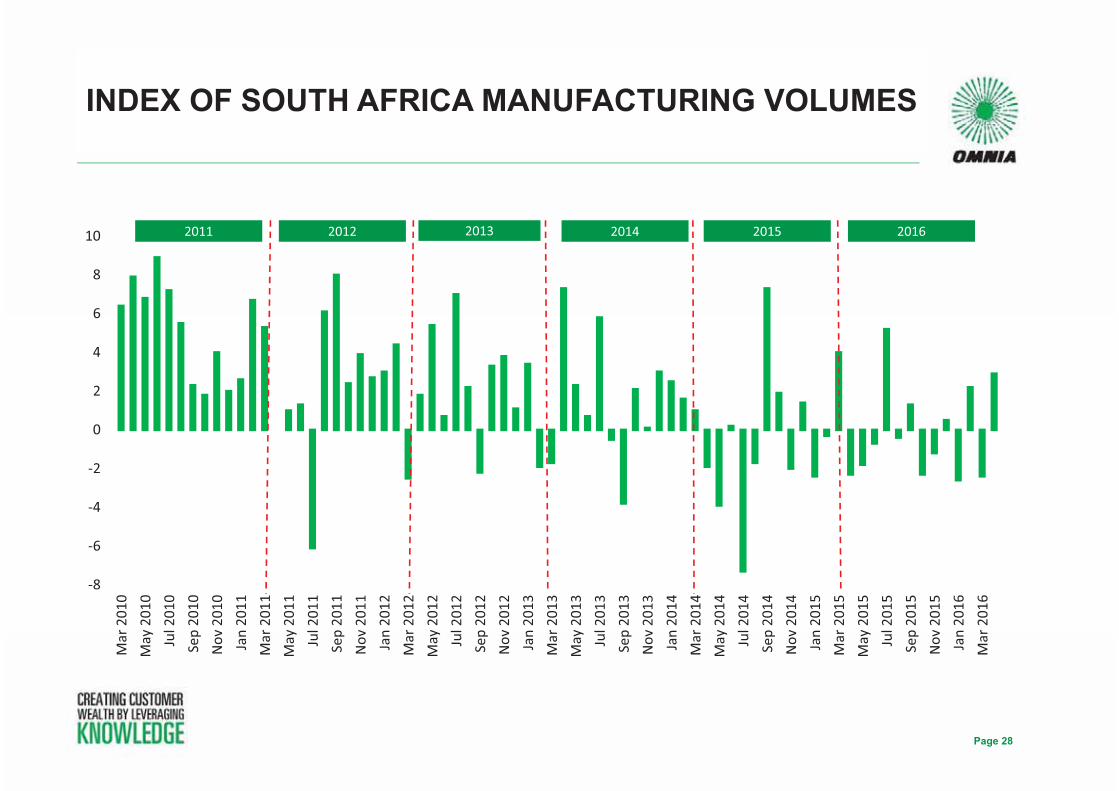
INDEX OF SOUTH AFRICA MANUFACTURING VOLUMES
�8
�6
�4
�2
0
2
4
6
8
10
Mar�201
0May�201
0Jul�201
0Sep�20
10Nov�201
0Jan�20
11Mar�201
1May�201
1Jul�201
1Sep�20
11Nov�201
1Jan�20
12Mar�201
2May�201
2Jul�201
2Sep�20
12Nov�201
2Jan�20
13Mar�201
3May�201
3Jul�201
3Sep�20
13Nov�201
3Jan�20
14Mar�201
4May�201
4Jul�201
4Sep�20
14Nov�201
4Jan�20
15Mar�201
5May�201
5Jul�201
5Sep�20
15Nov�201
5Jan�20
16Mar�201
6
2012 2013 2014 2015 20162011

• Low international commodity USD prices - especially oil-derived chemical prices
• SA rand prices remained flat – weakening of rand/dollar exchange rate offset lower USD prices
• Customer centric focus - improvements in product offering and service levels
• Improved logistics - rationalised warehouse and distribution expenses
CHEMICALS
Page 29
FINANCIAL OVERVIEW
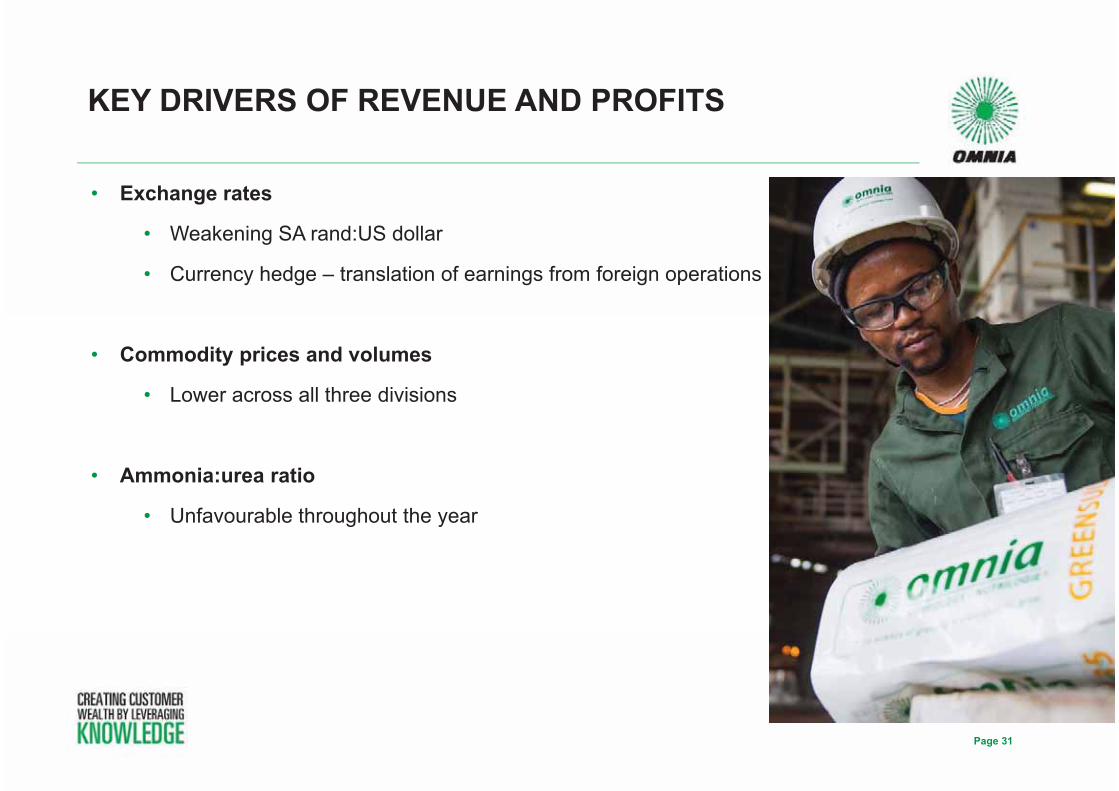
• Exchange rates
• Weakening SA rand:US dollar
• Currency hedge – translation of earnings from foreign operations
• Commodity prices and volumes
• Lower across all three divisions
• Ammonia:urea ratio
• Unfavourable throughout the year
KEY DRIVERS OF REVENUE AND PROFITS
Page 31
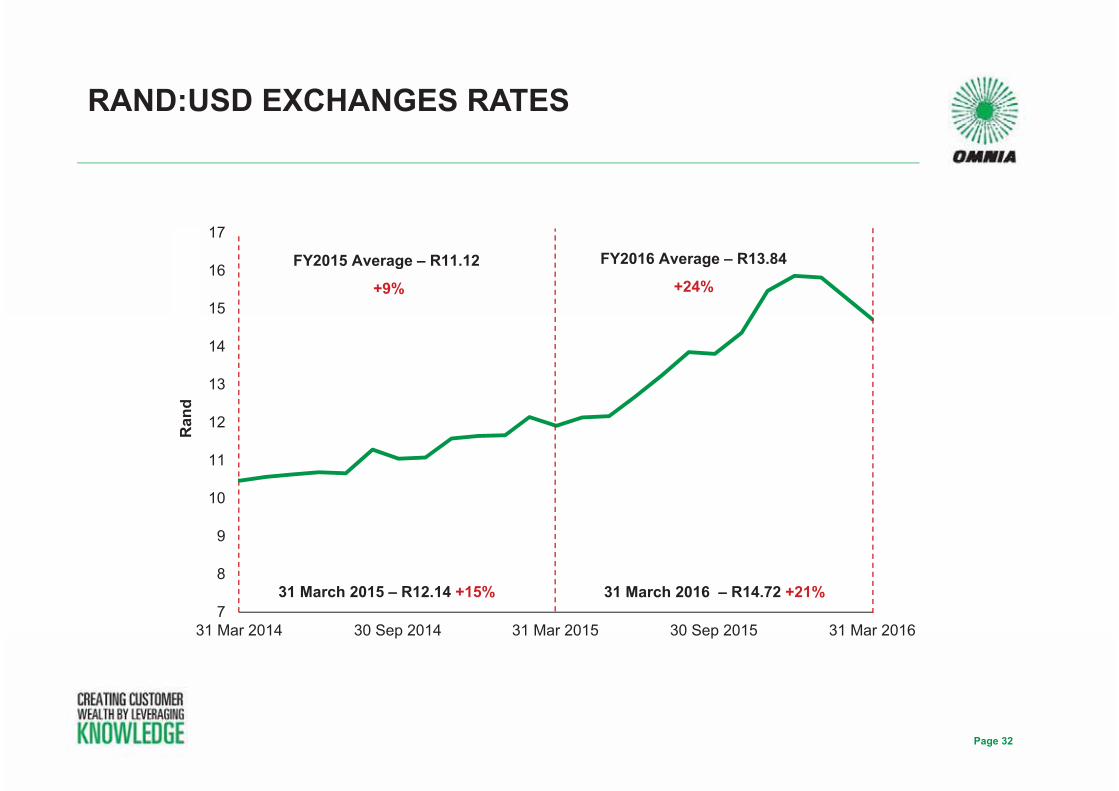
RAND:USD EXCHANGES RATES
Page 32
7
8
9
10
11
12
13
14
15
16
17
31 Mar 2014 30 Sep 2014 31 Mar 2015 30 Sep 2015 31 Mar 2016
FY2016 Average – R13.84
+24%FY2015 Average – R11.12
+9%
31 March 2015 – R12.14 +15% 31 March 2016 – R14.72 +21%
Ran
d

• Gross profit – Decrease in volumes, lower unit selling price and weakening exchange rate
• Distribution expenses – Decreased due to sales volumes resulting in lower distribution expenses
• Administrative expenses – Weaker rand: US dollar which affected costs of operations outside SA
• Other operating expenses – Foreign exchange loss of R53 million (2015: R59 million)
INCOME STATEMENT
Page 33
2016 % 2015
Revenue Rm 16 774 - 16 835Cost of sales Rm (13 369) +4 (12 898)Gross profit Rm 3 405 (14) 3 937Distribution expenses Rm (1 400) (8) (1 524)Administrative expenses Rm (802) (12) (907)Other operating expenses Rm (93) +3 (90)Other operating income Rm 79 +32 60Operating profit Rm 1 189 (19) 1 476Gross margin % 20.3 23.4Operating margin % 7.1 8.8
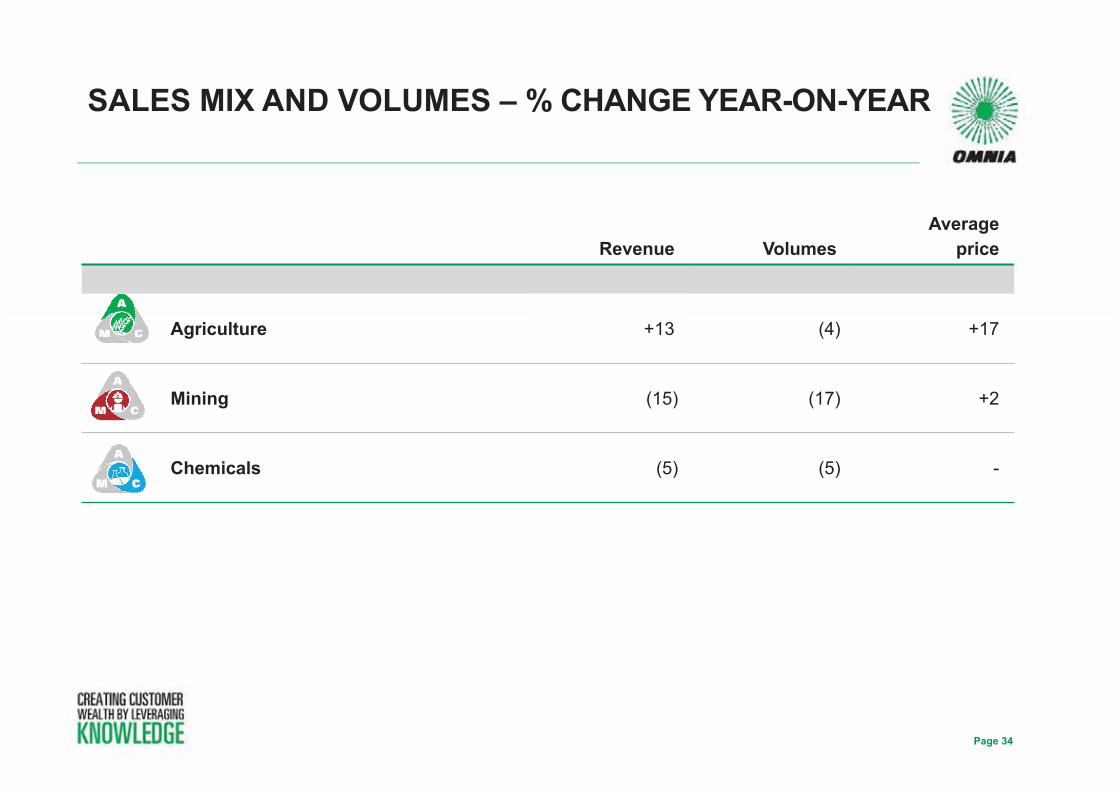
SALES MIX AND VOLUMES – % CHANGE YEAR-ON-YEAR
Page 34
Revenue VolumesAverage
price
Agriculture +13 (4) +17
Mining (15) (17) +2
Chemicals (5) (5) -
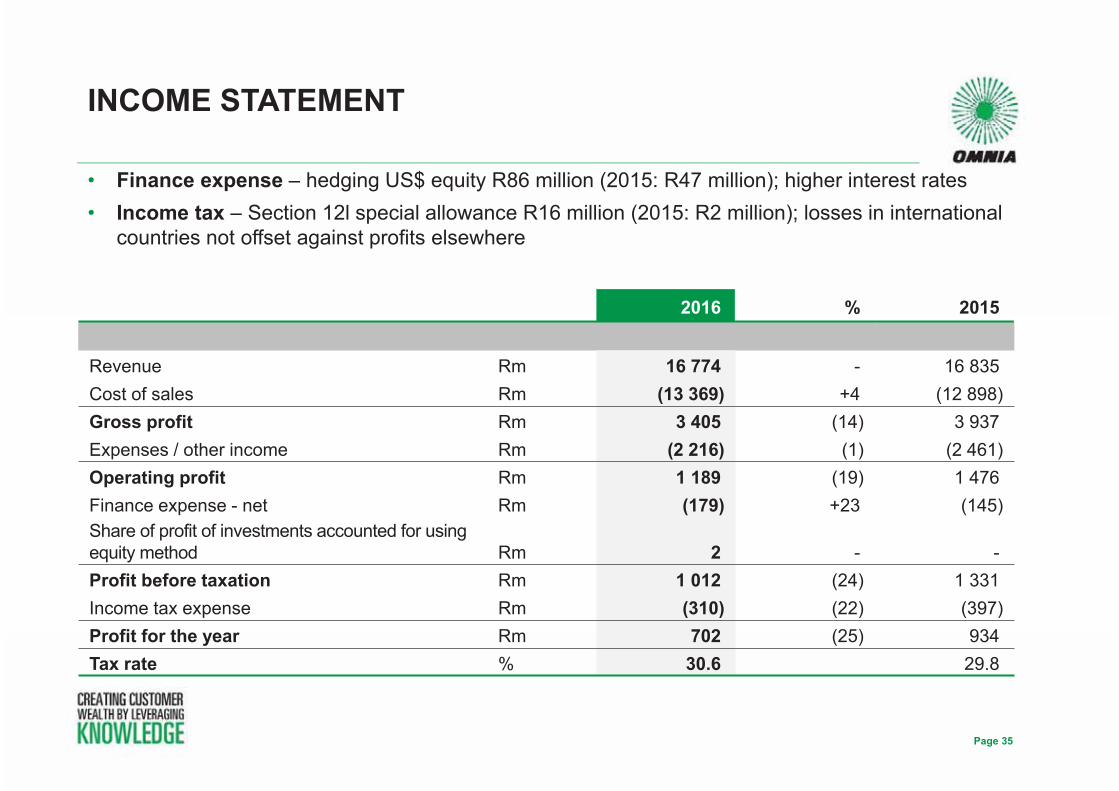
• Finance expense – hedging US$ equity R86 million (2015: R47 million); higher interest rates • Income tax – Section 12l special allowance R16 million (2015: R2 million); losses in international
countries not offset against profits elsewhere
INCOME STATEMENT
Page 35
2016 % 2015
Revenue Rm 16 774 - 16 835Cost of sales Rm (13 369) +4 (12 898)Gross profit Rm 3 405 (14) 3 937Expenses / other income Rm (2 216) (1) (2 461)Operating profit Rm 1 189 (19) 1 476Finance expense - net Rm (179) +23 (145)Share of profit of investments accounted for using equity method Rm 2 - -Profit before taxation Rm 1 012 (24) 1 331Income tax expense Rm (310) (22) (397)Profit for the year Rm 702 (25) 934Tax rate % 30.6 29.8
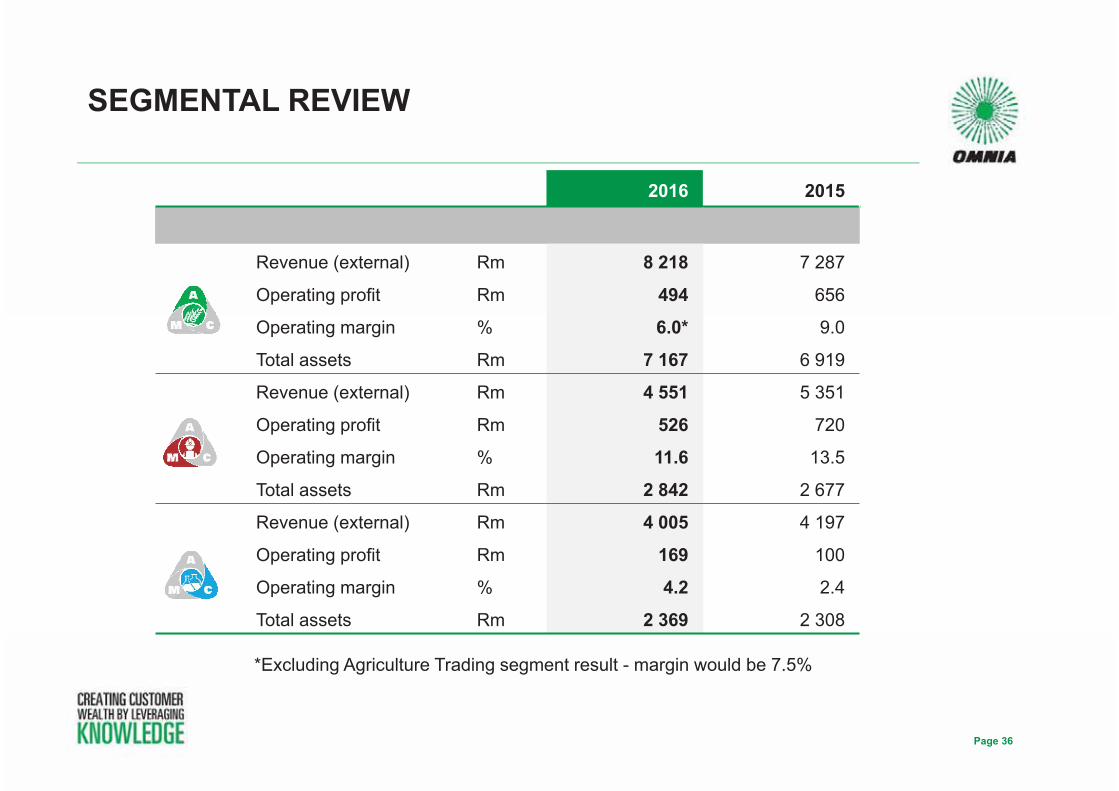
SEGMENTAL REVIEW
Page 36
2016 2015
Revenue (external) Rm 8 218 7 287
Operating profit Rm 494 656
Operating margin % 6.0* 9.0
Total assets Rm 7 167 6 919
Revenue (external) Rm 4 551 5 351
Operating profit Rm 526 720
Operating margin % 11.6 13.5
Total assets Rm 2 842 2 677
Revenue (external) Rm 4 005 4 197
Operating profit Rm 169 100
Operating margin % 4.2 2.4
Total assets Rm 2 369 2 308
*Excluding Agriculture Trading segment result - margin would be 7.5%
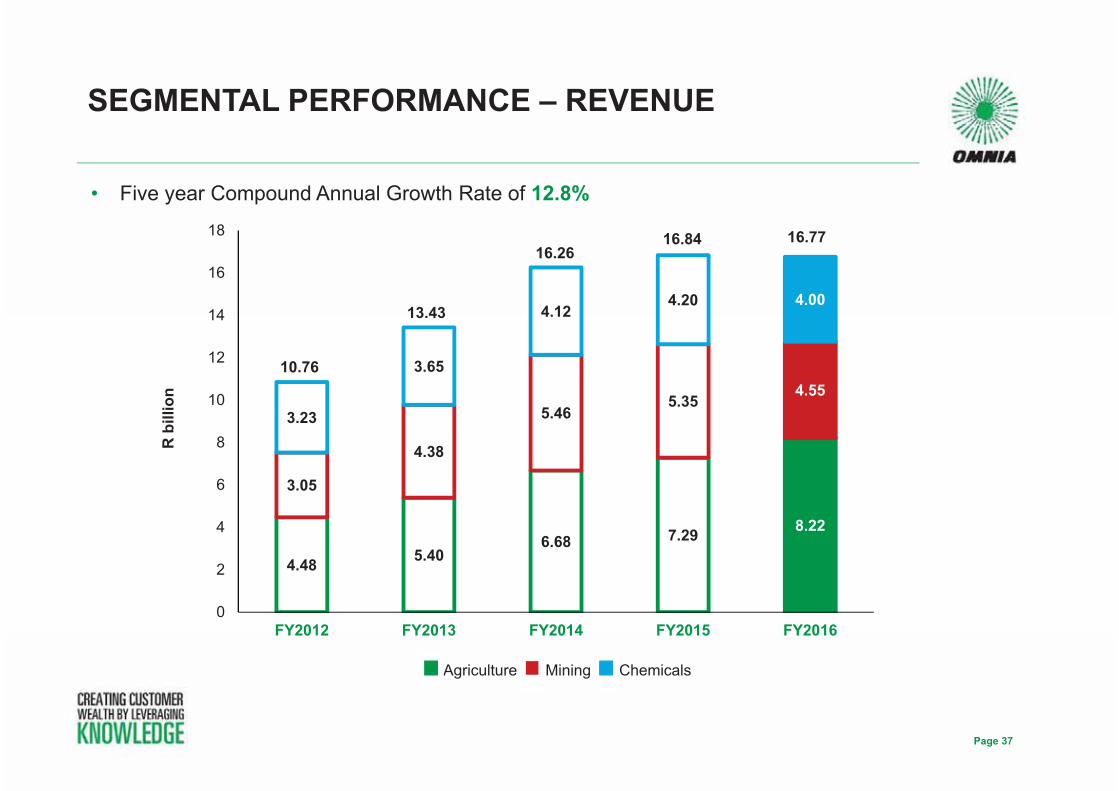
• Five year Compound Annual Growth Rate of 12.8%
SEGMENTAL PERFORMANCE – REVENUE
Page 37
4.48 5.406.68 7.29 8.22
3.05
4.38
5.465.35
4.55
3.23
3.65
4.124.20 4.00
0
2
4
6
8
10
12
14
16
18
FY2012 FY2013 FY2014 FY2015 FY2016
R b
illio
n
Agriculture Mining Chemicals
10.76
13.43
16.2616.84 16.77

• Five year Compound Annual Growth Rate of 11.6%
SEGMENTAL PERFORMANCE – OPERATING PROFIT
Page 38
323443 431
656494
476
735 829
720
52682
53
156100
169
0
200
400
600
800
1 000
1 200
1 400
1 600
FY2012 FY2013 FY2014 FY2015 FY2016
R m
illio
n
Agriculture Mining Chemicals
881
1 231
1 4161 476
1 189
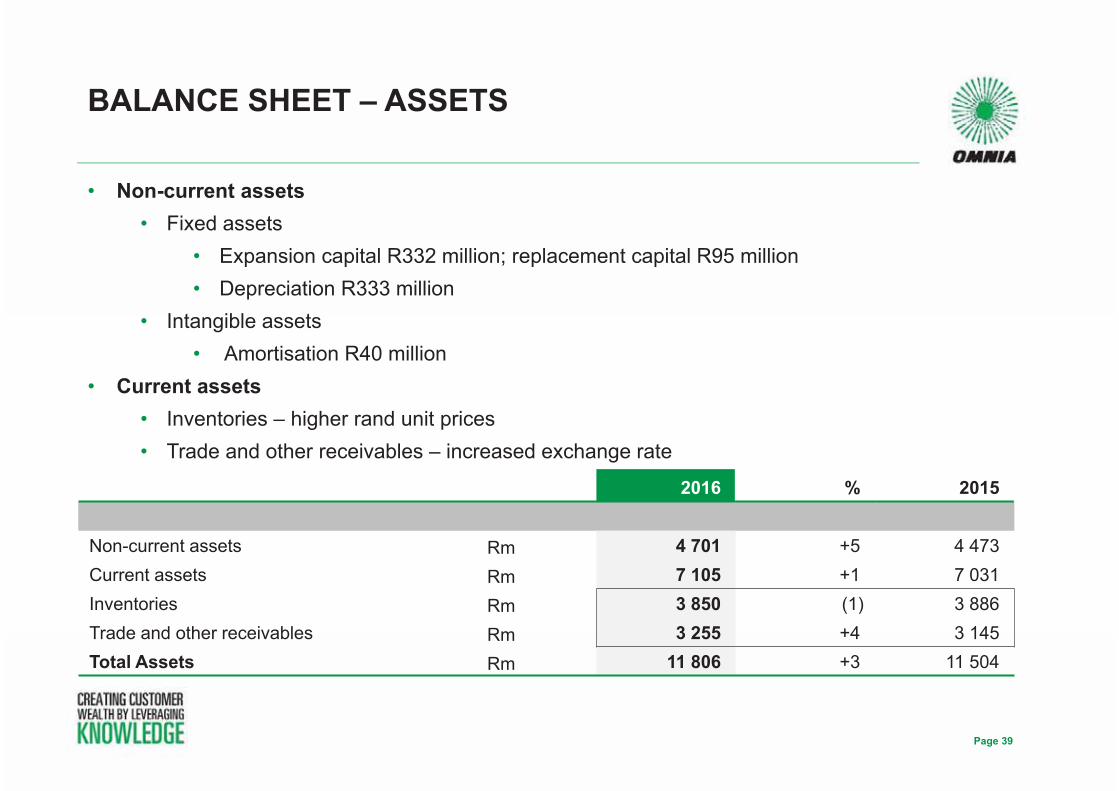
• Non-current assets• Fixed assets
• Expansion capital R332 million; replacement capital R95 million• Depreciation R333 million
• Intangible assets• Amortisation R40 million
• Current assets • Inventories – higher rand unit prices• Trade and other receivables – increased exchange rate
BALANCE SHEET – ASSETS
Page 39
2016 % 2015
Non-current assets Rm 4 701 +5 4 473Current assets Rm 7 105 +1 7 031Inventories Rm 3 850 (1) 3 886Trade and other receivables Rm 3 255 +4 3 145Total Assets Rm 11 806 +3 11 504
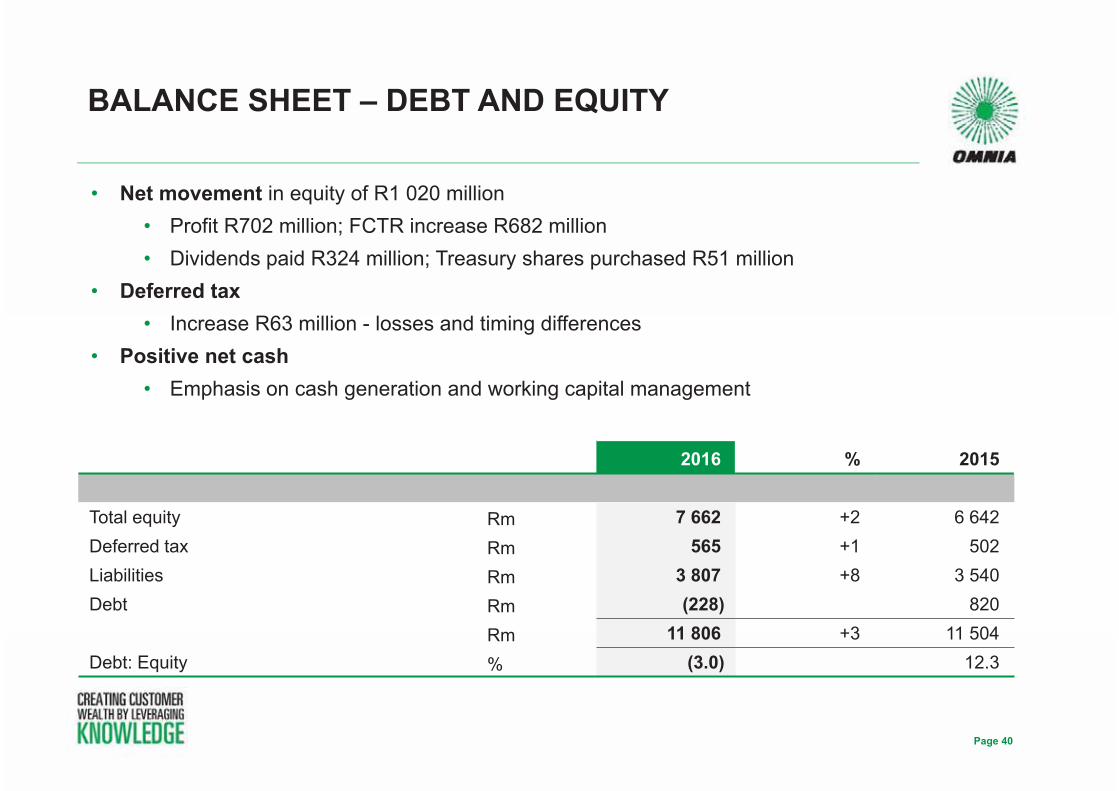
• Net movement in equity of R1 020 million• Profit R702 million; FCTR increase R682 million• Dividends paid R324 million; Treasury shares purchased R51 million
• Deferred tax • Increase R63 million - losses and timing differences
• Positive net cash • Emphasis on cash generation and working capital management
BALANCE SHEET – DEBT AND EQUITY
Page 40
2016 % 2015
Total equity Rm 7 662 +2 6 642 Deferred tax Rm 565 +1 502Liabilities Rm 3 807 +8 3 540Debt Rm (228) 820
Rm 11 806 +3 11 504Debt: Equity % (3.0) 12.3
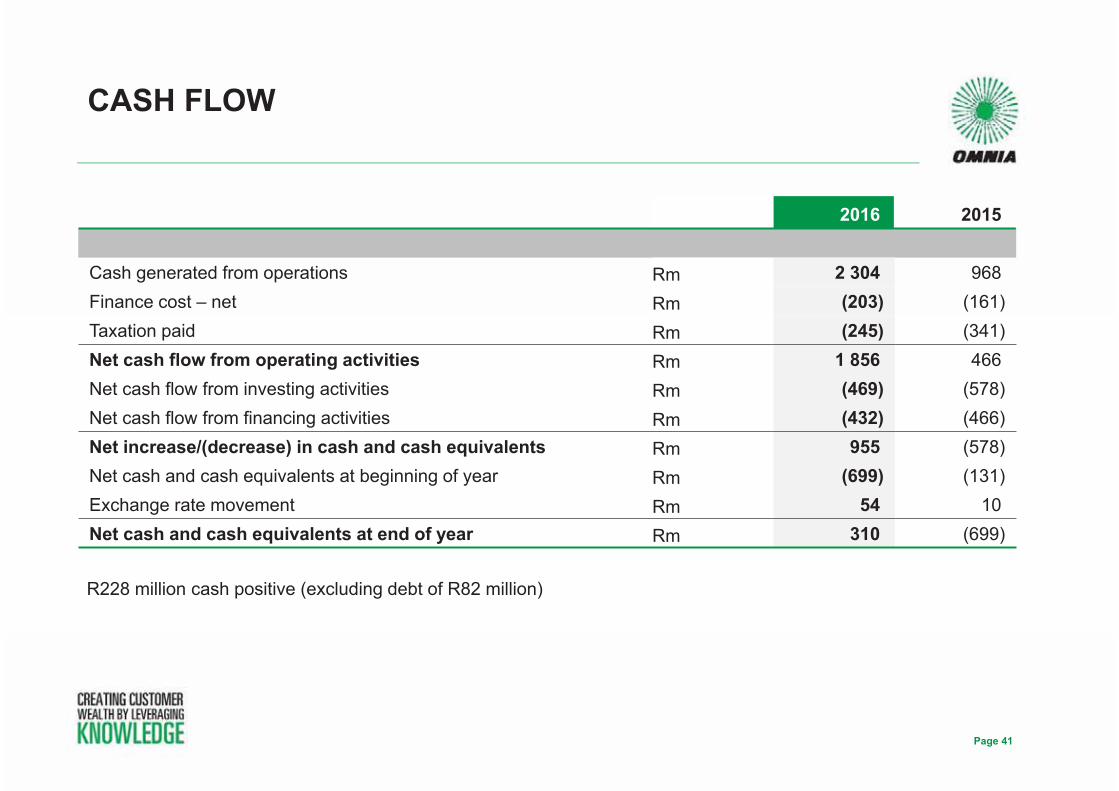
CASH FLOW
Page 41
2016 2015
Cash generated from operations Rm 2 304 968Finance cost – net Rm (203) (161)Taxation paid Rm (245) (341)Net cash flow from operating activities Rm 1 856 466Net cash flow from investing activities Rm (469) (578)Net cash flow from financing activities Rm (432) (466)Net increase/(decrease) in cash and cash equivalents Rm 955 (578)Net cash and cash equivalents at beginning of year Rm (699) (131)Exchange rate movement Rm 54 10Net cash and cash equivalents at end of year Rm 310 (699)
R228 million cash positive (excluding debt of R82 million)
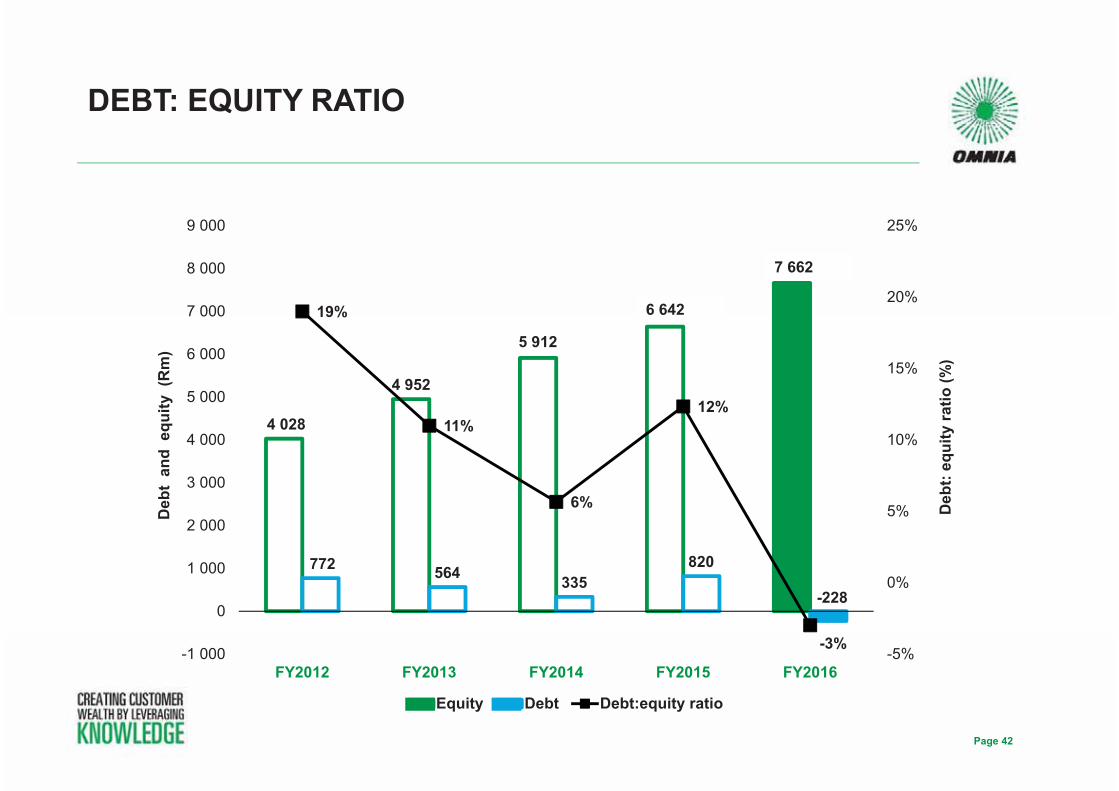
DEBT: EQUITY RATIO
Page 42
4 028
4 952
5912
6642
7662
772 564 335820
-228
19%
11%
6%
12%
-3%-5%
0%
5%
10%
15%
20%
25%
-1 000
0
1 000
2 000
3 000
4 000
5 000
6 000
7 000
8 000
9 000
FY2012 FY2013 FY2014 FY2015 FY2016
Deb
t: eq
uity
ratio
(%)
Deb
t an
d e
quity
(R
m)
Equity Debt Debt:equity ratio
5 912
6 642
7 662
PROSPECTS
• SA rand:USD weakness benefits all three divisions
• Strong balance sheet
• Growth opportunities – continue to identify and evaluate
• Turnaround of Protea Chemicals continues building momentum
• Upgrading of IT platforms adding value
• Strong management team and business model
• Continue to expand markets beyond Africa
GROUP OUTLOOK
Page 44
• Drought dissipating - La-Niña conditions developing
• Growth opportunities - Cape
• Ammonia:urea ratio expected to improve
• Expansion of new Nitrophosphate facility
• Operational – quadruple capacity
• Margin improvement – 1% to 2% margin points
• Indicative capital of R650 million - over 2 years
• On-going drive to improve energy and water utilisation
• Electricity – 40% co-generation at Sasolburg factory
• Carbon credits – continue to generate
OUTLOOK – AGRICULTURE DIVISION
Page 45
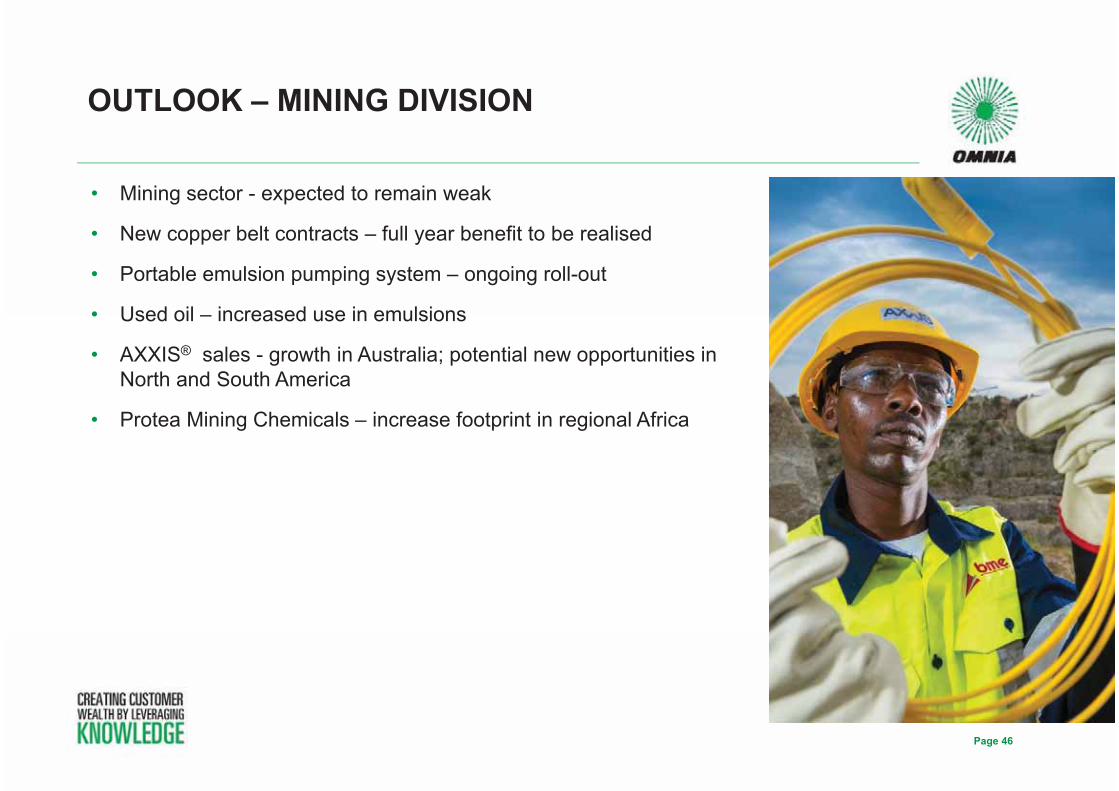
• Mining sector - expected to remain weak
• New copper belt contracts – full year benefit to be realised
• Portable emulsion pumping system – ongoing roll-out
• Used oil – increased use in emulsions
• AXXIS® sales - growth in Australia; potential new opportunities in North and South America
• Protea Mining Chemicals – increase footprint in regional Africa
OUTLOOK – MINING DIVISION
Page 46
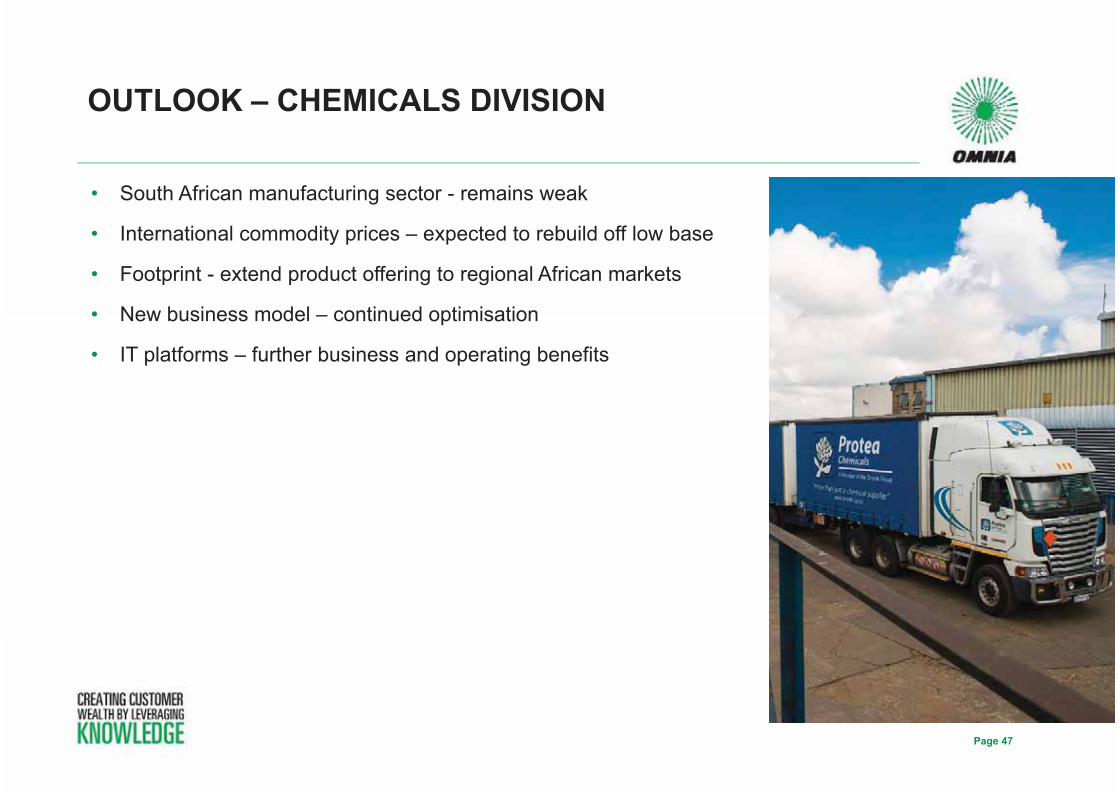
• South African manufacturing sector - remains weak
• International commodity prices – expected to rebuild off low base
• Footprint - extend product offering to regional African markets
• New business model – continued optimisation
• IT platforms – further business and operating benefits
OUTLOOK – CHEMICALS DIVISION
Page 47
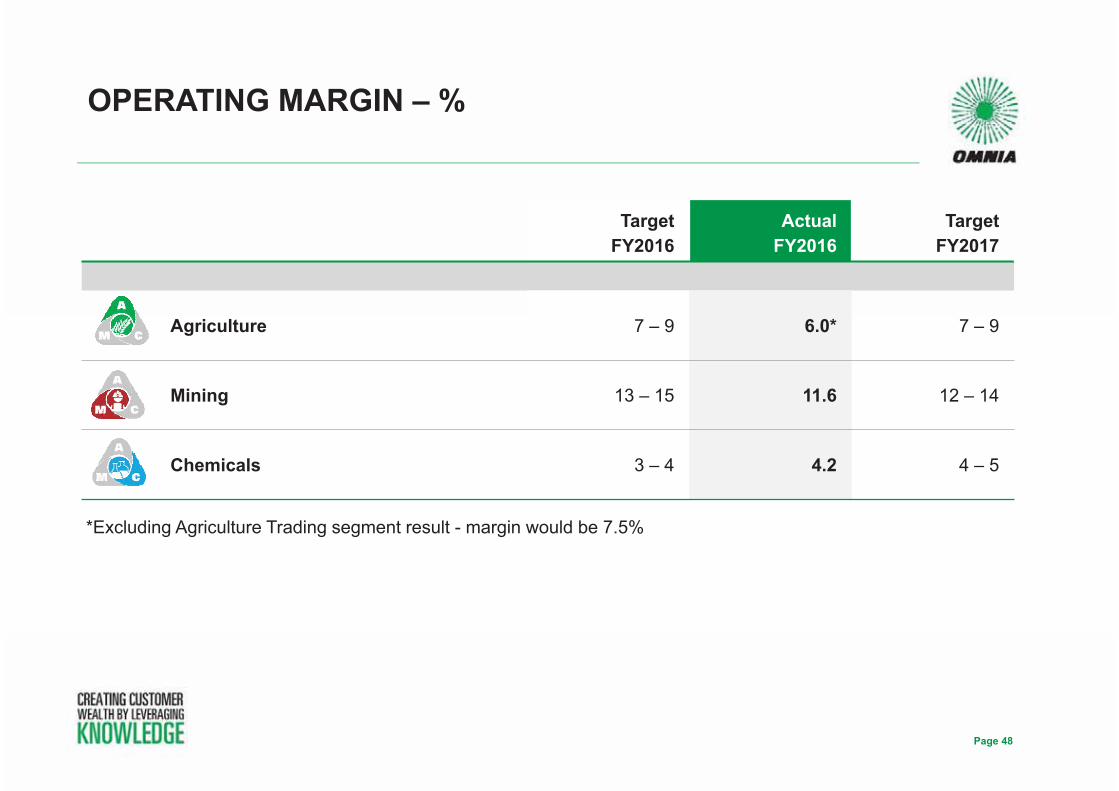
OPERATING MARGIN – %
Page 48
TargetFY2016
ActualFY2016
TargetFY2017
Agriculture 7 – 9 6.0* 7 – 9
Mining 13 – 15 11.6 12 – 14
Chemicals 3 – 4 4.2 4 – 5
*Excluding Agriculture Trading segment result - margin would be 7.5%