on-the-fly load data value tracing in multicoresmilenka/docs/esweek2016_mp_fin.pdf · cs32 : l1d /...
TRANSCRIPT

On-the-Fly Load Data Value Tracing in Multicores
Mounika Ponugoti, Amrish K. Tewar, and Aleksandar Milenković
ECE Department, The University of Alabama in Huntsville
Email: [email protected]
Web: http://lacasa.uah.edu
Outline
Background and Motivation
Proposed Trace Module – mlvCFiat
Experimental Environment
Results
Conclusions
2

Trends in Embedded Systems Society increasingly relies on embedded systems:
communication, transportation, medicine, military, …
Forces shaping embedded systems
Technology trends: Integration , Miniaturization , Cost
Application trends: Functionality , Complexity , Mobility
Market trends: Proliferation , Diversification , Time-to-market
Implications
SW development cost exceeds 80% of the total cost
Developers spend 50%-75% of time in debugging; increases as we transition to multicores
Estimated cost of SW bugs and glitches: $20-$60 billion annually
Need for better tools to help SW/HW developers find bugs faster
3
Background&Motivation mlvCFiat Experimental Environment Results Conclusions
Tracing and Debugging Challenges
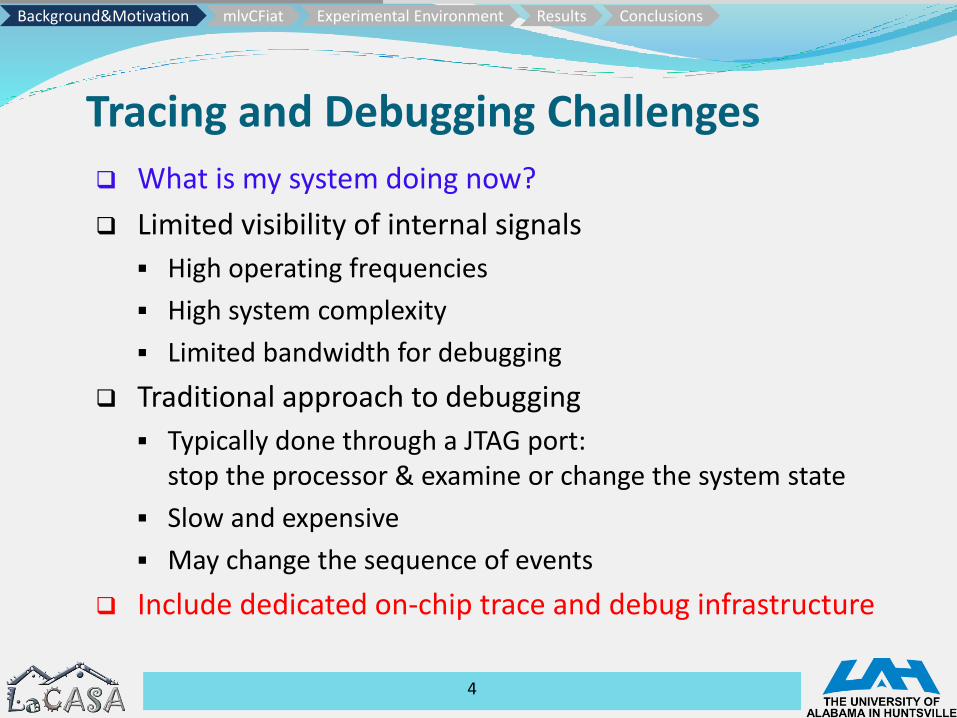
What is my system doing now?
Limited visibility of internal signals
High operating frequencies
High system complexity
Limited bandwidth for debugging
Traditional approach to debugging
Typically done through a JTAG port: stop the processor & examine or change the system state
Slow and expensive
May change the sequence of events
Include dedicated on-chip trace and debug infrastructure
4
Background&Motivation mlvCFiat Experimental Environment Results Conclusions

Tracing and Debugging in Multicores IEEE Nexus 5001 standard
Class 1: Run-control debugging: run, stop, single-step, examine memory or register contents, set values
Class 2: Captures control-flow traces in near real time
Class 3: Captures data traces in near real time
Class 4: Emulating memory and I/O through a trace port
5
System Interconnect
TracePortMulticore
SoC
Trace & Debug Interconnect
On-chipTrace Buffer
Trace PortInterface
Inter-connect
TraceModule DSP
Core
TraceModule
DMACore
TraceModule
Debug & TraceControl
Software Debugger System View
Binaries
Multicore Instruction Set Simulator
GUI
. . . . . .
Nexus Trace
Software Debugger(s)
on HostWorkstation
Trace Probe
Host InterfaceBuffers(~GB)Target
Interface
Trace Decoder and Control Software Module
CPUCore i
TraceModule
CPUCore 0
TraceModule
CPUCore N-1
TraceModule
Background&Motivation mlvCFiat Experimental Environment Results Conclusions

Load Data Value Tracing Software debugger can replay program offline using
Instruction set simulator
Program binary
Initial state of GPRs/SPRs
Exception traces and load data value traces
For each memory read emit a trace message that includes: [Timestamp, Core ID, Load Data Value]
Evaluate the average trace port bandwidth [TPB]: the number of bits traced through the trace port
Metrics: the average bpi and bpc
Average bpi = 𝑇𝑜𝑡𝑎𝑙 𝑡𝑟𝑎𝑐𝑒 𝑠𝑖𝑧𝑒 𝑖𝑛 𝑏𝑖𝑡𝑠
𝑇𝑜𝑡𝑎𝑙 𝑛𝑢𝑚𝑏𝑒𝑟 𝑜𝑓 𝑒𝑥𝑒𝑐𝑢𝑡𝑒𝑑 𝑖𝑛𝑠𝑡𝑟𝑢𝑐𝑡𝑖𝑜𝑛𝑠
Average bpc = 𝑇𝑜𝑡𝑎𝑙 𝑡𝑟𝑎𝑐𝑒 𝑠𝑖𝑧𝑒 𝑖𝑛 𝑏𝑖𝑡𝑠
𝐸𝑥𝑒𝑐𝑢𝑡𝑖𝑜𝑛 𝑡𝑖𝑚𝑒 𝑚𝑒𝑎𝑠𝑢𝑟𝑒𝑑 𝑖𝑛 𝑐𝑙𝑜𝑐𝑘 𝑐𝑦𝑐𝑙𝑒𝑠
6
Background&Motivation mlvCFiat Experimental Environment Results Conclusions

Data Tracing Challenges
7
Total TPB [bpi]
N = 1 N = 2 N = 4 N = 8
12.34 12.63 12.89 13.17
Total TPB [bpc]
N = 1 N = 2 N = 4 N = 8
4.92 8.76 15.61 25.64
Background&Motivation mlvCFiat Experimental Environment Results Conclusions
0
4
8
12
16
1 2 4 8 1 2 4 8 1 2 4 8 1 2 4 8 1 2 4 8 1 2 4 8 1 2 4 8 1 2 4 8 1 2 4 8 1 2 4 8 1 2 4 8
barnes cholesky fft fmm lu radiosity radix raytrace water-ns water-sp Total
(a) Trace Port Bandwidth [bpi, bits per instruction]LV Pi dCC
0
10
20
30
40
1 2 4 8 1 2 4 8 1 2 4 8 1 2 4 8 1 2 4 8 1 2 4 8 1 2 4 8 1 2 4 8 1 2 4 8 1 2 4 8 1 2 4 8
barnes cholesky fft fmm lu radiosity radix raytrace water-ns water-sp Total
(b) Trace Port Bandwidth [bpc, bits per clock cycle]LV Pi dCC
mlvCFiat
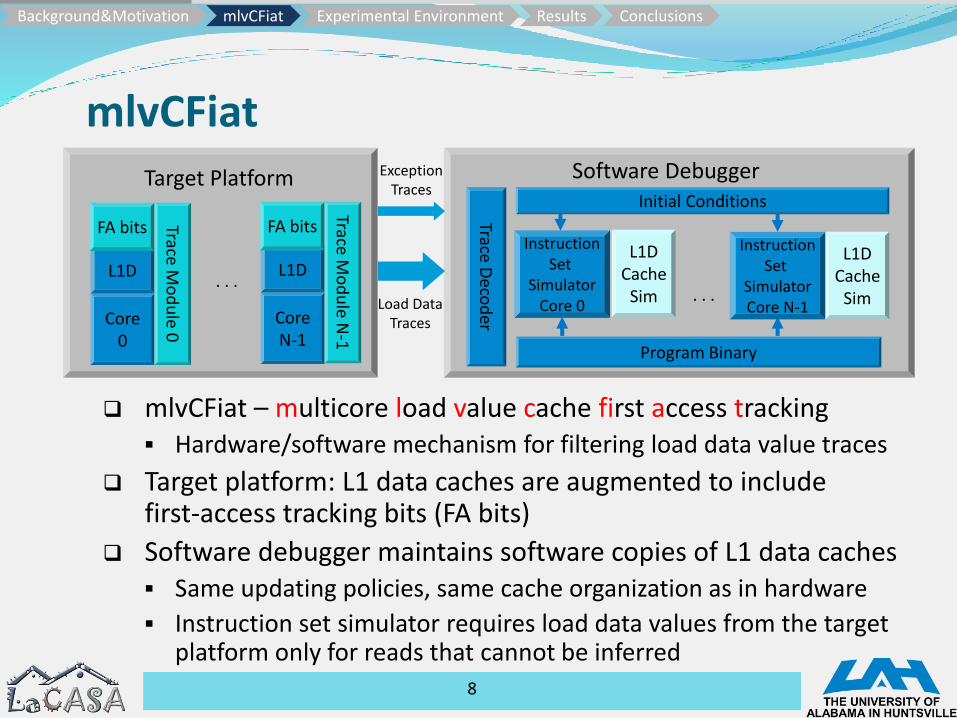
mlvCFiat – multicore load value cache first access tracking Hardware/software mechanism for filtering load data value traces
Target platform: L1 data caches are augmented to include first-access tracking bits (FA bits)
Software debugger maintains software copies of L1 data caches Same updating policies, same cache organization as in hardware
Instruction set simulator requires load data values from the target platform only for reads that cannot be inferred
8
Program Binary
InstructionSet
SimulatorCore 0
Software Debugger
. . .
Initial Conditions
InstructionSet
SimulatorCore N-1
L1DCache
Sim
L1DCache
Sim
Trace Deco
derCore
0
L1D
FA bits Trace Mo
du
le 0
Target Platform
CoreN-1
L1D
FA bits
Trace Mo
du
le N-1
. . .Load Data
Traces
Exception Traces
Background&Motivation mlvCFiat Experimental Environment Results Conclusions
mlvCFiat Hardware Structures
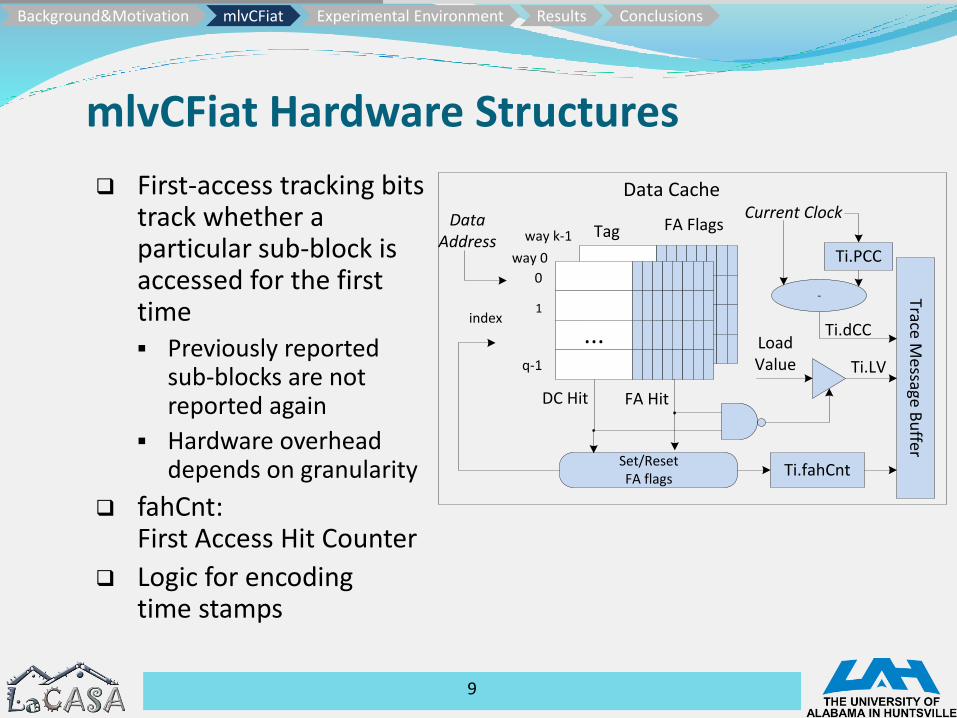
First-access tracking bits track whether a particular sub-block is accessed for the first time Previously reported
sub-blocks are not reported again
Hardware overhead depends on granularity
fahCnt: First Access Hit Counter
Logic for encoding time stamps
9
...
Set/Reset FA flags
Trace Message B
uffer
Data Cache
DC Hit
Data Address
FA Hit
Tag FA Flags
0
1
q-1
index
Ti.fahCnt
way 0
way k-1
Load Value
Ti.PCC
Current Clock
-
Ti.dCC
Ti.LV
...
Background&Motivation mlvCFiat Experimental Environment Results Conclusions
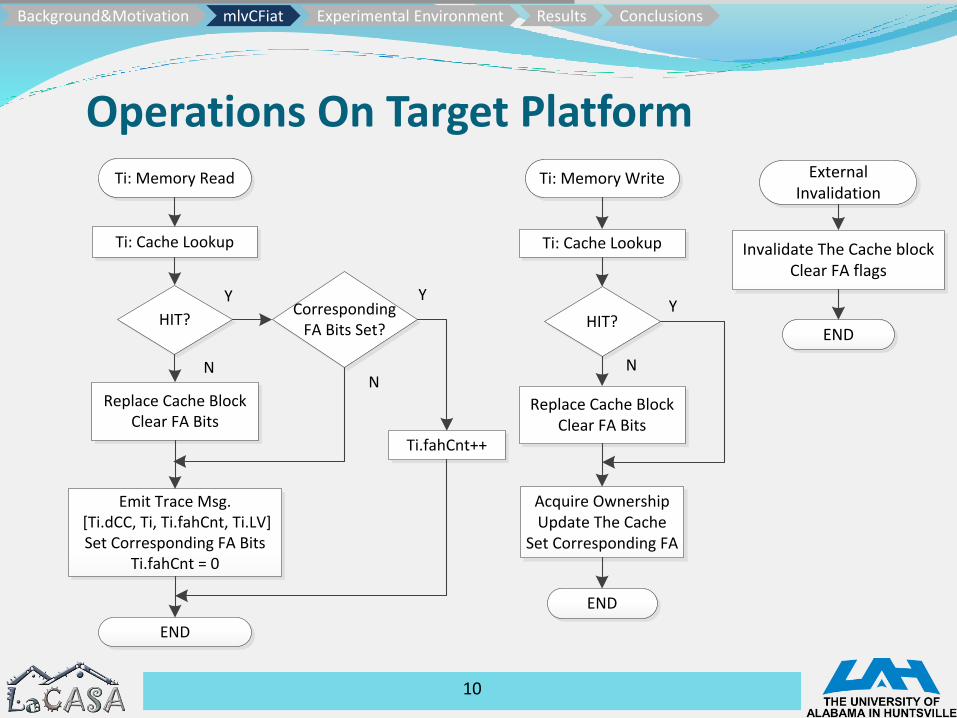
Operations On Target Platform
10
Background&Motivation mlvCFiat Experimental Environment Results Conclusions
Ti: Cache Lookup
Ti: Memory Read
HIT?
Replace Cache BlockClear FA Bits
Y
Ti.fahCnt++
END
N
Corresponding FA Bits Set?
Y
N
Emit Trace Msg. [Ti.dCC, Ti, Ti.fahCnt, Ti.LV]Set Corresponding FA Bits
Ti.fahCnt = 0
Ti: Cache Lookup
Ti: Memory Write
HIT?
N
Y
END
Replace Cache BlockClear FA Bits
Acquire OwnershipUpdate The Cache
Set Corresponding FA
Invalidate The Cache blockClear FA flags
External Invalidation
END
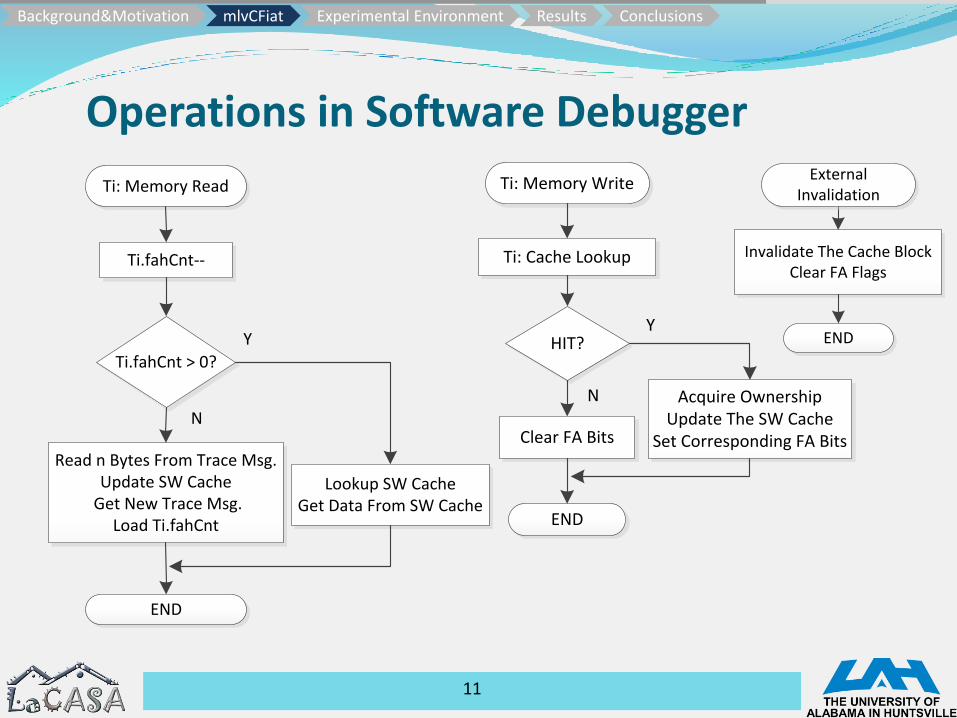
Operations in Software Debugger
11
Background&Motivation mlvCFiat Experimental Environment Results Conclusions
Invalidate The Cache BlockClear FA Flags
END
External Invalidation
Ti: Cache Lookup
Ti: Memory Write
HIT?
N
Y
END
Clear FA Bits
Acquire OwnershipUpdate The SW Cache
Set Corresponding FA Bits
Ti.fahCnt--
Ti: Memory Read
Ti.fahCnt > 0?
Read n Bytes From Trace Msg.Update SW Cache
Get New Trace Msg.Load Ti.fahCnt
Lookup SW CacheGet Data From SW Cache
END
Y
N

Encoding of Trace Messages
In mlvCFiat length of LV field depends on granularity
Encoding parameters (h0,h1) = (4, 2), (i0, i1) = (2, 2)
12
(a) Nexus-like encoding (NX_b) Legend:dCC Clock Cycle (differential enc.)Ti Thread/Core ID - élog2Nù bitsLV Load Value fahCnt First Access Hit Counterh0, h1 Chunk Sizes for CCi0, i1 Chunk Sizes for fahCnt
(b) mlvCFiat baseline encoding (CF_b) (c) mlvCFiat variable encoding (CF_e)
LVTidCC
dCC[0:7]8 b
dCC[8:15]8 b
C1 b
C 1 b
...
fahCnt[0:7] 8 b
fahCnt[8:15] 8 b
...C
1 bC
1 b
dCC fahCnt LVTi
dCC[0:7]8 b
dCC[8:15]8 b
C1 b
C 1 b
...
fahCnt LVTidCC
fahCnt[0:i0-1] i0 b
fahCnt[i0:i0+i1-1] i1 b
C 1 b
...C
1 b
dCC[0:h0-1] h0 b
C1 b
dCC[h0:h0+h1-1] h1 b
C 1 b
...
Background&Motivation mlvCFiat Experimental Environment Results Conclusions
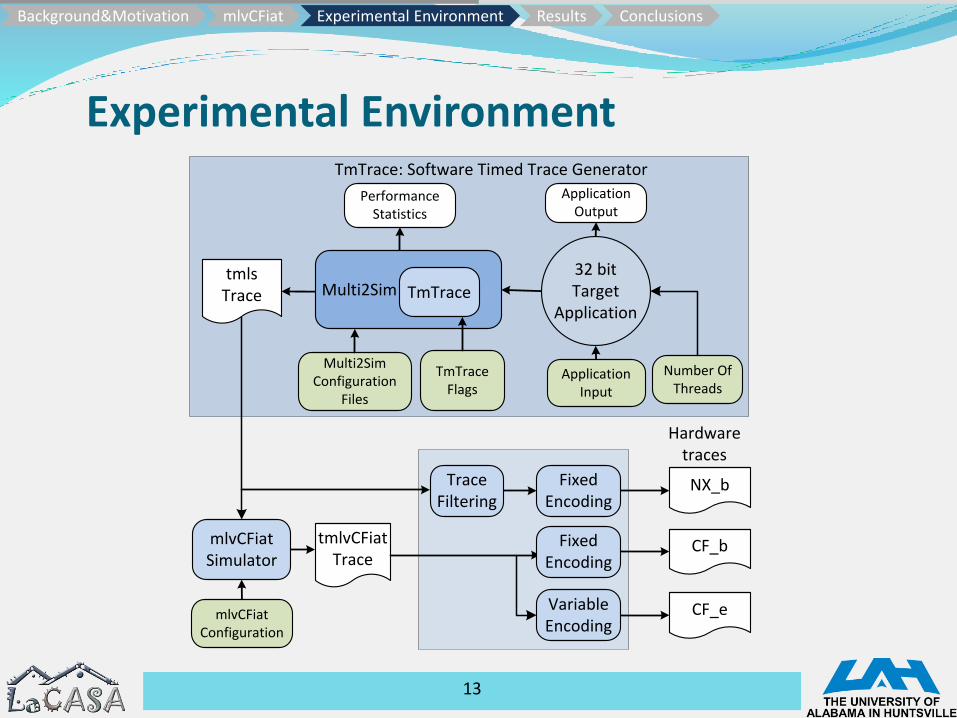
Experimental Environment
13
TmTrace: Software Timed Trace Generator
32 bit Target
Application
Application Input
Number Of Threads
Application Output
Multi2Sim Configuration
Files
TmTraceFlags
Performance Statistics
tmlsTrace
mlvCFiatConfiguration
tmlvCFiatTrace
Hardware traces
NX_b
CF_b
CF_e
Multi2Sim TmTrace
mlvCFiatSimulator
Trace Filtering
FixedEncoding
FixedEncoding
VariableEncoding
Background&Motivation mlvCFiat Experimental Environment Results Conclusions
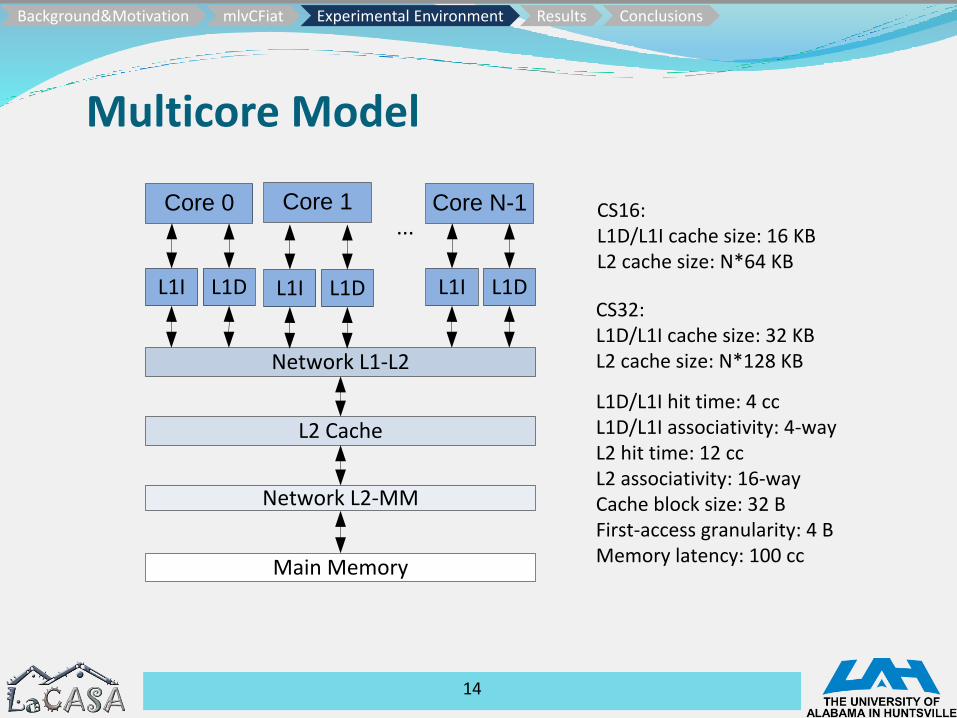
Multicore Model
14
L1I L1D
...
L2 Cache
Main Memory
Network L1-L2
Network L2-MM
CS16:L1D/L1I cache size: 16 KBL2 cache size: N*64 KB
CS32:L1D/L1I cache size: 32 KBL2 cache size: N*128 KB
L1D/L1I hit time: 4 ccL1D/L1I associativity: 4-wayL2 hit time: 12 ccL2 associativity: 16-wayCache block size: 32 BFirst-access granularity: 4 BMemory latency: 100 cc
Core 0
L1I L1D
Core 1
L1I L1D
Core N-1
Background&Motivation mlvCFiat Experimental Environment Results Conclusions

Trace Port Bandwidth [bpi]
15
0
1
2
3
CF_b(CS16) CF_b(CS32) CF_e(CS16) CF_e(CS32)
Trace port bandwidth (bpi)
N=1 N=2 N=4 N=8
0
4
8
12
16
NX_b
Trace port bandwidth (bpi)
N=1 N=2 N=4 N=8
mlvCFiat:
CF_b(CS16) – 0.88 bpi (N=1), 1.0 bpi (N=8)
CF_b(CS32) – 0.40 bpi (N=1), 0.71 bpi (N=8)
CF_e(CS16) – 0.80 bpi (N=1), 0.92 bpi (N=8)
CF_e(CS32) – 0.37 bpi (N=1), 0.66 bpi (N=8)
NX_b (CS16):
12.34 bpi (N=1)
13.17 bpi (N=8)
Background&Motivation mlvCFiat Experimental Environment Results Conclusions

Where Do Bits Go?
LV field requires 68 – 78%, dCC requires 13 – 16% , fahCnt 8 – 15%, Ti 0-5% of total trace port bandwidth
16
0
4
8
12
N=1 N=2 N=4 N=8
NX_b
Trace port bandwith [bpi]LV Ti dCC
0.0
0.2
0.4
0.6
0.8
1.0
1.2
N=1 N=2 N=4 N=8 N=1 N=2 N=4 N=8 N=1 N=2 N=4 N=8 N=1 N=2 N=4 N=8
CF_b(CS16) CF_b(CS32) CF_e(CS16) CF_e(CS32)
Trace port bandwidth [bpi] LV fahCnt Ti dCC
Background&Motivation mlvCFiat Experimental Environment Results Conclusions
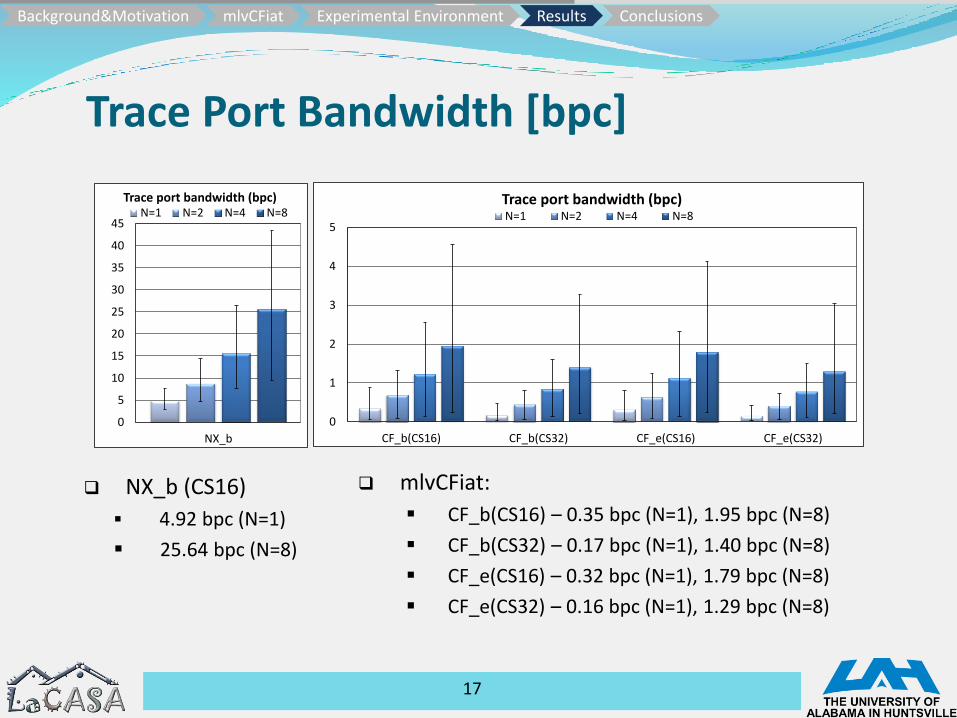
Trace Port Bandwidth [bpc]
mlvCFiat:
CF_b(CS16) – 0.35 bpc (N=1), 1.95 bpc (N=8)
CF_b(CS32) – 0.17 bpc (N=1), 1.40 bpc (N=8)
CF_e(CS16) – 0.32 bpc (N=1), 1.79 bpc (N=8)
CF_e(CS32) – 0.16 bpc (N=1), 1.29 bpc (N=8)
17
NX_b (CS16)
4.92 bpc (N=1)
25.64 bpc (N=8)
Background&Motivation mlvCFiat Experimental Environment Results Conclusions
0
1
2
3
4
5
CF_b(CS16) CF_b(CS32) CF_e(CS16) CF_e(CS32)
Trace port bandwidth (bpc)N=1 N=2 N=4 N=8
0
5
10
15
20
25
30
35
40
45
NX_b
Trace port bandwidth (bpc)N=1 N=2 N=4 N=8

Speedup (Trace Reduction Ratio)
18
# Cores N=1 N=2 N=4 N=8
Mech. NX_b.gz CF_e NX_b.gz CF_e NX_b.gz CF_e NX_b.gz CF_e
Config Unif Split CS16 CS32 Unif Split CS16 CS32 Unif Split CS16 CS32 Unif Split CS16 CS32
barnes 1.4 2.1 6.8 19.1 1.3 1.8 6.7 13.1 1.2 1.7 6.5 10.6 1.3 1.6 6.5 9.0
cholesky 1.7 6.7 8.2 20.4 1.7 3.4 12.5 20.4 1.9 2.3 16.7 25.5 2.5 1.7 25.7 35.1
fft 1.4 1.9 4.2 7.2 1.4 1.8 4.1 7.2 1.3 1.7 4.2 7.3 1.4 1.7 4.2 7.3
fmm 1.9 4.9 24.2 37.8 1.9 3.7 24.1 37.2 1.6 3.0 24.2 36.7 1.6 2.7 24.4 36.6
lu 1.6 5.9 20.5 20.7 1.5 3.6 19.8 21.3 1.4 3.1 19.8 21.2 1.8 3.0 19.2 27.6
radiosity 1.6 3.9 47.7 128.8 1.5 2.4 22.3 27.6 1.4 2.1 22.6 28.4 1.5 1.9 19.8 23.4
radix 2.0 4.2 17.9 24.8 1.8 3.1 8.4 9.6 1.5 2.1 8.1 9.3 1.4 2.0 8.1 9.3
raytrace 1.5 3.9 14.3 44.2 1.5 2.6 12.1 25.4 1.3 2.3 11.4 22.1 1.4 2.1 10.4 17.9
water-ns 1.4 2.7 21.7 47.4 1.4 2.1 20.8 42.8 1.3 1.9 19.7 28.0 1.3 1.9 20.0 26.6
water-sp 1.4 3.0 168.1 210.3 1.4 2.4 158.5189.4 1.3 2.1 147.3 170.9 1.4 2.0 136.9 156.2
Total 1.5 3.3 15.3 33.4 1.5 2.5 13.7 22.3 1.4 2.1 13.9 21.0 1.5 2.0 14.3 20.1
• Unified – NX_b as input to gzip• Split – Two streams (dCC, Ti), (LV) compressed separately
Background&Motivation mlvCFiat Experimental Environment Results Conclusions
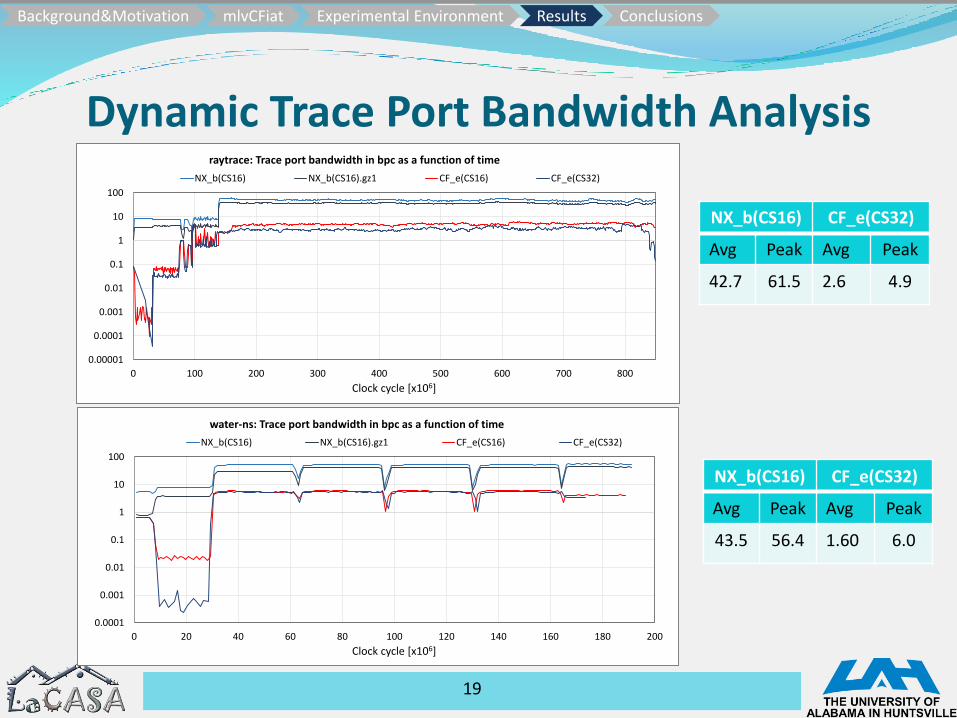
Dynamic Trace Port Bandwidth Analysis
19
NX_b(CS16) CF_e(CS32)
Avg Peak Avg Peak
42.7 61.5 2.6 4.9
NX_b(CS16) CF_e(CS32)
Avg Peak Avg Peak
43.5 56.4 1.60 6.0
Background&Motivation mlvCFiat Experimental Environment Results Conclusions
0.0001
0.001
0.01
0.1
1
10
100
0 20 40 60 80 100 120 140 160 180 200
Clock cycle [x106]
water-ns: Trace port bandwidth in bpc as a function of time
NX_b(CS16) NX_b(CS16).gz1 CF_e(CS16) CF_e(CS32)
0.00001
0.0001
0.001
0.01
0.1
1
10
100
0 100 200 300 400 500 600 700 800
Clock cycle [x106]
raytrace: Trace port bandwidth in bpc as a function of time
NX_b(CS16) NX_b(CS16).gz1 CF_e(CS16) CF_e(CS32)

Conclusions Need for trace modules that can guarantee
Unobtrusive program tracing in real-time
High compression (low trace port bandwidth)
Low complexity: narrow trace ports and small trace buffers
mlvCFiat - multicore load value Cache First-access tracking mechanism for filtering load data values Trace out only data cache read misses or
data cache read hits that occur for the first-time
Relatively low-complexity: only storage for first-access bits
Significant reduction in load data value trace: from 15 to 33 times when N = 1 and from 14 to 20 times when N = 8
Variable encoding mechanism Reduces the trace port bandwidth 8-9%
relative to base encoding
20
Background&Motivation mlvCFiat Experimental Environment Results Conclusions