on the performance of porous covalent organic polymers for
TRANSCRIPT

26 April 2015 1
On the Performance of Porous Covalent
Organic Polymers for CO2 Capture Process
at Elevated Pressures
Water and Energy Workshop
Organized by Texas A&M University at Qatar
RUH ULLAH
Research Fellow
Department of Chemical Engineering, Qatar University
February 17, 2015
Doha, Qatar

26 April 2015 2
Outline
Global concern of carbon dioxide capture and storage
Technologies in use
Materials selection for CO2 capture
Synthesis and characterization of covalent organic
polymers (COPs)
Material performance for gases capture at various
temperatures and pressures
Adsorption kinetics
Conclusion

26 April 2015 3
0
2
4
6
8
10
12
14
16
20
35
20
35
20
10
Global CO2 Emission
13.1
15.3
5.3

Power Generation & CO2 Emission
26 April 2015 5
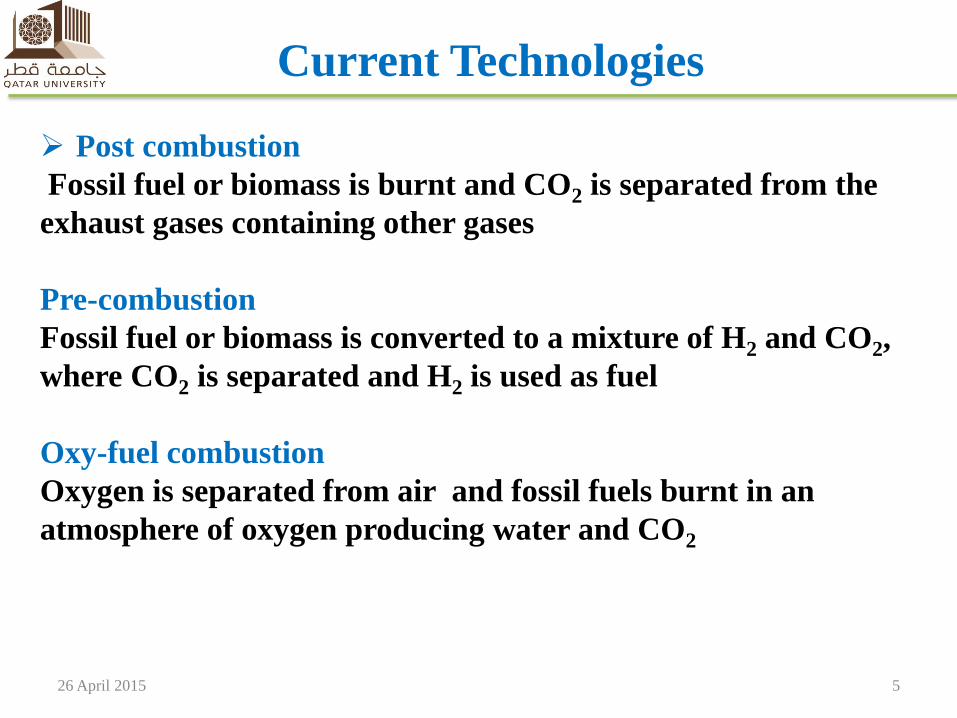
Current Technologies
Post combustion
Fossil fuel or biomass is burnt and CO2 is separated from the
exhaust gases containing other gases
Pre-combustion
Fossil fuel or biomass is converted to a mixture of H2 and CO2,
where CO2 is separated and H2 is used as fuel
Oxy-fuel combustion
Oxygen is separated from air and fossil fuels burnt in an
atmosphere of oxygen producing water and CO2
26 April 2015 6
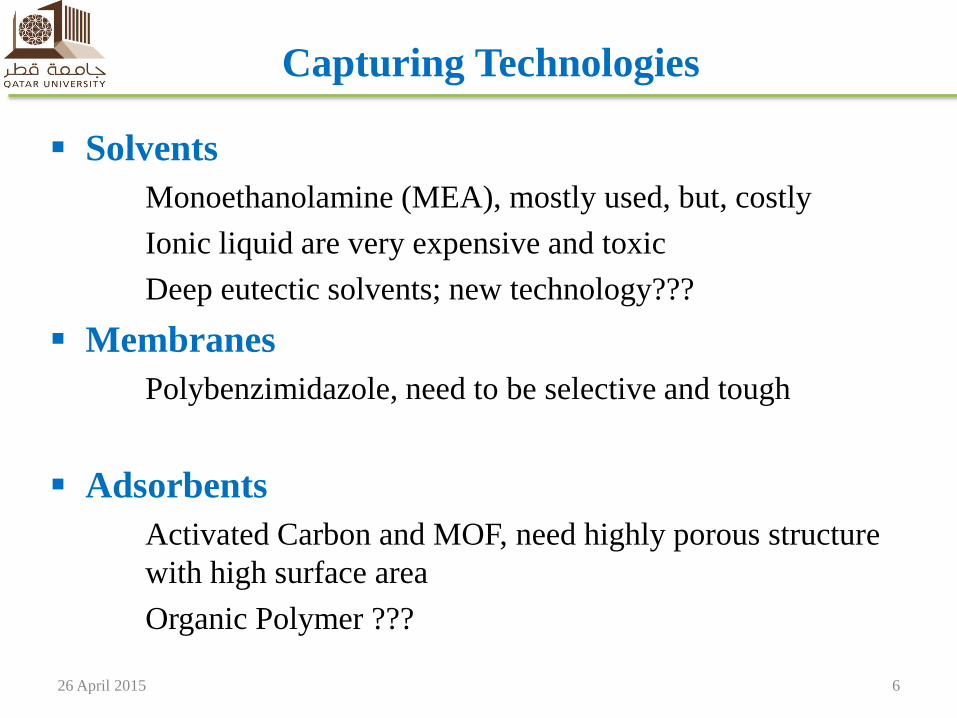
Solvents
Monoethanolamine (MEA), mostly used, but, costly
Ionic liquid are very expensive and toxic
Deep eutectic solvents; new technology???
Membranes
Polybenzimidazole, need to be selective and tough
Adsorbents
Activated Carbon and MOF, need highly porous structure
with high surface area
Organic Polymer ???
Capturing Technologies

26 April 2015 7
Material Selection (MoF)
• Metal Organic Frame Work
• Surface area: 4530 m2/g
• Pore volume: 3.59 cm3/g
• Maximum CO2 uptake at 50 bars and 298k
• 54.5 mmol/g
• Oxidation and cost of materials are big
issues
26 April 2015 8
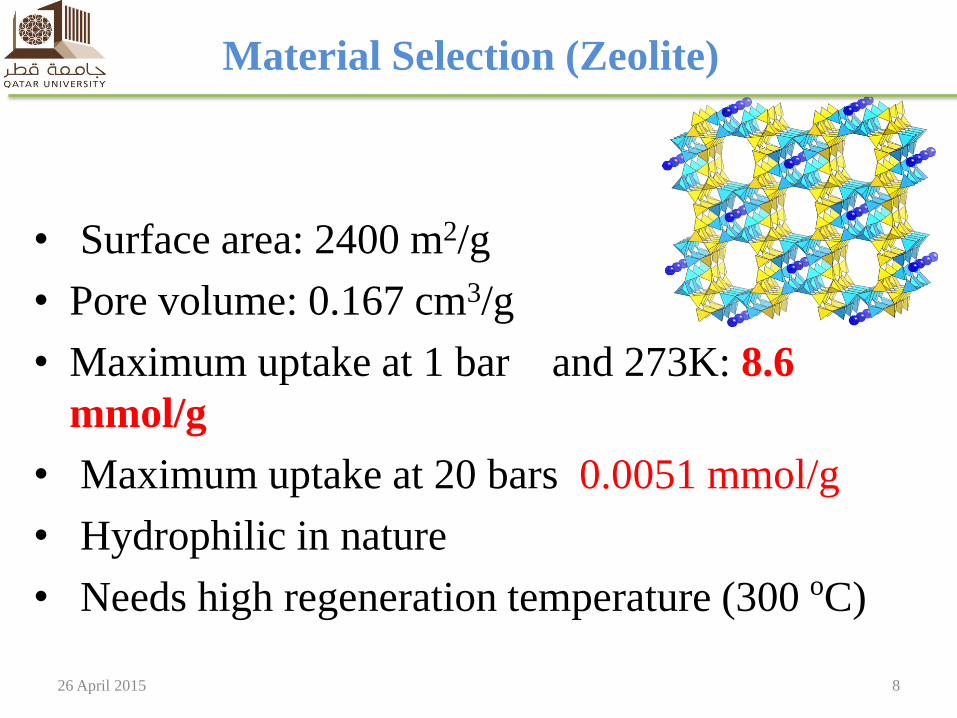
Material Selection (Zeolite)
• Surface area: 2400 m2/g
• Pore volume: 0.167 cm3/g
• Maximum uptake at 1 bar and 273K: 8.6
mmol/g
• Maximum uptake at 20 bars 0.0051 mmol/g
• Hydrophilic in nature
• Needs high regeneration temperature (300 oC)

26 April 2015 9
Material Selection (Activated Carbon)
Pore size Micropoers Mesopores Macropores
Diameter < 20 nm 20-50nm >50 nm
Pore
volume
(cm3/g)
0.15—0.5 0.020.1 0.5
Surface
area(m2/g)
100-1000 10-100 0.5-2
• Surface area: 2900 m2/g
• CO2uptake at 50 bar: 47 mmol/g
• Limitation at high pressure

26 April 2015 10
Atilhan Group
10
COFs
MOFs
DLH
Prussian Blue
MCO3Urea
Ionic Liquids
Amines
Zeolites
26 April 2015 11
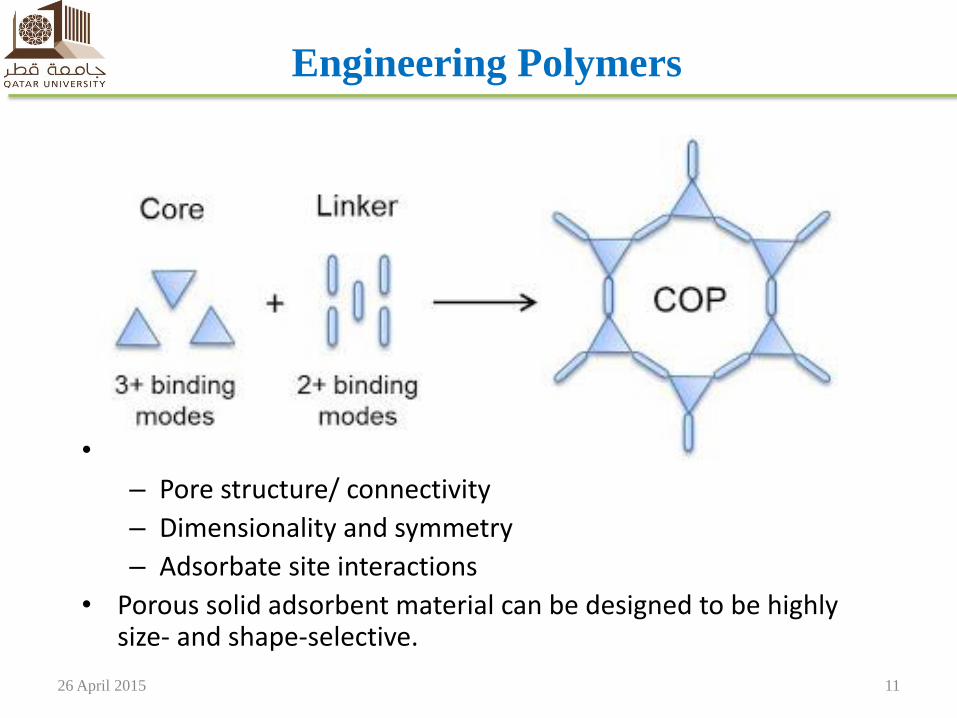
• Continuous innovation in control of:
– Pore structure/ connectivity
– Dimensionality and symmetry
– Adsorbate site interactions
• Porous solid adsorbent material can be designed to be highly size- and shape-selective.
Engineering Polymers
26 April 2015 12
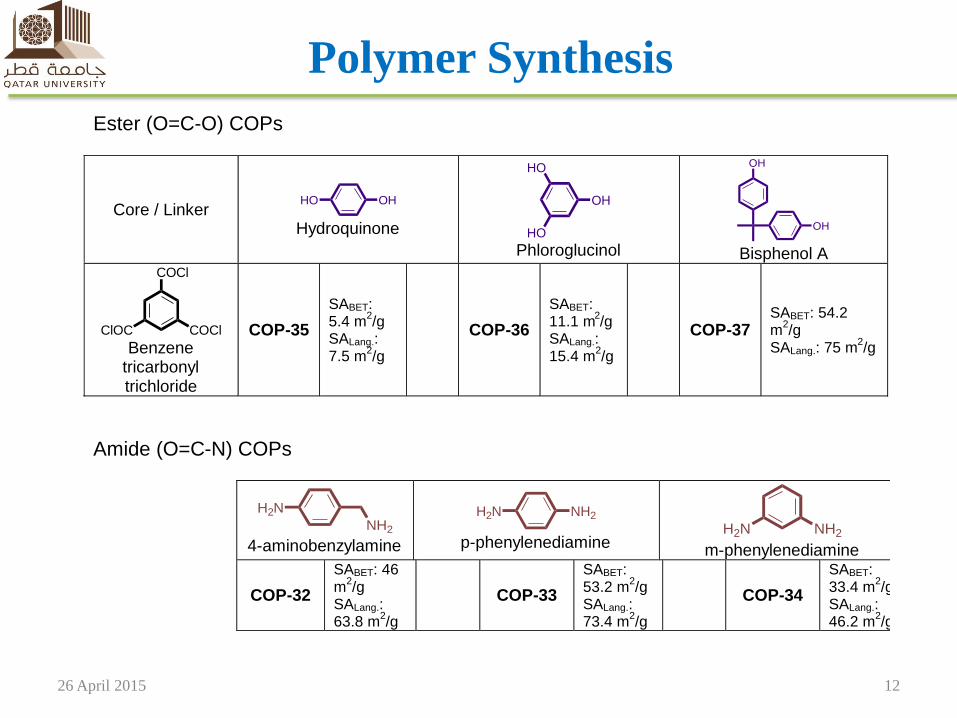
Ester (O=C-O) COPs
Core / Linker OHHO
Hydroquinone HO
HO
OH
Phloroglucinol
OH
OH
Bisphenol A
COCl
COClClOC Benzene
tricarbonyl trichloride
COP-35
SABET: 5.4 m
2/g
SALang.: 7.5 m
2/g
COP-36
SABET: 11.1 m
2/g
SALang.: 15.4 m
2/g
COP-37 SABET: 54.2 m
2/g
SALang.: 75 m2/g
Amide (O=C-N) COPs
NH2
H2N
4-aminobenzylamine
NH2H2N
p-phenylenediamine
NH2H2N m-phenylenediamine
COP-32
SABET: 46 m
2/g
SALang.: 63.8 m
2/g
COP-33
SABET: 53.2 m
2/g
SALang.: 73.4 m
2/g
COP-34
SABET: 33.4 m
2/g
SALang.: 46.2 m
2/g
Polymer Synthesis
26 April 2015 13
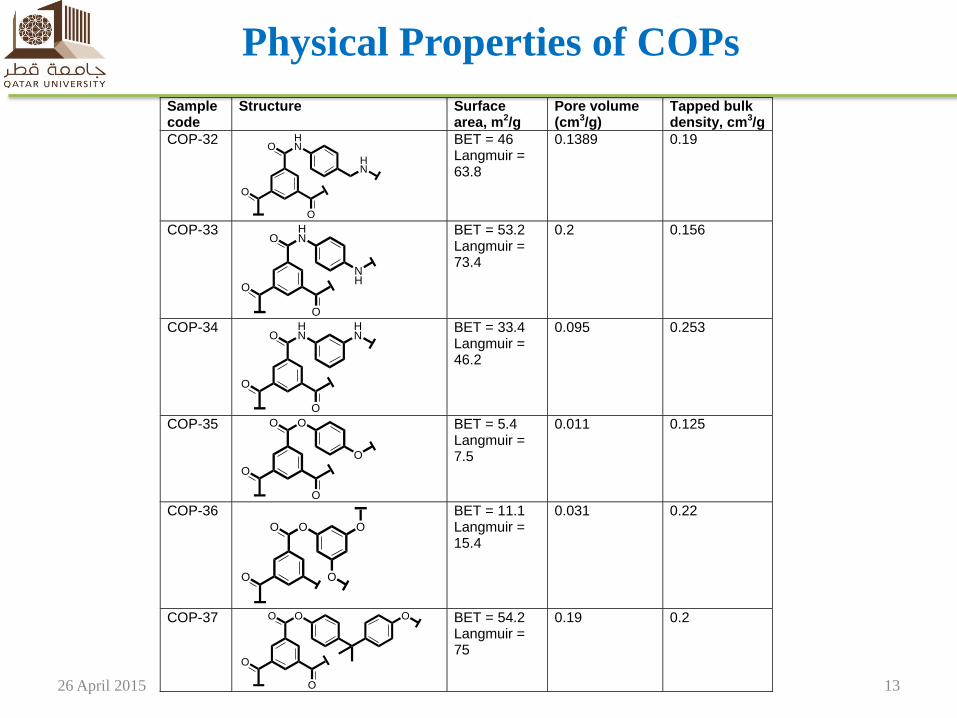
Physical Properties of COPs
Sample code
Structure Surface area, m2/g
Pore volume (cm3/g)
Tapped bulk density, cm3/g
COP-32 O
O
O
HN
HN
BET = 46 Langmuir = 63.8
0.1389 0.19
COP-33 O
O
O
HN
NH
BET = 53.2 Langmuir = 73.4
0.2 0.156
COP-34 O
O
O
HN
HN
BET = 33.4 Langmuir = 46.2
0.095 0.253
COP-35 O
O
O
O
O
BET = 5.4 Langmuir = 7.5
0.011 0.125
COP-36 O
O
O
O
O
BET = 11.1 Langmuir = 15.4
0.031 0.22
COP-37 O
O
O
O O
BET = 54.2 Langmuir = 75
0.19 0.2

26 April 2015 14
100 200 300 400 500 600 700 800
30
40
50
60
70
80
90
100
We
igh
t l
oss /
% w
t.
Temperature / o
C
COP-32
COP-33
COP-34
COP-35
COP-36
COP-37
4000 3500 3000 2500 2000 1500 1000 500
Wavelength / cm-1
COP-32
COP-33
COP-34
Tra
nsm
ittan
ce /
%
COP-33
COP-36
COP-37
COPs Characterization

26 April 2015 15
CO2 Solubility Measurements
• We used Rubotherm® sate-of-the-art gas
sorption apparatus.
• Two isotherms are used: 25 °C and 50 °C
• Three pressures ranges were used i.e. 1 bar, 10
bars and 200 bars.
• Buoyancy correction has been taken care of.
26 April 2015 16
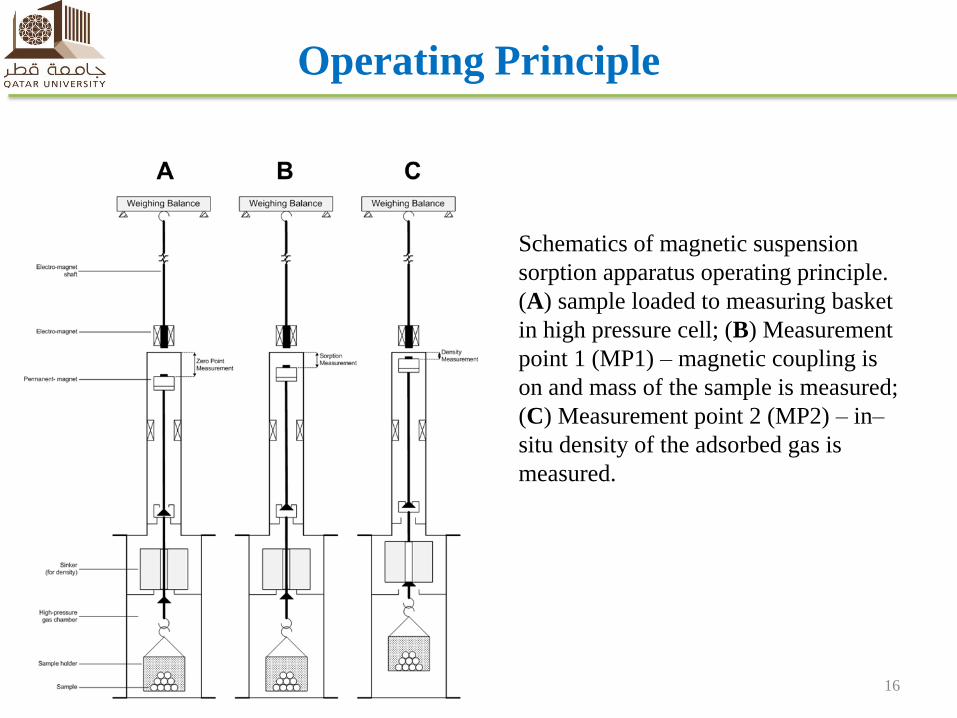
Operating Principle
Schematics of magnetic suspension
sorption apparatus operating principle.
(A) sample loaded to measuring basket
in high pressure cell; (B) Measurement
point 1 (MP1) – magnetic coupling is
on and mass of the sample is measured;
(C) Measurement point 2 (MP2) – in–
situ density of the adsorbed gas is
measured.
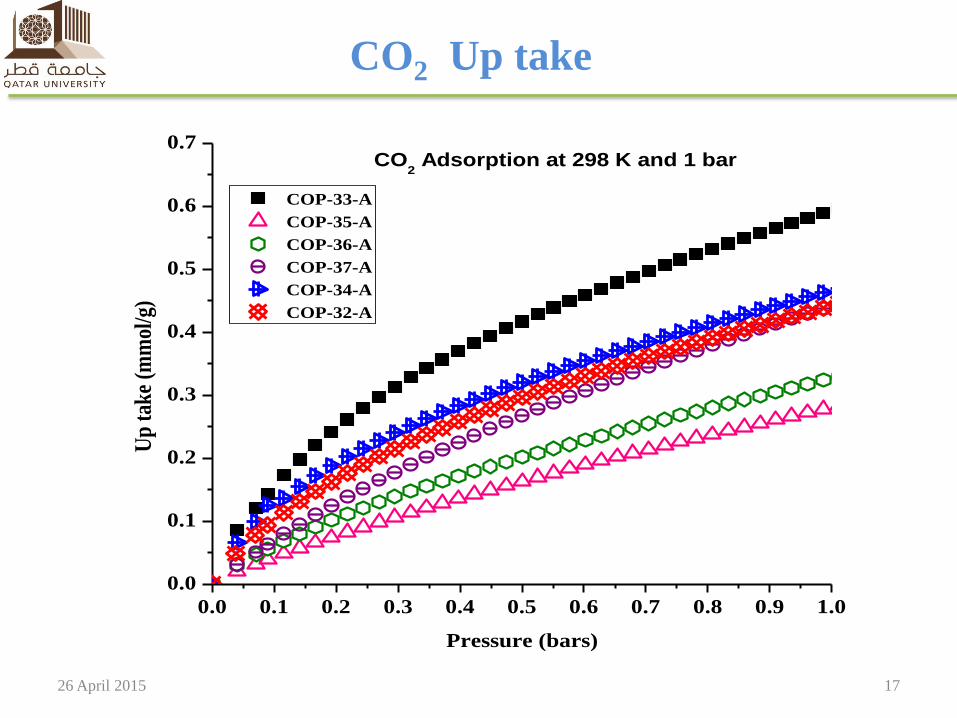
26 April 2015 17
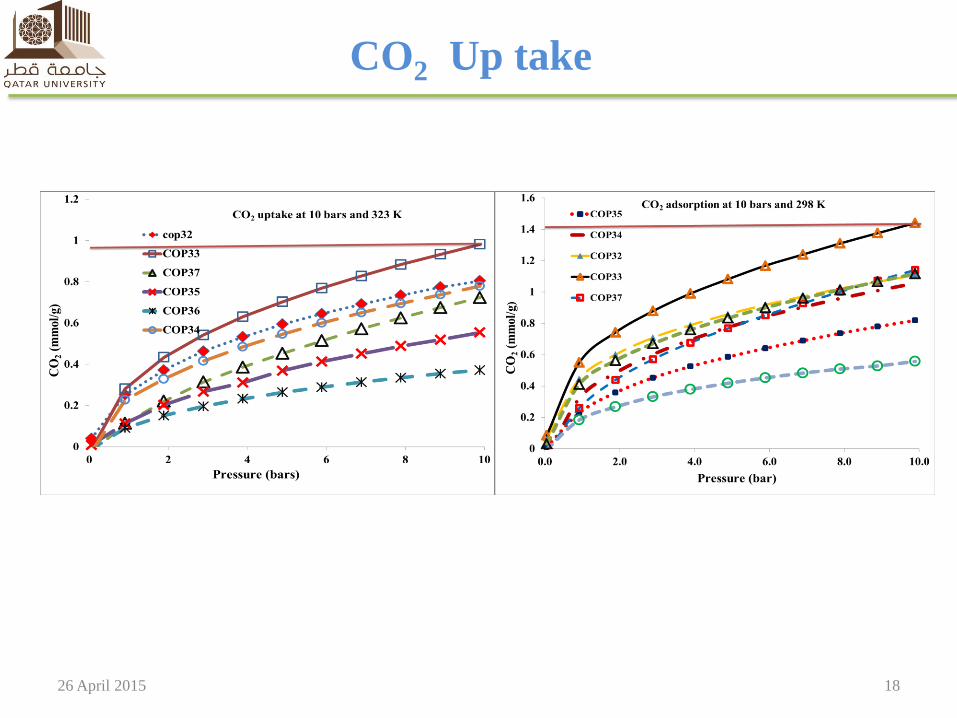
CO2 Up take
0.0 0.1 0.2 0.3 0.4 0.5 0.6 0.7 0.8 0.9 1.0
0.0
0.1
0.2
0.3
0.4
0.5
0.6
0.7CO
2 Adsorption at 298 K and 1 bar
COP-33-A
COP-35-A
COP-36-A
COP-37-A
COP-34-A
COP-32-A
Up
tak
e (m
mol
/g)
Pressure (bars)
26 April 2015 18
CO2 Up take
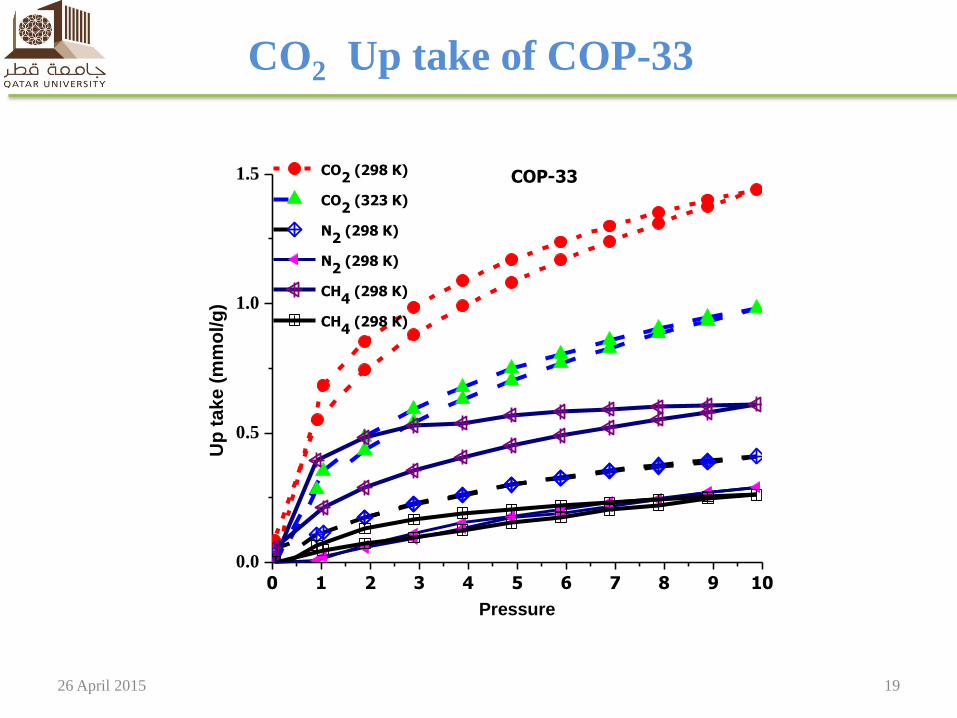
26 April 2015 19
0 1 2 3 4 5 6 7 8 9 10
0.0
0.5
1.0
1.5
Up
ta
ke
(m
mo
l/g
)
Pressure
CO2
(298 K)
CO2
(323 K)
N2
(298 K)
N2
(298 K)
CH4
(298 K)
CH4
(298 K)
COP-33
CO2 Up take of COP-33
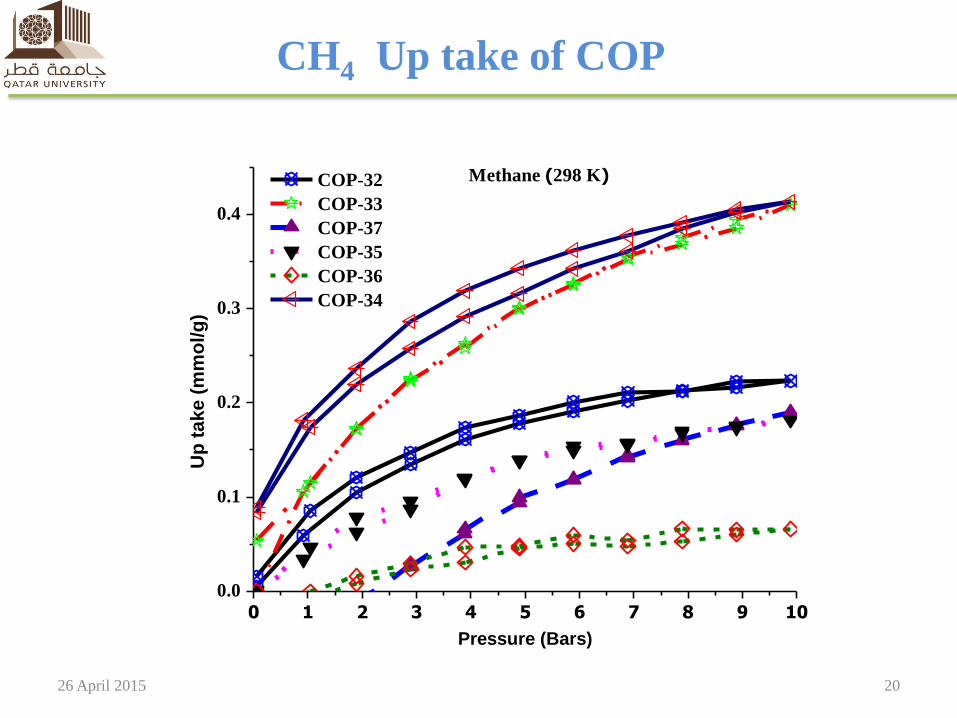
26 April 2015 20
0 1 2 3 4 5 6 7 8 9 10
0.0
0.1
0.2
0.3
0.4
Methane (298 K)
Up
ta
ke
(m
mo
l/g
)
Pressure (Bars)
COP-32
COP-33
COP-37
COP-35
COP-36
COP-34
CH4 Up take of COP
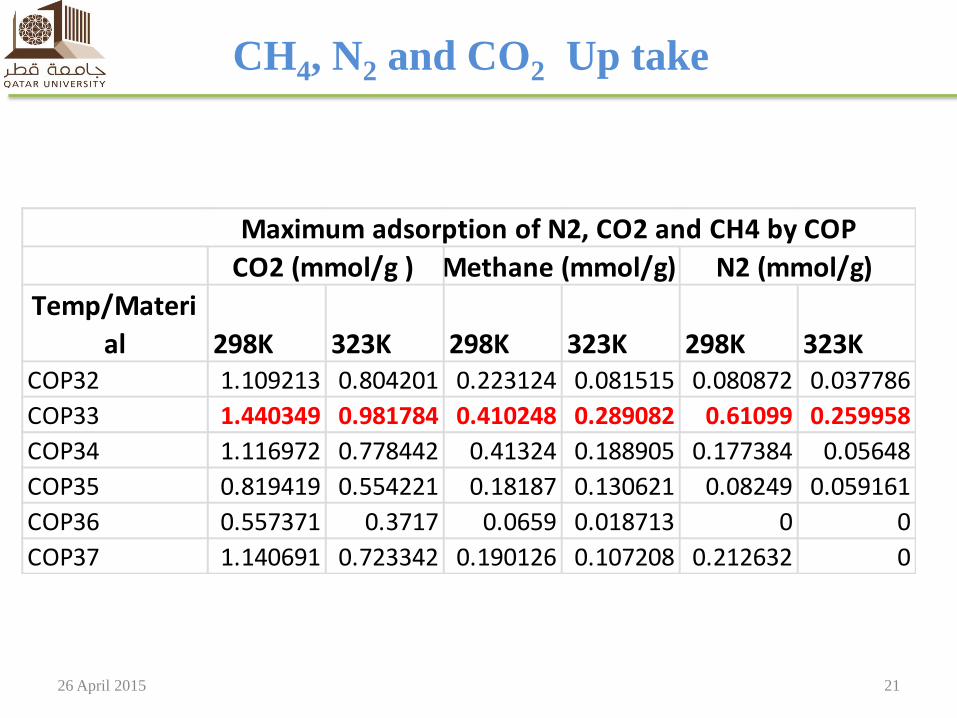
26 April 2015 21
Temp/Materi
al 298K 323K 298K 323K 298K 323KCOP32 1.109213 0.804201 0.223124 0.081515 0.080872 0.037786
COP33 1.440349 0.981784 0.410248 0.289082 0.61099 0.259958
COP34 1.116972 0.778442 0.41324 0.188905 0.177384 0.05648
COP35 0.819419 0.554221 0.18187 0.130621 0.08249 0.059161
COP36 0.557371 0.3717 0.0659 0.018713 0 0
COP37 1.140691 0.723342 0.190126 0.107208 0.212632 0
Maximum adsorption of N2, CO2 and CH4 by COP
CO2 (mmol/g ) Methane (mmol/g) N2 (mmol/g)
CH4, N2 and CO2 Up take

26 April 2015 22
0 50 100 150 200
0
10
20
30
40
50
60
70
COP-33
Up
tak
e (m
mol/
g)
Pressure (bars)
CO2
H2
N2
CH4
CO2 Up take of COP-33
26 April 2015 23
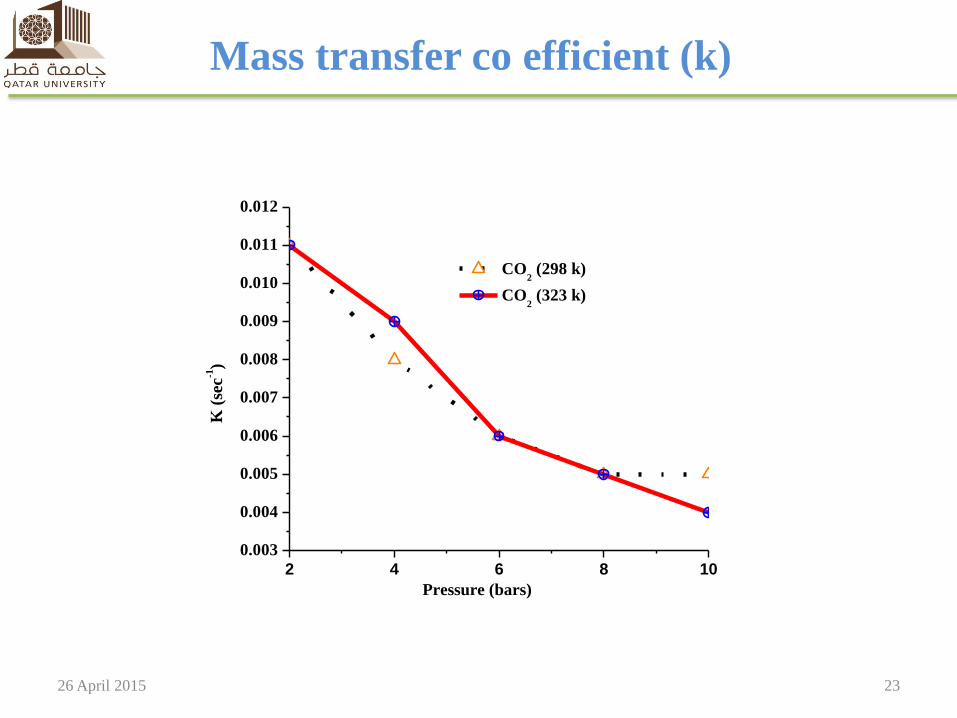
2 4 6 8 10
0.003
0.004
0.005
0.006
0.007
0.008
0.009
0.010
0.011
0.012K
(se
c-1)
Pressure (bars)
CO2 (298 k)
CO2 (323 k)
Mass transfer co efficient (k)
26 April 2015 24
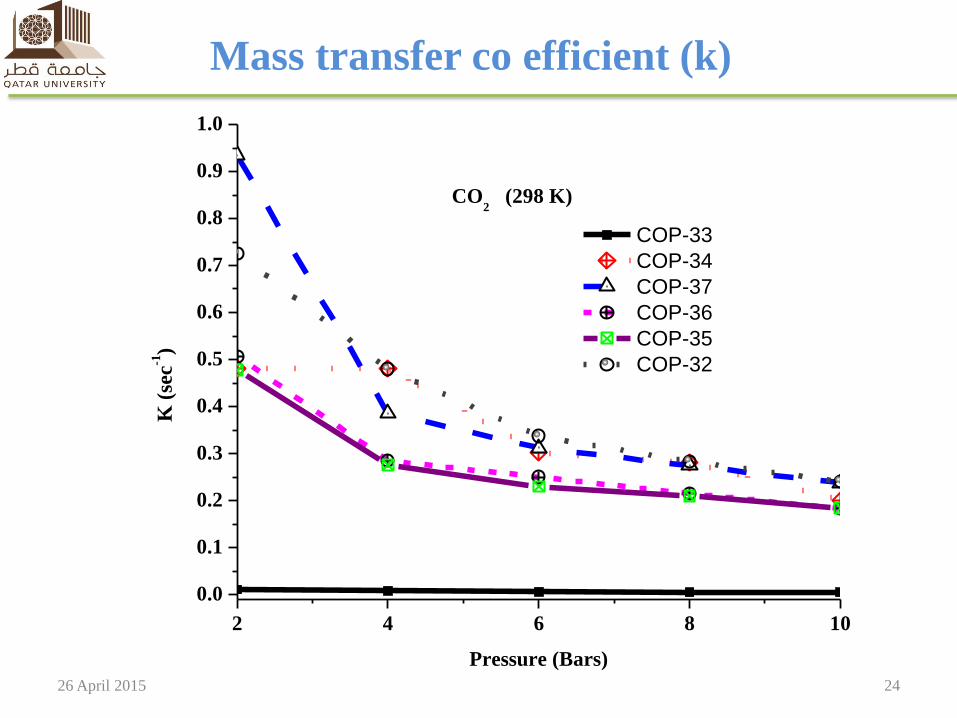
2 4 6 8 10
0.0
0.1
0.2
0.3
0.4
0.5
0.6
0.7
0.8
0.9
1.0
K (
sec
-1)
CO2 (298 K)
Pressure (Bars)
COP-33
COP-34
COP-37
COP-36
COP-35
COP-32
Mass transfer co efficient (k)
26 April 2015 25
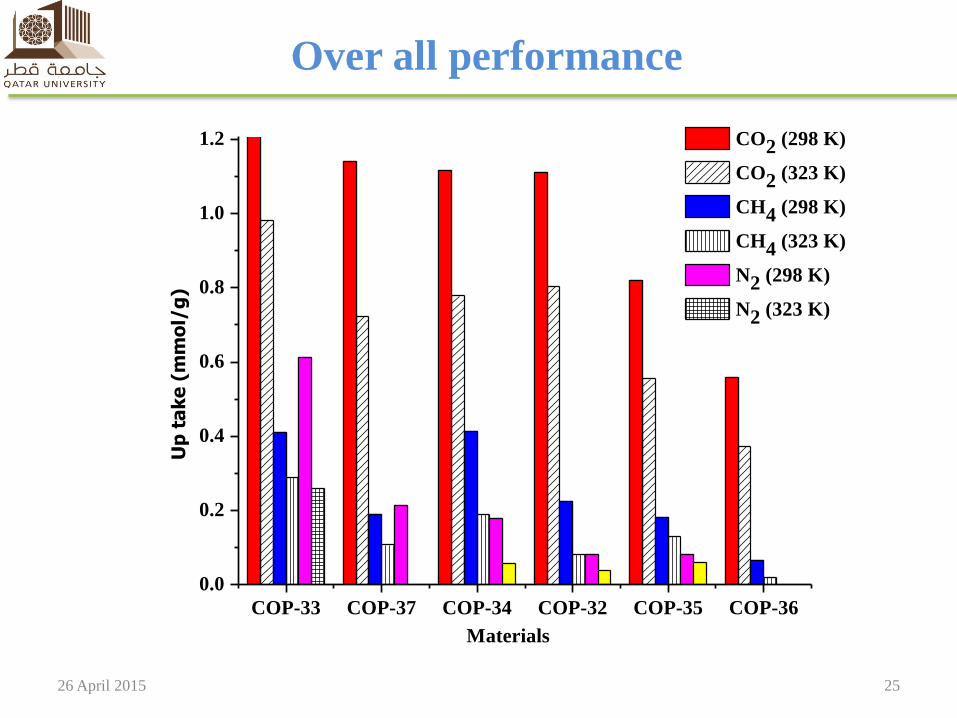
COP-33 COP-37 COP-34 COP-32 COP-35 COP-36
0.0
0.2
0.4
0.6
0.8
1.0
1.2
Up
ta
ke
(m
mo
l/g
)
Materials
CO2 (298 K)
CO2 (323 K)
CH4 (298 K)
CH4 (323 K)
N2 (298 K)
N2 (323 K)
Over all performance
26 April 2015 26
Group…
26

26 April 2015 27
Funding
• QNRF
– NPRP 5-499-1-088
– UREP 15-131-2-044
• Spanish National Secretariat for Research and
Development, Ministry of Economy.