separation with porous covalent triazine-based frameworks from
TRANSCRIPT

S1
Two linkers are better than one: Enhancing CO2 capture and separation with porous covalent triazine-based frameworks from mixed nitrile linkers.
Subarna Dey,a Asamanjoy Bhunia,a Hergen Breitzke,b Pedro B. Groszewicz,b Gerd Buntkowskyb and Christoph Janiaka,*a Institut für Anorganische Chemie und Strukturchemie, Heinrich-Heine Universität Düsseldorf, 40204 Düsseldorf, Germany. b Eduard-Zintl-Institut, Technische Universität Darmstadt, Alarich-Weiss-Str. 8, 64287 Darmstadt* Corresponding author: E-mail: [email protected]; Fax: + 49-211-81-12287; Tel: +49-211-81-12286.Further emails: [email protected], [email protected], [email protected], [email protected], [email protected]
Table of contents
page1. Experimental Section S2-S32. Syntheses of CTFs S4-S53. Elemental analysis of MM1-MM4 S6-S104. Powder X-ray diffraction (PXRD) patterns of MM1-MM4 S125. Thermogravimetric analysis (TGA) S136. Selectivity from initial slopes in the Henry region S14-S157. Ideal adsorbed solution theory (IAST) selectivity studies S16-S188. Karl Fischer Titration S199. Water adsorption S2010. Comparison to other CTFs. Table S6: Surface area, CO2 adsorption properties
and selectivity of triazine-based polymer.S20-S22
11. Scanning electron micrograph of MM1-MM4 S2312. Virial equation analysis of CO2 adsorption data for calculation of the Qst
valuesS24
13. Gas sorption of MM'-CTF materials synthesized at 300 °C and 600 °C (MM2-300, MM2-600 and MM4-600)
S25
14. Solid-state NMR spectroscopy S26-S2715. References S28
Electronic Supplementary Material (ESI) for Journal of Materials Chemistry A.This journal is © The Royal Society of Chemistry 2017
S2
1. Experimental Section
Materials and methods
All chemicals were purchased from commercial suppliers (Sigma-Aldrich, Acros Organics, and Alfa Aesar chemical company) and used without further purification, unless stated otherwise. Tetrakis(4-cyanophenyl)ethylene was synthesized according to the reported procedures.1
Infrared (IR) spectra were obtained on a Bruker FT-IR Tensor 37 Spectrometer in the 4000-550 cm–1 region with 2 cm–1 resolution as KBr disks. Solution 1H and 13C spectra were recorded on a Avance DRX-500 instruments. Elemental (CNH) analyses were carried out with a PerkinElmer 2400 series 2 elemental analyzer. Powder X-ray diffraction (PXRD) data was collected on a Bruker D2 Phaser diffractometer using a flat sample holder (also a flat silicon, low background sample holder) and Cu Kα1/α2 radiation with λ = 1.5418 Å at 30 kV covering 2theta angles 5-80° over a time of 2 h, that is. 0.01°/sec. Diffractograms were obtained on flat layer sample holders where at low angle the beam spot is strongly broadened so that only a fraction of the reflected radiation reaches the detector which leads to low relative intensities measured at 2θ< 7°. For hygroscopic or air-sensitive samples, the sample holder can be sealed with a dome. Scanning electron microscopy (SEM) images were obtained using an ESEM Quanta 400 FEG SEM equipped with a secondary electron detector for energy-dispersive X-ray spectroscopy or on a a Jeol JSM-6510LV QSEM Advanced electron microscope using a LAB-6 cathode at 5-20 keV. This microscope is equipped with a Bruker Xflash 410 silicon drift detector and the Bruker ESPRIT software for EDX analysis. Thermogravimetric analyses (TGA) were carried out at a ramp rate of 5 °C/min in a N2 flow with a Netzsch Thermo-Microbalance Apparatus TG 209 F3 Tarsus.
X-ray photoelectron spectroscopy (XPS) analysis was performed on an ESCALAB Fisons/VG Scientific ESCALAB 200XPS Spectrometer. The spectra were obtained at a temperature of 70-80 °C and a vacuum of 1x10⁻⁹ mbar with pass energy of 50 eV and Al-Kα radiation (h = 1486.6 eV) operated at 200 W and 12 kV with total acquisition time of 8 min. The binding energy region from 200-600 eV was scanned for determining the C/N ratio.
Gas sorption isotherms were measured using a Micromeritics ASAP 2020 automatic gas sorption analyzer equipped with oil-free vacuum pumps (ultimate vacuum <10–8 mbar) and valves, which guaranteed contamination free measurements. The sample was connected to the preparation port of the sorption analyzer and degassed under vacuum until the outgassing rate, i.e., the rate of pressure rise in the temporarily closed manifold with the connected sample tube, was less than 2 Torr/min at the specified temperature 200 °C. After weighing, the sample tube was then transferred to the analysis port of the sorption analyzer. All used gases (H2, He, N2, CO2, CH4) were of ultra high purity (UHP, grade 5.0, 99.999%) and the STP volumes are given according to the NIST standards (293.15 K, 101.325 kPa). Helium gas was used for the determination of the cold and warm free space of the sample tubes. H2 and N2 sorption isotherms were measured at 77 K (liquid nitrogen bath), whereas CO2 and CH4 sorption isotherms were measured at 2931 K (passive thermostating) and 273.15 K (ice/deionized water bath). The heat of adsorption values and the DFT pore size distributions (‘N2 DFT slit pore’ model) were calculated out using the ASAP 2020 v3.05 software.
A coulometric Karl-Fischer titration for the determination of the water content was carried out with a Karl-Fischer titration apparatus AQUA 40.00 with headspace module. The solid CTF sample was heated to 170 °C in the head space module and the liberated water transferred to the measurement cell.

S3
Water sorption isotherms at 20 °C were obtained volumetrically from a Quantachrome Autosorb iQ MP instrument equipped with an all-gas option. Prior to the sorption experiments, the compounds were degassed (130 °C, 2h) under dynamic vacuum.
1H /19F/13C CP MAS solid state NMR measurements were carried out at room temperature on a Bruker AVANCE II+ spectrometer at 400 MHz for 1H resonance frequency, employing a Bruker 3.2 mm H/F/X/Y MAS probe. 1H/19F/13C CP MAS spectra were recorded utilizing ramped CP-MAS sequences at spinning rates of 8 kHz. Contact times were set to 1.5 ms and tppm decoupling with a 20° phase jump was applied during data acquisition.1H /19F/13C CP MAS spectra were recorded under various decoupling conditions i.e. applying 1H, 19F decoupling only for 1H/13C and 19F/13CP, respectively, and applying 1H/19F decoupling simultaneously during data acquisition. High resolution 1H and 19F spectra were recorded on a Bruker AVANCE III Spectrometer at 600 MHz 1H resonance frequency employing a Bruker 1.3 mm H/X MAS Probe at 50 kHz spinning rate at room temperature. 1H/13C LG-HETCOR spectrum was recorded at 12 kHz spinning speed and 1.5 ms contact time. LG-decoupling field strength was set to 75 kHz, 1H tppm decoupling with a 20° phase jump was applied during data acquisition. Indirect dimension referencing was done by setting the correlation peak to the chemical shift of the aromatic peak of the 1H high speed MAS spectrum recorded at 600 MHz. 13C and 1H solid state NMR spectra were referenced to tetramethylsilane, 19F spectra were referenced with respect to CFCl3.

S4
2. Synthesis of CTFs (MM1-MM4)
- reaction temperature 400 °C
MM1: A mixture of tetrakis(4-cyanophenyl)ethylene (100 mg, 0.23 mmol), terephthalonitrile (60 mg,
0.46 mmol) and ZnCl2 (940 mg, 6.19 mmol) were placed into a Pyrex ampoule under inert conditions.
The ampoule was evacuated, sealed and heated to 400 °C for 48 h followed by cooling to room
temperature. The black product was collected and stirred with water for 72 h. Then the product was
isolated by filtration and again stirred with 100 mL of 2 mol/L HCl for 24 h. The resulting black powder
was further washed with water (3 × 50 mL), THF (3 × 30 mL), acetone (3 × 30 mL) and dried in vacuum.
Yield: 130 mg, 81 %.
MM2: A mixture of tetrakis(4-cyanophenyl)ethylene (100 mg, 0.23 mmol), tetrafluoroterephthalonitrile
(92 mg, 0.46 mmol) and ZnCl2 (940 mg, 6.91 mmol) were placed into a Pyrex ampoule under inert
conditions. The ampoule was evacuated, sealed and heated to 400 °C for 48 h followed by cooling to
room temperature. The black product was collected and stirred with water for 72 h. Then the product was
isolated by filtration and again stirred with 100 mL of 2 mol/L HCl for 24 h. The resulting black powder
was further washed with water (3 × 50 mL), THF (3 × 30 mL), acetone (3 × 30 mL) and dried in vacuum.
Yield: 137 mg, 71 %.
MM3: A mixture of tetrakis(4-cyanophenyl)ethylene (75 mg, 0.17 mmol), 4,4′-biphenyldicarbonitrile
(71 mg, 0.35 mmol) and ZnCl2 (713 mg, 5.34 mmol) were placed into a Pyrex ampoule under inert
conditions. The ampoule was evacuated, sealed and heated to 400 °C for 48 h followed by cooling to
room temperature. The black product was collected and stirred with water for 72 h. Then the product was
isolated by filtration and again stirred with 100 mL of 2 mol/L HCl for 24 h. The resulting black powder
was further washed with water (3 × 50 mL), THF (3 × 30 mL), acetone (3 × 30 mL) and dried in vacuum.
Yield: 127 mg, 87 %.
MM4: A mixture of tetrakis(4-cyanophenyl)ethylene (86 mg, 0.2 mmol), 1,3,5-benzenetricarbonitrile
(40 mg, 0.26 mmol) and ZnCl2 (627 mg, 4.6 mmol) were placed into a Pyrex ampoule under inert
conditions. The ampoule was evacuated, sealed and heated to 400 °C for 48 h followed by cooling to
room temperature. The black product was collected and stirred with water for 72 h. Then the product was
isolated by filtration and again stirred with 100 mL of 2 mol/L HCl for 24 h. The resulting black powder
was further washed with water (3 × 50 mL), THF (3 × 30 mL), acetone (3 × 30 mL) and dried in vacuum.
Yield: 105 mg, 83 %.
S5
- other reaction temperatures:
MM2-300: A mixture of tetrakis(4-cyanophenyl)ethylene (M, 100 mg, 0.23 mmol),
tetrafluoroterephthalonitrile (M2, 92 mg, 0.46 mmol) and ZnCl2 (940 mg, 6.91 mmol) were placed into
a Pyrex ampoule under inert conditions. The ampoule was evacuated, sealed and heated to 300 °C for 48
h followed by cooling to room temperature. The black product was collected and stirred with water for
72 h. Then the product was isolated by filtration and again stirred with 100 mL of 2 mol/L HCl for 24 h.
The resulting black powder was further washed with water (3 × 50 mL), THF (3 × 30 mL), acetone (3 ×
30 mL) and dried in vacuum.
MM2-600: A mixture of tetrakis(4-cyanophenyl)ethylene (M, 100 mg, 0.23 mmol),
tetrafluoroterephthalonitrile (M2, 92 mg, 0.46 mmol) and ZnCl2 (940 mg, 6.91 mmol) were placed into
a quartz ampoule under inert conditions. The ampoule was evacuated, sealed and heated to 600 °C for
48 h followed by cooling to room temperature. The black product was collected and stirred with water
for 72 h. Then the product was isolated by filtration and again stirred with 100 mL of 2 mol/L HCl for
24 h. The resulting black powder was further washed with water (3 × 50 mL), THF (3 × 30 mL), acetone
(3 × 30 mL) and dried in vacuum.
MM4-600: A mixture of tetrakis(4-cyanophenyl)ethylene (M, 86 mg, 0.2 mmol), 1,3,5-
benzenetricarbonitrile (M4, 40 mg, 0.26 mmol) and ZnCl2 (627 mg, 4.6 mmol) were placed into a quartz
ampoule under inert conditions. The ampoule was evacuated, sealed and heated to 600 °C for 48 h
followed by cooling to room temperature. The black product was collected and stirred with water for 72
h. Then the product was isolated by filtration and again stirred with 100 mL of 2 mol/L HCl for 24 h.
The resulting black powder was further washed with water (3 × 50 mL), THF (3 × 30 mL), acetone (3 ×
30 mL) and dried in vacuum.

S6
3. Elemental analysis of MM1-MM4
Table S1a Elemental analysis of MM1-MM4 (combustion analysisCalculated (%) b Found (%)Material a
C H N C/H C/N C H N C/H C/NMM1 80.22 3.51 16.27 1.9 5.7 79.09 2.52 5.77 2.6 16.0MM2synth.300°C
66.3566.35
1.941.94
13.4513.45
2.92.9
5.75.7
65.4367.12
4.023.25
10.7312.83
1.41.7
7.16.1
MM3 82.84 3.84 13.33 1.8 7.3 79.15 2.87 3.19 2.4 28.9MM4 79.23 3.17 17.6 2.10 5.24 74.99 3.46 9.79 1.8 8.9
a Synthesis at 400 °C unless mentioned otherwise.b Calculated based on the following formulae according to the used stoichiometric ratios (without considering the adsorption of moisture (see below):MM1 :
N
NN CN
NC
CNNC
NCCN
CNNC
NC
+
CN
CN
ZnCl2/400 °C
1 2
C30H16N4 C8H4N2 C46H24N8Molecular Weight: 688.74
MM2 :
N
NN CN
NC
CNNC
NCCN
CNNC
NC
+
CN
CN
ZnCl2/400 °CF
FF
FF F
FFF
F
F
F
1 2
C30H16N4 C8F4N2 C46H16F8N8, Molecular Weight: 832.66
MM3 :
CN
CNNC
NC
+
ZnCl2/400 °C
1 2 N
N
N
NC CN
CN
CN
NCCN
CN
C30H16N4 C14H8N2 C58H32N8, Molecular Weight: 840.93MM4 :

S7
CN
CNNC
NC
+
ZnCl2/400 °C
1N
N
N
CN
CN
NCCN
CNNCCN
CNCN
NC
1.3
C30H16N4 C9H3N3 ~C42H20N8, Molecular Weight: 636
The elemental analysis of MM1-MM4 give a much lower nitrogen content and concomitantly a much higher than calculated C/N ratio. This indicates that most of the nitrogen is lost due to decomposition (Scheme S1).
N
N
N 400 °CHCN + NH3 + nitrogenious
carbon+ ring condensation
network
Scheme S1 General schematic representation for the decomposition of a triazine ring.
The mismatch in N-content (calculated and found) is a combination of triazine ring decompositions together with residual ZnCl2. We note that the powder diffractograms for MM1, MM3 and MM4 show a distinct peak at 2θ = 17.2° which is assigned to the (111) plane from ZnCl2. It is these MM'-CTFs which also have the lowest N content.
However irregular distributions of the M and M1-4 building units in the resulting CTFs cannot be responsible as even the separate reaction of M and M' only with itself, which would give a mixture of M-CTF and M'-CTF, would still have to give the same theoretical C, H, N values for this mixture than for the ideal MM'-CTF. Also, unreacted –CN functional sites cannot explain the deviation as the polymerization reaction retains the full monomer formula content, that is, even the mixture of monomers will have the same calculated C, H, N values as the ideal MM'-CTF product.

S8
Table S1b Elemental analysis of MM1-MM4 from energy-dispersive X-ray spectroscopy (EDX) and X-ray photoelectron spectroscopy (XPS)
EDX XPS CHNElement@MM1 atom% a C/N d atom%
(%286 eV) cC/N d molar C/N found d
C 91.2 13.6 93.9 (11) 15.4 16.0N 6.7 6.1Zn 0.7 n.d.Cl 0.4 n.d.
Element@MM2(400 °C)C 86.1 6.7 87.5 (30) 7.0 7.1N 12.8 12.5F 0.6 (1) eZn 0.2 n.d.Cl 0.2 n.d.
Element@MM2(300 °C) b
C 77.4 7.0 6.1N 11.1F 11.5 (F:N=1.0)
Element@MM3C 94.6 19.3 95.0 (14) 19.0 28.9N 4.9 5.0Zn 0.3 n.d.Cl 0.2 n.d.
Element@MM4C 90.3 10.1 90.9 (20) 10.0 8.9N 8.9 9.1Zn 0.5 n.d.Cl 0.4 n.d.
a Based on the K lines. Note that quantification of atom% values for non-neighboring element is prone to large errors because of different cross-sections for the K-shell electron ionization together with different matrix effects for absorption of the emitted X-ray photons.
b Average from two samples with two EDX sampled regions each. The molar F:N ratio of 1.0 is the required ratio from the above formulae according to the used stoichiometric ratios.
c C and N content set to 100%. The value in parenthesis is the share (in %) of the tail contribution to the C 1s peak.
The C 1s peak (with a maximum at ~284 eV) can be de-convoluted into two or even three contributions and has a pronounced tail towards 286 eV. The peak-tail at ~286 eV can be assigned to C-N bound carbon atoms. The trend of a larger percentage of the 286 eV peak coincides with a larger amount of nitrogen found in the material. n.d. = not determined.- see graphics below (on next three pages for C1s regions.
d Carbon and nitrogen quantification by EDX and XPS are in excellent agreement concerning atom% amount and molar C/N ratio. The trend in the molar C/N ratio also agrees with the molar ratio determined by combustion analysis.
e Only a very small F 1s peak, barely about the noise level, could be detected with low accuracy (see following graphic).

S9
X-ray spectroscopy (XPS) of sample MM2(400 °C)
X-ray spectroscopy (XPS) of MM' samples (400 °C)
C 1s region for MM1. Contribution at 285.7 eV (11.2%), 284.6 eV (26.7%), 283.6 (62.1%):
C 1s
C 1s
C 1s
C 1s
x 103
2
4
6
8
10
CPS
292 290 288 286 284 282 280 278 276 274Binding Energy (eV)

S10
C 1s region for MM2. Contribution at 285.0 eV (30.3%), 283.8 (69.7%):
C 1s
C 1s
C 1s
x 102
10
20
30
40
50
60
70
80
90
100
CPS
292 290 288 286 284 282 280 278 276 274Binding Energy (eV)
C 1s region for MM3. Contribution at 285.5 eV (13.9%), 284.0 (86.1%):
C 1s
C 1s
C 1s
x 103
2
4
6
8
10
12
14
16
CPS
292 290 288 286 284 282 280 278 276 274Binding Energy (eV)

S11
C 1s region for MM4. Contribution at 285.4 eV (20.4%), 283.8 (79.6%):
C 1s
C 1s
C 1s
x 102
10
20
30
40
50
60
70
80
CPS
292 290 288 286 284 282 280 278 276 274Binding Energy (eV)
The presence of hydrated zinc and zinc hydroxide species would lead to chemisorption of CO2 according to: [Zn]-OH + CO2 --> [Zn]-OCO2H
However, from the formed Zn-bicarbonate the CO2 would not be released again at room temperature. So, in our CO2 sorption isotherms we should then have seen a hysteresis which does not close towards p --> 0 mmHg. Most likely, the above uptake of CO2 from ambient air by hydrated Zn species will have already occurred upon storage of the sample under air. Therefore, we are confident that the CO2 uptake from gas sorption reflects the uptake by the porosity of the network and not by the Zn species.

S12
4. Powder X-ray diffraction (PXRD) patterns of MM1-MM4
Fig. S1: Powder X-ray pattern of MM1-MM4 and its comparison with ZnCl2. Single peak with * is from ZnCl2 for the (111) plane at 2θ = 17.2°.2

S13
5. Thermogravimetric analysis (TGA)
All materials (MM1-MM4) show definite weight loss before decomposition. Both weight loss and
decomposition temperature are summarized in Table S2.
Table S2 Decomposition temperature for MM1-MM4.Compound Decomposition
Temperature (°C)Weight loss at decomposition
temperature (%)
Weight loss until 100-150 °C temperature range (%)
MM1 440 7.4 3.2
MM2 460 19.02 9.5-10.4
MM3 385 10.96 3.1-3.2
MM4 450 10.95 2.7-2.9
Fig. S2: TGA for MM1-MM4 in temperature range of 25 to 1000 °C at the heating rate of 5 °C / min.

S14
6. Selectivity from initial slopes in the Henry region
Fig. S3: The initial slopes in the Henry region of the adsorption isotherms for MM1 at 273 K (left) and 293 K (right).
Fig. S4: The initial slopes in the Henry region of the adsorption isotherms for MM2 at 273 K (left) and 293 K (right).

S15
Fig. S5: The initial slopes in the Henry region of the adsorption isotherms for MM3 at 273 K (left) and 293 K (right).
Fig. S6: The initial slopes in the Henry region of the adsorption isotherms for MM4 at 273 K (left) and 293 K (right).

S16
7. Ideal Adsorbed Solution Theory (IAST) selectivity studies
IAST selectivities were calculated from the gas adsorption data using a single or dual-site Langmuir
model to fit the adsorption isotherms. For CO2 adsorption isotherm up to 1 bar, we assumed the double-
layer adsorption. Therefore, the low pressure (up to 1 bar) adsorption isotherms of CO2 measured at 273
K was fitted with the dual-site Langmuir (DSL) model. The equation is:
𝑞 = 𝑞𝐴 + 𝑞𝐵 = 𝑞𝑠𝑎𝑡,𝐴
𝑏𝐴𝑝
1 + 𝑏𝐴𝑝+ 𝑞𝑠𝑎𝑡,𝐵
𝑏𝐵𝑝
1 + 𝑏𝐵𝑝
Where, q is molar uptake of adsorbate (mmol/g), qsat is saturation uptake (mmol/g), b is the parameter
in single component Langmuir isotherm (bar-1), p is the pressure of bulk gas, the subscription of A and
B refers to different two sites.
On the other hand, due to the mono-layer adsorption of CH4 and N2 adsorption, the single-site
Langmuir models were used:
𝑞 = 𝑞𝑠𝑎𝑡𝑏𝑝
1 + 𝑏𝑝
The IAST selectivity Sads can be calculated from the following equation:
𝑆𝑎𝑑𝑠 =
𝑞1𝑞2
𝑝1𝑝2
A CO2:N2 ratio of 15:85 was used for calculating the gas mixture selectivities, which is typically the
flue gas composition.

S17
Table S3 Langmuir fitting parameters of CO2, CH4, and N2 adsorption isotherms of MM1, MM2,
MM3 and MM4 at 273 K and 1 bar (synthesized at 400 °C).
MM1@273K qsat,A(mmol/g)
bA(bar-1)
qsat,B(mmol/g)
bB(bar-1)
Adj. R2
CO2 0.79922 12.12842 9.64014 0.44951 0.99999CH4 3.33385 0.62106 0.9996N2 4.6281 0.0974 0.99997
MM2@273K qsat,A(mmol/g)
bA(bar-1)
qsat,B(mmol/g)
bB(bar-1)
Adj. R2
CO2 1.21485 14.75997 9.04758 0.67154 0.99998CH4 3.542 0.693 0.99968N2 2.84484 0.18657 0.99997
MM3@273K qsat,A(mmol/g)
bA(bar-1)
qsat,B(mmol/g)
bB(bar-1)
Adj. R2
CO2 0.4344 8.28541 10.16668 0.28643 1CH4 3.45169 0.37891 0.9999N2 2.88644 0.12548 0.9999
MM4@273K qsat,A(mmol/g)
bA(bar-1)
qsat,B(mmol/g)
bB(bar-1)
Adj. R2
CO2 0.83529 11.16812 7.98059 0.50873 0.9999CH4 3.15435 0.51096 0.99985N2 2.74336 0.13795 0.99998

S18
Fig. S7: DSL fitting for CO2 adsorption and SSL fittings for CH4 and N2 adsorption at 273 K for MM1
(left) and MM2 (right).
Fig. S8: DSL fitting for CO2 adsorption and SSL fittings for CH4 and N2 adsorption at 273 K for MM3
(left) and MM4 (right).

S19
8. Karl Fischer Titration
Fig. S9: Karl-Fisher Titration plot for MM1-MM4
Table S4 Amount of water absorbed on CTFs measured by Karl-Fisher Titration
CTFs a Water loading (wt %)
MM1 5.1
MM2 17.5
MM3 1.9
MM4 6.3
a Sample had been stored under ambient air with about 50% air humidity.

S20
9. Water adsorption isotherms
Table S5 Water uptake values for MM1- MM4 at 20 °CUptake at P/P0 = 0.1 Uptake at P/P0 = 0.5 Uptake at P/P0 = 0.9
a
Vtot bCTFs
cm3/g g/g cm3/g g/g cm3/g g/g cm3/g
MM1 12 0.0096 140 0.11 622 0.498 1.11
MM2 44 0.035 377 0.3 548 0.439 0.67
MM3 7 0.0056 56 0.04 948 0.7596 1.52
MM4 17 0.0136 205 0.17 480 0.384 0.78
a The uptake near saturation pressure is not so much determined by the hydrophilicity but by the
porosity and available pore volume Vtot due to capillary condensationb Total pore volume at P/P0 = 0.95 for pores ≤20 nm (repeated from Table 1 in paper).
10. Comparison to other CTFs
Table S6 Surface area, CO2 adsorption properties and selectivity of triazine-based polymer.CO2 uptake (mmol/g) at 1
bar aCO2/N2 selectivity
bCompound BET
(m2/g)273 K 298 K or
293 K
Qst
Henry IAST
Ref.
CTF-0-400-600
2011 4.22 3
CTF-1 746 2.47 1.41 27.5 20 4
CTF-1-600 1533 3.82 2.25 30.0 13 4
FCTF-1 662 4.67 3.21 35.0 31 4
FCTF-1-600
1535 5.53 3.41 32 19 4
CTF-P2 776 1.84 20.3 5
CTF-P3 571 2.22 22.5 5
CTF-P4 867 3.05 16.6 5
CTF-P5 960 2.94 24.1 5
CTF-P6 1152 3.32 16.1 5
CTF-P1M 4 0.92 31.2 5

S21
CTF-P2M 464 1.87 21.0 5
CTF-P3M 523 2.21 15.8 5CTF-P4M 542 1.83 22.4 5
CTF-P5M 542 2.03 20.1 5
CTF-P6M 947 4.12 14.2 5
MCTP-1 1452 4.61 2.70 6
MCTP-2 859 3.65 2.46 6
Polymer 2 -- -- 1.56 7
Polymer 3 646 -- 1.68 7
Polymer 4 1266 -- 2.09 7
Polymer 2C 427 -- 2.99 7
Polymer 3C 1173 -- 3.08 7
Polymer 4C 1316 -- 3.61 7
NOP-1 978 1.83 1.06 32.8 8
NOP-2 1055 2.37 1.40 34.1 8
NOP-3 1198 2.51 1.39 33.8 27.1 25.6 8
NOP-4 635 1.71 0.83 31.9 8
NOP-5 913 1.45 0.72 30.5 8
NOP-6 1130 1.31 0.49 29.2 33.7 38.7 8
MCTF-300 640 2.25 1.39 24.6 9
MCTF-400 1060 2.36 1.55 25.4 9
MCTF-500 1510 3.16 2.22 26.3 9
fl-CTF300 15 1.27 0.71 43.1 35 37 10
fl-CTF350 1235 4.28 2.29 32.7 27 23 10
fl-CTF400 2862 4.13 1.97 30.7 15 16 10
fl-CTF500 2322 3.26 1.65 31.7 13 12 10
fl-CTF600 2113 3.48 1.80 32.4 14 12 10
COP-1 168 -- 1.33 11
COP-2 158 0.91 11
PCTF-1 2235 3.26 1.84 30 13 17 b 12

S22
PCTF-2 784 1.85 0.992 26 9 13 b 12
PCTF-3 641 2.17 1.32 27 16 34 b 12
PCTF-4 1090 2.30 1.49 28 17 35 b 12
PCTF-5 1183 2.59 1.48 27 17 39 b 12
PCTF-6 79 -- -- -- -- 12
PCTF-7 613 2.18 1.32 25 22 -- 12
HPF-1 576 -- 2.8 43 120 13
CTF-TPC 1668 4.24 2.47 32 14
CTF-FL 773 3.26 2.00 35 14
MM1 1800 3.68 2.17 32 32 130 This work
MM2 1360 4.70 2.88 36 23 97 This work
MM3 1884 2.62 1.51 43 13 77 This work
MM4 1407 3.40 2.05 30 21 98 This work
a Transformation into cm3/g can be done by the given value in mmol/g with the molar gas volume at 1 bar of 22.711 L/mol (or mL/mmol = cm3/mmol) (at 273 K), 24.375 L (at 293) and 24.791 L (at 298).
Alternatively, transformation from given cm3/g into mmol/g:
at 273 K: value in (cm3/g) : (22.711 cm3/mmol) = value in (mmol/g) (22.711 L is the molar volume at 1 bar and 273 K for an ideal gas).
at 293 K: value in (cm3/g) : (24.375 cm3/mmol) = value in (mmol/g) (24.375 L is the molar volume at 1 bar and 293 K for an ideal gas).
Conversion to value in g/g = value in (mmol/g) x (0.044 g/mmol) from which the value wt% is obtained as g(CO2)/g(CO2+adsorbent) x 100%.
b at 1 bar for an equimolar gas mixture.

S23
11. Scanning electron micrograph of MM1-MM4
Fig. S10 Scanning electron micrographs of MM1 - MM4 (numbers above the scale bar are in µm). Enlarged version of Fig. 2 in paper.

S24
12. Virial equation analysis of CO2 adsorption data for calculation of the Qst values
Fig. S11 Virial equation analysis of CO2 adsorption data fitting.
From these fittings we have calculated the Qst values for MM1-MM4 (see Fig. 8 in main manuscript).

S25
13. Gas sorption of MM'-CTF materials synthesized at 300 °C and 600 °C (MM2-300, MM2-600 and MM4-600)
Fig. S12 Nitrogen adsorption-desorption isotherms (closed symbols for adsorption and open symbols for desorption) for MM2-300, MM2-600 and MM4-600 (-300 and -600 are the synthesis temperatures in °C).
Fig. S13 CO2 sorption isotherms at 273 K and 1 bar for MM2-300, MM2-600 and MM4-600 (-300 and -600 are the synthesis temperatures in °C).
S26
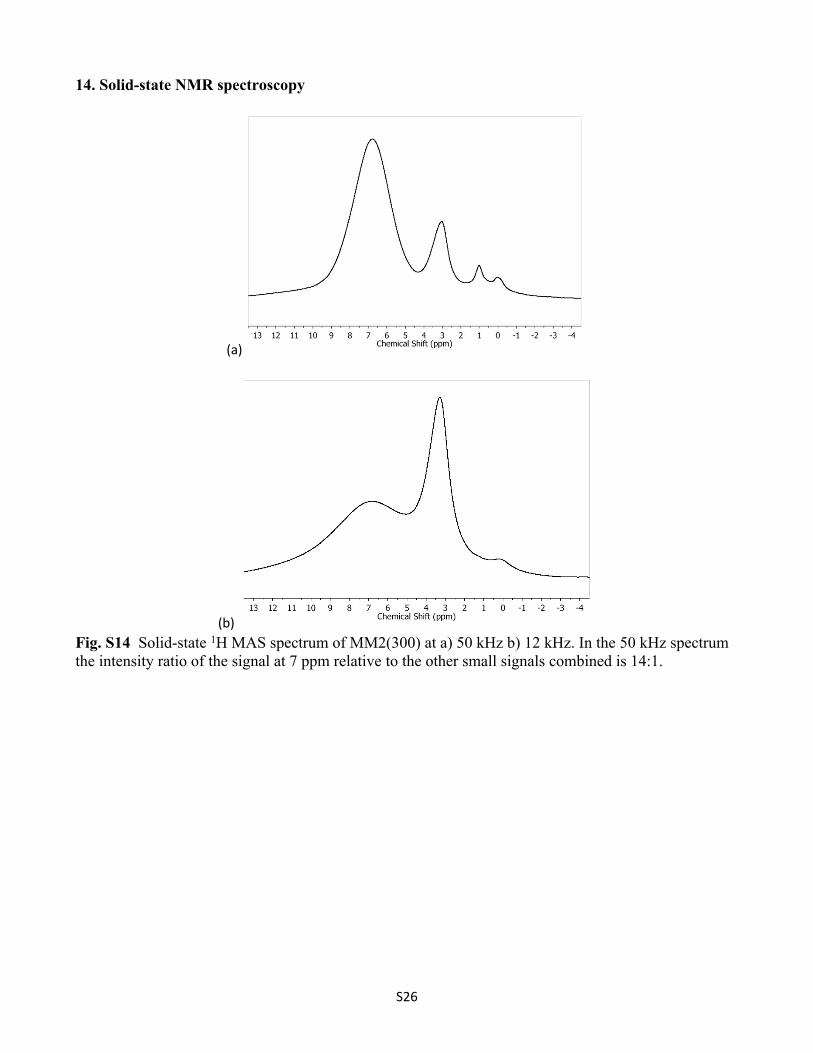
14. Solid-state NMR spectroscopy
(a)
(b) Fig. S14 Solid-state 1H MAS spectrum of MM2(300) at a) 50 kHz b) 12 kHz. In the 50 kHz spectrum the intensity ratio of the signal at 7 ppm relative to the other small signals combined is 14:1.

S27
Fig. S15 Solid-state 19F MAS spectrum of MM2(300) at 50 kHz. The intensity ratio of the signal at –140 ppm relative to the other smaller signals combined is 15:1.
Fig. S16 1H/13C HETCOR experiment of MM2(300) at 12 kHz spinning speed and 1.5 ms contact time.

S28
15. References
1 A. Bhunia, V. Vasylyeva and C. Janiak, Chem. Commun., 2013, 49, 3961-3963.2 B. Brehler, Naturwissenschaften, 1959, 46, 554.3 P. Katekomol, J. Roeser, M. Bojdys, J. Weber, and A. Thomas, Chem. Mater., 2013, 25, 542–15484 Y. Zhao, K. X. Yao, B. Teng, T. Zhang and Y. Han, Energy Environ. Sci., 2013, 6, 3684- 36925 S. Ren, M. J. Bojdys, R. Dawson, A. Laybourn, Y. Z. Khimyak, D. J. Adams and A. I. Cooper,
Adv. Mater., 2012, 24, 2357–2361.6 P. Puthiaraj, S.-M. Cho, Y.-R. Lee and W.-S. Ahn, J. Mater. Chem. A, 2015, 3, 6792-67977 H. Lim, M. C. Cha and J. Y. Chang, Macromol. Chem. Phys., 2012, 13, 1385–1390.8 S. Xiong, X. Fu, L. Xiang, G. Yu, J. Guan, Z. Wang, Y. Du, X. Xiong and C. Pan, Polym. Chem.,
2014, 5, 3424-3431.9 X. Liu, H. Li, Y. Zhang, B. Xu, S. A, H. Xia and Y. Mu, Polym. Chem., 2013, 4, 2445-2448.10 S. Hug, M. B. Mesch, H. Oh, N. Popp, M. Hirscher, J. Senkerd and B. V. Lotsch, J. Mater. Chem.
A, 2014, 2, 5928-5936.11 H. A. Patel, F. Karadas, A. Canlier, J. Park, E. Deniz, Y. Jung, M. Atilhan and C. T. Yavuz, J.
Mater. Chem., 2012, 22, 8431-8437.12 A. Bhunia, I. Boldog, A. Möller and C. Janiak, J. Mater. Chem. A, 2013, 1, 14990–14999.13 S. Nandi, U. Werner-Zwanziger and R. Vaidhyanathan, J. Mater. Chem. A, 2015, 3, 21116–21122.14 S. Dey, A. Bhunia, D. Esquivel and C. Janiak, J. Mater. Chem. A, 2016, 4, 6259-6263.