on24-2017 benchmark report finalcommunications.on24.com/rs/848...benchmarks-report... ·...
TRANSCRIPT

2017WEBINAR BENCHMARKS REPORT
2
2
Table of Contents
EXECUTIVE SUMMARY 03
METHODOLOGY
PRE-WEBINAR BENCHMARKS 05
DRIVING REGISTRATION
PROMOTIONAL TOOLS
SCHEDULING WEBINARS
WEBINAR BENCHMARKS 09
REGISTRATION DATA
ATTENDANCE DATA
VIEWING DURATION
INTERACTIVE TOOLS
POST-WEBINAR BENCHMARKS 14
ON-DEMAND VIEWING
INTEGRATION INTO VIRTUAL ENVIRONMENTS
CONCLUSION 17

3
3
Executive Summary
Webinars are the best tool we have to
engage audiences and communicate
information. Marketers use them to drive
leads, generate pipeline, and nurture
prospects through the every stage of the
buying cycle, from awareness to purchase.
Trainers and educators use them to
conduct global and on-demand training
sessions. Companies large and small
use them for internal communications,
new hire training, town halls, and more.
Consumers use them to get new
information and best practices, to discover
new products, and to self-educate before
they make a purchase. In short, webinars
have become indispensable for helping us
meet our business goals.
METHODOLOGY
The findings in this report were compiled by
ON24, the world’s leading webinar marketing
platform. In 2016, ON24 supported over 65,000
webcasts globally. This report is based on a
random subset of those events:
» 16,418 webinars were measured in this analysis
» All webinars were held between January
and December of 2016
» All webinars had at least 100 attendees
» Events represent a cross section of 1000+
organizations
» Company size ranges from large
enterprise to SMB
4
4
Executive SummaryCONTINUED
This study measured statistics across the
entire lifecycle of a webinar, including webinar
promotion and registration metrics, webinar
interactivity metrics, audience viewing habits,
and both live and on-demand attendance and
conversion metrics. Unless noted otherwise, the
report uses the following definitions:
» Live webinars: audio or video-based events that
are streamed on a specific day and time
» On-demand webinars: audio or video-based
events that are streamed upon request anywhere,
anytime, including live webcasts that have been
archived for additional viewing
» Registrants: people who registered to view an
event
» Attendees: people who registered to view an
event and attended that event

5
5
Pre-webinar Benchmarks
PROMOTIONAL CYCLE
Driving registration is critical to building and maintaining a successful webinar program. But how can you
get more people to register for your webinars? If you’re only promoting your events for a week or two,
you may be missing out on nearly half of your potential audience. Almost one in four registrants sign up
for a webinar more than 15 days before the event. And don’t forget the day of the live event — 25% of
webinar registrants sign up that day.
Pursuing a longer promotional cycle that includes a series of email drops and extended social promotion
over several weeks will provide more chances to drive a large audience to your webinars.
BEST DAYS TO SEND PROMOTIONAL EMAILS
PROMOTIONAL CYCLE
1
2
3
4
5
6
7
8
9
10
11
12
13
14
61%
17% 22% 22% 22% 11% 5%
BEST DAYS FOR WEBINAR ATTENDANCE
BEST TIMES TO RUN WEBINARS
23%
15+ DAYS
8-14 DAYS
21%
1-7 DAYS
31%
DAY OF EVENT
25%
LIVE ONLY
WK1
0
300,000
150,000
450,000
600,000
WK2 WK3 WK4 WK5 WK6 WK7 WK8 WK9 WK10 WK11
LIVE AND ON-DEMAND ON-DEMAND ONLY
17%
2016
18%
2017
16%
2015
9%
2014
ON-DEMAND VIEWING
POST-LIVE REGISTRANTS
ON-DEMAND VIEWING TIME
7%
GROUP CHAT
7%
POLLING
24%
SOCIAL
31%
Q & A
82%
INTEGRATION OF ENGAGEMENT TOOLS
AUDIENCE ENGAGEMENT
SURVEYS
28%
INTEGRATION OF VIDEO
AVERAGE VIEWING TIME FOR WEBINARS
WEBINAR AUDIENCE ON MOBILE AND TABLET
REGISTRANT TO ATTENDEE CONVERSION
AVERAGE ATTENDEE RATE
2017 MINUTES
55
2016 MINUTES
57
2015 MINUTES
56
2014 MINUTES
56
2013 MINUTES
56 6% 33%
2015 MINUTES
29
2016 MINUTES
34
2017 MINUTES
42
MON TUE WED THURS FRI SAT/SUN
11% 23% 27% 28% 8% 3%
MON TUE WED THURS FRI SAT/SUN
13%
9AM PST
17%
10AM PST8AM PST
11% 24%
11AM PST
16%
12PM PST
100-199 200-299 300-499 500-999 1000+
100-199: 47%300-499: 16%
500-999: 11%
1000+: 7%
200-299: 19%
CONTACT US
12%
RESOURCES LIST
66%
4.13.8
MARKETING TRAINING CONTINUINGEDUCATION
INTERNAL COMMUNICATIONS
AVERAGE ENGAGEMENT
3.84.6 4.1
45%
36%
MARKETINGWEBINARS
TRAININGWEBINARS
CONTINUINGEDUCATION
INTERNAL COMMUNICATIONS
WEBINARS
TOTAL WEBINAR CONVERSIONS
54%
40% 46%
WEBINAR PROMOTION STARTS EARLY AND KEEPS GOING STRONG

6
6
Pre-webinar BenchmarksCONTINUED
BEST DAYS TO SEND PROMOTIONAL EMAILS
The most effective promotional emails catch their intended audience with an engaging message
at a moment when they are receptive to it. For most business audiences, that means avoiding
weekends, when recipients are less likely to respond to work emails. Fridays, when many workers are
either winding down or frantically wrapping up their work week, are also poor performers. The middle
of the week (Tuesday, Wednesday, and Thursday) continues to be the most effective time to send a
promotional email.
SEND PROMO EMAILS IN THE MIDDLE OF THE WORKWEEK
BEST DAYS TO SEND PROMOTIONAL EMAILS
PROMOTIONAL CYCLE
1
2
3
4
5
6
7
8
9
10
11
12
13
14
61%
17% 22% 22% 22% 11% 5%
BEST DAYS FOR WEBINAR ATTENDANCE
BEST TIMES TO RUN WEBINARS
23%
15+ DAYS
8-14 DAYS
21%
1-7 DAYS
31%
DAY OF EVENT
25%
LIVE ONLY
WK1
0
300,000
150,000
450,000
600,000
WK2 WK3 WK4 WK5 WK6 WK7 WK8 WK9 WK10 WK11
LIVE AND ON-DEMAND ON-DEMAND ONLY
17%
2016
18%
2017
16%
2015
9%
2014
ON-DEMAND VIEWING
POST-LIVE REGISTRANTS
ON-DEMAND VIEWING TIME
7%
GROUP CHAT
7%
POLLING
24%
SOCIAL
31%
Q & A
82%
INTEGRATION OF ENGAGEMENT TOOLS
AUDIENCE ENGAGEMENT
SURVEYS
28%
INTEGRATION OF VIDEO
AVERAGE VIEWING TIME FOR WEBINARS
WEBINAR AUDIENCE ON MOBILE AND TABLET
REGISTRANT TO ATTENDEE CONVERSION
AVERAGE ATTENDEE RATE
2017 MINUTES
55
2016 MINUTES
57
2015 MINUTES
56
2014 MINUTES
56
2013 MINUTES
56 6% 33%
2015 MINUTES
29
2016 MINUTES
34
2017 MINUTES
42
MON TUE WED THURS FRI SAT/SUN
11% 23% 27% 28% 8% 3%
MON TUE WED THURS FRI SAT/SUN
13%
9AM PST
17%
10AM PST8AM PST
11% 24%
11AM PST
16%
12PM PST
100-199 200-299 300-499 500-999 1000+
100-199: 47%300-499: 16%
500-999: 11%
1000+: 7%
200-299: 19%
CONTACT US
12%
RESOURCES LIST
66%
4.13.8
MARKETING TRAINING CONTINUINGEDUCATION
INTERNAL COMMUNICATIONS
AVERAGE ENGAGEMENT
3.84.6 4.1
45%
36%
MARKETINGWEBINARS
TRAININGWEBINARS
CONTINUINGEDUCATION
INTERNAL COMMUNICATIONS
WEBINARS
TOTAL WEBINAR CONVERSIONS
54%
40% 46%

7
7
Pre-webinar BenchmarksCONTINUED
BEST DAYS FOR WEBINAR ATTENDANCE
You want to plan your webinars for the days that pull in the biggest audiences. For most of us, that
means scheduling your events in the middle of the week, when people are focused on work and
productivity. Unsurprisingly, weekend webinars don’t attract many attendees. Monday and Friday are only
a little better, bringing in 11% and 8% of all attendees, respectively. The most popular days for webinar
attendance are Wednesday and Thursday, pulling in a combined 55% of all webinar attendees.
MID-WEEK WEBINARS ATTRACT MORE ATTENDEES
BEST DAYS TO SEND PROMOTIONAL EMAILS
PROMOTIONAL CYCLE
1
2
3
4
5
6
7
8
9
10
11
12
13
14
61%
17% 22% 22% 22% 11% 5%
BEST DAYS FOR WEBINAR ATTENDANCE
BEST TIMES TO RUN WEBINARS
23%
15+ DAYS
8-14 DAYS
21%
1-7 DAYS
31%
DAY OF EVENT
25%
LIVE ONLY
WK1
0
300,000
150,000
450,000
600,000
WK2 WK3 WK4 WK5 WK6 WK7 WK8 WK9 WK10 WK11
LIVE AND ON-DEMAND ON-DEMAND ONLY
17%
2016
18%
2017
16%
2015
9%
2014
ON-DEMAND VIEWING
POST-LIVE REGISTRANTS
ON-DEMAND VIEWING TIME
7%
GROUP CHAT
7%
POLLING
24%
SOCIAL
31%
Q & A
82%
INTEGRATION OF ENGAGEMENT TOOLS
AUDIENCE ENGAGEMENT
SURVEYS
28%
INTEGRATION OF VIDEO
AVERAGE VIEWING TIME FOR WEBINARS
WEBINAR AUDIENCE ON MOBILE AND TABLET
REGISTRANT TO ATTENDEE CONVERSION
AVERAGE ATTENDEE RATE
2017 MINUTES
55
2016 MINUTES
57
2015 MINUTES
56
2014 MINUTES
56
2013 MINUTES
56 6% 33%
2015 MINUTES
29
2016 MINUTES
34
2017 MINUTES
42
MON TUE WED THURS FRI SAT/SUN
11% 23% 27% 28% 8% 3%
MON TUE WED THURS FRI SAT/SUN
13%
9AM PST
17%
10AM PST8AM PST
11% 24%
11AM PST
16%
12PM PST
100-199 200-299 300-499 500-999 1000+
100-199: 47%300-499: 16%
500-999: 11%
1000+: 7%
200-299: 19%
CONTACT US
12%
RESOURCES LIST
66%
4.13.8
MARKETING TRAINING CONTINUINGEDUCATION
INTERNAL COMMUNICATIONS
AVERAGE ENGAGEMENT
3.84.6 4.1
45%
36%
MARKETINGWEBINARS
TRAININGWEBINARS
CONTINUINGEDUCATION
INTERNAL COMMUNICATIONS
WEBINARS
TOTAL WEBINAR CONVERSIONS
54%
40% 46%

8
8
Pre-webinar BenchmarksCONTINUED
BEST TIMES TO RUN WEBINARS
It isn’t easy to schedule a webinar, especially when you have people attending from a wide range of
locations and time zones. Ideally, you would like to avoid commute times (before 9am or after 5pm) and
lunch hours (noon–1pm). In this study, we found that the most effective time to run a webinar was 11am
Pacific Time (2pm Eastern), because it succeeds at avoiding the most conflicts for the most people.
10am Pacific (1pm Eastern) and noon Pacific (3pm Eastern) were the next best time slots, accounting for
17% and 16% of attendees, respectively.
TIME OF DAY MAKES A DIFFERENCE TO ATTENDANCE
BEST DAYS TO SEND PROMOTIONAL EMAILS
PROMOTIONAL CYCLE
1
2
3
4
5
6
7
8
9
10
11
12
13
14
61%
17% 22% 22% 22% 11% 5%
BEST DAYS FOR WEBINAR ATTENDANCE
BEST TIMES TO RUN WEBINARS
23%
15+ DAYS
8-14 DAYS
21%
1-7 DAYS
31%
DAY OF EVENT
25%
LIVE ONLY
WK1
0
300,000
150,000
450,000
600,000
WK2 WK3 WK4 WK5 WK6 WK7 WK8 WK9 WK10 WK11
LIVE AND ON-DEMAND ON-DEMAND ONLY
17%
2016
18%
2017
16%
2015
9%
2014
ON-DEMAND VIEWING
POST-LIVE REGISTRANTS
ON-DEMAND VIEWING TIME
7%
GROUP CHAT
7%
POLLING
24%
SOCIAL
31%
Q & A
82%
INTEGRATION OF ENGAGEMENT TOOLS
AUDIENCE ENGAGEMENT
SURVEYS
28%
INTEGRATION OF VIDEO
AVERAGE VIEWING TIME FOR WEBINARS
WEBINAR AUDIENCE ON MOBILE AND TABLET
REGISTRANT TO ATTENDEE CONVERSION
AVERAGE ATTENDEE RATE
2017 MINUTES
55
2016 MINUTES
57
2015 MINUTES
56
2014 MINUTES
56
2013 MINUTES
56 6% 33%
2015 MINUTES
29
2016 MINUTES
34
2017 MINUTES
42
MON TUE WED THURS FRI SAT/SUN
11% 23% 27% 28% 8% 3%
MON TUE WED THURS FRI SAT/SUN
13%
9AM PST
17%
10AM PST8AM PST
11% 24%
11AM PST
16%
12PM PST
100-199 200-299 300-499 500-999 1000+
100-199: 47%300-499: 16%
500-999: 11%
1000+: 7%
200-299: 19%
CONTACT US
12%
RESOURCES LIST
66%
4.13.8
MARKETING TRAINING CONTINUINGEDUCATION
INTERNAL COMMUNICATIONS
AVERAGE ENGAGEMENT
3.84.6 4.1
45%
36%
MARKETINGWEBINARS
TRAININGWEBINARS
CONTINUINGEDUCATION
INTERNAL COMMUNICATIONS
WEBINARS
TOTAL WEBINAR CONVERSIONS
54%
40% 46%
9
9
Webinar Benchmarks
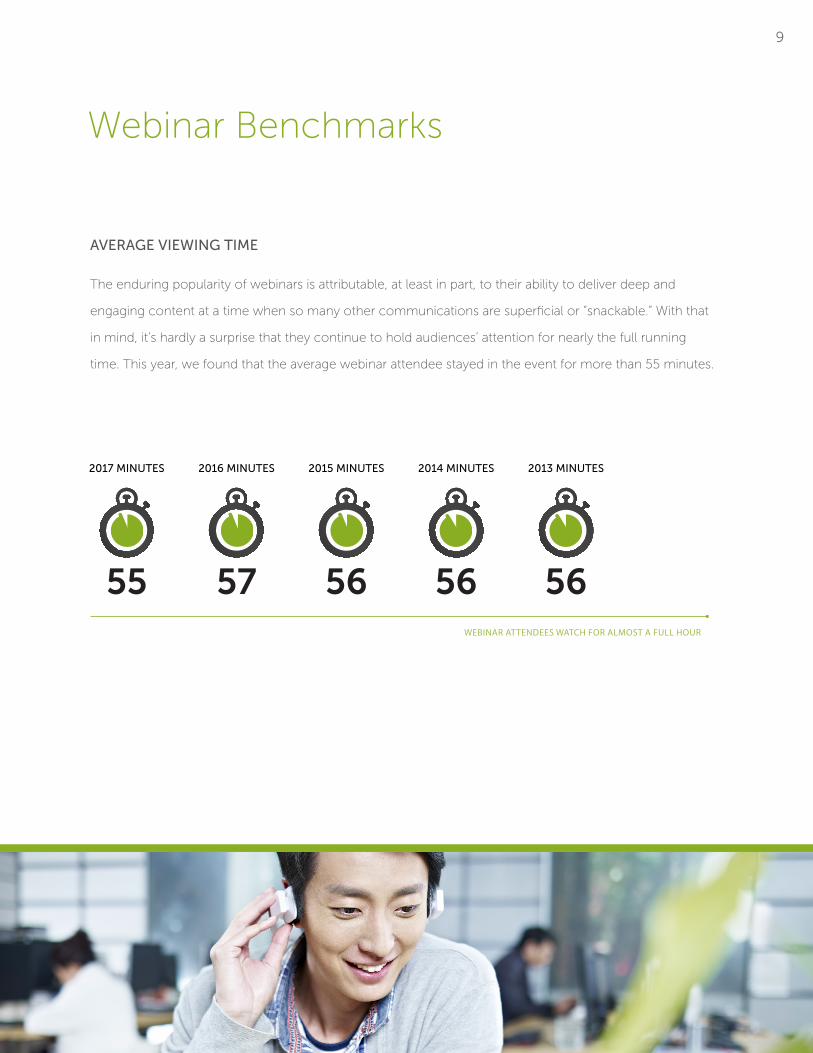
AVERAGE VIEWING TIME
The enduring popularity of webinars is attributable, at least in part, to their ability to deliver deep and
engaging content at a time when so many other communications are superficial or “snackable.” With that
in mind, it’s hardly a surprise that they continue to hold audiences’ attention for nearly the full running
time. This year, we found that the average webinar attendee stayed in the event for more than 55 minutes.
WEBINAR ATTENDEES WATCH FOR ALMOST A FULL HOUR
BEST DAYS TO SEND PROMOTIONAL EMAILS
PROMOTIONAL CYCLE
1
2
3
4
5
6
7
8
9
10
11
12
13
14
61%
17% 22% 22% 22% 11% 5%
BEST DAYS FOR WEBINAR ATTENDANCE
BEST TIMES TO RUN WEBINARS
23%
15+ DAYS
8-14 DAYS
21%
1-7 DAYS
31%
DAY OF EVENT
25%
LIVE ONLY
WK1
0
300,000
150,000
450,000
600,000
WK2 WK3 WK4 WK5 WK6 WK7 WK8 WK9 WK10 WK11
LIVE AND ON-DEMAND ON-DEMAND ONLY
17%
2016
18%
2017
16%
2015
9%
2014
ON-DEMAND VIEWING
POST-LIVE REGISTRANTS
ON-DEMAND VIEWING TIME
7%
GROUP CHAT
7%
POLLING
24%
SOCIAL
31%
Q & A
82%
INTEGRATION OF ENGAGEMENT TOOLS
AUDIENCE ENGAGEMENT
SURVEYS
28%
INTEGRATION OF VIDEO
AVERAGE VIEWING TIME FOR WEBINARS
WEBINAR AUDIENCE ON MOBILE AND TABLET
REGISTRANT TO ATTENDEE CONVERSION
AVERAGE ATTENDEE RATE
2017 MINUTES
55
2016 MINUTES
57
2015 MINUTES
56
2014 MINUTES
56
2013 MINUTES
56 6% 33%
2015 MINUTES
29
2016 MINUTES
34
2017 MINUTES
42
MON TUE WED THURS FRI SAT/SUN
11% 23% 27% 28% 8% 3%
MON TUE WED THURS FRI SAT/SUN
13%
9AM PST
17%
10AM PST8AM PST
11% 24%
11AM PST
16%
12PM PST
100-199 200-299 300-499 500-999 1000+
100-199: 47%300-499: 16%
500-999: 11%
1000+: 7%
200-299: 19%
CONTACT US
12%
RESOURCES LIST
66%
4.13.8
MARKETING TRAINING CONTINUINGEDUCATION
INTERNAL COMMUNICATIONS
AVERAGE ENGAGEMENT
3.84.6 4.1
45%
36%
MARKETINGWEBINARS
TRAININGWEBINARS
CONTINUINGEDUCATION
INTERNAL COMMUNICATIONS
WEBINARS
TOTAL WEBINAR CONVERSIONS
54%
40% 46%
10
10
Webinar BenchmarksCONTINUED
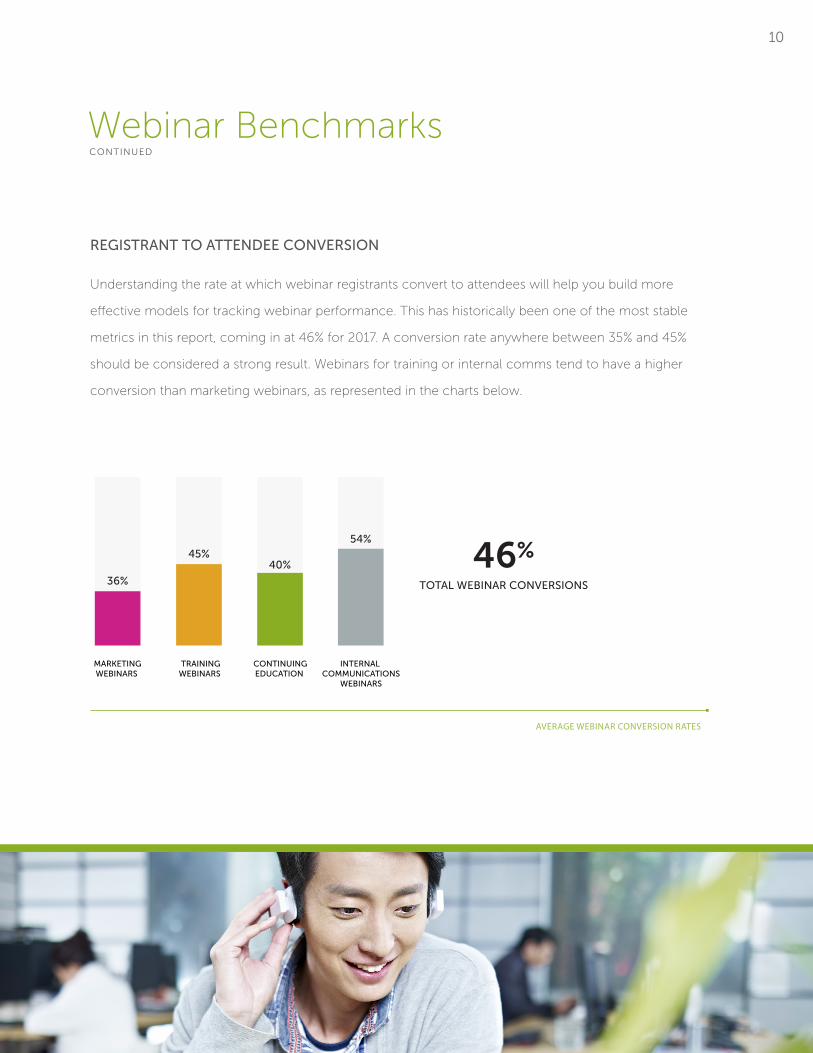
REGISTRANT TO ATTENDEE CONVERSION
Understanding the rate at which webinar registrants convert to attendees will help you build more
effective models for tracking webinar performance. This has historically been one of the most stable
metrics in this report, coming in at 46% for 2017. A conversion rate anywhere between 35% and 45%
should be considered a strong result. Webinars for training or internal comms tend to have a higher
conversion than marketing webinars, as represented in the charts below.
AVERAGE WEBINAR CONVERSION RATES
BEST DAYS TO SEND PROMOTIONAL EMAILS
PROMOTIONAL CYCLE
1
2
3
4
5
6
7
8
9
10
11
12
13
14
61%
17% 22% 22% 22% 11% 5%
BEST DAYS FOR WEBINAR ATTENDANCE
BEST TIMES TO RUN WEBINARS
23%
15+ DAYS
8-14 DAYS
21%
1-7 DAYS
31%
DAY OF EVENT
25%
LIVE ONLY
WK1
0
300,000
150,000
450,000
600,000
WK2 WK3 WK4 WK5 WK6 WK7 WK8 WK9 WK10 WK11
LIVE AND ON-DEMAND ON-DEMAND ONLY
17%
2016
18%
2017
16%
2015
9%
2014
ON-DEMAND VIEWING
POST-LIVE REGISTRANTS
ON-DEMAND VIEWING TIME
7%
GROUP CHAT
7%
POLLING
24%
SOCIAL
31%
Q & A
82%
INTEGRATION OF ENGAGEMENT TOOLS
AUDIENCE ENGAGEMENT
SURVEYS
28%
INTEGRATION OF VIDEO
AVERAGE VIEWING TIME FOR WEBINARS
WEBINAR AUDIENCE ON MOBILE AND TABLET
REGISTRANT TO ATTENDEE CONVERSION
AVERAGE ATTENDEE RATE
2017 MINUTES
55
2016 MINUTES
57
2015 MINUTES
56
2014 MINUTES
56
2013 MINUTES
56 6% 33%
2015 MINUTES
29
2016 MINUTES
34
2017 MINUTES
42
MON TUE WED THURS FRI SAT/SUN
11% 23% 27% 28% 8% 3%
MON TUE WED THURS FRI SAT/SUN
13%
9AM PST
17%
10AM PST8AM PST
11% 24%
11AM PST
16%
12PM PST
100-199 200-299 300-499 500-999 1000+
100-199: 47%300-499: 16%
500-999: 11%
1000+: 7%
200-299: 19%
CONTACT US
12%
RESOURCES LIST
66%
4.13.8
MARKETING TRAINING CONTINUINGEDUCATION
INTERNAL COMMUNICATIONS
AVERAGE ENGAGEMENT
3.84.6 4.1
45%
36%
MARKETINGWEBINARS
TRAININGWEBINARS
CONTINUINGEDUCATION
INTERNAL COMMUNICATIONS
WEBINARS
TOTAL WEBINAR CONVERSIONS
54%
40% 46%

11
11
Webinar BenchmarksCONTINUED
AVERAGE ATTENDEE RATE
One advantage webinars have over in-person events is their ability to attract audiences of any size from
all around the world. Over the past few years, we’ve seen a rise in of webinars with over 1,000 attendees,
with 7% of all ON24 webinars in 2016 attracting audiences on that scale. 25% of webinars drew
audiences between 300–1000 attendees.
DISTRIBUTION OF WEBINARS BY SIZE, AS A PERCENTAGE OF WEBINARS WITH 100+ LIVE ATTENDEES
BEST DAYS TO SEND PROMOTIONAL EMAILS
PROMOTIONAL CYCLE
1
2
3
4
5
6
7
8
9
10
11
12
13
14
61%
17% 22% 22% 22% 11% 5%
BEST DAYS FOR WEBINAR ATTENDANCE
BEST TIMES TO RUN WEBINARS
23%
15+ DAYS
8-14 DAYS
21%
1-7 DAYS
31%
DAY OF EVENT
25%
LIVE ONLY
WK1
0
300,000
150,000
450,000
600,000
WK2 WK3 WK4 WK5 WK6 WK7 WK8 WK9 WK10 WK11
LIVE AND ON-DEMAND ON-DEMAND ONLY
17%
2016
18%
2017
16%
2015
9%
2014
ON-DEMAND VIEWING
POST-LIVE REGISTRANTS
ON-DEMAND VIEWING TIME
7%
GROUP CHAT
7%
POLLING
24%
SOCIAL
31%
Q & A
82%
INTEGRATION OF ENGAGEMENT TOOLS
AUDIENCE ENGAGEMENT
SURVEYS
28%
INTEGRATION OF VIDEO
AVERAGE VIEWING TIME FOR WEBINARS
WEBINAR AUDIENCE ON MOBILE AND TABLET
REGISTRANT TO ATTENDEE CONVERSION
AVERAGE ATTENDEE RATE
2017 MINUTES
55
2016 MINUTES
57
2015 MINUTES
56
2014 MINUTES
56
2013 MINUTES
56 6% 33%
2015 MINUTES
29
2016 MINUTES
34
2017 MINUTES
42
MON TUE WED THURS FRI SAT/SUN
11% 23% 27% 28% 8% 3%
MON TUE WED THURS FRI SAT/SUN
13%
9AM PST
17%
10AM PST8AM PST
11% 24%
11AM PST
16%
12PM PST
100-199 200-299 300-499 500-999 1000+
100-199: 47%300-499: 16%
500-999: 11%
1000+: 7%
200-299: 19%
CONTACT US
12%
RESOURCES LIST
66%
4.13.8
MARKETING TRAINING CONTINUINGEDUCATION
INTERNAL COMMUNICATIONS
AVERAGE ENGAGEMENT
3.84.6 4.1
45%
36%
MARKETINGWEBINARS
TRAININGWEBINARS
CONTINUINGEDUCATION
INTERNAL COMMUNICATIONS
WEBINARS
TOTAL WEBINAR CONVERSIONS
54%
40% 46%

12
12
Webinar BenchmarksCONTINUED
INTEGRATION OF ENGAGEMENT TOOLS
Whether you are talking about marketing webinars or training webinars, engagement is the key to a more
successful event. An engaged audience is more likely to feel positively, retain more information, and
engage with you again in the future. As always, Q&A is the most popular form of audience engagement,
appearing in 82% of all webinars. 66% of webinars provide a list of additional resources for attendees to
download, and 31% integrate a social experience, such as Twitter, LinkedIn, or Facebook.
New to this year’s report, we are tracking webinars that integrate a “contact us” widget. This turns the
webinar into a powerful tool for driving sales leads.
WEBINARS DRIVE AUDIENCE ENGAGEMENT
BEST DAYS TO SEND PROMOTIONAL EMAILS
PROMOTIONAL CYCLE
1
2
3
4
5
6
7
8
9
10
11
12
13
14
61%
17% 22% 22% 22% 11% 5%
BEST DAYS FOR WEBINAR ATTENDANCE
BEST TIMES TO RUN WEBINARS
23%
15+ DAYS
8-14 DAYS
21%
1-7 DAYS
31%
DAY OF EVENT
25%
LIVE ONLY
WK1
0
300,000
150,000
450,000
600,000
WK2 WK3 WK4 WK5 WK6 WK7 WK8 WK9 WK10 WK11
LIVE AND ON-DEMAND ON-DEMAND ONLY
17%
2016
18%
2017
16%
2015
9%
2014
ON-DEMAND VIEWING
POST-LIVE REGISTRANTS
ON-DEMAND VIEWING TIME
7%
GROUP CHAT
7%
POLLING
24%
SOCIAL
31%
Q & A
82%
INTEGRATION OF ENGAGEMENT TOOLS
AUDIENCE ENGAGEMENT
SURVEYS
28%
INTEGRATION OF VIDEO
AVERAGE VIEWING TIME FOR WEBINARS
WEBINAR AUDIENCE ON MOBILE AND TABLET
REGISTRANT TO ATTENDEE CONVERSION
AVERAGE ATTENDEE RATE
2017 MINUTES
55
2016 MINUTES
57
2015 MINUTES
56
2014 MINUTES
56
2013 MINUTES
56 6% 33%
2015 MINUTES
29
2016 MINUTES
34
2017 MINUTES
42
MON TUE WED THURS FRI SAT/SUN
11% 23% 27% 28% 8% 3%
MON TUE WED THURS FRI SAT/SUN
13%
9AM PST
17%
10AM PST8AM PST
11% 24%
11AM PST
16%
12PM PST
100-199 200-299 300-499 500-999 1000+
100-199: 47%300-499: 16%
500-999: 11%
1000+: 7%
200-299: 19%
CONTACT US
12%
RESOURCES LIST
66%
4.13.8
MARKETING TRAINING CONTINUINGEDUCATION
INTERNAL COMMUNICATIONS
AVERAGE ENGAGEMENT
3.84.6 4.1
45%
36%
MARKETINGWEBINARS
TRAININGWEBINARS
CONTINUINGEDUCATION
INTERNAL COMMUNICATIONS
WEBINARS
TOTAL WEBINAR CONVERSIONS
54%
40% 46%

13
13
Webinar BenchmarksCONTINUED
INTEGRATION OF VIDEO
Over the past few years, webinars have become more dynamic and visually engaging. We’ve seen
this in webinar consoles and the presentations themselves, but nowhere is it more apparent than in
the increasing integration of video into webinars. For the fourth year in a row, we’ve seen a rise in the
proportion of webinars that include a video component. This includes the following video types:
• Studio video presenters
• Webcam presenters
• Integrated video clips
• Streaming video and screen sharing
The increasing presence of video likely reflects a growing comfort with video technologies and the ability
to reliably push video without bandwidth constraints.
VIDEO INTEGRATION INCREASES YEAR OVER YEAR
BEST DAYS TO SEND PROMOTIONAL EMAILS
PROMOTIONAL CYCLE
1
2
3
4
5
6
7
8
9
10
11
12
13
14
61%
17% 22% 22% 22% 11% 5%
BEST DAYS FOR WEBINAR ATTENDANCE
BEST TIMES TO RUN WEBINARS
23%
15+ DAYS
8-14 DAYS
21%
1-7 DAYS
31%
DAY OF EVENT
25%
LIVE ONLY
WK1
0
300,000
150,000
450,000
600,000
WK2 WK3 WK4 WK5 WK6 WK7 WK8 WK9 WK10 WK11
LIVE AND ON-DEMAND ON-DEMAND ONLY
17%
2016
18%
2017
16%
2015
9%
2014
ON-DEMAND VIEWING
POST-LIVE REGISTRANTS
ON-DEMAND VIEWING TIME
7%
GROUP CHAT
7%
POLLING
24%
SOCIAL
31%
Q & A
82%
INTEGRATION OF ENGAGEMENT TOOLS
AUDIENCE ENGAGEMENT
SURVEYS
28%
INTEGRATION OF VIDEO
AVERAGE VIEWING TIME FOR WEBINARS
WEBINAR AUDIENCE ON MOBILE AND TABLET
REGISTRANT TO ATTENDEE CONVERSION
AVERAGE ATTENDEE RATE
2017 MINUTES
55
2016 MINUTES
57
2015 MINUTES
56
2014 MINUTES
56
2013 MINUTES
56 6% 33%
2015 MINUTES
29
2016 MINUTES
34
2017 MINUTES
42
MON TUE WED THURS FRI SAT/SUN
11% 23% 27% 28% 8% 3%
MON TUE WED THURS FRI SAT/SUN
13%
9AM PST
17%
10AM PST8AM PST
11% 24%
11AM PST
16%
12PM PST
100-199 200-299 300-499 500-999 1000+
100-199: 47%300-499: 16%
500-999: 11%
1000+: 7%
200-299: 19%
CONTACT US
12%
RESOURCES LIST
66%
4.13.8
MARKETING TRAINING CONTINUINGEDUCATION
INTERNAL COMMUNICATIONS
AVERAGE ENGAGEMENT
3.84.6 4.1
45%
36%
MARKETINGWEBINARS
TRAININGWEBINARS
CONTINUINGEDUCATION
INTERNAL COMMUNICATIONS
WEBINARS
TOTAL WEBINAR CONVERSIONS
54%
40% 46%
14
14
Post-webinar Benchmarks
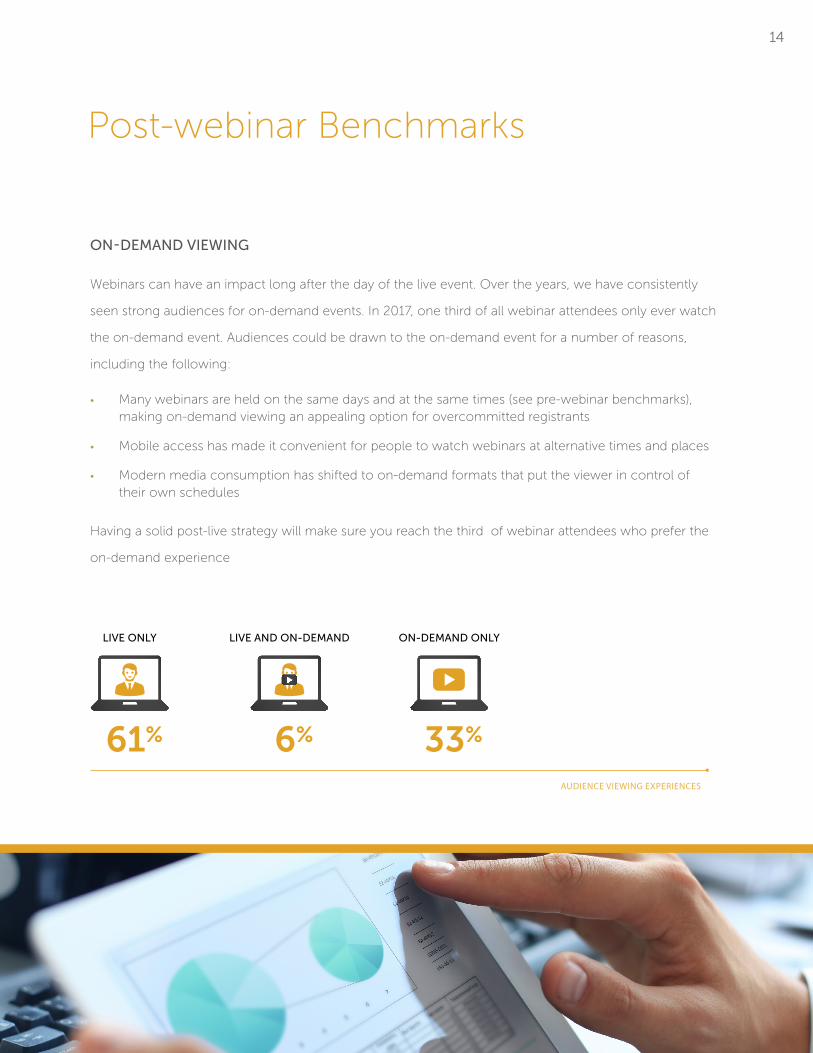
ON-DEMAND VIEWING
Webinars can have an impact long after the day of the live event. Over the years, we have consistently
seen strong audiences for on-demand events. In 2017, one third of all webinar attendees only ever watch
the on-demand event. Audiences could be drawn to the on-demand event for a number of reasons,
including the following:
• Many webinars are held on the same days and at the same times (see pre-webinar benchmarks), making on-demand viewing an appealing option for overcommitted registrants
• Mobile access has made it convenient for people to watch webinars at alternative times and places
• Modern media consumption has shifted to on-demand formats that put the viewer in control of their own schedules
Having a solid post-live strategy will make sure you reach the third of webinar attendees who prefer the
on-demand experience
AUDIENCE VIEWING EXPERIENCES
BEST DAYS TO SEND PROMOTIONAL EMAILS
PROMOTIONAL CYCLE
1
2
3
4
5
6
7
8
9
10
11
12
13
14
61%
17% 22% 22% 22% 11% 5%
BEST DAYS FOR WEBINAR ATTENDANCE
BEST TIMES TO RUN WEBINARS
23%
15+ DAYS
8-14 DAYS
21%
1-7 DAYS
31%
DAY OF EVENT
25%
LIVE ONLY
WK1
0
300,000
150,000
450,000
600,000
WK2 WK3 WK4 WK5 WK6 WK7 WK8 WK9 WK10 WK11
LIVE AND ON-DEMAND ON-DEMAND ONLY
17%
2016
18%
2017
16%
2015
9%
2014
ON-DEMAND VIEWING
POST-LIVE REGISTRANTS
ON-DEMAND VIEWING TIME
7%
GROUP CHAT
7%
POLLING
24%
SOCIAL
31%
Q & A
82%
INTEGRATION OF ENGAGEMENT TOOLS
AUDIENCE ENGAGEMENT
SURVEYS
28%
INTEGRATION OF VIDEO
AVERAGE VIEWING TIME FOR WEBINARS
WEBINAR AUDIENCE ON MOBILE AND TABLET
REGISTRANT TO ATTENDEE CONVERSION
AVERAGE ATTENDEE RATE
2017 MINUTES
55
2016 MINUTES
57
2015 MINUTES
56
2014 MINUTES
56
2013 MINUTES
56 6% 33%
2015 MINUTES
29
2016 MINUTES
34
2017 MINUTES
42
MON TUE WED THURS FRI SAT/SUN
11% 23% 27% 28% 8% 3%
MON TUE WED THURS FRI SAT/SUN
13%
9AM PST
17%
10AM PST8AM PST
11% 24%
11AM PST
16%
12PM PST
100-199 200-299 300-499 500-999 1000+
100-199: 47%300-499: 16%
500-999: 11%
1000+: 7%
200-299: 19%
CONTACT US
12%
RESOURCES LIST
66%
4.13.8
MARKETING TRAINING CONTINUINGEDUCATION
INTERNAL COMMUNICATIONS
AVERAGE ENGAGEMENT
3.84.6 4.1
45%
36%
MARKETINGWEBINARS
TRAININGWEBINARS
CONTINUINGEDUCATION
INTERNAL COMMUNICATIONS
WEBINARS
TOTAL WEBINAR CONVERSIONS
54%
40% 46%

15
15
Post-webinar BenchmarksCONTINUED
POST-LIVE REGISTRANTS
This study took into account the behavior of millions of webinar registrants and attendees. Of those, 33%
only ever saw the webinar on-demand. This thriving audience for on-demand content represents a clear
opportunity for those of us running webinar programs: by continuing to support and promote the event
after the live date, we can continue to reach large and engaged audiences.
The majority of post-live registrations happen the week after the live event, suggesting that they were
interested in the live event, but missed it due to scheduling conflicts. However, the long tail for on-
demand registration highlights their power to pull in registrants for months.
POST-LIVE REGISTRATION DATA
BEST DAYS TO SEND PROMOTIONAL EMAILS
PROMOTIONAL CYCLE
1
2
3
4
5
6
7
8
9
10
11
12
13
14
61%
17% 22% 22% 22% 11% 5%
BEST DAYS FOR WEBINAR ATTENDANCE
BEST TIMES TO RUN WEBINARS
23%
15+ DAYS
8-14 DAYS
21%
1-7 DAYS
31%
DAY OF EVENT
25%
LIVE ONLY
WK1
0
300,000
150,000
450,000
600,000
WK2 WK3 WK4 WK5 WK6 WK7 WK8 WK9 WK10 WK11
LIVE AND ON-DEMAND ON-DEMAND ONLY
17%
2016
18%
2017
16%
2015
9%
2014
ON-DEMAND VIEWING
POST-LIVE REGISTRANTS
ON-DEMAND VIEWING TIME
7%
GROUP CHAT
7%
POLLING
24%
SOCIAL
31%
Q & A
82%
INTEGRATION OF ENGAGEMENT TOOLS
AUDIENCE ENGAGEMENT
SURVEYS
28%
INTEGRATION OF VIDEO
AVERAGE VIEWING TIME FOR WEBINARS
WEBINAR AUDIENCE ON MOBILE AND TABLET
REGISTRANT TO ATTENDEE CONVERSION
AVERAGE ATTENDEE RATE
2017 MINUTES
55
2016 MINUTES
57
2015 MINUTES
56
2014 MINUTES
56
2013 MINUTES
56 6% 33%
2015 MINUTES
29
2016 MINUTES
34
2017 MINUTES
42
MON TUE WED THURS FRI SAT/SUN
11% 23% 27% 28% 8% 3%
MON TUE WED THURS FRI SAT/SUN
13%
9AM PST
17%
10AM PST8AM PST
11% 24%
11AM PST
16%
12PM PST
100-199 200-299 300-499 500-999 1000+
100-199: 47%300-499: 16%
500-999: 11%
1000+: 7%
200-299: 19%
CONTACT US
12%
RESOURCES LIST
66%
4.13.8
MARKETING TRAINING CONTINUINGEDUCATION
INTERNAL COMMUNICATIONS
AVERAGE ENGAGEMENT
3.84.6 4.1
45%
36%
MARKETINGWEBINARS
TRAININGWEBINARS
CONTINUINGEDUCATION
INTERNAL COMMUNICATIONS
WEBINARS
TOTAL WEBINAR CONVERSIONS
54%
40% 46%

16
16
Post-webinar BenchmarksCONTINUED
ON-DEMAND VIEWING TIME
In the past year, we have seen a massive jump in on-demand viewing times, from 34 minutes in 2016
to 42 minutes in 2017. This reflects the growing appeal of on-demand content. We attribute the lower
viewing time of on-demand viewing (compared to live viewing times) to a variety of factors, including
the following:
• Some on-demand viewers also watched the live event, and they are only attending to catch up on content they missed the first time.
• Most on-demand webinars include timeline tools that let the audience fast-forward through the webinar and focus on the content they’re most interested in.
• Viewers can watch on-demand webinars multiple times, so they may only watch short sections in any given viewing.
INCREASING ON-DEMAND VIEWING TIME
BEST DAYS TO SEND PROMOTIONAL EMAILS
PROMOTIONAL CYCLE
1
2
3
4
5
6
7
8
9
10
11
12
13
14
61%
17% 22% 22% 22% 11% 5%
BEST DAYS FOR WEBINAR ATTENDANCE
BEST TIMES TO RUN WEBINARS
23%
15+ DAYS
8-14 DAYS
21%
1-7 DAYS
31%
DAY OF EVENT
25%
LIVE ONLY
WK1
0
300,000
150,000
450,000
600,000
WK2 WK3 WK4 WK5 WK6 WK7 WK8 WK9 WK10 WK11
LIVE AND ON-DEMAND ON-DEMAND ONLY
17%
2016
18%
2017
16%
2015
9%
2014
ON-DEMAND VIEWING
POST-LIVE REGISTRANTS
ON-DEMAND VIEWING TIME
7%
GROUP CHAT
7%
POLLING
24%
SOCIAL
31%
Q & A
82%
INTEGRATION OF ENGAGEMENT TOOLS
AUDIENCE ENGAGEMENT
SURVEYS
28%
INTEGRATION OF VIDEO
AVERAGE VIEWING TIME FOR WEBINARS
WEBINAR AUDIENCE ON MOBILE AND TABLET
REGISTRANT TO ATTENDEE CONVERSION
AVERAGE ATTENDEE RATE
2017 MINUTES
55
2016 MINUTES
57
2015 MINUTES
56
2014 MINUTES
56
2013 MINUTES
56 6% 33%
2015 MINUTES
29
2016 MINUTES
34
2017 MINUTES
42
MON TUE WED THURS FRI SAT/SUN
11% 23% 27% 28% 8% 3%
MON TUE WED THURS FRI SAT/SUN
13%
9AM PST
17%
10AM PST8AM PST
11% 24%
11AM PST
16%
12PM PST
100-199 200-299 300-499 500-999 1000+
100-199: 47%300-499: 16%
500-999: 11%
1000+: 7%
200-299: 19%
CONTACT US
12%
RESOURCES LIST
66%
4.13.8
MARKETING TRAINING CONTINUINGEDUCATION
INTERNAL COMMUNICATIONS
AVERAGE ENGAGEMENT
3.84.6 4.1
45%
36%
MARKETINGWEBINARS
TRAININGWEBINARS
CONTINUINGEDUCATION
INTERNAL COMMUNICATIONS
WEBINARS
TOTAL WEBINAR CONVERSIONS
54%
40% 46%

17
17
Conclusion
At ON24, we spend a lot of time thinking about webinars and webinar performance. And in all the years
that we’ve been producing this report, webinars have become consistently more popular, more effective,
and more interesting. Webinar producers and presenters put an increasing emphasis on creating an
engaging audience experience. Webinar promoters are thinking bigger, extending their promotions long
before and after the live event. Audiences are getting larger and more engaged, and spending more time
watching webinars, both live and on-demand.
As you plan your next webinars and evaluate the effectiveness of the program, use the benchmarks in
this report as a set of guidelines to help you create, promote, and deliver successful events.

© 2017 ON24, Inc. For more information on the benefits of the ON24 virtual environment, contact us at 877-202-9599 or visit www.on24.com.
ON24, INC.
795 FOLSOM STREET, FLOOR 3 SAN FRANCISCO, CA 94107 877.202.9599 ON24.COM
ABOUT ON24, INC.
ON24 is the leading webinar marketing platform for demand generation, lead
qualification and customer engagement. Its award-winning, patented, cloudbased
platform enables companies of all sizes to deliver engaging live and ondemand
webinars. Providing industry-leading analytics that can be integrated with all leading
marketing automation and CRM platforms, ON24 enables marketers to optimize demand
generation, enhance lead qualification and accelerate sales pipeline opportunities.
Additional applications for the ON24 product portfolio include virtual training, talent
development and town hall meetings. More than 1,000 enterprises rely on ON24,
including IBM, CA Technologies, Merck, JPMorgan Chase, Deloitte, Credit Suisse and
SAP. The company is headquartered in San Francisco, with offices throughout the world.
For more information, visit ON24.com