oncogeneisafunctionalmarkerofaglioblastoma stem cell...
TRANSCRIPT
Tumor and Stem Cell Biology
TheMETOncogene Is a Functional Marker of a GlioblastomaStem Cell Subtype
Francesca De Bacco1, Elena Casanova1, Enzo Medico1, Serena Pellegatta2,4, Francesca Orzan1,Raffaella Albano1, Paolo Luraghi1, Gigliola Reato1, Antonio D'Ambrosio1, Paola Porrati2, Monica Patan�e2,Emanuela Maderna3, Bianca Pollo3, Paolo M. Comoglio1, Gaetano Finocchiaro2,4, and Carla Boccaccio1
AbstractThe existence of treatment-resistant cancer stem cells contributes to the aggressive phenotype of glioblastoma.
However, the molecular alterations that drive stem cell proliferation in these tumors remain unknown. In thisstudy, we found that expression of the MET oncogene was associated with neurospheres expressing the genesignature of mesenchymal and proneural subtypes of glioblastoma. Met expression was almost absent fromneurospheres expressing the signature of the classical subtype andwasmutually exclusive with amplification andexpression of the EGF receptor (EGFR) gene. Met-positive and Met-negative neurospheres displayed distinctgrowth factor requirements, differentiated along divergent pathways, and generated tumors with distinctivefeatures. The Methigh subpopulation within Met-pos neurospheres displayed clonogenic potential and long-termself-renewal ability in vitro and enhanced growth kinetics in vivo. In Methigh cells, the Met ligand HGF furthersustained proliferation, clonogenicity, expression of self-renewal markers, migration, and invasion in vitro.Together, our findings suggest that Met is a functional marker of glioblastoma stem cells and a candidate targetfor identification and therapy of a subset of glioblastomas. Cancer Res; 72(17); 4537–50. �2012 AACR.
IntroductionGlioblastoma, the highest grade glioma variant, is a relatively
rare (yearly incidence of 4–5/100,000 people) but very aggres-sive tumor, associated with high morbidity, mortality, andrecurrence (median survival of 12–15 months; ref. 1). Thesemeager treatment options prompted a huge effort to achievecomprehensive profiling of gene expression patterns andgenetic alterations (2–6), in order to identify molecular targetsfor innovative—possibly personalized—therapies. By expres-sion profiling, 3 main glioblastoma subtypes have been recog-nized: classical, mesenchymal, and neural/proneural (hereproneural; ref. 6). The classical subtype mostly displays altera-tions of the EGF receptor (EGFR) gene, such as amplification ordeletion of the extracellular domain (EGFRvIII; ref. 6). Themesenchymal subtype often harbors a normal EGFR gene anddeletion of NF1 or PTEN tumor suppressor genes (6). Theproneural subtype preferentially associates with mutations of
isocitrate dehydrogenase 1 (IDH1) or 2 (IDH2), or aberrantactivation of PDGFRA, resulting from gene amplification/mutation, or occurrence of autocrine loops. This subtype, oftenevolving from lower grade gliomas, may associate with a morefavorable prognosis, but does not benefit from current ther-apies (6, 7).
To understand glioblastoma pathogenesis, it is crucial toidentify the driving genetic lesions and to recognize thatglioblastoma onset and progression depend on a (small) sub-population of cancer stem cells (CSC), which, according to anoperational definition, hold replicative immortality in vitro andtumor-initiating potential when transplanted in vivo (8, 9).Despite the controversy arising on the ultimate, elusive natureof these cells, convincing evidence indicates that CSCs possessinherent radio- and chemoresistance, a major cause of treat-ment failure and disease recurrence (10, 11). To envisage newtherapeutical strategies, genetic and molecular alterationsoccurring in glioblastoma stem cells must be identified. There-fore, we investigated whether themolecular alterations detect-able in the clinically manifest glioblastoma were present in thetumor-initiating subset, allowing classification in subtypesalready at the CSC level. From primary glioblastoma tissues,we isolated and propagated extensively self-renewing neuro-spheres, that is, cultures enriched in stem and progenitor cells(12). These neurospheres displayed mutational profiles largelyoverlapping with those of the original tumors and could beclassified as classical, mesenchymal, or proneural, according totheir gene expression profile. We then specifically associatedexpression of the MET oncogene with mesenchymal andproneural neurospheres, and we showed that Met signalingactively supported the stem-like and invasive phenotype.
Authors' Affiliations: 1IRCC–Institute for Cancer Research, Center forExperimental Clinical Molecular Oncology, University of Turin MedicalSchool, Candiolo; 2Unit of Molecular Neuro-Oncology, 3Unit of Neuropa-thology, Fondazione I.R.C.C.S. Istituto NeurologicoC. Besta; and 4Depart-ment of Experimental Oncology, IFOM-IEO Campus, Milan, Italy
Note: Supplementary data for this article are available at Cancer ResearchOnline (http://cancerres.aacrjournals.org/).
Corresponding Authors: Carla Boccaccio, IRCC, University of TorinoMedical School, Str. Prov. 142, Candiolo, 10060, Italy. Phone: 39-011-993-3208; Fax: 39-011-993-3225; E-mail: [email protected]; andPaolo M. Comoglio. Phone: 39-011-9933601; E-mail:[email protected]
doi: 10.1158/0008-5472.CAN-11-3490
�2012 American Association for Cancer Research.
CancerResearch
www.aacrjournals.org 4537
on February 15, 2019. © 2012 American Association for Cancer Research. cancerres.aacrjournals.org Downloaded from
Published OnlineFirst June 26, 2012; DOI: 10.1158/0008-5472.CAN-11-3490
Materials and MethodsNeurospheres derivation and culture
Neurospheres were derived from glioblastoma specimensdiagnosed according to WHO criteria (13) and cultured instandard medium containing EGF and bFGF (12). HGF(20 ng/mL) was added where indicated.
Evaluation of tumorigenicityCells were injected ortothopically (2 � 105 cells) or subcu-
taneously (105 cells in v/v PBS/Matrigel) into 6 weeks old maleNOD.CB17-Prkdcscid/J mice.
Gene copy number and sequencingGene amplification was assessed using commercially avail-
able TaqMan Copy Number Assays. For gene sequencing,specific primer pairs used are listed in Supplementary Table S7.
Microarray dataData have been deposited in the GEO database, accession
number GSE36426.
Immunophenotypical analysis and fluorescence-activated cell sorting
Cells were incubated with the antibodies listed in Supple-mentary Table S8.
Proliferation assayCells were plated at clonal density (10 cells/mL) in 96-well
plates in a medium devoid of growth factors. Twenty-four
hours after seeding (day 0), the indicated growth factors wereadded, and proliferation was measured by Cell Titer Glo.
Clonogenic assay and long-term propagationSingle cells were directly sorted into 96-well plates (1 cell/
well). Neurospheres were counted 14 days after seeding. Forlong-term propagation, cells were plated at clonal density, andformed neurospheres were dissociated, counted, and replatedonce a week.
Migration and invasion assaysA total of 105 cells were seeded in Transwell in the
absence (migration) or in the presence (invasion) of Matri-gel (10 mg/cm2; ref. 14).
Statistical analysisNumerical results were expressed as means � SEM. Statis-
tical significance was evaluated using 2-tailed Student t tests,Fisher exact tests or c2 tests. Multiple comparisons werecarried out using Bonferroni correction. Values of P less than0.05 were considered statistically significant.
For the other methods see Supplementary ExperimentalProcedure.
ResultsNeurospheres harbor genetic lesions specific ofglioblastoma subtypes
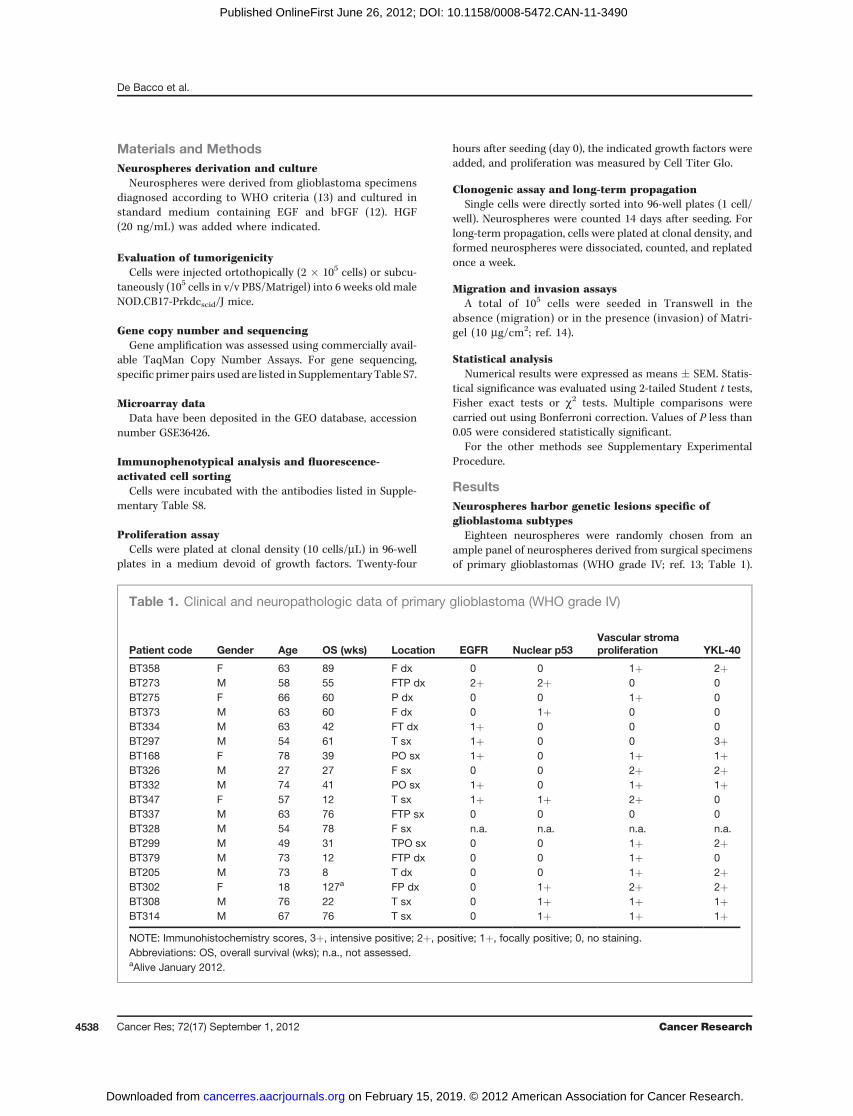
Eighteen neurospheres were randomly chosen from anample panel of neurospheres derived from surgical specimensof primary glioblastomas (WHO grade IV; ref. 13; Table 1).
Table 1. Clinical and neuropathologic data of primary glioblastoma (WHO grade IV)
Patient code Gender Age OS (wks) Location EGFR Nuclear p53Vascular stromaproliferation YKL-40
BT358 F 63 89 F dx 0 0 1þ 2þBT273 M 58 55 FTP dx 2þ 2þ 0 0BT275 F 66 60 P dx 0 0 1þ 0BT373 M 63 60 F dx 0 1þ 0 0BT334 M 63 42 FT dx 1þ 0 0 0BT297 M 54 61 T sx 1þ 0 0 3þBT168 F 78 39 PO sx 1þ 0 1þ 1þBT326 M 27 27 F sx 0 0 2þ 2þBT332 M 74 41 PO sx 1þ 0 1þ 1þBT347 F 57 12 T sx 1þ 1þ 2þ 0BT337 M 63 76 FTP sx 0 0 0 0BT328 M 54 78 F sx n.a. n.a. n.a. n.a.BT299 M 49 31 TPO sx 0 0 1þ 2þBT379 M 73 12 FTP dx 0 0 1þ 0BT205 M 73 8 T dx 0 0 1þ 2þBT302 F 18 127a FP dx 0 1þ 2þ 2þBT308 M 76 22 T sx 0 1þ 1þ 1þBT314 M 67 76 T sx 0 1þ 1þ 1þNOTE: Immunohistochemistry scores, 3þ, intensive positive; 2þ, positive; 1þ, focally positive; 0, no staining.Abbreviations: OS, overall survival (wks); n.a., not assessed.aAlive January 2012.
De Bacco et al.
Cancer Res; 72(17) September 1, 2012 Cancer Research4538
on February 15, 2019. © 2012 American Association for Cancer Research. cancerres.aacrjournals.org Downloaded from
Published OnlineFirst June 26, 2012; DOI: 10.1158/0008-5472.CAN-11-3490
Tab
le2.
Gen
etic
lesion
sin
neuros
phe
res(NS)a
ndtheco
rres
pon
dingoriginal
glioblastom
atis
suesp
ecim
ens(T)
Patient
code
EGFR
amp(a)
EGFR
vIII(a)
PDGFR
Aamp
IDH1/2m
ut
TP53
mut (b
)PTENmut (b
)NF1
mut (b
)
NS
TNS
TNS
TNS
TNS
TNS
TNS
T
BT3
58þ
þþ
þ�
��
��
��
��
n.a.
BT2
73þ
þþ
þ�
��
�þ
þ�
��
n.a.
BT2
75þ
þ�
þ�
��
�þ
þ�
��
n.a.
BT3
73þ
þ�
þ�
��
��
��
��
n.a.
BT3
34þ
þþ
þ�
��
��
n.a.
�n.a.
�n.a.
BT2
97þ
þ�
��
��
��
��
��
n.a.
BT1
68þ
þ�
þ�
��
�þ
n.a.
�n.a.
�n.a.
BT3
26þ
þ�
��
��
��
�þ
þ�
n.a.
� BT3
32�c
þ�
þ�
��
��
�þ
þ�
n.a.
� BT3
47�c
þ�
��
��
�þ
þþ
þ�
n.a.
� BT3
37�
þ�
��
��
��
��
��
n.a.
� BT3
28�
þ�
��
��
�þ
þþ
��
n.a.
BT2
99�c
�c�
��
��
��
�þ
þ�
n.a.
� BT3
79�
��
þ�
��
�þ
þþd
þdþ
n.a.
BT2
05�c
��
��
��
�þ
�þ
�þ
n.a.
BT3
02�
�c�
��
��
��
�þ
þ�
n.a.
BT3
08�c
��
��
��
�þ
þþ
þ�
n.a.
BT3
14�
��
��
��
�þ
þþ
þ�
n.a.
NOTE
:þ,p
rese
nceof
gene
ticalteratio
ns;�
,abse
nceof
gene
ticalteratio
ns.
Abbreviation:
n.a.,n
otac
cess
eddue
tolack
ofmaterial.
aAna
lysisof
EGFR
amp/vIIIis
show
nin
Sup
plem
entary
Fig.
S1an
dreportedin
Sup
plemen
tary
TableS2.
bDetailedlistof
mutations
isreportedin
Sup
plemen
tary
Table
S1
cch
r7polysom
ydHom
ozyg
ousdeletion
Met Is a Functional Marker of Glioblastoma Stem Cells
www.aacrjournals.org Cancer Res; 72(17) September 1, 2012 4539
on February 15, 2019. © 2012 American Association for Cancer Research. cancerres.aacrjournals.org Downloaded from
Published OnlineFirst June 26, 2012; DOI: 10.1158/0008-5472.CAN-11-3490
Histologic sections of the corresponding tumorswere analyzedfor mitotic index (invariably high, data not shown), EGFR, andp53 expression (15), and traits associated with subtyping,including vascular stroma proliferation and YKL-40 expression(ref. 5; Table 1 and Supplementary Fig. S1A).
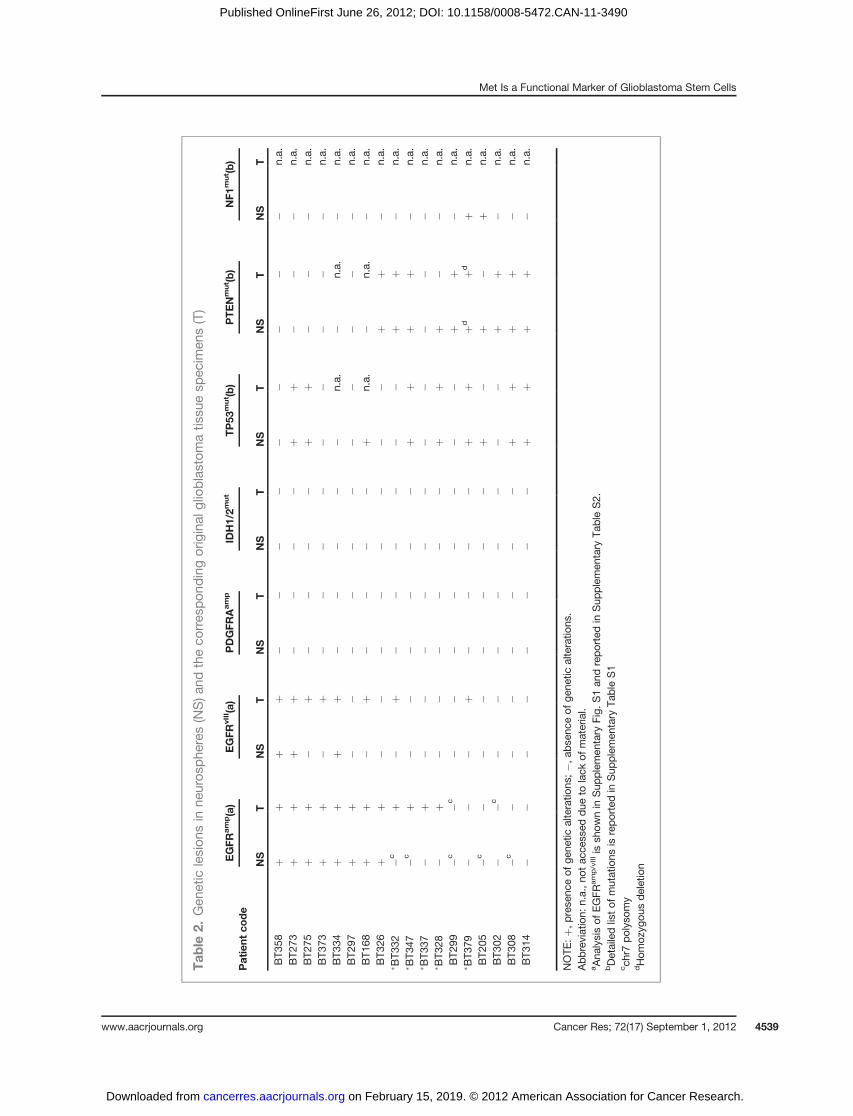
Neurospheres and their corresponding tumors were ana-lyzed for the presence of genetic alterations known occurringat high frequency in glioblastoma, such as amplification ofEGFR (EGFRamp), or deletion of its extracellular domain (exon2–7, EGFRvIII), amplification of PDGFRA, mutations of IDH1/2,TP53, PTEN, and NF1 (refs. 6, 16; Table 2; EGFR and PDGFRA
gene copy number and expression of EGFRvIII in Supplemen-tary Fig. S1B and C; TP53, PTEN, and NF1 mutations inSupplementary Table S1).
Eight of 18 neurospheres displayed EGFR amplificationand/or deletion (EGFRamp/vIII), a genetic trait preferentiallyassociated with the "classical" glioblastoma subtype, whereasthe remaining harbored a normal EGFR gene (EGFRwt), usuallyfound in either "mesenchymal" or "proneural" subtypes(ref. 6; Table 2). No neurosphere displayed the genetic land-marks of the "proneural" subtype, such as PDGFRA amplifica-tion or autocrine loop, or IDH1/2mutations (ref. 6; Table 2 and
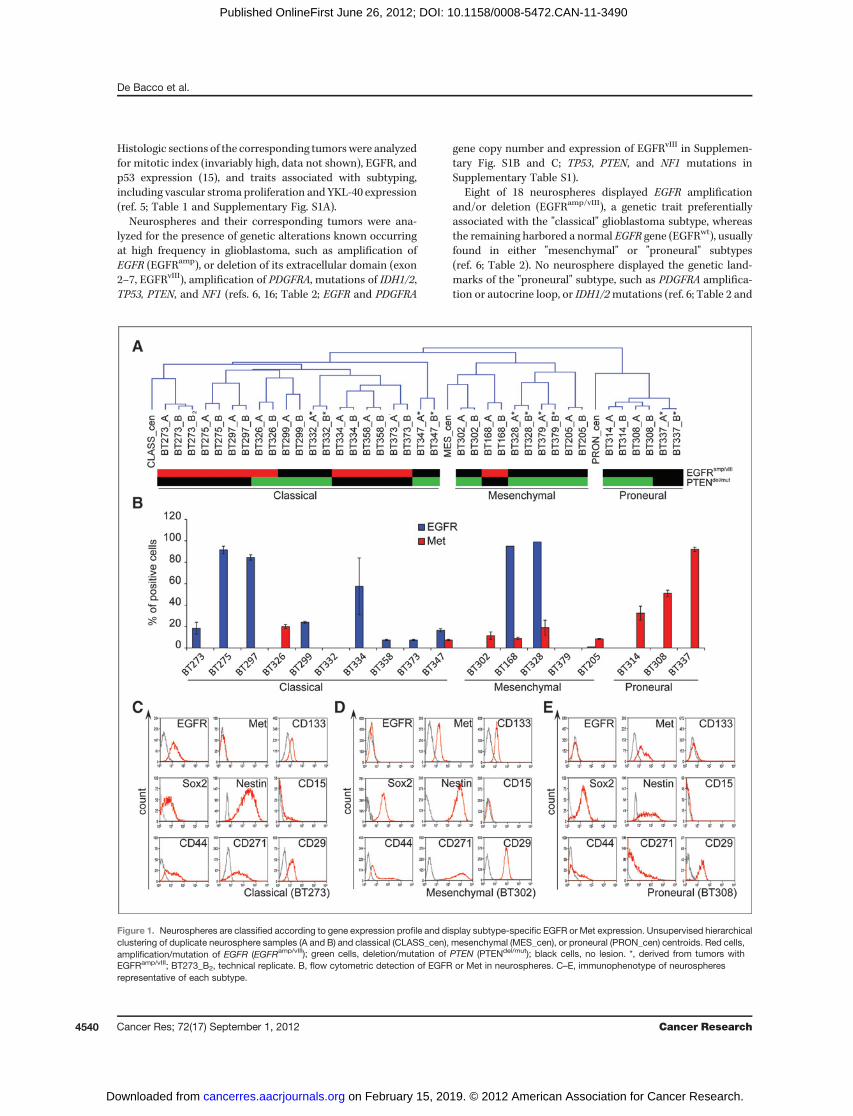
Figure 1. Neurospheres are classified according to gene expression profile and display subtype-specific EGFR or Met expression. Unsupervised hierarchicalclustering of duplicate neurosphere samples (A and B) and classical (CLASS_cen), mesenchymal (MES_cen), or proneural (PRON_cen) centroids. Red cells,amplification/mutation of EGFR (EGFRamp/vIII); green cells, deletion/mutation of PTEN (PTENdel/mut); black cells, no lesion. *, derived from tumors withEGFRamp/vIII; BT273_B2, technical replicate. B, flow cytometric detection of EGFR or Met in neurospheres. C–E, immunophenotype of neurospheresrepresentative of each subtype.
De Bacco et al.
Cancer Res; 72(17) September 1, 2012 Cancer Research4540
on February 15, 2019. © 2012 American Association for Cancer Research. cancerres.aacrjournals.org Downloaded from
Published OnlineFirst June 26, 2012; DOI: 10.1158/0008-5472.CAN-11-3490

data not shown). TP53, PTEN, or NF1 alterations (mutations ordeletions) were found in 9 of 18, 10 of 18, and 2 of 18 neuro-spheres, respectively (Table 2 and Supplementary Table S1).Mutations of TP53 and NF1 were shown to preferentiallyassociate with EGFRwt glioblastomas (6). In our panel, how-ever, only PTEN deletion/mutation was significantly asso-ciated with EGFRwt (for TP53, Fisher exact test, P ¼ 0.637; forPTEN, P ¼ 0.003; for NF1, P ¼ 0.477).Neurospheres displayed a mutational profile largely over-
lapping with the corresponding original tumors (Table 2).However, 5 of 13 neurospheres derived from EGFRamp/vIII
tumors lacked EGFR alterations (Table 2). Moreover, in theremainingEGFRamp/vIII neurospheres, the number ofEGFR genecopieswas decreasedwith respect to the corresponding originaltumor (Supplementary Table S2). These findings are consistentwith previous reports, indicating that in vitro culture selectsagainst EGFR genetic lesions (refs. 17, 18; see Discussion).
Neurospheres can be classified as classical,mesenchymal, or proneural according to geneexpression profileNext we carried out genome-wide gene expression profiling
of the whole neurosphere panel and assessed whether theycould be subdivided in classical, mesenchymal, or proneuralsubgroups by the transcriptional signature identified in anindependent set of glioblastoma tissues by Verhaak (ref. 6;Fig. 1A and Supplementary Fig. S2). The classical, mesenchy-mal, and proneural centroids (i.e., 3 virtual samples displayingaverage expression of each signature gene in, respectively,classical, mesenchymal, and proneural glioblastomas) wereextracted from the published datasets (https://tcga-data.nci.nih.gov/docs/publications/gbm_exp/) and mapped in themicroarray, resulting in 549 probes, corresponding to 532genes. The 3 centroids and the neurosphere samples werethen hierarchically clustered by unsupervised analysis. The
clustering sharply subdivided the neurospheres in 3 subgroups,including the classical, the mesenchymal, and the proneuralcentroid, respectively (Fig. 1A and Supplementary Fig. S2).
By comparing neurosphere gene expression and mutationalprofiles, we observed that the majority (7 of 10) of neuro-spheres profiled as classical harbored EGFR gene amplifica-tion/deletion (EGFRamp/vIII; Fig. 1A). Interestingly, the 3 of 10classical neurospheres without EGFR gene amplification dis-played high chromosome 7 polisomy and, in 2 cases, derivedfrom EGFRamp/vIII tumors (Table 2). On the contrary, 7 of 8neurospheres profiled as mesenchymal or proneural harboreda normal EGFR gene (EGFRwt; Fig. 1A). Altogether, these dataindicated a marked preferential association of EGFRamp/vIII
with classical compared with mesenchymal/proneural neuro-spheres (c2 test, P < 0.04). Vice versa, although not statisticallysignificant, PTEN mutation/deletion was preferentially asso-ciated with mesenchymal/proneural compared with classicalneurospheres (6 of 8 vs. 4 of 10 neurospheres, c2 test, P ¼0.31; Fig. 1A).
Classical andmesenchymal/proneural neurospheres arediscriminated by EGFR or Met expression
Gene expression profiling and qPCR validation (Supplemen-tary Fig. 3A–C) indicated that not only EGFR alteration butalso transcription was preferentially associated with classicalneurospheres (2-sided t test, P < 0.0001). Vice versa, transcrip-tion of the MET gene, known to be expressed in a fraction(ffi30%) of unclassified human gliomas (19, 20), was preferen-tially associated with mesenchymal/proneural neurospheres(2-sided t test, P < 0.01).
To further investigate the role of EGFR and Met as markersof classical and mesenchymal/proneural neurosphere sub-groups respectively, we assessed by flow cytometry the cell-surface expression of the 2 receptors in the whole neurospherepanel.
Figure 1. (Continued ) F, variation ofthe average number of cells positivefor the indicated markers in eachsubtype with respect to allneurospheres (absolute numbers inSupplementary Table S3). G–I,relative expression of 532 signaturegenes (https://tcga-data.nci.nih.gov/docs/publications/gbm_exp/; blackdots). x-axis, log2 ratio betweenglioblastoma (GB) samples of eachsubtype versus the other subtypes;y-axis, log2 ratio between Met-pos-NS and Met-neg-NS.
Met Is a Functional Marker of Glioblastoma Stem Cells
www.aacrjournals.org Cancer Res; 72(17) September 1, 2012 4541
on February 15, 2019. © 2012 American Association for Cancer Research. cancerres.aacrjournals.org Downloaded from
Published OnlineFirst June 26, 2012; DOI: 10.1158/0008-5472.CAN-11-3490
De Bacco et al.
Cancer Res; 72(17) September 1, 2012 Cancer Research4542
on February 15, 2019. © 2012 American Association for Cancer Research. cancerres.aacrjournals.org Downloaded from
Published OnlineFirst June 26, 2012; DOI: 10.1158/0008-5472.CAN-11-3490
As expected, EGFR was detected in the majority (8 of 10) ofclassical neurospheres, but only in 2 of 8 mesenchymal/pro-neural neurospheres (Fig. 1B and Supplementary Table S3).Vice versa, Met was expressed by the majority (7 of 8) ofmesenchymal/proneural neurospheres, with variable percen-tages of positive cells (5%–94%), but only in 2 of 10 classicalneurospheres (Fig. 1B and Supplementary Table S3). Therefore,EGFRprotein expressionwas strongly preferentially associatedwith the classical neurosphere subgroup (c2 test, P < 0.001),whereas Met protein was associated with the mesenchymal/proneural neurosphere subgroup (c2 test, P < 0.02). Interest-ingly, Met expression (in the absence of any gene alteration)was detected in the majority of original tumors that generat-ed neurospheres expressing Met, but was mostly absent fromtumors that generated neurospheres not expressing Met,and that harbored EGFR amplification (SupplementaryTable S4).We then analyzed whether other cell-surface markers could
be specifically associated with each neurosphere subgroup.CD133, previously used (21), and more recently questioned(22, 23), as glioblastoma stem cell marker, was inconstantlyexpressed (0%–90% of positive cells), without associationwith any subgroup (Fig. 1C–F and Supplementary Table S3).Also expression of Sox2, Nestin, and CD15/SSEA1, 3 markersassociated with the neural stem cell phenotype (24), did notdisplay any statistically significant difference among thesubgroups (Fig. 1C–F and Supplementary Table S3; for Sox2,c2 test, P ¼ 0.08; for Nestin, P ¼ 0.09; for CD15, P ¼ 0.314).Consistently, transcription of CD133 and Sox2 and otherstem cell markers was comparable in all subgroups (Sup-plementary Fig. S3D). Finally, cell-surface expression ofCD44 (a gene of the mesenchymal signature; refs. 5, 6), orCD271 and CD29 (2 markers of mesenchymal differentiationof neural progenitors; ref. 25), was not preferentially asso-ciated with any subgroup (for CD44, c2 test, P ¼ 0.304; forCD271, P ¼ 0.982; for CD29, P ¼ 0.766; Fig. 1C–F andSupplementary Table S3).Taken together, these data indicated that, in neurospheres,
expression of EGFR and Met are almost mutually exclusive. Bycombined flow cytometric analysis, unlike othermarkers, the 2receptors are sufficient to separate neurospheres in 2 sub-groups: EGFR-pos/Met-neg-NS (hereafter indicated as Met-neg-NS), roughly corresponding to classical neurospheres, andEGFR-neg/Met-pos-NS (hereafter indicated as Met-pos-NS),roughly corresponding to mesenchymal/proneural neuro-spheres. Consistently, Met-pos-NS, unlike Met-neg-NS, werehighly enriched in mesenchymal or proneural, but lackedclassical signature genes (Fig. 1G–I). Strikingly, among all thesesignature genes, EGFRwas, concomitantly, themost expressed
in the classical subtype and the least expressed in Met-pos-NS(Fig. 1G).
Met-pos and Met-neg neurosphere subgroups areidentified by multiple transcriptional signatures
Neurosphere gene expression profiles were also analyzed byapplying additional transcriptional signatures, including 2identified in glioblastoma neurospheres (26, 27), 2 in originaltumors (5, 28), and 1 in mixed tissues, neurospheres, and celllines (ref. 29; Supplementary Fig. S4 and Supplementary TableS5). The 5 signatures were almost fully mapped in the micro-arrays and hierarchically clusterized neurospheres. In all cases,Met-pos-NS and Met-neg-NS were sharply separated intodistinct and homogeneous clusters. By applying the 2-clustersignatures, the majority of Met-pos-NS fell into Cluster II (26),or Type II (27), or GSr/lines group (29), whereas themajority ofMet-neg-NS fell into Cluster I (26), or Type I (27), or GSf/tumorgroup (29). By applying the multicluster signatures generatedfrom tumor tissues (5, 28), Met-pos-NS fell into the mostaggressive subgroups (Supplementary Fig. S4 and Supplemen-tary Table S5).
Met-pos and Met-neg neurospheres display subtype-specific growth factor requirements and differentiationpatterns
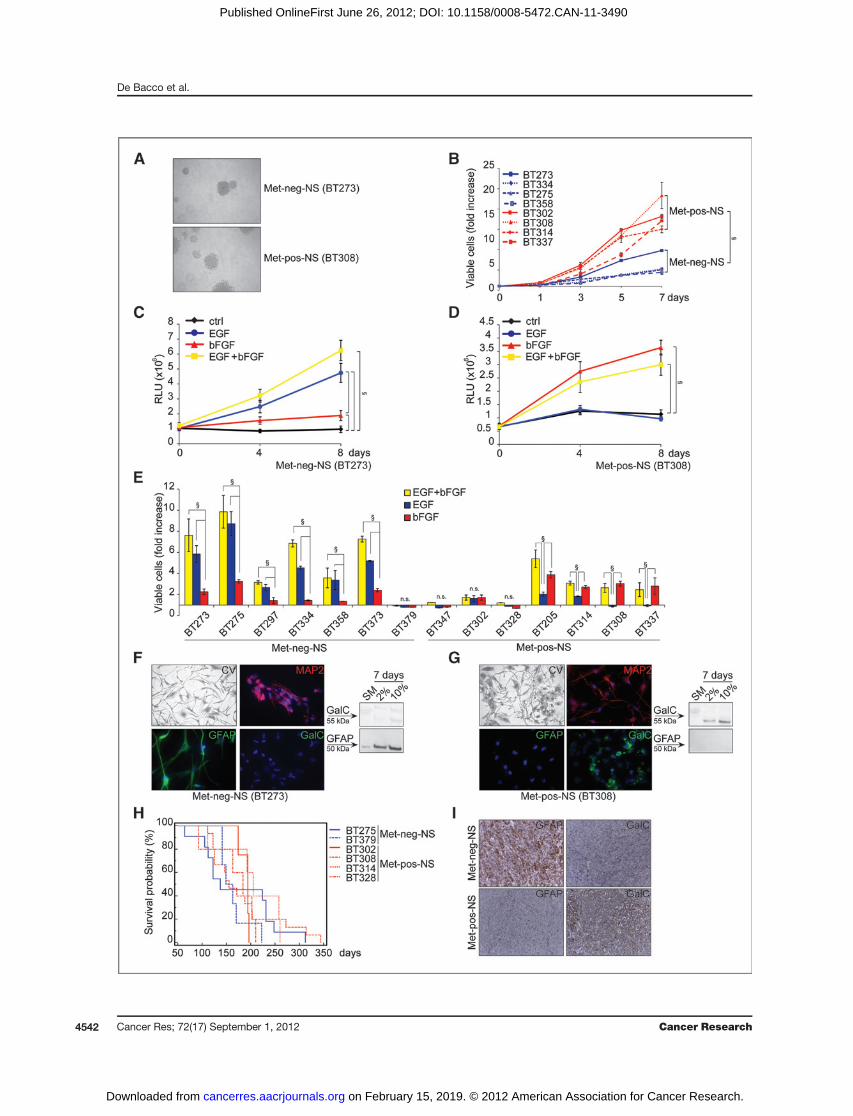
We observed that Met-pos-NS and Met-neg-NS displayeddistinctive microscopic features: Met-neg-NSmostly displayeda compact, smooth surface, whereas Met-pos-NS appeared asaggregates of cells with loose intercellular adhesion (Fig. 2A).Moreover, in standard medium, Met-pos-NS displayed a pro-liferative rate significantly higher than Met-neg-NS (Fig. 2B).We then systematically analyzed the proliferative response toEGF or bFGF, alone or in combination (Fig. 2C–E and Sup-plementary Fig. S5A).Met-neg-NSweremostly quiescent in theabsence of growth factors (data not shown), and, with oneexception, were markedly stimulated by EGF, but weakly bybFGF alone; the 2 growth factorswere not significantly additive(Fig. 2C and E; median fold increase with EGF ¼ 4.54, withbFGF¼ 1.45, Supplementary Fig. S5A). Vice versa, Met-pos-NSgrew in the absence of exogenous growth factors (data notshown), and, with some exceptions, were further stimulated bybFGF, but not by EGF; again, the 2 factors were not additive(Fig. 2D and E; median fold increase with EGF ¼ 0.94, withbFGF ¼ 2.73, Supplementary Fig. S5A).
The ability of Met-pos-NS to proliferate in the absence ofexogenous growth factors could be explained by expressionof autocrine loops (data not shown). The different sensitivity ofMet-neg-NS and Met-pos-NS to EGF was correlated with thedifferent levels of EGFR expression (Fig. 1B). Consistently,
Figure 2. Met-neg-NS and Met-pos-NS display subtype-specific growth factor requirements and differentiation patterns. A, representative micrographs(magnification,�100). B, proliferation in standard mediummeasured by Cell Titer Glo. Fold increase with respect to day 0. x, 2-sided t test, P < 0.05. C and D,proliferation with different growth factors (EGF and/or bFGF) measured as above. RLU, relative light units. x, 2-sided t test, P < 0.05. E, proliferationmeasured as above after 8 days in standard medium (EGFþ bFGF) or EGF or bFGF alone, with respect to control cells kept in the absence of growth factors.x, 2-sided t test, P < 0.05. F and G, micrographs (magnification, �100) of cells kept in 10% serum for 7 days and stained with crystal violet (CV), oranti-MAP2, anti-GFAP or anti-GalC antibodies. Nuclei counterstained with 40, 6-diamidino-2-phenylindole (DAPI). Western blots of cells kept in standardmedium (SM) or 2% or 10% serum. H, Kaplan–Meier survival curves of mice orthotopically injected with neurospheres. I, immunohistochemistry for GFAP orGalC in tumors formed by orthotopically injected neurospheres (Met-neg-NS: BT379; Met-pos-NS: BT308, magnification, �200).
Met Is a Functional Marker of Glioblastoma Stem Cells
www.aacrjournals.org Cancer Res; 72(17) September 1, 2012 4543
on February 15, 2019. © 2012 American Association for Cancer Research. cancerres.aacrjournals.org Downloaded from
Published OnlineFirst June 26, 2012; DOI: 10.1158/0008-5472.CAN-11-3490
EGFR family members were found significantly phosphorylat-ed, in the presence of EGF, only inMet-neg-NS (SupplementaryFig. S5C). The comparable sensitivity of bothMet-neg andMet-pos neurospheres to bFGF correlated with similar expressionand ligand-induced tyrosine phosphorylation of FGFR2, themain bFGF receptor (Supplementary Fig. S5B and C).
By culturing dissociated neurospheres in prodifferentiatingconditions, Met-neg and Met-pos neurospheres displayeddivergent differentiation patterns (Fig. 2F and G, Supplemen-tary Fig. S5D, and data not shown). Met-neg-NS differentiatedinto neuro-astroglial lineages, as shown by upregulation of
the neural marker MAP2 and the astroglial marker GFAP.No oligodendroglial cells were detected after staining withthe specific GalC marker. On the contrary, Met-pos-NS dif-ferentiated into neuro-oligodendroglial but not into theastroglial lineage.
Finally, a panel of representative Met-neg and Met-posneurospheres were orthotopically transplanted into immuno-compromised mice. Between the 2 subgroups, no significantdifferences were reported in mouse survival (Fig. 2H andSupplementary Table S6), tumor proliferative index (Supple-mentary Table S6), or vascularization (data not shown). In no
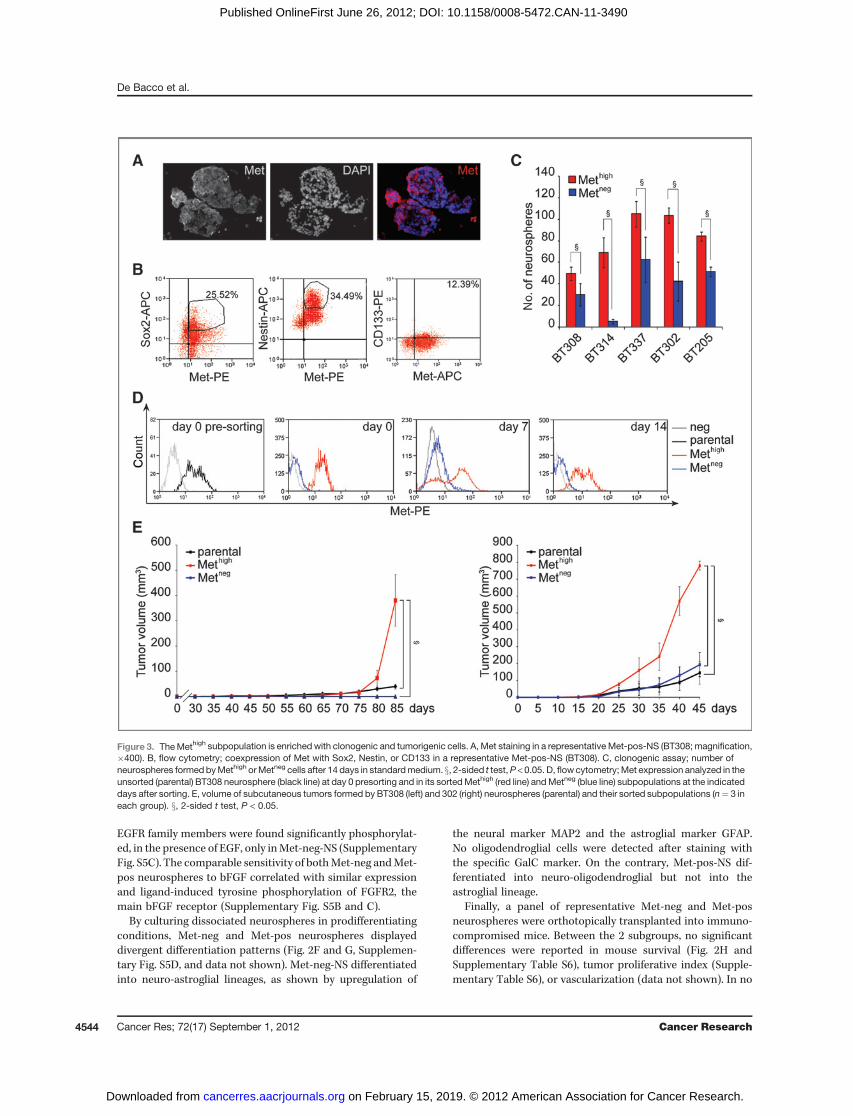
Figure 3. TheMethigh subpopulation is enrichedwith clonogenic and tumorigenic cells. A, Met staining in a representative Met-pos-NS (BT308; magnification,�400). B, flow cytometry; coexpression of Met with Sox2, Nestin, or CD133 in a representative Met-pos-NS (BT308). C, clonogenic assay; number ofneurospheres formed byMethigh orMetneg cells after 14 days in standardmedium. x, 2-sided t test,P < 0.05. D, flowcytometry;Met expression analyzed in theunsorted (parental) BT308 neurosphere (black line) at day 0 presorting and in its sortedMethigh (red line) andMetneg (blue line) subpopulations at the indicateddays after sorting. E, volume of subcutaneous tumors formed by BT308 (left) and 302 (right) neurospheres (parental) and their sorted subpopulations (n¼ 3 ineach group). x, 2-sided t test, P < 0.05.
De Bacco et al.
Cancer Res; 72(17) September 1, 2012 Cancer Research4544
on February 15, 2019. © 2012 American Association for Cancer Research. cancerres.aacrjournals.org Downloaded from
Published OnlineFirst June 26, 2012; DOI: 10.1158/0008-5472.CAN-11-3490
case, invasion of the contralateral brain hemisphere could beobserved (data not shown). However, consistent with thedifferentiation pattern observed in vitro, tumors derived fromMet-neg-NS invariably expressed high levels of GFAP, but notGalC. Vice versa, those derived from Met-pos-NS invariablyexpressed high levels of GalC and traces of GFAP only at thetumor periphery (Fig. 2I, Supplementary Table S6, and data notshown).The above data showed that, although selected and prop-
agated in the same medium, Met-pos and Met-neg neuro-spheres have distinct, subtype-specific signaling requirementsfor proliferation and specific differentiation patterns, bothin vitro and in vivo. Altogether, these observations suggestedthat the corresponding tumors may have different cells oforigin (see Discussion).
In Met-pos-NS the Methigh subpopulation is enrichedwith clonogenic and tumorigenic cellsHaving established that Met is a marker of a biologically
distinct neurosphere subtype, we investigated its functionalrole. By flow cytometry (Fig. 1B–E and Supplementary TableS3) and immunofluorescence (Fig. 3A and data not shown), weobserved that Met expression was restricted to cell subpopula-tions of various extents, which, in some cases, expressed alsohigh levels of stem cell markers such as Sox2, Nestin, or CD133(Fig. 3B and data not shown). We thus sorted the Methigh fromthe Metneg subpopulation (for sorting parameters see Supple-
mentary Fig. S6) and carried out clonogenic assays by platingand culturing single cells in standard medium. In 9 of 9 Met-pos-NS, Methigh cells invariably displayed higher clonogenicability as compared with Metneg cells (Fig. 3C and data notshown). Moreover, neurospheres derived from Methigh cellsmaintained their clonogenic ability and differentiative multi-potentiality through more than 20 serial passages, whereasthose derived from Metneg cells arrested their growth within 3to 8 passages (Supplementary Fig. S7A and B). Cell-cycleanalysis of the representative neurospheres BT308 showedthat, immediately after sorting, the Methigh subpopulationcontained a higher percentage of cells in the S phase (8.2%vs. 3.4%) and a lower percentage of apoptotic cells (3.4% vs.20.7%), as compared with the Metneg subpopulation (over-lapping results were obtained with BT337, data not shown). Inanother set of experiments, Methigh and Metneg cells weresorted, plated at clonal density, and cultured in standardmedium. The secondary clones were analyzed by flow cyto-metry forMet expression after 7 and 14 days; the clones formedby Methigh cells progressively reacquired the same Met immu-nophenotypic profile (including Methigh and Metneg) as theparental neurospheres (Fig. 3D, Supplementary Fig. S7C, anddata not shown). In contrast, neurospheres formed by Metneg
cells remained entirely composed of Metneg cells.To investigate the tumorigenicity of the 2 subpopulations,
representative parental Met-pos-NS (BT308 and BT302)and their sorted Methigh or Metneg subpopulations were
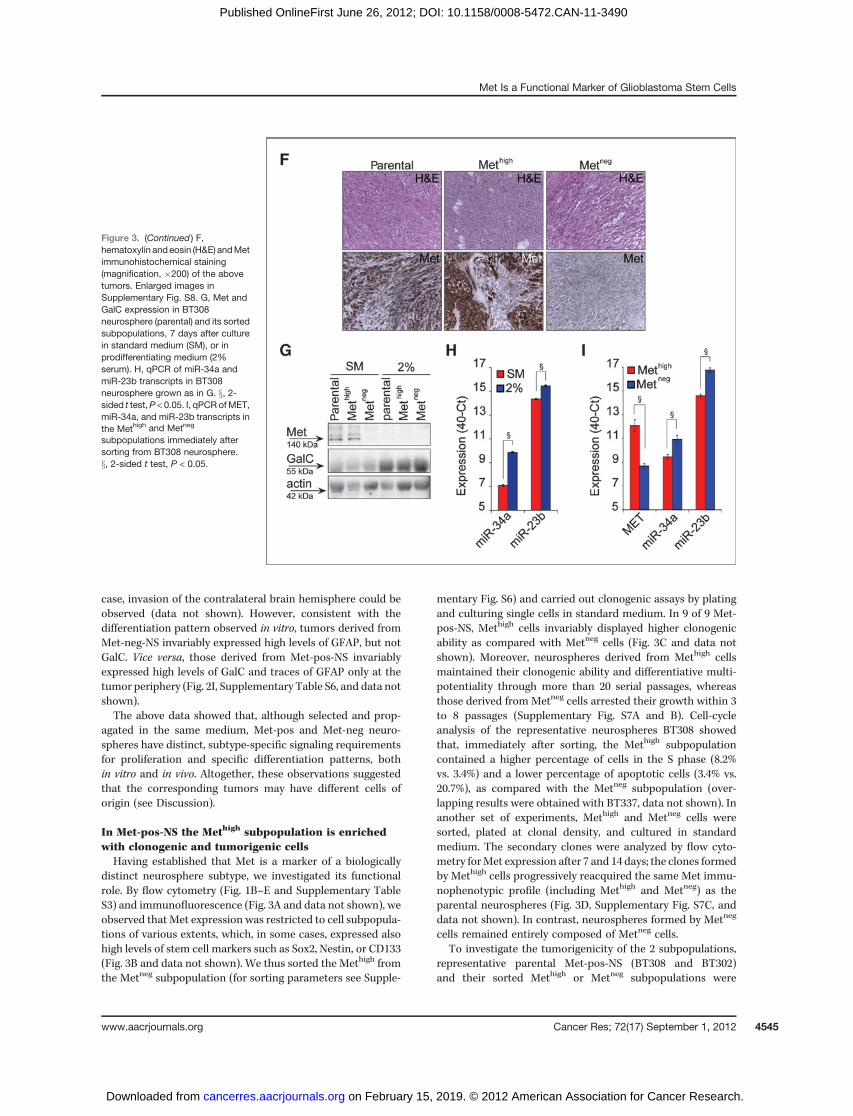
Figure 3. (Continued ) F,hematoxylin andeosin (H&E) andMetimmunohistochemical staining(magnification, �200) of the abovetumors. Enlarged images inSupplementary Fig. S8. G, Met andGalC expression in BT308neurosphere (parental) and its sortedsubpopulations, 7 days after culturein standard medium (SM), or inprodifferentiating medium (2%serum). H, qPCR of miR-34a andmiR-23b transcripts in BT308neurosphere grown as in G. x, 2-sided t test,P < 0.05. I, qPCR ofMET,miR-34a, and miR-23b transcripts inthe Methigh and Metneg
subpopulations immediately aftersorting from BT308 neurosphere.x, 2-sided t test, P < 0.05.
Met Is a Functional Marker of Glioblastoma Stem Cells
www.aacrjournals.org Cancer Res; 72(17) September 1, 2012 4545
on February 15, 2019. © 2012 American Association for Cancer Research. cancerres.aacrjournals.org Downloaded from
Published OnlineFirst June 26, 2012; DOI: 10.1158/0008-5472.CAN-11-3490

subcutaneously injected into immunocompromised mice. Inthe case of BT308, only the parental neurosphere and theMethigh subpopulation displayed the ability to form tumors,whereas in the case of BT302, even the Metneg subpopulationgenerated measurable tumors. However, in both cases, tumorsformed by Methigh cells grew significantly more rapidly thanthose formed by the parental or its sorted Metneg subpopula-tion (Fig. 3E). Interestingly, tumors derived by Methigh orunsorted cells had a similar histopathologic aspect, featuringa mixture of small-rounded and spindle-shaped cells. Byimmunohistochemistry, the small-rounded cells were positivefor Met expression, whereas spindle-shaped cells were nega-tive. On the contrary, tumors derived by Metneg cells sortedfrom BT302 only contained uniform spindle-shaped cells neg-ative for Met expression (Fig. 3F, Supplementary Fig. S8, anddata not shown).
Taken together, these findings indicated that, unlike theMetneg subpopulation, the Methigh retained long-term clono-genic properties in vitro, enhanced growth kinetics in vivo, andgenerated a heterogeneous progeny, including Methigh andMetneg cells, both in vitro and in vivo. Whereas Methigh mightcorrespond to stem-like cells, Metneg likely correspond tomoredifferentiated cells that exhaust their proliferative potential.Consistently, we observed that Met expression was down-
regulated when neurospheres (or the sorted Methigh subpopu-lations) were cultured in prodifferentiating conditions (Fig. 3Gand Supplementary Fig. S7D). Concomitantly, upregulationof miRNA-34a and miRNA-23b, both targeting the MET tran-script (30, 31), was observed (Fig. 3H and data not shown).Interestingly, in neurospheres cultured in standard medium,the same miRNAs were more expressed in Metneg than Methigh
cells (Fig 3I and Supplementary Fig. S7E).
HGF sustains clonogenicity, expression of self-renewalmarkers, and cell invasion in vitro
Next we investigated whether HGF stimulated proliferationof Met-pos-NS and their sorted Methigh and Metneg subpopula-tions. When supplied to parental neurospheres as the solegrowth factor, HGF displayed a negligible proliferative effect, ifcompared with bFGF (Fig. 4A and Supplementary Fig. S9A).However, in the sorted Methigh subpopulation, HGF signifi-cantly increased proliferation, although less intensely thanbFGF (2-fold versus 6-fold increase; Fig. 4A and SupplementaryFig. S9A). As expected, HGF did not stimulate proliferation ofMetneg cells (Fig. 4A and Supplementary Fig. S9A) andMet-neg-NS (data not shown).
Moreover, HGF supported the clonogenic ability of Methigh
cells, sorted as single cells fromMet-pos-NS and cultured in the
A B
0
10
30
40
50
60
BT308BT337
Met
Met
No
. o
f n
eu
rosp
he
res
§ high
neg
20
Parental Met Methigh neg0
1
2
3
4
5
6
7
8
9
10
HGFEGFEGF+HGFbFGFbFGF+HGFEGF+bFGFEGF+bFGF+HGF
Via
ble
ce
lls (
fold
in
cre
ase
)
§
- - ++- - ++ HGF
Ctrl
§
§
§
__ neg__ SM+HGF__ SM
Co
un
t
Nestin-APC
34.24%
45.97%
__ neg__ SM+HGF__ SM 63.91%
95.13%
Co
un
t
Sox2-APC
CBT302
- - ++
BT314
- - ++
§
§
§
D
§ §
0
2
3
4
5
Nanog
x-f
old
in
du
ctio
n
1
Ctrl
Sox2
1 h6 h24 h
Sox2 Nanog
20
22
23
24
25
21
§
§
§
§
BT302 BT308
Figure 4. HGF sustains clonogenicity and expression of self-renewal markers. A, proliferative effect of growth factors on the Met-pos-NS BT308 (parental) orits sorted subpopulations, with respect to control (no growth factor), after 8 days of culture. x, 2-sided t test, P < 0.05. B, clonogenic assay; number ofneurospheres formed by Methigh or Metneg cells after 14 days with (þ) or without (�) HGF. x, 2-sided t test, P < 0.05. C, flow cytometry; expression of Sox2 orNestin in BT308 neurosphere in standard medium (SM) with or without HGF. x, 2-sided t test, P < 0.05. D, qPCR; expression of Nanog and Sox2 inneurospheres treated with HGF with respect to standard medium (Ctrl).
De Bacco et al.
Cancer Res; 72(17) September 1, 2012 Cancer Research4546
on February 15, 2019. © 2012 American Association for Cancer Research. cancerres.aacrjournals.org Downloaded from
Published OnlineFirst June 26, 2012; DOI: 10.1158/0008-5472.CAN-11-3490
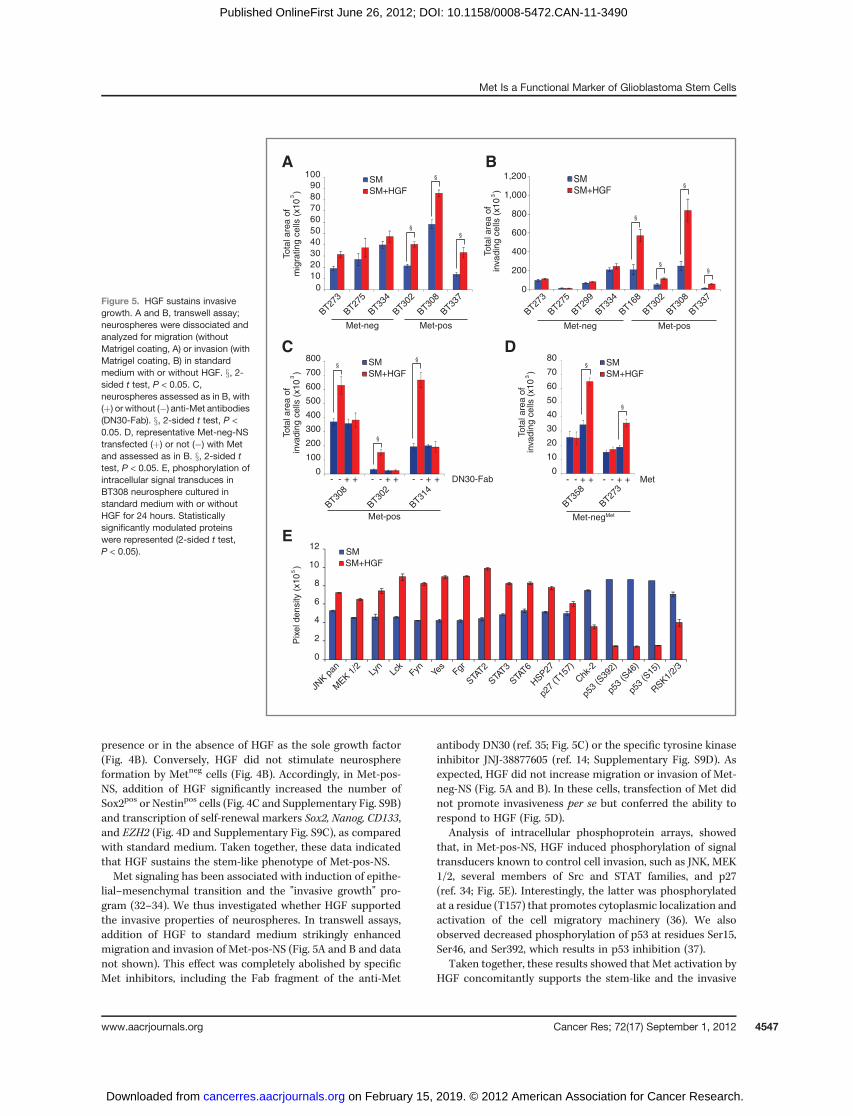
presence or in the absence of HGF as the sole growth factor(Fig. 4B). Conversely, HGF did not stimulate neurosphereformation by Metneg cells (Fig. 4B). Accordingly, in Met-pos-NS, addition of HGF significantly increased the number ofSox2pos or Nestinpos cells (Fig. 4C and Supplementary Fig. S9B)and transcription of self-renewal markers Sox2, Nanog, CD133,and EZH2 (Fig. 4D and Supplementary Fig. S9C), as comparedwith standard medium. Taken together, these data indicatedthat HGF sustains the stem-like phenotype of Met-pos-NS.Met signaling has been associated with induction of epithe-
lial–mesenchymal transition and the "invasive growth" pro-gram (32–34). We thus investigated whether HGF supportedthe invasive properties of neurospheres. In transwell assays,addition of HGF to standard medium strikingly enhancedmigration and invasion of Met-pos-NS (Fig. 5A and B and datanot shown). This effect was completely abolished by specificMet inhibitors, including the Fab fragment of the anti-Met
antibody DN30 (ref. 35; Fig. 5C) or the specific tyrosine kinaseinhibitor JNJ-38877605 (ref. 14; Supplementary Fig. S9D). Asexpected, HGF did not increase migration or invasion of Met-neg-NS (Fig. 5A and B). In these cells, transfection of Met didnot promote invasiveness per se but conferred the ability torespond to HGF (Fig. 5D).
Analysis of intracellular phosphoprotein arrays, showedthat, in Met-pos-NS, HGF induced phosphorylation of signaltransducers known to control cell invasion, such as JNK, MEK1/2, several members of Src and STAT families, and p27(ref. 34; Fig. 5E). Interestingly, the latter was phosphorylatedat a residue (T157) that promotes cytoplasmic localization andactivation of the cell migratory machinery (36). We alsoobserved decreased phosphorylation of p53 at residues Ser15,Ser46, and Ser392, which results in p53 inhibition (37).
Taken together, these results showed that Met activation byHGF concomitantly supports the stem-like and the invasive
Figure 5. HGF sustains invasivegrowth. A and B, transwell assay;neurospheres were dissociated andanalyzed for migration (withoutMatrigel coating, A) or invasion (withMatrigel coating, B) in standardmedium with or without HGF. x, 2-sided t test, P < 0.05. C,neurospheres assessed as in B, with(þ) or without (�) anti-Met antibodies(DN30-Fab). x, 2-sided t test, P <0.05. D, representative Met-neg-NStransfected (þ) or not (�) with Metand assessed as in B. x, 2-sided ttest, P < 0.05. E, phosphorylation ofintracellular signal transduces inBT308 neurosphere cultured instandard medium with or withoutHGF for 24 hours. Statisticallysignificantly modulated proteinswere represented (2-sided t test,P < 0.05).
A B
Tota
l are
a o
f
E
0
10
20
30
40
50
60
70
80
90
100SM
SM+HGF
BT308
BT337
mig
rating c
ells
(x10 )
3
§
§
0
4
6
8
10
12
Pix
el density (
x10 )
5
2
Lyn
MEK 1
/2
JNK p
an
STAT3
STAT6
HSP27
p27
(T15
7)
Chk
-2
p53
(S39
2)
p53
(S46
)
p53
(S15
)Lc
kFyn Ye
sFgr
STAT2
RSK1/
2/3
SMSM+HGF
Met-neg
BT273
BT275
BT334
BT302
§
Met-pos
Tota
l are
a o
f
0
200
400
600
800
1,000
1,200
inva
din
g c
ells
(x10 )
3
BT308
BT337
Met-neg
BT273
BT275
BT334
BT302
Met-pos
BT168
BT299
§
§
§§
D
Tota
l are
a o
f
0
10
20
30
40
50
60
70
80SM
SM+HGF
BT273
inva
din
g c
ells
(x10 )
3
BT358
§
Met-neg
SM
SM+HGF
- - ++ Met- - ++
C
Tota
l are
a o
f
0
100
200
300
400
500
600
700
800 SM
SM+HGF
BT308
inva
din
g c
ells
(x10 )
3
§
§
BT314
BT302
§
Met-pos
- - ++- - ++ DN30-Fab- - ++
§
Met
Met Is a Functional Marker of Glioblastoma Stem Cells
www.aacrjournals.org Cancer Res; 72(17) September 1, 2012 4547
on February 15, 2019. © 2012 American Association for Cancer Research. cancerres.aacrjournals.org Downloaded from
Published OnlineFirst June 26, 2012; DOI: 10.1158/0008-5472.CAN-11-3490
phenotype of Met-pos-NS in vitro and suggest that thismechanism may promote aggressiveness of a subset ofglioblastomas.
DiscussionA unifying model of tumor onset and progression that
integrates the CSC model and the Darwinian model assumesthat CSCs accumulate the driving genetic lesions and transmitthem to the genetically and phenotypically heterogeneousprogeny forming the tumor bulk (38). The comparative analysisreported in this article showed that, as a rule, the samemutations of primary glioblastomas are found in theirmatchedneurospheres. This confirms that neurospheres are a faithfulin vitro model of the original tumor, useful to dissect therelationship between genetics and biology, and to predictthe therapeutical response.
Notably, neurospheres derived from EGFRamp/vIII tumorsdisplayed a decreased—or in a few cases an even normal—number of EGFR gene copies, consistent with previous andrecent data (17, 18). As EGFR amplification is usually detectedonly in a fraction of glioblastoma cells (data not shown andref. 39), these findings can be explained by in vitro negativeselection of clones harboring EGFR amplification and positiveselection of clones with a normal EGFR gene, coexisting in thesame tumor. Growth of clones with normal/low number ofEGFR gene copies might be favored by concentrations ofexogenous EGF (20 ng/mL), likely exceeding those in braintissues (18).
Gene expression profiling allowed to classify the neuro-spheres into classical, mesenchymal, and proneural subtypesaccording to the signatures identified in glioblastoma tissuesby Verhaak (6). Interestingly, the classical subgroup encom-passed the vast majority of neurospheres harboring EGFRamplification (7 of 10), confirming an association between theclassical expression profile andEGFR genetic alteration alreadyobserved in tumors (6).Vice versa, themesenchymal/proneuralsubgroup included neurospheres mostly harboring a wild-typeEGFR gene (7 of 8), together with deletion/mutation of PTENtumor suppressor gene (6 of 8). This association—to ourknowledge—was still unreported in tumors or neurospheres.
EGFR is renowned as a prominent player of glioma biology(40) and tumorigenic potential of glioblastoma stem cells (41).However, we found that EGFRwas highly expressed in classicalneurospheres, consistent with the presence of gene amplifi-cation, but barely detectable in most mesenchymal/proneuralneurospheres. In search for a functional marker for glioblas-toma stem cells lacking EGFR, we considered the MET onco-gene. Indeed, we noticed that MET was listed among genesupregulated in microarrays of glioblastoma tissues, in associ-ation with the mesenchymal subtype (6). Moreover, recently,Met was shown to support the stem-like phenotype of unclas-sified glioblastoma neurospheres (42). The data presented inthis article show, for the first time, that Met expression ispreferentially associated with the mesenchymal/proneuralsubtype of glioblastoma stem cells, and that expression ofEGFR and Met are mutually exclusive in neurospheres and,possibly, in original tumors. If further studies will confirm that
the cellular distribution of Met and EGFR in patients reflectsthat observed in neurospheres, there will be far-reachingimplications for the molecular diagnostics of glioblastoma.Flow cytometric or immunohistochemical analysis of theEGFR-Met pair could be proposed as a reliable test to dis-criminate between classical and mesenchymal/proneural glio-blastoma, possibly in addition to previous criteria, such asYKL-40 expression (5).
Interestingly, the neurosphere subgroup expressing Met(Met-pos-NS), irrespective of their mesenchymal or proneuralprofile, and the subgroup lacking Met (Met-neg-NS) displayedsignificant biologic differences. They had a different prolifer-ation rate, invariably higher in Met-pos-NS. In this respect, the2 subgroups were reminiscent of those previously described(12). Interestingly, Met-pos-NS mostly proliferated even with-out growth factors, and, as expected, were insensitive to EGF,whereas Met-neg-NS depended on exogenous growth factor,mostly EGF. Moreover, the 2 neurosphere subgroups showed adivergent differentiation pattern, either in vitro, or in tumorsformed by orthotopic transplantation: Met-pos-NS differenti-ated along the neuro-astroglial, whereas Met-neg-NS along theneuro-oligodendroglial pathway. These findings seem consis-tent with observations inmousemodel systems, in which brainprogenitors inheriting high levels of EGFR give rise to astro-cytes, whereas those inheriting low levels generate oligoden-drocytes (43).
Strikingly, theMet-pos andMet-neg neurosphere subgroupsnot only displayed distinct biologic features but were con-served according to 5 additional transcriptional classifiers,obtained in neurospheres or in original tumors (5, 26–29).When 2-cluster classifiers found in neurospheres by Guntherand colleagues (26) or Lottaz and colleagues (27) were applied,Met-neg-NS almost fully overlapped with Cluster I/Type I,whereas Met-pos-NS overlapped with Cluster II/Type II.
Taken together, biologic and gene expression features ofMet-pos and Met-neg neurospheres suggest that Met expres-sion could associate with tumors deriving from different cellsof origin. Met-neg-NS (and glioblastoma) could derive fromstem or transit amplifying cells of the brain subventricularzone, which depend on EGFR signaling (8, 44). Conversely,Met-pos-NS (and glioblastoma) could originate either from thesubventricular progenitors inheriting low levels of EGFR(43), or the diffuse astrocytes of the reactive glia. These cellsreactivate their proliferative and regenerative potential inresponse to injuries (45). The reactive astrocytes are anappealing candidate as a glioblastoma cell-of-origin, alsobecause they are intermingled within the blood–brain barrierand may be easily exposed to genotoxic agents.
Another novel finding presented in this study is that, in eachMet-pos-NS, Met marks and functionally supports a cell sub-population that retains long-term clonogenic and multipoten-tial ability in vitro and enhanced growth kinetics in vivo andthus may retain cancer stem cell properties. Conversely, inMet-pos-NS, loss of Met expression characterizes a cell sub-population that exhausts its clonogenic activity in vitro andin vivo. These data strongly suggest that Met is a glioblastomastem cell marker, which can be proposed for cell isolation as analternative to CD133.
De Bacco et al.
Cancer Res; 72(17) September 1, 2012 Cancer Research4548
on February 15, 2019. © 2012 American Association for Cancer Research. cancerres.aacrjournals.org Downloaded from
Published OnlineFirst June 26, 2012; DOI: 10.1158/0008-5472.CAN-11-3490
A further new finding presented in this study indicates thatMet supports not only the stem-like but also the invasivephenotype, at least in vitro. Indeed, invasiveness of Met-pos-NS was significantly enhanced by the Met ligand HGF, a keydriver of invasive growth (32), and counteracted by specificMetinhibitors. The Met ability to concomitantly support stemnessand invasiveness shows that the two phenotypes are function-ally associated and driven by the same signaling circuits andgenetic programs, consistent with previous observations (46).It has been noticed that "the existence ofmolecularly defined
subgroups of glioblastoma raises the question of whether thesecategories actually represent separate disease entities ratherthan the expression of minor variability in a single tumor class(15)." Our study suggests that primary glioblastomas containdistinct types of CSCs, each possibly arising from distinct cellsof origin, each endowed with specific molecular markers andsignaling circuits responsible for stem and tumorigenic prop-erties. These findings contribute to identify separate glioblas-
toma entities and to define criteria that might be exploited toguide therapeutic decision making.
Disclosure of Potential Conflicts of InterestNo potential conflicts of interest were disclosed.
AcknowledgmentsThe authors thank Andrea Bertotti, Livio Trusolino, and Claudio Isella for
critical discussion; Stefania Giove for histopathology; Daniela Gramaglia,Antonella Cignetto, and Michela Bruno for secretarial assistance.
Grant SupportThe study was supported by Italian Association for Cancer Research (Inves-
tigator Grants and "Special Program Molecular Clinical Oncology 5xMille, N.9970"), Regione Piemonte (PI-STEM), European Union Framework Programs 7(N. 201279 and 201640).
The costs of publication of this article were defrayed in part by the payment ofpage charges. This article must therefore be hereby marked advertisement inaccordance with 18 U.S.C. Section 1734 solely to indicate this fact.
Received October 20, 2011; revised June 6, 2012; accepted June 19, 2012;published OnlineFirst June 26, 2012.
References1. Wen PY, Kesari S. Malignant gliomas in adults. N Engl J Med 2008;
359:492–507.2. Comprehensive genomic characterization defines human glioblas-
toma genes and core pathways. Nature 2008;455:1061–8.3. Brennan C, Momota H, Hambardzumyan D, Ozawa T, Tandon A,
Pedraza A, et al. Glioblastoma subclasses can be defined by activityamong signal transduction pathways and associated genomic altera-tions. PLoS One 2009;4:e7752.
4. Parsons DW, Jones S, Zhang X, Lin JC, Leary RJ, Angenendt P, et al.An integrated genomic analysis of human glioblastoma multiforme.Science 2008;321:1807–12.
5. Phillips HS, Kharbanda S, Chen R, Forrest WF, Soriano RH, Wu TD,et al. Molecular subclasses of high-grade glioma predict prognosis,delineate a pattern of disease progression, and resemble stages inneurogenesis. Cancer Cell 2006;9:157–73.
6. VerhaakRG,HoadleyKA,PurdomE,WangV,QiY,WilkersonMD, et al.Integrated genomic analysis identifies clinically relevant subtypes ofglioblastoma characterized by abnormalities in PDGFRA, IDH1, EGFR,and NF1. Cancer Cell 2010;17:98–110.
7. Yan H, Parsons DW, Jin G, McLendon R, Rasheed BA, Yuan W, et al.IDH1 and IDH2 mutations in gliomas. N Engl J Med 2009;360:765–73.
8. Vescovi AL, Galli R, Reynolds BA. Brain tumour stem cells. Nat RevCancer 2006;6:425–36.
9. Dirks PB. Brain tumor stem cells: bringing order to the chaos of braincancer. J Clin Oncol 2008;26:2916–24.
10. BaoS,WuQ,McLendonRE,HaoY,ShiQ,HjelmelandAB, et al. Gliomastem cells promote radioresistance by preferential activation of theDNA damage response. Nature 2006;444:756–60.
11. Park CY, Tseng D, Weissman IL. Cancer stem cell-directed therapies:recent data from the laboratory and clinic. Mol Ther 2009;17:219–30.
12. Galli R, Binda E, Orfanelli U, Cipelletti B, Gritti A, De VS, et al. Isolationand characterization of tumorigenic, stem-like neural precursors fromhuman glioblastoma. Cancer Res 2004;64:7011–21.
13. Louis DN, Ohgaki H, Wiestler OD, Cavenee WK, Burger PC, Jouvet A,et al. The 2007 WHO classification of tumours of the central nervoussystem. Acta Neuropathol 2007;114:97–109.
14. De Bacco F, Luraghi P, Medico E, Reato G, Girolami F, Perera T, et al.Induction of MET by ionizing radiation and its role in radioresistanceand invasive growth of cancer. J Natl Cancer Inst 2011;103:645–61.
15. Huse JT, Holland EC. Targeting brain cancer: advances in the molec-ular pathology of malignant glioma and medulloblastoma. Nat RevCancer 2010;10:319–31.
16. Bredel M, Scholtens DM, Yadav AK, Alvarez AA, Renfrow JJ, ChandlerJP, et al. NFKBIA deletion in glioblastomas. N Engl J Med 2011;364:627–37.
17. Pandita A, Aldape KD, Zadeh G, Guha A, James CD. Contrastingin vivo and in vitro fates of glioblastoma cell subpopulationswith amplified EGFR. Genes Chromosomes Cancer 2004;39:29–36.
18. Schulte A, Gunther HS,Martens T, Zapf S, Riethdorf S,WulfingC, et al.Glioblastoma stem-like cell lines with either maintenance or loss ofhigh-level EGFR amplification, generated via modulation of ligandconcentration. Clin Cancer Res 2012;18:1901–13
19. Koochekpour S, Jeffers M, Rulong S, Taylor G, Klineberg E, HudsonEA, et al. Met and hepatocyte growth factor/scatter factor expressionin human gliomas. Cancer Res 1997;57:5391–8.
20. KongDS, SongSY, KimDH, Joo KM, Yoo JS, Koh JS, et al. Prognosticsignificance of c-Met expression in glioblastomas. Cancer 2009;115:140–8.
21. Singh SK, Hawkins C, Clarke ID, Squire JA, Bayani J, Hide T, et al.Identification of human brain tumour initiating cells. Nature 2004;432:396–401.
22. Beier D, Hau P, Proescholdt M, Lohmeier A, Wischhusen J, Oefner PJ,et al. CD133(þ) and CD133(�) glioblastoma-derived cancer stem cellsshowdifferential growth characteristics andmolecular profiles. CancerRes 2007;67:4010–5.
23. Chen R, Nishimura MC, Bumbaca SM, Kharbanda S, Forrest WF,Kasman IM, et al. A hierarchy of self-renewing tumor-initiating celltypes in glioblastoma. Cancer Cell 2010;17:362–75.
24. Doetsch F. The glial identity of neural stem cells. Nat Neurosci2003;6:1127–34.
25. Pruszak J, Ludwig W, Blak A, Alavian K, Isacson O. CD15, CD24, andCD29 define a surface biomarker code for neural lineage differentiationof stem cells. Stem Cells 2009;27:2928–40.
26. Gunther HS, Schmidt NO, Phillips HS, Kemming D, Kharbanda S,Soriano R, et al. Glioblastoma-derived stem cell-enriched culturesform distinct subgroups according to molecular and phenotypic cri-teria. Oncogene 2008;27:2897–909.
27. Lottaz C, Beier D, Meyer K, Kumar P, Hermann A, Schwarz J, et al.Transcriptional profiles of CD133þ and CD133- glioblastoma-derivedcancer stem cell lines suggest different cells of Origin. Cancer Res2010;70:2030–40.
28. Freije WA, Castro-Vargas FE, Fang Z, Horvath S, Cloughesy T, LiauLM, et al. Gene expression profiling of gliomas strongly predictssurvival. Cancer Res 2004;64:6503–10.
29. Schulte A, Gunther HS, Phillips HS, Kemming D, Martens T,Kharbanda S, et al. A distinct subset of glioma cell lines with stemcell-like properties reflects the transcriptional phenotype of glio-blastomas and overexpresses CXCR4 as therapeutic target. Glia2011;59:590–602.
Met Is a Functional Marker of Glioblastoma Stem Cells
www.aacrjournals.org Cancer Res; 72(17) September 1, 2012 4549
on February 15, 2019. © 2012 American Association for Cancer Research. cancerres.aacrjournals.org Downloaded from
Published OnlineFirst June 26, 2012; DOI: 10.1158/0008-5472.CAN-11-3490
30. Li Y, Guessous F, Zhang Y, Dipierro C, Kefas B, Johnson E, et al.MicroRNA-34a inhibits glioblastoma growth by targeting multipleoncogenes. Cancer Res 2009;69:7569–76.
31. Salvi A, Sabelli C, Moncini S, Venturin M, Arici B, Riva P, et al.MicroRNA-23b mediates urokinase and c-met downmodulation anda decreasedmigration of human hepatocellular carcinoma cells. FEBSJ 2009;276:2966–82.
32. Boccaccio C, Comoglio PM. Invasive growth: a MET-driven geneticprogramme for cancer and stem cells. Nat Rev Cancer 2006;6:637–45.
33. Thiery JP, Acloque H, Huang RY, Nieto MA. Epithelial-mesenchymaltransitions in development and disease. Cell 2009;139:871–90.
34. Trusolino L, Bertotti A, Comoglio PM. MET signalling: principles andfunctions in development, organ regeneration andcancer. NatRevMolCell Biol 2010;11:834–48.
35. Petrelli A, Circosta P,Granziero L,MazzoneM, PisacaneA, Fenoglio S,et al. Ab-induced ectodomain shedding mediates hepatocyte growthfactor receptor down-regulation and hampers biological activity. ProcNatl Acad Sci U S A 2006;103:5090–5.
36. Larrea MD, Wander SA, Slingerland JM. p27 as Jekyll and Hyde:regulation of cell cycle and cell motility. Cell Cycle 2009;8:3455–61.
37. Dai C, Gu W. p53 post-translational modification: deregulated intumorigenesis. Trends Mol Med 2010;16:528–36.
38. Dick JE. Stem cell concepts renew cancer research. Blood 2008;112:4793–807.
39. Strommer K, Hamou MF, Diggelmann H, de TN. Cellular and tumouralheterogeneity of EGFR gene amplification in human malignant glio-mas. Acta Neurochir (Wien) 1990;107:82–7.
40. Nicholas MK, Lukas RV, Jafri NF, Faoro L, Salgia R. Epidermal growthfactor receptor–mediated signal transduction in the development andtherapy of gliomas. Clin Cancer Res 2006;12:7261–70.
41. Mazzoleni S, Politi LS, Pala M, Cominelli M, Franzin A, Sergi SL, et al.Epidermal growth factor receptor expression identifies functionallyand molecularly distinct tumor-initiating cells in human glioblastomamultiforme and is required for gliomagenesis. Cancer Res 2010;70:7500–13.
42. Li Y, Li A, GlasM, Lal B, YingM,SangY, et al. c-Met signaling induces areprogramming network and supports the glioblastoma stem-likephenotype. Proc Natl Acad Sci U S A 2011;108:9951–6.
43. Sun Y, Goderie SK, Temple S. Asymmetric distribution of EGFRreceptor during mitosis generates diverse CNS progenitor cells. Neu-ron 2005;45:873–86.
44. Pastrana E, Cheng LC, Doetsch F. Simultaneous prospective purifi-cation of adult subventricular zone neural stem cells and their progeny.Proc Natl Acad Sci U S A 2009;106:6387–92.
45. Robel S, Berninger B, Gotz M. The stem cell potential of glia: lessonsfrom reactive gliosis. Nat Rev Neurosci 2011;12:88–104.
46. Mani SA, Guo W, Liao MJ, Eaton EN, Ayyanan A, Zhou AY, et al. Theepithelial-mesenchymal transition generates cells with properties ofstem cells. Cell 2008;133:704–15.
De Bacco et al.
Cancer Res; 72(17) September 1, 2012 Cancer Research4550
on February 15, 2019. © 2012 American Association for Cancer Research. cancerres.aacrjournals.org Downloaded from
Published OnlineFirst June 26, 2012; DOI: 10.1158/0008-5472.CAN-11-3490

2012;72:4537-4550. Published OnlineFirst June 26, 2012.Cancer Res Francesca De Bacco, Elena Casanova, Enzo Medico, et al. Cell Subtype
Oncogene Is a Functional Marker of a Glioblastoma StemMETThe
Updated version
10.1158/0008-5472.CAN-11-3490doi:
Access the most recent version of this article at:
Material
Supplementary
http://cancerres.aacrjournals.org/content/suppl/2012/06/26/0008-5472.CAN-11-3490.DC1
Access the most recent supplemental material at:
Cited articles
http://cancerres.aacrjournals.org/content/72/17/4537.full#ref-list-1
This article cites 46 articles, 15 of which you can access for free at:
Citing articles
http://cancerres.aacrjournals.org/content/72/17/4537.full#related-urls
This article has been cited by 10 HighWire-hosted articles. Access the articles at:
E-mail alerts related to this article or journal.Sign up to receive free email-alerts
Subscriptions
Reprints and
To order reprints of this article or to subscribe to the journal, contact the AACR Publications Department at
Permissions
Rightslink site. Click on "Request Permissions" which will take you to the Copyright Clearance Center's (CCC)
.http://cancerres.aacrjournals.org/content/72/17/4537To request permission to re-use all or part of this article, use this link
on February 15, 2019. © 2012 American Association for Cancer Research. cancerres.aacrjournals.org Downloaded from
Published OnlineFirst June 26, 2012; DOI: 10.1158/0008-5472.CAN-11-3490