one-dimensional modelling of pulse separation … · technology is one of the enabling...
TRANSCRIPT
1
One-Dimensional Modelling of Pulse Separation Strategy,
Waste-gated Turbines and Electric Turbocharger Systems
for Downsized Turbocharged Gasoline Engines
MUHAMMAD IZZAL ISMAIL
Department of Mechanical Engineering
Imperial College London
A thesis submitted for the degree of
Doctor of Philosophy of the Imperial College London
November 2017
2
Abstract
The demand for CO2 emission reduction for modern road vehicles has seen engine
downsizing become a key trend in internal combustion engine design: a smaller engine has
reduced pumping, frictional and heat losses, and therefore better fuel economy. Turbocharger
technology is one of the enabling technologies, offering lower specific fuel consumption and
producing more power for a given engine capacity. The turbocharger matching process,
which specifies an appropriate turbocharger design for a particular engine, is crucial in
obtaining optimum engine performance. In order to achieve a high level of accuracy in the
system-level prediction, high fidelity turbocharger models are required; but such models have
not yet reached fruition.
The present study has assessed the effect of preserving the exhaust pulse energy from an
engine right through to the turbine on the steady and transient engine performance. A
combination of appropriate turbine sizing and pulse-divided exhaust manifold was applied,
and as a consequence, lower back pressure and improved engine scavenging reduced residual
content by 28%, while the brake specific fuel consumption (BSFC) improves by approx.
1.2% on average over speed range. Furthermore, the implementation of electric turbo assist
(ETA) system on the engine results in better fuel economy by 2.4%. The present work has
also assessed the overall engine performance using a commercial 1-D gas dynamics
simulation tool by modelling the waste-gated turbines in a novel manner. This approach has
been validated experimentally.
The study also examined the benefits of electric turbocharger systems for a highly-downsized
engine, a modified version of the baseline engine. Some potential multi-boosting systems
were applied, and the overall benefits in terms of engine performance were assessed. An
integration of an electric turbocharger and a low-pressure turbine with electric turbo
compounding gives the best advantages particularly in pumping loss, residual and transient
performance while improving fuel economy in comparison with other systems.

3
Buat Nenek, Mak, Ayah, Isteri dan anak-anakku…

4
Declaration
This thesis represents my work that I have undertaken over the course of the registration
period for this degree. I declare this thesis to be my own work and the appropriate citations
are included to acknowledge the work of others.
__________________________________
Muhammad Izzal Ismail
5
Copyright Declaration
The copyright of this thesis rests with the author and is made available under a Creative
Commons Attribution Non-Commercial No Derivatives licence. Researchers are free to
copy, distribute or transmit the thesis on the condition that they attribute it, that they
do not use it for commercial purposes and that they do not alter, transform or build
upon it. For any reuse or redistribution, researchers must make clear to others the
licence terms of this work.

6
Acknowledgements
First, I must thank my supervisor, Professor Ricardo Martinez-Botas for his tremendous
support and guidance throughout my PhD journey. Knowing my capability, he is the one that
has given the opportunity for me to further explore the automotive industry, particularly in
the area of turbomachinery. I thank him for his motivation and guidance during my study and
for allowing me to implement all my industrial experience by involving me in many
collaboration projects (especially with Mitsubishi Heavy Industries). I would also like to
thank my co-supervisor, Dr Aaron Costall, for giving me a chance to carry out a collaboration
project with Mitsubishi Turbocharger Engine Europe. With the full support of both
supervisors, I have become a committed and passionate person in executing every detail of
my work.
I would also like to express my gratitude to the past and current members of the Turbocharger
Group at Imperial College London for their valuable idea and critical comments. I thank my
best friend and mentor, Dr Wan Saiful-Islam Wan Salim, for helpful discussions and his
generous companionship during my study.
I wish to extend my thanks to my beloved wife, Siti Nur Aishah, for her endless support
throughout the period of my PhD journey. She was always there by my side, ever-willing to
face hardships and challenges together, over the years. My brave son Irfan and sweet little
daughter Izyan were also there to give me joy making the moments of my life in London so
much more memorable. I love you with all my heart.
I must thank my grandma, Hajjah Kamsiah Mat Piah, Mum and Dad, Hajjah Norfauziah
Jamaludin and Haji Ismail Endot, brothers Muhammad Izam and Muhammad Izwan, and my
one and only sister Nur Izzati Aina for their continuous support and constant prayers, which
gave me strength to complete this study.
Finally, I would like to thank the Malaysian Government and sponsorship agency, MARA for
giving me the opportunity to fulfil my dream of pursuing my PhD at Imperial College
London. To those who I failed to mention but have contributed to my research directly, or
indirectly, thank you very much. This journey would have been more difficult without
continuous support from all of you.
Muhammad Izzal Ismail, Imperial College London, 2017

7
Contents
Abstract ...................................................................................................................................... 2
Declaration ................................................................................................................................. 4
Copyright Declaration ................................................................................................................ 5
Acknowledgements .................................................................................................................... 6
Contents ..................................................................................................................................... 7
List of Figures .......................................................................................................................... 10
List of Tables ........................................................................................................................... 17
Nomenclature ........................................................................................................................... 18
Chapter 1: Introduction ............................................................................................................ 22
1.1 Overview ........................................................................................................................ 22
1.2 Turbocharging the Internal Combustion Engine ............................................................ 24
1.3 Research Motivation ...................................................................................................... 27
1.3.1 Pulse Separation ...................................................................................................... 27
1.3.2 Waste-gate System and Boost Control .................................................................... 28
1.3.3 Electrified Turbocharger System ............................................................................. 28
1.4 Research Aims................................................................................................................ 29
1.5 Thesis Objectives ........................................................................................................... 29
1.6 Thesis Outline ................................................................................................................ 30
Chapter 2: Literature Review ................................................................................................... 32
2.1 Turbocharged Engines Modelling .................................................................................. 32
2.2 Turbocharger and Engine Matching ............................................................................... 33
2.3 The Effect of Residual Gas on Knock ............................................................................ 34
2.4 Electrified Turbocharger Systems .................................................................................. 35
2.5 Summary ........................................................................................................................ 36
8
Chapter 3: Baseline Engine Modelling .................................................................................... 38
3.1 GT-Power Engine Simulation Tool................................................................................ 38
3.2 Engine Specifications ..................................................................................................... 39
3.3 Engine Modelling ........................................................................................................... 41
3.3.1 Experimental Setup.................................................................................................. 41
3.3.2 Full-load Simulation and Validation ....................................................................... 42
3.3.3 Transient Simulation and Validation ....................................................................... 48
3.4 Summary ........................................................................................................................ 50
Chapter 4: Pulse Separation Strategy ....................................................................................... 52
4.1 Introduction .................................................................................................................... 52
4.1 Turbine Sizing ................................................................................................................ 52
4.2 Pulse Divided Exhaust Manifold.................................................................................... 60
4.3 Turbine Sizing with Pulse Divided Exhaust Manifold................................................... 61
4.4 The Effect of Increasing Compression Ratio on BSFC ................................................. 64
4.5 Effect of Turbine Size on Inertia .................................................................................... 66
4.6 Transient Performance ................................................................................................... 69
4.7 Summary ........................................................................................................................ 75
Chapter 5: Waste-gate Modelling ............................................................................................ 77
5.1 Introduction .................................................................................................................... 77
5.2 Waste-gate experimental work ....................................................................................... 77
5.2.1 Baseline hot testing (waste-gate closed) .................................................................. 78
5.2.2 Hot testing (waste-gate open) .................................................................................. 82
5.2.3 Cold testing (turbine bypassed) ............................................................................... 86
5.3 Waste-gate modelling and validation ............................................................................. 89
5.4 Waste-gate model impact on engine performance ......................................................... 94
5.5 Summary ...................................................................................................................... 100
Chapter 6: Electrified Turbocharger System ......................................................................... 102
9
6.1 Electric Turbo Assist (ETA) System ............................................................................ 102
6.2 Engine Downsizing Strategy ........................................................................................ 106
6.3 Multi-Stage Systems .................................................................................................... 110
6.4 Boosting Assessment Criteria ...................................................................................... 113
6.5 Results .......................................................................................................................... 114
6.5.1 BMEP/Torque Target and Low-End Torque ......................................................... 114
6.5.2 Pumping Loss ........................................................................................................ 115
6.5.3 Residuals ................................................................................................................ 115
6.5.4 BSFC Full-load ...................................................................................................... 116
6.5.5 BSFC Part Load ..................................................................................................... 117
6.5.6 Transient Response ................................................................................................ 119
6.5.6 Overall Results ...................................................................................................... 119
6.6 Summary ...................................................................................................................... 121
Chapter 7: Conclusions .......................................................................................................... 122
7.1 Objective 1 ................................................................................................................... 122
7.2 Objective 2 ................................................................................................................... 123
7.3 Objective 3 ................................................................................................................... 124
7.4 Objective 4 ................................................................................................................... 126
7.5 Recommendations for Future Work ............................................................................. 127
7.5.1 Experimental work to see pulsating flow effect on the waste-gate ....................... 127
7.5.2 Downsized engine optimisation............................................................................. 127
References .............................................................................................................................. 128
Appendices ............................................................................................................................. 133
Appendix A (Proton 1.6L CFE engine full-load validation) .............................................. 133
Appendix B (Renault 1.2L H5Ft engine full-load prediction in turbine resizing strategy)147
Appendix C (Waste-gate Experimental Setup) .................................................................. 150
Appendix D (Low-Pressure Turbine Map) ........................................................................ 151
10
List of Figures
Figure 1.1: Historical fleet CO2 emissions performance and current or proposed passenger
vehicle standards [2]. ............................................................................................................... 22
Figure 1.2: Typical energy flow in gasoline engines [3]. ....................................................... 23
Figure 1.3: PV diagram for an ideal NA ICE engine [4]. ....................................................... 24
Figure 1.4: Hatch area represents the maximum turbine energy available in a turbocharged
engine [4]. ................................................................................................................................ 25
Figure 1.5: The component of a turbocharger. ....................................................................... 26
Figure 1.6: A single-stage turbocharged engine schematic diagram [5]. ............................... 27
Figure 3.1: The Proton 1.6L Campro Turbo engine (CFE). .................................................... 39
Figure 3.2: The Renault 1.2L Turbo engine (H5Ft). ................................................................ 40
Figure 3.3: Proton 1.6L CFE engine on the test bench at the Proton dynamometer laboratory.
.................................................................................................................................................. 41
Figure 3.4: Configuration of a waste-gate for controlling boost [42]. ..................................... 43
Figure 3.5: GT-Power project map for Proton 1.6L Campro Turbo engine. ........................... 44
Figure 3.6: Proton 1.6L Campro Turbo engine layout............................................................. 44
Figure 3.7: (a) the intake manifold in 3D format, (b) discretisation step in GEM3D, and (c)
completed intake manifold geometry in GT-Power................................................................. 45
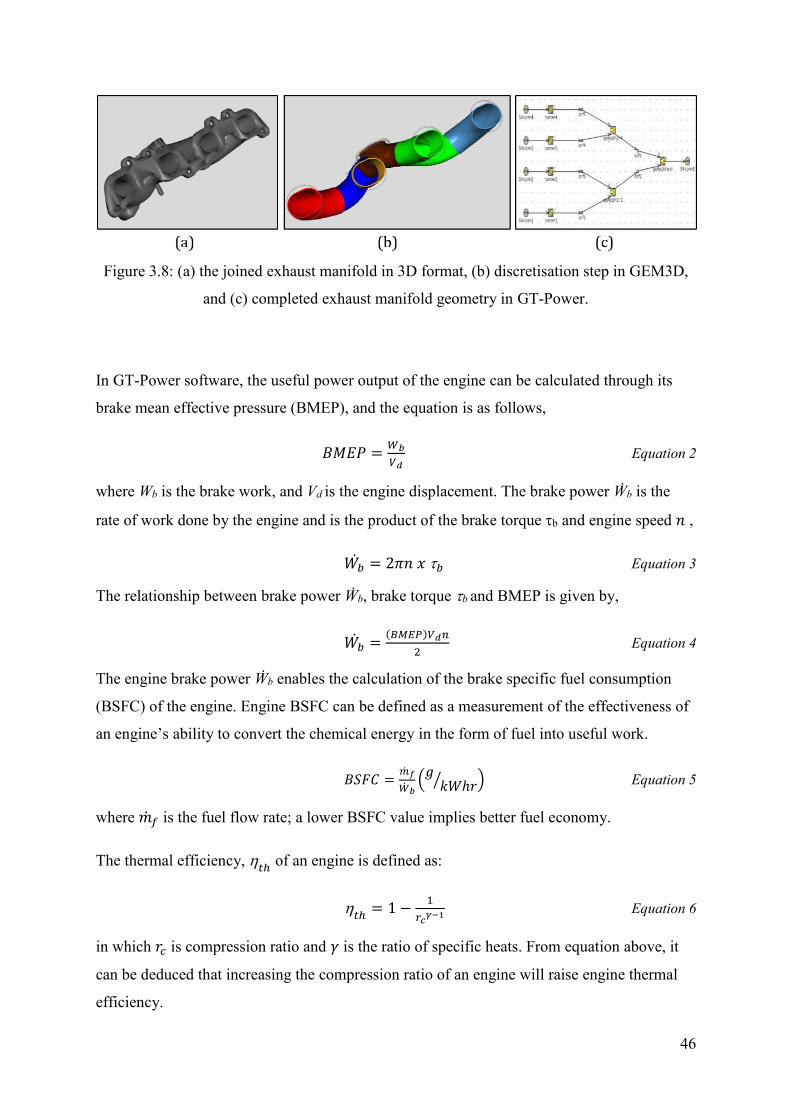
Figure 3.8: (a) the joined exhaust manifold in 3D format, (b) discretisation step in GEM3D,
and (c) completed exhaust manifold geometry in GT-Power. ................................................. 46
Figure 3.9: Time-to-torque definition at constant engine speed [8]. ....................................... 48
Figure 3.10: Time-to-90% torque comparison between simulation and test at 1000 rpm. ...... 50
11
Figure 4.1: Turbine resizing strategy. ...................................................................................... 53
Figure 4.2: The effect of increasing turbine area [4]. .............................................................. 53
Figure 4.3: Engine operation plotted on the baseline turbine map (black squares) for 1.0 (red
circles) and 1.5 (green triangles) turbine mass multipliers, showing that once the baseline
choking level is exceeded, a larger turbine wheel will be required. ........................................ 55
Figure 4.4: The effect of progressively increasing turbine mass multiplier until there is zero
waste-gate authority at 2000 rpm (the peak torque speed). ..................................................... 56
Figure 4.5: The effect of turbine mass multiplier on the engine speed at which zero waste-
gate authority is reached: shows how waste-gate diameter falls in discontinuous steps as
engine speed reduces (or as mass multiplier increases). .......................................................... 57
Figure 4.6: The effect of turbine mass multiplier on the engine speed at which zero waste-
gate authority is reached: shows how continuous variation of engine speed will identify the
zero waste-gate authority speed precisely................................................................................ 57
Figure 4.7: Effect of turbine size on in-cylinder residuals....................................................... 58
Figure 4.8: Effect of turbine size on exhaust pressure. ............................................................ 58
Figure 4.9: Brake torque versus engine speed for different mass multipliers. ........................ 59
Figure 4.10: Torque deficit at 1500 rpm for different mass multipliers. ................................. 59
Figure 4.11: Pulse divided exhaust manifold - 3D CAD model. ............................................. 60
Figure 4.12: Turbocharger matching by integrating pulse divided exhaust manifold and
turbine re-sizing: Brake Torque ............................................................................................... 62
Figure 4.13: Turbocharger matching by integrating pulse divided exhaust manifold and
turbine re-sizing: BSFC ........................................................................................................... 62
Figure 4.14: Turbocharger matching by integrating pulse divided exhaust manifold and
turbine re-sizing: Residuals...................................................................................................... 63
12
Figure 4.15: Turbocharger matching by integrating pulse divided exhaust manifold and
turbine re-sizing: Turbine Inlet Pressure.................................................................................. 63
Figure 4.16: Turbocharger matching by integrating pulse divided exhaust manifold and
turbine re-sizing: Scavenging (ratio of intake pressure/exhaust pressure) .............................. 64
Figure 4.17: Maximum cylinder pressure. The compression ratio of PD2.5 was increased,
namely PD2.5_CR adj, to have an equivalent limit of baseline engine of 80bar. ................... 65
Figure 4.18: Further BSFC after increasing engine compression ratio of PD2.5. ................... 65
Figure 4.19: Relationship between turbine mass flow parameter and turbine efficiency due to
scaling. ..................................................................................................................................... 67
Figure 4.20: Relationship between turbine mass multiplier and turbine wheel diameter. ....... 68
Figure 4.21: Relationship between turbine wheel diameter and turbine inertia from real
turbocharger supplier data (blue circles). ................................................................................. 69
Figure 4.22: Normalised time-to-torque at 1250 rpm for different mass multipliers, and using
baseline (“Base”) and revised (“Calc”) inertias. (Renault H5Ft engine) ................................. 70
Figure 4.23: Time-to-torque versus engine speed for different mass multipliers, and using
baseline (“Base”) and revised (“Calc”) inertias. (Renault H5Ft engine) ................................. 71
Figure 4.24: Difference in time-to-torque between cases using the base and revised inertias,
for different turbine mass multipliers. ..................................................................................... 71
Figure 4.25: Normalised time-to-torque versus engine speed for different mass multipliers,
and using baseline (“Base”) and revised (“Calc”) inertias. ..................................................... 72
Figure 4.26: Difference in normalised time-to-torque between cases using the base and
revised inertias, for different turbine mass multipliers. ........................................................... 72
Figure 4.27: Transient response comparison with turbine sizing (TMM), from 1250 rpm to
2000 rpm (low engine speed). .................................................................................................. 73
13
Figure 4.28: Effect of turbine mass multiplier on BSFC and time-to-torque for different
engine speeds. (S: Small turbine, L: Large turbine) ................................................................ 74
Figure 5.1: An installation of a waste-gated turbine on a hot gas stand test bench at
Mitsubishi Turbocharger and Engine Europe (M.T.E.E.). ...................................................... 78
Figure 5.2: The baseline hot testing for standard turbine map configuration. In this test, the
waste-gate is fully shut............................................................................................................. 79
Figure 5.3: Baseline hot testing (Mass Flow Parameter vs Pressure Ratio). ........................... 79
Figure 5.4: Baseline hot testing (Efficiency vs Pressure Ratio). ............................................. 80
Figure 5.5: Baseline hot testing (Pressure Ratio vs Volume Flow). ........................................ 81
Figure 5.6: Waste-gate opening angle. .................................................................................... 83
Figure 5.7: Hot testing with variable waste-gate opening angle (Mass Flow Parameter vs
Pressure Ratio). ........................................................................................................................ 83
Figure 5.8: Effect of increasing waste-gate opening angle on baseline turbine performance
map (Mass Flow Parameter vs Pressure Ratio). ...................................................................... 84
Figure 5.9: Hot testing with variable waste-gate opening angle (Efficiency vs Pressure Ratio).
.................................................................................................................................................. 85
Figure 5.10: Effect of increasing waste-gate opening angle on baseline turbine performance
map (Efficiency vs Pressure Ratio).......................................................................................... 85
Figure 5.11: Cold testing configuration. .................................................................................. 87
Figure 5.12: Waste-gate flow characteristic (CD vs PR) .......................................................... 89
Figure 5.13: Waste-gate flow characteristic (𝐶𝐷 vs L/DWG) ................................................... 91
Figure 5.14: Cold testing validation (Mass Flow Rate vs Pressure Ratio) .............................. 92
Figure 5.15: Cold testing validation (percentage difference) .................................................. 92
Figure 5.16: Waste-gate model (dashed blue line) on the hot test bench layout GT-Power
model........................................................................................................................................ 93

14
Figure 5.17: Hot testing validation (Mass Flow Parameter vs Pressure Ratio) ....................... 94
Figure 5.18: Comparison between predicted turbine speed for standard waste-gate in GT-
Power (STD WG) and the modelled waste-gate (OWN WG). ................................................ 95
Figure 5.19: Comparison between predicted turbine inlet pressure for standard waste-gate in
GT-Power (STD WG) and the modelled waste-gate (OWN WG). ......................................... 96
Figure 5.20: Comparison between predicted turbine outlet pressure for standard waste-gate in
GT-Power (STD WG) and the modelled waste-gate (OWN WG). ......................................... 96
Figure 5.21: Comparison between predicted mass flow parameter for standard waste-gate in
GT-Power (STD WG) and the modelled waste-gate (OWN WG). ......................................... 97
Figure 5.22: Comparison between predicted turbine mass flow rate for standard waste-gate in
GT-Power (STD WG) and the modelled waste-gate (OWN WG). ......................................... 97
Figure 5.23: Comparison between predicted turbine efficiency for standard waste-gate in GT-
Power (STD WG) and the modelled waste-gate (OWN WG). ................................................ 98
Figure 5.24: Sensitivity study of different flow characteristic of waste-gate valve (𝐶𝐷 vs
LiftDiameter) ........................................................................................................................... 99
Figure 5.25: Pulsating flow entering the waste-gate channel. Effect of changing discharge
coefficient at 3000rpm. ............................................................................................................ 99
Figure 6.1: Schematic of Electric Turbo Assist (ETA) system [49]. ..................................... 103
Figure 6.2: Left: Eliminate the role of waste-gate by applying the ETA system. Right: The
amount of stored energy in ETA system................................................................................ 103
Figure 6.3: Benefit of applying ETA system on BSFC ......................................................... 105
Figure 6.4: Transient benefit by using ETA system .............................................................. 105
Figure 6.5: Downsized H5Ft engine cannot meet BMEP target with a single-stage turbo ... 109
Figure 6.6: A single stage turbocharger unable to meet BMEP peak torque and rated power
for the downsized H5Ft engine. ............................................................................................. 109
15
Figure 6.7: Series Turbo configuration. ................................................................................. 110
Figure 6.8: TurboSuper configuration. .................................................................................. 111
Figure 6.9: TurboElecTurbo configuration. ........................................................................... 112
Figure 6.10: TurboElecTurboETC configuration. ................................................................. 113
Figure 6.11: BMEP results show all multi-stage boosting system achieve BMEP requirement.
................................................................................................................................................ 114
Figure 6.12: PMEP comparison ............................................................................................. 115
Figure 6.13: Residuals Comparison ....................................................................................... 116
Figure 6.14: BSFC Full-load Comparison ............................................................................. 117
Figure 6.15: BSFC Part Load Comparison ............................................................................ 118
Figure 6.16: Transient performance comparison at 1500rpm for all multi-stage boosting
systems. .................................................................................................................................. 119
Figure 6.17: Multi-stage systems overall result. .................................................................... 120
Figure A.1: Air mass flow 1.6L CFE engine full-load. ......................................................... 133
Figure A.2: Fuel Mass Flow 1.6L CFE engine full-load. ...................................................... 134
Figure A.3: Intake Manifold Pressure 1.6L CFE engine full-load. ....................................... 135
Figure A.4: Volumetric Efficiency 1.6L CFE full-load. ........................................................ 136
Figure A.5: Brake Mean Effective Pressure (BMEP) 1.6L CFE engine full-load. ............... 137
Figure A.6: Brake Specific Fuel Consumption (BSFC) 1.6L CFE engine full-load. ............ 138
Figure A.7: Brake Torque 1.6L CFE engine full-load. .......................................................... 139
Figure A.8: Brake Power 1.6L CFE engine full-load. ........................................................... 140
Figure A.9: Average Pressure Pre-catalyst 1.6L CFE engine full-load. ................................ 141
Figure A.10: Average Pressure Post-catalyst 1.6L CFE engine full-load. ............................ 142
Figure A.11: Intake Temperature 1.6L CFE engine full-load. .............................................. 143
Figure A.12: Intake Temperature before air filter 1.6L CFE engine full-load. ..................... 144
16
Figure A. 13: Intake Manifold Temperature 1.6L CFE engine full-load ............................... 145
Figure A.14: Pre-catalyst Temperature 1.6L CFE engine full-load. ...................................... 146
Figure B.1: Effect of increasing turbine mass multiplier until zero waste-gate authority at
1500rpm (peak torque speed)................................................................................................. 147
Figure B.2: Effect of turbine mass multiplier on turbine inlet pressure. ............................... 147
Figure B.3: Effect of turbine mass multiplier on scavenging pressure ratio P2/P3 (higher
intake to exhaust pressure ratio promotes better scavenging) ............................................... 148
Figure B.4: Effect of turbine mass multiplier on residual gas ............................................... 148
Figure B.5: Effect of turbine mass multiplier on BSFC. ....................................................... 149
Figure C.1: Hot gas stand test bench setup for a waste-gated turbocharger testing. ............. 150
Figure C.2: A waste-gated turbine with integrated exhaust manifold (IEM) was installed on
the test bench.......................................................................................................................... 150
Figure D.1: LPT map (Mass Flow Parameter vs Pressure Ratio)[55]. .................................. 151
Figure D.2: LPT map (Efficiency vs Pressure Ratio)[55]. .................................................... 151
Figure D.3: LPT map compared to the conventional turbine [55]. ........................................ 152
17
List of Tables
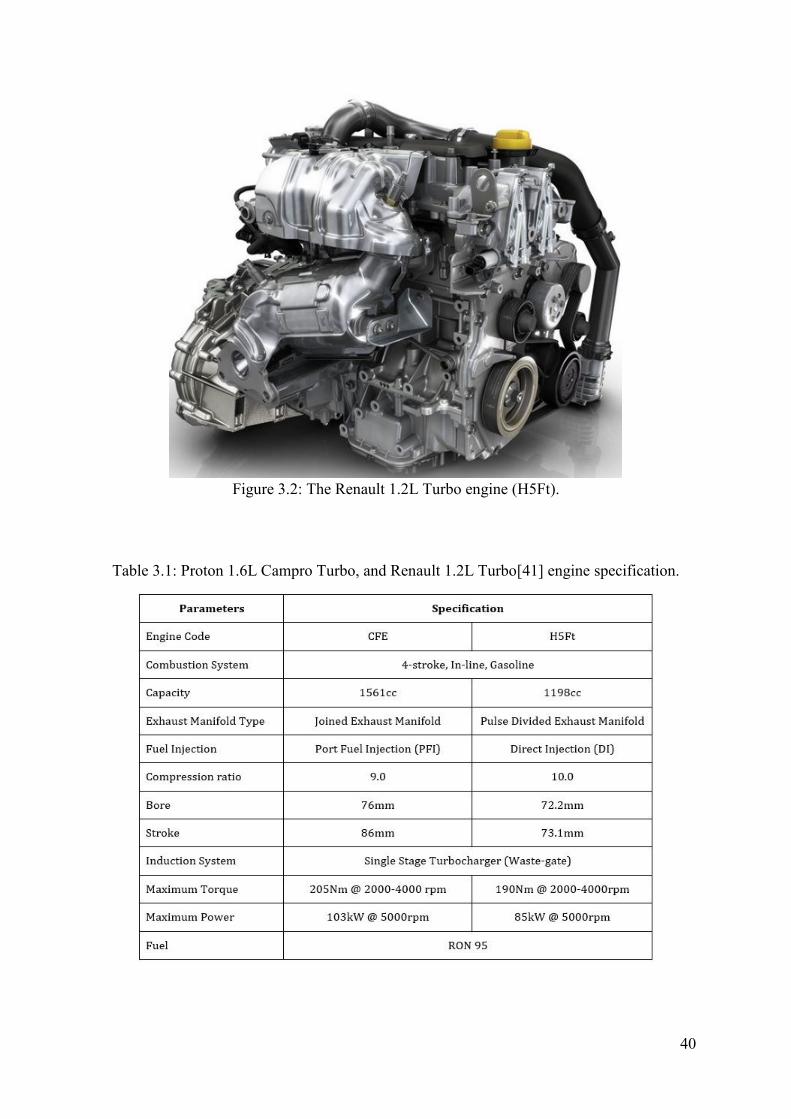
Table 3.1: Proton 1.6L Campro Turbo, and Renault 1.2L Turbo[41] engine specification. ... 40
Table 3.2: Engine parameter calculation in dynamometer software........................................ 42
Table 3.3: Percentage error between predicted and measured engine test data. ...................... 47
Table 3.4: Percentage error between predicted and measured engine test data (cont.). .......... 47
Table 3.5: Transient test set up for H5Ft engine. ..................................................................... 49
Table 4.1: Label description for figures below. ....................................................................... 61
Table 4.2: Selected turbine mass multiplier values and the corresponding normalised turbine
wheel diameters and inertias .................................................................................................... 68
Table 5.1: Hot gas stand specifications.................................................................................... 77
Table 5.2: Hot testing experimental setup ............................................................................... 82
Table 5.3: Cold testing experimental setup.............................................................................. 86
Table 5.4: Description of variables in Equation 11-16 ............................................................ 88
Table 5.5: Cold testing input and output in the 1D simulation ................................................ 91
Table 6.1: The importance of vehicle requirements value that has been chosen in this study
................................................................................................................................................ 114
Table 6.2: Downsized H5Ft selected part load points ........................................................... 118
Table 6.3: Multi-stage systems sorted by ranking. ................................................................ 120
18
Nomenclature
Definitions/Abbreviations
AFR Air fuel ratio
BDC Bottom dead centre
BMEP Brake mean effective pressure
BSFC Brake specific fuel consumption
BTDC Before top dead centre
CAD Crank angle degrees, computer-aided design
CD Discharge coefficient
CDIAC Carbon dioxide information analysis centre
ETA Electric turbo assist
ETC Electric turbocompounding
FA Full admission
FMEP Friction mean effective pressure
GDI Gasoline Direct Injection
HP High pressure
ICE Internal combustion engine
IEM Integrated exhaust manifold
IMEP Indicated mean effective pressure
IVO Intake valve open
LP Low pressure
LPT Low-pressure turbine
19
MFP Mass flow parameter
MGU Motor generator unit
MTEE Mitsubishi Turbocharger and Engine Europe
NA Naturally aspirated
NEDC New European Driving Cycle
OEM Original equipment manufacturers
PA Partial admission
PD Pulse divided
PFI Port fuel injection
PMEP Pumping mean effective pressure
PR Pressure ratio
RGF Residual gas fraction
SAE Society of Automotive Engineers
SI Spark ignition
TMM Turbine mass multiplier
TOD Turbine outlet diameter
TVD Total variation diminishing
TDC Top dead centre
VGT Variable geometry turbocharger
WG Waste-gate
WLTP Worldwide harmonised light vehicles test procedure
WOT Wide open throttle
20
Notations
𝑚𝑟 = Residual mass flow rate
𝑚𝑒 = Exhaust mass flow rate
𝑚𝐼𝑉𝑂 = Mass trapped in the cylinder at intake valve opening
𝐸𝑉𝐶 = Crank angle at exhaust valve closing
𝐼𝑉𝑂 = Crank angle at intake valve opening
= Lambda (AFR / 14.7)
𝑊𝑏= Brake work
𝑉𝑑 = Displacement volume
𝜏𝑏 = Brake torque
�̇�𝑓 = Fuel mass flow rate
�̇�𝑎 = Air mass flow rate
𝑡ℎ
= Thermal efficiency
𝑟𝑐 = Compression ratio
𝐷𝑊𝐺 = Waste-gate diameter
rpm = Revolution per minute
�̇�𝑏 = Engine brake power
�̇�𝑒𝑙𝑒𝑐 = Electric power
𝑒𝑙𝑒𝑐
= Electric conversion efficiency
𝜏𝑓 = Friction torque
𝑃𝑓 = Friction power
N = Engine speed

21
𝐶𝑝 = Heat capacity
𝑇
= Turbine efficiency
𝐶𝐷 = discharge coefficient
�̇� = mass flow rate
𝐴𝑒𝑓𝑓 = effective flow area
𝜌𝑖𝑠 = density at the throat
𝜌0 = upstream stagnation density
𝑈𝑖𝑠 = isentropic velocity at the throat
𝐴𝑅 = reference flow area
𝑃𝑟 = absolute pressure ratio
𝑃𝑒𝑥 = static exit pressure
𝑃0,𝑖𝑛 = total inlet pressure
R = gas constant
𝑇0,𝑖𝑛 = upstream stagnation temperature
𝛾 = specific heat ratio (1.4 for air at 300K)
22
Chapter 1: Introduction
1.1 Overview
Concerns over air quality and the effort of reducing carbon dioxide (CO2) emissions has been
the main driver in passenger-vehicle powertrain technology and engine designs over the
years. The study on global atmospheric trace gases by the Carbon Dioxide Information
Analysis Center (CDIAC) reports that CO2 emissions increased from 280ppm pre-1750 to
386ppm in 2009, increasing by 106ppm. Several greenhouse gas emission standards for
passenger cars have already been established to tackle climate change, and some are in the
process of revision. For instance, the European Commission set a mandatory target for new
passenger vehicles to meet a fleet CO2 emissions limit of 130g/km by 2015, reducing to
95g/km in 2021. The manufacturers who fail to meet the limit must pay an excess emissions
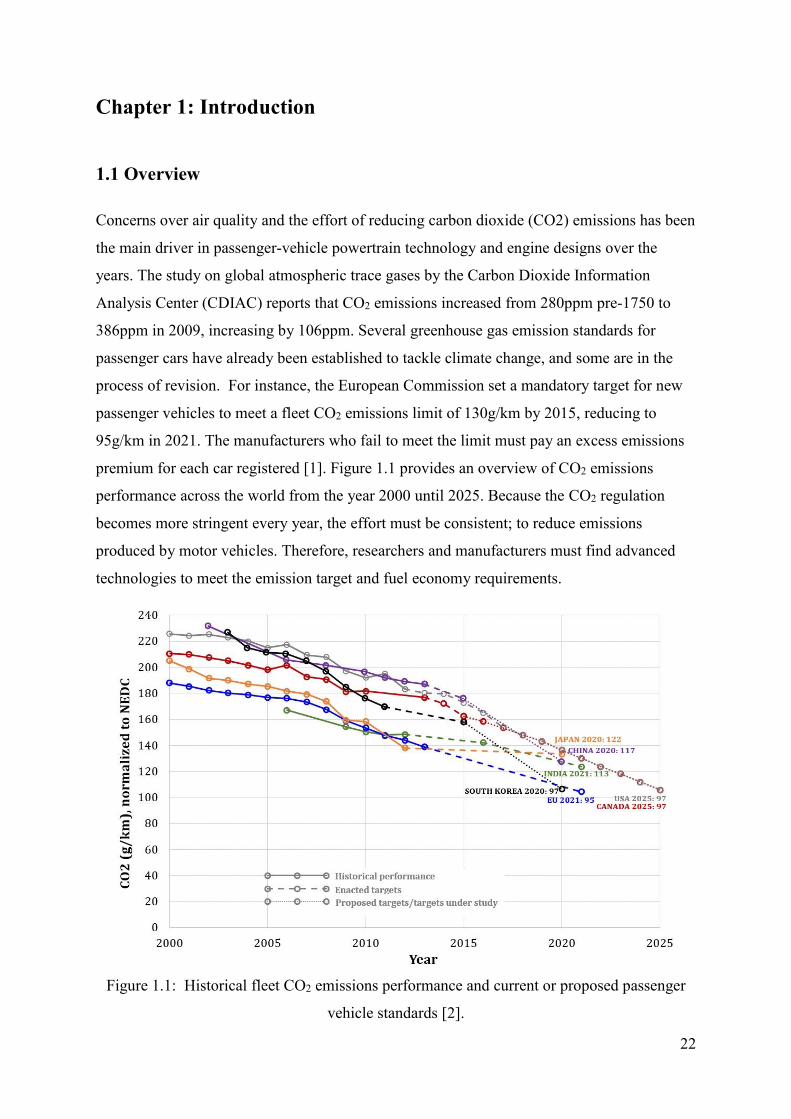
premium for each car registered [1]. Figure 1.1 provides an overview of CO2 emissions
performance across the world from the year 2000 until 2025. Because the CO2 regulation
becomes more stringent every year, the effort must be consistent; to reduce emissions
produced by motor vehicles. Therefore, researchers and manufacturers must find advanced
technologies to meet the emission target and fuel economy requirements.
Figure 1.1: Historical fleet CO2 emissions performance and current or proposed passenger
vehicle standards [2].
23
To date, although the development of alternative low-carbon transport has seen growth, such
as in electric vehicles, hybrid vehicles and fuel cells, the conventional internal combustion
engine (ICE) remains the mainstay of vehicle propulsion systems on the road. In an internal
combustion engine, the ignition and the combustion of the fuel occur to power the vehicle.
Engines convert chemical energy in the fuel into mechanical energy, commonly in the form
of a rotating crankshaft, which is the output of the engine. From the total heat of the
combustion, only around 30% is converted to useful work applied to moving the vehicle and
running the accessories, while the remaining 70% of the energy goes into the coolant and also
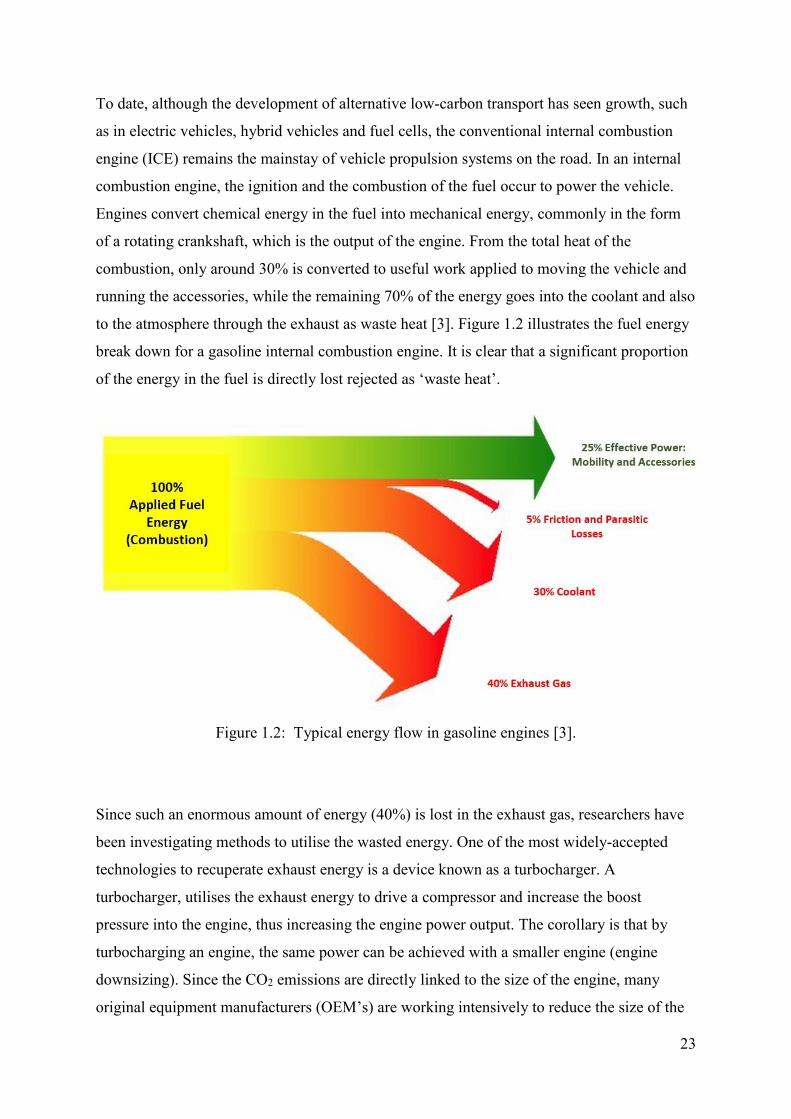
to the atmosphere through the exhaust as waste heat [3]. Figure 1.2 illustrates the fuel energy
break down for a gasoline internal combustion engine. It is clear that a significant proportion
of the energy in the fuel is directly lost rejected as ‘waste heat’.
Figure 1.2: Typical energy flow in gasoline engines [3].
Since such an enormous amount of energy (40%) is lost in the exhaust gas, researchers have
been investigating methods to utilise the wasted energy. One of the most widely-accepted
technologies to recuperate exhaust energy is a device known as a turbocharger. A
turbocharger, utilises the exhaust energy to drive a compressor and increase the boost
pressure into the engine, thus increasing the engine power output. The corollary is that by
turbocharging an engine, the same power can be achieved with a smaller engine (engine
downsizing). Since the CO2 emissions are directly linked to the size of the engine, many
original equipment manufacturers (OEM’s) are working intensively to reduce the size of the

24
engine, by turbocharging the engine of a specific vehicle, thereby improving the efficiency.
This forced induction systems based on turbochargers play a vital role in engine downsizing
and are arguably the most practical and economical method to address the fuel economy and
emissions challenges for transport.
1.2 Turbocharging the Internal Combustion Engine
Figure 1.3 presents the ideal air cycle of a naturally aspirated (NA) engine on the pressure
versus volume (PV) diagram. It corresponds to a dual-combustion engine model, which is a
reasonable representation of the thermodynamic process in an engine. Combustion is
idealised as heat addition (2-4) taking place during a constant volume process (2-3) and
subsequently a constant pressure process (3-4). The process 5-1 corresponds to the intake and
exhaust process in the NA engine. Power is needed to achieve compression 1-2. Useful work
can be seen in processes 3-4-5; this is the power stroke of an engine. The work output from
the engine is the area inside the diagram. The indicated mean effective pressure (IMEP)
represents the capacity to do work in this ideal cycle. An additional process of an isentropic
expansion from the exhaust valve opening state (point 5) down to ambient pressure (point 6)
is also shown. Practically, no useful work can be delivered for the process 5-6; however, if
the piston could extend to point 6, which is beyond bottom dead centre (BDC), the available
energy at 5 could be recovered. Area 5-1-6 is the energy available for recovery. One method
of energy recovery technologies is a turbocharger.
Figure 1.3: PV diagram for an ideal NA ICE engine [4].
25
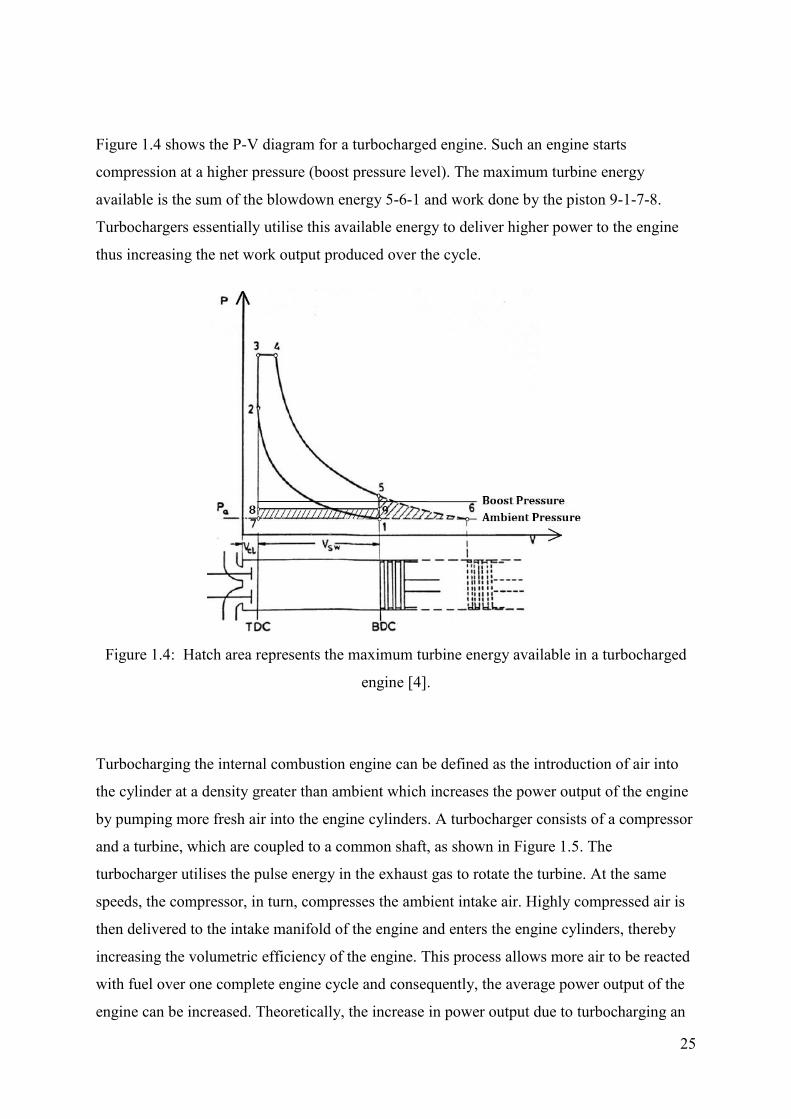
Figure 1.4 shows the P-V diagram for a turbocharged engine. Such an engine starts
compression at a higher pressure (boost pressure level). The maximum turbine energy
available is the sum of the blowdown energy 5-6-1 and work done by the piston 9-1-7-8.
Turbochargers essentially utilise this available energy to deliver higher power to the engine
thus increasing the net work output produced over the cycle.
Figure 1.4: Hatch area represents the maximum turbine energy available in a turbocharged
engine [4].
Turbocharging the internal combustion engine can be defined as the introduction of air into
the cylinder at a density greater than ambient which increases the power output of the engine
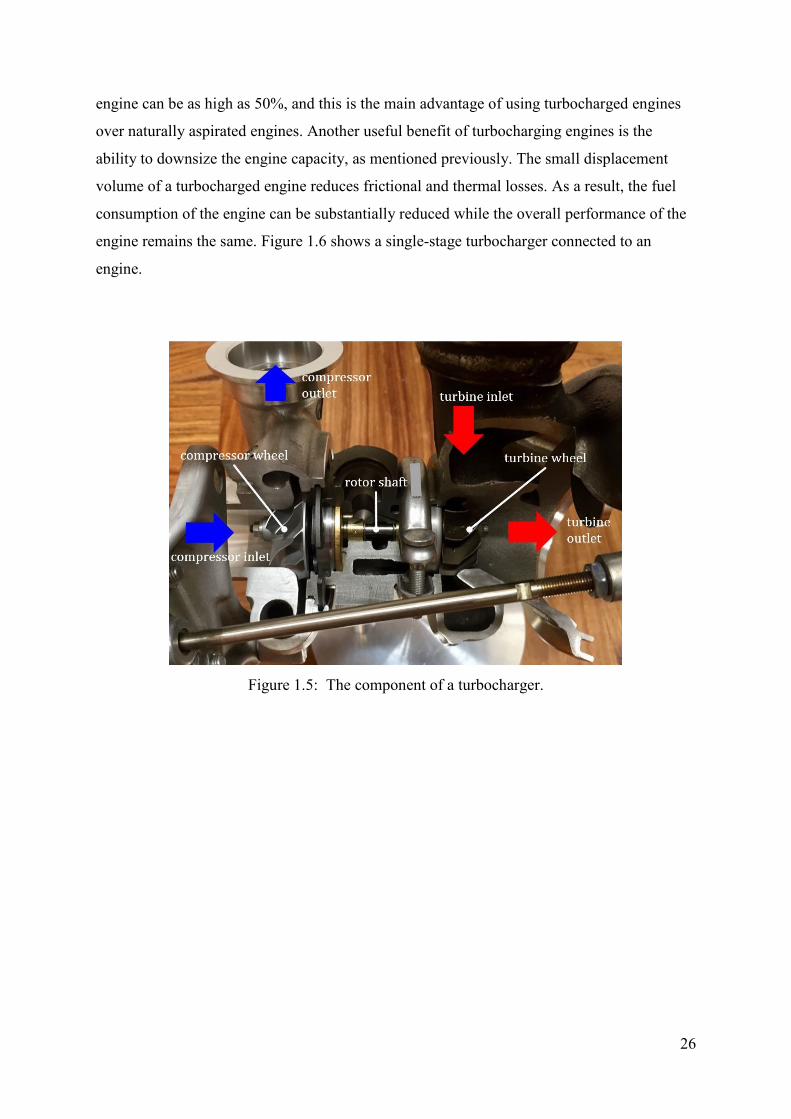
by pumping more fresh air into the engine cylinders. A turbocharger consists of a compressor
and a turbine, which are coupled to a common shaft, as shown in Figure 1.5. The
turbocharger utilises the pulse energy in the exhaust gas to rotate the turbine. At the same
speeds, the compressor, in turn, compresses the ambient intake air. Highly compressed air is
then delivered to the intake manifold of the engine and enters the engine cylinders, thereby
increasing the volumetric efficiency of the engine. This process allows more air to be reacted
with fuel over one complete engine cycle and consequently, the average power output of the
engine can be increased. Theoretically, the increase in power output due to turbocharging an
26
engine can be as high as 50%, and this is the main advantage of using turbocharged engines
over naturally aspirated engines. Another useful benefit of turbocharging engines is the
ability to downsize the engine capacity, as mentioned previously. The small displacement
volume of a turbocharged engine reduces frictional and thermal losses. As a result, the fuel
consumption of the engine can be substantially reduced while the overall performance of the
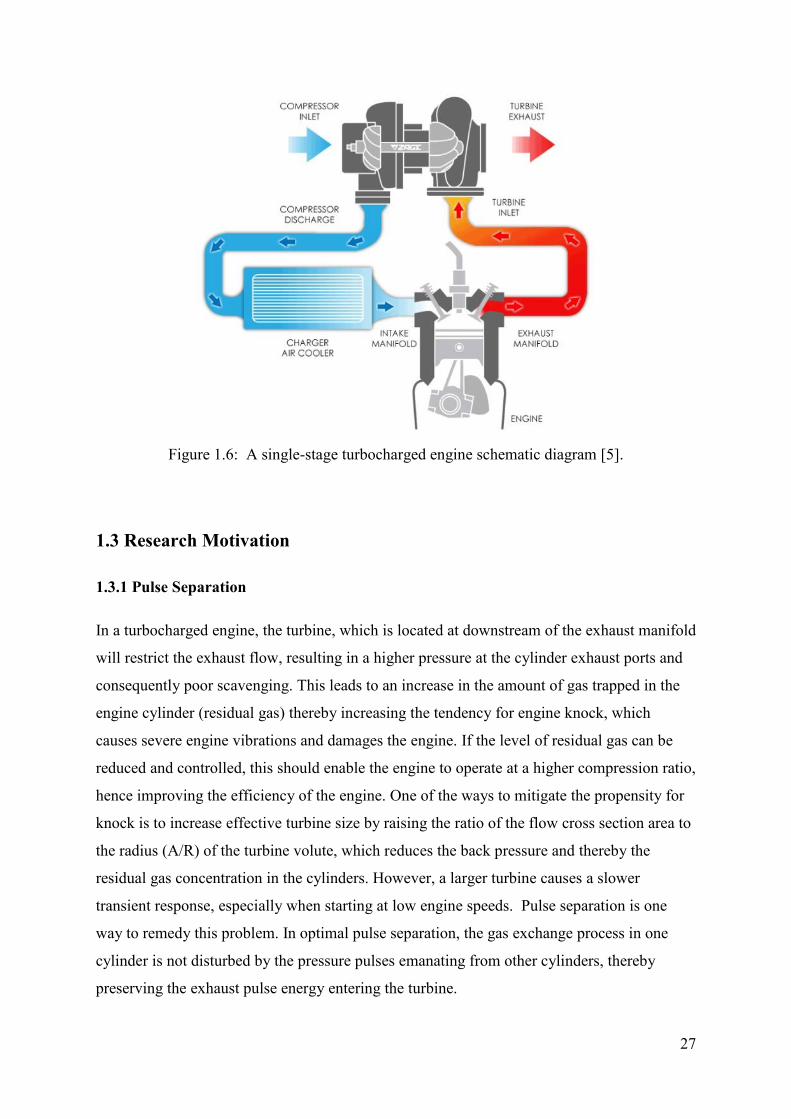
engine remains the same. Figure 1.6 shows a single-stage turbocharger connected to an
engine.
Figure 1.5: The component of a turbocharger.
27
Figure 1.6: A single-stage turbocharged engine schematic diagram [5].
1.3 Research Motivation
1.3.1 Pulse Separation
In a turbocharged engine, the turbine, which is located at downstream of the exhaust manifold
will restrict the exhaust flow, resulting in a higher pressure at the cylinder exhaust ports and
consequently poor scavenging. This leads to an increase in the amount of gas trapped in the
engine cylinder (residual gas) thereby increasing the tendency for engine knock, which
causes severe engine vibrations and damages the engine. If the level of residual gas can be
reduced and controlled, this should enable the engine to operate at a higher compression ratio,
hence improving the efficiency of the engine. One of the ways to mitigate the propensity for
knock is to increase effective turbine size by raising the ratio of the flow cross section area to
the radius (A/R) of the turbine volute, which reduces the back pressure and thereby the
residual gas concentration in the cylinders. However, a larger turbine causes a slower
transient response, especially when starting at low engine speeds. Pulse separation is one
way to remedy this problem. In optimal pulse separation, the gas exchange process in one
cylinder is not disturbed by the pressure pulses emanating from other cylinders, thereby
preserving the exhaust pulse energy entering the turbine.

28
1.3.2 Waste-gate System and Boost Control
The turbocharger has a limiting operational speed, and beyond this it can be damaged
(overspeeding). Also the boost pressure provided to the engine must be controlled. Having a
waste-gate on the turbine allows the exhaust gas to bypass the turbine when the inlet
manifold pressure reaches desired boost level, thus avoiding the abovementioned problems.
However, allowing more gas to bypass the turbine causes heat to be wasted. Thus waste-gate
matching is necessary during turbine design. Understanding the waste-gate behaviour and
flow characteristics will make the waste-gate design easier.
1.3.3 Electrified Turbocharger System
The electrification of the boosting system is an option to substantially improve engine
efficiency. One of the most challenging tasks of electrified boosting systems development is
to determine the optimal system from many realisable configurations. The optimised system
is not only from the standpoint of engine efficiency but also cost, driveability, technology
readiness and so on.
With downsized turbocharged engines now widely in use, the research focus is on how to
further increase the efficiency of the engine for improved fuel economy and better engine
transient response. Research efforts is broadly split between work on maximising work
extraction by the piston and recovering energy from the exhaust [6].
The aims of this research are threefold; firstly, to develop a new architecture that integrates
pulse separation with turbine matching for a turbocharged gasoline engine. This architecture
allows maximizing exhaust pulse energy at the turbine while reducing in-cylinder residual
gas content. This gives the potential to raise the compression ratio of the engine, which
improves thermal efficiency. Secondly, this research aims to gain a better understanding of
the waste-gate flow characteristics as this improves the knowledge of its impact on the
turbine performance and generally on the overall engine performance. Thirdly, the research
aims to assess several potential electrification boosting systems available for a highly
downsized turbocharged engine, which are modified versions of the benchmark engine. All
systems will be evaluated thoroughly based on important engine performance criteria, which
include meeting torque/BMEP target, transient response, pumping loss, in-cylinder residuals,
and fuel consumption.
29
1.4 Research Aims
The aims of this research are threefold; firstly, to develop a new architecture that integrates
pulse separation with turbine matching for a turbocharged gasoline engine. This architecture
allows maximizing exhaust pulse energy at the turbine while reducing in-cylinder residual
gas content. This gives the potential to raise the compression ratio of the engine, which
improves thermal efficiency. Secondly, this research aims to gain a better understanding of
the waste-gate flow characteristics as this improves the knowledge of its impact on the
turbine performance and generally on the overall engine performance. Thirdly, the research
aims to assess several potential electrification boosting systems available for a highly
downsized turbocharged engine, which are modified versions of the benchmark engine. All
systems will be evaluated thoroughly based on important engine performance criteria, which
include meeting torque/BMEP target, transient response, pumping loss, in-cylinder residuals,
and fuel consumption.
1.5 Thesis Objectives
The objectives of this research are:
(1) To construct a 1D model for benchmarking of single-stage turbocharged engines – a
Proton 1.6L CFE engine and a Renault 1.2L H5Ft engine – and validate the model against
engine dynamometer measurements. The validation includes both full-load and transient
performance.
(2) To propose a new architecture that integrates exhaust manifold design for pulse separation
and turbine matching for the purpose of preserving exhaust pulse energy and reducing
residual concentration, thus improving engine efficiency and transient response.
(3) To investigate the effect of a waste-gate on the turbine performance via experimental
work and propose a suitable modelling strategy.
(4) To assess the electrification options available for an advanced small gasoline engine.

30
1.6 Thesis Outline
This thesis is divided into 7 chapters as described below:
Chapter 1: Introduction
This chapter provides an overview of the research, and the rationale of the research carried
out. It also details the motivation and objectives of the research.
Chapter 2: Literature Review
The literature review activity is carried out to provide an insight into current developments
and the state-of-the-art of the topics at hand. Various publications and previous work related
to the research are reviewed and discussed include turbocharged engine modelling,
turbocharger and engine matching, the effect of residual gas on engine knock and electrified
turbocharger systems.
Chapter 3: Baseline Engine Modelling
This chapter presents the development of a 1D modelling process for benchmarking engines,
a Proton 1.6L CFE engine and a Renault 1.2L H5Ft engine. Both turbocharged engine
specifications were described. The full-load and transient model have been constructed and
validated against engine dynamometer measurements. The validated engine model will be
used as a baseline model for the next study.
Chapter 4: Pulse Separation Strategy
This section introduces the pulse separation strategy that integrates a pulse divided exhaust
manifold and turbine matching. The study covers how this pulse separation strategy affect
turbocharged engine performance under steady and transient performance. This study also
presents the importance of accounting the realistic turbine inertia in the simulation work,
particularly for transient event.
Chapter 5: Waste-gate Modelling
Experimental work for a waste-gated single scroll turbine with multiple waste-gate opening
positions was carried out, investigating the waste-gate flow characteristics to see the effect on
the turbine performance. Following the experimental work, the outcomes of the experimental
data were used as inputs in the waste-gate model to determine how the waste-gate can be
31
represented in the 1D simulation. The validated waste-gate model was then built into an
engine model to assess its impact on the overall engine performance.
Chapter 6: Electric Turbocharger Systems
This chapter assesses potential electrified boosting systems quantitatively regarding energy
balance. A high-level investigation into several multi-boosting strategies for a heavily
downsized turbocharged gasoline engine was carried. The baseline engine has been
downsized and electrified in order to examine the benefit of both strategies with several
boosting system arrangement. This assessment will provide better understanding into which
one of the air management strategies offers the greatest impact on the main engine
requirements.
Chapter 7: Conclusions
The final chapter of the thesis provides the overall findings of the work and highlights
recommendations for future work.

32
Chapter 2: Literature Review
The following literature review is carried out to give an insight into current developments and
the state-of-the-art of the topics at hand. Various publications and previous work related to
the study are reviewed and discussed. Some of the literature reflect the work presented in [7]
and [8] where the author of this thesis is the main author of both papers.
2.1 Turbocharged Engines Modelling
Early simulation techniques to predict the performance of turbocharged engines has been
done by [9] where they used quasi-steady and filling and emptying methods to analyse the
transient performance for turbocharged diesel engines. This effort was followed by further
work by Watson [10] to enhance the performance prediction and diesel engines as well as
turbocharger matching.
Watson [11] then validated the use of the computational method for predictive performance
of spark ignition (SI) engine. The main purpose of this work is to solve the problems
combined with interaction with the engine and component turbocharger in the control volume
based environment. The approach has been used by the author in the structural model to
ensure flexibility in the design change of the various engine components. Engine components
such as cylinders, intake and exhaust manifolds are modelled with various and fixed volumes
respectively. Flow devices such as valves and throttles are modelled as an orifice with
different areas. Boosting components such as turbochargers and superchargers are built into
the model as a boundary condition within the manifolds. One of the key features of the model
is its ability to predict the effects of gas dynamics resulting from the manifold length of the
manifold, and this will create the ability to model the cylinder to cylinder variations. Another
feature that can be identified is the use of turbocharger performance maps (both turbine and
compressor) where it is directly charged as a boundary condition within the manifold. In
addition to his research, Watson [11] also investigated twin entry and variable geometry
turbochargers. The speed of the turbocharger is calculated by balancing the torque generated
and used by turbocharger turbines and compressors. The simulation work has been successful
in prediction of changes in engine performance due to changes in engine geometry and also
the presence and selection of turbochargers. The method used by Watson has been widely
adopted in modelling simulations.
33
2.2 Turbocharger and Engine Matching
Turbocharger matching is a method of selecting the optimum turbocharger components for an
engine in order to meet its performance requirements. The compressor and turbine wheels
have the greatest influence on a turbocharger’s operational characteristics. The selection of a
smaller turbine improves the response of the engine at low engine speeds, but the maximum
power of the turbine is limited due to its size. A larger turbine increases the swallowing
capacity of the exhaust gas mass flow that enters the wheel, which enhances the power of the
turbine. However, a larger turbine results in slower acceleration of the wheel and this causes
delayed engine response. Therefore, it is important that the most appropriate turbocharger for
the desired engine performance characteristics is selected.
Much research on effects of turbochargers on internal combustion engines has been done.
These studies have shown that a turbocharger increases the power of the engine if the
appropriate turbocharger is chosen [4, 12]. The performance of the engine can be negatively
affected (reducing power, torque, and increasing the pollutants emitted to the environment
[13]) if the process is not carried out correctly.
A typical turbocharger matching in a 1D simulation environment is given by Pohorelsky et al.
[14]. The required charge pressure is varied by sweeping the inlet pressure and exhaust back
pressure within a certain range. From this, the initial sizing of the compressor can be done.
Korakianitis et al. [15] carried out a theoretical matching method for selecting a turbocharger
for a given engine. They chose a range of turbochargers using theory relations but
recommended the final selection can only be obtained by experimental tests. Korakianitis
concluded that different turbocharger selection has advantages over different engine
operating point.
Different curve fitting methods for compressor and turbine are presented by Moraal et al.
[16]. The efficiency and turbocharger speed are interpolated from the compressor maps. With
efficiency defined, the power required by each compressor can be calculated. The compressor
choice is then a complex balance between minimising power consumed and the ability to
keep an adequate margin to the limits of stable operation for all speeds.
34
2.3 The Effect of Residual Gas on Knock
The residual gas fraction (RGF) quantifies the burned gases that remain trapped inside the
engine cylinders, which is originated from two mechanisms; (1) the flow of burned gas from
the exhaust manifold back to the engine cylinder during valve overlap, and (2) the trapped
gas in the cylinder just before the commence of the valve overlap flow:
𝑚𝑟 = ∫ 𝑚𝑒𝐸𝑉𝐶
𝐼𝑉𝑂𝑑 + 𝑚𝐼𝑉𝑂 Equation 1
in which IVO is the crank angle at intake valve opening, EVC is the crank angle at exhaust
valve closing, me is the mass flow rate of the burned gas from exhaust port back into the
engine cylinder during valve overlap and mIVO is the mass trapped in the cylinder at intake
valve open (IVO). High levels of residuals gas lead to the engine knock [17].
Knock is a phenomenon where the air-fuel mixture is spontaneously combusted prior to the
combustion that is supposed to be initiated by the spark plug. The main reason for the
occurrence of knock is the high temperatures and pressures during the combustion process
causing the end gas to auto ignite. Residual exhaust gases that have not left on the cylinder
also impact on the composition of the fresh charge. This causes a higher thermal and
mechanical stresses that causes mechanical failure of the engine components such as valve
lash and piston.
Galliot et al. [18] conducted an experiment to measure the residual gas fraction using a fast-
response flame ionization hydrocarbon detector, which enabled measurement of in-cylinder
hydrocarbon concentration in real time. According to their study, the residual gas content
decreases with the increase of intake pressure. The amount of residual gas highly depends on
the intake and exhaust processes. When the intake pressure equals the exhaust pressure, there
would be very little back flow of the burned gas from the exhaust port. Therefore, the residual
is not dependent on the flow time but would be independent of engine speed.
Fox et al. [19] also show that positive scavenging, when the intake pressure is greater than the
exhaust pressure, causes a reduction in the residual gas fraction. Improving the pressure ratio
(inlet pressure to exhaust pressure) from 0.3 to 1.0, the residual gas fraction reduces from
25% to 10%. Fox et al. also show that the valve overlap flow contributes to the amount of
residual gas fraction.

35
The effort to investigate the influence of residual gas on engine knock has been studied by
Westin et al. [20]. According to this study, for constant ignition timing, the greater residual
gas fraction will increase the average cylinder pressure and temperature in the combustion
chamber and consequently the engine is more likely to knock. Lower residual gas fraction
also enables ignition timing to be advanced hence reducing the cylinder pressure and
temperature. Reducing 15% of residual gas fraction when knock intensity is constant at
30kPa allows the ignition timing to be advanced up to 5 CAD, which improves the efficiency
of combustion.
2.4 Electrified Turbocharger Systems
Various technologies have been developed for exhaust gas recovery such as
turbocompounding, Rankine cycle and thermoelectric generator. All of the systems are
designed to recuperate the wasted energy in the exhaust system and convert it into useful
energy for the vehicles. The comparison of waste heat recovery systems have been
summarised by Aghaali et al. in [21]. The first effort to utilise electric turbocompounding
(ETC) technology into an engine was made in 2004 by Caterpillar [22], demonstrating the
integration of the turbocharger and motor generator unit (MGU) and its effectiveness in fuel
savings. There are many researchers working on ETC system on heavy-duty diesel engine
after the year 2000. Most of the work focused on interaction with engines, especially the
effect of increased back pressure [23-25]. Due to the recent stringent trend in CO2 emission
standard, there is an increasing demand for ETC system for passenger cars (below 2.0L
engine). After 2010, ETC system on small displacement engines have been investigated in
some projects [26-35]. An assessment was conducted by Wei W. et al. [30] comparing
several types of ETC systems in turbocharged gasoline engines. They summarised that ETC
system with turbo-generator parallel arrangement gives the highest fuel economy
improvement under engine operating condition (driving cycles). Ismail Y et. al [26]
investigated that series turbocompounding has higher potential of energy recovery than the
parallel turbocompounding. For the series turbocompounding configuration, the power
turbine is installed at the downstream of the turbocharger turbine, while for the parallel
turbocompounding system, the exhaust gas flows separately into the power turbine and the
turbocharger. Even though the parallel creates lower exhaust back pressure, the exhaust mass
flow through the turbocharger turbine of series turbocompounding is higher.
36
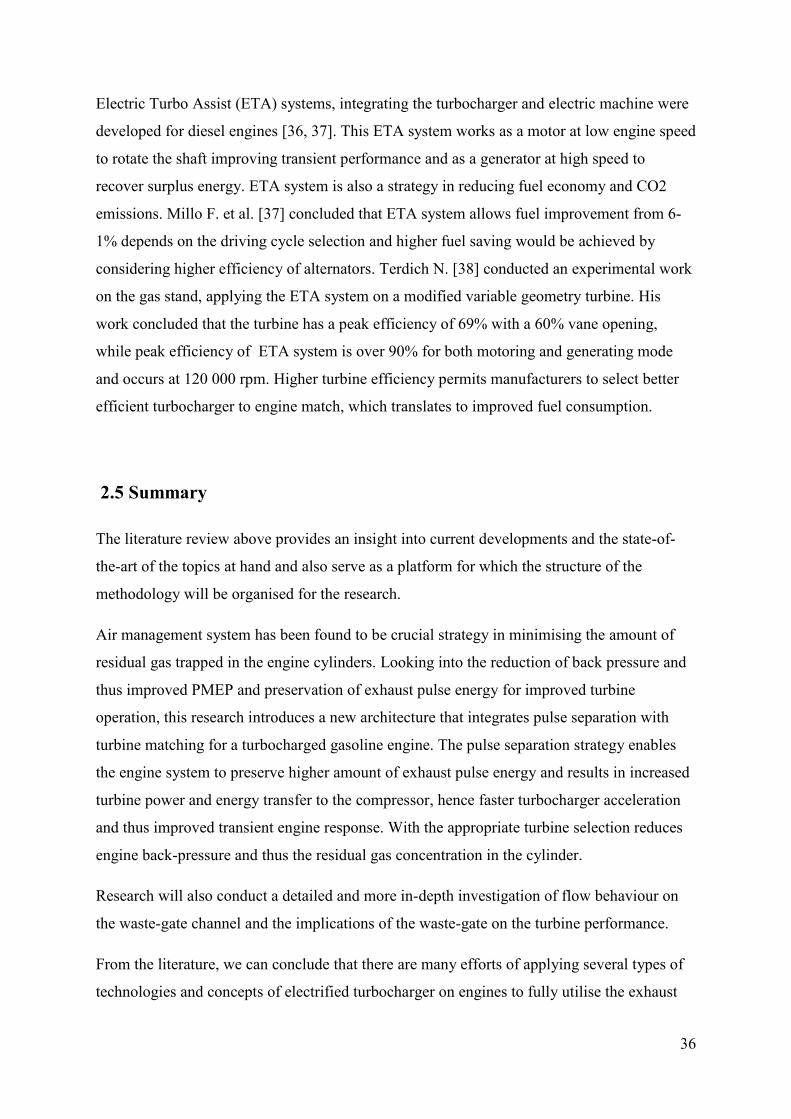
Electric Turbo Assist (ETA) systems, integrating the turbocharger and electric machine were
developed for diesel engines [36, 37]. This ETA system works as a motor at low engine speed
to rotate the shaft improving transient performance and as a generator at high speed to
recover surplus energy. ETA system is also a strategy in reducing fuel economy and CO2
emissions. Millo F. et al. [37] concluded that ETA system allows fuel improvement from 6-
1% depends on the driving cycle selection and higher fuel saving would be achieved by
considering higher efficiency of alternators. Terdich N. [38] conducted an experimental work
on the gas stand, applying the ETA system on a modified variable geometry turbine. His
work concluded that the turbine has a peak efficiency of 69% with a 60% vane opening,
while peak efficiency of ETA system is over 90% for both motoring and generating mode
and occurs at 120 000 rpm. Higher turbine efficiency permits manufacturers to select better
efficient turbocharger to engine match, which translates to improved fuel consumption.
2.5 Summary
The literature review above provides an insight into current developments and the state-of-
the-art of the topics at hand and also serve as a platform for which the structure of the
methodology will be organised for the research.
Air management system has been found to be crucial strategy in minimising the amount of
residual gas trapped in the engine cylinders. Looking into the reduction of back pressure and
thus improved PMEP and preservation of exhaust pulse energy for improved turbine
operation, this research introduces a new architecture that integrates pulse separation with
turbine matching for a turbocharged gasoline engine. The pulse separation strategy enables
the engine system to preserve higher amount of exhaust pulse energy and results in increased
turbine power and energy transfer to the compressor, hence faster turbocharger acceleration
and thus improved transient engine response. With the appropriate turbine selection reduces
engine back-pressure and thus the residual gas concentration in the cylinder.
Research will also conduct a detailed and more in-depth investigation of flow behaviour on
the waste-gate channel and the implications of the waste-gate on the turbine performance.
From the literature, we can conclude that there are many efforts of applying several types of
technologies and concepts of electrified turbocharger on engines to fully utilise the exhaust
37
energy recovery. It is worth mentioning that the configurations on electric turbocharger
systems play an important role in engine development stage in order to meet important engine
performance criteria which include meeting torque/BMEP target, transient response, pumping
loss, in-cylinder residuals, and fuel consumption. This research will also assess a high-level
investigation into several multi-boosting strategies for a heavily downsized turbocharged
gasoline engine. This study provides insight into which one of the air management strategies
offers the greatest impact on the main engine requirements.

38
Chapter 3: Baseline Engine Modelling
This section details the method of engine modelling using an industry standard 1D
simulations tool, namely GT-Power. The engines were constructed and validated against
engine dynamometer measurements, which covers full-load steady state and transient
performance. Due to OEM’s confidentiality requirement, most of the results in the graphs
have been normalised by the corresponding maximum value in each set of results. Some of
the figures and paragraphs in this chapter are taken from SAE and IGTC proceeding
conference in 2015 where the author of this thesis is the main author [7, 8].
3.1 GT-Power Engine Simulation Tool
GT-Power software is the industry standard engine simulation tool, and it is widely used by
leading engine makers and suppliers in the automotive industry. GT-Power, which is easy to
use and user-friendly, can be used for a broad range of activities relating to engine design and
development. GT-Power software can be used to predict either steady-state or transient
behaviour of an engine system. Furthermore, GT-Power is also applicable to all types of
internal combustion and provides the user with many components for modelling various
advanced concepts. GT-Power software minimises the time and the cost of developing a new
design without the need for various prototype parts to be developed for experimental
purposes. Integration further enhances its usefulness with 3rd party software products such as
Fluent, STAR-CD and Simulink. GT-Power has been thoroughly validated by real life
applications due to the large size of its user base. The validated engine model can reduce the
number of prototypes and experimental tests. It also can simulate at any engine operating
condition even points that could be dangerous to run on a real engine.
The gas flow concept in GT-Power uses the solution of the governing equations in one-
dimensional form. The Navier-Stokes equations which consist of the conservation of mass,
momentum and energy are simultaneously solved at each time-step with all quantities
averaged across the direction of flow [39]. In engine cycle simulation. GT-Power solves the
equations to predict the flow rates in the intake and exhaust systems and also contain the built
in predefined template objects of specific engine components (pipes and flowsplits,
manifolds, valvetrain, cranktrain, combustion system, boosting components, catalyst etc.)
39
[40]. It enables users to find the best balance between complexity and accuracy, taking into
account available input data and desired outputs.
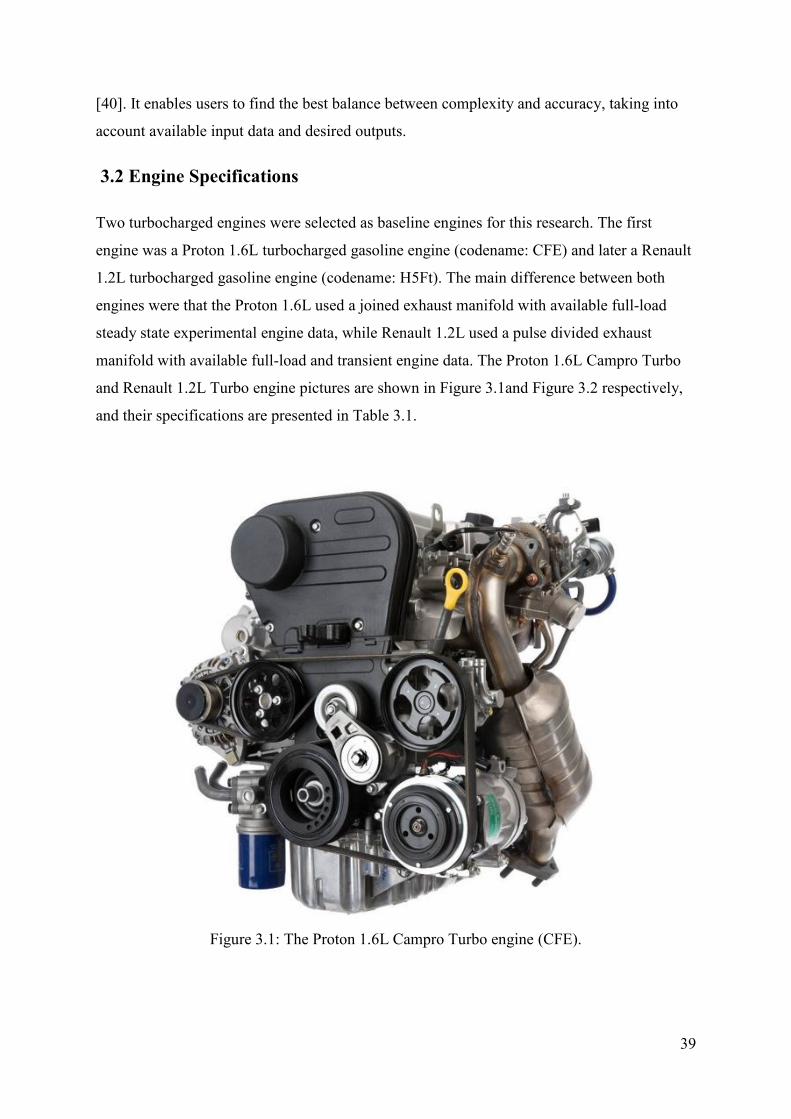
3.2 Engine Specifications
Two turbocharged engines were selected as baseline engines for this research. The first
engine was a Proton 1.6L turbocharged gasoline engine (codename: CFE) and later a Renault
1.2L turbocharged gasoline engine (codename: H5Ft). The main difference between both
engines were that the Proton 1.6L used a joined exhaust manifold with available full-load
steady state experimental engine data, while Renault 1.2L used a pulse divided exhaust
manifold with available full-load and transient engine data. The Proton 1.6L Campro Turbo
and Renault 1.2L Turbo engine pictures are shown in Figure 3.1and Figure 3.2 respectively,
and their specifications are presented in Table 3.1.
Figure 3.1: The Proton 1.6L Campro Turbo engine (CFE).
40
Figure 3.2: The Renault 1.2L Turbo engine (H5Ft).
Table 3.1: Proton 1.6L Campro Turbo, and Renault 1.2L Turbo[41] engine specification.

41
3.3 Engine Modelling
3.3.1 Experimental Setup
A full-load steady-state performance test has been undertaken on the engine test bench to
confirm the base performance of the engine, shown in Figure 3.3 below. The engine was
installed on the test bench at the Proton engine development laboratory, using gasoline
RON95 fuel, engine oil viscosity 10w-30 and the coolant-to-water ratio of 50-50. A 250kW
test bench dynamometer was used in the test. The engine parameter calculations are included
in the dynamometer software, which are summarised in Table 3.2 below.
Figure 3.3: Proton 1.6L CFE engine on the test bench at the Proton dynamometer laboratory.
42
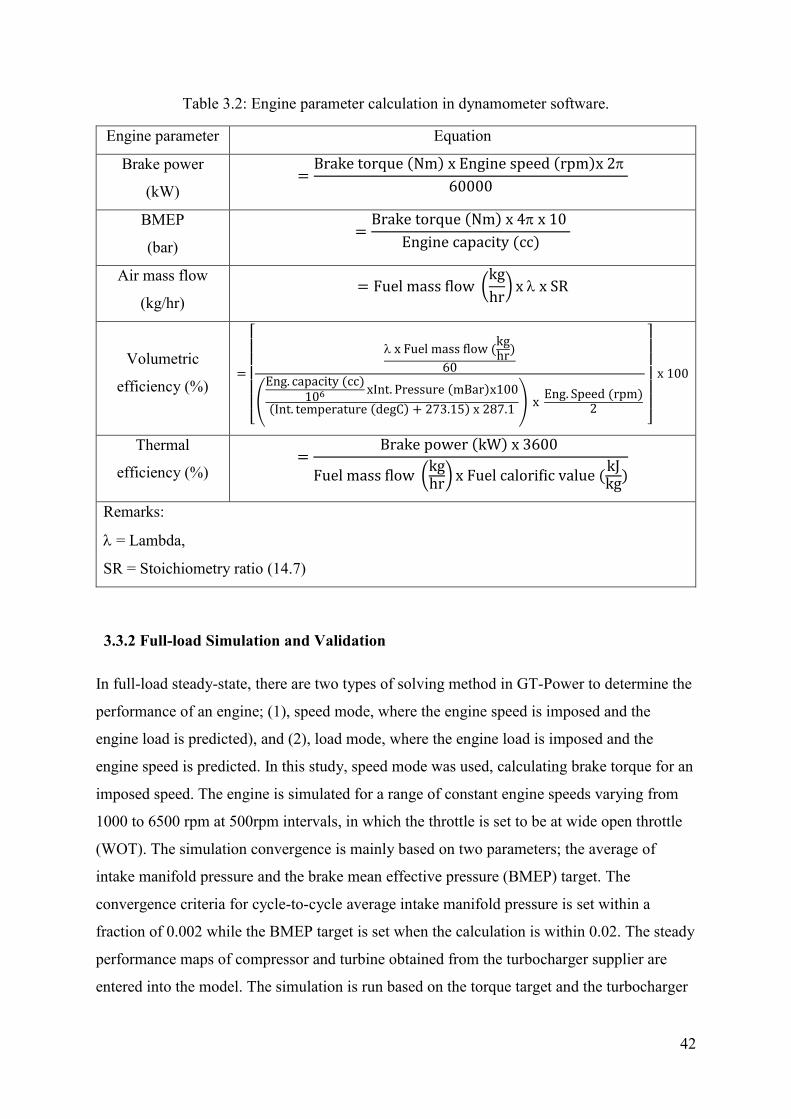
Table 3.2: Engine parameter calculation in dynamometer software.
Engine parameter Equation
Brake power
(kW) =
Brake torque (Nm) x Engine speed (rpm)x 2
60000
BMEP
(bar) =
Brake torque (Nm) x 4 x 10
Engine capacity (cc)
Air mass flow
(kg/hr) = Fuel mass flow (
kg
hr) x x SR
Volumetric
efficiency (%) =
[
x Fuel mass flow (kghr
)
60
(
Eng. capacity (cc)106 xInt. Pressure (mBar)x100
(Int. temperature (degC) + 273.15) x 287.1) x
Eng. Speed (rpm)2
]
x 100
Thermal
efficiency (%) =
Brake power (kW) x 3600
Fuel mass flow (kghr
) x Fuel calorific value (kJkg
)
Remarks:
= Lambda,
SR = Stoichiometry ratio (14.7)
3.3.2 Full-load Simulation and Validation
In full-load steady-state, there are two types of solving method in GT-Power to determine the
performance of an engine; (1), speed mode, where the engine speed is imposed and the
engine load is predicted), and (2), load mode, where the engine load is imposed and the
engine speed is predicted. In this study, speed mode was used, calculating brake torque for an
imposed speed. The engine is simulated for a range of constant engine speeds varying from
1000 to 6500 rpm at 500rpm intervals, in which the throttle is set to be at wide open throttle
(WOT). The simulation convergence is mainly based on two parameters; the average of
intake manifold pressure and the brake mean effective pressure (BMEP) target. The
convergence criteria for cycle-to-cycle average intake manifold pressure is set within a
fraction of 0.002 while the BMEP target is set when the calculation is within 0.02. The steady
performance maps of compressor and turbine obtained from the turbocharger supplier are
entered into the model. The simulation is run based on the torque target and the turbocharger
43
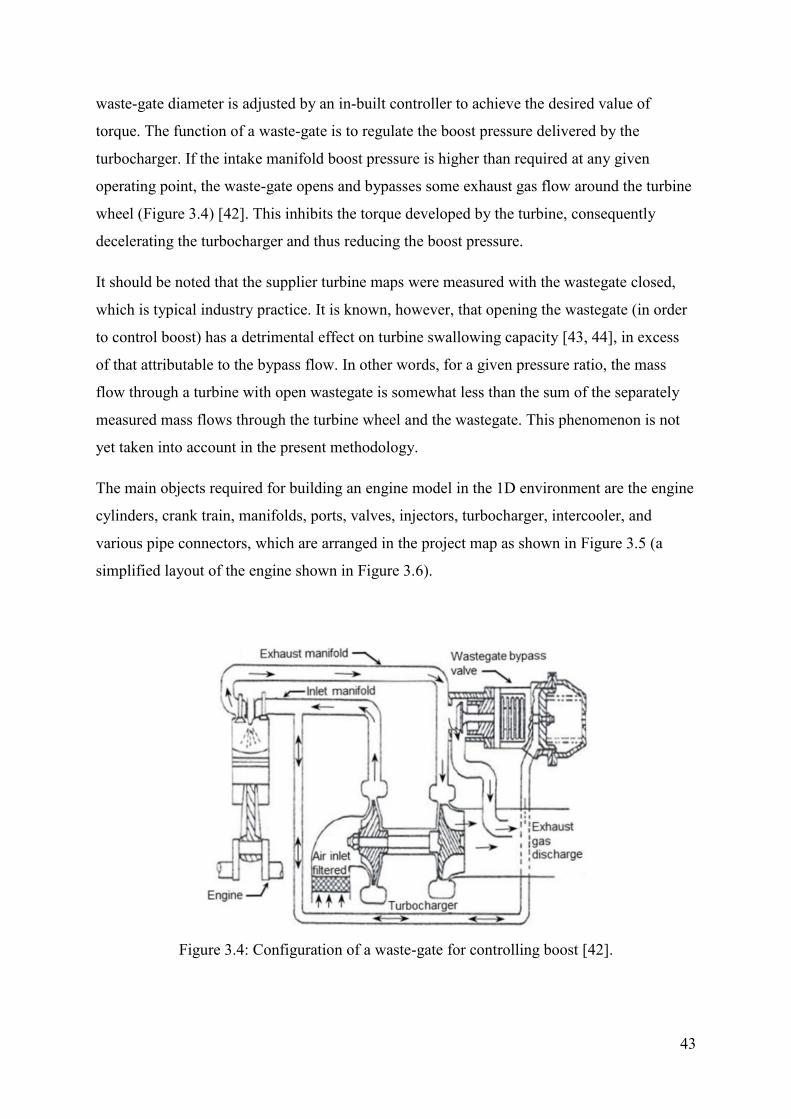
waste-gate diameter is adjusted by an in-built controller to achieve the desired value of
torque. The function of a waste-gate is to regulate the boost pressure delivered by the
turbocharger. If the intake manifold boost pressure is higher than required at any given
operating point, the waste-gate opens and bypasses some exhaust gas flow around the turbine
wheel (Figure 3.4) [42]. This inhibits the torque developed by the turbine, consequently
decelerating the turbocharger and thus reducing the boost pressure.
It should be noted that the supplier turbine maps were measured with the wastegate closed,
which is typical industry practice. It is known, however, that opening the wastegate (in order
to control boost) has a detrimental effect on turbine swallowing capacity [43, 44], in excess
of that attributable to the bypass flow. In other words, for a given pressure ratio, the mass
flow through a turbine with open wastegate is somewhat less than the sum of the separately
measured mass flows through the turbine wheel and the wastegate. This phenomenon is not
yet taken into account in the present methodology.
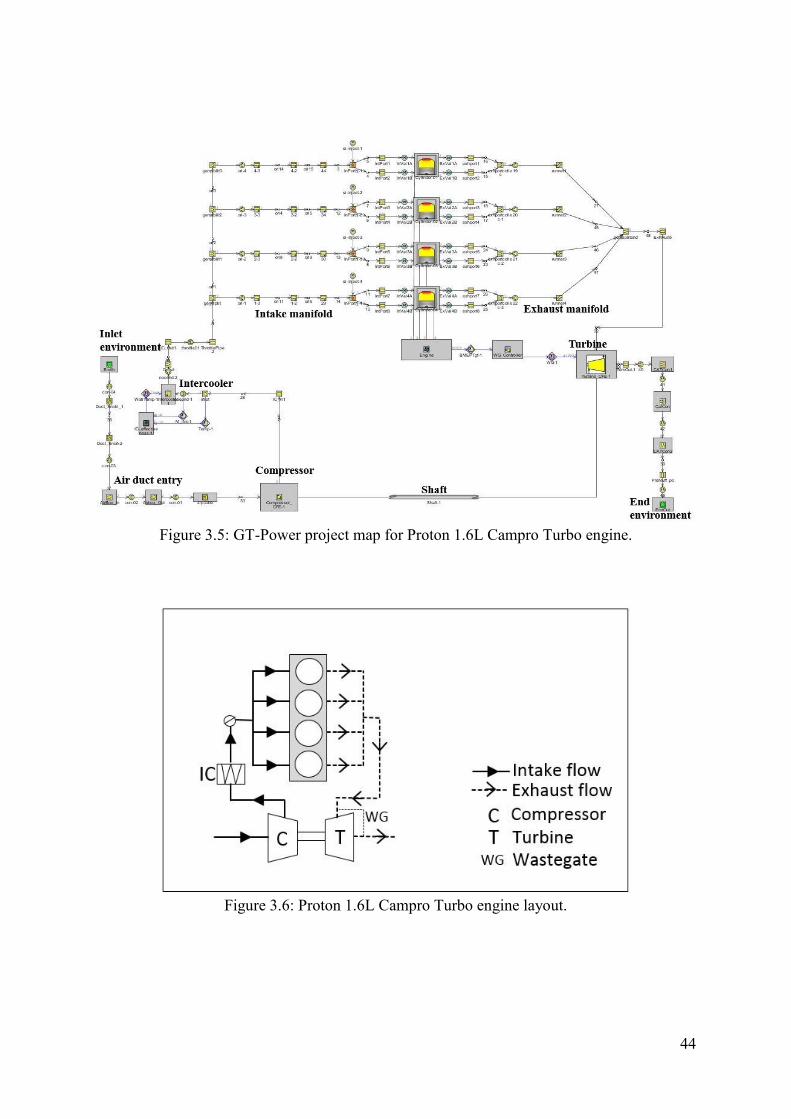
The main objects required for building an engine model in the 1D environment are the engine
cylinders, crank train, manifolds, ports, valves, injectors, turbocharger, intercooler, and
various pipe connectors, which are arranged in the project map as shown in Figure 3.5 (a
simplified layout of the engine shown in Figure 3.6).
Figure 3.4: Configuration of a waste-gate for controlling boost [42].
44
Figure 3.5: GT-Power project map for Proton 1.6L Campro Turbo engine.
Figure 3.6: Proton 1.6L Campro Turbo engine layout.
45
Combustion energy release in GT-Power is modelled using an SI Wiebe function, which is
commonly used for spark ignition engines. Without in-cylinder pressure measurements, the
combustion is represented by imposing the values of burn point (50% burn anchor angle), 10-
90% burn duration and the Wiebe exponent in degrees of crank angle [12] for all engine
speeds at wide open throttle (WOT) with these burn points and durations having been
obtained during performance and emission test by the Proton engine development team.
Intake and exhaust valve lift and timing are defined according to the actual engine set up. The
values of intake and exhaust discharge coefficient (CD) were obtained during the flow bench
test of Campro cylinder head. Both intake and exhaust manifold are based on actual
geometries from 3D CAD data.
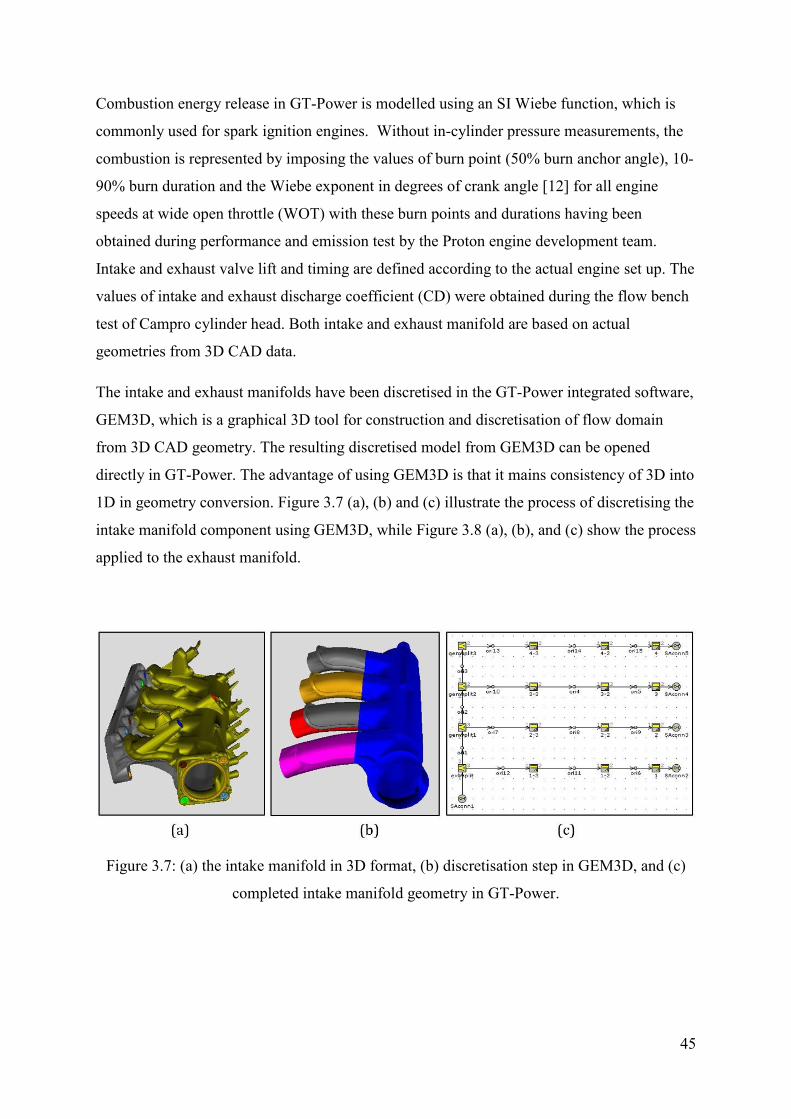
The intake and exhaust manifolds have been discretised in the GT-Power integrated software,
GEM3D, which is a graphical 3D tool for construction and discretisation of flow domain
from 3D CAD geometry. The resulting discretised model from GEM3D can be opened
directly in GT-Power. The advantage of using GEM3D is that it mains consistency of 3D into
1D in geometry conversion. Figure 3.7 (a), (b) and (c) illustrate the process of discretising the
intake manifold component using GEM3D, while Figure 3.8 (a), (b), and (c) show the process
applied to the exhaust manifold.
Figure 3.7: (a) the intake manifold in 3D format, (b) discretisation step in GEM3D, and (c)
completed intake manifold geometry in GT-Power.
46
Figure 3.8: (a) the joined exhaust manifold in 3D format, (b) discretisation step in GEM3D,
and (c) completed exhaust manifold geometry in GT-Power.
In GT-Power software, the useful power output of the engine can be calculated through its
brake mean effective pressure (BMEP), and the equation is as follows,
𝐵𝑀𝐸𝑃 =𝑊𝑏
𝑉𝑑 Equation 2
where Wb is the brake work, and Vd is the engine displacement. The brake power Ẇb is the
rate of work done by the engine and is the product of the brake torque b and engine speed 𝑛 ,
𝑊𝑏̇ = 2𝜋𝑛 𝑥 𝑏 Equation 3
The relationship between brake power Ẇb, brake torque b and BMEP is given by,
𝑊𝑏̇ =
(𝐵𝑀𝐸𝑃)𝑉𝑑𝑛
2 Equation 4
The engine brake power Ẇb enables the calculation of the brake specific fuel consumption
(BSFC) of the engine. Engine BSFC can be defined as a measurement of the effectiveness of
an engine’s ability to convert the chemical energy in the form of fuel into useful work.
𝐵𝑆𝐹𝐶 =�̇�𝑓
�̇�𝑏(𝑔
𝑘𝑊ℎ𝑟⁄ ) Equation 5
where �̇�𝑓 is the fuel flow rate; a lower BSFC value implies better fuel economy.
The thermal efficiency, 𝑡ℎ
of an engine is defined as:
𝑡ℎ
= 1 −1
𝑟𝑐𝛾−1 Equation 6
in which 𝑟𝑐 is compression ratio and 𝛾 is the ratio of specific heats. From equation above, it
can be deduced that increasing the compression ratio of an engine will raise engine thermal
efficiency.
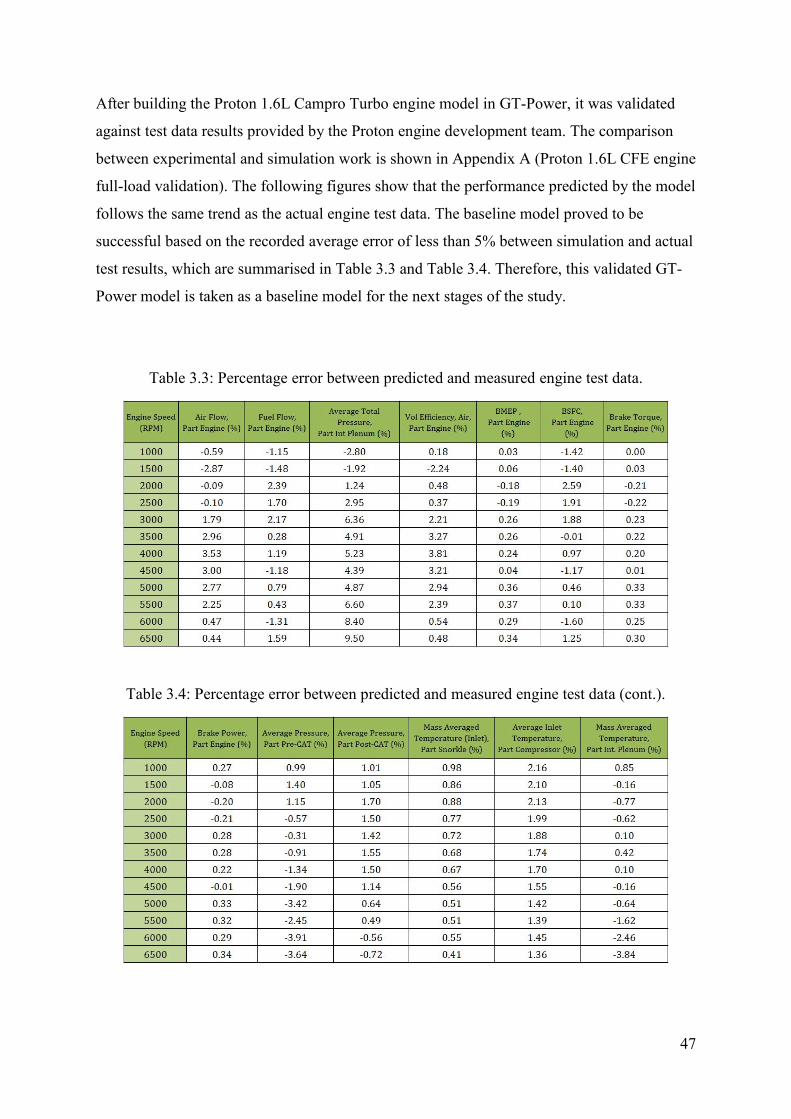
47
After building the Proton 1.6L Campro Turbo engine model in GT-Power, it was validated
against test data results provided by the Proton engine development team. The comparison
between experimental and simulation work is shown in Appendix A (Proton 1.6L CFE engine
full-load validation). The following figures show that the performance predicted by the model
follows the same trend as the actual engine test data. The baseline model proved to be
successful based on the recorded average error of less than 5% between simulation and actual
test results, which are summarised in Table 3.3 and Table 3.4. Therefore, this validated GT-
Power model is taken as a baseline model for the next stages of the study.
Table 3.3: Percentage error between predicted and measured engine test data.
Table 3.4: Percentage error between predicted and measured engine test data (cont.).

48
3.3.3 Transient Simulation and Validation
In the transient simulation, the model was set up to replicate the actual H5Ft engine test bed
setting. The moment of inertia for components such as the turbocharger and the crankshaft
are of critical importance [45]. The transient simulation runs specific cycles to obtain a steady
operating condition before imposing a transient event. To simulate the transient performance
for an engine, it is essential to define the response time, which is measured here in terms of
time-to-torque. Figure 3.9 below defines the time-to-torque response interval used for load
changes at a constant speed, starting at a constant BMEP of 2 bar and finishing of 90% of the
maximum torque value at the particular engine speed under examination. This definition of
the response time has been used throughout this study.
Figure 3.9: Time-to-torque definition at constant engine speed [8].

49
Table 3.5: Transient test set up for H5Ft engine.
Table 3.5 shows the set up for an engine for the transient test. Engine brake mean effective
pressure (BMEP) is kept constant at 2 bar for 5 minutes (300seconds), to full-load wide open
throttle (WOT).
One of the important parameters to consider in transient simulation was the inertia value. An
accurate value of the turbocharger inertia was obtained for use in the simulation of the
Renault engine model, which is shown in Figure 4.21.
Figure 3.10 below shows the transient model validation against measured engine test data at
engine constant speed of 1000rpm. The simulation work time was shifted in order to match it
with engine data. It can be seen that there are 2 phases in the transient curve. Phase 1 explains
the engine cylinder is directly filled and obtain atmospheric torque, which is similar to a
naturally aspirated (NA) engine. Later phase 2 period represents the moment when the
turbocharger starts to work and the torque is slowly increased due the inertia of the
turbocharger and energy is now required to accelerate its rotating components. Figure 3.10
below shows the validation between simulation and experimental data for 1000rpm. For the 2
bar BMEP to 90% torque load step, the time difference between simulation and test is 2.5%.
Running the transient model at other engine speeds also indicates similarly adequate
validations against test data.
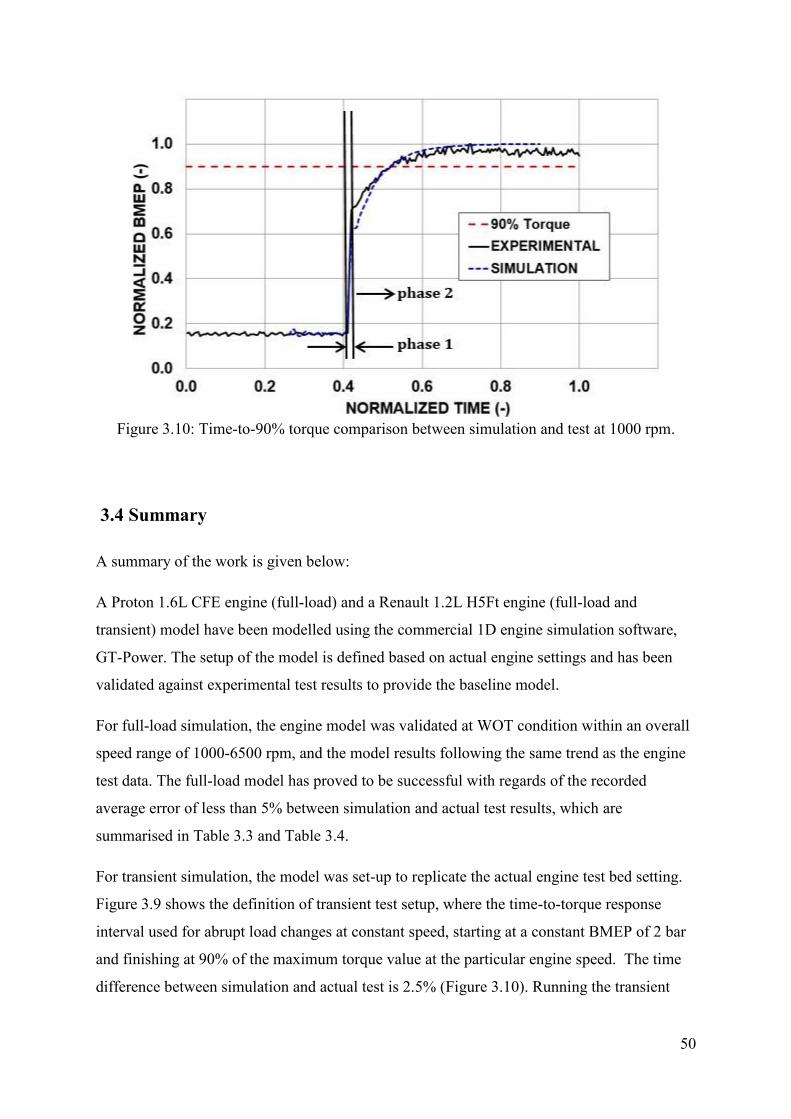
50
Figure 3.10: Time-to-90% torque comparison between simulation and test at 1000 rpm.
3.4 Summary
A summary of the work is given below:
A Proton 1.6L CFE engine (full-load) and a Renault 1.2L H5Ft engine (full-load and
transient) model have been modelled using the commercial 1D engine simulation software,
GT-Power. The setup of the model is defined based on actual engine settings and has been
validated against experimental test results to provide the baseline model.
For full-load simulation, the engine model was validated at WOT condition within an overall
speed range of 1000-6500 rpm, and the model results following the same trend as the engine
test data. The full-load model has proved to be successful with regards of the recorded
average error of less than 5% between simulation and actual test results, which are
summarised in Table 3.3 and Table 3.4.
For transient simulation, the model was set-up to replicate the actual engine test bed setting.
Figure 3.9 shows the definition of transient test setup, where the time-to-torque response
interval used for abrupt load changes at constant speed, starting at a constant BMEP of 2 bar
and finishing at 90% of the maximum torque value at the particular engine speed. The time
difference between simulation and actual test is 2.5% (Figure 3.10). Running the transient

51
model at other engine speeds also indicates similarly adequate validation against the test data.
Therefore, all these validated GT-Power models are ready to be used as a baseline model for
the next stage of the study.

52
Chapter 4: Pulse Separation Strategy
4.1 Introduction
In the following sections, the pulse separation strategy, which integrates a pulse divided
exhaust manifold and turbine matching are presented. After constructing the 1D model and
validating against experimental test results, the turbine will be scaled to a larger size. This is
the first step towards reducing back pressure and thus the residual gas concentration in-
cylinder. At this stage, the engine performance is evaluated based on the torque deficit or
benefit compared to the baseline engine, engine transient response, in-cylinder residual
reduction and potential fuel savings. However a larger turbine causes a torque deficit
particularly at low engine speeds. So the next following step is the introduction of a pulse
divided exhaust manifold design to investigate its impact on engine performance.
Effectiveness of the new method combining appropriate turbine sizing and pulse divided
exhaust manifold design will be evaluated by considering torque deficit, transient response,
brake specific fuel consumption, engine scavenging and residual gas fraction. Most of the
contents have been published in SAE and IGTC conference in 2015 where the author is the
main author [7, 8].
4.1 Turbine Sizing
After validating the baseline engine model, the turbine is set to a larger size. The primary aim
of this strategy is to reduce back pressure and thus the residual gas concentration in the
engine cylinders, which is shown in Figure 4.1 below. Reducing the amount of residual gas
also reduces the in-cylinder temperature, thereby decreasing the tendency for engine knock.
This enables the engine to operate at a higher compression ratio, hence improving the
efficiency of the engine and consequently improve fuel economy.
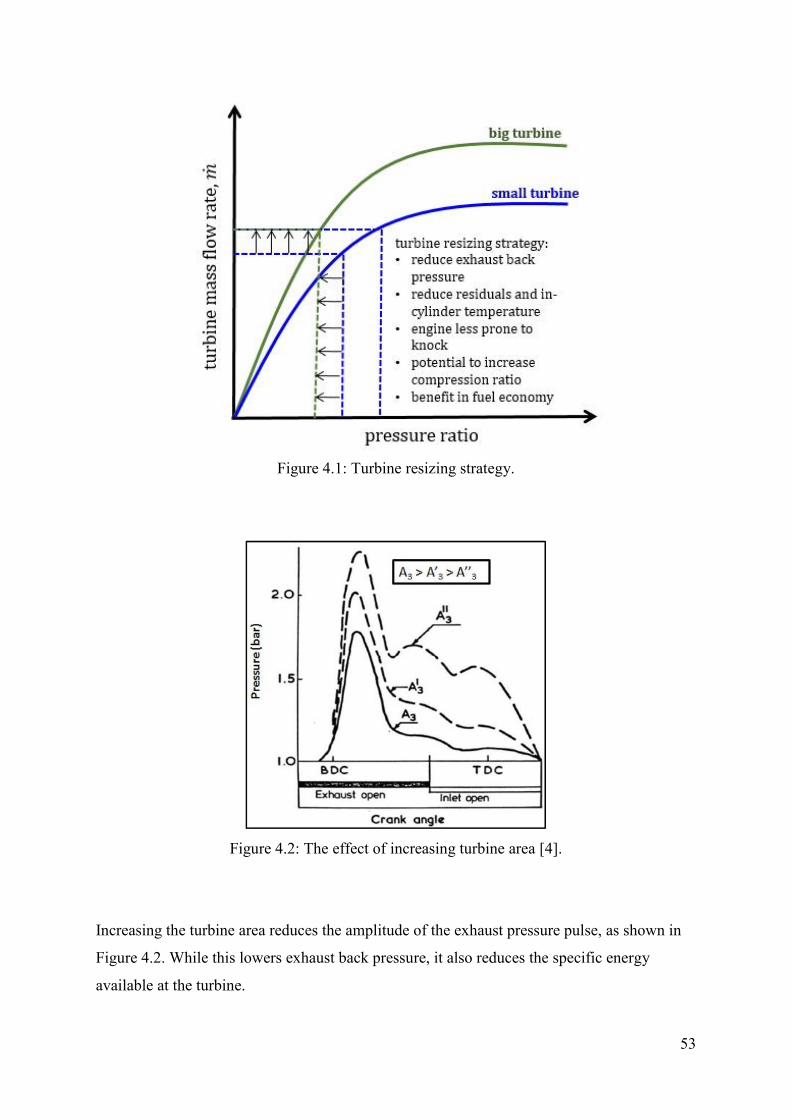
53
Figure 4.1: Turbine resizing strategy.
Figure 4.2: The effect of increasing turbine area [4].
Increasing the turbine area reduces the amplitude of the exhaust pressure pulse, as shown in
Figure 4.2. While this lowers exhaust back pressure, it also reduces the specific energy
available at the turbine.
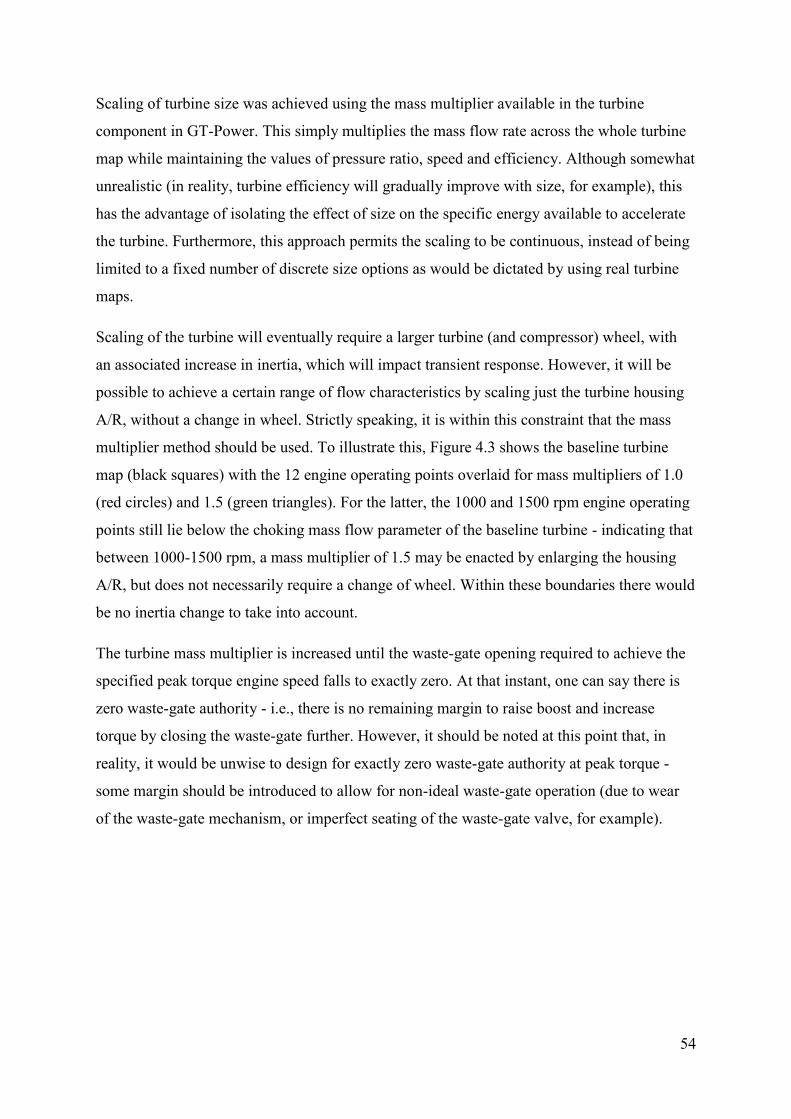
54
Scaling of turbine size was achieved using the mass multiplier available in the turbine
component in GT-Power. This simply multiplies the mass flow rate across the whole turbine
map while maintaining the values of pressure ratio, speed and efficiency. Although somewhat
unrealistic (in reality, turbine efficiency will gradually improve with size, for example), this
has the advantage of isolating the effect of size on the specific energy available to accelerate
the turbine. Furthermore, this approach permits the scaling to be continuous, instead of being
limited to a fixed number of discrete size options as would be dictated by using real turbine
maps.
Scaling of the turbine will eventually require a larger turbine (and compressor) wheel, with
an associated increase in inertia, which will impact transient response. However, it will be
possible to achieve a certain range of flow characteristics by scaling just the turbine housing
A/R, without a change in wheel. Strictly speaking, it is within this constraint that the mass
multiplier method should be used. To illustrate this, Figure 4.3 shows the baseline turbine
map (black squares) with the 12 engine operating points overlaid for mass multipliers of 1.0
(red circles) and 1.5 (green triangles). For the latter, the 1000 and 1500 rpm engine operating
points still lie below the choking mass flow parameter of the baseline turbine - indicating that
between 1000-1500 rpm, a mass multiplier of 1.5 may be enacted by enlarging the housing
A/R, but does not necessarily require a change of wheel. Within these boundaries there would
be no inertia change to take into account.
The turbine mass multiplier is increased until the waste-gate opening required to achieve the
specified peak torque engine speed falls to exactly zero. At that instant, one can say there is
zero waste-gate authority - i.e., there is no remaining margin to raise boost and increase
torque by closing the waste-gate further. However, it should be noted at this point that, in
reality, it would be unwise to design for exactly zero waste-gate authority at peak torque -
some margin should be introduced to allow for non-ideal waste-gate operation (due to wear
of the waste-gate mechanism, or imperfect seating of the waste-gate valve, for example).
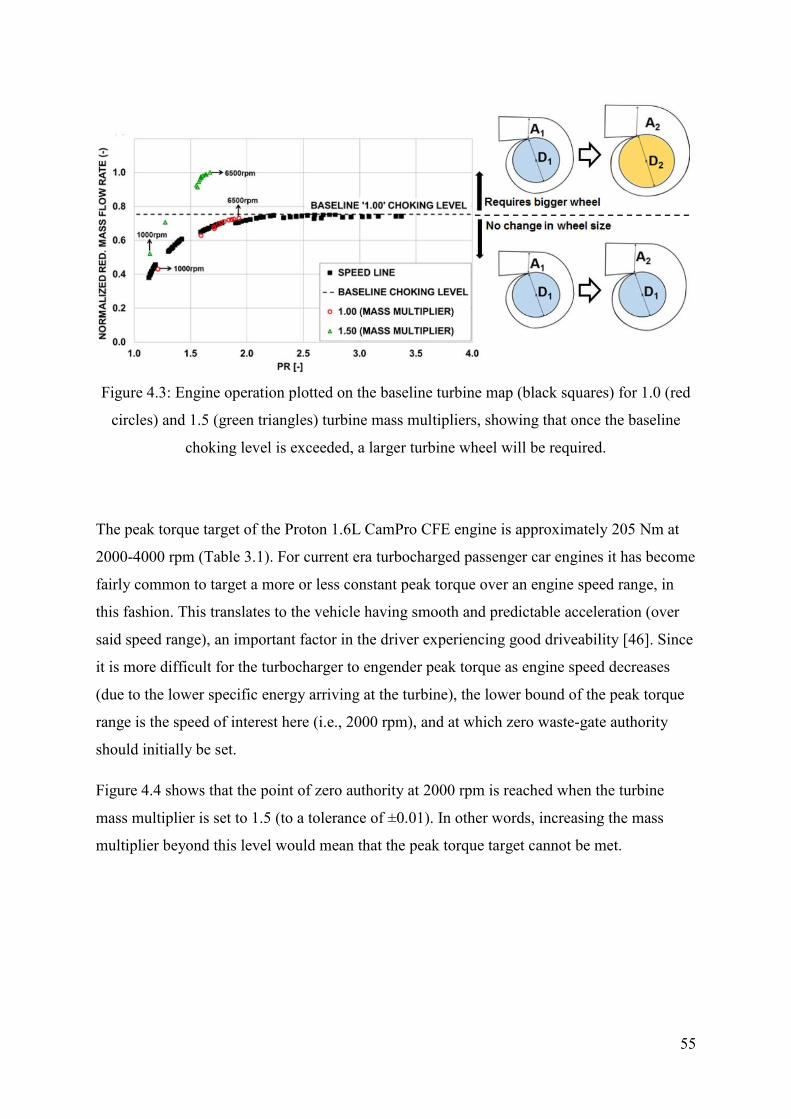
55
Figure 4.3: Engine operation plotted on the baseline turbine map (black squares) for 1.0 (red
circles) and 1.5 (green triangles) turbine mass multipliers, showing that once the baseline
choking level is exceeded, a larger turbine wheel will be required.
The peak torque target of the Proton 1.6L CamPro CFE engine is approximately 205 Nm at
2000-4000 rpm (Table 3.1). For current era turbocharged passenger car engines it has become
fairly common to target a more or less constant peak torque over an engine speed range, in
this fashion. This translates to the vehicle having smooth and predictable acceleration (over
said speed range), an important factor in the driver experiencing good driveability [46]. Since
it is more difficult for the turbocharger to engender peak torque as engine speed decreases
(due to the lower specific energy arriving at the turbine), the lower bound of the peak torque
range is the speed of interest here (i.e., 2000 rpm), and at which zero waste-gate authority
should initially be set.
Figure 4.4 shows that the point of zero authority at 2000 rpm is reached when the turbine
mass multiplier is set to 1.5 (to a tolerance of ±0.01). In other words, increasing the mass
multiplier beyond this level would mean that the peak torque target cannot be met.
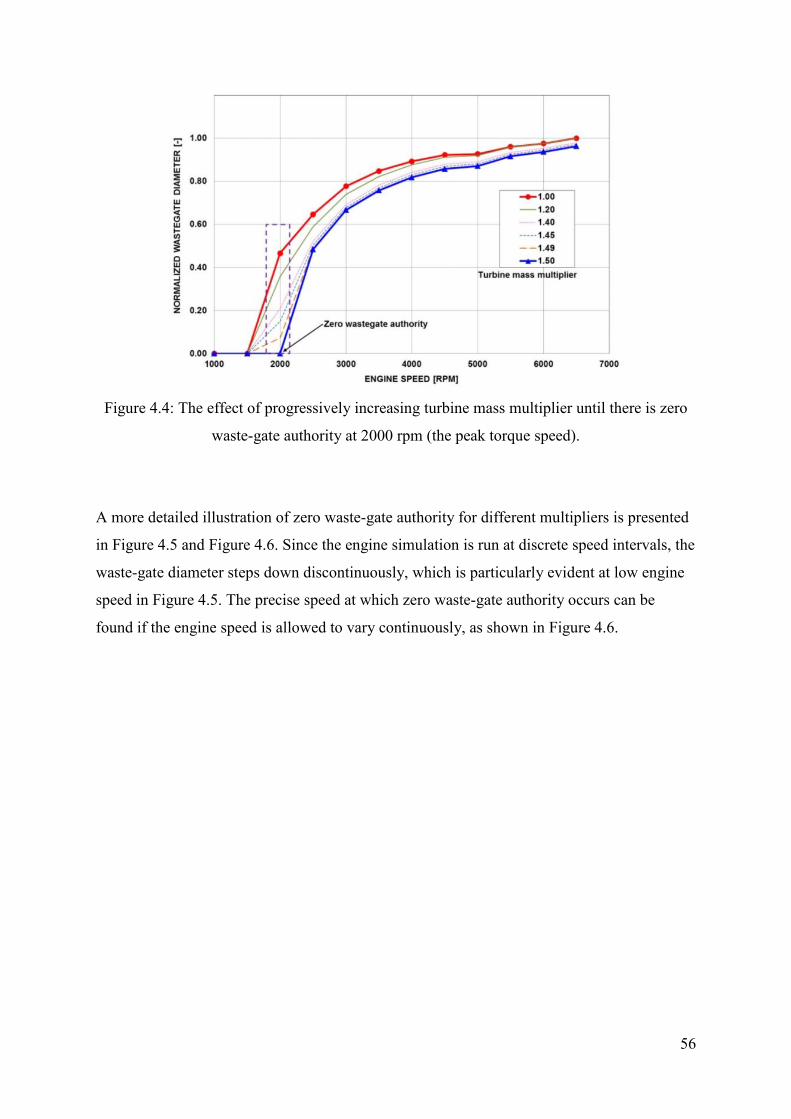
56
Figure 4.4: The effect of progressively increasing turbine mass multiplier until there is zero
waste-gate authority at 2000 rpm (the peak torque speed).
A more detailed illustration of zero waste-gate authority for different multipliers is presented
in Figure 4.5 and Figure 4.6. Since the engine simulation is run at discrete speed intervals, the
waste-gate diameter steps down discontinuously, which is particularly evident at low engine
speed in Figure 4.5. The precise speed at which zero waste-gate authority occurs can be
found if the engine speed is allowed to vary continuously, as shown in Figure 4.6.

57
Figure 4.5: The effect of turbine mass multiplier on the engine speed at which zero waste-
gate authority is reached: shows how waste-gate diameter falls in discontinuous steps as
engine speed reduces (or as mass multiplier increases).
Figure 4.6: The effect of turbine mass multiplier on the engine speed at which zero waste-
gate authority is reached: shows how continuous variation of engine speed will identify the
zero waste-gate authority speed precisely.

58
The intended effect of increasing turbine size is to reduce the residual gas trapped in the
cylinders. Figure 4.7 and Figure 4.8 show the improvement in residuals and the reduction of
exhaust pressure at all engine speeds, by increasing the turbine area (via the mass multiplier).
Figure 4.7: Effect of turbine size on in-cylinder residuals.
Figure 4.8: Effect of turbine size on exhaust pressure.
However, Figure 4.9 shows that the larger (1.5 mass multiplier) turbine causes a clear torque
deficit at speeds below 2000 rpm, compared to the baseline engine. Although the desired
torque at 1500 rpm is much lower than the peak torque, the re-sized turbocharger is unable to
59
provide as much boost as the original here. The brake torque at all engine speeds and the
torque deficit at 1500 rpm are presented in Figure 4.9 and Figure 4.10 respectively. This
difference would be perceptible to the driver and so a solution for recovering the “low-end”
torque is now required.
Figure 4.9: Brake torque versus engine speed for different mass multipliers.
Figure 4.10: Torque deficit at 1500 rpm for different mass multipliers.
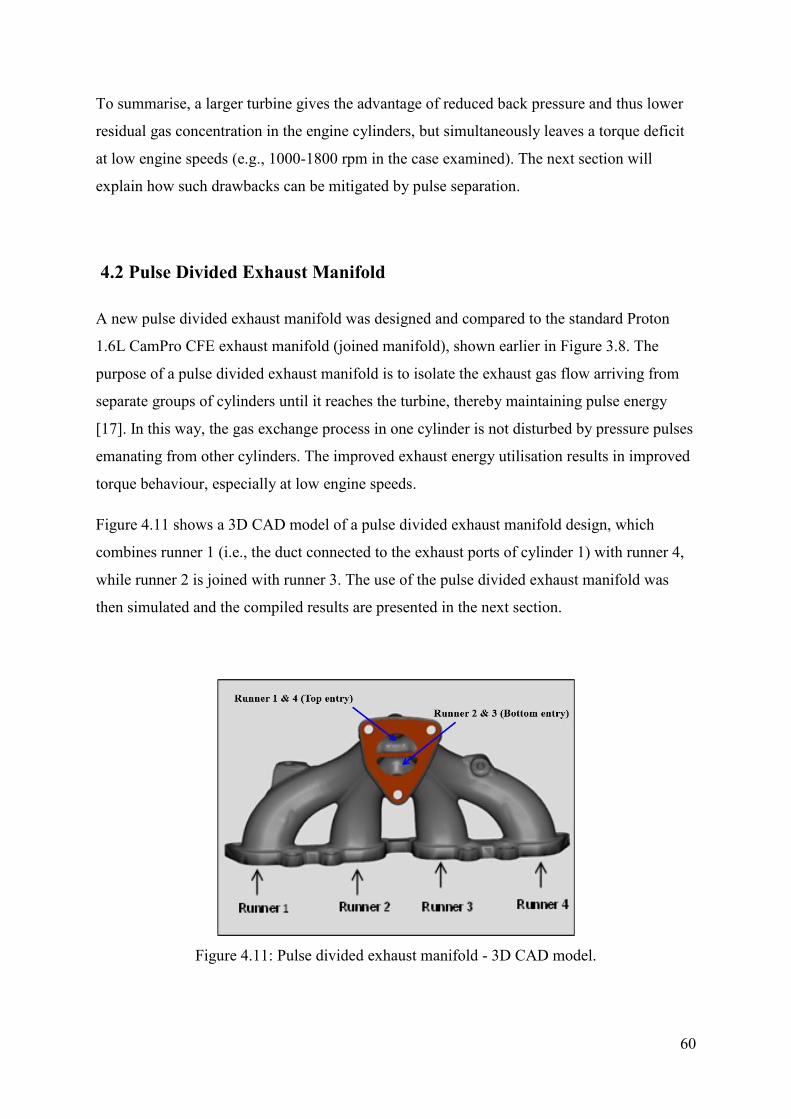
60
To summarise, a larger turbine gives the advantage of reduced back pressure and thus lower
residual gas concentration in the engine cylinders, but simultaneously leaves a torque deficit
at low engine speeds (e.g., 1000-1800 rpm in the case examined). The next section will
explain how such drawbacks can be mitigated by pulse separation.
4.2 Pulse Divided Exhaust Manifold
A new pulse divided exhaust manifold was designed and compared to the standard Proton
1.6L CamPro CFE exhaust manifold (joined manifold), shown earlier in Figure 3.8. The
purpose of a pulse divided exhaust manifold is to isolate the exhaust gas flow arriving from
separate groups of cylinders until it reaches the turbine, thereby maintaining pulse energy
[17]. In this way, the gas exchange process in one cylinder is not disturbed by pressure pulses
emanating from other cylinders. The improved exhaust energy utilisation results in improved
torque behaviour, especially at low engine speeds.
Figure 4.11 shows a 3D CAD model of a pulse divided exhaust manifold design, which
combines runner 1 (i.e., the duct connected to the exhaust ports of cylinder 1) with runner 4,
while runner 2 is joined with runner 3. The use of the pulse divided exhaust manifold was
then simulated and the compiled results are presented in the next section.
Figure 4.11: Pulse divided exhaust manifold - 3D CAD model.

61
4.3 Turbine Sizing with Pulse Divided Exhaust Manifold
A simulation study combining turbine matching and the pulse divided exhaust manifold was
carried out to investigate its potential to both preserve exhaust pulse energy and reduce
residual gas content. Using the pulse divided manifold, the preserved exhaust pulse energy is
substantially higher than that for the standard exhaust manifold and single-entry turbine. As a
consequence, exhaust back pressure and the residual gas trapped inside the combustion
chamber increased, and so the previously described method of turbine re-sizing was then
applied. Table 4.1 shows the four combinations that were investigated and described the
labels used in the next figures.
Table 4.1: Label description for figures below.
As shown in Figure 4.12, the use of the pulse divided manifold (label PD1.0) can easily
achieve the torque target at all speeds due to better preservation of exhaust pulse energy
entering the turbine. This can be described in Figure 4.15 where the result of turbine inlet
pressure of P.D1.0 is significantly higher. However, the high exhaust pressure of PD1.0
causes a significant increase in residual gas content and this is shown in Figure 4.14. The
preserved exhaust pulse energy is higher than the standard exhaust manifold and as a
consequence, engine back pressure and residual gas trapped in the combustion chamber will
increase, affecting the BSFC results (Figure 4.13). To remedy this problem, again the turbine
matching strategy were used in order to reduce engine back pressure while having adequate
high torque at low engine speed. In this study, the use of the pulse divided exhaust manifold
will permit the turbine mass multiplier to rise to 2.5, while the required torque at low engine
speeds is maintained (Figure 4.12). Based on simulation results, PD2.5 gives better engine
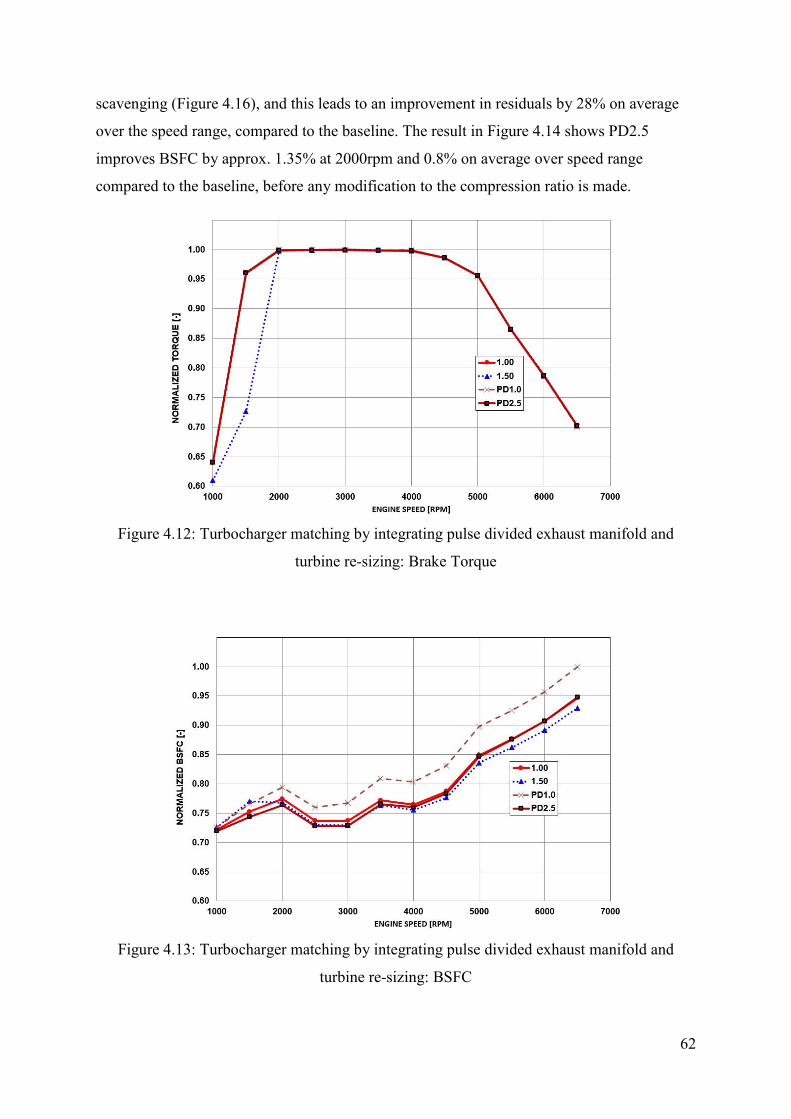
62
scavenging (Figure 4.16), and this leads to an improvement in residuals by 28% on average
over the speed range, compared to the baseline. The result in Figure 4.14 shows PD2.5
improves BSFC by approx. 1.35% at 2000rpm and 0.8% on average over speed range
compared to the baseline, before any modification to the compression ratio is made.
Figure 4.12: Turbocharger matching by integrating pulse divided exhaust manifold and
turbine re-sizing: Brake Torque
Figure 4.13: Turbocharger matching by integrating pulse divided exhaust manifold and
turbine re-sizing: BSFC
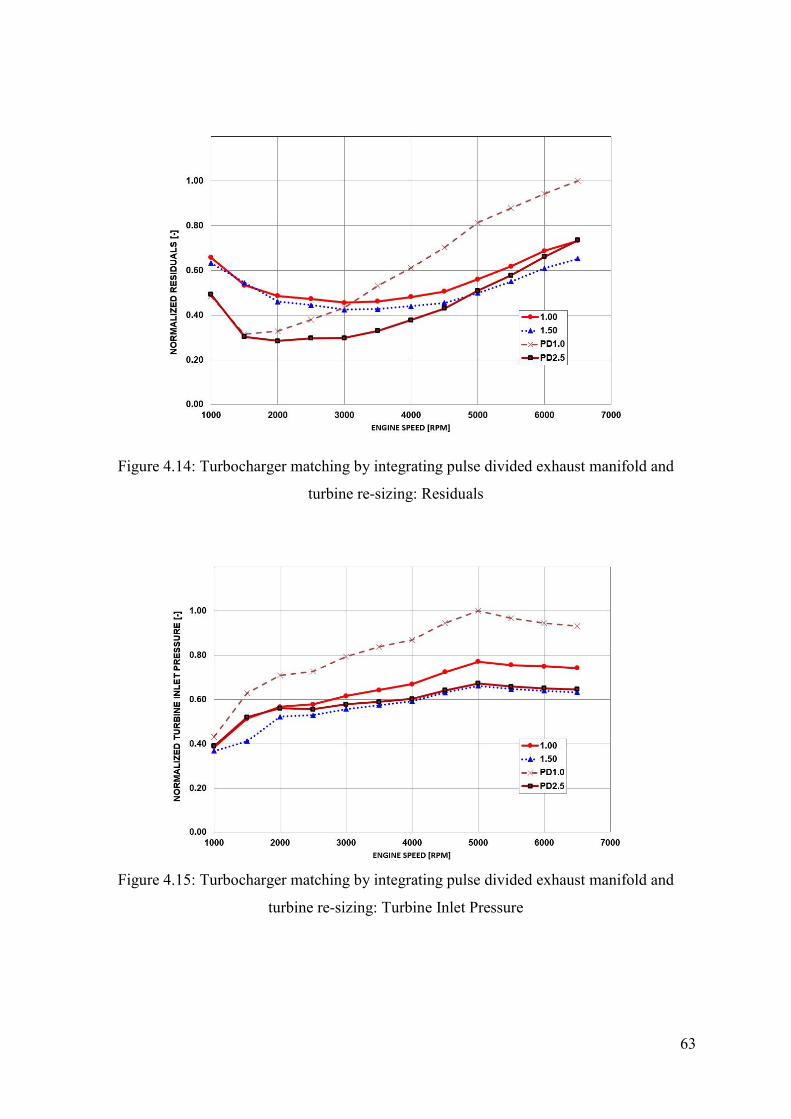
63
Figure 4.14: Turbocharger matching by integrating pulse divided exhaust manifold and
turbine re-sizing: Residuals
Figure 4.15: Turbocharger matching by integrating pulse divided exhaust manifold and
turbine re-sizing: Turbine Inlet Pressure
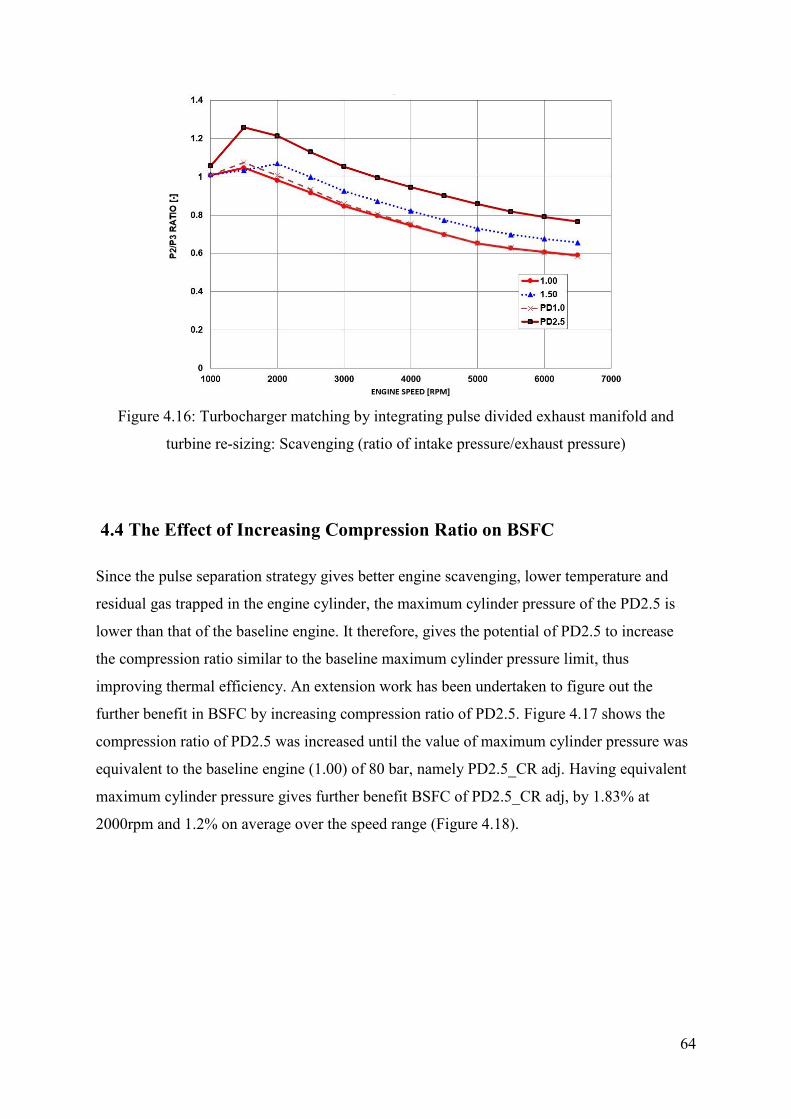
64
Figure 4.16: Turbocharger matching by integrating pulse divided exhaust manifold and
turbine re-sizing: Scavenging (ratio of intake pressure/exhaust pressure)
4.4 The Effect of Increasing Compression Ratio on BSFC
Since the pulse separation strategy gives better engine scavenging, lower temperature and
residual gas trapped in the engine cylinder, the maximum cylinder pressure of the PD2.5 is
lower than that of the baseline engine. It therefore, gives the potential of PD2.5 to increase
the compression ratio similar to the baseline maximum cylinder pressure limit, thus
improving thermal efficiency. An extension work has been undertaken to figure out the
further benefit in BSFC by increasing compression ratio of PD2.5. Figure 4.17 shows the
compression ratio of PD2.5 was increased until the value of maximum cylinder pressure was
equivalent to the baseline engine (1.00) of 80 bar, namely PD2.5_CR adj. Having equivalent
maximum cylinder pressure gives further benefit BSFC of PD2.5_CR adj, by 1.83% at
2000rpm and 1.2% on average over the speed range (Figure 4.18).
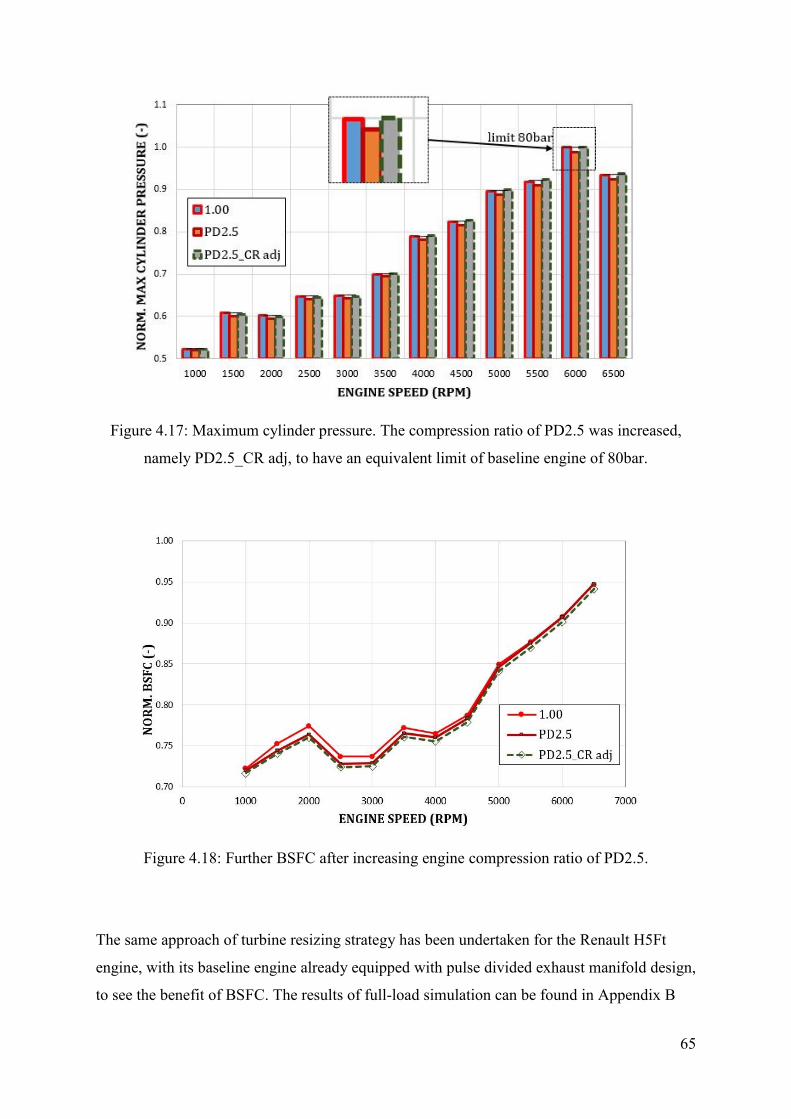
65
Figure 4.17: Maximum cylinder pressure. The compression ratio of PD2.5 was increased,
namely PD2.5_CR adj, to have an equivalent limit of baseline engine of 80bar.
Figure 4.18: Further BSFC after increasing engine compression ratio of PD2.5.
The same approach of turbine resizing strategy has been undertaken for the Renault H5Ft
engine, with its baseline engine already equipped with pulse divided exhaust manifold design,
to see the benefit of BSFC. The results of full-load simulation can be found in Appendix B
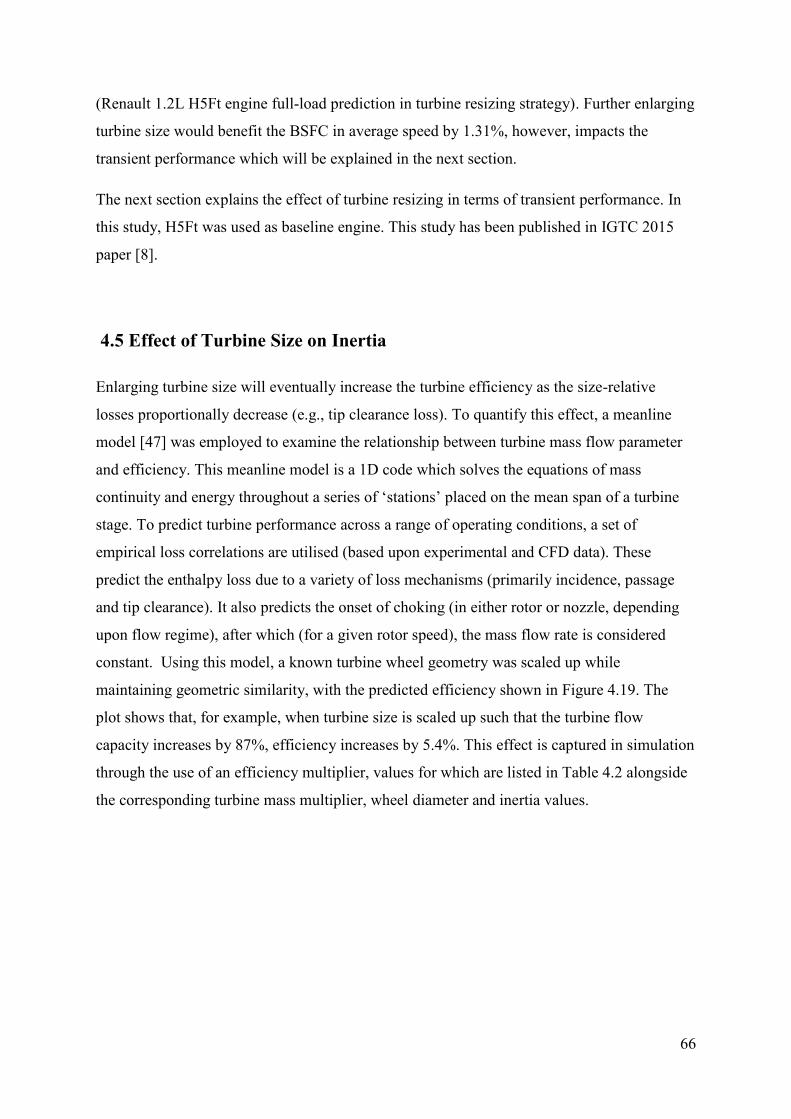
66
(Renault 1.2L H5Ft engine full-load prediction in turbine resizing strategy). Further enlarging
turbine size would benefit the BSFC in average speed by 1.31%, however, impacts the
transient performance which will be explained in the next section.
The next section explains the effect of turbine resizing in terms of transient performance. In
this study, H5Ft was used as baseline engine. This study has been published in IGTC 2015
paper [8].
4.5 Effect of Turbine Size on Inertia
Enlarging turbine size will eventually increase the turbine efficiency as the size-relative
losses proportionally decrease (e.g., tip clearance loss). To quantify this effect, a meanline
model [47] was employed to examine the relationship between turbine mass flow parameter
and efficiency. This meanline model is a 1D code which solves the equations of mass
continuity and energy throughout a series of ‘stations’ placed on the mean span of a turbine
stage. To predict turbine performance across a range of operating conditions, a set of
empirical loss correlations are utilised (based upon experimental and CFD data). These
predict the enthalpy loss due to a variety of loss mechanisms (primarily incidence, passage
and tip clearance). It also predicts the onset of choking (in either rotor or nozzle, depending
upon flow regime), after which (for a given rotor speed), the mass flow rate is considered
constant. Using this model, a known turbine wheel geometry was scaled up while
maintaining geometric similarity, with the predicted efficiency shown in Figure 4.19. The
plot shows that, for example, when turbine size is scaled up such that the turbine flow
capacity increases by 87%, efficiency increases by 5.4%. This effect is captured in simulation
through the use of an efficiency multiplier, values for which are listed in Table 4.2 alongside
the corresponding turbine mass multiplier, wheel diameter and inertia values.

67
Figure 4.19: Relationship between turbine mass flow parameter and turbine efficiency due to
scaling.
The turbine stage will choke wherever the smallest effective flow area occurs. For a
nozzleless turbine (as considered in this study), the maximum flow will be limited by choking
flow usually at the throat of the casing or at the rotor exit (where the turbine wheel outlet
diameter is specified) [4]. In this study, the turbine wheel outlet diameter dimension is used
to represent the effective size, in order to form a relationship between turbine mass multiplier
and turbine wheel diameter. The relationship between the turbine mass multiplier (TMM) and
turbine outlet diameter (TOD) is defined below and presented in Figure 4.20.
𝑇𝑂𝐷𝑛𝑒𝑤 = √𝑇𝑀𝑀𝑛𝑒𝑤
𝑇𝑀𝑀𝑏𝑎𝑠𝑒 𝑇𝑂𝐷𝑏𝑎𝑠𝑒 Equation 7
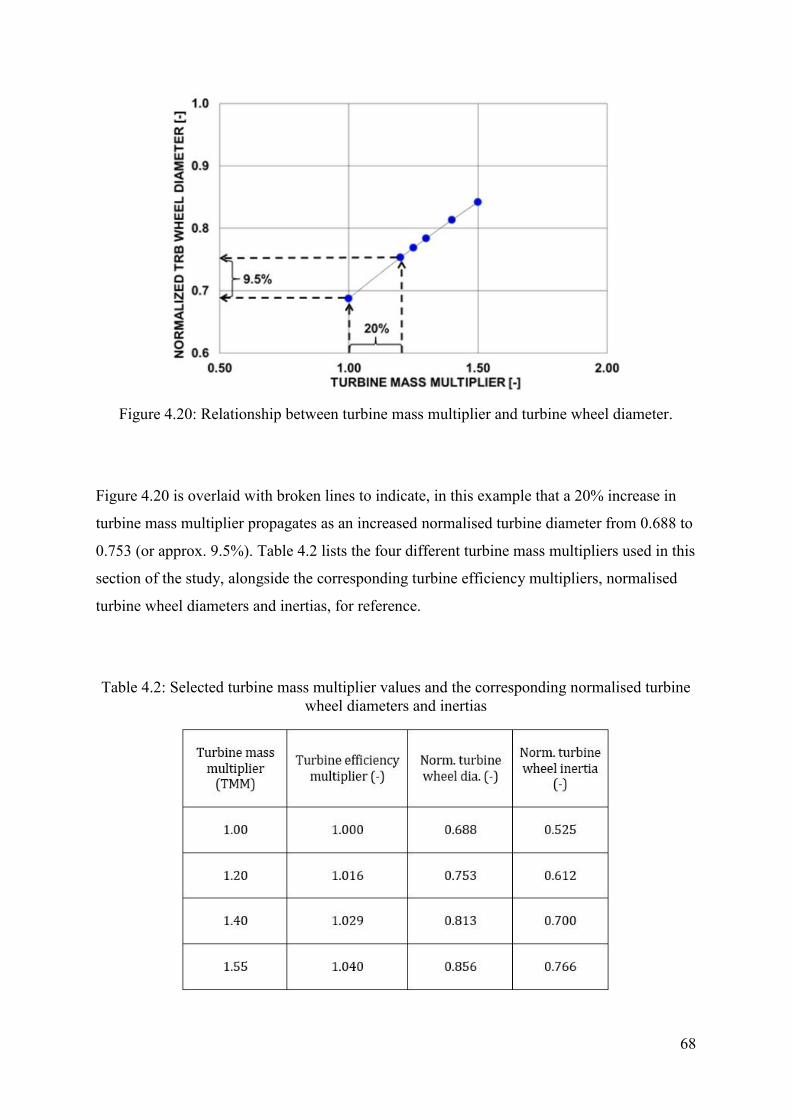
68
Figure 4.20: Relationship between turbine mass multiplier and turbine wheel diameter.
Figure 4.20 is overlaid with broken lines to indicate, in this example that a 20% increase in
turbine mass multiplier propagates as an increased normalised turbine diameter from 0.688 to
0.753 (or approx. 9.5%). Table 4.2 lists the four different turbine mass multipliers used in this
section of the study, alongside the corresponding turbine efficiency multipliers, normalised
turbine wheel diameters and inertias, for reference.
Table 4.2: Selected turbine mass multiplier values and the corresponding normalised turbine
wheel diameters and inertias
69
With real turbine inertia information for various turbine wheel diameters provided by a major
turbocharger supplier, the relationship between turbine wheel diameter and inertia can be
established and this is shown in Figure 4.21. In the aforementioned example where the
turbine mass multiplier is increased by 20% to give a 9.5% increase in turbine wheel diameter
(Figure 4.20), the broken lines overlaid on Figure 4.21 then translate this to an approx. 20%
increase in turbine wheel inertia. This correlation will now be used as a reference to link
turbine mass multiplier, turbine wheel diameter and turbine inertia in the transient engine
model.
Figure 4.21: Relationship between turbine wheel diameter and turbine inertia from real
turbocharger supplier data (blue circles).
4.6 Transient Performance
Four different turbine sizes (mass multipliers of 1.00, 1.20, 1.40 and 1.55) were simulated on
the Renault H5Ft engine, first by applying the baseline inertia (i.e., with no inertia adjustment
for size), and then with revised inertia values derived from the information in Figure 4.20 and
Figure 4.21. As mentioned before, the transient engine model is exercised at a number of
constant engine speeds while the demanded load steps from 2 bar BMEP to full-load, and the
time-to-torque response was measured at 90% of the maximum torque value for each speed.
One example is shown in Figure 4.22 for 1250 rpm only, where the effect of increasing
turbine size (i.e., mass multiplier) is to delay the time-to-torque and the effect of
incorporating an appropriate rise in inertia delays the response time even more.
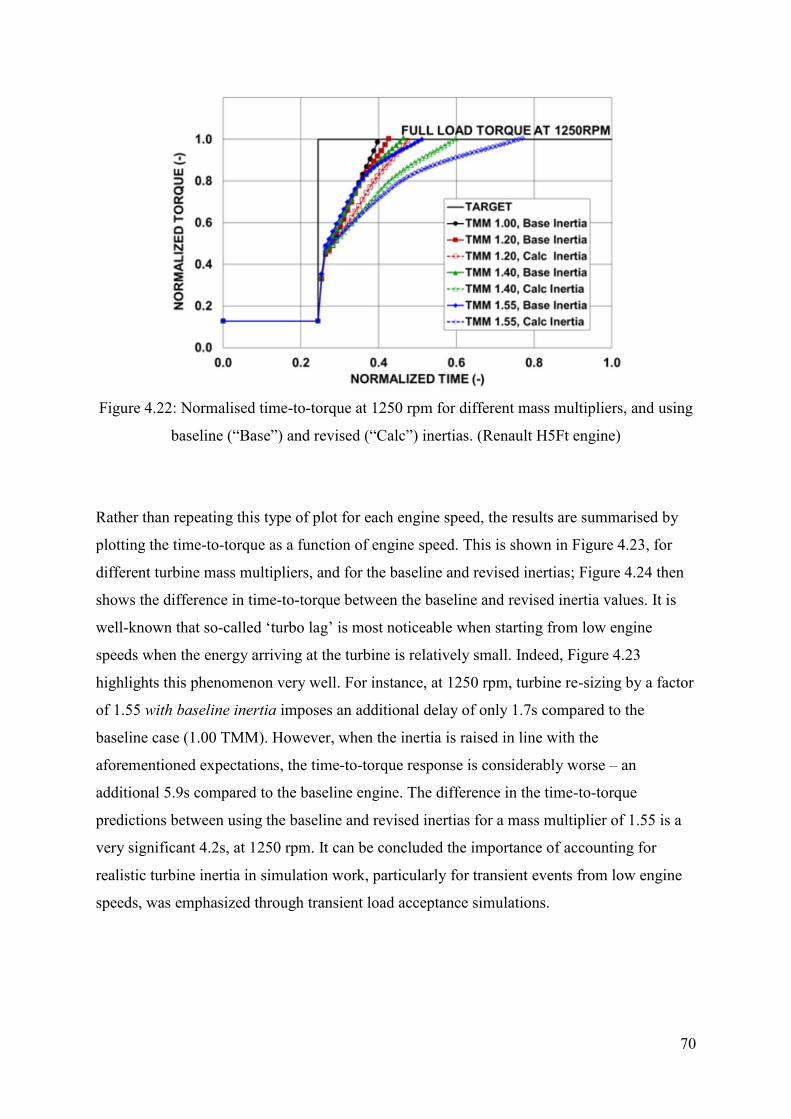
70
Figure 4.22: Normalised time-to-torque at 1250 rpm for different mass multipliers, and using
baseline (“Base”) and revised (“Calc”) inertias. (Renault H5Ft engine)
Rather than repeating this type of plot for each engine speed, the results are summarised by
plotting the time-to-torque as a function of engine speed. This is shown in Figure 4.23, for
different turbine mass multipliers, and for the baseline and revised inertias; Figure 4.24 then
shows the difference in time-to-torque between the baseline and revised inertia values. It is
well-known that so-called ‘turbo lag’ is most noticeable when starting from low engine
speeds when the energy arriving at the turbine is relatively small. Indeed, Figure 4.23
highlights this phenomenon very well. For instance, at 1250 rpm, turbine re-sizing by a factor
of 1.55 with baseline inertia imposes an additional delay of only 1.7s compared to the
baseline case (1.00 TMM). However, when the inertia is raised in line with the
aforementioned expectations, the time-to-torque response is considerably worse – an
additional 5.9s compared to the baseline engine. The difference in the time-to-torque
predictions between using the baseline and revised inertias for a mass multiplier of 1.55 is a
very significant 4.2s, at 1250 rpm. It can be concluded the importance of accounting for
realistic turbine inertia in simulation work, particularly for transient events from low engine
speeds, was emphasized through transient load acceptance simulations.
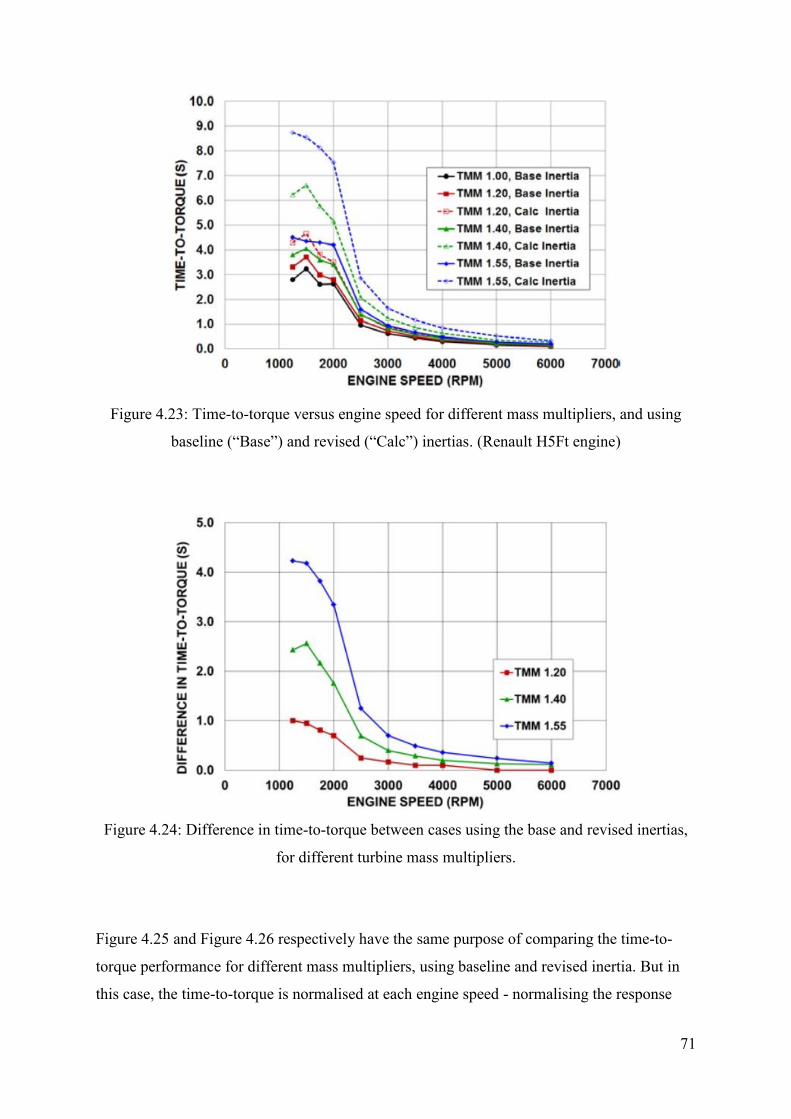
71
Figure 4.23: Time-to-torque versus engine speed for different mass multipliers, and using
baseline (“Base”) and revised (“Calc”) inertias. (Renault H5Ft engine)
Figure 4.24: Difference in time-to-torque between cases using the base and revised inertias,
for different turbine mass multipliers.
Figure 4.25 and Figure 4.26 respectively have the same purpose of comparing the time-to-
torque performance for different mass multipliers, using baseline and revised inertia. But in
this case, the time-to-torque is normalised at each engine speed - normalising the response
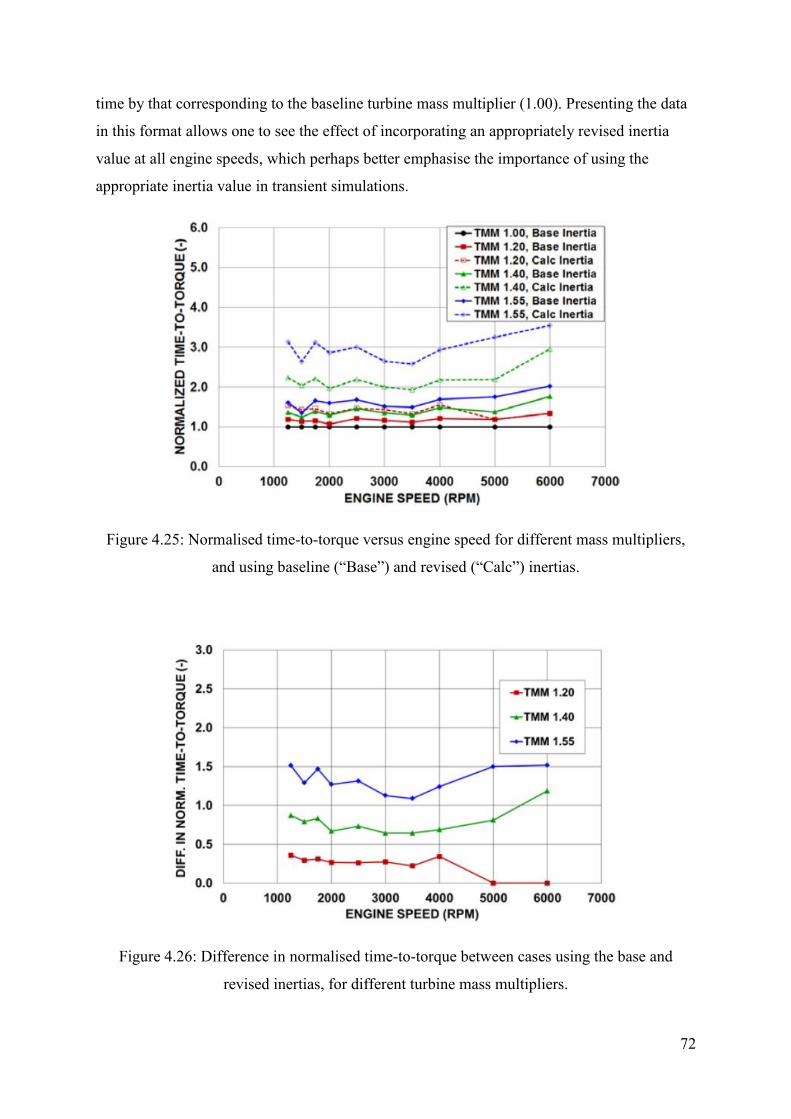
72
time by that corresponding to the baseline turbine mass multiplier (1.00). Presenting the data
in this format allows one to see the effect of incorporating an appropriately revised inertia
value at all engine speeds, which perhaps better emphasise the importance of using the
appropriate inertia value in transient simulations.
Figure 4.25: Normalised time-to-torque versus engine speed for different mass multipliers,
and using baseline (“Base”) and revised (“Calc”) inertias.
Figure 4.26: Difference in normalised time-to-torque between cases using the base and
revised inertias, for different turbine mass multipliers.
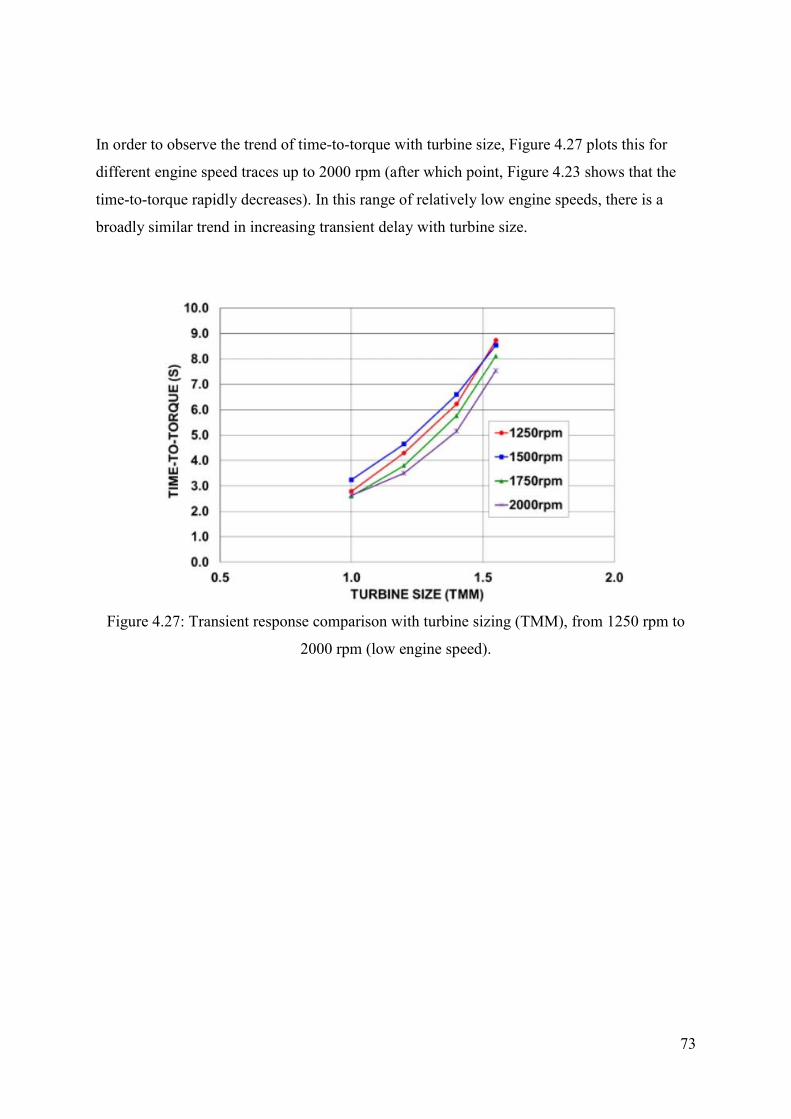
73
In order to observe the trend of time-to-torque with turbine size, Figure 4.27 plots this for
different engine speed traces up to 2000 rpm (after which point, Figure 4.23 shows that the
time-to-torque rapidly decreases). In this range of relatively low engine speeds, there is a
broadly similar trend in increasing transient delay with turbine size.
Figure 4.27: Transient response comparison with turbine sizing (TMM), from 1250 rpm to
2000 rpm (low engine speed).
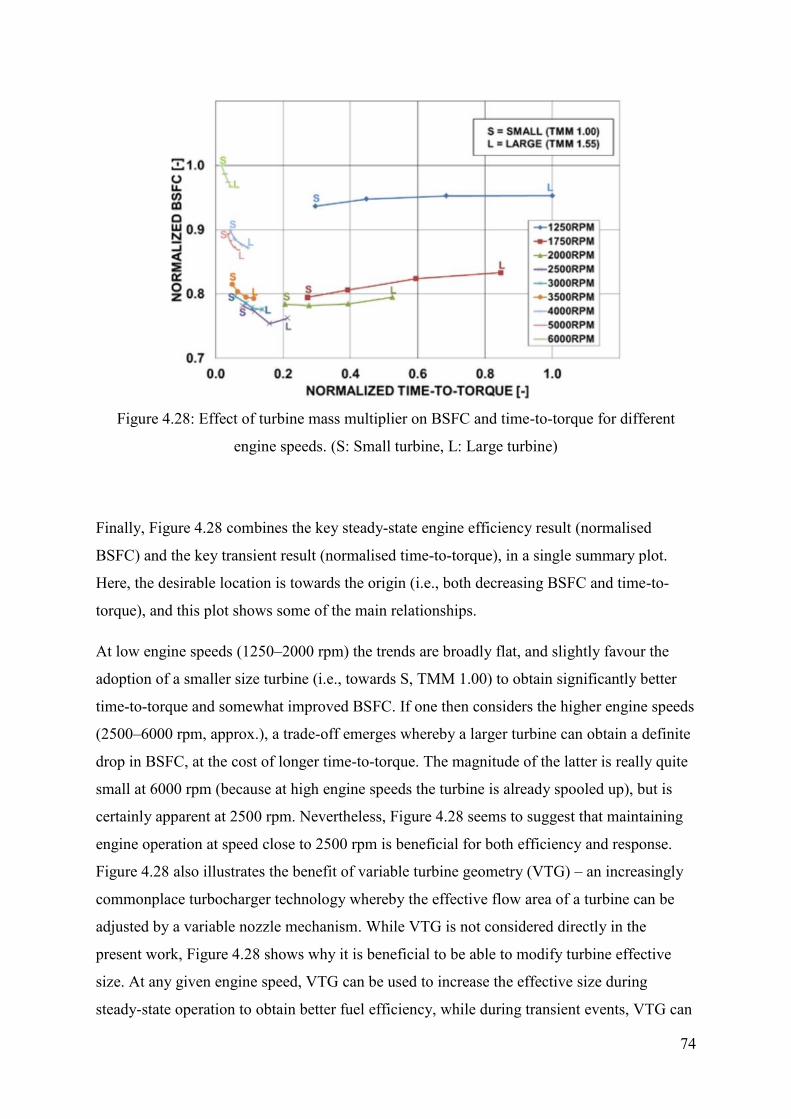
74
Figure 4.28: Effect of turbine mass multiplier on BSFC and time-to-torque for different
engine speeds. (S: Small turbine, L: Large turbine)
Finally, Figure 4.28 combines the key steady-state engine efficiency result (normalised
BSFC) and the key transient result (normalised time-to-torque), in a single summary plot.
Here, the desirable location is towards the origin (i.e., both decreasing BSFC and time-to-
torque), and this plot shows some of the main relationships.
At low engine speeds (1250–2000 rpm) the trends are broadly flat, and slightly favour the
adoption of a smaller size turbine (i.e., towards S, TMM 1.00) to obtain significantly better
time-to-torque and somewhat improved BSFC. If one then considers the higher engine speeds
(2500–6000 rpm, approx.), a trade-off emerges whereby a larger turbine can obtain a definite
drop in BSFC, at the cost of longer time-to-torque. The magnitude of the latter is really quite
small at 6000 rpm (because at high engine speeds the turbine is already spooled up), but is
certainly apparent at 2500 rpm. Nevertheless, Figure 4.28 seems to suggest that maintaining
engine operation at speed close to 2500 rpm is beneficial for both efficiency and response.
Figure 4.28 also illustrates the benefit of variable turbine geometry (VTG) – an increasingly
commonplace turbocharger technology whereby the effective flow area of a turbine can be
adjusted by a variable nozzle mechanism. While VTG is not considered directly in the
present work, Figure 4.28 shows why it is beneficial to be able to modify turbine effective
size. At any given engine speed, VTG can be used to increase the effective size during
steady-state operation to obtain better fuel efficiency, while during transient events, VTG can

75
be actuated to reduce the turbine’s effective size for better response (time-to-torque), though
with an associated fuel efficiency penalty. Indeed, this is the underlying reason to find VTG
technology in some automotive applications.
4.7 Summary
This study has proposed a scaled turbine matching method and has evaluated its effectiveness
in the form of a simulation study on a Proton 1.6L CFE engine (full-load) and a Renault 1.2L
H5Ft engine (transient) using the 1D engine simulation tool, GT-Power. Therefore, a method
of turbocharger matching by integrating pulse separation with turbine matching is proposed.
A new pulse divided exhaust manifold is designed to preserve exhaust energy entering the
turbine, thus improving torque behaviour especially at low engine speeds. The turbine is then
re-sized larger in order to reduce exhaust back pressure and the in-cylinder residual gas
concentration (with associated benefits for knock). It was shown that using the turbine mass
multiplier (with corresponding meanline-predicted turbine efficiency multiplier) to up-scale
the turbine until the point of zero waste-gate authority at the peak torque speed is a sensible
approach to achieving useful reductions in engine back pressure and the level of residual gas
trapped in the engine cylinders, while maintaining the original torque target. This improved
engine scavenging reduced residual gas content by 28% on average over the engine speed
range, while the brake specific fuel consumption (BSFC) can be improved by 1.35% at
2000rpm and 0.8% on average speed before any compression ratio adjustments have been
made. Increasing the compression ratio of the engine up to the similar maximum cylinder
pressure of the baseline engine enables the BSFC to further improve by 1.83% at 2000 rpm
and 1.2% on average over the speed range.
A turbine resizing approach has been conducted to the 1.2L Renault H5Ft engine, of which
the baseline engine is already equipped with the pulse divided exhaust manifold. This work is
carried out to see the effect of transient response by considering the real turbine inertia
information for various turbine wheel diameters provided by the major turbocharger supplier
(Table 4.2). Having established the relationship between turbine mass multiplier, turbine
efficiency multiplier, turbine wheel diameter, and turbine inertia, the importance of
accounting for realistic turbine inertia, particularly for transient events from low engine
speeds, was emphasised through transient load acceptance simulations. For instance, the
76
combined effect of a 1.55 times larger turbine and the associated inertia increase was shown
to delay time-to-torque response by up to 3.5 times (Figure 4.25). While such large delays are
unlikely to be acceptable to the engine OEM, the point of this continuous scaling matching
method is that the turbine mass multiplier could be optimised to obtain the desired balance
between fuel economy and transient response, as illustrated in Figure 4.28. Alternatively,
matching simulation results may show a large benefit (for both steady-state fuel efficiency
and transient response) in being able to dynamically vary turbine effective size, thereby
building a case for variable turbine geometry technology in a particular application.
Further transient response and BSFC benefit could be gained by implementing an ETA
system on the turbocharger shaft, therefore the function of waste-gate that bypass the surplus
exhaust energy to the turbine outlet can be eliminated, and the speed at low engine speed can
be electrically controlled. This work is presented in subsection 6.1 Electric Turbo Assist
(ETA) System.
77
Chapter 5: Waste-gate Modelling
5.1 Introduction
This chapter presents the investigation into the effect of the waste-gate on the turbine
performance. In a waste-gated turbine the flow is split between (1) the flow that goes into the
turbine rotor, and (2) the flow that bypasses the turbine via the waste-gate channel. In
general, the turbine map (measured with the waste-gate fully shut) are available courtesy of
OEMs but for waste-gated systems no performance figures are available that can be used for
simulations. Therefore, one of the objectives of this study is to measure the performance of
the turbine at different waste-gate areas. Experimental work for a waste-gated single scroll
turbine has been conducted with multiple waste-gate opening positions, investigating the
waste-gate flow characteristics to see the effect on the turbine performance. Following the
experimental work, the outcomes of the experimental data (mass flow parameter, pressure
ratio, and efficiency parameter and the calculation of discharge coefficients) were used as
inputs in the waste-gate model to determine how the waste-gate can be represented in the 1D
simulation. The validated waste-gate model was then built into an engine model to assess its
impact on the overall engine performance.
5.2 Waste-gate experimental work
Figure 5.1 shows a waste-gated single scroll turbine (turbine wheel diameter of 35.5mm)
which was installed on a hot gas stand. The test bench has specifications given in Table 5.1
below. The maximum pressure is limited by the test bench less than 5 bar absolute. Further
experimental setup figures can be found in Appendix C (Waste-gate Experimental Setup).
Three types of testing were conducted, which include a baseline hot testing with closed
waste-gate, hot testing with open waste-gate and cold flow testing with open waste-gate.
Table 5.1: Hot gas stand specifications
Bench Name AVL Hot Gas Stand
Power 200kW
Flow Range 36-1000kg/h
Maximum Temperature 1200C
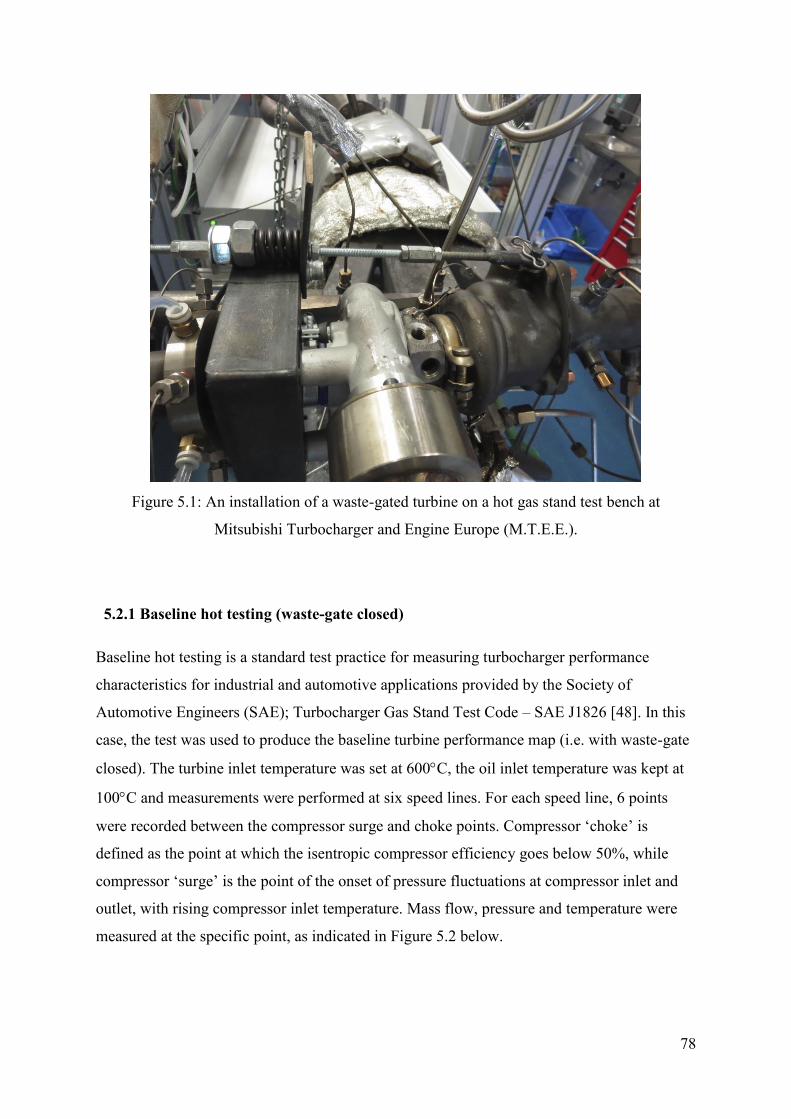
78
Figure 5.1: An installation of a waste-gated turbine on a hot gas stand test bench at
Mitsubishi Turbocharger and Engine Europe (M.T.E.E.).
5.2.1 Baseline hot testing (waste-gate closed)
Baseline hot testing is a standard test practice for measuring turbocharger performance
characteristics for industrial and automotive applications provided by the Society of
Automotive Engineers (SAE); Turbocharger Gas Stand Test Code – SAE J1826 [48]. In this
case, the test was used to produce the baseline turbine performance map (i.e. with waste-gate
closed). The turbine inlet temperature was set at 600C, the oil inlet temperature was kept at
100C and measurements were performed at six speed lines. For each speed line, 6 points
were recorded between the compressor surge and choke points. Compressor ‘choke’ is
defined as the point at which the isentropic compressor efficiency goes below 50%, while
compressor ‘surge’ is the point of the onset of pressure fluctuations at compressor inlet and
outlet, with rising compressor inlet temperature. Mass flow, pressure and temperature were
measured at the specific point, as indicated in Figure 5.2 below.
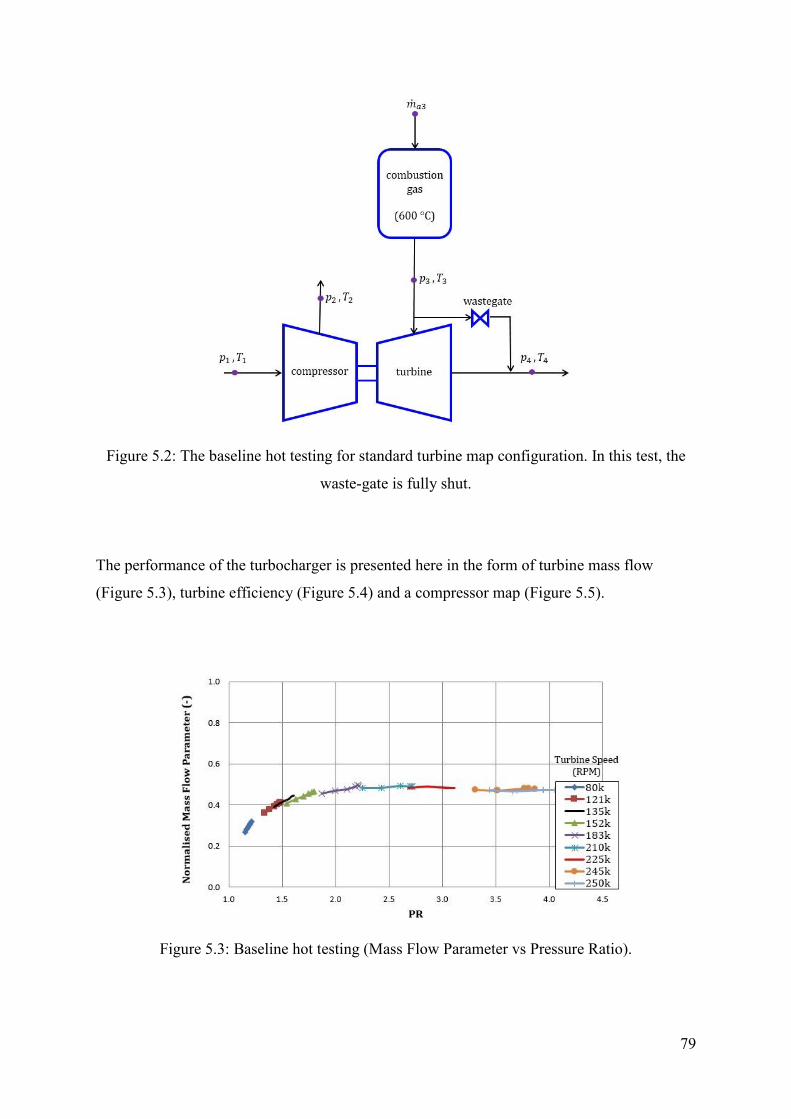
79
Figure 5.2: The baseline hot testing for standard turbine map configuration. In this test, the
waste-gate is fully shut.
The performance of the turbocharger is presented here in the form of turbine mass flow
(Figure 5.3), turbine efficiency (Figure 5.4) and a compressor map (Figure 5.5).
Figure 5.3: Baseline hot testing (Mass Flow Parameter vs Pressure Ratio).

80
Figure 5.3 displays the normalised mass flow parameter over turbine expansion ratio at nine
rotor speeds with six points plotted for each speed line. Mass flow parameter is a pseudo-
dimensionless parameter to eliminate the influence of total inlet pressure, 𝑇03 and total inlet
temperature, 𝑃03 in the turbine. The mass flow parameter is defined as;
𝑀𝑎𝑠𝑠 𝐹𝑙𝑜𝑤 𝑃𝑎𝑟𝑎𝑚𝑒𝑡𝑒𝑟 (𝑀𝐹𝑃) =�̇�𝑎𝑐𝑡𝑢𝑎𝑙√𝑇03
𝑃03 Equation 8
It can be seen that at a turbine expansion ratio of 3.0, the mass flow is no longer increased
even though the rotor speed is increased. In these cases, the flow in the turbine is said to be
choked. There is a maximum mass flow limit when the Mach number is equal to 1. It is
important to identify the choke flow of the turbine because it will have a direct impact on
compressor and hence, the engine intake. The mass flow through the turbine depends on the
effective flow area of the turbine.
Figure 5.4: Baseline hot testing (Efficiency vs Pressure Ratio).
Figure 5.4 plots the normalised turbine efficiency against turbine expansion ratio at various
rotor speeds. The points are obtained by measuring the thermodynamic characteristics of the
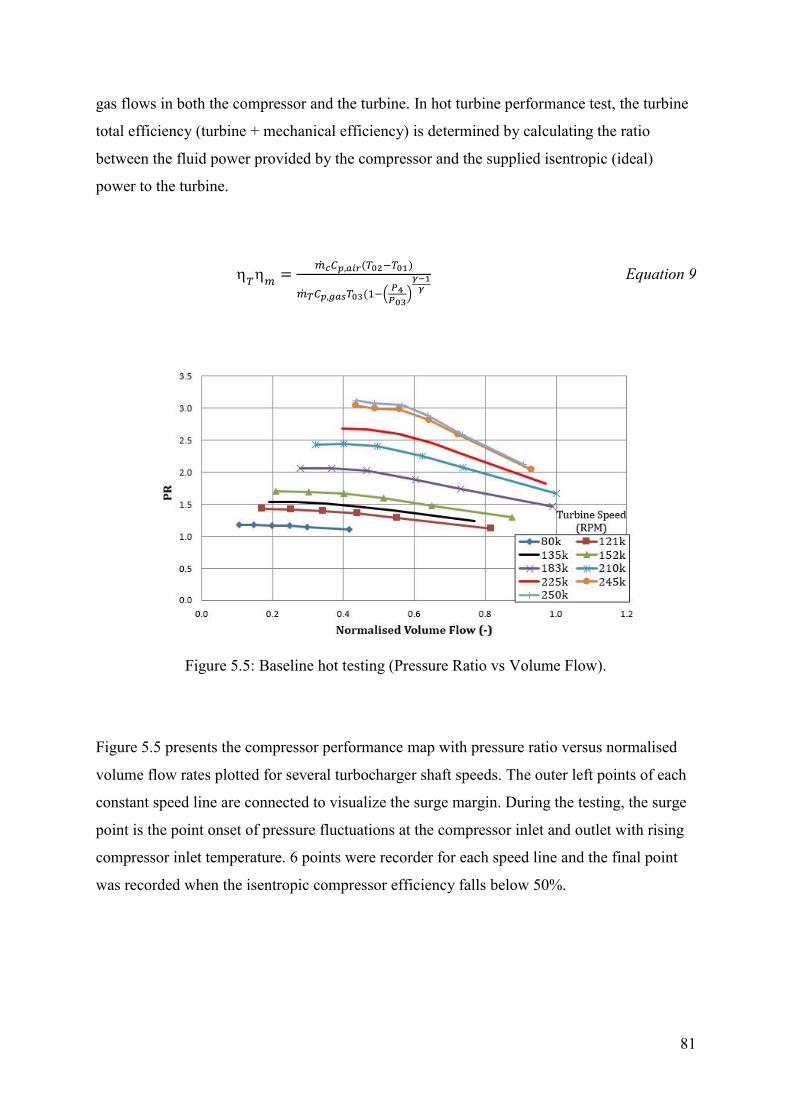
81
gas flows in both the compressor and the turbine. In hot turbine performance test, the turbine
total efficiency (turbine + mechanical efficiency) is determined by calculating the ratio
between the fluid power provided by the compressor and the supplied isentropic (ideal)
power to the turbine.
𝑇
𝑚=
�̇�𝑐𝐶𝑝,𝑎𝑖𝑟(𝑇02−𝑇01)
�̇�𝑇𝐶𝑝,𝑔𝑎𝑠𝑇03(1−(𝑃4𝑃03
)
𝛾−1𝛾
Equation 9
Figure 5.5: Baseline hot testing (Pressure Ratio vs Volume Flow).
Figure 5.5 presents the compressor performance map with pressure ratio versus normalised
volume flow rates plotted for several turbocharger shaft speeds. The outer left points of each
constant speed line are connected to visualize the surge margin. During the testing, the surge
point is the point onset of pressure fluctuations at the compressor inlet and outlet with rising
compressor inlet temperature. 6 points were recorder for each speed line and the final point
was recorded when the isentropic compressor efficiency falls below 50%.

82
5.2.2 Hot testing (waste-gate open)
The next experimental test was designed to see the effect of waste-gate on the turbine
performance. The configuration for this test is similar to that in Figure 5.2 except that in this
test the waste-gate is opened. Here, the flow is split at the waste-gate channel and the flow
distribution between turbine and waste-gate depends on the opening angle of the waste-gate.
The waste-gate opening angle, which is representative of the area of the waste-gate valve has
been set to 5%, 10%, 30%, 50% and 100% of the maximum. The definition of the waste-gate
opening is given in Figure 5.6. The degree of waste-gate valve opening angle was measured
in the Solidworks software, and based on the turbocharger specification, a waste-gate opening
angle of 100% represents an equivalent diameter of the waste-gate effective area that is equal
to the diameter of the waste-gate channel. ‘Hardstop’ occurs when the waste-gate flap valve
is fully opened to its point of contact with the turbine housing. This is, in practice, very
unlikely to occur at any engine operating condition. The hot testing has been conducted at
specific pressure ratios and speeds with a turbine inlet temperature of 600C, as described in
Table 5.2. The outcomes of the test have been plotted in the ensuing figures.
Table 5.2: Hot testing experimental setup
WG Opening
Angle, α (%)
Turbine
Pressure Ratio
Speed Turbine Inlet Temperature,
T03 (C)
5%
PR 1.5
PR 2.0
PR 3.0
135000 rpm
180000 rpm
225000 rpm
600C
10%
PR 1.5
PR 2.0
PR 3.0
135000 rpm
180000 rpm
225000 rpm
600C
30%
PR 1.5
PR 2.0
PR 3.0
135000 rpm
180000 rpm
225000 rpm
600C
50%
PR 1.5
PR 2.0
PR 3.0
135000 rpm
180000 rpm
225000 rpm
600C
100%
PR 1.5
PR 2.0
PR 3.0
135000 rpm
180000 rpm
225000 rpm
600C
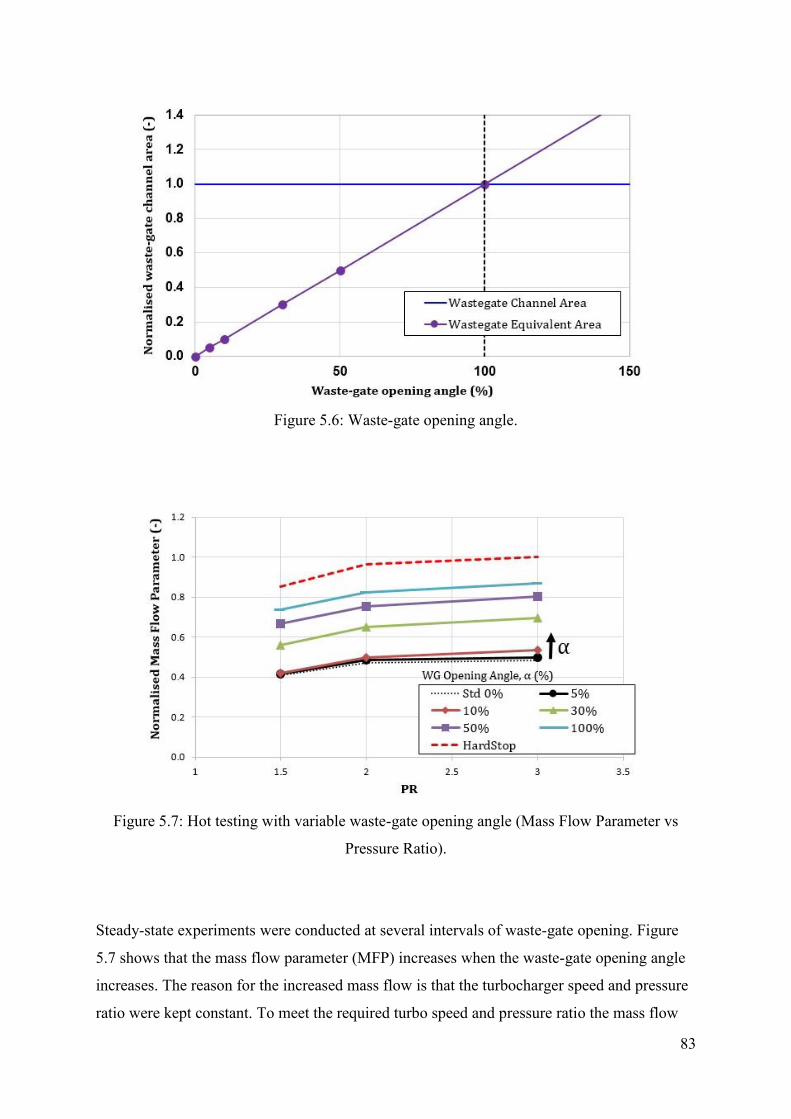
83
Figure 5.6: Waste-gate opening angle.
Figure 5.7: Hot testing with variable waste-gate opening angle (Mass Flow Parameter vs
Pressure Ratio).
Steady-state experiments were conducted at several intervals of waste-gate opening. Figure
5.7 shows that the mass flow parameter (MFP) increases when the waste-gate opening angle
increases. The reason for the increased mass flow is that the turbocharger speed and pressure
ratio were kept constant. To meet the required turbo speed and pressure ratio the mass flow

84
had to increase. When the opening angle of the waste gate valve increases the mass flow
through the turbine increases as well. When a bypass valve is opened, the inlet pressure of the
turbine will decrease due to increased turbine area, but in this case, the pressure ratio and
speed were kept constant, and therefore the mass flow through the turbine had to be
increased. The effect on waste-gate opening on the mass flow parameter on baseline turbine
performance map is plotted in Figure 5.8.
Figure 5.8: Effect of increasing waste-gate opening angle on baseline turbine performance
map (Mass Flow Parameter vs Pressure Ratio).
Figure 5.9 below shows that the value of turbine efficiency decreases when the waste-gate
opening angle increases, due to the fact that less mass flow goes through the turbine rotor. To
keep the pressure ratio constant, the mass flow had to be increased. However, due to waste-
gate flow, the amount of flow through the turbine scroll in percentages decreases compared to
the total turbine flow. This explains why the turbine efficiency decreases (Equation 10).
Turbine mass flow rate �̇�𝑒 increases when waste-gate is opened and therefore the turbine
efficiency 𝑇
decreases. The effect of waste-gate opening on baseline efficiency performance
map also can be seen in Figure 5.10.
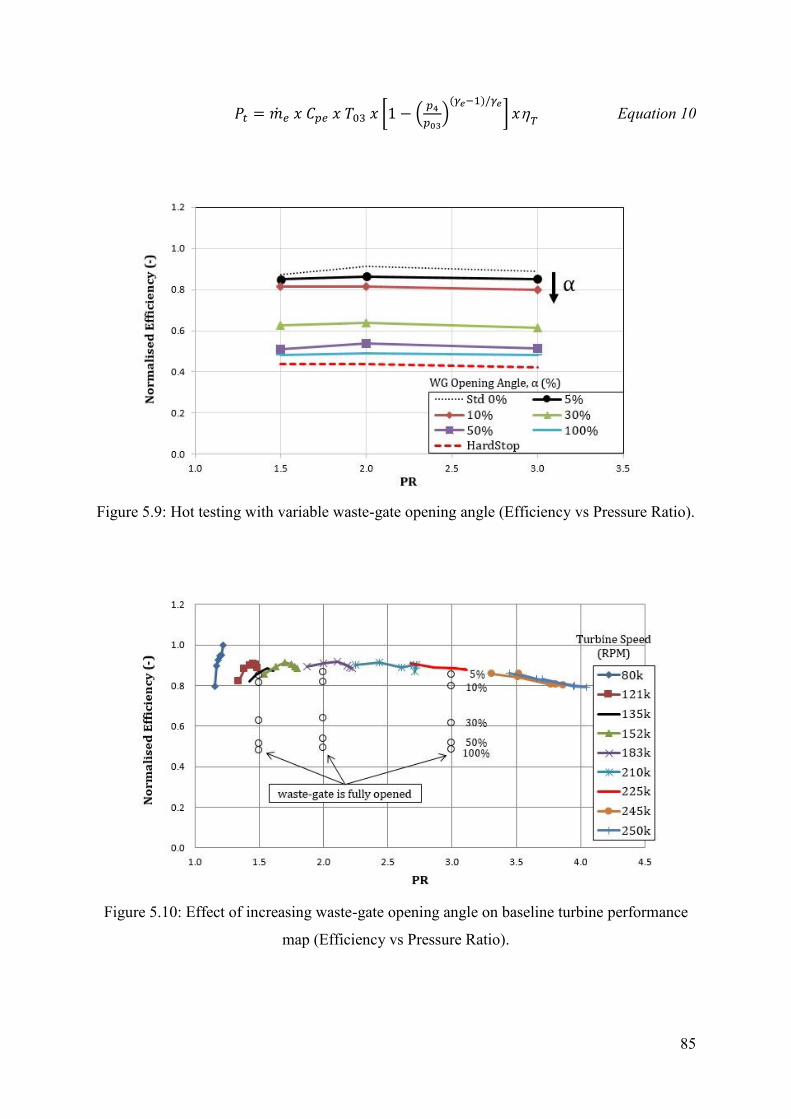
85
𝑃𝑡 = �̇�𝑒 𝑥 𝐶𝑝𝑒 𝑥 𝑇03 𝑥 [1 − (𝑝4
𝑝03)(𝛾𝑒−1)/𝛾𝑒
] 𝑥𝑇
Equation 10
Figure 5.9: Hot testing with variable waste-gate opening angle (Efficiency vs Pressure Ratio).
Figure 5.10: Effect of increasing waste-gate opening angle on baseline turbine performance
map (Efficiency vs Pressure Ratio).

86
5.2.3 Cold testing (turbine bypassed)
The next experimental work was carried out to measure the characteristics of the waste-gate
without the influence of the turbine scroll. The rationale of this test is to characterise the
waste-gate by measuring the mass flow going into the waste-gate channel at various
wastegate openings. From this, the flow coefficient of the waste-gate can be calculated. This
cold testing was conducted with the air temperature of 20C, and the test setup is shown in
Figure 5.11. The flow into the turbine scroll is blocked by using a blind plug. Therefore the
mass flow will pass through only the waste-gate channel and into the turbine outlet. The
waste-gate is also set to 5%, 10%, 30%, 50% and 100% opening angles with the specific
pressure ratio and at the turbine inlet temperature of 20C. The cold testing setup is
summarised in the table below.
Table 5.3: Cold testing experimental setup
WG Opening Angle, α
(%)
Turbine
Pressure Ratio
Turbine Inlet Temperature,
T03 (C)
5%
PR 1.5
PR 2.0
PR 3.0
20C
10%
PR 1.5
PR 2.0
PR 3.0
20C
30%
PR 1.5
PR 2.0
PR 3.0
20C
50%
PR 1.5
PR 2.0
PR 3.0
20C
100%
PR 1.5
PR 2.0
PR 3.0
20C

87
Figure 5.11: Cold testing configuration.
After measuring the flow through the waste-gate, the data can now be used to determine the
flow discharge coefficient of the waste-gate, CD. Discharge coefficient is the ratio of the
effective flow area to the reference flow area. In this study, the reference area is derived from
the diameter of the waste-gate valve. This valve will be used to calculate the mass flow
through a poppet valve, in GT-Power 1D simulations through a component called
‘ValveActuLiftCdConn’ using the following equation [12, 39]:
𝑚 ̇ = 𝐴𝑒𝑓𝑓𝑖𝑠𝑈𝑖𝑠 = 𝐶𝐷𝐴𝑅𝑖𝑠
𝑈𝑖𝑠 Equation 11
𝑖𝑠
= 0(𝑃𝑟)
1
𝛾 Equation 12
𝑃𝑟 = 𝑃𝑒𝑥
𝑃0,𝑖𝑛 Equation 13
𝑈𝑖𝑠 = √𝑅𝑇0,𝑖𝑛 {2𝛾
𝛾−1[1 − 𝑃𝑟
𝛾−1
𝛾 ]}
1
2
Equation 14
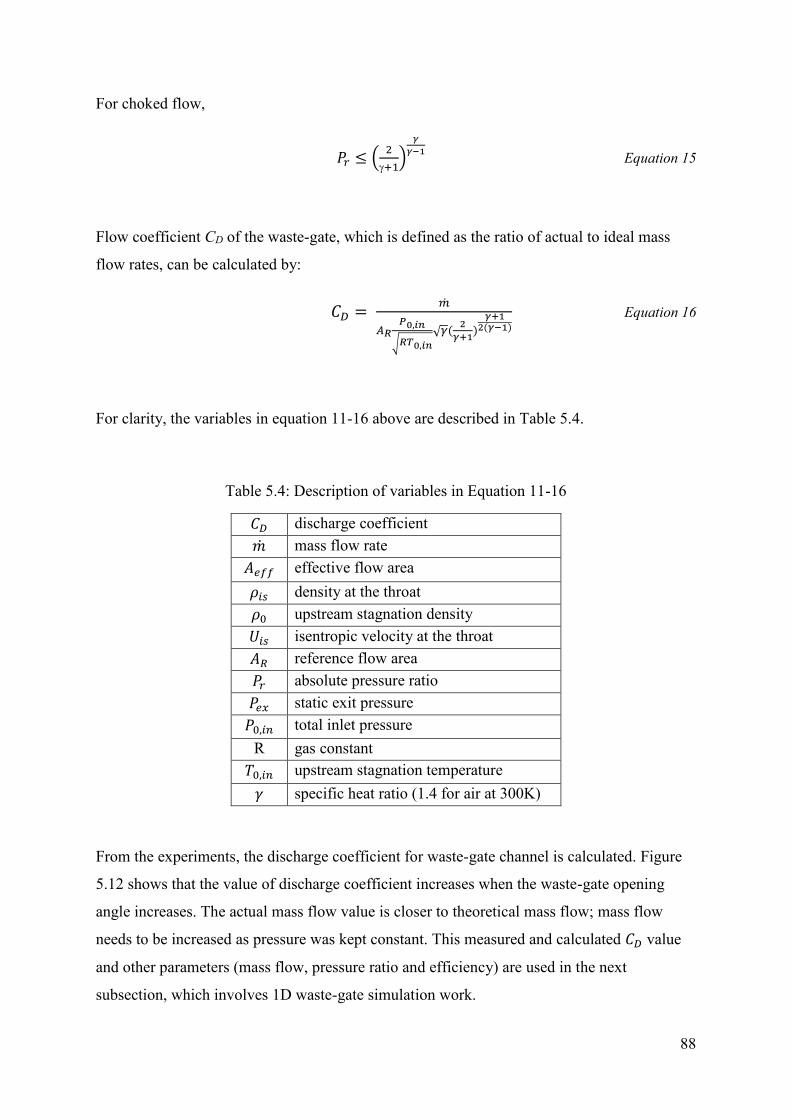
88
For choked flow,
𝑃𝑟 ≤ (2
+1)
𝛾
𝛾−1 Equation 15
Flow coefficient CD of the waste-gate, which is defined as the ratio of actual to ideal mass
flow rates, can be calculated by:
𝐶𝐷 = �̇�
𝐴𝑅𝑃0,𝑖𝑛
√𝑅𝑇0,𝑖𝑛
√𝛾(2
𝛾+1)
𝛾+12(𝛾−1)
Equation 16
For clarity, the variables in equation 11-16 above are described in Table 5.4.
Table 5.4: Description of variables in Equation 11-16
𝐶𝐷 discharge coefficient
�̇� mass flow rate
𝐴𝑒𝑓𝑓 effective flow area
𝜌𝑖𝑠 density at the throat
𝜌0 upstream stagnation density
𝑈𝑖𝑠 isentropic velocity at the throat
𝐴𝑅 reference flow area
𝑃𝑟 absolute pressure ratio
𝑃𝑒𝑥 static exit pressure
𝑃0,𝑖𝑛 total inlet pressure
R gas constant
𝑇0,𝑖𝑛 upstream stagnation temperature
𝛾 specific heat ratio (1.4 for air at 300K)
From the experiments, the discharge coefficient for waste-gate channel is calculated. Figure
5.12 shows that the value of discharge coefficient increases when the waste-gate opening
angle increases. The actual mass flow value is closer to theoretical mass flow; mass flow
needs to be increased as pressure was kept constant. This measured and calculated 𝐶𝐷 value
and other parameters (mass flow, pressure ratio and efficiency) are used in the next
subsection, which involves 1D waste-gate simulation work.
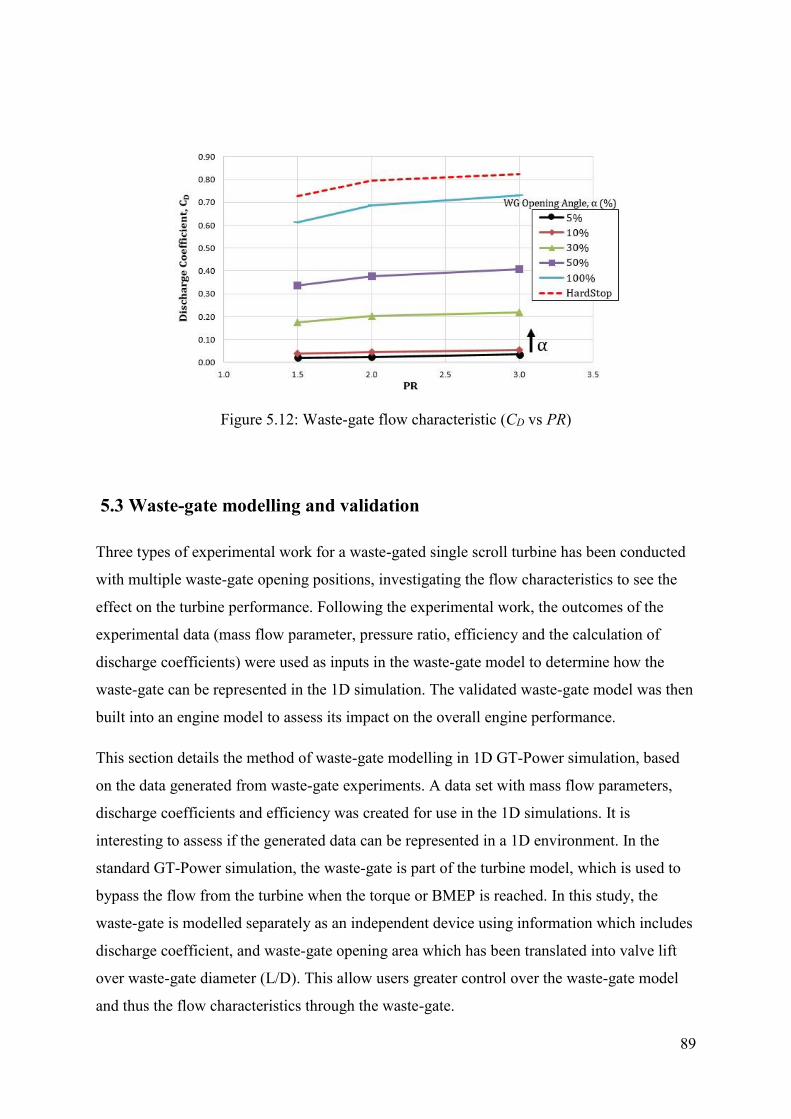
89
Figure 5.12: Waste-gate flow characteristic (CD vs PR)
5.3 Waste-gate modelling and validation
Three types of experimental work for a waste-gated single scroll turbine has been conducted
with multiple waste-gate opening positions, investigating the flow characteristics to see the
effect on the turbine performance. Following the experimental work, the outcomes of the
experimental data (mass flow parameter, pressure ratio, efficiency and the calculation of
discharge coefficients) were used as inputs in the waste-gate model to determine how the
waste-gate can be represented in the 1D simulation. The validated waste-gate model was then
built into an engine model to assess its impact on the overall engine performance.
This section details the method of waste-gate modelling in 1D GT-Power simulation, based
on the data generated from waste-gate experiments. A data set with mass flow parameters,
discharge coefficients and efficiency was created for use in the 1D simulations. It is
interesting to assess if the generated data can be represented in a 1D environment. In the
standard GT-Power simulation, the waste-gate is part of the turbine model, which is used to
bypass the flow from the turbine when the torque or BMEP is reached. In this study, the
waste-gate is modelled separately as an independent device using information which includes
discharge coefficient, and waste-gate opening area which has been translated into valve lift
over waste-gate diameter (L/D). This allow users greater control over the waste-gate model
and thus the flow characteristics through the waste-gate.
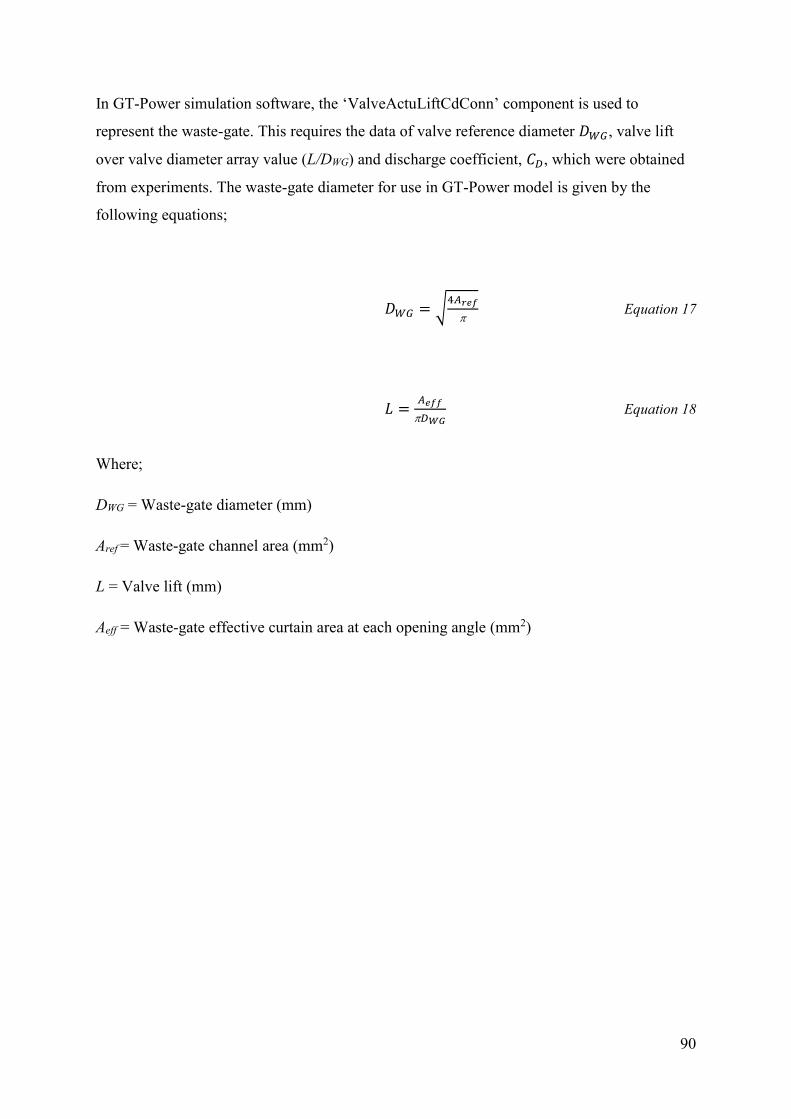
90
In GT-Power simulation software, the ‘ValveActuLiftCdConn’ component is used to
represent the waste-gate. This requires the data of valve reference diameter 𝐷𝑊𝐺, valve lift
over valve diameter array value (L/DWG) and discharge coefficient, 𝐶𝐷, which were obtained
from experiments. The waste-gate diameter for use in GT-Power model is given by the
following equations;
𝐷𝑊𝐺 = √4𝐴𝑟𝑒𝑓
Equation 17
𝐿 =𝐴𝑒𝑓𝑓
𝐷𝑊𝐺 Equation 18
Where;
DWG = Waste-gate diameter (mm)
Aref = Waste-gate channel area (mm2)
L = Valve lift (mm)
Aeff = Waste-gate effective curtain area at each opening angle (mm2)
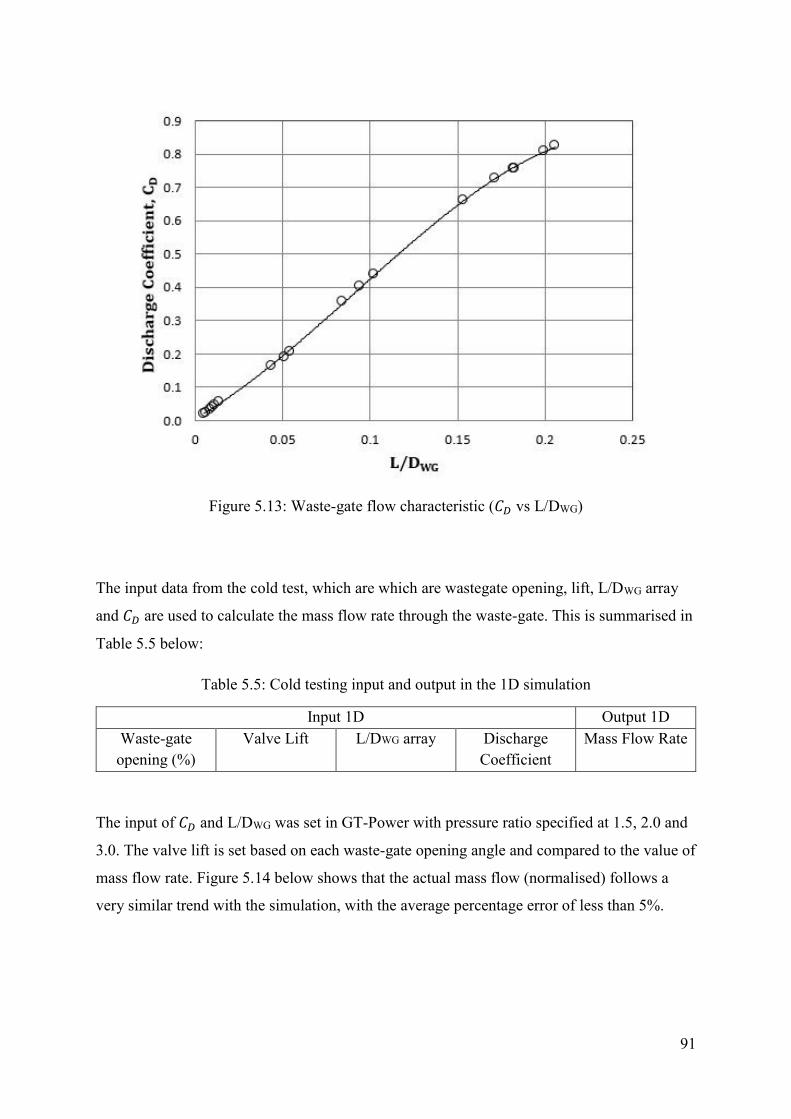
91
Figure 5.13: Waste-gate flow characteristic (𝐶𝐷 vs L/DWG)
The input data from the cold test, which are which are wastegate opening, lift, L/DWG array
and 𝐶𝐷 are used to calculate the mass flow rate through the waste-gate. This is summarised in
Table 5.5 below:
Table 5.5: Cold testing input and output in the 1D simulation
Input 1D Output 1D
Waste-gate
opening (%)
Valve Lift L/DWG array Discharge
Coefficient
Mass Flow Rate
The input of 𝐶𝐷 and L/DWG was set in GT-Power with pressure ratio specified at 1.5, 2.0 and
3.0. The valve lift is set based on each waste-gate opening angle and compared to the value of
mass flow rate. Figure 5.14 below shows that the actual mass flow (normalised) follows a
very similar trend with the simulation, with the average percentage error of less than 5%.
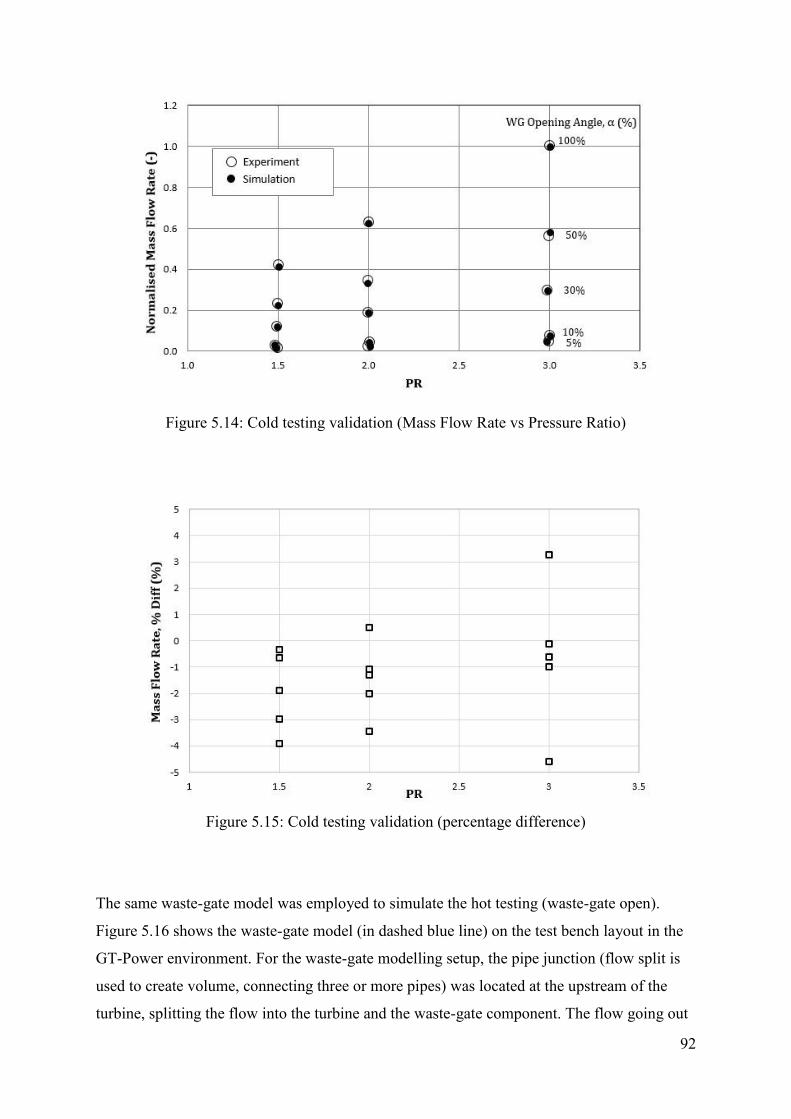
92
Figure 5.14: Cold testing validation (Mass Flow Rate vs Pressure Ratio)
Figure 5.15: Cold testing validation (percentage difference)
The same waste-gate model was employed to simulate the hot testing (waste-gate open).
Figure 5.16 shows the waste-gate model (in dashed blue line) on the test bench layout in the
GT-Power environment. For the waste-gate modelling setup, the pipe junction (flow split is
used to create volume, connecting three or more pipes) was located at the upstream of the
turbine, splitting the flow into the turbine and the waste-gate component. The flow going out
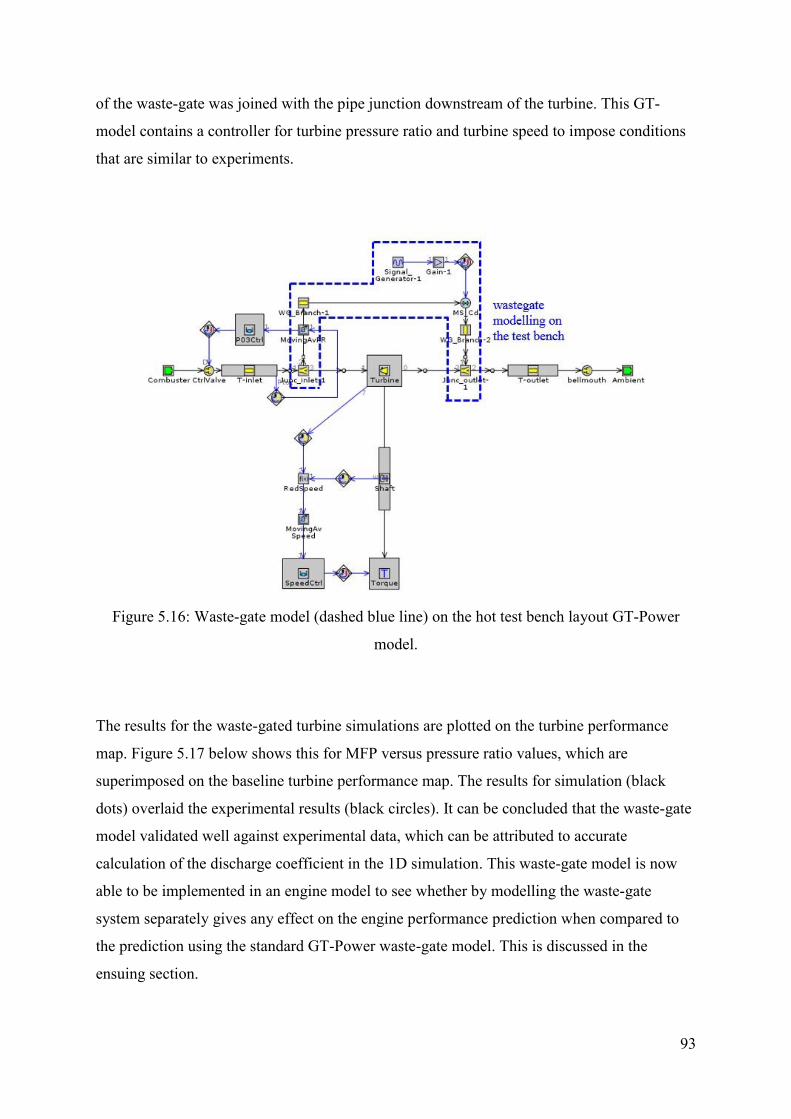
93
of the waste-gate was joined with the pipe junction downstream of the turbine. This GT-
model contains a controller for turbine pressure ratio and turbine speed to impose conditions
that are similar to experiments.
Figure 5.16: Waste-gate model (dashed blue line) on the hot test bench layout GT-Power
model.
The results for the waste-gated turbine simulations are plotted on the turbine performance
map. Figure 5.17 below shows this for MFP versus pressure ratio values, which are
superimposed on the baseline turbine performance map. The results for simulation (black
dots) overlaid the experimental results (black circles). It can be concluded that the waste-gate
model validated well against experimental data, which can be attributed to accurate
calculation of the discharge coefficient in the 1D simulation. This waste-gate model is now
able to be implemented in an engine model to see whether by modelling the waste-gate
system separately gives any effect on the engine performance prediction when compared to
the prediction using the standard GT-Power waste-gate model. This is discussed in the
ensuing section.
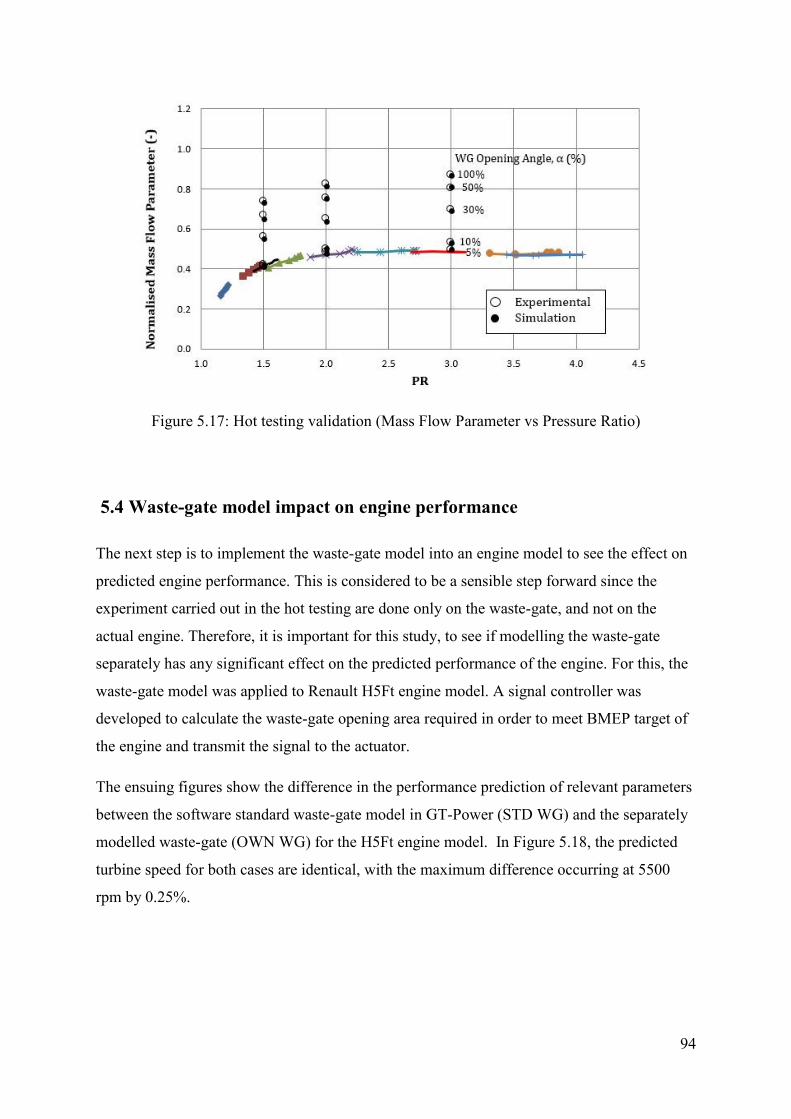
94
Figure 5.17: Hot testing validation (Mass Flow Parameter vs Pressure Ratio)
5.4 Waste-gate model impact on engine performance
The next step is to implement the waste-gate model into an engine model to see the effect on
predicted engine performance. This is considered to be a sensible step forward since the
experiment carried out in the hot testing are done only on the waste-gate, and not on the
actual engine. Therefore, it is important for this study, to see if modelling the waste-gate
separately has any significant effect on the predicted performance of the engine. For this, the
waste-gate model was applied to Renault H5Ft engine model. A signal controller was
developed to calculate the waste-gate opening area required in order to meet BMEP target of
the engine and transmit the signal to the actuator.
The ensuing figures show the difference in the performance prediction of relevant parameters
between the software standard waste-gate model in GT-Power (STD WG) and the separately
modelled waste-gate (OWN WG) for the H5Ft engine model. In Figure 5.18, the predicted
turbine speed for both cases are identical, with the maximum difference occurring at 5500
rpm by 0.25%.
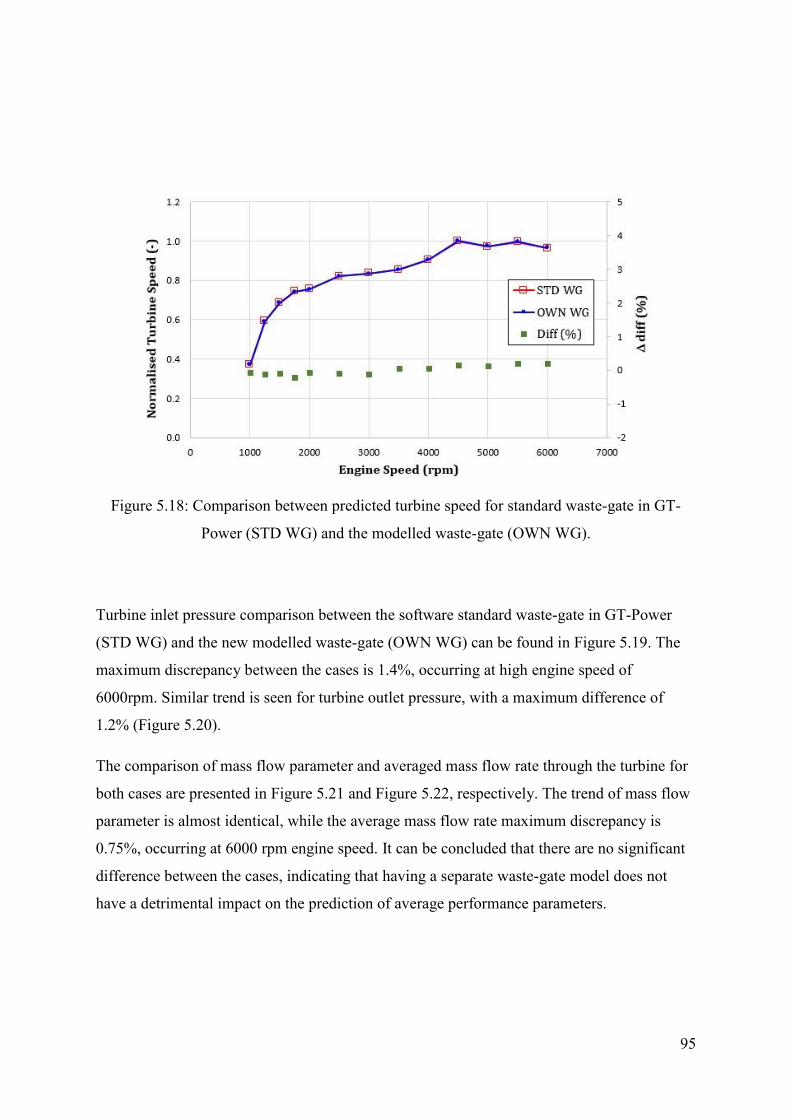
95
Figure 5.18: Comparison between predicted turbine speed for standard waste-gate in GT-
Power (STD WG) and the modelled waste-gate (OWN WG).
Turbine inlet pressure comparison between the software standard waste-gate in GT-Power
(STD WG) and the new modelled waste-gate (OWN WG) can be found in Figure 5.19. The
maximum discrepancy between the cases is 1.4%, occurring at high engine speed of
6000rpm. Similar trend is seen for turbine outlet pressure, with a maximum difference of
1.2% (Figure 5.20).
The comparison of mass flow parameter and averaged mass flow rate through the turbine for
both cases are presented in Figure 5.21 and Figure 5.22, respectively. The trend of mass flow
parameter is almost identical, while the average mass flow rate maximum discrepancy is
0.75%, occurring at 6000 rpm engine speed. It can be concluded that there are no significant
difference between the cases, indicating that having a separate waste-gate model does not
have a detrimental impact on the prediction of average performance parameters.

96
Figure 5.19: Comparison between predicted turbine inlet pressure for standard waste-gate in
GT-Power (STD WG) and the modelled waste-gate (OWN WG).
Figure 5.20: Comparison between predicted turbine outlet pressure for standard waste-gate in
GT-Power (STD WG) and the modelled waste-gate (OWN WG).
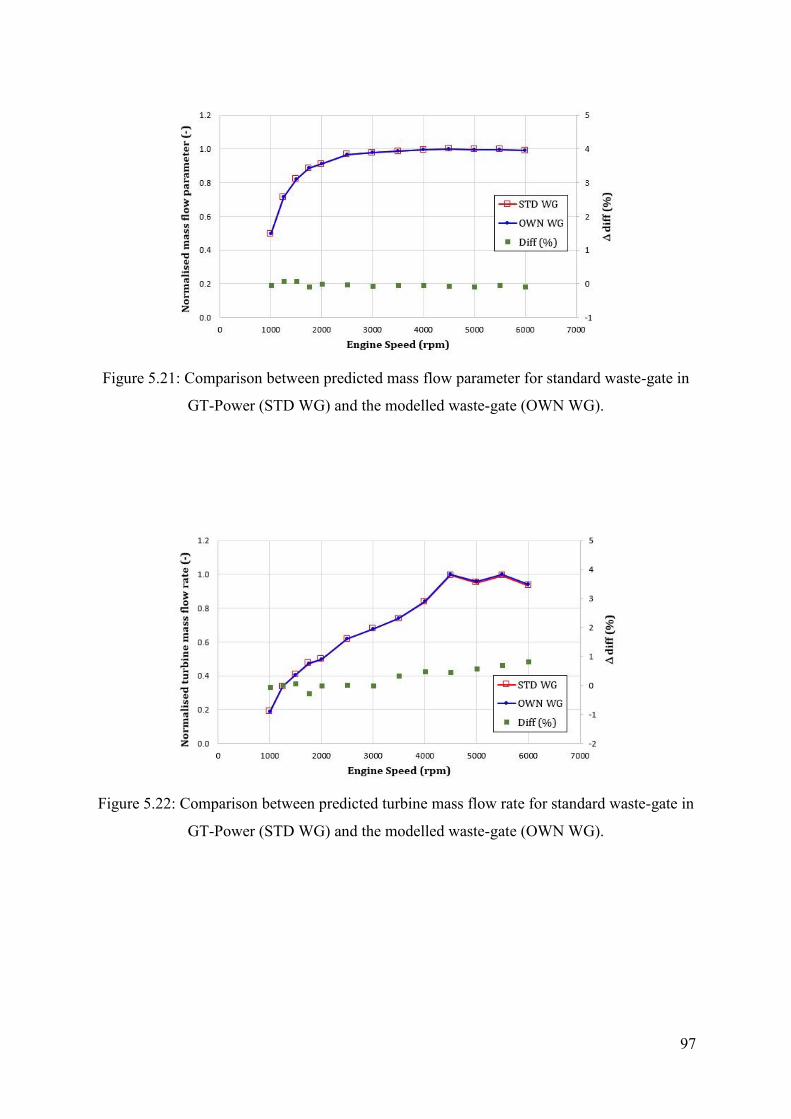
97
Figure 5.21: Comparison between predicted mass flow parameter for standard waste-gate in
GT-Power (STD WG) and the modelled waste-gate (OWN WG).
Figure 5.22: Comparison between predicted turbine mass flow rate for standard waste-gate in
GT-Power (STD WG) and the modelled waste-gate (OWN WG).

98
Figure 5.23: Comparison between predicted turbine efficiency for standard waste-gate in GT-
Power (STD WG) and the modelled waste-gate (OWN WG).
Figure 5.23 shows the average efficiency of the turbine for both standard waste-gate in GT-
Power and the modelled waste-gate cases. It can be seen that the results for both results are
almost identical.
From the above figures, it can be concluded that modelling the waste-gate separately does not
give any significant effect on the prediction of the engine performance, particularly on the
average turbocharger parameters. However, it is equally important for exhaust manifold and
turbine designers to be able to predict the pulsating flow through the waste-gate channel.
Figure 5.24 shows the calculated discharge coefficient (black circle), namely calculated 𝐶𝐷
and a scaled down discharge coefficient with a factor of 0.9 (red circle), denoted as ‘adjusted
𝐶𝐷’. The adjusted 𝐶𝐷 value is then used in waste-gate modelling in GT-Power to see the
difference on the pulsating flow performance for both cases (standard GT-Power and
separately modelled waste-gate). The rationale of this work is to clarify the importance of
having accurate discharge coefficient value in the simulation work.
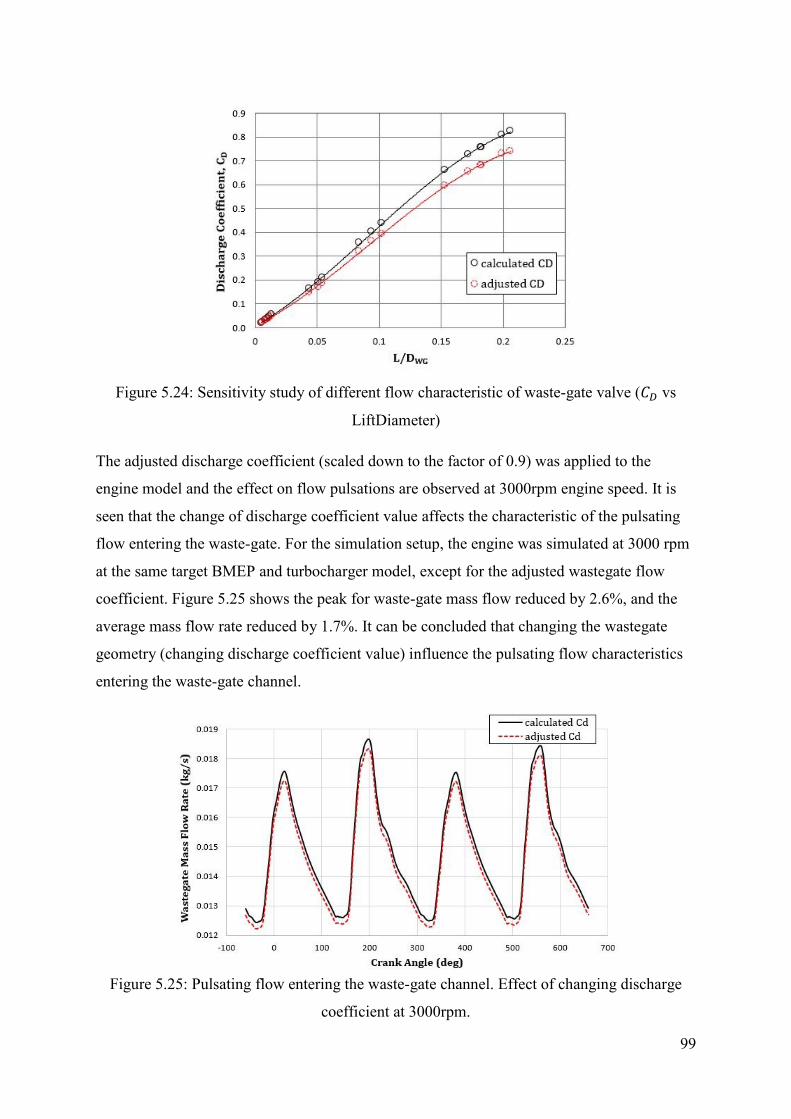
99
Figure 5.24: Sensitivity study of different flow characteristic of waste-gate valve (𝐶𝐷 vs
LiftDiameter)
The adjusted discharge coefficient (scaled down to the factor of 0.9) was applied to the
engine model and the effect on flow pulsations are observed at 3000rpm engine speed. It is
seen that the change of discharge coefficient value affects the characteristic of the pulsating
flow entering the waste-gate. For the simulation setup, the engine was simulated at 3000 rpm
at the same target BMEP and turbocharger model, except for the adjusted wastegate flow
coefficient. Figure 5.25 shows the peak for waste-gate mass flow reduced by 2.6%, and the
average mass flow rate reduced by 1.7%. It can be concluded that changing the wastegate
geometry (changing discharge coefficient value) influence the pulsating flow characteristics
entering the waste-gate channel.
Figure 5.25: Pulsating flow entering the waste-gate channel. Effect of changing discharge
coefficient at 3000rpm.
100
5.5 Summary
Experimental work has been conducted to see the waste-gate effects on turbine performance.
Three types of testing, which include baseline hot testing (waste-gate closed), hot testing
(waste-gate open) and cold testing (turbine fully bypassed) were performed. The outcomes of
the experimental data were used in constructing a waste-gate in 1D environment and the flow
characteristics are validated against the experimental data. The validated waste-gate model
was built into the H5Ft engine model to assess its impact on the engine performance.
The hot testing was carried out with five waste-gate opening positions. The results of this test
show that the mass flow increases with the increase in wastegate opening. The reason for the
increased mass flow is that higher is needed to maintain the constant speed and pressure ratio
because some mass is bypassing the turbine. When a waste-gate valve is opened, the inlet
pressure of the turbine will decrease due to increased turbine area. In the current experiment,
the pressure ratio and speed were kept constant, and therefore the mass flow through the turbine
had to be increased. It is also found that the turbine efficiency decreases when the waste-gate
opening increases. This is because the waste-gate channel splits the flow, and the mass flow
through the turbine rotor decreases compared to the total turbine flow.
The cold testing was carried out by blocking the flow going into the turbine rotor with a blind
plug so that the flow only goes to the waste-gate channel and into the turbine outlet. This test
is to investigate the flow characteristics of the waste-gate. From the experiments, the
discharge coefficient is calculated and used in the 1D simulation. The discharge coefficient
value increases when the waste-gate opening angle increases. This is because the actual mass
flow value is closer to theoretical mass flow.
The information obtained from the experiment are used for 1D simulations. 1D simulations
were performed for cold testing (turbine bypassed) test where the input of calculated
discharge coefficient was used with L/D value. The calculated mass flow from simulation
exhibits very similar trend with experiments, with the average percentage error of less than
5%. The same method was used for hot testing (waste-gate open) case where calculations
were validated with experiments.
After validating the waste-gate model, it was implemented in the H5Ft engine simulations to
see whether having a separate waste-gate model will have any significant effect on the
prediction of the engine and turbocharger performance. It was found that the implementation

101
of a separate waste-gate model as opposed to the standard built-in GT-Power waste-gate
model does not have any significant impact on engine system and turbocharger average
performance. However, having a separate waste-gate model allows observation on the
behaviour of the pulsating flow through the turbocharger system, thus allowing better waste-
gate matching to the turbine and further improvements to the waste-gate design.
102
Chapter 6: Electrified Turbocharger System
This chapter describes assessment made on an engine equipped with an electrified
turbocharger systems. A high-level investigation into several multi-boosting strategies for a
heavily downsized turbocharged gasoline engine was presented. In this study, the Renault
H5Ft engine was selected as a baseline engine, and it has been downsized and electrified to
examine the benefit of both strategies with several boosting system arrangement. This
assessment provides better understanding as to which of the air management strategy offers
the greatest impact on the main engine requirements.
6.1 Electric Turbo Assist (ETA) System
With the similar approach of turbine resizing strategy in chapter 4 (refer Figure 4.1), an
electric turbo assist (ETA) system was modelled into the Renault 1.2 H5Ft engine to replace
the function of the waste-gate. By doing so, the surplus energy would be stored instead of
being released to the atmosphere via a waste-gate. An extension work in the simulation was
undertaken to predict the performance of the engine and see whether further improvements
can be achieved for BSFC and transient response.
By referring the benefit of enlarging turbine for the H5Ft engine, the BSFC was improved by
1.31% (Figure B.5). However, the transient performance was significantly worsened. The
next approach is applying the ETA system by connecting the turbocharger shaft to a motor-
generator (Figure 6.1). During low rpm, the motoring mode is activated, extracting energy to
rotate the shaft to improve transient performance thereby reducing turbo-lag. At high-speeds,
when the boost pressure is greater than those required to meet the BMEP/torque demand, the
generator activates, absorbing the surplus energy from the turbine to be stored in a battery,
thus eliminating the need for a waste-gate.
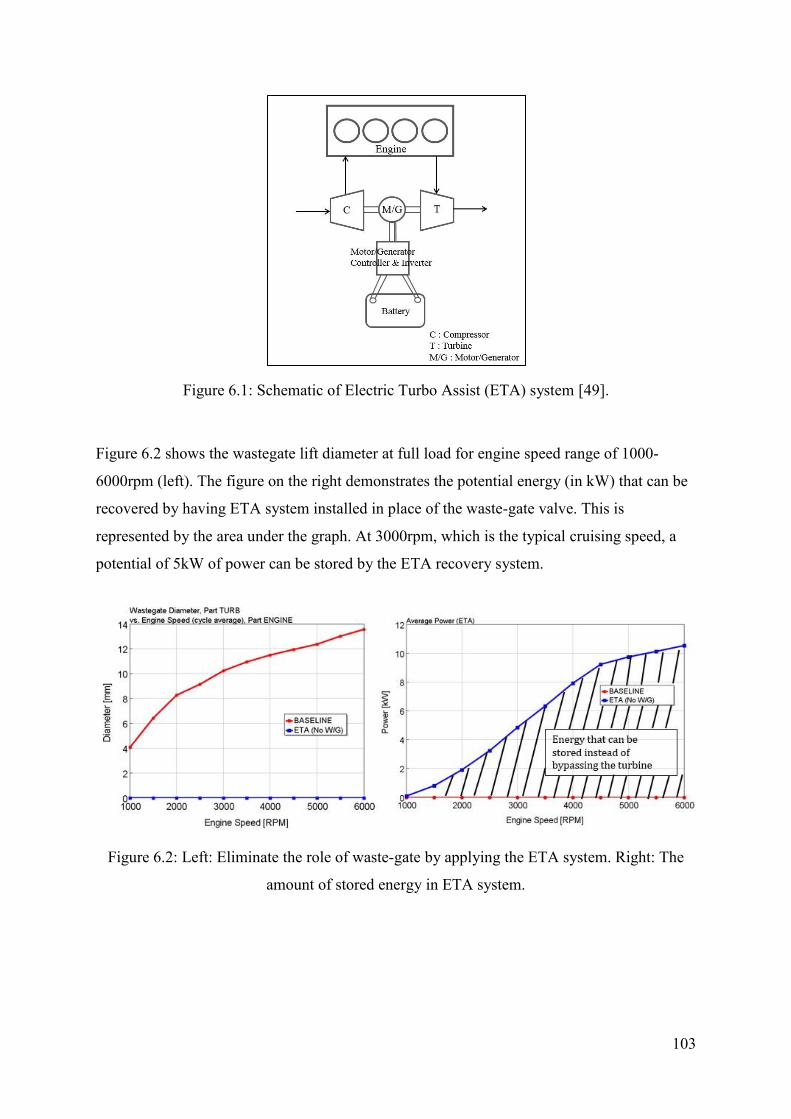
103
Figure 6.1: Schematic of Electric Turbo Assist (ETA) system [49].
Figure 6.2 shows the wastegate lift diameter at full load for engine speed range of 1000-
6000rpm (left). The figure on the right demonstrates the potential energy (in kW) that can be
recovered by having ETA system installed in place of the waste-gate valve. This is
represented by the area under the graph. At 3000rpm, which is the typical cruising speed, a
potential of 5kW of power can be stored by the ETA recovery system.
Figure 6.2: Left: Eliminate the role of waste-gate by applying the ETA system. Right: The
amount of stored energy in ETA system.

104
As mentioned earlier in Chapter 3, the BSFC for a standard engine can be expressed by a
ratio of fuel mass flow rate to engine brake power. To account for the power generated by the
ETA system, the total BSFC is defined as follows[23]:
𝐵𝑆𝐹𝐶𝑡𝑜𝑡𝑎𝑙 =�̇�𝑓
�̇�𝑏+(�̇�𝑒𝑙𝑒𝑐 𝑥 𝑒𝑙𝑒𝑐) Equation 19
Where;
�̇�𝑓 = fuel mass flow (kg/hr)
�̇�𝑏 = engine brake power (kW)
�̇�𝑒𝑙𝑒𝑐 = electric power recovered (kW)
𝑒𝑙𝑒𝑐
= efficiency of generator. Electrical conversion efficiency is predicted to be 85% based
on [50].
Figure 6.3 shows the benefit of BSFC predicted by GT-Power simulations. The blue line
represents the ETA system on the Renaults 1.2H5Ft baseline engine, which shows that the
BSFC is improved by approximately 0.8% on average over the speed range. A combination
of turbine sizing and electric turbo gives further average BSFC benefit by 2.4%. To ensure
the transient performance is not deteriorated, a transient simulation was undertaken to
estimate the time taken by the engines to achieve 90% of the target BMEP. Figure 6.4
confirms that the transient performance is improved with electrified system compared to the
baseline engine. At 1500rpm, the ETA system enables the engine to achieve 90% torque at
20% rate faster than the baseline engine.

105
Figure 6.3: Benefit of applying ETA system on BSFC
Figure 6.4: Transient benefit by using ETA system

106
6.2 Engine Downsizing Strategy
Further benefit on BSFC could be gained by having engine downsizing strategy. This section
will assess through simulations several potential boosting systems for a downsized engine.
The main challenges for engine downsizing can be summarized as follows:
(a) Combustion limitation.
Increased BMEP and maximum cylinder pressure require robust combustion system and
engine components.
(b) Low-speed torque requirement
Boosted downsized engines often struggle to emulate the low-speed torque of its naturally
aspirated counterpart. Meeting low-speed BMEP is one of the most difficult challenges in
development of highly boosted downsized engines [51].
(c) Transient response
Boosted engines suffer from poor transient performance at low engine speeds.
(d) Cylinder geometry
Geometrical constraints become increasingly critial once the engine capacity falls below
1 liter as components such as valves have to be made smaller. The geometry of the
combustion cylinder itself and the intake/exhaust ports will have to be optimized to
accommodate the new combustion system and gas flows.
(e) Engine durabilty/reliability
As highly boosted engines operate at higher temperatures and pressure, the thermal
resistance, mechanical strength and engine wear becomes inherent issues which cannot be
ignored.
1D, GT-Power simulations are carried out in this study to look at several boosting strategies
that can be implemented for a downsized engine. The simulations are based on the H5Ft
engine and several engine features are taken into consideration when the downsizing
procedures are carried out, which includes the following:
(a) Down-cylindering
The number of cylinder was reduced from 4 to 3.

107
(b) Firing order
The firing order was changed as a consequence of down-cylindering from 1-3-4-2
(180deg intervals) to 1-2-3 (240deg intervals).
(c) Cylinder geometry
The cylinder geometry was maintained with 72.2mm x 73.2mm bore x stroke
measurements.
(d) Air-fuel-ratio
The original air-fuel-ratio was maintained.
(e) Intake and exhaust manifold system
The intake manifold and exhaust manifold was simplified by removing the length of one
runner.
(f) BMEP target
The BMEP target was changed to higher values to maintain torque performance. The
BMEP value changes are based on below equation:
𝐵𝑀𝐸𝑃(𝑏𝑎𝑟) = 𝐵𝑟𝑎𝑘𝑒 𝑇𝑜𝑟𝑞𝑢𝑒 (𝑁𝑚)𝑥 4 𝑥 10
𝐸𝑛𝑔𝑖𝑛𝑒 𝐶𝑎𝑝𝑎𝑐𝑖𝑡𝑦 (𝑐𝑐) Equation 20
The brake torque remains constant while the engine capacity was changed to 900cc (3
cylinders) from of 1200cc (4cylinders).
(g) Friction Mean Effective Pressure (FMEP)
The downsized engine has lower friction torque and power. Thus, the Friction Mean
Effective Pressure (FMEP) was changed to a new estimated value based on equation
below following references [52, 53]
𝐹𝑀𝐸𝑃 = 𝑃𝑓
𝑉𝑑𝑁 Equation 21
𝑃𝑓 = 𝑓 = 𝑓2𝑁
60 Equation 22
where;
𝑃𝑓 = Friction power

108
𝑓 = Friction torque
N = Engine speed
𝑉𝑑 = Displacement volume
Besides the abovementioned parameters, other aspects that required optimizations in the
development of a downsized engine include the valvetrain system and strategies, fuel
strategies, manifold geometry optimizations, charge-air cooling,etc. These require detailed
and extensive test-bed testing and calibration, thus is beyond the scope of the present work.
The following sections describe simulations carried out on the engine fitted with several
types of advanced multiple boosting systems. These include Series Turbo, TurboSuper,
TurboElecTurbo and TurboElecTurboETC. The predicted performance of these systems are
assessed in terms of their torque/BMEP target achievement, full-load and part-load BSFCs,
exhaust gas residuals and engine transient response. The work also propose a basic method
for ranking the systems based on the aforementioned performance criteria.
Figure 6.5 presents the target and predicted BMEP curves for the downsized engine, namely
0.9H5Ft, equipped with two differently-sized single-stage turbochargers. The cases are
labeled 0.9H5Ft_BIG for the engine equipped with a larger turbocharger and 0.9H5Ft_SML
for the engine with a smaller unit. Also included here in Figure 6.5 is a compressor map
showing the operating points of the turbochargers overlaid on efficiency contours of both
turbocharger compressors. It is seen from the results that the 0.9H5Ft_BIG was able to
deliver the required BMEP at high engine speeds but was limited by surge at low engine
speeds. On the other hand, 0.9H5Ft_SML, which has the smaller turbocharger (current
turbocharger is scaled to the factor of 0.75) was able to meet the BMEP target up to 2000 rpm
without surging but chokes afterwards. These limitations are indicated in Figure 6.6, which
points out the operating points of both engines on the compressor maps. These results
demonstrate the difficulty of meeting the torque target curve with a single-stage turbocharger.
Therefore, a multi-stage boosting system, which utilizes more than one turbocharger stage is
is necessary.
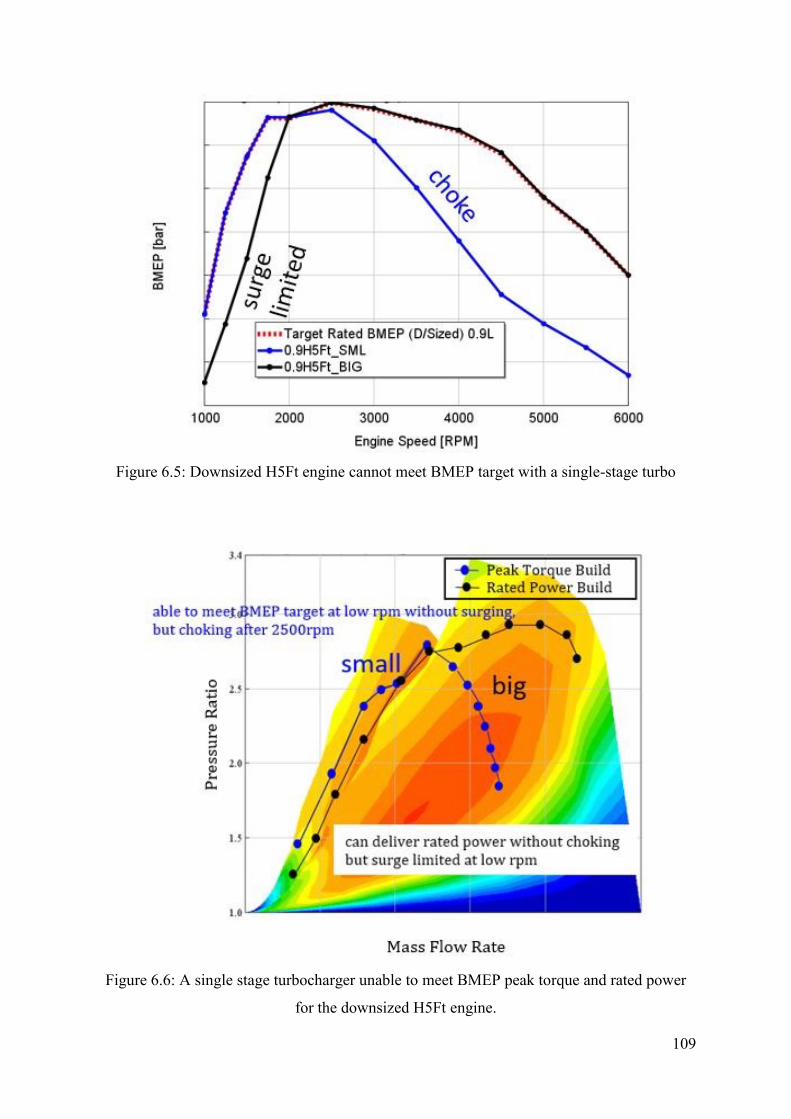
109
Figure 6.5: Downsized H5Ft engine cannot meet BMEP target with a single-stage turbo
Figure 6.6: A single stage turbocharger unable to meet BMEP peak torque and rated power
for the downsized H5Ft engine.
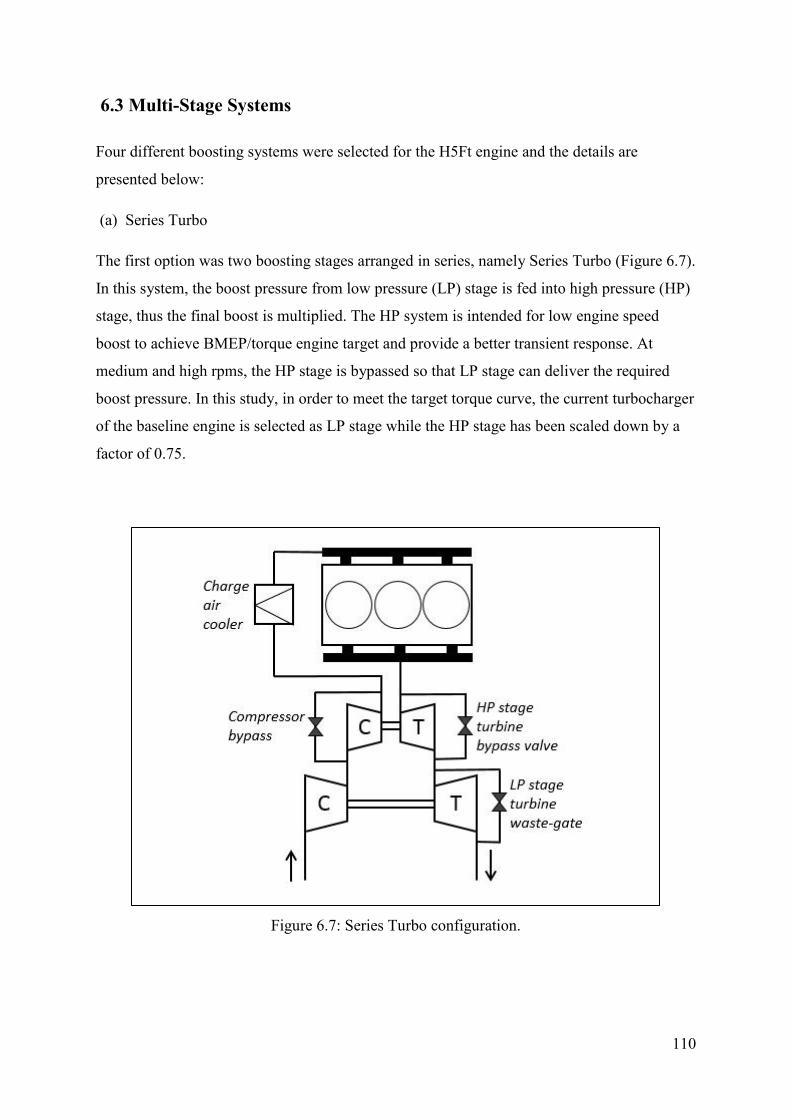
110
6.3 Multi-Stage Systems
Four different boosting systems were selected for the H5Ft engine and the details are
presented below:
(a) Series Turbo
The first option was two boosting stages arranged in series, namely Series Turbo (Figure 6.7).
In this system, the boost pressure from low pressure (LP) stage is fed into high pressure (HP)
stage, thus the final boost is multiplied. The HP system is intended for low engine speed
boost to achieve BMEP/torque engine target and provide a better transient response. At
medium and high rpms, the HP stage is bypassed so that LP stage can deliver the required
boost pressure. In this study, in order to meet the target torque curve, the current turbocharger
of the baseline engine is selected as LP stage while the HP stage has been scaled down by a
factor of 0.75.
Figure 6.7: Series Turbo configuration.
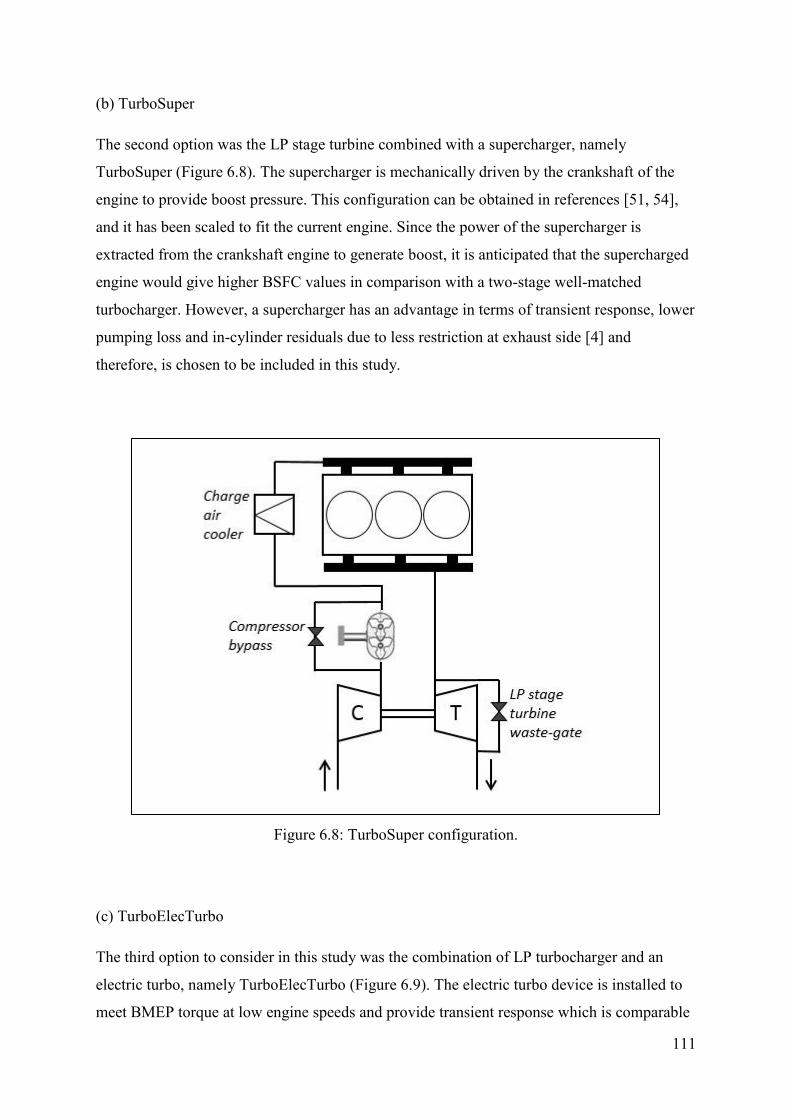
111
(b) TurboSuper
The second option was the LP stage turbine combined with a supercharger, namely
TurboSuper (Figure 6.8). The supercharger is mechanically driven by the crankshaft of the
engine to provide boost pressure. This configuration can be obtained in references [51, 54],
and it has been scaled to fit the current engine. Since the power of the supercharger is
extracted from the crankshaft engine to generate boost, it is anticipated that the supercharged
engine would give higher BSFC values in comparison with a two-stage well-matched
turbocharger. However, a supercharger has an advantage in terms of transient response, lower
pumping loss and in-cylinder residuals due to less restriction at exhaust side [4] and
therefore, is chosen to be included in this study.
Figure 6.8: TurboSuper configuration.
(c) TurboElecTurbo
The third option to consider in this study was the combination of LP turbocharger and an
electric turbo, namely TurboElecTurbo (Figure 6.9). The electric turbo device is installed to
meet BMEP torque at low engine speeds and provide transient response which is comparable
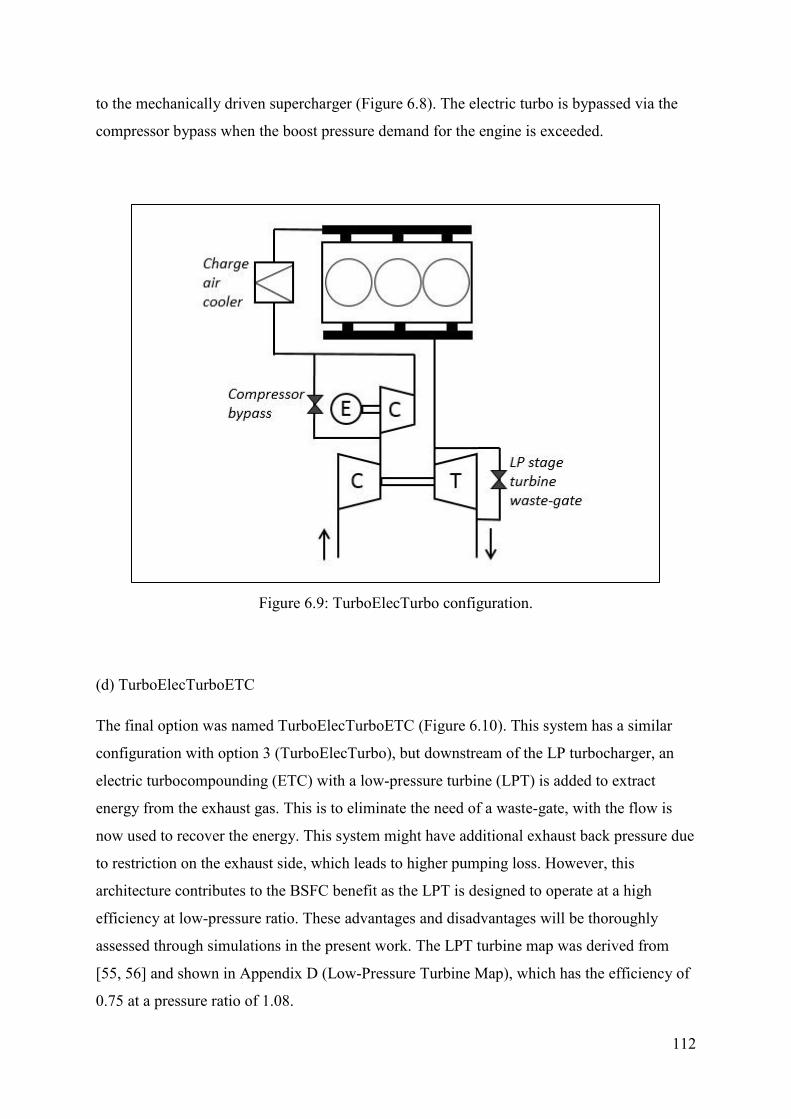
112
to the mechanically driven supercharger (Figure 6.8). The electric turbo is bypassed via the
compressor bypass when the boost pressure demand for the engine is exceeded.
Figure 6.9: TurboElecTurbo configuration.
(d) TurboElecTurboETC
The final option was named TurboElecTurboETC (Figure 6.10). This system has a similar
configuration with option 3 (TurboElecTurbo), but downstream of the LP turbocharger, an
electric turbocompounding (ETC) with a low-pressure turbine (LPT) is added to extract
energy from the exhaust gas. This is to eliminate the need of a waste-gate, with the flow is
now used to recover the energy. This system might have additional exhaust back pressure due
to restriction on the exhaust side, which leads to higher pumping loss. However, this
architecture contributes to the BSFC benefit as the LPT is designed to operate at a high
efficiency at low-pressure ratio. These advantages and disadvantages will be thoroughly
assessed through simulations in the present work. The LPT turbine map was derived from
[55, 56] and shown in Appendix D (Low-Pressure Turbine Map), which has the efficiency of
0.75 at a pressure ratio of 1.08.
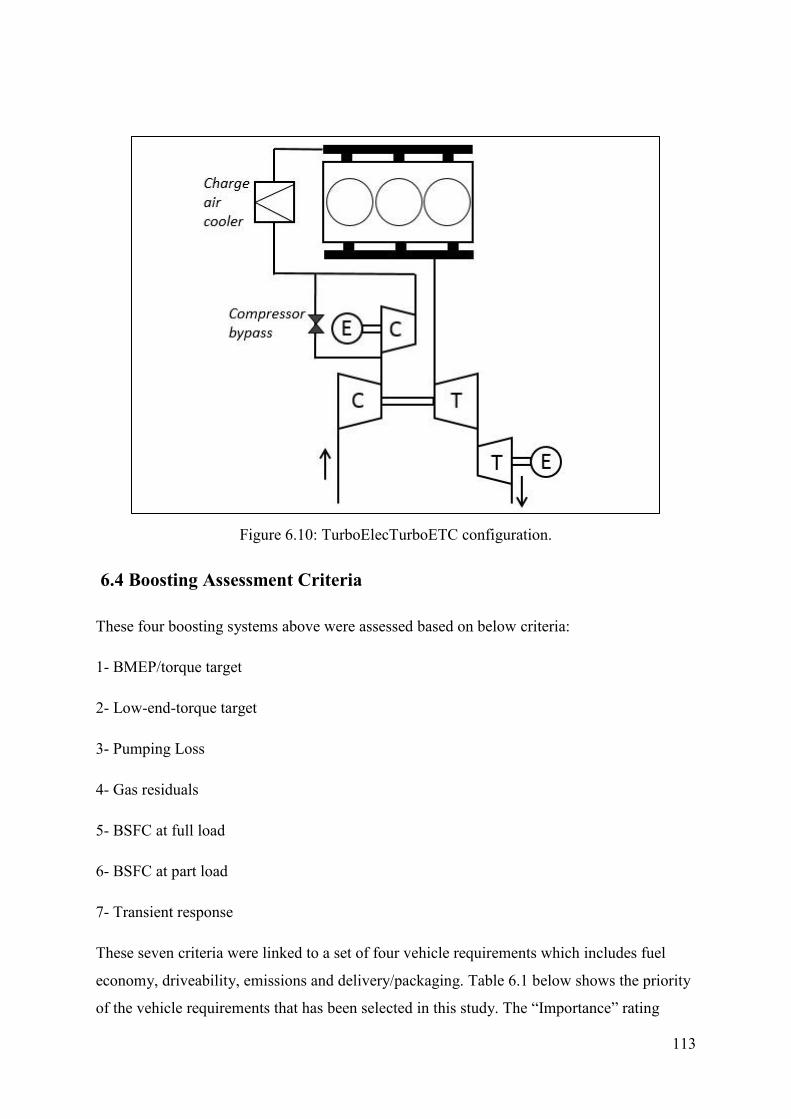
113
Figure 6.10: TurboElecTurboETC configuration.
6.4 Boosting Assessment Criteria
These four boosting systems above were assessed based on below criteria:
1- BMEP/torque target
2- Low-end-torque target
3- Pumping Loss
4- Gas residuals
5- BSFC at full load
6- BSFC at part load
7- Transient response
These seven criteria were linked to a set of four vehicle requirements which includes fuel
economy, driveability, emissions and delivery/packaging. Table 6.1 below shows the priority
of the vehicle requirements that has been selected in this study. The “Importance” rating
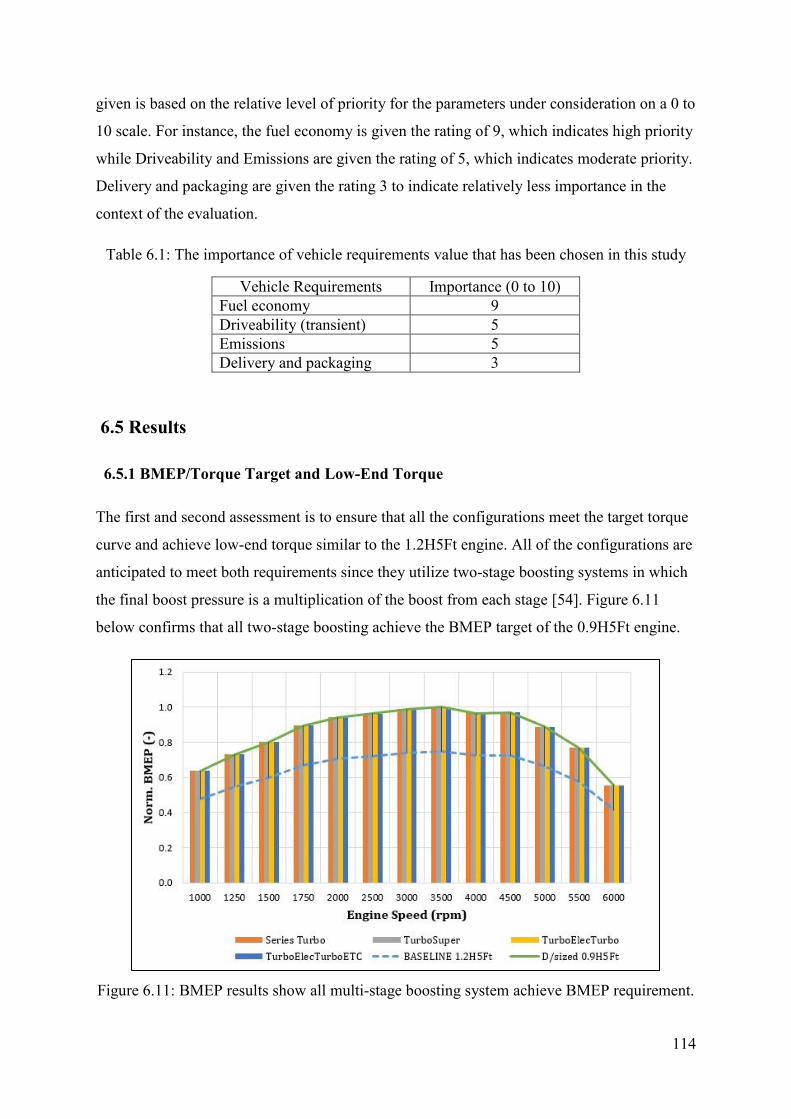
114
given is based on the relative level of priority for the parameters under consideration on a 0 to
10 scale. For instance, the fuel economy is given the rating of 9, which indicates high priority
while Driveability and Emissions are given the rating of 5, which indicates moderate priority.
Delivery and packaging are given the rating 3 to indicate relatively less importance in the
context of the evaluation.
Table 6.1: The importance of vehicle requirements value that has been chosen in this study
Vehicle Requirements Importance (0 to 10)
Fuel economy 9
Driveability (transient) 5
Emissions 5
Delivery and packaging 3
6.5 Results
6.5.1 BMEP/Torque Target and Low-End Torque
The first and second assessment is to ensure that all the configurations meet the target torque
curve and achieve low-end torque similar to the 1.2H5Ft engine. All of the configurations are
anticipated to meet both requirements since they utilize two-stage boosting systems in which
the final boost pressure is a multiplication of the boost from each stage [54]. Figure 6.11
below confirms that all two-stage boosting achieve the BMEP target of the 0.9H5Ft engine.
Figure 6.11: BMEP results show all multi-stage boosting system achieve BMEP requirement.
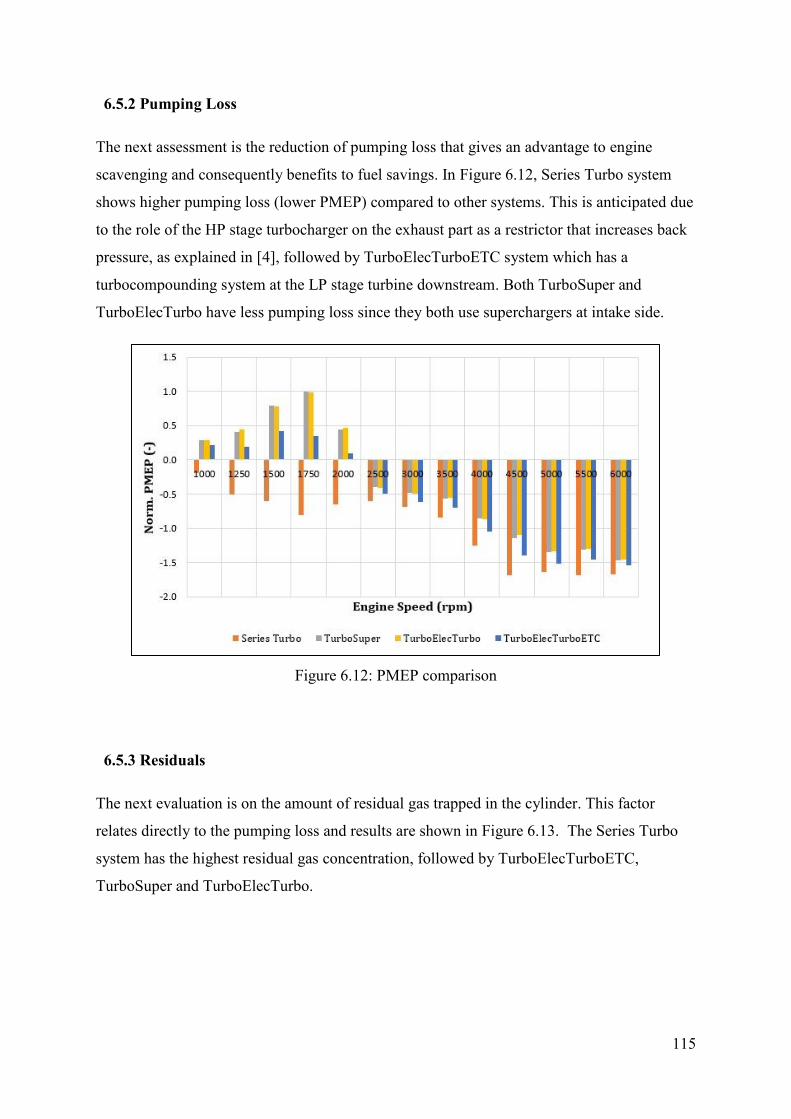
115
6.5.2 Pumping Loss
The next assessment is the reduction of pumping loss that gives an advantage to engine
scavenging and consequently benefits to fuel savings. In Figure 6.12, Series Turbo system
shows higher pumping loss (lower PMEP) compared to other systems. This is anticipated due
to the role of the HP stage turbocharger on the exhaust part as a restrictor that increases back
pressure, as explained in [4], followed by TurboElecTurboETC system which has a
turbocompounding system at the LP stage turbine downstream. Both TurboSuper and
TurboElecTurbo have less pumping loss since they both use superchargers at intake side.
Figure 6.12: PMEP comparison
6.5.3 Residuals
The next evaluation is on the amount of residual gas trapped in the cylinder. This factor
relates directly to the pumping loss and results are shown in Figure 6.13. The Series Turbo
system has the highest residual gas concentration, followed by TurboElecTurboETC,
TurboSuper and TurboElecTurbo.

116
Figure 6.13: Residuals Comparison
6.5.4 BSFC Full-load
The study also evaluates the BSFC benefit at full load condition, and the result is presented in
Figure 6.14. The best fuel economy is found on the TurboElecTurboETC system. Even
though the system has higher pumping loss and residuals, the ability to store the surplus
energy instead of bypassing the wastegate outweigh the other factors. Furthermore, it is
clearly seen that the TurboElecTurboETC system gives many benefits at high engine speeds
due to the positive effect from the turbine on the total system being more pronounced at the
high engine speed region. It can also be clearly seen that TurboSuper has the worst fuel
economy, which is anticipated as this system employs the supercharger which draws power
from engine crankshaft and affects the overall engine efficiency.
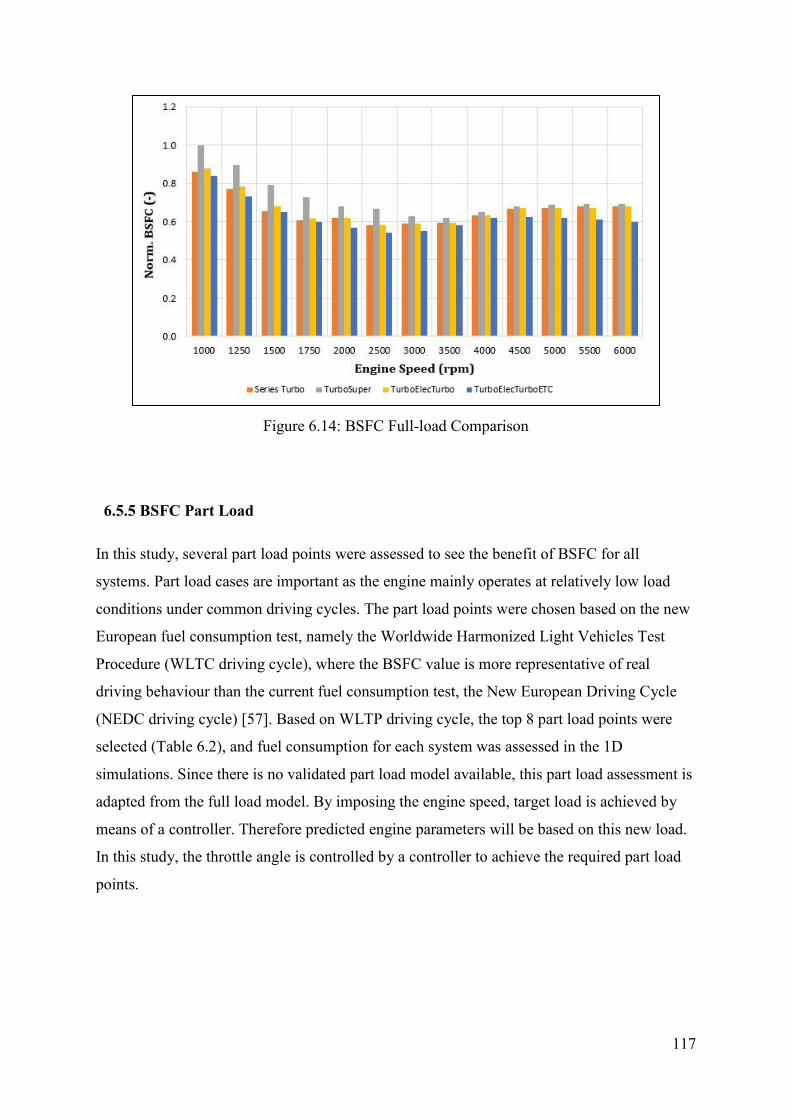
117
Figure 6.14: BSFC Full-load Comparison
6.5.5 BSFC Part Load
In this study, several part load points were assessed to see the benefit of BSFC for all
systems. Part load cases are important as the engine mainly operates at relatively low load
conditions under common driving cycles. The part load points were chosen based on the new
European fuel consumption test, namely the Worldwide Harmonized Light Vehicles Test
Procedure (WLTC driving cycle), where the BSFC value is more representative of real
driving behaviour than the current fuel consumption test, the New European Driving Cycle
(NEDC driving cycle) [57]. Based on WLTP driving cycle, the top 8 part load points were
selected (Table 6.2), and fuel consumption for each system was assessed in the 1D
simulations. Since there is no validated part load model available, this part load assessment is
adapted from the full load model. By imposing the engine speed, target load is achieved by
means of a controller. Therefore predicted engine parameters will be based on this new load.
In this study, the throttle angle is controlled by a controller to achieve the required part load
points.
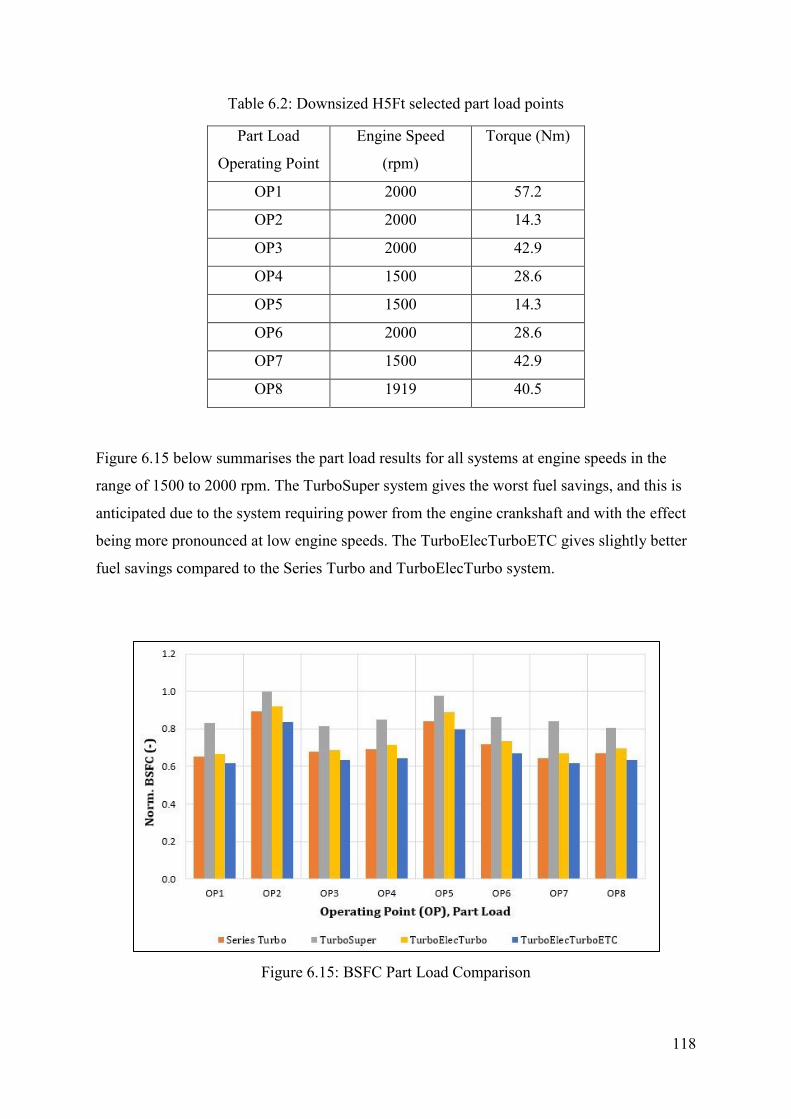
118
Table 6.2: Downsized H5Ft selected part load points
Part Load
Operating Point
Engine Speed
(rpm)
Torque (Nm)
OP1 2000 57.2
OP2 2000 14.3
OP3 2000 42.9
OP4 1500 28.6
OP5 1500 14.3
OP6 2000 28.6
OP7 1500 42.9
OP8 1919 40.5
Figure 6.15 below summarises the part load results for all systems at engine speeds in the
range of 1500 to 2000 rpm. The TurboSuper system gives the worst fuel savings, and this is
anticipated due to the system requiring power from the engine crankshaft and with the effect
being more pronounced at low engine speeds. The TurboElecTurboETC gives slightly better
fuel savings compared to the Series Turbo and TurboElecTurbo system.
Figure 6.15: BSFC Part Load Comparison
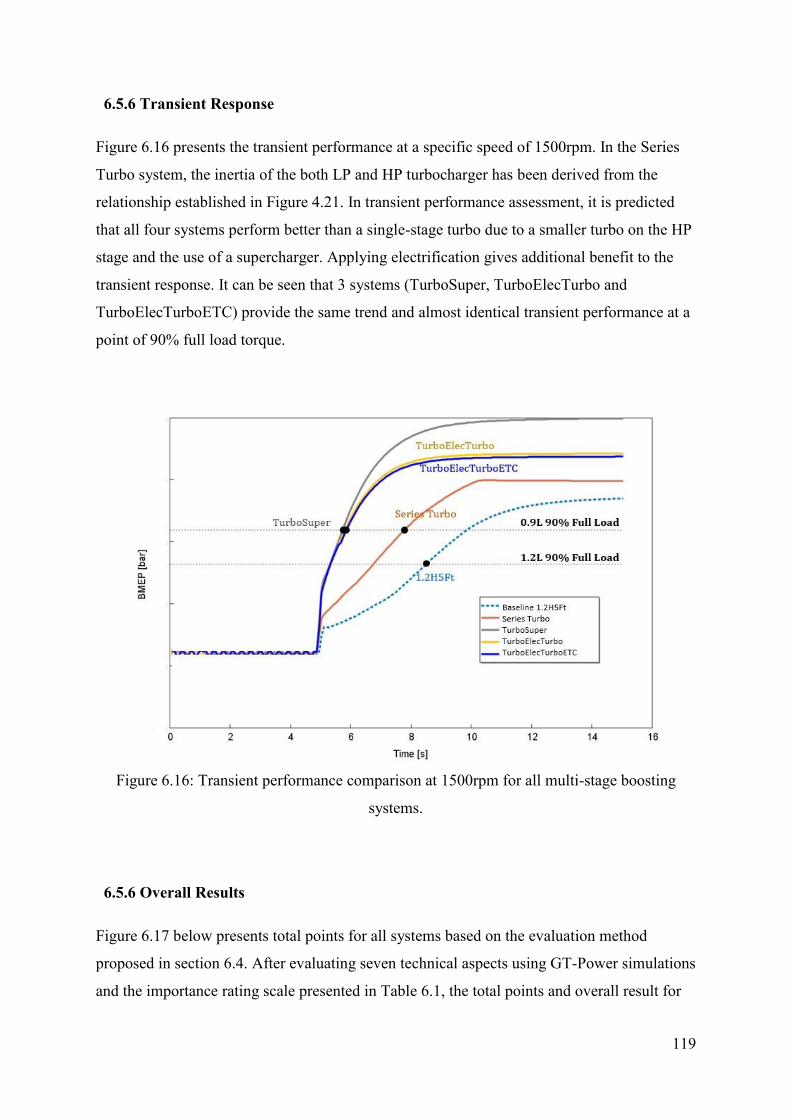
119
6.5.6 Transient Response
Figure 6.16 presents the transient performance at a specific speed of 1500rpm. In the Series
Turbo system, the inertia of the both LP and HP turbocharger has been derived from the
relationship established in Figure 4.21. In transient performance assessment, it is predicted
that all four systems perform better than a single-stage turbo due to a smaller turbo on the HP
stage and the use of a supercharger. Applying electrification gives additional benefit to the
transient response. It can be seen that 3 systems (TurboSuper, TurboElecTurbo and
TurboElecTurboETC) provide the same trend and almost identical transient performance at a
point of 90% full load torque.
Figure 6.16: Transient performance comparison at 1500rpm for all multi-stage boosting
systems.
6.5.6 Overall Results
Figure 6.17 below presents total points for all systems based on the evaluation method
proposed in section 6.4. After evaluating seven technical aspects using GT-Power simulations
and the importance rating scale presented in Table 6.1, the total points and overall result for

120
four downsized multi-stage system is summarised in Figure 6.17 (radar chart), and Table 6.3
where the systems sorted by ranking.
Figure 6.17: Multi-stage systems overall result.
Table 6.3: Multi-stage systems sorted by ranking.
Name Boosting System Ranking
TurboElecTurboETC LP Turbocharger + Electric Turbocharger + Electric
Turbocompounding (ETC)
1
TurboElecTurbo LP Turbocharger + Electric Turbocharger 2
Series Turbo Two-stage series system 3
TurboSuper LP Turbocharger + Supercharger (mechanically driven) 4
121
6.6 Summary
An extensive simulation work has been undertaken to predict the potential of implementing
electric turbo assist (ETA) system for the 1.2H5Ft engine. The main benefit of implementing
electric turbo assist is the ability of the system to store surplus energy (generator) when boost
pressure produced by the turbocharger exceeds Torque/BMEP demand, thus eliminating the
function of waste-gate. Another advantage is improved transient response, particularly at low
engine speed by electrification (motor). This study shows applying ETA into the baseline
1.2H5Ft engine improves the BSFC by approx. 0.8% on average over the speed range. A
combination of turbine sizing and ETA system gives further benefit by 2.4% in average and
proves that the transient response is significantly improved compared to the baseline engine.
A single-stage turbocharger is unable to meet torque curve (similar to baseline engine) for
Renault downsized 0.9H5Ft engine. Several potential multi-boosting systems have been
selected to assess the overall performance (based on seven criteria) on the Renault downsized
0.9H5Ft engine.
The combination of LP Turbocharger + Electrical Turbocharger + ETC, namely
TurboElecTurboETC gives the highest points based on selected technical aspects compared
to other boosting systems. Even though the TurboElecTurboETC system gives higher engine
back pressure due to flow restriction by the turbine downstream, which diminishes the benefit
of PMEP, the implementation of low-pressure turbine (LPT) design contributes to the BSFC
benefit as the LPT is designed to operate at a high efficiency at low-pressure ratio compared
to a conventional turbine. The TurboElecTurboETC system gives a further benefit at high
engine rpm due to higher surplus energy provided by the engine, outweighing the presence of
small pumping loss.
Future extension of this work will consider optimisation the 0.9H5Ft engine which will
include turbocharger matching, valve train and fuel strategy, manifold geometry optimisation,
cam phaser, charge air cooler sensitivity and others to obtain further benefit using the
selected system. Heavy downsizing also can be done for the engine to operate up to the
maximum cylinder pressure of as demonstrated by the work in reference [58] to gain further
benefit in fuel economy.
122
Chapter 7: Conclusions
This thesis accounts for work carried out to construct a 1-D model for a baseline
turbocharged gasoline engine and validate against experimental data, which include full load
and transient performance for use in various simulations throughout the study.This thesis also
introduces the integration of pulse separation with turbine matching that allows the reduction
of residual content and improved engine scavenging thus improving engine fuel consumption.
Furthermore, experimental work has been carried out on the hot test bench at Mitsubishi
Turbocharger and Engine Europe (MTEE) to study the effect of the wastegate on turbine
performance, by measuring turbine performance maps and wastegate flow characteristics at
various wastegate settings. In addition to the experimental work, the data were used in
computational simulations to provide a better physical representation of the turbocharger
turbine and to assess the significance of having an accurate waste-gate model on the
prediction of engine performance. This thesis also assessed several multi-boosting strategies
for a heavily downsized engine, the modified version of the baseline engine. The specific
objectives of the thesis were described in Chapter 1. The main conclusion was arranged in
four sections based on the set objectives.
7.1 Objective 1
To construct a 1D model for benchmarking of single-stage turbocharged engines – a
Proton 1.6L CFE engine and a Renault 1.2L H5Ft engine – and validate the model
against engine dynamometer measurements. The validation includes both full-load and
transient performance.
A Proton 1.6L CFE engine (full load) and a Renault 1.2L H5Ft engine (full load and
transient) have been modelled using a commercial 1D engine simulation software, GT-
Power. The setup of the model is based on actual engine settings and has been validated
against experimental test results to serve as the baseline model. For full load simulation, the
engine model was validated at WOT condition within an overall speed range of 1000-6500
rpm. The full load model has proved to be successful with the recorded average error of less
than 5% between simulation and actual test results. For transient simulations, the model was
set-up to replicate the actual engine test bed setting. The time difference between simulation
123
and actual test is 2.5%. Running the transient model at other engine speeds also indicates
similarly adequate validation against the test data. Therefore, all these validated GT-Power
models are asset for use as baseline models for the later stages of the study.
7.2 Objective 2
To propose a new architecture that integrates exhaust manifold design for pulse
separation and turbine matching for the purpose of preserving exhaust pulse energy
and reducing residual concentration, thus improving engine efficiency and transient
response.
This study has proposed a scaled turbine matching method and has evaluated its effectiveness
in the form of a simulation study on a Proton 1.6L CFE engine (full load) and a Renault 1.2L
H5Ft engine (transient) using the 1D engine simulation tool, GT-Power. A method of
turbocharger matching by integrating pulse separation with turbine matching is proposed. A
new pulse divided exhaust manifold is designed to preserve exhaust energy entering the
turbine, thus improving torque behaviour especially at low engine speeds. The turbine is then
scaled up in order to reduce exhaust back pressure and the in-cylinder residual gas
concentration (with associated benefits for knock). It was shown that using the turbine mass
multiplier (with corresponding meanline-predicted turbine efficiency multiplier) to up-scale
the turbine until the point of zero waste-gate authority at the peak torque speed is a sensible
approach to achieving useful reductions in engine back pressure and the level of residual gas
trapped in the engine cylinders, while maintaining the original torque target. This improved
engine scavenging reduced residual gas content by 28% on average over the engine speed
range, while the brake specific fuel consumption (BSFC) can be improved by 1.35% at
2000rpm and 0.8% on average speed before any changes to compression ratio. Increasing the
compression ratio of the engine up to the similar maximum cylinder pressure of the baseline
engine enable the BSFC to further improve by 1.83% at 2000 rpm and 1.2% on average over
the speed range.
A turbine resizing approached has been conducted on the 1.2L Renault H5Ft engine, where
the pulse divided exhaust manifold design is already implemented. This work focuses on
evaluation on transient response by considering the real turbine inertia information for
various turbine wheel diameters provided by a major turbocharger supplier. Having
124
established the relationship between turbine mass multiplier, turbine efficiency multiplier,
turbine wheel diameter, and turbine inertia, the importance of accounting for realistic turbine
inertia, particularly for transient events from low engine speeds, was emphasised through
transient load acceptance simulations. For instance, the combined effect of a 1.55 times larger
turbine and the associated inertia increase was shown to delay time-to-torque response by up
to 3.5 times. While such large delays are unlikely to be acceptable to the engine OEM, the
point of this continuous scaling matching method is that the turbine mass multiplier could be
optimised to obtain the desired balance between fuel economy and transient response.
Alternatively, matching simulation results may show a large benefit (for both steady-state
fuel efficiency and transient response) in being able to dynamically vary turbine effective
size, thereby building a case for variable turbine geometry technology in a particular
application.
Further transient response and BSFC benefit could be gained by implementing an ETA
system on the turbocharger shaft, therefore the function of waste-gate that bypass the surplus
exhaust energy to the turbine outlet can be eliminated, and the speed at low engine speed can
be electrically controlled. Implementing an ETA system and turbine sizing on the Renault
1.2H5Ft engine gives further BSFC benefit by 2.4% on average over speed range, while
maintaining transient performance.
7.3 Objective 3
To investigate the effect of a waste-gate on the turbine performance via experimental
work and propose a suitable modelling strategy.
Experimental work has been conducted to see the waste-gate effect on turbine performance.
Three types of testing include baseline hot testing (waste-gate closed), hot testing (waste-gate
open) and cold testing (turbine bypassed) has been carried out. The experimental data were
used in constructing a waste-gate model in 1D environment. The validated waste-gate model
was built into the H5Ft engine model to assess its impact on the engine performance
prediction.
125
The steady state flow experiment was carried out on the baseline hot testing with the waste-
gate is fully closed. This test was conducted to produce the baseline turbine performance map
which includes the measurement of mass flow parameter, pressure ratio and efficiency.
The hot testing was carried out with multiple waste-gate opening positions. The results of this
test show that the mass flow increases with the increase in waste-gate openings. The reason
for the increased total mass flow is that when a curtained amount of mass is passed through
the waste-gate when it is opened, needing for additional mass to pass through the turbine to
maintain speed and pressure ratio. When a bypass valve is opened, the inlet pressure of the
turbine will decrease due to increased turbine area, but in this case, the pressure ratio and
speed were kept constant, and therefore the mass flow through the turbine had to be
increased. It is also found that the turbine efficiency decreases when the waste-gate opening
increases. This is because the total mass flow for the calculation of isentropic power is
increased due to a certain amount of flow passing through the waste-gate and bypassing the
turbine rotor, hence decreasing the efficiency.
The cold testing was carried out by blocking the flow into the turbine rotor with a blind plug
so that the flow only passes through the waste-gate channel into the turbine outlet
(downstream of the turbine rotor). This test is carried out to characterize the waste-gate. From
the experiments, the discharge coefficient is calculated and used in the 1-D simulation. The
results show that discharge coefficient values increase when the waste-gate opening angle
increases, indicating that the actual mass flow value is closer to theoretical mass flow.
After completing the experiment, all inputs have been applied to the 1D model waste-gate
model, which was constructed to represent the cold testing (turbine bypassed) test bench
where the input of calculated discharge coefficient was used with L/D value. One pipe
junction has been placed before the turbine entry as the waste-gate channel, which is then
connected to the flow downstream of turbine outlet. The same method has been used for hot
testing (waste-gate open) and has been validated against experiments. The simulations were
successful in replicating the results produced in the experiments.
After validating the waste-gate model, this model has been implemented in the H5Ft engine
model to see whether having a separate waste-gate model affects the overall engine and
turbocharger performance. It can be concluded that the existence of a separate waste-gate
model does not impact on engine system and turbocharger average performance. However,
the characteristics of the pulsating flow-entering waste-gate and turbine in general is seen to
126
be affected by the presence of a separate waste-gate model, which may be useful for
optimization of turbine unsteady performance and matching in the future.
7.4 Objective 4
To assess the electrification options available for an advanced small gasoline engine.
An extensive simulation work has been undertaken to predict the potential of implementing
electric turbo assist (ETA) system for the 1.2H5Ft engine. The main benefit of implementing
electric turbo assist is the ability of the system to store surplus energy (generator) when boost
pressure produced by a turbocharger exceeds the Torque/BMEP demand, thus eliminating the
function of waste-gate. Another advantage is improved transient response particularly at low
engine speeds by electrification (motor). This study shows applying ETA into the baseline
1.2H5Ft engine improves the BSFC by approx. 0.8% (average) across the speed range. A
combination of turbine sizing and ETA system gives further benefit by 2.4% in average and
clearly proves that the transient response is significantly improved compared to the baseline
engine.
A single-stage turbocharger is unable to meet the required torque curve (similar to baseline
engine) for the Renault downsized 0.9H5Ft engine. Several potential multi-boosting systems
have been selected to assess the overall performance (seven criteria summarised in subsection
6.4 Boosting Assessment Criteria) on the Renault downsized 0.9H5Ft engine.
The combination of LP Turbocharger + Electrical Turbocharger + ETC, namely
TurboElecTurboETC scored the highest points based on technical criteria compared to other
boosting systems. Even though the TurboElecTurboETC system gives higher engine back
pressure due to restriction on the turbine downstream, which diminished the benefit of
PMEP, the implementation of low-pressure turbine (LPT) design contributes to the BSFC
benefit as the LPT design enables operation at low-pressure ratio with high efficiency
compared to conventional turbines. The TurboElecTurboETC system gives a further benefit
at high engine speeds due to higher surplus energy provided by the engine with minimal
impact on pumping loss.
127
7.5 Recommendations for Future Work
7.5.1 Experimental work to see pulsating flow effect on the waste-gate
The influence of pulsations was not part of the experiments carried out in this study. Of
course, flow pulsations could influence the waste-gate flow characteristics, but unfortunately,
the hot gas test bench used during the experiments is not capable of generating pulsations. It
would be enlightening to investigate this further, to get a clear view on the influence of
pulsations on the performance of the turbine and the engine.
7.5.2 Downsized engine optimisation
It is recommended that further optimisation work be carried out on the 0.9H5Ft engine. These
include turbocharger matching, valve train and fuel strategy, manifold geometry optimisation,
cam phaser, charge air cooler sensitivity and others to obtain further benefit using the
selected boosting systems. A higher degree of downsizing also can be done by changing bore
and stroke of the engine up to the maximum cylinder pressure of 35bar for a downsized
engine to gain further benefit in fuel economy.
128
References
[1] (2007, Accessed 26-May-2015). EU Commission Climate Action Policy for
Transport. Available:
https://ec.europa.eu/clima/policies/transport/vehicles/cars_en#tab-0-0
[2] (2014, Accessed 14-Jan-2017). ICCT The International Council on Clean
Transportation. Available: http://www.theicct.org/blogs/staff/improving-conversions-
between-passenger-vehicle-efficiency-standards
[3] (2005, Accessed 10-Aug-2016). Green Car Congress, Energy, Technologies, Issues
and Policies for Sustainable Mobility. Available:
http://www.greencarcongress.com/2005/02/doe_cofunds_12_.html
[4] N. Watson and M. S. Janota, Turbocharging the Internal Combustion Engine.
Macmillan Press Ltd., 1982.
[5] (2016, Accessed 16-Apr-2017). LS1 turbocharger engine diagram. Available:
https://ls1tech.com/how-tos/a/camaro-and-firebird-engine-modifications-419312
[6] K. D. Edwards, R. M. Wagner, T. E. Briggs, T. J. Theiss, and B. Gemmer, "Defining
engine efficiency limits," in Proc. 17th DEER Conference, Detroit, MI, USA, 2011.
[7] M. I. Ismail, A. Costall, R. Martinez-Botas, and S. Rajoo, "Turbocharger Matching
Method for Reducing Residual Concentration in a Turbocharged Gasoline Engine,"
SAE Technical Paper, 2015. Available: https://doi.org/10.4271/2015-01-1278
[8] M. I. Ismail, A. W. Costall, and R. M. Botas, "Evaluation of Scaled Turbine Matching
Method for Steady and Transient Performance Prediction of Turbocharged Passenger
Car Engines," in Proceedings of International Gas Turbine Congress, 2015.
[9] N. Watson and M. Marzouk, "A Non-Linear Digital Simulation of Turbocharged
Diesel Engines Under Transient Conditions," SAE Technical Paper, 1977. Available:
https://doi.org/10.4271/770123
[10] N. Watson, "Transient Performance Simulation and Analysis of Turbocharged Diesel
Engines," SAE Technical Paper, 1981. Available: https://doi.org/10.4271/810338
[11] N. Watson, "Turbocharged Spark Ignition Engine Simulation," SAE Technical Paper,
1984. Available: https://doi.org/10.4271/845042
[12] J. B. Heywood, Internal Combustion Engine Fundamentals. New York: McGraw-
Hill, 1988.
129
[13] M. Tancrez, J. Galindo, C. Guardiola, P. Fajardo, and O. Varnier, "Turbine adapted
maps for turbocharger engine matching," Experimental Thermal and Fluid Science,
vol. 35, pp. 146--153, 2011.
[14] L. Pohorelsky et al., "Air System Conception for a Downsized Two-Stroke Diesel
Engine," SAE Technical Paper, 2012. Available: https://doi.org/10.4271/2012-01-
0831
[15] T. Korakianitis and T. Sadoi, "Turbocharger-Design Effects on Gasoline-Engine
Performance," Journal of Engineering for Gas Turbines and Power, vol. 127, no. 3,
pp. 525-530, 2005.
[16] P. Moraal and I. Kolmanovsky, "Turbocharger Modeling for Automotive Control
Applications," SAE Technical Paper, 1999. Available: https://doi.org/10.4271/1999-
01-0908
[17] A. Pagot, A. Duparchy, X. Gautrot, P. Leduc, and G. Monnier, "Combustion
Approach for Downsizing : the IFP Concept," Oil & Gas Science and Technology,
vol. 61, no. 2006, pp. 139--153, 2006.
[18] F. Galliot, W. K. Cheng, C.-O. Cheng, M. Sztenderowicz, J. B. Heywood, and N.
Collings, "In-Cylinder Measurements of Residual Gas Concentration in a Spark
Ignition Engine," SAE Technical Paper, 1990. Available:
https://doi.org/10.4271/900485
[19] J. W. Fox, W. K. Cheng, and J. B. Heywood, "A Model for Predicting Residual Gas
Fraction in Spark-Ignition Engines," SAE Technical Paper, 1993. Available:
https://doi.org/10.4271/931025
[20] F. Westin, B. Grandin, and H.-E. Ångström, "The Influence of Residual Gases on
Knock in Turbocharged SI-Engines," SAE Technical Paper, 2000. Available:
https://doi.org/10.4271/2000-01-2840
[21] H. Aghaali and H.-E. Angstrom, "A review of turbocompounding as a waste heat
recovery system for internal combustion engines," Renewable and Sustainable Energy
Reviews, vol. 49, no. Supplement C, pp. 813 - 824, 2015.
[22] M. Algrain and U. Hopmann, "Diesel Engine Waste Heat Recovery Utilizing Electric
Turbocompound Technology," in DEER Conference, San Diego, California, 2003.
[23] I. Briggs et al., "Waste Heat Recovery on a Diesel-Electric Hybrid Bus Using a
Turbogenerator," SAE Technical Paper, 2012. Available:
https://doi.org/10.4271/2012-01-1945
[24] D. T. Hountalas, C. O. Katsanos, and V. T. Lamaris, "Recovering Energy from the
Diesel Engine Exhaust Using Mechanical and Electrical Turbocompounding," SAE
Technical Paper, 2007. Available: https://doi.org/10.4271/2007-01-1563
130
[25] A. T. C. Patterson, R. J. Tett, and J. McGuire, "Exhaust Heat Recovery using Electro-
Turbogenerators," SAE Technical Paper, 2009. Available:
https://doi.org/10.4271/2009-01-1604
[26] Y. Ismail, D. Durrieu, P. Menegazzi, P. Chesse, and D. Chalet, "Study of Parallel
Turbocompounding for Small Displacement Engines," SAE Technical Paper, 2013.
Available: https://doi.org/10.4271/2013-01-1637
[27] Y. Ismail, D. Durrieu, P. Menegazzi, P. Chesse, and D. Chalet, "Potential of Exhaust
Heat Recovery by Turbocompounding," SAE Technical Paper, 2012. Available:
https://doi.org/10.4271/2012-01-1603
[28] R. Zhao, W. Zhuge, Y. Zhang, M. Yang, R. F. Martinez-Botas, and Y. Yin, "Study of
two-stage turbine characteristic and its influence on turbo-compound engine
performance," Energy Conversion and Management, vol. 95, no. 2015, pp. 414-423,
2015.
[29] W. Zhuge, L. Huang, W. Wei, Y. Zhang, and Y. He, "Optimization of an Electric
Turbo Compounding System for Gasoline Engine Exhaust Energy Recovery," SAE
Technical Paper, 2011. Available: https://doi.org/10.4271/2011-01-0377
[30] W. Wei, Z. Weilin, Y. Zhang, and Y. He, "Comparative Study on Electric Turbo-
Compounding Systems for Gasoline Engine Exhaust Energy Recovery," ASME Turbo
Expo 2010: Power for Land, Sea and Air, vol. 5 pp. 531-539, 2010.
[31] G. Pasini et al., "Numerical Evaluation of an electric turbo compound system for SI
engines 2014-32-0013," SAE Technical Paper, 2014. Available:
https://doi.org/10.4271/2014-32-0013
[32] G. Pasini et al., "Evaluation of an electric turbo compound system for SI engines: A
numerical approach," Applied Energy, vol. 162, no. 2016, pp. 527--540, 2016.
[33] J. King et al., "Hyboost - An intelligent electrified optimised downsized gasoline
engine concept," in 10th International Conference on Turbochargers and
Turbocharging: Woodhead Publishing, 2012.
[34] D. Boggs and J. King, "Application of Synergistic Tecnologies to Achieve High
Levels of Gasoline Engine Downsizing," in DEER Conference, 2011.
[35] J. King, A. Fraser, G. Morris, and D. Durrieu. (2012) Electrification Boost for
Downsized Gasoline Engine. Autotechreview.
[36] U. Hopmann and M. C. Algrain, "Diesel Engine Electric Turbo Compound
Technology," SAE Technical Paper, 2003. Available: https://doi.org/10.4271/2003-
01-2294
131
[37] F. Millo, F. Mallamo, E. Pautasso, and G. Ganio Mego, "The Potential of Electric
Exhaust Gas Turbocharging for HD Diesel Engines," SAE Technical Paper, 2006.
Available: https://doi.org/10.4271/2006-01-0437
[38] N. Terdich and R. Martinez-Botas, "Experimental Efficiency Characterization of an
Electrically Assisted Turbocharger," SAE Technical Paper, 2013. Available:
https://doi.org/10.4271/2013-24-0122
[39] G. Technologies, GT-Power Flow Theory Manual, Version 7.5. Gamma Technologies
Inc., 2014.
[40] G. Technologies, GT-SUITE Engine Performance Application Manual, Version 7.5.
Gamma Technologies Inc., 2014.
[41] (Accessed 04-Jun-2017). Renault 1.2TGDI engine. Available:
http://www.powertrain.renault.com/our-range/powertrain-units-of-our-range/1.2-
gdih5ft
[42] W. E. Woollenweber, "The Turbocharger - A Vital Part of the Engine Intake and
Exhaust Systems," SAE Technical Paper, 1970. Available:
https://doi.org/10.4271/700534
[43] M. Capobianco and S. Marelli, "Steady and pulsating flow efficiency of a waste-gated
turbocharger radial flow turbine for automotive application," Journal of Energy, vol.
36, no. 1, pp. 459--465, 2011.
[44] M. Capobianco, F. Polidori, and S. Paulo, "Experimental Investigation on Open
Waste-Gate Behaviour of Automotive Turbochargers," SAE Technical Paper, 2008.
Available: https://doi.org/10.4271/2008-36-0052
[45] A. Lefebvre and S. Guilain, "Transient response of a Turbocharged SI Engine with an
electrical boost pressure supply," SAE Technical Paper, 2003. Available:
https://doi.org/10.4271/2003-01-1844
[46] V. Wicke, C. J. Brace, M. Deacon, and N. D. Vaughan, "Preliminary Results from
Driveability Investigations of Vehicles with Continuously Variable Transmissions,"
Proceedings of CVT’99, vol. 5, no. November 2016, pp. 9-14, 1999.
[47] A. Romagnoli and R. Martinez-Botas, "Performance prediction of a nozzled and
nozzleless mixed-flow turbine in steady conditions," (in English), International
Journal of Mechanical Sciences, vol. 53, no. 8, pp. 557-574, Aug 2011.
[48] Turbocharger Gas Stand Test Code - SAE J1826 APR89, 1989.
132
[49] N. Terdich, "Impact of Electrically Assisted Turbocharging on the Transient
Response of an Off-Highway Diesel Engine," PhD, Mechanical Engineering, Imperial
College London, 2015.
[50] M. Michon et al., "Modelling and Testing of a Turbo-generator System for Exhaust
Gas Energy Recovery," IEEE Vehicle Power and Propulsion Conference, pp. 544 -
550, Sept 2007. Available: http://ieeexplore.ieee.org/document/4544184/
[51] J. W. G. Turner et al., "Ultra Boost for Economy: Extending the Limits of Extreme
Engine Downsizing," SAE International Journal of Engines, vol. 7, no. 1, pp. 387-
417, 2014.
[52] K. J. Patton, R. C. Nitschke, and J. B. Heywood, "Development and Evaluation of a
Friction Model for Spark-Ignition Engines," SAE Technical Paper, 1989. Available:
https://doi.org/10.4271/890836
[53] Y. Shimada, S. Abou, K. Okita, and M. Chuubachi, "Development of Friction
Prediction Procedure and Friction Reduction Technologies for New Nissan HR and
MR Engines," SAE Technical Paper, 2006. Available: https://doi.org/10.4271/2006-
01-0618
[54] C. Copeland et al., "Boost system selection for a heavily downsized spark ignition
prototype engine," in 10th International Conference on Turbochargers and
Turbocharging: Woodhead Publishing, 2012.
[55] A. M. I. Bin Mamat, "Design and Development of a High Performance LPT for
Electric Turbocompounding Energy Recovery Unit in a Heavily Downsized Engine,"
PhD, Mechanical Engineering, Imperial College London, 2012.
[56] M. Kant, A. Romagnoli, A. M. Mamat, and R. F. Martinez-Botas, "Heavy-duty
engine electric turbocompounding," Proceedings of the Institution of Mechanical
Engineers, Part D: Journal of Automobile Engineering, vol. 229, no. 4, pp. 457-472,
2015.
[57] (2010, Accessed 8-July-2017). New fuel consumption data based on WLTP driving
cycle. Available: http://www.vauxhall.co.uk/discover-vauxhall/technology/wltp.html
[58] N. Fraser, H. Blaxill, G. Lumsden, and M. Bassett, "Challenges for Increased
Efficiency through Gasoline Engine Downsizing," SAE International Journal of
Engines, vol. 2, no. 1, pp. 991-1008, 2009.
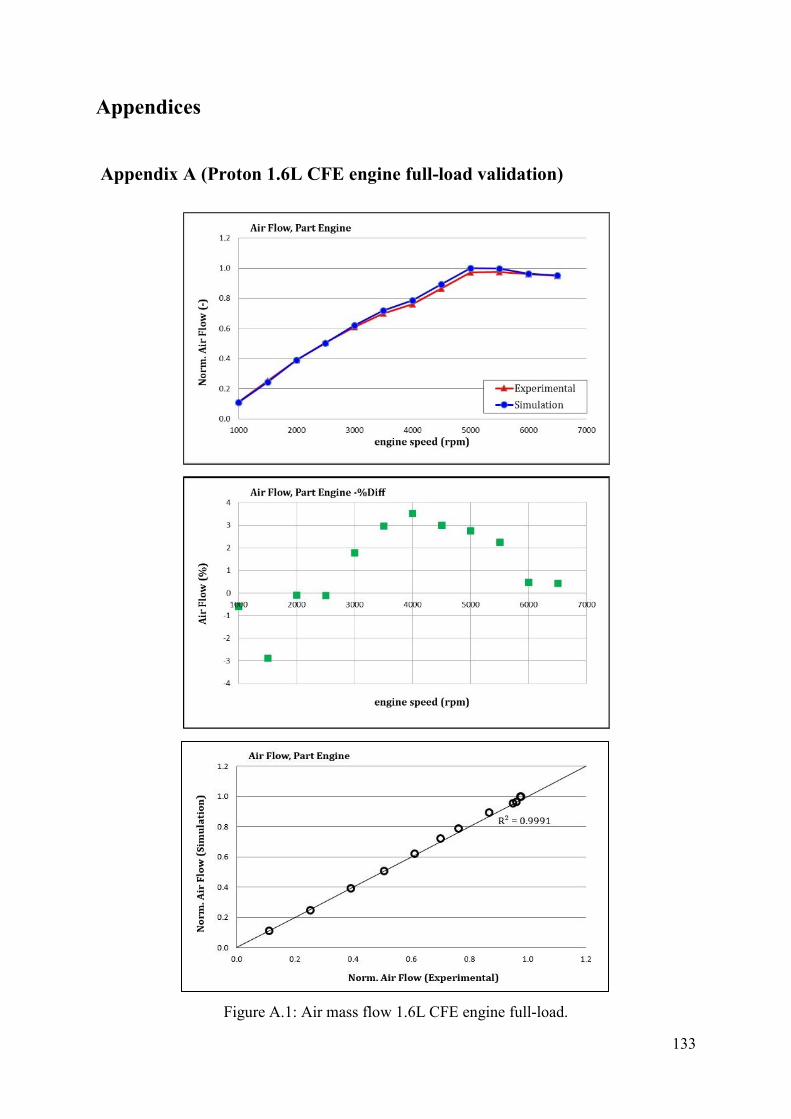
133
Appendices
Appendix A (Proton 1.6L CFE engine full-load validation)
Figure A.1: Air mass flow 1.6L CFE engine full-load.

134
Figure A.2: Fuel Mass Flow 1.6L CFE engine full-load.
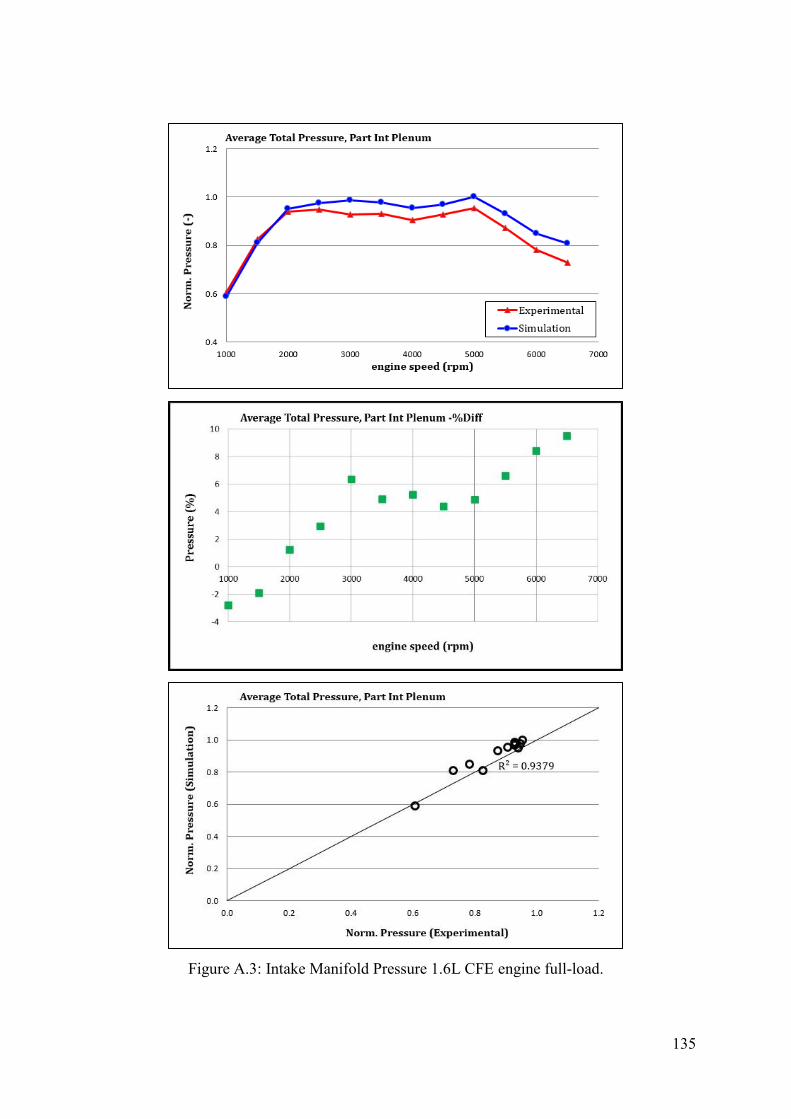
135
Figure A.3: Intake Manifold Pressure 1.6L CFE engine full-load.
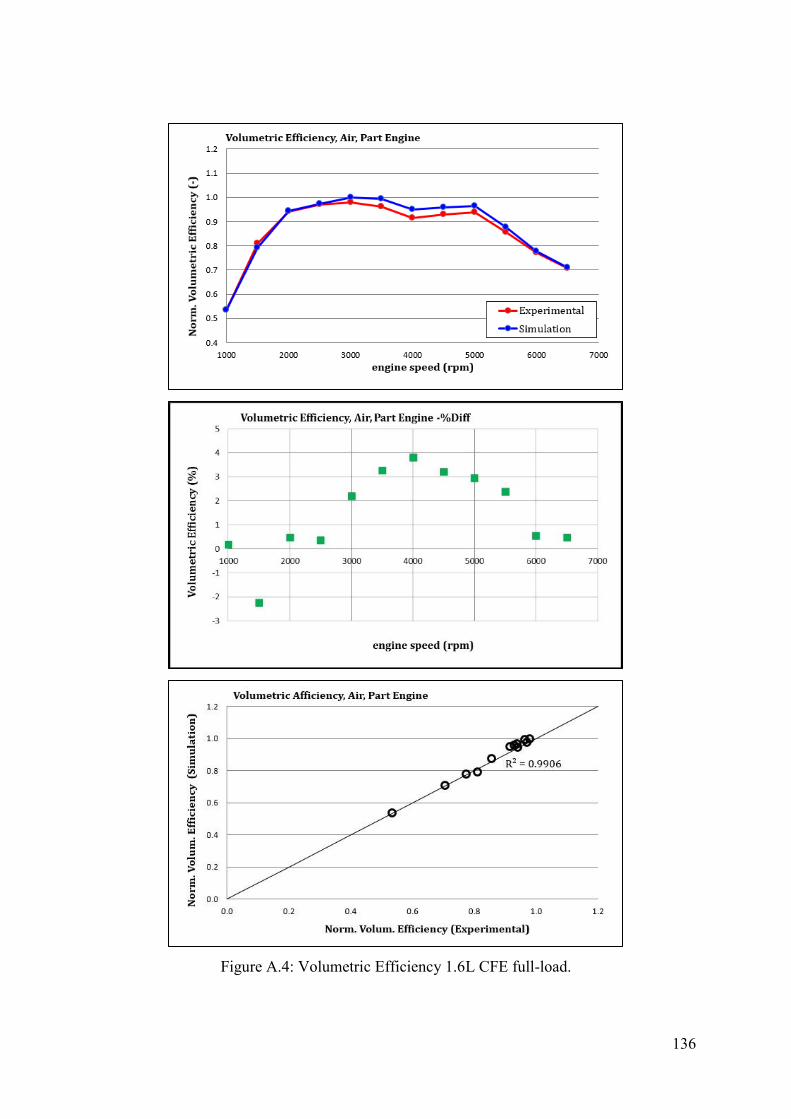
136
Figure A.4: Volumetric Efficiency 1.6L CFE full-load.
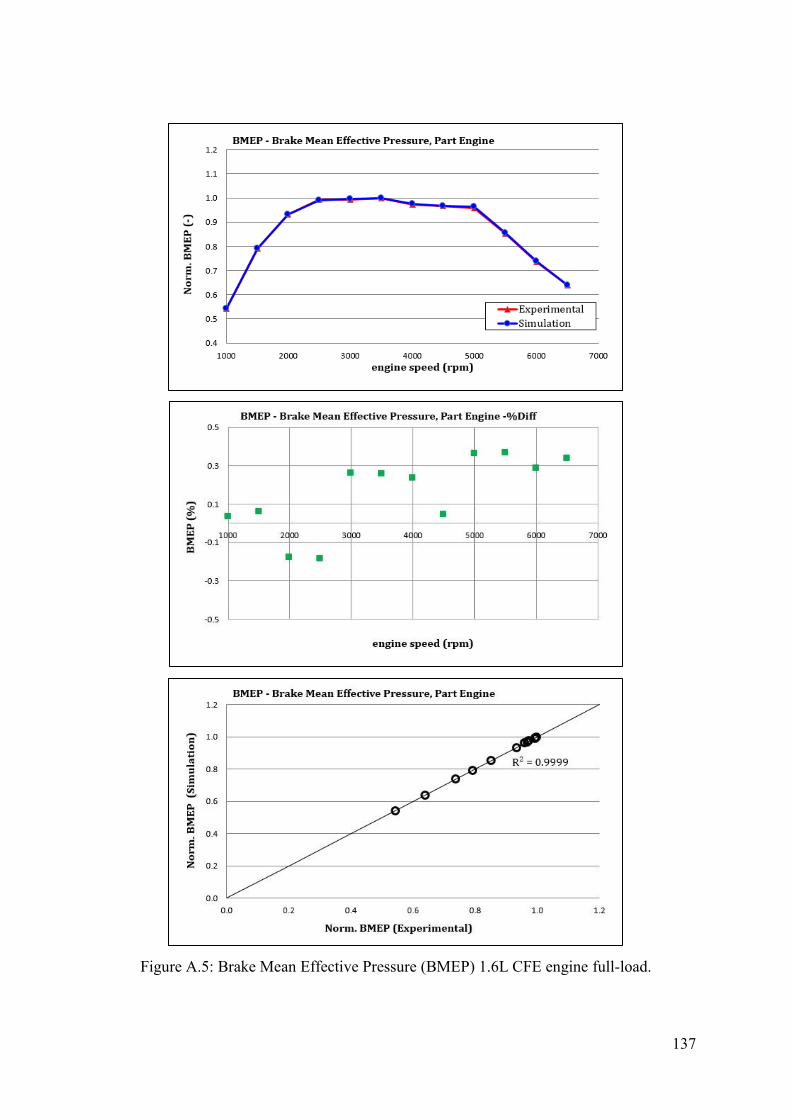
137
Figure A.5: Brake Mean Effective Pressure (BMEP) 1.6L CFE engine full-load.
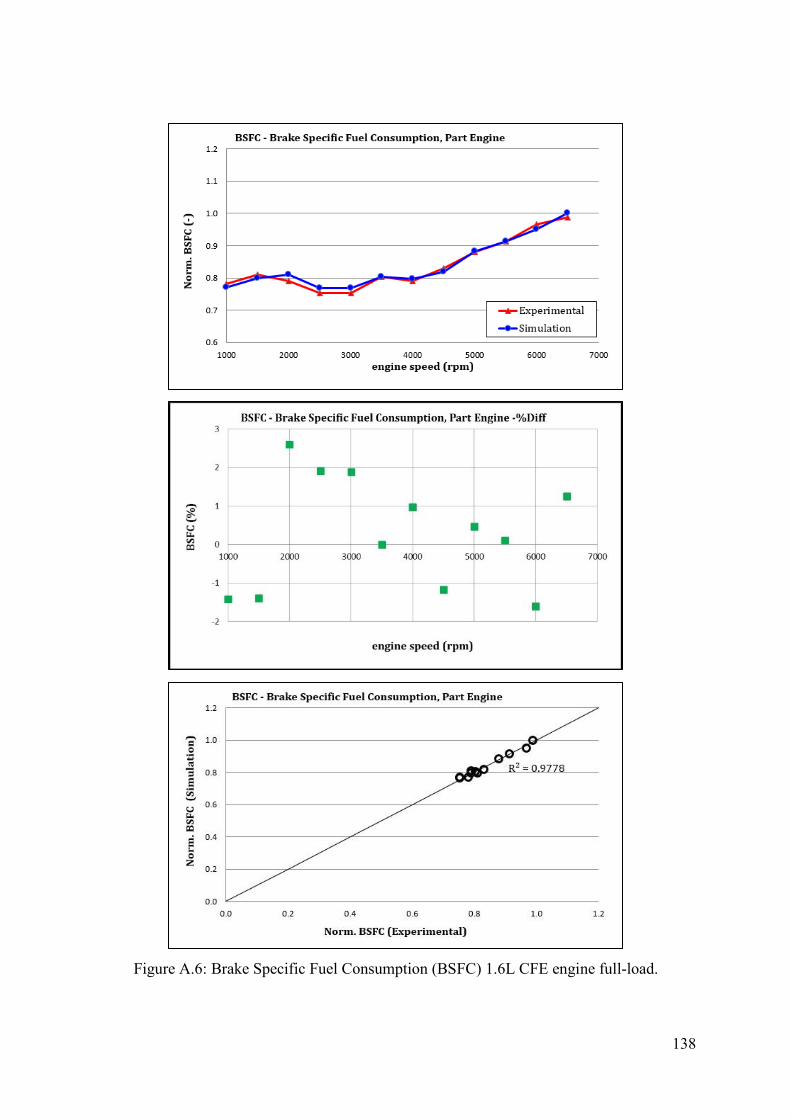
138
Figure A.6: Brake Specific Fuel Consumption (BSFC) 1.6L CFE engine full-load.
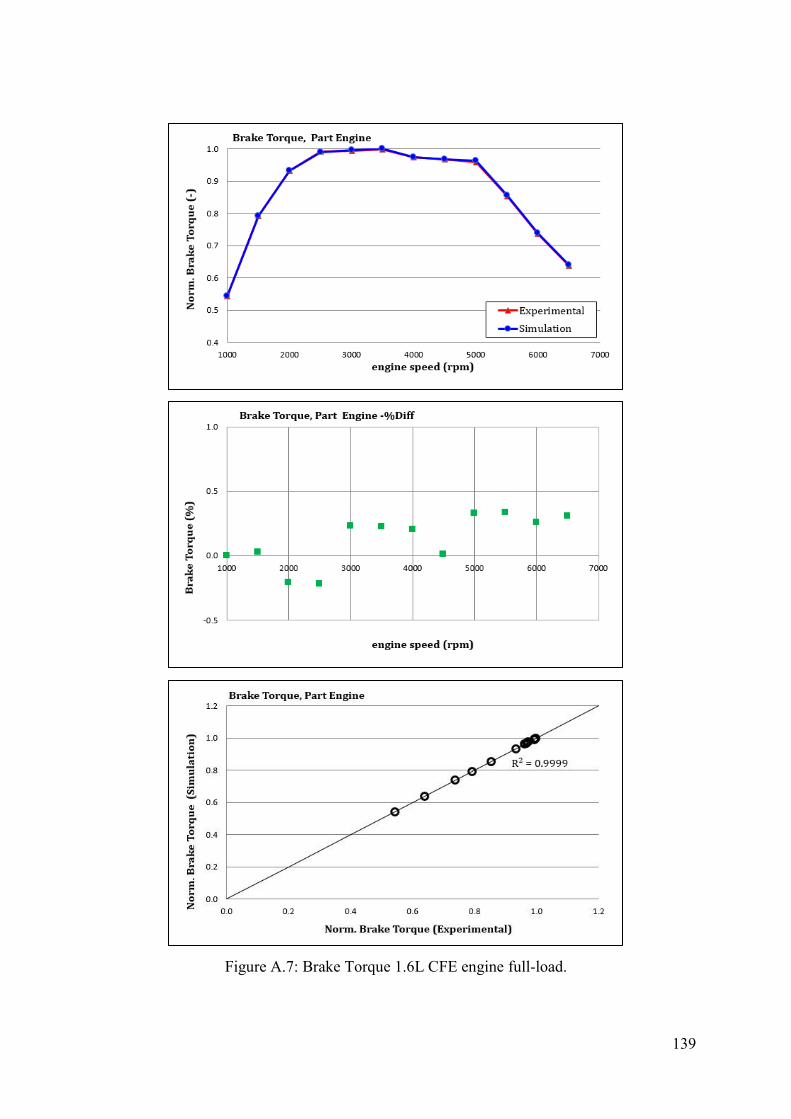
139
Figure A.7: Brake Torque 1.6L CFE engine full-load.

140
Figure A.8: Brake Power 1.6L CFE engine full-load.
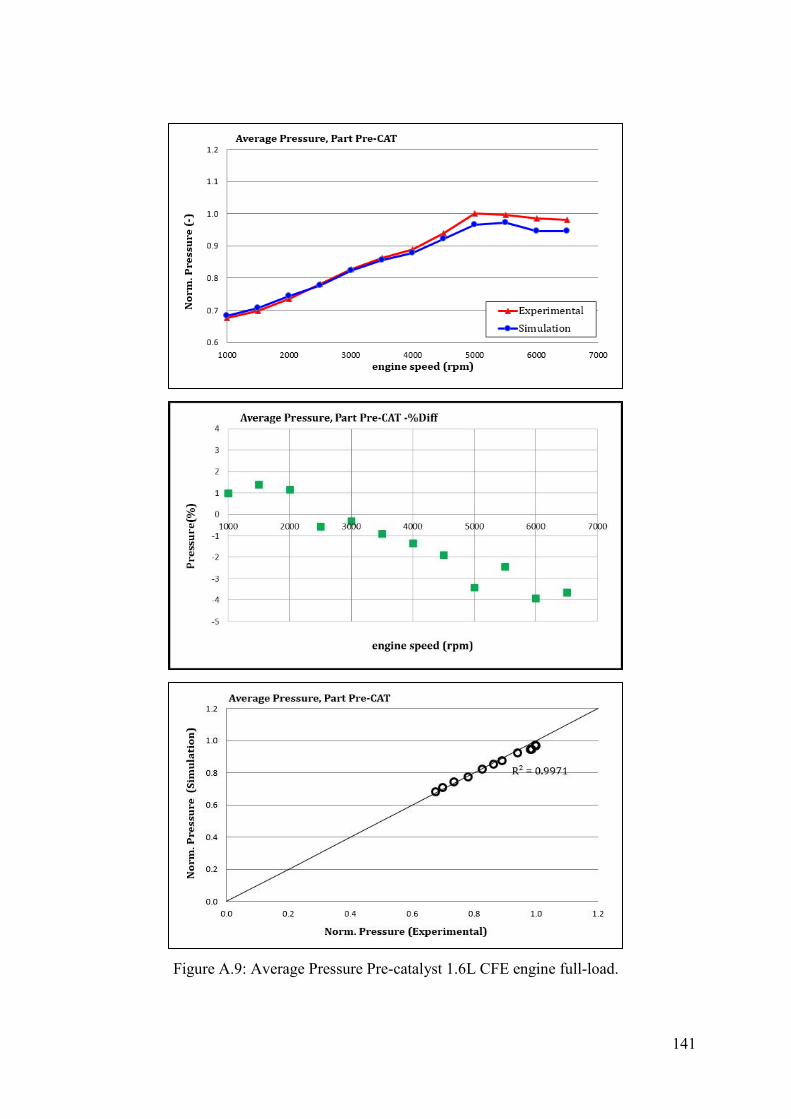
141
Figure A.9: Average Pressure Pre-catalyst 1.6L CFE engine full-load.

142
Figure A.10: Average Pressure Post-catalyst 1.6L CFE engine full-load.
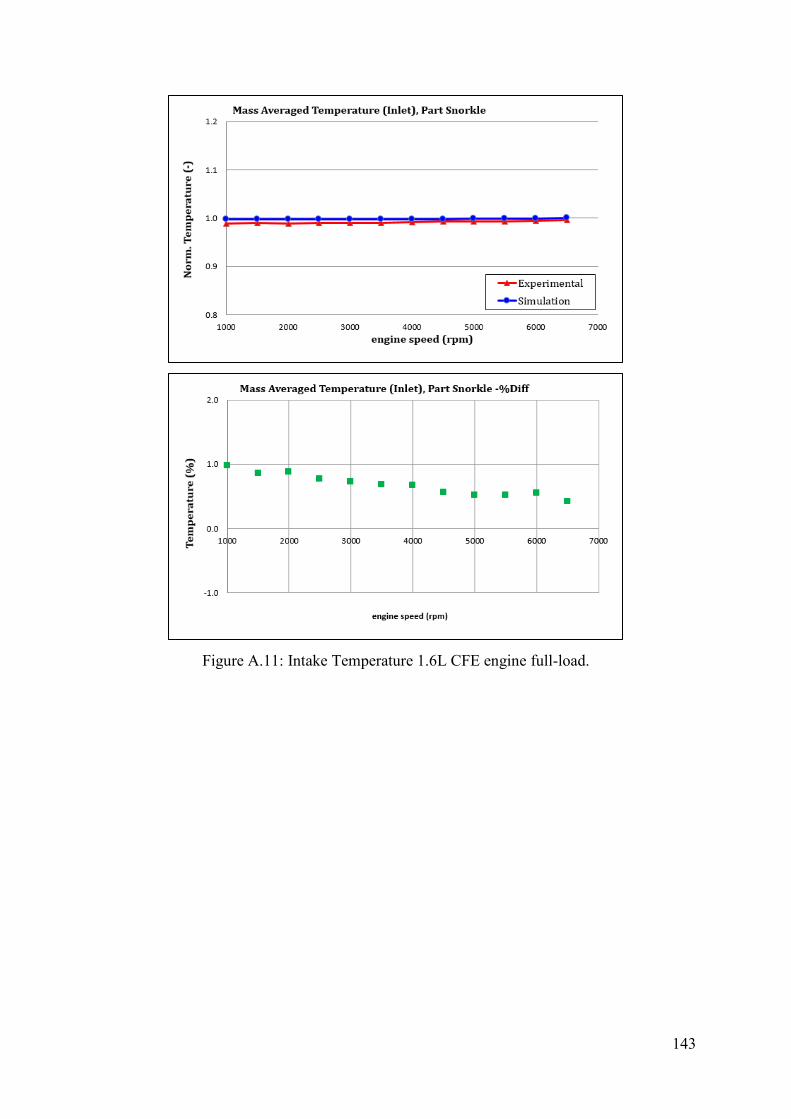
143
Figure A.11: Intake Temperature 1.6L CFE engine full-load.
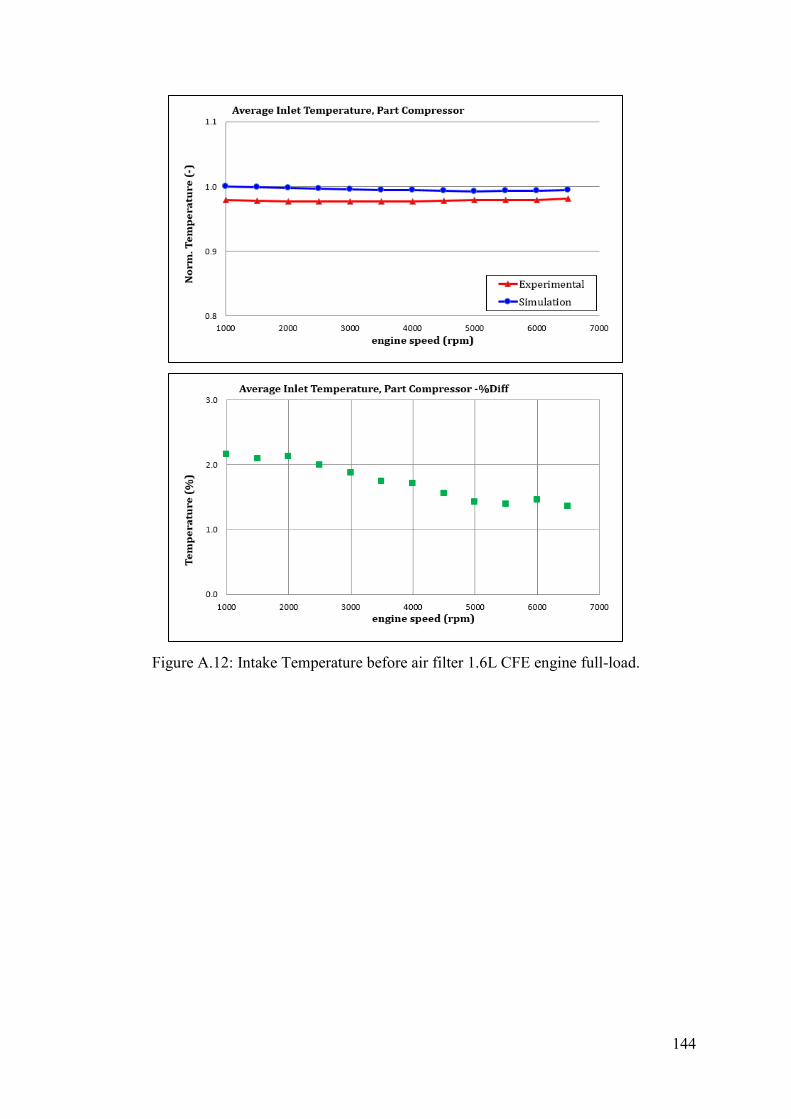
144
Figure A.12: Intake Temperature before air filter 1.6L CFE engine full-load.
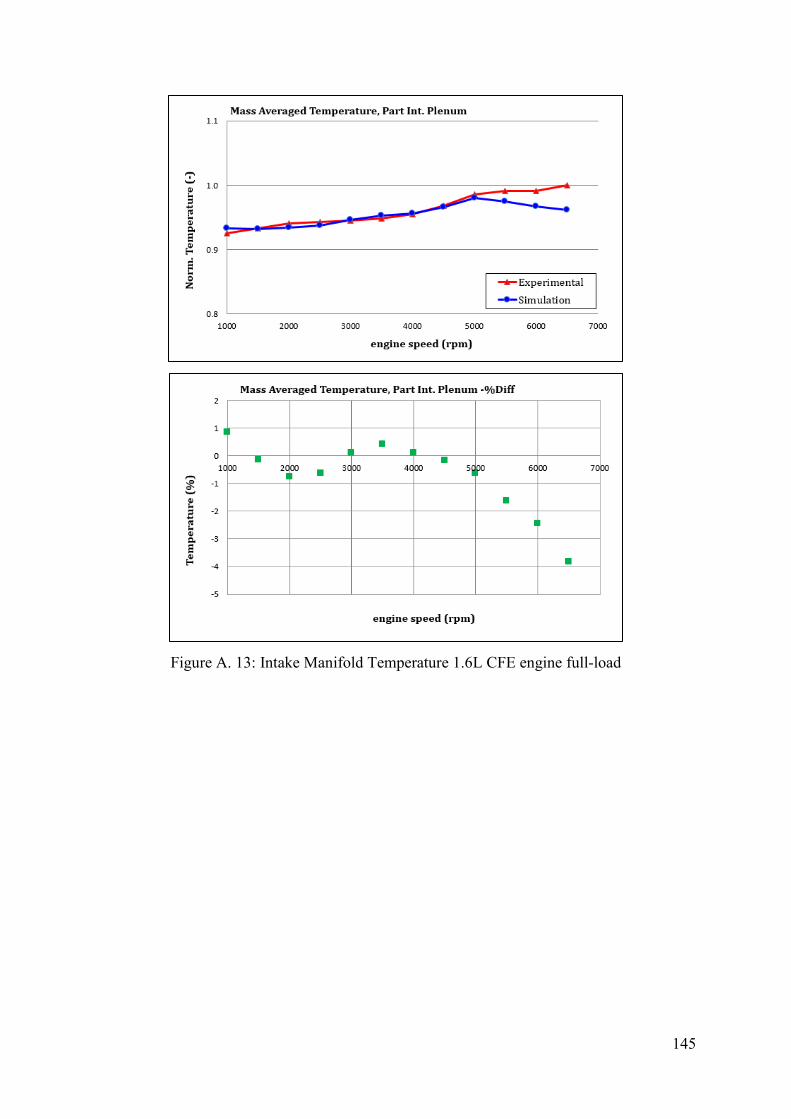
145
Figure A. 13: Intake Manifold Temperature 1.6L CFE engine full-load
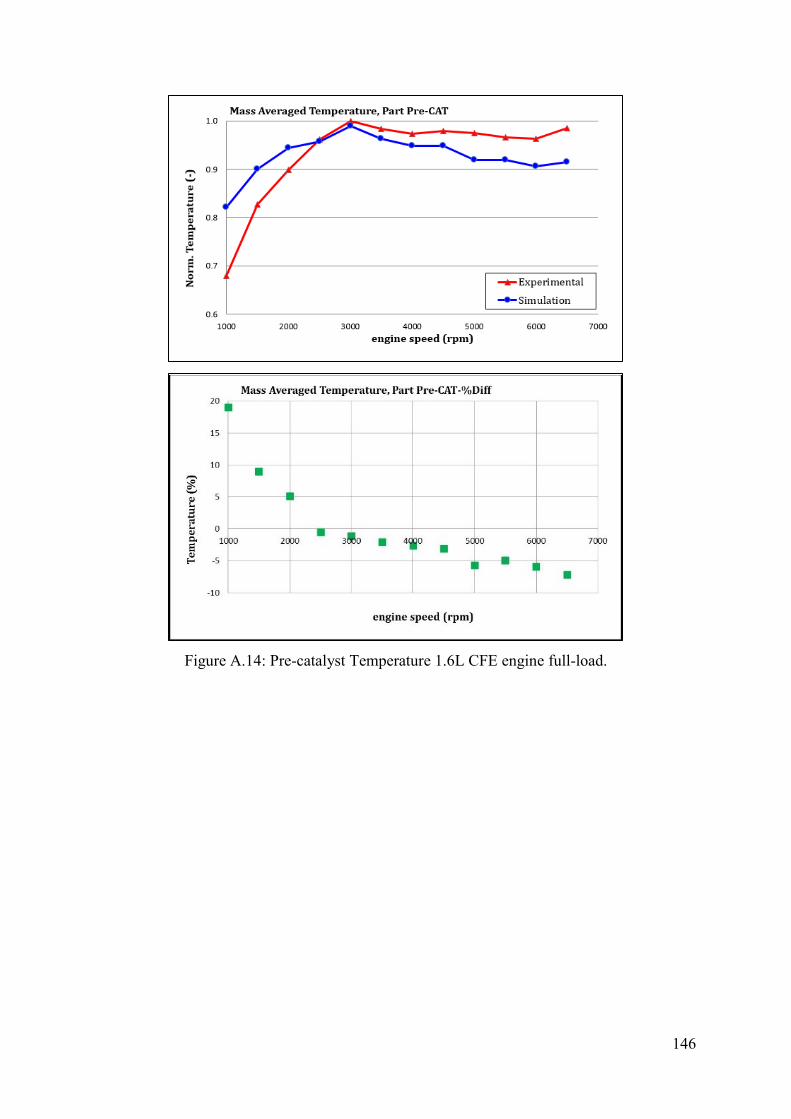
146
Figure A.14: Pre-catalyst Temperature 1.6L CFE engine full-load.
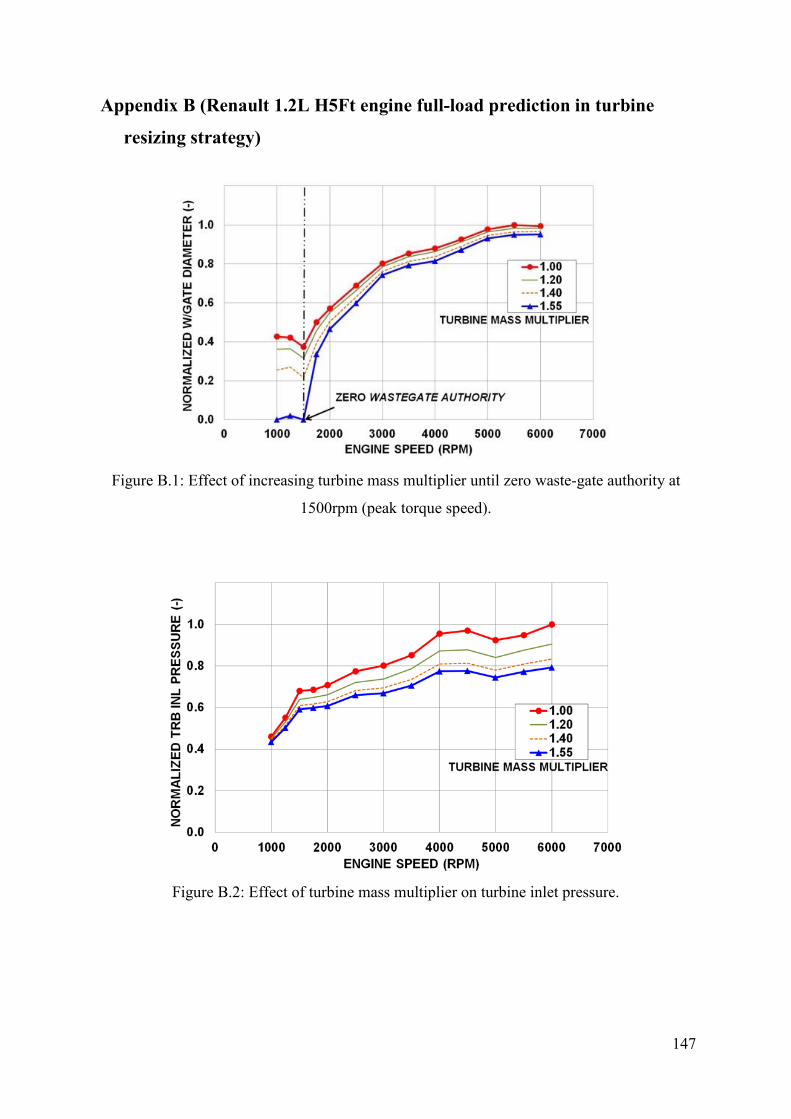
147
Appendix B (Renault 1.2L H5Ft engine full-load prediction in turbine
resizing strategy)
Figure B.1: Effect of increasing turbine mass multiplier until zero waste-gate authority at
1500rpm (peak torque speed).
Figure B.2: Effect of turbine mass multiplier on turbine inlet pressure.
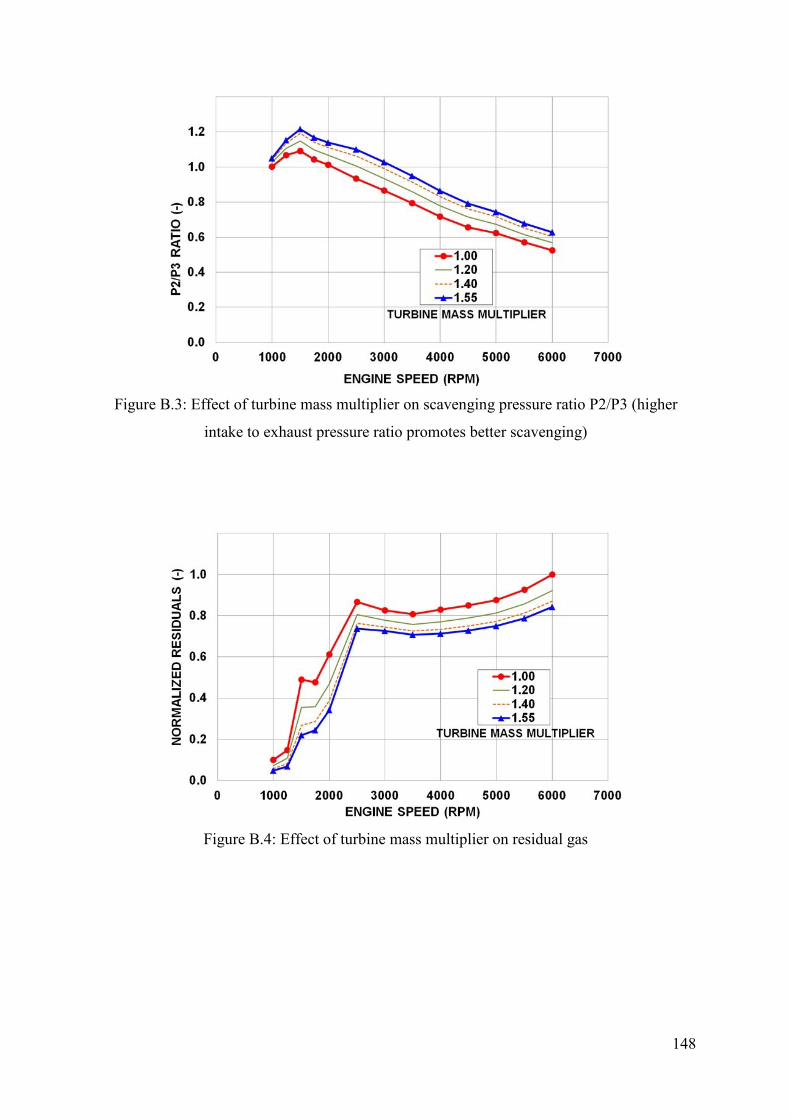
148
Figure B.3: Effect of turbine mass multiplier on scavenging pressure ratio P2/P3 (higher
intake to exhaust pressure ratio promotes better scavenging)
Figure B.4: Effect of turbine mass multiplier on residual gas
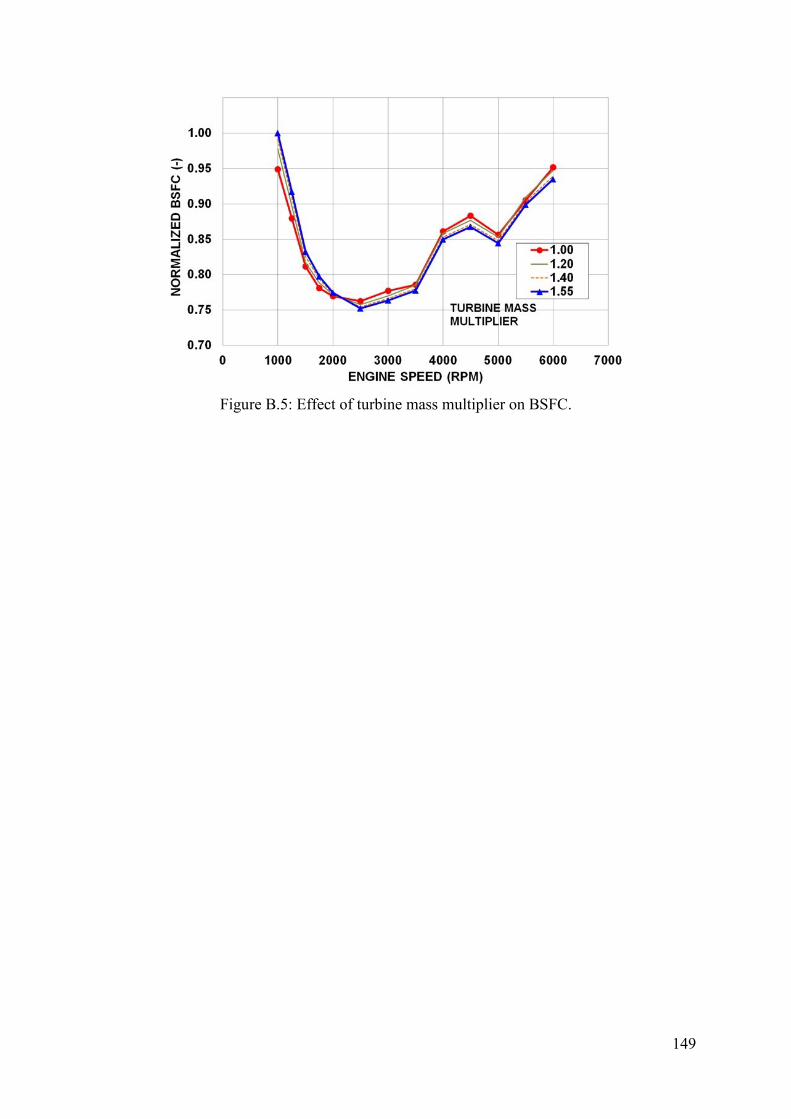
149
Figure B.5: Effect of turbine mass multiplier on BSFC.
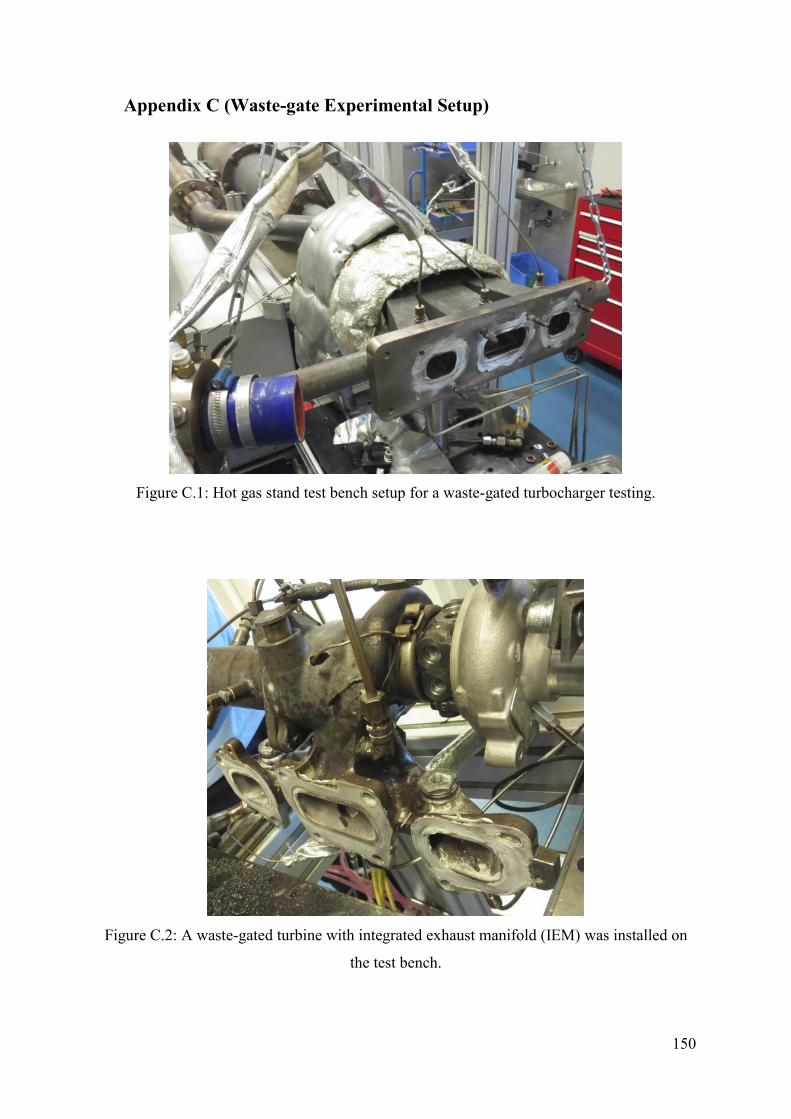
150
Appendix C (Waste-gate Experimental Setup)
Figure C.1: Hot gas stand test bench setup for a waste-gated turbocharger testing.
Figure C.2: A waste-gated turbine with integrated exhaust manifold (IEM) was installed on
the test bench.
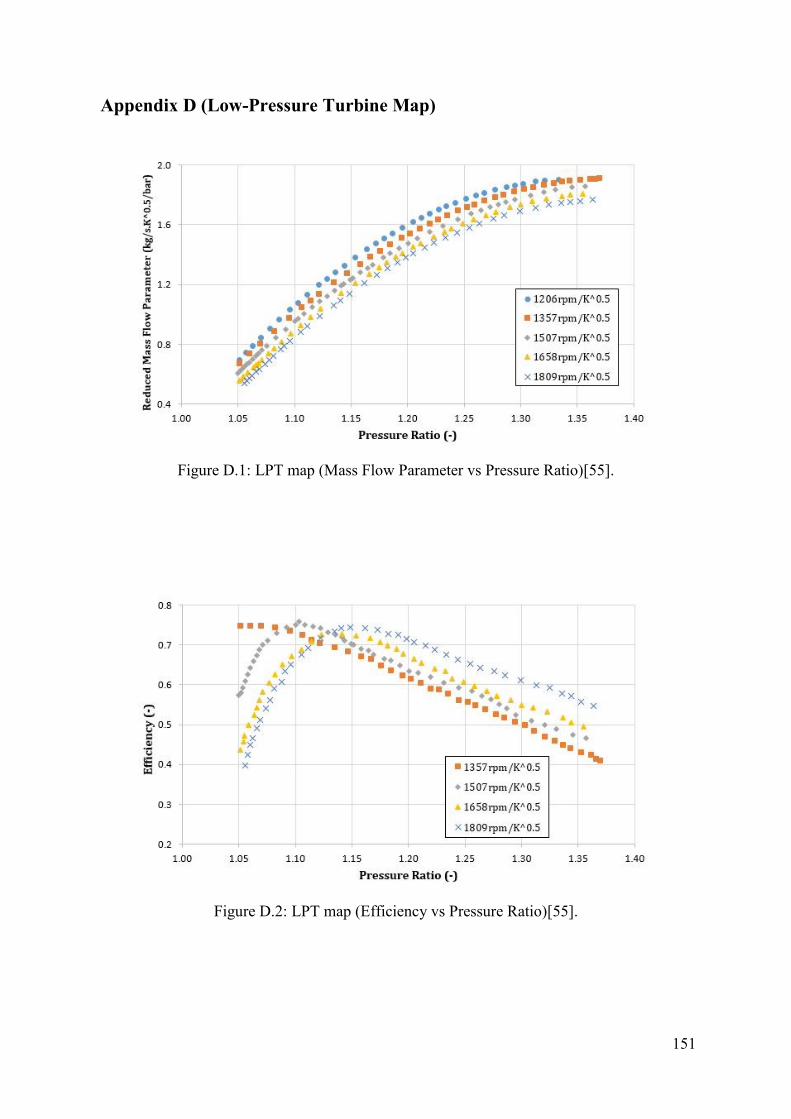
151
Appendix D (Low-Pressure Turbine Map)
Figure D.1: LPT map (Mass Flow Parameter vs Pressure Ratio)[55].
Figure D.2: LPT map (Efficiency vs Pressure Ratio)[55].
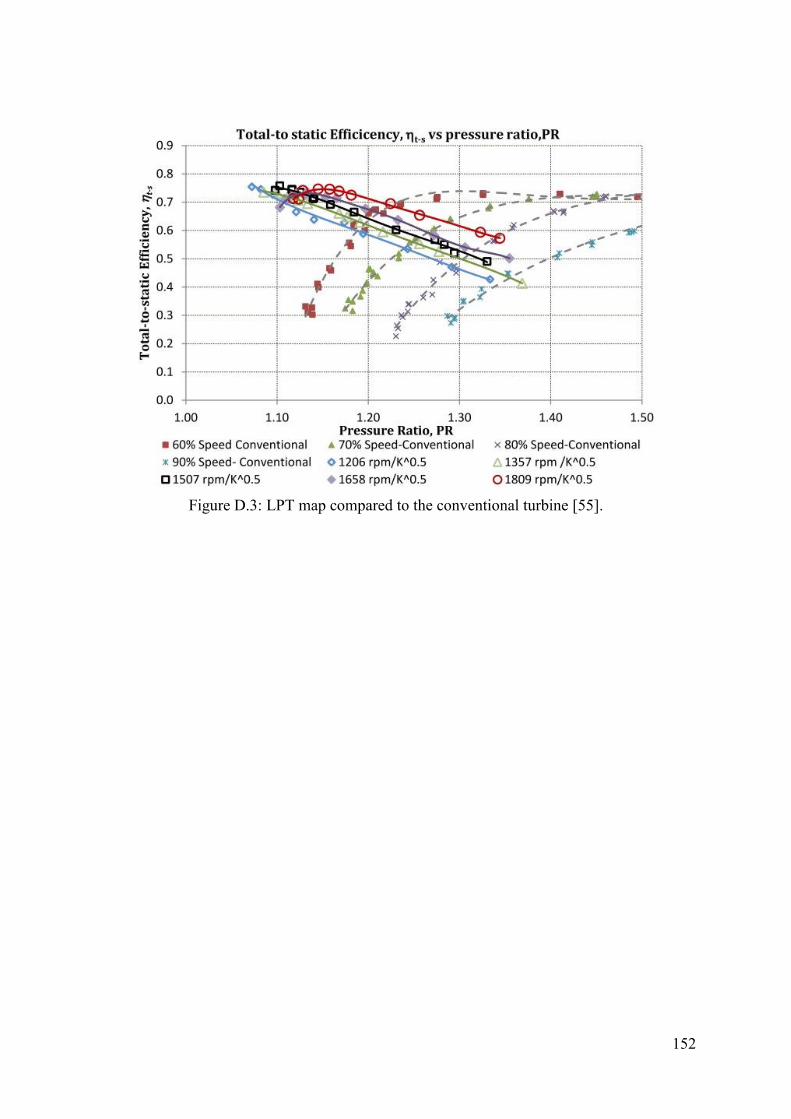
152
Figure D.3: LPT map compared to the conventional turbine [55].