one total maximum daily load for bacteria in oso bay
TRANSCRIPT
TCEQ Adopted: August 22, 2007EPA Approved: June 6, 2008
One Total Maximum Daily Load for Bacteria in Oso Bay Segment 2485
P r e p a r e d b y t h e : C h i e f E n g i n e e r ’ s O f f i c e , W a t e r P r o g r a m s , T M D L S e c t i o n
TEXAS COMMISSION ON ENVIRONMENTAL QUAL ITY

One TMDL for Oso Bay, Segment 2485
Distributed by the Total Maximum Daily Load Program
Texas Commission on Environmental QualityMC-203
P.O. Box 13087 Austin, Texas 78711-3087
TMDL project reports are available on the TCEQ web site at: <www.tceq.state.tx.us/goto/tmdl/>
This document is based in large part on technical reports prepared for the TCEQ by the Center for Coastal Studies at Texas A&M University, Corpus Christi.
Texas Commission on Environmental Quality ii Adopted August 2007

One TMDL for Oso Bay, Segment 2485
Contents Executive Summary......................................................................................................................... 1
Introduction ..................................................................................................................................... 2
Problem Definition.......................................................................................................................... 3
Endpoint Identification.................................................................................................................... 6
Source Analysis............................................................................................................................... 7
Land Use ................................................................................................................................... 7Point Sources ............................................................................................................................ 8Nonpoint Sources.................................................................................................................... 10Data Analysis.......................................................................................................................... 13Seasonal Trends ...................................................................................................................... 14
Linkage Analysis........................................................................................................................... 16
Model Calibration................................................................................................................... 17Decay Rate ....................................................................................................................... 18Event Concentrations ....................................................................................................... 18Dry-Day Loading.............................................................................................................. 19Existing Loads.................................................................................................................. 21
Model Predictions................................................................................................................... 21Dry-Day loading Removed............................................................................................... 21Allowable Loads .............................................................................................................. 23
Margin of Safety............................................................................................................................ 27
Pollutant Load Allocation ............................................................................................................. 27
Oso Bay TMDL in Annual Units............................................................................................ 29Expressing Load Allocation in Daily Units............................................................................ 30
Seasonal Variation ........................................................................................................................ 33
Public Participation ....................................................................................................................... 33
Implementation and Reasonable Assurances ................................................................................ 33
Implementation Processes to Address the TMDL......................................................................... 35
References ..................................................................................................................................... 38
Figures Figure 1: Project Watershed ......................................................................................................... 3Figure 2: Land Use, 2003 ............................................................................................................. 7Figure 3. City Limits of Corpus Christi in Oso Bay Watershed ................................................ 10Figure 4: Location of Potential Bacteria Sources from Sanitary Survey ................................... 11Figure 5: Sampling locations...................................................................................................... 13
Texas Commission on Environmental Quality iii Adopted August 2007

One TMDL for Oso Bay, Segment 2485
Figure 6: Enterococci Concentrations Measured at Ambient Monitoring Stations from May 19, 2005 through June 8, 2006................................................................... 14
Figure 7: Salinity Concentrations Measured at Ambient Monitoring Stations from May 19, 2005 through June 8, 2006................................................................... 15
Figure 8: Water Temperature Measured at Ambient Monitoring Stations from May 19, 2005 through June 8, 2006................................................................... 15
Figure 9: Dissolved Oxygen Measured at Ambient Monitoring Stations from May 19, 2005 through June 8, 2006................................................................... 16
Figure 10: Revised Bi-Hourly Model Process Flow Chart........................................................... 17Figure 11: Subwatersheds with Sampling Point at Outlets (pour points) .................................... 18Figure 12: Daily Load Allocations as Function of Flow Rate...................................................... 32
Tables Table 1: Water Quality Standards for Oso Bay .......................................................................... 4Table 2: Water Quality Bacteria Assessment Results for Oso Bay ............................................ 4Table 3: Land Use Distribution, 2003......................................................................................... 8Table 4: Discharge Permits in the Oso Watershed...................................................................... 8Table 5: Targeted Monitoring Stations ..................................................................................... 11Table 6: Land Use Types and ECs for Oso Model ................................................................... 19Table 7: Dry-Day loading Rates Used in Oso Model ............................................................... 20Table 8: Existing Loading by Model Subwatershed ................................................................. 21Table 9: Model Output Concentrations from the Existing Load Simulation ............................ 22Table 10: Modeled Loading with Dry-Day Loads Removed...................................................... 23Table 11: Model Output Concentrations from the No Dry-Day Load Simulation ..................... 23Table 12: Allowable Loading by Model Subwatershed.............................................................. 24Table 13: Model Output Concentrations from Allowable Load Simulation............................... 25Table 14: Percent Reductions Simulated for Oso Bay by Model Subwatershed and
Source Type ................................................................................................................ 26Table 15: Portion of Each Subwatershed within Corpus Christi City Limits ............................. 28Table 16: Allowable Loading Redistributed to LA and WLA Categories.................................. 29Table 17. Daily Load Allocation for Selected Flow Values....................................................... 32
Texas Commission on Environmental Quality iv Adopted August 2007

One Total Maximum Daily Load for Bacteria in Oso Bay
Executive Summary This document describes a project to address a water quality impairment related to bacteria concentrations in Oso Bay (Segment 2485). The TCEQ first identified the bay as impaired on the state’s 2004 Texas Water Quality Inventory and 303(d) List (TCEQ 2004) because bacteria concentrations exceeded the criteria established to evaluate the contact recreation use. Oso Creek, which flows into Oso Bay, will be addressed in a separate total maximum daily load (TMDL) report that is based on analyses performed in conjunction with this TMDL.
Oso Bay is a tertiary embayment adjoining the southwesterly portion of Corpus Christi Bay. The combined watersheds of Oso Creek and Oso Bay drain a small area of approximately 235 square miles in Nueces County, Texas (Figure 1). Oso Bay has an area of about 2,963 acres (1,200 hectares). Since 2002, some of the samples taken in the bay have exceeded the Enterococci criteria.
Model-based analyses indicate that bacteria concentrations significantly exceeding contact recreation criteria occur only in the portion of Oso Bay known as the Blind Oso, and that those concentrations are the result of dry-weather loads. The TCEQ believes the source of the dry-weather loads to be the many waterfowl and shorebirds that inhabit the Blind Oso. The Blind Oso, which is included on the Texas Parks and Wildlife Department’s Great Texas Coastal Birding Trail, is a highly popular bird-watching location. A municipal domestic wastewater treatment facility discharges to the Blind Oso area, but the TCEQ did not find it to be a significant contributor to elevated bacteria concentrations in the bay.
The Blind Oso differs significantly in physical characteristics and uses from the main portion of Oso Bay. It is extremely shallow, and has a soft muddy bottom and wetland areas. The Blind Oso also provides high quality habitat for waterfowl and shorebirds. Local area stakeholders indicate that the Blind Oso is not used for contact recreation, but is used extensively by waterfowl since it provides high quality habitat.
Since the Blind Oso area differs in physical characteristics from Oso Bay, the segment boundary for Oso Bay should be evaluated further to determine if it would be more appropriate to consider the Blind Oso an unclassified water body. Any change in the segment boundary would require a revision to the Texas Surface Water Quality Standards. A use attainability analysis (UAA) may be appropriate in order to determine the existing and attainable recreational uses of the Blind Oso. If the TCEQ determines that adjustment of the recreational use and/or criteria for the Blind Oso is appropriate, load reductions in the Blind Oso area may not be needed.
The model analyses indicate that actual loads to Oso Bay proper are substantially less than the allowable TMDLs, and that the bay is generally compliant with contact recrea-
Texas Commission on Environmental Quality 1 Adopted August 2007

One TMDL for Oso Bay, Segment 2485
tion standards. The allowable loading determined by model analyses for the main bay area is more than ten times the existing loading. Therefore, no load reductions are required for Oso Bay proper at this time.
Introduction Section 303(d) of the federal Clean Water Act requires all states to identify waters that do not meet, or are not expected to meet, applicable water quality standards. For each listed water body that does not meet a standard, states must develop a TMDL for each pollutant that contributes to the impairment of water. The TCEQ is responsible for ensuring that TMDLs are developed for impaired surface waters in Texas.
In simple terms, a TMDL is like a budget that determines the amount of a particular pollutant that a water body can receive and still meet its applicable water quality standards. In other words, TMDLs are the best possible estimates of the assimilative capacity of a water body for a pollutant under consideration. A TMDL is commonly expressed as a load with units of mass per time, but may be expressed in other ways. TMDLs also estimate how much the pollutant load must be reduced from current levels in order to achieve water quality standards.
This TMDL will address the impairment of the contact recreation use due to bacteria concentrations in Oso Bay (Segment 2485). The TMDL Program is a major component of Texas’ overall process for managing surface water quality. The program addresses impaired or threatened streams, reservoirs, lakes, bays, and estuaries (water bodies) in, or bordering on, the state of Texas. The primary objective of the TMDL Program is to restore and maintain the beneficial uses—such as drinking water supply, recreation, support of aquatic life, or fishing—of impaired or threatened water bodies.
Section 303(d) of the Clean Water Act and the implementing regulations of the U.S. Environmental Protection Agency (EPA) in Title 40, Code of Federal Regulations, Part 130 (40 CFR 130) describe the statutory and regulatory requirements for acceptable TMDLs. The EPA provides further direction in its Guidance for Water Quality-Based Decisions: The TMDL Process (USEPA 1991). This TMDL document has been prepared in accordance with those regulations and guidelines.
The TCEQ must consider certain elements in developing a TMDL; they are described in the following sections:
� Problem Definition � Endpoint Identification � Source Analysis � Linkage Analysis � Margin of Safety � Pollutant Load Allocation � Seasonal Variation � Public Participation � Implementation and Reasonable Assurance
Texas Commission on Environmental Quality 2 Adopted August 2007

One TMDL for Oso Bay, Segment 2485
The commission adopted this document on August 22, 2007. Upon EPA approval, the TMDL will become an update to the state’s Water Quality Management Plan.
Problem Definition The combined watersheds of Oso Creek and Oso Bay drain a small area of approximately 235 square miles in Nueces County, Texas (Figure 1). Oso Bay is a shallow tertiary bay of about 2,963 acres that empties into Corpus Christi Bay. Oso Creek begins near the City of Robstown and flows 24.9 miles southeast to Oso Bay in the City of Corpus Christi. It is the main channel for more than 60 miles of natural and constructed drainage. The creek’s non-tidal section, 14.3 miles long, flows into a 10.6-mile tidal section before discharging to Oso Bay.
Figure 1: Project Watershed
Topographically, the basin can be characterized as flat to gently sloping remnants of Pleistocene marine terraces. The total change in elevation within the basin, from just northwest of Robstown to Oso Bay, is about 28 meters, for an overall slope of about 0.7 meters per kilometer.
Geologically, the watershed lies on the Pleistocene Beaumont Formation. The Beaumont Formation within the basin is largely made up of interdistributary muds, abandoned channel-fill muds, and fluvial over-bank muds, all of low permeability. Other parts of the ba-
Texas Commission on Environmental Quality 3 Adopted August 2007

One TMDL for Oso Bay, Segment 2485
sin represent the low to moderate permeability of meander belt, levee, crevasse splay, and distributary sand deposits.
The standards for water quality are defined in the Texas Surface Water Quality Standards (TCEQ 2000). The specific uses designated for Oso Bay are contact recreation, exceptional aquatic life use, and oyster water. Table 1 presents the uses and criteria currently applicable to Oso Bay.
Table 1: Water Quality Standards for Oso Bay
Segment Number
Segment Name Uses Criteria
2485 Oso Bay Contact Recreation Enterococci Bacteria:
Geometric Mean: 35 cfu/100 mL
Single Sample: not more than 25 percent of samples >104 cfu/100 mL*
Exceptional Aquatic Life Dissolved Oxygen:
24-hour average: > 5.0 mg/L
Daily Minimum: > 4.0 mg/L
Oyster Water Fecal coliform Bacteria:
Median: ≤ 14 cfu/100 mL
Single Sample: not more than 10 percent of samples > 43 cfu/100 mL
General pH: 6.5 – 9.0
Temperature: 95° F
* This is the corrected value expected to be included in the next revision to the TSWQS; the currently established value is 89 cfu/100 mL.
The indicator bacteria used to evaluate contact recreation use support in the bay is Enterococci. The numeric criteria defined in the 2000 Standards are as follows.
� The geometric mean of Enterococci should not exceed 35 colony-forming units (cfu) per 100 milliliters (mL) of water.
� Single samples should not exceed 89 cfu/100 mL.
However, the single-sample value is an error, and the TCEQ expects to revise the TSWQS during 2006-2008 to correct the single sample criterion for Enterococci to 104 cfu/100 mL (Davenport 2006). This TMDL will use the correct single-sample value—104 cfu/100 mL—for its calculations and reduction targets.
The standards for the contact recreation use and associated Enterococci criteria had been recently adopted when water quality was assessed for the 2002 Texas Water Quality
Texas Commission on Environmental Quality 4 Adopted August 2007

One TMDL for Oso Bay, Segment 2485
Inventory and 303(d) List (Inventory and List), so there were limited amounts of Enterococci data available for screenings. Consequently, the more abundant data on fecal coliform, the indicator bacteria used prior to 2002, were also used to assess contact recreation uses.
When using fecal coliform data to assess contact recreation:
� the geometric mean should not exceed 200 cfu/100 mL, and � single samples should not exceed 400 cfu/100 mL.
In 2002, fecal coliform data indicated that Oso Bay supported contact recreation (Table 2). Enterococci data were not sufficient to assess the bay in 2002, but the small amount then available indicated some reason for concern.
Table 2: Water Quality Bacteria Assessment Results for Oso Bay
Indicator Parameter # samples Was Geometric Mean assessment exceeded?
Was Single Sample assessment exceeded?
Oso Bay 2002 (assessment based on one station: 13440)
Fecal Coliform 12 No (Geometric Mean = 60)
No (1/12 =8.3% exceeded)
Enterococci 6 Insufficient Data (Geometric mean = 43)
Insufficient Data (3/6 = 50% exceeded)
Oso Bay 2004 (assessment based on three stations: 13440, 13441, 13442)
Fecal Coliform 68 Yes Geometric Means were:
23 at Station 13440 307 at Station 13441 48 at Station 13442
Yes (at one station) 3/18 = 16.7% at Station 13440
8/18 = 44.4% at 13441 3/32 = 9.4% at 13442
Enterococci 68 Yes Geometric Means were:
36.6 at Station 13442 295 at Station 13441 54 at Station 13440
Yes 6/18 = 33.3% at Station 13442
16/18 = 88.9% at Station 13441 12/32 = 37.5% at 13440
Oso Bay 2006 * Assessment Unit 2485_02 includes stations 13440, 15003, 17119, 18249 Assessment Unit 2485_03 includes stations 13441, 13442, 17118, 18248
Fecal Coliform 2485_02 2485_03
31 16
No No
No No
Enterococcus 2485_02 2485_03
37 17
Yes (geometric mean = 59) No
Yes (14/37 = 37.8%) No
* 2006 303(d) List is subject to EPA approval
Texas Commission on Environmental Quality 5 Adopted August 2007

One TMDL for Oso Bay, Segment 2485
Additional sampling of bacteria in the Oso Bay system was conducted prior to 2004 to assure sufficient data sets for assessment. In the 2004 Inventory and List, part of Oso Bay was identified as impaired for contact recreation, based on both Enterococci and fecal coliform data (Table 2). Oso Bay was placed in Category 5(a) of the 303(d) List, and a TMDL project began.
Endpoint Identification All TMDLs must identify a quantifiable water quality target that indicates the desired water quality condition and provides a measurable goal for the TMDL. The TMDL endpoint also serves to focus the technical work to be accomplished and as a criterion against which to evaluate future conditions.
For certain parameters, the primary water quality endpoint for the TMDL is explicitly set forth in the TSWQS. In other cases, the state standards may not establish a numeric criterion for the parameters of concern. In those cases, current scientific literature, cause-andeffect relationships established from scientific studies, or other appropriate means are used to establish the endpoint for the TMDL.
Establishing the endpoint for the TMDL is an integral part of the TMDL process, and manifests many of the same complexities that are encountered in the development of TMDLs. Through the analysis of water quality data and modeling exercises, it becomes possible, at least to some degree, to define quantitative values for various parameters that can serve as target conditions.
Specification of endpoint conditions implies a corresponding set of critical conditions; yet there is not necessarily one unique set of these critical conditions. The parameter for which an endpoint condition is defined may not be the parameter that characterizes pollutant loading, and may not be in itself sufficient to ensure attainment of the desired use of the water body.
The endpoints for this TMDL are expressed as concentrations of Enterococci bacteria in units of cfu/100 mL. The endpoints represent both the geometric mean and single-sample methods defined in the Standards and the Guidance for Assessing Texas Surface and Fin-ished Drinking Water Quality Data (TCEQ 2004). The allowable loading was determined from model simulations that were compared to the numeric endpoints listed below.
The endpoints for this TMDL are that, for surface water samples collected from Oso Bay to represent ambient water quality:
� The annual geometric mean of Enterococci concentrations should not exceed 35 cfu/100 mL.
� Enterococci concentrations should not exceed 104 cfu/100 mL more often than 25 percent of the time (or 25 percent of samples).
Texas Commission on Environmental Quality 6 Adopted August 2007

One TMDL for Oso Bay, Segment 2485
Source Analysis Pollutants may come from several sources, both point and nonpoint. The possible sources of pollutants are discussed in this section.
Land Use There are a variety of land uses within the watershed of Oso Bay and Oso Creek (Figure 2, Table 3). Land use data layers were acquired from the United States Geological Survey Earth Resource Observation and Science Data Center (NCDC 2005), depicting the 2003 National Land Cover Dataset (NLCD), as shown in Figure 2. For modeling purposes, the 20 land use categories in the NLCD dataset were clustered into four larger categories, as shown in Table 3.
Agricultural row crops are the predominant land use by far, but urban residential and commercial land uses are significant in areas near Oso Bay, and some of the monitoring sites on Oso Creek. There are also small areas of concentrated residential land use outside of city limits or municipal jurisdiction. Storm water runoff from both agricultural and urban areas may be a source of bacteria loading.
Figure 2: Land Use, 2003
Texas Commission on Environmental Quality 7 Adopted August 2007

One TMDL for Oso Bay, Segment 2485
Table 3: Land Use Distribution, 2003
NLCD Classifications for Oso Basin
Class ID Type
Area (square meters)
Percent of Total
Oso Model Classifications
11 Water 12,365,625 2.03% Not Classified
21 Low Intensity Residential 11,045,693 1.81% Residential
22 High Intensity Residential 35,128,910 5.77% Residential
23 Commercial/Industrial/Transportation 27,908,531 4.58% Commercial/ Industrial/ Transportation
31 Bare Rock/Sand/Clay 12,942,915 2.13% Not Classified
32 Quarries/Strip Mines/Gravel Pits 7,789,829 1.28% Not Classified
33 Transitional 0 0% -----
41 Deciduous Forest 10,150,382 1.67% Not Classified
42 Evergreen Forest 3,874,244 0.64% Not Classified
43 Mixed Forest 11,596,810 1.91% Not Classified
51 Shrubland 6,716,444 1.10% Cropland/ Rangeland
61 Orchards/Vineyards/Others 0 0% -----
71 Grasslands/Herbaceous 64,285,045 10.56% Cropland/ Rangeland
81 Pasture/Hay 8,821,194 1.45% Cropland/ Rangeland
82 Row Crops 381,741,357 62.71% Cropland/ Rangeland
83 Small Grains 0 0% -----
84 Fallow 0 0% -----
85 Urban/Recreational Grass 6,654,853 1.09% Cropland/ Rangeland
91 Woody Wetland 3,642,858 0.60% Not Classified
92 Emergent Herbaceous Wetlands 4,037,207 0.66% Not Classified
Total 608,701,897 100.00%
Point Sources A sanitary survey was conducted to identify possible sources of bacteria within the Oso Creek and Oso Bay watershed. The survey included literature and database searches, historic GIS datasets, and field observations. There are 10 permitted discharges to Oso Bay
Texas Commission on Environmental Quality 8 Adopted August 2007

One TMDL for Oso Bay, Segment 2485
and Oso Creek, with permitted daily average discharge volumes ranging from 1,500 gallons per day to 540 million gallons per day (MGD) (Table 4). The approximate locations of permitted discharges are shown in Figure 3 and Figure 4.
Table 4: Discharge Permits in the Oso Watershed
Permitted Facility (Bold font below indicates discharges to Oso Bay )
Texas Permit Number
Maximum Permitted Daily Average Flow
(MGD)
Tennessee Pipeline Construction Co. 14228-001 0.06
Texas A&M University – Agricultural Extension Service 11345-001 0.0015
Corpus Christi Peoples Baptist Church – Roloff WWTF 11134-001 0.02
City of Corpus Christi – Oso WWTF 10401-004 16.2
City of Corpus Christi – Greenwood WWTF 10401-003 8.0
City of Robstown WWTF 10261-001 3.0
City of Corpus Christi – Storm Water 04200-000 NA
Texas A&M University – Shoreline Env Res Facility 03646-000 0.99
Equistar Chemical LP – Corpus Christi Plant 02075-003 2.0
American Electric and Power – Barney Davis Power Station 01490-000 540.0
There are six domestic wastewater treatment plants in the combined Oso Creek and Oso Bay watershed. Three of the domestic wastewater plants have permits for discharges greater than one million gallons per day (>1.0 MGD): one in Robstown, and two in Corpus Christi. The other three domestic wastewater plants have small permitted discharge rates (<1.0 MGD). All domestic wastewater facilities are required to disinfect effluent before discharge, using chlorination or ultra-violet light. Facilities larger than 1.0 MGD that use chlorination must also de-chlorinate to reduce toxic effects on stream organisms.
The Corpus Christi Greenwood wastewater treatment facility (WWTF) also has an effluent limit for fecal coliform. Self-reporting data (Beaber 2005) indicate that fecal coliform concentrations from the Greenwood facility range from zero to 800 cfu/100ml with a mean value of 10.5 and a geometric mean of 3.53. Two other permitted facilities discharge treated wastewater from industrial facilities. These industrial wastewater discharges are not expected to have high concentrations of pathogens or bacteria.
The majority of daily discharges are from wastewater treatment plants, but the largest volume (540 MGD) is cooling water discharged from the Barney Davis Power Plant. Cooling water is withdrawn from the very salty Laguna Madre, passes through the power plant and its cooling ponds, and is then discharged into the upper end of Oso Bay.
Texas Commission on Environmental Quality 9 Adopted August 2007
One TMDL for Oso Bay, Segment 2485
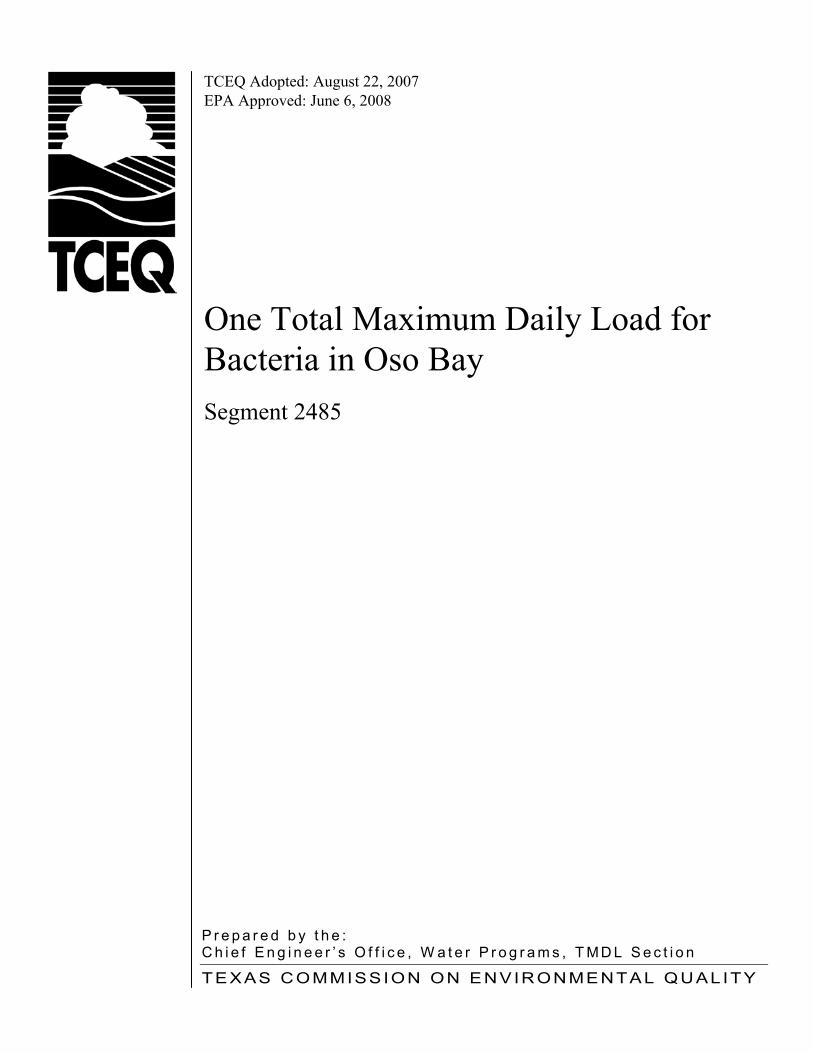
Figure 3. City Limits of Corpus Christi in Oso Bay Watershed
The Barney Davis facility has recently been producing less power than its capacity, so cooling water discharge is often much less than the permitted amount, and sometimes there is no discharge.
There is also one municipal separate storm sewer system (MS4) permit for storm water discharge issued to the City of Corpus Christi. MS4 permits do not impose maximum daily flow limits, since the quantity of storm water on any day or within any month cannot be controlled by human endeavor. Storm water effluent is typically controlled through best management practices (BMPs).
Storm water discharge is categorized as a point source for TMDL purposes when there are permits that cover the discharges, as may be the case for cities. In the Oso watershed, the storm water discharges from areas covered by the City of Corpus Christi’s MS4 permit are therefore point sources, while other storm water discharges in the watershed are categorized as nonpoint sources. Figure 3 depicts the Corpus Christi city limit in relation to monitoring sites and permitted discharges within the Oso Bay watershed.
Texas Commission on Environmental Quality 10 Adopted August 2007
One TMDL for Oso Bay, Segment 2485
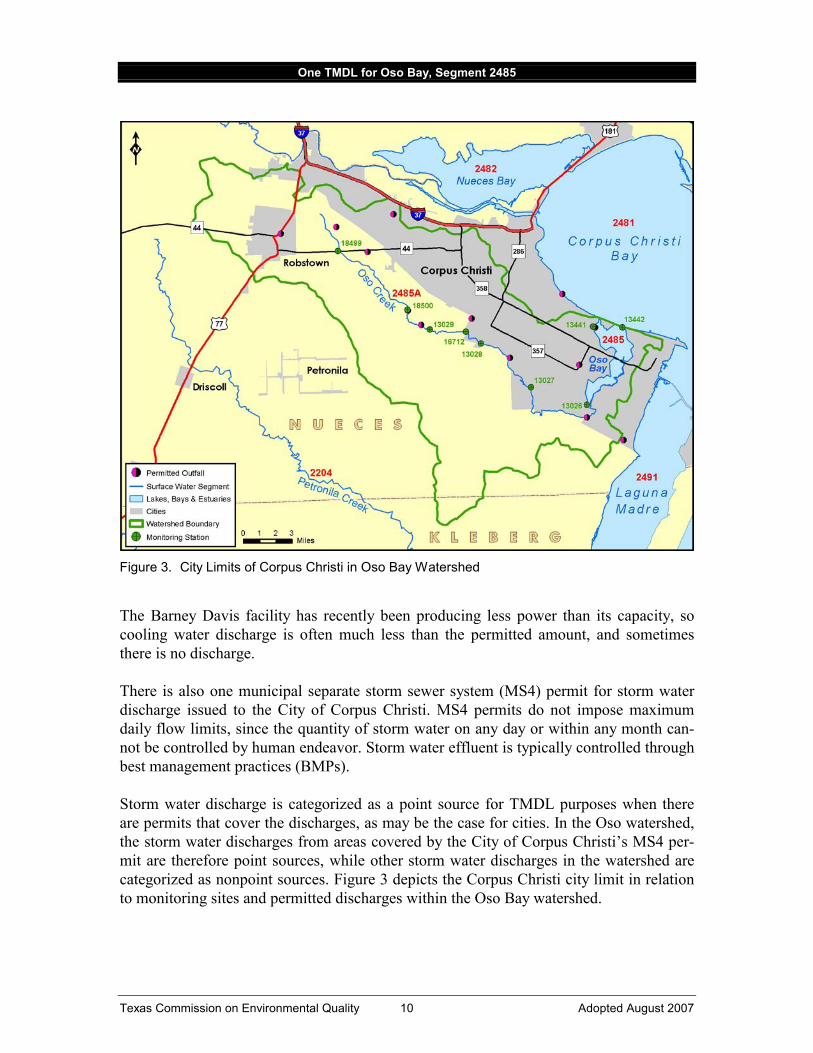
Nonpoint Sources The Oso Creek and Oso Bay watershed was first assessed using aerial imagery to examine land use and accessibility for sampling. The Texas A&M University–Corpus Christi project managers, the lab’s quality assurance officer, the lab’s manager, and the field supervisor conducted a field survey on January 7, 2005. Each ambient site was visited. Locations along the creek that were accessible by road were noted, and the staff determined whether water access was possible either by wading from the banks or by bridge. Livestock, colonias, and any other potential sources of bacteria were observed, recorded, and marked on a map (Figure 4). Geographic coordinates of each potential site were taken using a hand-held Global Positioning System (GPS) device.
Figure 4: Location of Potential Bacteria Sources from Sanitary Survey
The sites listed in Table 5 were identified for field sampling to assess sources based on the sanitary survey, historic data locations, and stakeholder input. The locations of the sampling sites are shown in Figure 5.
Collection of field data began on May 19, 2005. Weekly samples were collected at 11 ambient stations on Oso Creek and Oso Bay. Storm water runoff was sampled for significant events at the 11 ambient stations and at 11 source assessment sites. All sampling and measurements took place under the approved Oso Creek and Oso Bay Bacteria TMDL Project Quality Assurance Project Plan (QAPP).
Texas Commission on Environmental Quality 11 Adopted August 2007

One TMDL for Oso Bay, Segment 2485
Table 5: Targeted Monitoring Stations
Station ID Description
S1 Oso WWTF outfall
S2 Corpus Christi urban storm-water drainage ditch
S3 Robstown urban storm-water drainage ditch
S4 Colonia with various livestock and septic systems
S5 Flour Bluff storm water ditch with livestock, primarily horses, grazing close by
S6 Corpus Christi storm water ditch with some nearby livestock
S7 Ditch downstream from Robstown WWTF
S8 Ditch collecting runoff from Elliot landfill
S9 Ditch at Colonia with septic systems
S10 Ditch collecting agriculture field runoff
S11 Creek flowing from Pharos Golf Course into Oso Bay
13442 Oso Bay at Ocean Drive
13441 Oso Bay at the Hans Suter Park
13440 Oso Bay at South Padre Island Drive
13026 Oso Bay at Yorktown Road
13027 Oso Creek (tidal) at FM 2444
13028 Oso Creek (tidal) at SH 286
16712 Oso Creek (tidal) at La Volla Creek
13029 Oso Creek at FM 763
18501 West Oso Creek at FM 665
18500 Oso Creek at FM 665
18499 Oso Creek at SH 44
In Oso Bay, a notable nonpoint source of bacteria is the dense concentration of birds near Hans Suter Park in the portion of Oso Bay known as the Blind Oso. Boardwalks have been constructed in the wetland areas of Hans Suter Park to facilitate bird watching. This area is one of the sites listed by the Texas Parks and Wildlife Department as part of the Great Texas Coastal Birding Trail.
Data Analysis All data was analyzed to evaluate processes that may generate bacteria, contribute to flow in the creek, impede or enhance water flow through the Creek/Bay system, or affect the survival of bacteria. Much of the data analysis was performed using geographic information system (GIS) software. More information about analyses of the data is available in the technical reports (Hay & Mott 2005; Hay & Mott 2006) that supported preparation of this TMDL.
Texas Commission on Environmental Quality 12 Adopted August 2007

One TMDL for Oso Bay, Segment 2485
Figure 5: Sampling locations
Concentrations of the indicator bacteria Enterococci for all stations over the period of sampling ranged from one cfu/100 mL to 97,000 cfu/100 mL, with a mean value of 3,752 cfu/100 mL and a geometric mean value of 483 cfu/100 mL. Many of the highest measurements of Enterococci concentrations occurred during the wet-weather sampling event of June 2006, including the highest concentration (97,000 cfu/100 ml), which was measured on June 2, 2006, at targeted station S6.
Many of the targeted stations produced high bacteria concentrations during wet-weather sampling, yielding a wet-weather geometric mean concentration for all targeted stations of 1,572 cfu/100 mL. Enterococci concentrations in Oso Bay ranged from one to 11,650 cfu/100 mL, with a geometric mean of 41 cfu/100 mL. However, considering only dry-weather sampling events, the geometric mean concentration for Oso Bay was only 17 cfu/100 mL.
General trends in data can be clearly seen in the surface plots of Enterococci, salinity, water temperature, and dissolved oxygen (Figures 6 through 9). Parameter concentrations (zaxis) are plotted against time (x-axis). Monitoring stations are listed in sequence from upstream to downstream (y-axis). Enterococci concentrations (Figure 6) were generally higher at stations upstream of station 13026 (Oso Creek) than those downstream of and including station 13026 (Oso Bay).
Texas Commission on Environmental Quality 13 Adopted August 2007
One TMDL for Oso Bay, Segment 2485
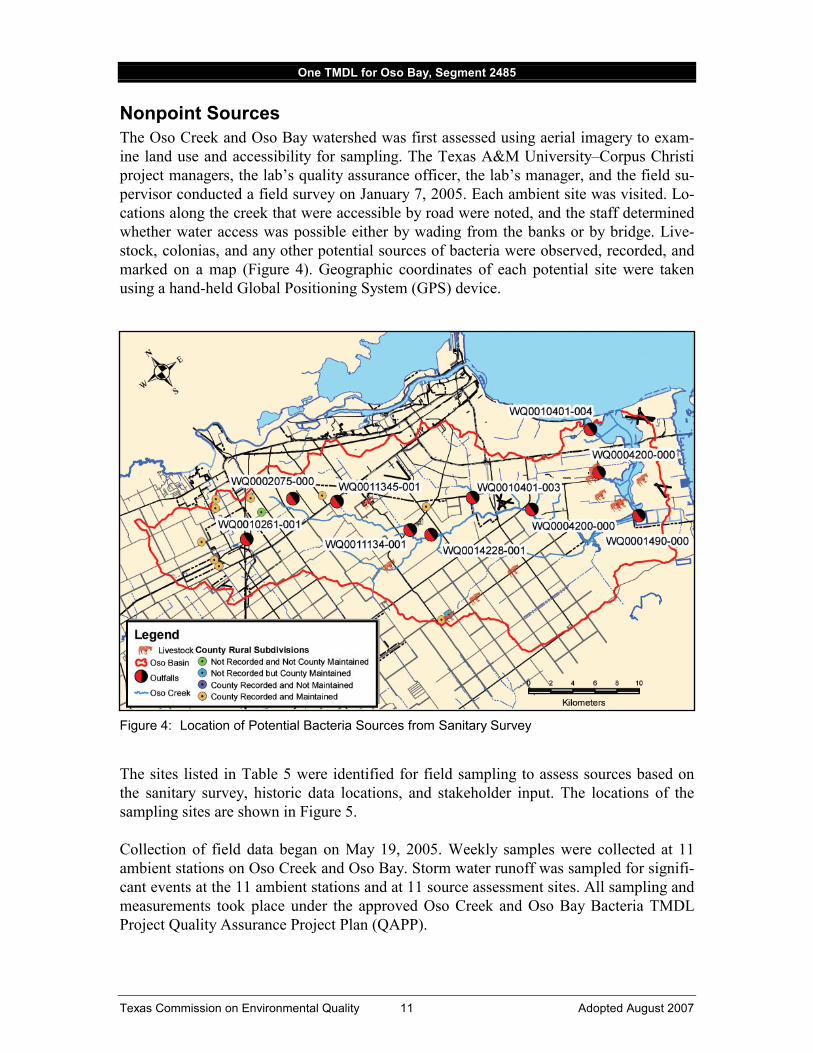
Seasonal Trends Concentrations of Enterococci were higher during warmer periods and lower during colder periods, as reflected by comparisons with water temperature measurements (Figure 8). The abrupt change in salinity between Oso Creek and Oso Bay due to the influx of cooling water diverted from Laguna Madre, a hyper-saline lagoon, through the Barney Davis Power Plant is clearly evident (Figure 7). Dissolved oxygen values (Figure 9) are also elevated in response to colder water temperatures.
Stations are listed from furthest upstream (back) to furthest downstream (front).
Figure 6: Enterococci Concentrations Measured at Ambient Monitoring Stations from May 19, 2005 through June 8, 2006
Linear features oriented along the y-axis (stations listed in sequence) are evident in Figure 6 (Enterococci), Figure 7 (salinity), Figure 8 (water temperature), and Figure 9 (dissolved oxygen). These features can be associated with runoff events that alter the water chemistry for a short time period. These linear features indicate an increase in Enterococci concentrations, a decrease in salinities in Oso Bay, some decrease in dissolved oxygen, and a contrast in water temperatures depending on the seasonal climate in response to runoff and its associated parameters entering the Oso hydrologic system.
Linear features oriented along the x-axis (time) are also evident, indicating anomalies or events specific to a particular station. X-axis linear features can be observed in Figure 6, where high Enterococci concentrations are persistent at station 13027 when compared to upstream and downstream stations during July and August 2005, as well as for station 13441 where generally higher concentrations are found compared to other Oso Bay stations. Other x-axis oriented linear features are observed for station 13441 on plots of
Texas Commission on Environmental Quality 14 Adopted August 2007

One TMDL for Oso Bay, Segment 2485
Stations are listed from furthest upstream (back) to furthest downstream (front).
Figure 7: Salinity Concentrations Measured at Ambient Monitoring Stations from May 19, 2005 through June 8, 2006
Stations are listed from furthest upstream (back) to furthest downstream (front).
Figure 8: Water Temperature Measured at Ambient Monitoring Stations from May 19, 2005 through June 8, 2006
Texas Commission on Environmental Quality 15 Adopted August 2007

One TMDL for Oso Bay, Segment 2485
Stations are listed from furthest upstream (back) to furthest downstream (front).
Figure 9: Dissolved Oxygen Measured at Ambient Monitoring Stations from May 19, 2005 through June 8, 2006
salinity (Figure 7), where fresher water at this station is persistent throughout the period of measurements, and where warmer temperatures (Figure 8) are persistent throughout the colder months of December, January, and February.
The occurrence of time-oriented linear features at station 13441, such as elevated temperature during cold periods and persistently lower salinities, indicate that this station is strongly influenced by the neighboring Oso WWTF and is best treated as a tributary feeding into the Oso hydrologic system rather than as representative of broader conditions in Oso Bay.
Linkage Analysis The connection between watershed sources of bacteria and concentrations of bacteria within Oso Creek and Oso Bay was further examined using a computer simulation model. The model uses GIS software to organize and manage data, calculations, and output. Important inputs to the model included GIS layers depicting land use (Figure 2), digital elevation data, stream hydrography, and precipitation intensity. The basic calculation structure of the final model is illustrated in Figure 10. These calculations were performed for each subwatershed within the model, and each land use present in a subwatershed was assigned an event concentration (EC) value. More detailed discussion of the model theory, structure, and application are presented in the supporting technical reports (Hay & Mott 2005, Hay & Mott 2006) from which this description is extracted and compiled.
Texas Commission on Environmental Quality 16 Adopted August 2007

EC
Rain
Runoff
Runoff Load
*
Runoff Coe fficient
Sum Loads
Alo
ng e
ach
subw
ater
shed
Calculate Decayed Load
Load From Station
Upstream
Point Source Load
*
Dry Day Loading
Repeat for next subbasin
One TMDL for Oso Bay, Segment 2485
Modifications are highlighted in red.
Figure 10: Revised Bi-Hourly Model Process Flow Chart
The Oso watershed was initially divided into 14 subwatersheds for modeling purposes, as shown in Figure 11. Those 14 subwatersheds generally corresponded to potential sources (Figure 4) and monitoring stations (Figure 5) used by the project. For load allocation simulations, locations S7 and S3 were incorporated into subwatershed 18499, location 18501 was incorporated into subwatershed 13029, and location S6 was incorporated into subwatershed 13440. Model input and output summaries were ultimately compiled for the 10 subwatersheds thus defined. Figure 11 also depicts the approximate city limit of Corpus Christi relative to the model subwatersheds, which is used to estimate sub-watershed areas for allocating MS4 storm water loading.
The subwatersheds upstream from station 13027 comprise the Oso Creek watershed for modeling and load allocation purposes, while the subwatersheds downstream from station 13027 are the Oso Bay watershed. Load allocations for model subwatersheds may be aggregated to define load allocations for the larger Oso Creek and Oso Bay watersheds.
Model Calibration The Oso watershed model was calibrated to stream and runoff data collected during 20052006. Calibration of the model focused on decay rate, runoff event concentrations, and other sources of bacteria loading not characterized by data.
Texas Commission on Environmental Quality 17 Adopted August 2007

One TMDL for Oso Bay, Segment 2485
Red line approximates current Corpus Christi boundary and MS4 permit coverage.
Figure 11: Subwatersheds with Sampling Point at Outlets (pour points)
Decay Rate Decay rate is a first order parameter that determines die off, sequestration, uptake, or predation of the bacteria and allows for the removal of bacteria from the model. Initial estimates of the decay rate were based on literature reviews and observed rates of change in stream bacteria concentrations between stations. Those observations suggested that decay rates in fresh and salt water were different. Final decay rates were constrained within the range reported in literature, and balanced against the runoff concentrations and other loads in the calibration runs. The decay rates that were chosen for the final model were 2.0 day-1 in Oso Creek, and 4.0 day-1 in Oso Bay (Hay & Mott 2006).
Event Concentrations The Oso model initially used event mean concentrations (EMCs) to characterize surface runoff quality, a common approach for watershed loading models. However, the model iterates in two-hour time steps, a time period much shorter than a complete rain event, so EMC values did not fit this model appropriately. Since the model calculated concentrations that represent discrete intervals within the rain event, values are required to represent the Enterococci concentrations of the runoff before it enters channel flow and begins decaying (event concentrations).
Using the new decay rate of 2.0 day-1 for fresh water segments, event concentration (EC) values were back-calculated from EMC values, assuming that the EMC values repre-
Texas Commission on Environmental Quality 18 Adopted August 2007

One TMDL for Oso Bay, Segment 2485
sented about one day of decay. The final EC values for the land use categories used in the model are shown in Table 6. These values are comparable to the bacteria concentrations for fecal coliform observed by the City of Corpus Christi in its storm water, which had concentrations as high as 445,000 cfu/100 mL (City of Corpus Christi 2003).
Cropland was not well represented in the development of EMC values from the subwatershed for station S6. However, station 18501 on West Oso Creek, a tributary of Oso Creek, was used earlier in model development to determine a cropland EMC value appropriate for this area. This value was then used to calculate the EC for cropland.
Table 6: Land Use Types and ECs for Oso Model
Enterococci EC Value (cfu/100 mL) Land Use Type
353,829 Residential
305,332 Commercial/Industrial/Transportation
62,807 Cropland/Rangeland
0 Not Classified
(See Table 3 for NLCD equivalents)
Dry-Day Loading Early calibration runs of the model revealed a tendency to under-predict bacteria concentrations during dry-weather periods when storm runoff is not affecting stream concentrations. Adjusting only decay rates would have required the use of decay rates well outside published values to account for the elevated bacteria levels observed in the dry periods. With addition of a dry-day loading parameter for each basin, the decay rates could be restricted to those observed in the literature.
The initial bi-hourly model was based on the assumption that the only sources of bacteria to the creek and bay were runoff and known point sources (i.e., WWTFs) and that the Enterococci bacteria die off when removed from their natural habitat (feces). However, persistently elevated bacteria concentrations in the freshwater portion of the system suggested that another flux of bacteria to the creek exists that is not related to runoff or known point sources. This flux, referred to in this report as dry-day loading, has a profound influence on the geometric mean value of Enterococci concentrations that determine whether a stream segment meets water quality endpoints, and could have various sources.
Fecal Enterococci are naturally found in the intestines of warm-blooded animals. Their egress to extra-intestinal environments is primarily via the feces of warm-blooded animal. There are numerous potential sources for the dry-day loading in the Oso watershed, including:
� leaking or failed septic systems in a nearby subdivision, � leaking municipal sewer lines near the creek,
Texas Commission on Environmental Quality 19 Adopted August 2007

One TMDL for Oso Bay, Segment 2485
� wildlife activity in and around the creek (nesting under bridges, feeding at waters edge) or bay (Blind Oso bird area),
� equestrian activities (exercising horses in the creek), and � illegal discharge/disposal of sewage in the creek.
In rural and suburban areas, septic systems provide a steady source of fecal bacteria to the ground. Ideally, fecal bacteria will be eliminated by the chemical and bacterial processes in the septic tank and the mechanical processes and bacteria in the soil. Poorly maintained or leaking septic systems can undermine these processes.
Clay soils, dominant in the Oso Creek watershed, are poorly suited for septic systems. Installation of systems into low-permeability soils such as clay requires additional planning; they must have significantly larger leaching fields to effectively treat the water without contaminating the groundwater. Many studies suggest that Enterococci may be capable of surviving and growing within certain soil environments (Cools et al 2001). Groundwater, once contaminated, can be a steady, long lasting flux of bacteria to surface waters.
Based on the results of the initial bi-hourly model, the residence times and decay rate for any one segment of the creek are insufficient to remove all the bacteria in that segment, so each stream or bay segment transfers some bacteria load to the segment immediately downstream. Therefore, calculation of dry-day loads must begin at the uppermost stream segment in the hydrologic system.
Since the temporal resolution of data collection was at intervals not less than daily, dry-day loading was represented in the model as a constant loading (flux) applied to each bihourly time step. To determine the dry-day load, a model simulation was run to equilibrium (seven days) prior to the date of a sampling event. A binary search algorithm was used to determine, to the nearest hundredth of a log10, the bacteria load that would yield the observed concentration after the model reaches equilibrium.
If the resulting load at a station was sufficient to generate the observed concentrations at the next station downstream, then the dry-day loading determined for the downstream station was limited to a value two orders of magnitude less than the load receive from upstream. This was done to constrain the log values of concentrations to the measurement limits of the analytical technique. Once dry loads were determined for each dry-day of each segment, the average dry-day loading was calculated for each of the segments. The dry-day loads for the revised bi-hourly model are listed in Table 7.
The dry-day loading rates for two-hour model time steps may be converted to daily or annual loading rates for load allocation purposes, or to ease comparison with load allocation values. Table 7 shows dry-day loading rates used for each model subwatershed for bihourly, daily, and annual periods. Daily loads in Table 7 are calculated as 12 times the bihourly loads used in modeling, and annual loads are calculated as 365 times the daily loads.
Texas Commission on Environmental Quality 20 Adopted August 2007

One TMDL for Oso Bay, Segment 2485
Table 7: Dry-Day loading Rates Used in Oso Model
Station ID
Enterococci Dry-Day loading Rates (x1012 cfu/time unit)
per 2-hour time step per day per year
18499* 0.00459 0.05508 20.104
18500 0.00544 0.06528 23.827
13029 0.000640 0.00768 2.803
16712 0.0113 0.13560 49.494
13028 0.0379 0.45480 166.002
13027 0.141 1.69200 617.580
13026 0.0246 0.29520 107.748
13440 0.0307 0.36840 134.466
13441 0.00168 0.02016 7.358
13442 0.0650 0.78000 284.700
*Numbers in gray are associated with Oso Creek.
Existing Loads The calibrated model characterized a yearlong period, using source loadings that were estimated from recent data, such as wastewater treatment facility effluent monitoring, or from the calibration process itself, such as storm runoff and dry-day loading. Therefore, the calibrated model also defines the magnitude of existing sources that affect bacteria concentrations in the Oso system.
A summary of the total annual loading from each source type for each model subwatershed was extracted from the calibrated model to represent the existing (i.e., pre-TMDL) conditions, and is presented in Table 8. For load allocation or management purposes, the annual loading rates shown in Table 8 may be mathematically manipulated to aggregate and express loading at different subwatershed scales (e.g., for Oso Creek and Oso Bay) rather than for each model subwatershed.
Model output concentrations corresponding to the existing loads in Table 8 are shown in Table 9. Concentrations shown in bold font in Table 9 exceeded the relevant goal, while those shown in italic font met the goals.
Model Predictions After the model was calibrated to observed data, which also defined the existing loads, additional model simulations predicted the effects of load reductions.
Dry-Day Loading Removed Since the dry-day loadings are the most significant factor in meeting the geometric mean criteria, this input was removed from the model at all stations, as shown in Table 9, and a new simulation was run to test the significance of dry-day loading.
Texas Commission on Environmental Quality 21 Adopted August 2007

One TMDL for Oso Bay, Segment 2485
Table 8: Existing Loading by Model Subwatershed
Sub-watershed
Enterococci Loads x1012 cfu/year
Annual Dry Loading
WWTP Annual Loading Residential Urban Crop Range
Total Sub-watershed
Loads
18499* 20 0.07 341 219 886 67 1533
18500 24 0.00 5 2 263 12 307
13029 3 0.00 2 2 219 8 235
16712 50 0.40 299 575 753 117 1793
13028 166 0.00 14 23 453 33 689
13027 616 0.00 1154 631 294 76 2770
13026 108 0.00 144 125 737 422 1536
13440 134 0.00 668 300 84 156 1343
13441 7 0.79 516 178 0 14 716
13442 285 0.00 448 403 38 59 1233
*Numbers in gray are associated with Oso Creek.
Table 9: Model Output Concentrations from the Existing Load Simulation
Subwatershed
Enterococci Concentrations from Model, in cfu/100 mL
Geometric Mean 25% Exceed
18499* 1366.3 1199.9
18500 1321.6 1471.3
13029 909.0 1108.7
16712 569.1 797.5
13028 367.6 434.5
13027 349.3 380.0
13026 7.9 5.8
13440 7.7 5.7
13441 80.5 50.1
13442 12.6 9.3
*Numbers in gray are associated with Oso Creek. Concentrations shown in bold font exceeded the relevant goal. Those shown in italic font met the goals.
Texas Commission on Environmental Quality 22 Adopted August 2007

One TMDL for Oso Bay, Segment 2485
Table 10: Modeled Loading with Dry-Day Loads Removed
Subwatershed
Enterococci Loads x1012 cfu/year
Annual Dry
Loading
WWTF Annual Loading Residential Urban Crop Range
Total Subwatershed
Load
18499* 0 0.07 341 219 886 67 1513
18500 0 0.00 5 2 263 12 283
13029 0 0.00 2 2 219 8 232
16712 0 0.40 299 575 753 117 1743
13028 0 0.00 14 23 453 33 523
13027 0 0.00 1154 631 294 76 2155
13026 0 0.00 144 125 737 422 1428
13440 0 0.00 668 300 84 156 1209
13441 0 0.79 516 178 0 14 709
13442 0 0.00 448 403 38 59 948
*Numbers in gray are associated with Oso Creek.
Table 11: Model Output Concentrations from the No Dry-Day Load Simulation
Subwatershed
Enterococci Concentrations from Model, in cfu/100 mL
Geometric Mean 25% Exceed
18499* 36.0 419.4
18500 39.4 929.0
13029 38.6 793.4
16712 45.9 558.1
13028 26.4 247.4
13027 20.8 175.7
13026 2.7 2.3
13440 2.5 2.2
13441 13.6 5.4
13442 2.5 2.1
*Numbers in gray are associated with Oso Creek. Concentrations shown in italic font met the goals.
Table 10 shows loading by subwatershed for the scenario with reduced dry-day loading, which is very similar to Table 8—only the Annual Dry Loading and Total Subwatershed Load columns are different between Tables 8 and 10.
Although dry-day loading comprises a relatively small percentage of the existing load, removing it has a dramatic effect on predicted concentrations (Table 11). The results of
Texas Commission on Environmental Quality 23 Adopted August 2007
One TMDL for Oso Bay, Segment 2485
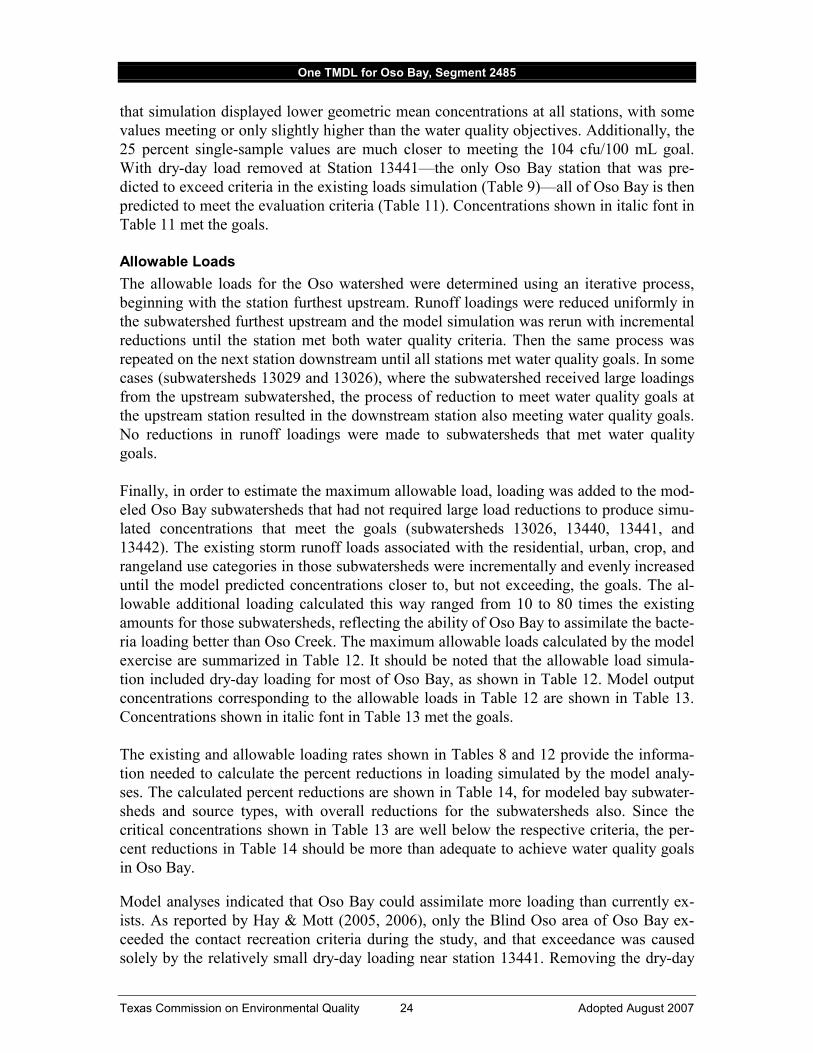
that simulation displayed lower geometric mean concentrations at all stations, with some values meeting or only slightly higher than the water quality objectives. Additionally, the 25 percent single-sample values are much closer to meeting the 104 cfu/100 mL goal. With dry-day load removed at Station 13441—the only Oso Bay station that was predicted to exceed criteria in the existing loads simulation (Table 9)—all of Oso Bay is then predicted to meet the evaluation criteria (Table 11). Concentrations shown in italic font in Table 11 met the goals.
Allowable Loads The allowable loads for the Oso watershed were determined using an iterative process, beginning with the station furthest upstream. Runoff loadings were reduced uniformly in the subwatershed furthest upstream and the model simulation was rerun with incremental reductions until the station met both water quality criteria. Then the same process was repeated on the next station downstream until all stations met water quality goals. In some cases (subwatersheds 13029 and 13026), where the subwatershed received large loadings from the upstream subwatershed, the process of reduction to meet water quality goals at the upstream station resulted in the downstream station also meeting water quality goals. No reductions in runoff loadings were made to subwatersheds that met water quality goals.
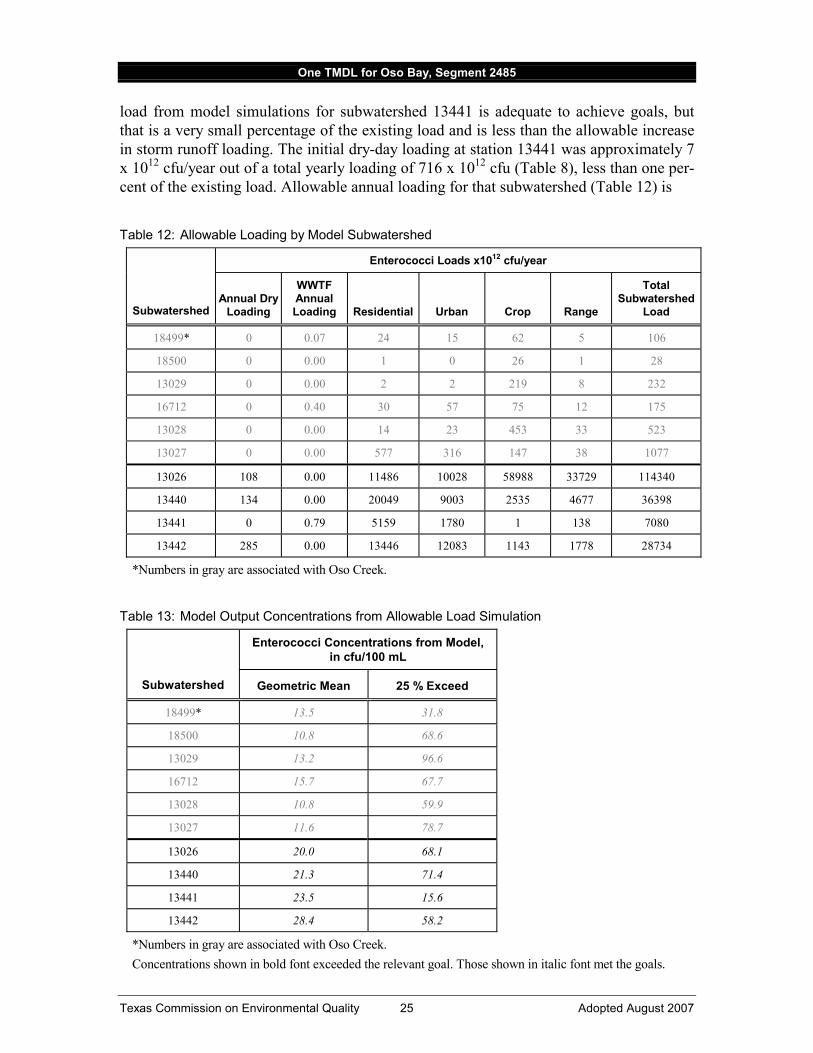
Finally, in order to estimate the maximum allowable load, loading was added to the modeled Oso Bay subwatersheds that had not required large load reductions to produce simulated concentrations that meet the goals (subwatersheds 13026, 13440, 13441, and 13442). The existing storm runoff loads associated with the residential, urban, crop, and rangeland use categories in those subwatersheds were incrementally and evenly increased until the model predicted concentrations closer to, but not exceeding, the goals. The allowable additional loading calculated this way ranged from 10 to 80 times the existing amounts for those subwatersheds, reflecting the ability of Oso Bay to assimilate the bacteria loading better than Oso Creek. The maximum allowable loads calculated by the model exercise are summarized in Table 12. It should be noted that the allowable load simulation included dry-day loading for most of Oso Bay, as shown in Table 12. Model output concentrations corresponding to the allowable loads in Table 12 are shown in Table 13. Concentrations shown in italic font in Table 13 met the goals.
The existing and allowable loading rates shown in Tables 8 and 12 provide the information needed to calculate the percent reductions in loading simulated by the model analyses. The calculated percent reductions are shown in Table 14, for modeled bay subwatersheds and source types, with overall reductions for the subwatersheds also. Since the critical concentrations shown in Table 13 are well below the respective criteria, the percent reductions in Table 14 should be more than adequate to achieve water quality goals in Oso Bay.
Model analyses indicated that Oso Bay could assimilate more loading than currently exists. As reported by Hay & Mott (2005, 2006), only the Blind Oso area of Oso Bay exceeded the contact recreation criteria during the study, and that exceedance was caused solely by the relatively small dry-day loading near station 13441. Removing the dry-day
Texas Commission on Environmental Quality 24 Adopted August 2007
One TMDL for Oso Bay, Segment 2485
load from model simulations for subwatershed 13441 is adequate to achieve goals, but that is a very small percentage of the existing load and is less than the allowable increase in storm runoff loading. The initial dry-day loading at station 13441 was approximately 7 x 10¹² cfu/year out of a total yearly loading of 716 x 1012 cfu (Table 8), less than one per- cent of the existing load. Allowable annual loading for that subwatershed (Table 12) is
Table 12: Allowable Loading by Model Subwatershed
Subwatershed
Enterococci Loads x1012 cfu/year
Annual Dry Loading
WWTF Annual Loading Residential Urban Crop Range
Total Subwatershed
Load
18499* 0 0.07 24 15 62 5 106
18500 0 0.00 1 0 26 1 28
13029 0 0.00 2 2 219 8 232
16712 0 0.40 30 57 75 12 175
13028 0 0.00 14 23 453 33 523
13027 0 0.00 577 316 147 38 1077
13026 108 0.00 11486 10028 58988 33729 114340
13440 134 0.00 20049 9003 2535 4677 36398
13441 0 0.79 5159 1780 1 138 7080
13442 285 0.00 13446 12083 1143 1778 28734
*Numbers in gray are associated with Oso Creek.
Table 13: Model Output Concentrations from Allowable Load Simulation
Subwatershed
Enterococci Concentrations from Model, in cfu/100 mL
Geometric Mean 25 % Exceed
18499* 13.5 31.8
18500 10.8 68.6
13029 13.2 96.6
16712 15.7 67.7
13028 10.8 59.9
13027 11.6 78.7
13026 20.0 68.1
13440 21.3 71.4
13441 23.5 15.6
13442 28.4 58.2
*Numbers in gray are associated with Oso Creek. Concentrations shown in bold font exceeded the relevant goal. Those shown in italic font met the goals.
Texas Commission on Environmental Quality 25 Adopted August 2007

One TMDL for Oso Bay, Segment 2485
7,080 x 1012 cfu/year, so the allowable loading would result in a negative percentage reduction for annual loading to Oso Bay. Percentage reductions are therefore considered not applicable (NA) to Oso Bay.
Table 14: Percent Reductions Simulated for Oso Bay by Model Subwatershed and Source Type
Subwatershed
Annual Dry
Loading
WWTF Annual Loading Residential Urban Crop Range
Total Subwatershed
Load
13026 0.00% NA NA NA NA NA
13440 0.00% NA NA NA NA NA
13441 100.00% 0.00% NA NA NA NA NA
13442 0.00% NA NA NA NA NA
Hay & Mott (2005, 2006) also noted that station 13441 is not representative of ambient conditions in Oso Bay and is unsuitable for characterizing Oso Bay in assessments, because the station is essentially monitoring a freshwater inflow rather than ambient saline bay water (see Figure 7). In addition, a number of stakeholders, including the Texas Parks and Wildlife Department, Coastal Bend Bays and Estuary Program, the U.S. Fish and Wildlife Service, and the City of Corpus Christi have noted that the Blind Oso area around station 13441 is not representative of Oso Bay.
The Blind Oso is an extremely shallow estuary, much of it only a few inches deep, with extensive wetland vegetation and a soft, silty bottom. Furthermore, the Blind Oso is a well-known and popular bird watching and rookery area, where large concentrations of water birds nest in brushy wetland and feed in the extremely shallow water (several inches) along the shoreline. A boardwalk provides access for bird watching, but the density of both wetland vegetation and birds makes the area inhospitable for water-based primary or secondary contact recreation activities, and the site is not known to be used for recreation. Local residents have indicated, in the course of various stakeholder meetings and conversations, that waterfowl habitat is considered the primary and most appropriate water body use in that vicinity, and should not be disrupted.
The Blind Oso differs significantly from the rest of Oso Bay in both physical characteristics and uses. Local residents have indicated that the Blind Oso is considered a tributary area and not part of Oso Bay proper. A UAA may be appropriate in order to determine the existing and attainable recreation use of the Blind Oso. If adjustment of the recreational use and/or criteria for the Blind Oso is determined to be appropriate, dry-day load reductions may not be needed.
To summarize and review the preceding paragraphs:
� The 100% load reduction shown in Table 14 for Station 13441 represents the only scenario modeled. Much less reduction than was modeled could suffice to meet the contact recreation standard, but modeling has not established a precise percent.
Texas Commission on Environmental Quality 26 Adopted August 2007
One TMDL for Oso Bay, Segment 2485
� The primary source of the dry-day loading at Station 13441 is thought to be the bird colony. This TMDL does not propose or anticipate any effort to disrupt wildlife use of that area, nor is such effort considered appropriate.
Permitted wastewater discharges were not major sources of bacteria loading (Hay & Mott 2005). Several of the permitted discharges are industrial and were not deemed likely sources by the sanitary survey. Discharges of treated domestic waste contributed a very small portion of the existing load, and were generally compliant with bacterial criteria, so reductions in that source were not necessary or simulated.
Model simulations indicate that storm runoff loading has not impaired Oso Bay. No reduction in storm water runoff loading is necessary.
Margin of Safety The margin of safety (MOS) should account for uncertainty in the analysis used to develop the TMDL and thus provide a higher level of assurance that the goal of the TMDL will be met. The margin of safety may be incorporated into the analysis using two methods:
� implicitly incorporating the MOS using conservative model assumptions to develop allocations, or
� explicitly assigning a loading amount for the MOS.
The margin of safety is designed to account for any uncertainty that may arise in specifying water quality control strategies for the complex environmental processes that affect water quality. Quantification of this uncertainty, to the extent possible, is the basis for assigning a margin of safety.
The Oso Bay allocation includes an implicit margin of safety in that the predicted geometric mean and 25 percent exceedance concentrations based on the load allocation (see Table 13) are well below the respective criteria. Annual geometric means predicted at all stations were well below the criterion of 35 cfu/100mL. The “25% exceed” concentrations predicted at all stations were well below the 104 cfu/100mL that was used, and all in Oso Bay were below the 89 cfu/100mL currently in the Standards. The margin of safety has not been explicitly calculated for expression as a load or percentage.
Pollutant Load Allocation The TMDL represents the maximum amount of pollutant that the water body can receive without exceeding the water quality standard. The load allocations for the selected scenarios are summarized using the following equation:
TMDL = ∑ WLA +∑ LA + MOS Where:
WLA = wasteload allocation (point source contributions); LA = load allocation (nonpoint source contributions); and MOS = margin of safety.
Texas Commission on Environmental Quality 27 Adopted August 2007
One TMDL for Oso Bay, Segment 2485
As mentioned in the previous section, the margin of safety for the Oso Bay TMDL is implicit, so does not appear as an explicit amount in the TMDL summation.
Typically, several potential allocation strategies would achieve the TMDL endpoint and water quality standards. Available control options depend on the number, location, and character of pollutant sources.
Parsing of the sources into point and nonpoint categories is not simple in this case. As mentioned previously, storm water runoff from areas covered by a storm-water discharge permit must be categorized as a point source, while storm runoff from other areas is a nonpoint source. The modeled subwatersheds were based on the physical topography of the watershed, and do not conveniently match the boundaries of the area covered by the City of Corpus Christi’s MS4 permit.
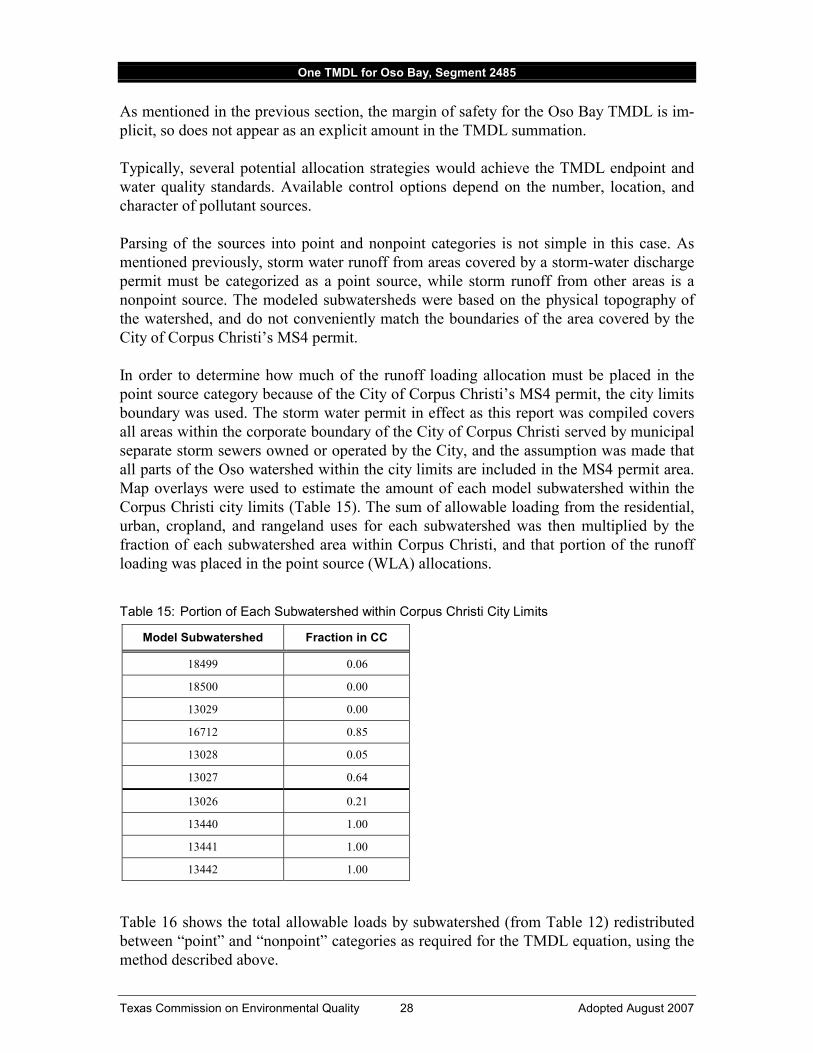
In order to determine how much of the runoff loading allocation must be placed in the point source category because of the City of Corpus Christi’s MS4 permit, the city limits boundary was used. The storm water permit in effect as this report was compiled covers all areas within the corporate boundary of the City of Corpus Christi served by municipal separate storm sewers owned or operated by the City, and the assumption was made that all parts of the Oso watershed within the city limits are included in the MS4 permit area. Map overlays were used to estimate the amount of each model subwatershed within the Corpus Christi city limits (Table 15). The sum of allowable loading from the residential, urban, cropland, and rangeland uses for each subwatershed was then multiplied by the fraction of each subwatershed area within Corpus Christi, and that portion of the runoff loading was placed in the point source (WLA) allocations.
Table 15: Portion of Each Subwatershed within Corpus Christi City Limits
Model Subwatershed Fraction in CC
18499 0.06
18500 0.00
13029 0.00
16712 0.85
13028 0.05
13027 0.64
13026 0.21
13440 1.00
13441 1.00
13442 1.00
Table 16 shows the total allowable loads by subwatershed (from Table 12) redistributed between “point” and “nonpoint” categories as required for the TMDL equation, using the method described above.
Texas Commission on Environmental Quality 28 Adopted August 2007

One TMDL for Oso Bay, Segment 2485
Table 16: Allowable Loading Redistributed to LA and WLA Categories
Subwatershed Nonpoint LA + Point WLA = TMDL
Oso Creek annual export to Oso Bay = 772.81 (part of LA)*
13026 90328.30 24011.32 114339.62
13440 0.00 36398.41 36398.41
13441 0.00 7079.79 7079.79
13442 0.00 28733.79 28733.79
Oso Bay total 90328.30 96223.31 186551.61
All loads 1012 cfu/yr*Numbers in gray are associated with Oso Creek.
After redistribution of loading to point and nonpoint categories, allowable loads from the individual subwatersheds were aggregated to represent the Oso Bay watershed. The bottom row of Table 16 summarizes loading from the four subwatersheds that comprise the proximate Oso Bay watershed.
The TMDL for Oso Bay must also account for loading that is delivered to the bay by the creek. The total load passing from station 13027 (lower end of creek) into the bay over the simulated annual period was 772.81 x 10¹² cfu/yr. That amount is added to the non-point source total from the bay subwatersheds to calculate the total maximum annual load for Oso Bay.
The resulting equation shown below is the TMDL for Oso Bay, expressed in annual units. These values will be the bases for administering the implementation plan and evaluating the success of the TMDL.
Oso Bay TMDL in Annual Units
LA + WLA = TMDL91,101.11 + 96,223.31 = 187,324.42 x 1012 cfu/yr (“T-org/yr”)
Note on units: Other sources or documents may use different terminology for the units in which this TMDL is expressed, as shown below.
1x10¹² cfu or organisms per year = trillion/yr = 1 tera-org or “T-org” per year1x109 cfu or organisms per year = billion/yr = 1 giga-org or “G-org” per year1x106 cfu or organisms per year = million/yr = 1 mega-org or “M-org” per year
This TMDL is consistent with the anti-degradation policy established in the Texas Sur-face Water Quality Standards (30 TAC 307.5). This TMDL will not authorize discharges
Texas Commission on Environmental Quality 29 Adopted August 2007

One TMDL for Oso Bay, Segment 2485
of pollutants in amounts that would degrade existing or designated contact recreation use of Oso Bay.
Expressing Load Allocation in Daily Units While the annual load allocation described above will be the basis for the state’s management of water quality, it is desirable to express the allocation in daily units as well. The daily unit expression is designed to satisfy any concern that the load allocation is not strictly consistent with the phrase “total maximum daily load.”
Daily loading that is primarily affected by storm water runoff varies dramatically in time. Both the average and the maximum amount of loading allowable on any specific day is a function of the stream flow on that date. The analyses and annual load allocation described above were converted to daily unit expressions as follows.
There are two U.S. Geological Survey (USGS) stream flow-gauging stations in the Oso watershed: “08211520 Oso Creek at Corpus Christi, TX” and “08211517 W Oso Ck at Merret Rd nr Corpus Christi, TX.” The West Oso Creek gauge was established in 2005, and does not have a sufficient period of record to be used for statistical analyses. The Oso Creek gauge (08211520) has a period of record extending back to 1972, and provided the daily average flow data used to derive daily load allocation units.
The daily average flows for the entire period of record were downloaded from the USGS online data and inserted into a spreadsheet. A percentile function within the spreadsheet was used to extract flow values that correspond to a frequency of occurrence. For instance, the spreadsheet function derives a “10th percentile” flow that is larger than 10 percent of the daily average values in the record, or smaller than 90 percent. The “0 percent” flow is the smallest recorded; the “100 percent” flow is the largest recorded. The resulting list of percentiles and flows can define a “flow duration curve,” or the potential flow range at the gauge site that is at station 13029 (previously described in this report).
The range of flows defined by that extraction process can be extrapolated to other areas within the watershed, or in nearby areas, using the “Drainage-Area Ratio Method” described by a recent USGS Scientific Investigation Report (Asquith et al 2006). The method is based on the equation:
φ⎛Au ⎞Qu = Qg × ⎜⎜⎝
⎟⎟⎠Ag
Where: Qu = flow at ungauged site Qg = flow at gauged site Au = drainage area at ungauged site Ag = drainage area at gauged site φ = exponent corresponding to flow percentile
Texas Commission on Environmental Quality 30 Adopted August 2007
One TMDL for Oso Bay, Segment 2485
The percentile intervals used to extract flow values corresponded to the intervals presented in the USGS report Table 5 so that corresponding “phi” exponents could be used for converting flows to other sites.
Next, drainage areas for each of the Oso model subwatersheds were assembled, and summed as appropriate to derive the total upstream drainage area for each subwatershed outlet point. Then the equation above was applied to each flow percentile value, using the appropriate drainage area ratios and exponent values, to derive estimated flow ranges for each of the Oso Bay subwatershed outlets (13026, 13440, 13441, 13442) and for the Oso Creek outlet that discharges to Oso Bay (13027).
Records of the Oso modeled bacteria concentrations at each subwatershed outlet for each two-hour time step were also loaded into a spreadsheet. A running 24-hour average concentration was calculated for each subwatershed, and the maximum 24-hour average concentration selected for each. Those represent the “maximum daily concentration” from the allowable load scenario on which this TMDL is based.
The flow range thus derived for Oso Bay is broadly characterized by the net non-tidal flow predicted at station 13442, the outlet from Oso Bay. In this context, the net non-tidal flow represents the daily average flow from the entire watershed that passes out the mouth of Oso Bay, not including tidal exchange water. The spreadsheet was used to “balance” that flow by distributing it among the subwatershed of origin, thus determining how much came in from Oso Creek (13027), and how much entered incrementally from each of the Oso Bay subwatersheds (13026, 13440, 13441, 13442). The balancing distribution was applied to each percentile flow in the list originally derived.
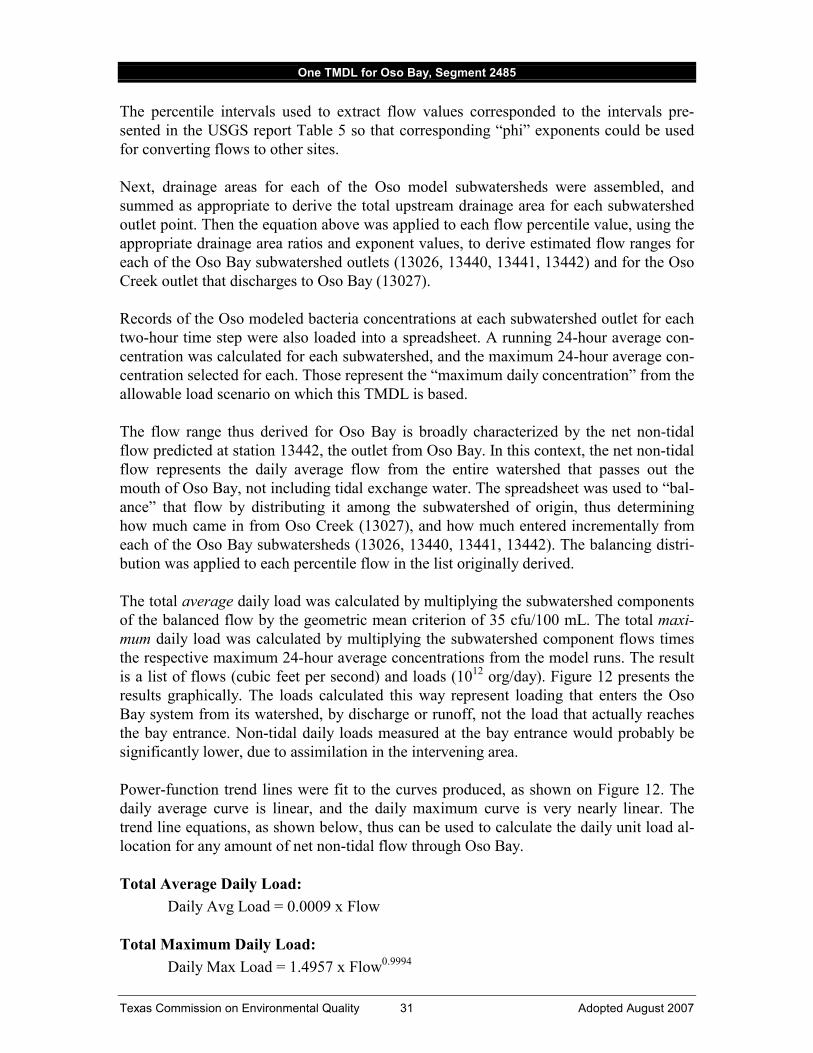
The total average daily load was calculated by multiplying the subwatershed components of the balanced flow by the geometric mean criterion of 35 cfu/100 mL. The total maxi-mum daily load was calculated by multiplying the subwatershed component flows times the respective maximum 24-hour average concentrations from the model runs. The result is a list of flows (cubic feet per second) and loads (1012 org/day). Figure 12 presents the results graphically. The loads calculated this way represent loading that enters the Oso Bay system from its watershed, by discharge or runoff, not the load that actually reaches the bay entrance. Non-tidal daily loads measured at the bay entrance would probably be significantly lower, due to assimilation in the intervening area.
Power-function trend lines were fit to the curves produced, as shown on Figure 12. The daily average curve is linear, and the daily maximum curve is very nearly linear. The trend line equations, as shown below, thus can be used to calculate the daily unit load allocation for any amount of net non-tidal flow through Oso Bay.
Total Average Daily Load: Daily Avg Load = 0.0009 x Flow
Total Maximum Daily Load: Daily Max Load = 1.4957 x Flow0.9994
Texas Commission on Environmental Quality 31 Adopted August 2007

One TMDL for Oso Bay, Segment 2485
In both equations, flows are entered as cubic feet per second (cfs) and loads are calculated as trillion organisms per day or “x1012 org/day” or “T-org/day.”
Daily MAX Ld = 1.4957(Flow)0.9994
Daily AVG Ld = 0.0009(Flow)
0.000
0.001
0.010
0.100
1.000
10.000
100.000
1,000.000
10,000.000
100,000.000
0 1 10 100 1,000 10,000 100,000
Net Flow (cfs)
Dai
ly L
oad
10 12
org
/day
(T-o
rg/d
ay)
Daily AVG Ld Daily MAX Ld P (D il MAX Ld) P (D il AVG Ld)
Figure 12: Daily Load Allocations as Function of Flow Rate
Table 17 illustrates application of the equations above to selected flow values. The flow values in Table 17 were selected based on the frequency of occurrence, so the table also illustrates that allowable daily loading is relatively small most of the time, but increases during periods of runoff. Comparing Table 17 to Figure 12 illustrates that daily allowable loading rates will be towards the low end of the Figure 12 curves about 90% of the time. Existing loading is less than allowable.
Table 17. Daily Load Allocation for Selected Flow Values
Percent of days when net flow is less than or equal
to selected value >> Selected Flow Value (cubic feet/second)
Daily Avg Load (1012 org/day)
Daily Max Load (1012 org/day)
10 % 2.64 0.002375 3.94436
26% 3.55 0.003194 5.30326
50% 5.28 0.004753 7.89038
74% 9.78 0.008798 14.60087
90% 36.17 0.032554 53.98549
100% 10,009.90 9.00891 14,889.28952
Texas Commission on Environmental Quality 32 Adopted August 2007

One TMDL for Oso Bay, Segment 2485
Seasonal Variation Seasonal variation was considered while developing the Oso Bay load allocation. The model analyses simulated an entire year, with 2-hour time steps, thus accounting for seasonal and daily variation in rainfall patterns and surface runoff loading. The annual allocation summarizes loading for the range of conditions that occur across all seasons. The daily-unit expression of maximum load considers loading that could occur under the most extreme variations in flow.
Public Participation Public participation is important to the success of a TMDL project. The TCEQ formed a stakeholder group for development of the Oso TMDLs. The group included representatives from state and federal agencies, the local estuary program, industries, citizen groups, local governments and non-governmental organizations, universities, water districts, agricultural interests, environmental groups, and other water user groups.
The Oso Bay advisory group provided advice and comment to the TCEQ on its project to improve water quality in the watersheds of Oso Bay and Oso Creek in Nueces County. Participation was voluntary. Anyone who was interested could attend meetings of this advisory group. Time was set aside at each meeting for questions and comments from all stakeholders in attendance.
� The first stakeholder meeting was held on January 18, 2005, at the Texas A&M University - Corpus Christi campus in the Natural Resources Center.
� The second stakeholder meeting was held on June 21, 2005, at the Natural Resources Center, TAMUCC. An update on the status of the project was presented.
� A third stakeholder meeting was held on August 23, 2005, at the Natural Resources Center, TAMUCC. A preliminary model run was presented.
� The fourth stakeholder meeting was held on January 17, 2006. A project update was presented, along with a presentation on septic system permitting by the City-County Health Department. The group also began to brainstorm ideas for ways to control the various sources of bacteria throughout the watershed.
� The fifth stakeholder meeting was held on May 16, 2006. The modeling analysis was discussed.
� The sixth stakeholder meeting was held on February 8, 2007. A quick review of the modeling analysis was followed by an outline of how the model results would be crafted into the load allocation expressed by the TMDL equations, and discussion of possible implementation measures.
Implementation and Reasonable Assurances All TMDL projects of the TCEQ include two components (or phases). These phases are:
1) TMDL development 2) TMDL implementation
Texas Commission on Environmental Quality 33 Adopted August 2007

One TMDL for Oso Bay, Segment 2485
During TMDL development, the TCEQ determines the acceptable pollutant load for impaired water bodies and apportions the load among broad categories of pollutant sources in the watershed. This information is summarized in a TMDL report such as this document.
During TMDL implementation, the TCEQ helps develop the management strategies needed to restore water quality to an impaired water body, in conjunction with area stakeholders. This information is summarized in an implementation plan (I-Plan) which references, but is separate from, the TMDL document. The I-Plan details load reduction and other mitigation measures planned to attain water quality standards in an impaired water body.
I-Plans to achieve the recommended loadings may use an adaptive management approach that achieves initial loading allocations from a subset of the source categories. An adaptive management approach allows for development or refinement of technologies that achieve the environmental goal of the plan. For Oso Bay, load reductions will not be sought until after appropriate designated uses and criteria are determined for the Blind Oso area, and unless subsequent analyses indicate that load reductions are then needed.
The TCEQ anticipates that load reduction and mitigation measures will not be required for Oso Bay for the following reasons: � Existing loads to Oso Bay are substantially lower than the allowable loads. � The Blind Oso, monitored by station 13441, is a tributary or sub-area of Oso Bay
and differs significantly from Oso Bay proper in physical characteristics, water chemistry, and actual existing uses.
� Preliminary information and comments from stakeholders suggest that the Blind Oso is not appropriate for contact recreation use or designation.
� The Blind Oso is compliant with bacteria standards typically applied to secondary contact or non-contact recreation uses.
Periodic and repeated evaluations of the effectiveness of implementation measures assure that progress is occurring, and may show that the original distribution of loading among sources should be modified to increase efficiency while maintaining the objective of compliance with water quality standards. Appropriate monitoring of Oso Bay will continue, to detect potential adverse effects of any new or increasing sources of bacteria.
This approach provides reasonable assurances that the necessary regulatory and voluntary activities to achieve and maintain water quality standards will be implemented.
For the purposes of regulatory procedures, implementation of the Oso Bay TMDL may need to address permit conditions for one large municipal WWTF, one large cooling water discharge, and an MS4 permit. None of those sources are considered causes of impairment, and no load reductions are required for those permitted facilities.
The most important issue in implementation will be the status of the Blind Oso, which includes the bird watching and rookery area. During the first phase of implementation, a
Texas Commission on Environmental Quality 34 Adopted August 2007

One TMDL for Oso Bay, Segment 2485
primary effort will be to consider and establish appropriate uses, water quality criteria, and management strategies for the Blind Oso.
Implementation to Address the TMDL The following description of implementation processes addresses generic types of activities that may be used for any typical TMDL. Because the Oso Bay TMDL is different from the usual pattern of load reductions, some processes discussed below will not be pertinent to or used in the Oso Bay I-plan.
Together, a TMDL and a TMDL I-Plan direct the correction of unacceptable water quality conditions that exist in an impaired surface water in the state. A TMDL broadly identifies the pollutant load goal after assessment of existing conditions and the impact on those conditions from probable or known sources. A TMDL identifies a total loading from the combination of point sources and nonpoint sources that would allow attainment of the established water quality standard.
A TMDL I-Plan specifically identifies required or voluntary implementation actions that will be taken to achieve the pollutant loading goals of the TMDL. Regulatory actions identified in the I-Plan could include:
� adjustment of an effluent limitation in a wastewater permit, � a schedule for the elimination of a certain pollutant source, � identification of any nonpoint source discharge that would be regulated as a point
source, � a limitation or prohibition for authorizing a point source under a general permit, or � a required modification to a storm water management program (SWMP) and pol
lution prevention plan (PPP).
Strategies to optimize compliance and oversight are identified in an I-Plan when necessary. Such strategies may include additional monitoring and reporting of effluent discharge quality to evaluate and verify loading trends, adjustment of an inspection frequency or a response protocol to public complaints, and escalation of an enforcement remedy to require corrective action of a regulated entity contributing to an impairment. For Oso Bay, load reductions are not required, but additional monitoring and reporting may be sought to evaluate and verify source contributions.
A TMDL and the underlying assumptions, model scenarios, and assessment results are not and should not be interpreted as required effluent limitations, pollutant load reductions that will be applied to specific permits, or any other regulatory action necessary to achieve attainment of the water quality standard. In simple terms, a TMDL is like a budget that determines the amount of a particular pollutant that the water body can receive and still meet a water quality standard. The I-Plan adopted by the commission will direct implementation requirements for certain sources that contribute a pollutant load to the impaired water. For Oso Bay, load reductions are not required, but additional monitoring and reporting may be sought to evaluate and verify source contributions.
Texas Commission on Environmental Quality 35 Adopted August 2007

One TMDL for Oso Bay, Segment 2485
The I-Plan will be developed in coordination with stakeholders who are affected by or interested in the goals of the TMDL. In determining which sources need to accomplish what reductions, the I-Plan may consider factors such as:
� cost and/or feasibility, � current availability or likelihood of funding, � existing or planned pollutant reduction initiatives such as watershed-based protec
tion plans, � whether a source is subject to an existing regulation, � the willingness and commitment of a regulated or unregulated source, and � a host of additional factors.
Ultimately, the I-Plan will identify the commitments and requirements to be implemented through specific permit actions and other means. For these reasons, the I-Plan that is adopted may not approximate the predicted loadings identified category by category in the TMDL and its underlying assessment, but with certain exceptions, the I-Plan must nonetheless meet the overall loading goal established by the commission-adopted and EPA-approved TMDL.
An exception would include an I-Plan that identifies a phased implementation that takes advantage of an adaptive management approach. It is not practical or feasible to approach all TMDL implementation as a one-time, short-term restoration effort. This is particularly true when a challenging wasteload reduction or load reduction was required by the TMDL, high uncertainty with the TMDL analysis exists, there is a need to reconsider or revise the established water quality standard, or the pollutant load reduction would require costly infrastructure and capital improvements.
Instead, activities contained in the first phase of implementation may be the full scope of the initial I-Plan and include strategies to make substantial progress towards source reduction and elimination, refine the TMDL analysis, conduct site-specific analyses of the appropriateness of an existing use, and monitor in stream water quality to gauge the results of the first phase. Ultimately, the accomplishments of the first phase would lead to development of a phase two or final I-Plan, or revision of the TMDL. This adaptive management approach is consistent with established guidance from the EPA (see August 2, 2006 memorandum from EPA relating to clarifications on TMDL revisions).
The TCEQ maintains an overall water quality management plan (WQMP) that directs the efforts to address water quality problems and restore water quality uses throughout Texas. The WQMP is continually updated with new, more specifically focused WQMPs, or “water quality management plan elements” as identified in federal regulations (40 CFR 130.6(c)). Consistent with federal requirements, each TMDL is a plan element of a WQMP; commission adoption of a TMDL is state certification of the WQMP update.
Because the TMDL does not reflect or direct specific implementation by any one pollutant discharger, the TCEQ certifies additional “water quality management plan elements” to the WQMP once the I-Plan is adopted by the commission. Based on the TMDL and I-Plan, the TCEQ will propose and certify WQMP updates to establish required water-
Texas Commission on Environmental Quality 36 Adopted August 2007

One TMDL for Oso Bay, Segment 2485
quality-based effluent limitations necessary for specific TPDES wastewater discharge permits. The TCEQ would normally establish best management practices (BMPs), which are a substitute for effluent limitations in TPDES MS4 storm water permits, as allowed by the federal rules where numeric effluent limitations are infeasible (see November 22, 2002 memorandum from EPA relating to establishing TMDL WLAs for storm water sources).
Thus, the TCEQ would not identify specific implementation requirements applicable to a specific TPDES storm water permit through an effluent limitation update. However, the TCEQ would revise a storm water permit, require a revised storm water management program (SWMP) or pollution prevention plan (PPP), or implement other specific revisions affecting storm water dischargers in accordance with an adopted I-Plan. For Oso Bay, load reductions are not required, but additional monitoring and reporting may be sought to evaluate and verify source contributions.
Texas Commission on Environmental Quality 37 Adopted August 2007
One TMDL for Oso Bay, Segment 2485
References Asquith, W., M. Roussel, J. Vrabel 2006. Statewide Analysis of the Drainage-Area Ratio
Method for 34 Streamflow Percentile Ranges in Texas. SIR2006-5286. Texas Water Science Center, United States Geological Survey.
Beaber, C. 2005. Personal communication, cited in Hay & Mott 2005. Excel spreadsheets of self-monitoring data for the Greenwood WWTF. Corpus Christi, Texas.
City of Corpus Christi 2003. Storm water data from annual report for August 2002–July 2003.
Cools, D., R. Merckx, K. Vlassak, and J. Verhaegen 2001. Survival of E. coli and En-terococcus derived from pig slurry in soils of different texture. Applied Soil Ecology, 17: 53-62.
Davenport, J. 2006. Personal communication: Proposed pending revisions to the Texas Surface Water Quality Standards. TCEQ, Austin, Texas.
Hay, R., and J. Mott 2005. Oso Creek and Oso Bay bacteria loading model, Work Order #1 final report. TCEQ Contract No. 582-5-72503. Texas A&M University–Corpus Christi. <www.tceq.state.tx.us/assets/public/implementation/water/tmdl/ 67osobaybacteria/67-osowo1finrpt-aug05.pdf>.
Hay, R., and J. Mott 2006. Oso Creek and Oso Bay bacteria loading model, Work Order #2 final report. TCEQ Contract No. 582-5-72503. Texas A&M University–Corpus Christi. <www.tceq.state.tx.us/assets/public/implementation/water/tmdl/ 67osobaybacteria/67-osowo2finrpt-dec06.pdf>.
NCDC 2005. <http://waterdata.usgs.gov/tx/nwis/uv/?site_no=08211520&PARAmeter_cd =00065,00060>. National Climatic Data Center, Internet site.
TCEQ 2004. Guidance for Assessing Texas Surface and Finished Drinking Water Quality Data. <www.tceq.state.tx.us/assets/public/compliance/monops/water/ 04twqi/04_guidance.pdf>.
TCEQ 2004. Texas Water Quality Inventory and 303(d) List. <www.tceq.state. tx.us/compliance/monitoring/water/quality/data/wqm/305_303.html>.
TCEQ 2000. Texas Surface Water Quality Standards, 2000 update, 30 TAC 307. <www.tceq.state.tx.us/permitting/water_quality/wq_assessment/standards/ WQ_standards_2000.html>.
USEPA 2002. Memorandum: Establishing Total Maximum Daily Load (TMDL) Waste-load Allocations (WLAs) for Storm Water Sources and NPDES Permit Requirements Based on Those WLAs. Robert H. Wayland, III to Water Division Directors, November 22, 2002..
USEPA 2006. Memorandum: Clarification Regarding “Phased” Total Maximum Daily Loads. Benita Best-Wong to Water Division Directors, August 2, 2006.
Texas Commission on Environmental Quality 38 Adopted August 2007