one wajax -...
TRANSCRIPT

WAJAX CORPORATION 2016 ANNUAL REPORT
WAJAX.COM
ONE WAJAXACROSS INDUSTRIES. ACROSS CANADA.

Forward-Looking Statements and Information
This Annual Report, including the accompanying Management’s Discussion and Analysis, includes forward-looking statements and information that is based on Wajax’s current beliefs, expectations, estimates and assumptions in light of information currently available. Actual results, performance and achievements may differ materially from those anticipated or implied in such forward-looking statements or information. Please see page 17 for a discussion of the risks and uncertainties related to such statements and information.
At Wajax, our goal is to be Canada’s leading industrial products and services provider, distinguished through:
The excellence of our sales force;
The breadth and efficiency of our repair and maintenance operations; and
Our ability to work closely with existing and new vendor partners to constantly expand our offering to our customers.
We are building on a strong foundation. Our dedicated team, national network, diverse market expertise, broad range of products and services and world-class vendor partners allow us to serve resource and industrial customers from coast-to-coast. We are transforming how we do business in order to serve our customers even better.
Wajax. Across Industries. Across Canada.
Contents
Financial Highlights 1Message to Our Shareholders 2Building on a Strong Foundation 4Transforming Wajax 6Executing Our Strategy 8Health and Safety 12Message from the Chairman 14Board of Directors 15Management’s Discussion and Analysis 17Management’s Responsibility for Financial Reporting 39Independent Auditors’ Report 39Consolidated Statements of Financial Position 40Consolidated Statements of Earnings 41Consolidated Statements of Comprehensive Income 41Consolidated Statements of Changes in Shareholders’ Equity 42Consolidated Statements of Cash Flows 43Notes to Consolidated Financial Statements 44Corporate Information 60Branch Locations

WAJAX CORPORATION 2016 ANNUAL REPORT 1
For the years ended December 31 (in millions of Canadian dollars, except per share data) 2016 2015 2014
Revenue $ 1,221.9 $ 1,273.3 $ 1,451.3Net earnings (loss) 11.0 (11.0) 41.2Adjusted net earnings(1) 20.1 27.8 43.3Cash flows from operating activities 58.5 7.9 52.9Funded net debt (1) 126.0 149.0 201.0Shareholders’ equity 276.8 288.5 248.5Basic earnings (loss) per share 0.55 (0.59) 2.46Adjusted basic earnings per share(1) 1.01 1.50 2.58Cash dividends declared 1.00 1.23 2.40
Leverage ratio(1) 2.07 2.05 2.17Weighted average number of shares outstanding 19,898,004 18,559,558 16,772,769
(1) These measures do not have standardized meaning prescribed by GAAP, see Management’s Discussion and Analysis, page 32.
20% Power Systems Products and Services
n West 29% n Central 22% n East 49%
n West 29% n Central 35% n East 36%
n West 52% n Central 24% n East 24%
49% Equipment Products and Services
31% Industrial Products and Services
2016 Revenue Distribution by Major Category
Financial Highlights
For the year ended December 31, 2016.
Revenue ($ millions)
20122013201420152016
1,451.3
1,221.9 1,273.31,428.5 1,466.0
Adjusted Basic Earnings Per Share(1) ($)
20122013201420152016
2.582.85
3.95
1.011.50
Basic Earnings (Loss) Per Share ($)
20122013201420152016
2.46
0.55
(0.59)
2.85
3.95

2 WAJAX CORPORATION 2016 ANNUAL REPORT
The backbone of our strategy is our goal to become Canada’s leading industrial products and service provider, distinguished through our core capabilities:
The excellence of our sales force;
The breadth and efficiency of our repair and maintenance operations; and
Our ability to work closely with existing and new vendor partners to constantly expand our offering to our customers.
Core capabilities are our most important organizational skills – these are the areas where we seek to distinguish Wajax in the eyes of our customers, vendors, investors and our team.
Our goal is supported by the “4 Points of Growth” framework which sets out the priorities in our four main areas of focus; specifically, programs for the development of the core capabilities, organic growth, acquisitions and systems investments. Amidst difficult market conditions and the major reorganization we completed in 2016, progress in many areas of the “4 Points of Growth” was excellent and is further described in this annual report.
Our reorganization was a major undertaking and we are appreciative (to say the least) of the significant effort made by the entire team who sought to minimize disruption to our customers and vendor partners. After decades of operation as a company organized based on three independent product segments, we transitioned to a functional organization. Detailed planning for the change began in late 2015, the change was announced in March 2016 and was largely completed by year end. Our team is now positioned to execute our strategy more effectively, has enterprise-
wide visibility to customer activities, provides a broader pool of resources to grow our major vendors’ businesses and operates at a lower cost. Additional information on the reorganization is included in this annual report.
At the start of 2016, we expected financial performance to be comprised of weaker first half earnings and improvements as the year progressed.
Our expectations were based primarily on weakness in western Canadian market conditions, the timing of customer deliveries and the expected flow-through during the year of benefits from our reorganization. First half results were further affected by the Fort McMurray wildfires and more significant pressure than we had expected on our western Canada power systems categories. Adjusted net earnings(1) in the first half of 2016 were $3.7 million, down 77% from 2015 and adjusted net earnings in the second half were $16.4 million, up 42% from 2015 (note that second half results include recoveries of $3.7 million in business interruption insurance, mainly related to the Fort McMurray wildfires). Total adjusted net earnings of $20.1 million were 28% lower than last year. Consolidated revenue was $1.22 billion in 2016 (down 4%). Revenue growth was difficult given the conditions in western Canada where sales declined 12%, partially offset by a 2% gain in central and eastern Canada. Our mining and oil sands equipment business had an excellent year with the delivery of four large mining shovels (approximately $69 million in revenue), three of which went to work in Fort McMurray and one in eastern Canada. Management of leverage was an important factor in 2016 and we are satisfied that our leverage ratio(1) ended the year at 2.1X, slightly above our target range of 1.5 – 2.0X. The Management’s Discussion and Analysis included with this Annual Report provides additional details regarding our financial performance during the year.
2016 was an important turning point for Wajax. We continued to push forward toward our goal of being Canada’s leading industrial products and services provider and we completed the major reorganization announced in March 2016. The reorganization has embedded the key execution elements of our strategy directly into how we are structured and has made our company simpler, leaner and better able to scale more efficiently when market conditions improve.
Message to Our Shareholders
(1) These measures do not have a standardized meaning prescribed by GAAP, see Management’s Discussion and Analysis, page 32.

WAJAX CORPORATION 2016 ANNUAL REPORT 3
We are very proud of our team’s safety performance in 2016 – Wajax’s safest year on record.
The number of recordable injuries declined by 39% (on top of a 23% reduction in 2015) and all major safety indicators continue to trend positively. Our safety teams, leaders, support staff and most importantly, our technicians and trades personnel, all contributed to this result. Supported by new training programs, measurement, processes and constant dialogue on safety, we continue to progress toward our ultimate goal of making sure every member of our team goes home safe at the end of every shift.
As we look forward to 2017, we expect market conditions to remain challenging.
Although there have been some announced increases in planned investments by Canadian oil and gas companies, we expect that most major resource and industrial markets will remain under continuing spending and resultant competitive pressure. Our focus in 2017 will be to generate revenue sufficient to offset the four large shovel deliveries made in 2016 (which are not expected to be repeated), effectively manage our margins and ensure we deliver the operational improvements and full annualized savings expected from our reorganization.
Assuming the achievement of these objectives, we anticipate net earnings in 2017 will increase compared to 2016 adjusted net earnings.
In closing, I would like to thank three stakeholders who have made tremendous contributions to Wajax. Paul Gagné, a director since 1996 and Chairman of the Board since 2006, will retire from the Board of Directors at the close of the company’s 2017 annual meeting of shareholders. Paul has been an exceptional director and, as Chairman, has demonstrated great passion for the company, its strategic direction and how best to enhance shareholder value. The board, management team and I in particular will miss his influence, contributions and wisdom. Rob Dexter has been
nominated by his fellow directors to assume the duties of Chairman following the 2017 annual meeting. Rob has been a director since 1988 and has most recently served as Chair of the Human Resources and Compensation Committee of the board. We look forward to welcoming Rob as Chairman.
John Hamilton, who served as the company’s Chief Financial Officer for 18 years, retired in March 2017. A stalwart member of the senior management team, John saw the company through both peaks and troughs, with one eye on the balance sheet and the other on the income statement. I have greatly valued his advice, experience, dedication and guidance, and our entire team congratulates John on a successful career and wishes him a happy and healthy retirement. We welcome Darren Yaworsky, who has assumed the role of Chief Financial Officer. Darren’s extensive experience in corporate finance and his enthusiasm for growing our business make him a great addition to our management group.
Finally, I would like to thank the entire Wajax team. I have always admired the dedication and resilience of the people who work for our company, but never more so than over the past year.
We are especially proud of our team’s response to the wildfires in Fort McMurray. The community is home to many of our largest customers, important business partners and 124 of our Wajax colleagues who live and work there. From the start of major evacuations on May 3 to the day our team went back to work, our focus was on ensuring they and our customers were taken care of. We thank our entire team across Canada for their help and generosity.
The effort required to manage through difficult conditions, reorganize the company, deliver improving financial results and achieve our safest year on record is, quite simply, impressive. It is a privilege to work with every member of our team every day. It is their energy and enthusiasm for our business that will drive the growth we are so excited about.
Mark Foote Chief Executive Officer

4 WAJAX CORPORATION 2016 ANNUAL REPORT
Our national branch network of 109 locations covers all major resource and industrial markets in Canada. We operate dedicated and combined locations providing sales, service operations, industrial distribution and engineered repair services.
2016 2015
n Transportation 15% 15%n Forestry 15% 14%n Industrial/Commercial 15% 14%n Construction 14% 15%n Oil Sands 11% 10%n Mining 9% 9%n Metal Processing 6% 6%n Government and Utilities 5% 5%n Oil and Gas 2% 5%n Other 8% 7%
2016 Revenue by Market
Building on a Strong Foundation
2016 2015
n Western Canada 40% 44%n Central Canada 26% 26%n Eastern Canada* 34% 30% *Includes Quebec and the Atlantic provinces.
2016 Revenue by Geographic Region
Wajax’s foundation starts with our team of approximately 2,200 active technicians, parts and service, sales and support personnel whose safety is our first priority. Our team’s engineering, sales and service skills support a diverse range of customers in all regions of Canada, from major mining companies to local contractors. We support our customers through a national branch network that delivers one of the broadest ranges of industrial products and services in the country.

WAJAX CORPORATION 2016 ANNUAL REPORT 5
Construction
Sales and product support for excavators, articulated dump trucks, road building, wheel loaders, skid steers and utility equipment, working with major vendors including Hitachi, Bell, Wirtgen and JCB.
Forestry
Sales and product support for harvesters, forestry excavators, feller bunchers, skidders, forwarders, log loaders and chippers, working with major vendors including Tigercat, Hitachi and Peterson.
Power Generation
Engineering, design, sales, rental and product support for diesel, natural gas and CHP systems for standby and prime power for land and marine applications, working with major vendors including MTU.
Process
Engineering, design, sales and product support for process instrumentation, filtration and pumping systems, working with major vendors including ITT, 3M, Honeywell and Moyno.
Material Handling
Sales, rental and product support for industrial and heavy duty lift trucks, pallet trucks and stackers and container handlers, working with major brands including Hyster and Yale.
On-Highway Power Train
Sales and product support for truck, coach and utility vehicle engine, transmission and ancillary services, working with major vendors including Detroit, Allison and Webasto.
Crane and Utility
Engineering, design, sales and product support for knuckle-boom cranes, telescopic aerial and truck mounted cranes, working with major vendors including Terex and Palfinger.
Bearing and Power Transmission
Engineering, design, sales and product support for bearings, electric motors, gear reducers, chain and belt systems, working with major vendors including SKF, Timken, NTN and Baldor Dodge.
Off-Highway Power Train
Engineering, design, sales and product support for power train services to the mining, oil and gas and commercial and defense marine markets, working with major vendors including Rolls Royce Power Systems (MTU), Allison and Volvo.
Mining and Oil Sands
Sales and product support for hydraulic shovels, rigid frame trucks and underground equipment, working with major vendors including Hitachi and Fletcher.
Engineered Repair Services
ISO-certified engineering and repair centres providing design, repairs and rebuilds, field services, reliability services, and installation and commissioning.
Fluid Power
Engineering, design, sales and product support for hydraulic and pneumatic systems, working with major vendors including Eaton, Hawe Hydraulik, Festo and SMC.

6 WAJAX CORPORATION 2016 ANNUAL REPORT
Transforming Wajax
To improve the execution of our strategy, lower our costs, increase operating leverage and to scale more efficiently as market conditions improve, Wajax undertook a major reorganization in 2016.
Benefits
Customers
The reorganization of the sales force and the implementation of a CRM system are improving the coordination and visibility to customer activities across all product and service categories. Major markets, starting with the oil sands and mining, have dedicated teams that interact with resources elsewhere in the company to ensure the broadest range of customers’ needs are covered.
Team
Our team operates as an integrated unit within a simple functional structure focused on servicing the customer and growing the total business. Important employee attributes are significantly improved such as communications, alignment on goals, awareness of career opportunities, access to training and consistency of individual and team compensation.
Vendors
Sales representatives have maintained their product-specific level of technical expertise but operate within a standard sales process and management structure which is expected to benefit vendors through revenue growth. Regardless of the category they specialize in, sales personnel are being trained in the full product and service range and can generate sales leads for all major categories. Major vendors and categories have dedicated managers who work closely with vendors to develop business plans and monitor execution.
InvestorsWajax expects to execute its strategy more effectively, operate at a lower cost and scale more efficiently as market conditions improve.
The reorganization was planned by our management team in late 2015, announced in March 2016 and largely completed between May and December, 2016.
The project was a major undertaking and has transformed the company from its previous structure of three independent product segments to an integrated functional organization. Within the new structure, main sales and service functions are supported by common support groups, including supply chain, finance, human resources, information systems and environment, health and safety.
Throughout the Wajax reorganization, face-to-face communications with our team were critical. Wajax senior managers and local teams held over 50 Town Hall meetings, covering all major regions, to provide updates and resolve issues affecting teams, vendors and customers.

WAJAX CORPORATION 2016 ANNUAL REPORT 7
Included in the changes was the reorganization of management structures and teams, the development of new business processes, implementation of new information systems and the reconfiguration of measurement and compensation systems. We are very pleased that the management roles created in the reorganization were almost entirely filled with high potential leaders from our current team, offering enhanced career opportunities for our employees.
Approximately 200 roles (8% of the active workforce at the start of the year) were eliminated in the change and the estimated annualized pre-tax cost savings, net of implementation costs, is approximately $17.0 million in 2017, of which $8.6 million was achieved in 2016.
Given the speed and magnitude of the change for Wajax, and market conditions that existed in 2016, managing the change was an important consideration.
The focus was placed primarily on ensuring open and transparent communications with our team and not disrupting our customers and vendors.
We are pleased that our financial and safety results, two major barometers of the health of our business, improved during the timeframe of the implementation. While other factors contributed to the improving results, the fact that we saw improvements during a period of significant internal change is a testament to the efforts of our team. Our vendor partners were also key stakeholders in our change and we appreciate their support as we have continued to adjust to reflect their feedback.
While we are pleased with the initial results, we will continue to optimize our new organization as we work through 2017.
In managing the organizational change, the majority of which began in July 2016, we tracked a series of important measures reflecting the issues faced by our team, our vendors and our financial and safety performance. We were pleased that the majority of measures met our expectations and that both our financial and safety performance improved during the transition period from July to December 2016.
Revenue ($ millions)
Revenue trends improved on a year-over-year basis from a 5.5% reduction in the first half of the year to a 2.4% reduction in the second half.
Adjusted Net Earnings(1)(2) ($ millions)
Adjusted net earnings improved significantly in the second half of the year due to the timing of customer deliveries, improved margins and a lower year-over-year SGA of $7.9 million due primarily to the reorganization.
Safety (Recordable Injuries)
The number of recordable injuries declined 33%, comparing the July to December period to the first half of the year. Recordable injuries declined 39% for the full year.
Tracking customer activities during Wajax’s organizational change was important. Our CRM system has become an important tool for doing so and was rolled out to over 400 sales and support personnel to ensure that teams who service customers before, during and after the transition have the necessary information to maintain a high level of service.
Adjusted Earnings ($ millions)
January to June 2016 (H1)July to December 2016 (H2)
16.4
3.7
Revenue ($ millions)
January to June 2016 (H1)July to December 2016 (H2)
600.3 621.6
– 2.4% to 2015 – 5.5% to 2015
Safety (Recordable Injuries)
January to June 2016 (H1)July to December 2016 (H2)
22
33– 33% to H1
(1) July to December includes the effect of $3.7 million in business interruption insurance recoveries mainly related to the Fort McMurray wildfires.
(2) These measures do not have a standardized meaning prescribed by GAAP, see Management’s Discussion and Analysis, page 32.
8 WAJAX CORPORATION 2016 ANNUAL REPORT
Executing Our Strategy
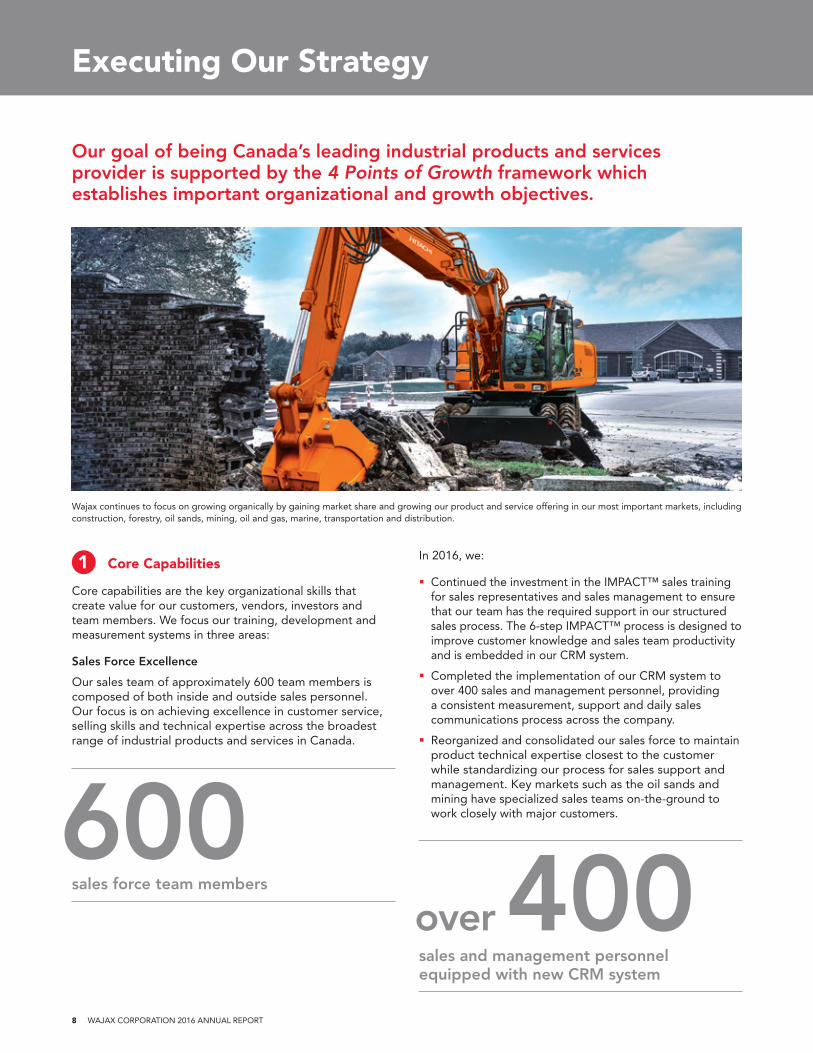
Our goal of being Canada’s leading industrial products and services provider is supported by the 4 Points of Growth framework which establishes important organizational and growth objectives.
1 Core Capabilities
Core capabilities are the key organizational skills that create value for our customers, vendors, investors and team members. We focus our training, development and measurement systems in three areas:
Sales Force Excellence
Our sales team of approximately 600 team members is composed of both inside and outside sales personnel. Our focus is on achieving excellence in customer service, selling skills and technical expertise across the broadest range of industrial products and services in Canada.
In 2016, we:
Continued the investment in the IMPACT™ sales training for sales representatives and sales management to ensure that our team has the required support in our structured sales process. The 6-step IMPACT™ process is designed to improve customer knowledge and sales team productivity and is embedded in our CRM system.
Completed the implementation of our CRM system to over 400 sales and management personnel, providing a consistent measurement, support and daily sales communications process across the company.
Reorganized and consolidated our sales force to maintain product technical expertise closest to the customer while standardizing our process for sales support and management. Key markets such as the oil sands and mining have specialized sales teams on-the-ground to work closely with major customers.
Wajax continues to focus on growing organically by gaining market share and growing our product and service offering in our most important markets, including construction, forestry, oil sands, mining, oil and gas, marine, transportation and distribution.
600sales force team members
over 400sales and management personnel equipped with new CRM system

WAJAX CORPORATION 2016 ANNUAL REPORT 9
Repair and Maintenance Operations
Our team of approximately 950 technicians and parts and service personnel operate 54 major repair and maintenance locations positioned to serve customers coast-to-coast. Our objective is to achieve significant improvement, and ultimately leadership, in repair operations in terms of safety, customer service, breadth of repair services and profitability.
In 2016, we:
Achieved very strong improvements in our safety results. Approximately 80% of all recordable injuries involve our technicians and other trades personnel who work in high risk roles. Safety awareness, constant dialogue, ongoing improvements to support systems and enhanced training were significant contributors to a 39% reduction in recordable injuries and our safest year on record.
Reorganized and consolidated our service management team and implemented standard operating procedures, new service management training and a consistent operational system for all main service branches. Like our sales reorganization, our service management team is now under one leadership structure which has improved overall efficiency and provided a consistent focus on parts and service operations, shop profitability and customer service.
Product, Service and Vendor Development
Wajax works closely with world-class vendors to deliver a compelling range of products and services designed to meet the needs of customers across diverse markets in all regions of Canada. Our ability to expand that range based on the needs of our customers is an important factor in our growth.
In 2016, we:
Continued to improve our vendor, product and service development process. Our sales, business development, vendor and technical teams use customer feedback and market knowledge to determine the opportunities to expand the product and service range to increase our ability to grow with our customers.
Added important new products and/or services in areas such as energy storage, alternative fuel systems, turbines and marine products. We completed important research on the Canadian industrial services market in order to validate our target company acquisition pipeline and to review the opportunities to expand our acquisitions strategy.
Hyster material handling equipment is an important category for Wajax. We provide sales, rental and product support for a broad range of lift trucks, container handlers and large material handling vehicles. Wajax’s material handling offering was extended in 2016 with hydrogen powered vehicles. In an effort to increase productivity and operational efficiency through clean, non-combustive, non-emissive and sustainable technology, Canadian Tire Corporation chose Hyster’s Nuvera fuel cells to power forklifts in two Ontario distribution centres.
Qulliq Energy Corporation required delivery of a 1.1 MW continuous power system to the Cambridge Bay site in Nunavut. Wajax engineered and delivered the system which was powered by an MTU 16V4000 engine in a custom enclosure with integrated switchgear and heat recovery. The system augments existing MTU generators that have provided reliable power to the community for over 30,000 hours. The key to this project was on time delivery due to the logistics challenges of transportation to the site at one of Canada’s northernmost points. The unit was delivered on time in July and commissioned in December. The additional power supports the Canadian High Arctic Research Centre, opening for Canada’s 150th anniversary in 2017.

10 WAJAX CORPORATION 2016 ANNUAL REPORT
2 Organic Growth
While market conditions, particularly in western Canada, made organic growth difficult in 2016, we achieved wins in a number of important areas such as mining, and protected our positon in major categories such as construction, forestry, material handling, power generation and industrial components.
2016 highlights include:
Mining – In the Equipment segment, we achieved a 71% increase in mining equipment, parts and service sales due to the delivery of four large Hitachi mining shovels and an improvement in parts and service volumes related to higher equipment utilization in the oil sands. In addition to the equipment category, multi-year mining supply contracts for industrial components remain an important focus to build sustained revenue. Mining is one of Wajax’s most important markets, contributing to the results of a broad range of product and service categories. Total sales to Wajax’s mining and oil sands customers were $254 million in 2016.
Material Handling – We signed multi-year equipment, parts and service contracts with major customers including the Department of National Defense. In addition, Wajax will support Canadian Tire Corporation’s project to use hydrogen fuel cell technology to replace lead acid batteries to power forklifts in two Ontario distribution centres. Canadian Tire conducted a comprehensive evaluation before selecting Hyster’s Nuvera hydrogen fuel cell technology which will be exclusively supported in Canada by Wajax. Total sales in the material handling category were $109 million in 2016.
Power Generation – Working closely with our partner MTU, Wajax provides gas and diesel standby, prime power and CHP (combined heat and power) systems for a broad range of applications including data centres, water treatment, mining, oil and gas and commercial and defense marine. Major projects in 2016 included our work with Urbacon, a leading data centre provider, to supply a turnkey 12.5 MW standby system for the initial stage of Urbacon’s Richmond Hill, Ontario site. Power Generation is an important area of organic growth due to growing demand from commercial, industrial, resource and marine markets. Total power generation sales (including rental) were $73 million in 2016.
Hitachi is a world leader in hydraulic mining shovels. As one of Hitachi’s largest distributors, Wajax delivered 4 large mining shovels in 2016 to mining and oil sands customers in eastern and western Canada. Wajax continues to work closely with Hitachi on earning market share in the rigid-frame haul truck market with Hitachi’s line of electric drive vehicles designed for large surface mining and oil sands operations.
Executing Our Strategy
WAJAX CORPORATION 2016 ANNUAL REPORT 11
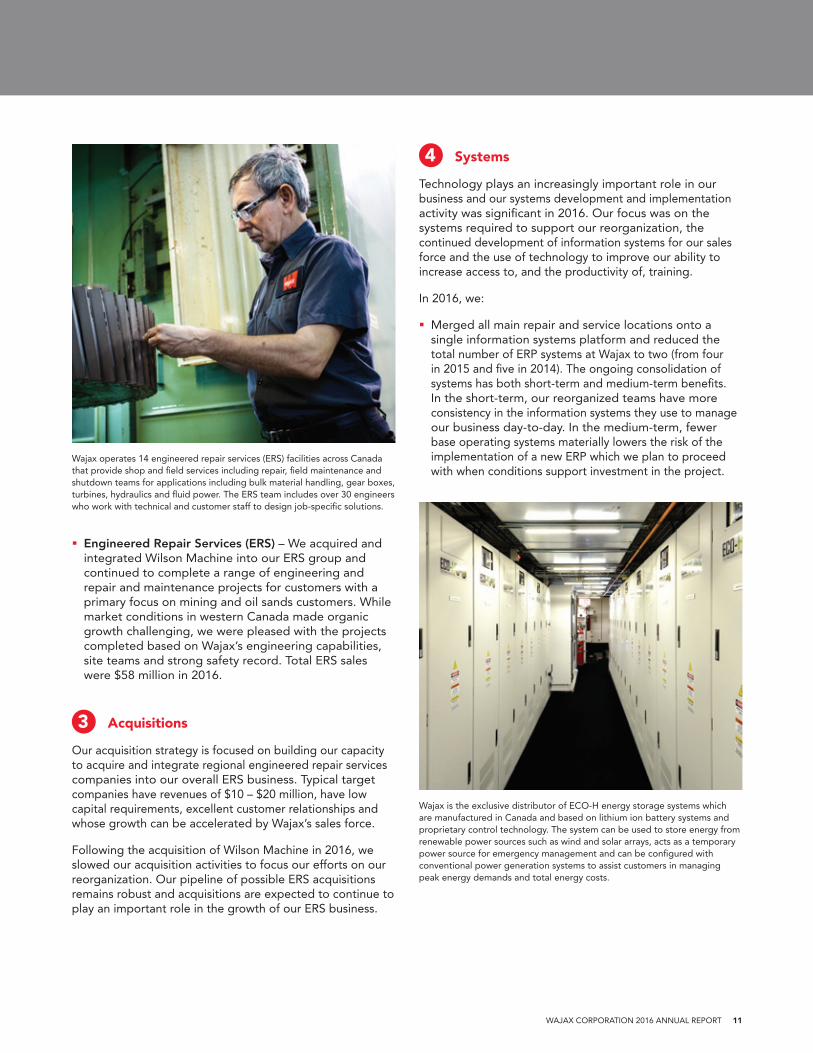
Engineered Repair Services (ERS) – We acquired and integrated Wilson Machine into our ERS group and continued to complete a range of engineering and repair and maintenance projects for customers with a primary focus on mining and oil sands customers. While market conditions in western Canada made organic growth challenging, we were pleased with the projects completed based on Wajax’s engineering capabilities, site teams and strong safety record. Total ERS sales were $58 million in 2016.
3 Acquisitions
Our acquisition strategy is focused on building our capacity to acquire and integrate regional engineered repair services companies into our overall ERS business. Typical target companies have revenues of $10 – $20 million, have low capital requirements, excellent customer relationships and whose growth can be accelerated by Wajax’s sales force.
Following the acquisition of Wilson Machine in 2016, we slowed our acquisition activities to focus our efforts on our reorganization. Our pipeline of possible ERS acquisitions remains robust and acquisitions are expected to continue to play an important role in the growth of our ERS business.
4 Systems
Technology plays an increasingly important role in our business and our systems development and implementation activity was significant in 2016. Our focus was on the systems required to support our reorganization, the continued development of information systems for our sales force and the use of technology to improve our ability to increase access to, and the productivity of, training.
In 2016, we:
Merged all main repair and service locations onto a single information systems platform and reduced the total number of ERP systems at Wajax to two (from four in 2015 and five in 2014). The ongoing consolidation of systems has both short-term and medium-term benefits. In the short-term, our reorganized teams have more consistency in the information systems they use to manage our business day-to-day. In the medium-term, fewer base operating systems materially lowers the risk of the implementation of a new ERP which we plan to proceed with when conditions support investment in the project.
Wajax operates 14 engineered repair services (ERS) facilities across Canada that provide shop and field services including repair, field maintenance and shutdown teams for applications including bulk material handling, gear boxes, turbines, hydraulics and fluid power. The ERS team includes over 30 engineers who work with technical and customer staff to design job-specific solutions.
Wajax is the exclusive distributor of ECO-H energy storage systems which are manufactured in Canada and based on lithium ion battery systems and proprietary control technology. The system can be used to store energy from renewable power sources such as wind and solar arrays, acts as a temporary power source for emergency management and can be configured with conventional power generation systems to assist customers in managing peak energy demands and total energy costs.

12 WAJAX CORPORATION 2016 ANNUAL REPORT
We are committed to ensuring that every member of our team goes home safe at the end of every shift. 2016 was the safest year on record for Wajax resulting in a 39% decline in recordable injuries. While we will not be satisfied until our workplace is completely injury free, we are pleased with our ongoing progress and thank our technicians, sales teams, contractors, support personnel and managers for their constant focus on safety.
Health and Safety
In 2016, we:
Launched a revitalized safety program to establish an even stronger platform for cultural change. The program is designed to provide improved support for local managers by focusing on four areas: safety leadership, systems, culture and behavior.
Advanced our Behaviour Based Safety Program. This program reinforces safe behaviour through a colleague observation process that thanks team members for exhibiting safe practices and calls-out unsafe practices when they are observed.
We introduced the SafeStart® program in selected large branches where the risk of injury is highest. SafeStart® provides additional training to branch personnel in the four areas of Rushing, Frustration, Fatigue, and Complacency, which can be the root cause of a significant portion of injuries.
Implemented 14 “Lifesaving Rules” which are non-negotiable “must-dos” to ensure everyone’s safety.
Continued our senior leadership walk-throughs and safety meetings to provide support for local managers and to ensure that the dialogue on safety is focused on the most important issues faced by our team.
Continued our practice of Safety Stop calls where we stand-down the national leadership team for 15 minutes upon the occurrence of a serious injury or near miss. These calls ensure that we quickly communicate information on the situation to ensure that local managers and their teams have the information required to ensure that a similar incident does not occur at their location.
Wajax completed an engineered repair services project for Shell’s Muskeg River Mine that required a team of approximately 145 who completed confined-space repairs to an ore crusher during a scheduled maintenance shutdown. We are proud to say that the Wajax team received Shell’s “Golden Toolbox” award recognizing the management of the work area and the dedication of the team, both important contributors to completing this project injury-free.
39%decline in total number of recordable injuries
35%decrease in total recordable incident frequency (TRIF)

71%of our high-risk branches were injury-free following implementation of SafeStart®
88%average score for branch safety audits
Wajax Lifesaving RulesWajax has adopted 14 Lifesaving Rules as listed below. These rules shall be followed by all employees and contractors’ employees and are non-negotiable. If employees break the rules, they face disciplinary action up to termination of employment for cause.
Wear a seatbelt when operating vehicles or moving equipment
Operate equipment or vehicles without the appropriate training and license
Control hazards to yourself or others before the work starts
Wear all personal protective equipment required for the task
Use a hand-held communication device while driving
Walk under a suspended load
Use all safety protective devices provided on tools and equipment
Use fall protection/fall arrest when working at heights, as defined by Wajax or customer standards
Disable, disarm or interfere with safety devices, equipment or alarms
Climb on or off equipment, ladders or vehicles without using 3 points of contact
Isolate all energy sources and lock out powered equipment
Report injuries, property damage, near misses and environmental incidents
Attempt to lift or manoeuver a heavy load beyond your capability and/or if the load exceeds Wajax or customer standards
Perform any work while in violation of the Wajax Drug and Alcohol policy
Always
Never

14 WAJAX CORPORATION 2016 ANNUAL REPORT
The entire Wajax team worked tirelessly during the year, both to complete the strategic reorganization and to address market conditions, which remained weak, particularly in western Canada. In spite of these challenges, financial results improved as the year went on as Wajax began to reap some of the benefits of its new organizational structure.
The focus of the board during 2017 will be to support Mark and his team as they continue to refine operations, drive efficiencies and further execute the corporation’s strategic plan.
As a board, we are pleased with the progress made since the introduction of the 4 Points of Growth strategy in March 2015, and continue to believe very strongly that the strategy will result in a stronger, customer focused competitor, delivering more resilient earnings through the market cycle.
As discussed in Mark’s letter to shareholders, John Hamilton, Wajax’s Chief Financial Officer since 1999, retired in March 2017. I would be remiss in not adding my sincere personal thanks and the thanks of the board to John for his years of dedication and outstanding service to Wajax. We have greatly valued his contributions and wish him the very best in his retirement. On behalf of the board, I also welcome Darren Yaworsky as John’s successor. Darren’s broad range of financial leadership experience will allow him to make an immediate impact as the corporation continues to execute its growth strategy.
This Annual Report also marks my last as Chairman of Wajax. After twenty one years, I will be retiring from the Board of Directors following the corporation’s 2017 annual meeting. Rob Dexter, the current Chair of the Human Resources and Compensation Committee and a director since 1988, has been nominated by the members of the board to assume the duties of Chairman following the 2017 annual meeting. Rob is an exceptionally experienced director, and will do an excellent job in leading the board forward.
It has been a tremendous honour to serve as a director and Chairman of Wajax, and I thank my fellow directors and members of management for their support over the years, as well as shareholders for their confidence.
Paul E. Gagné Chairman of the Board
During 2016 Wajax continued to take major steps forward in executing its 4 Points of Growth strategy. In particular, the corporation completed the strategic reorganization announced in March 2016, improving its focus on customers, better aligning its resources with its strategic goals, improving operational leverage and lowering costs. With market challenges expected to persist in 2017, Wajax is in a stronger competitive position and will benefit further when conditions improve.
Message from the Chairman

WAJAX CORPORATION 2016 ANNUAL REPORT 15
Thomas M. Alford ▲n Director since 2014
Mr. Alford is a corporate director.
Ian A. Bourne ● Director since 2006
Mr. Bourne is a corporate director.
Edward M. Barrett ●▲ Director since 2006
Mr. Barrett is Chairman and Co-Chief Executive Officer of Barrett Corporation.
Douglas A. Carty ●n Director since 2009
Mr. Carty is a corporate director and the Chairman and Co-Founder of Switzer-Carty Transportation Inc.
Sylvia D. Chrominska ●▲ Director since 2015
Ms. Chrominska is a corporate director.
Robert P. Dexter ▲n Director since 1988
Mr. Dexter is Chairman and Chief Executive Officer of Maritime Travel Inc.
A. Mark Foote Director since 2012
Mr. Foote is President and Chief Executive Officer of the Corporation.
John C. Eby ●n Director since 2006
Mr. Eby is a corporate director and a Founder and the President of Developing Scholars.
Paul E. Gagné Director since 1996
Mr. Gagné is a corporate director and the Chairman of the Board of Directors of the Corporation.
Alexander S. Taylor ▲n Director since 2009
Mr. Taylor is President, Power Group of SNC-Lavalin Group Inc.
● Audit Committee▲ Human Resources and Compensation Committeen Governance Committee
Board of Directors

WAJAX CORPORATION 2016 ANNUAL REPORT 17
The following management’s discussion and analysis (“MD&A”) discusses the consolidated financial condition and results of operations of Wajax Corporation (“Wajax” or the “Corporation”) for the year ended December 31, 2016. This MD&A should be read in conjunction with the information contained in the Corporation’s Consolidated Financial Statements and accompanying notes for the year ended December 31, 2016. Information contained in this MD&A is based on information available to management as of March 7, 2017.
Unless otherwise indicated, all financial information within this MD&A is in millions of Canadian dollars, except ratio calculations, share, share rights and per share data. Additional information, including Wajax’s Annual Report and Annual Information Form, are available on SEDAR at www.sedar.com.
Responsibility of Management and the Board of Directors
Management is responsible for the information disclosed in this MD&A and the Consolidated Financial Statements and accompanying notes, and has in place appropriate information systems, procedures and controls to ensure that information used internally by management and disclosed externally is materially complete and reliable. Wajax’s Board of Directors has approved this MD&A and the Consolidated Financial Statements and accompanying notes. In addition, Wajax’s Audit Committee, on behalf of the Board of Directors, provides an oversight role with respect to all public financial disclosures made by Wajax and has reviewed this MD&A and the Consolidated Financial Statements and accompanying notes.
Disclosure Controls and Procedures and Internal Control over Financial Reporting
Wajax’s management, under the supervision of its Chief Executive Officer (“CEO”) and Chief Financial Officer (“CFO”), is responsible for establishing and maintaining disclosure controls and procedures (“DC&P”) and internal control over financial reporting (“ICFR”).
As at December 31, 2016, Wajax’s management, under the supervision of its CEO and CFO, had designed DC&P to provide reasonable assurance that information required to be disclosed by Wajax in annual filings, interim filings or other reports filed or submitted under applicable securities legislation is recorded, processed, summarized and reported within the time periods specified in such securities legislation. DC&P are designed to ensure that information required to be disclosed by Wajax in annual filings, interim filings or other reports filed or submitted under applicable securities legislation is accumulated and communicated to Wajax’s management, including its CEO and CFO, as appropriate, to allow timely decisions regarding required disclosure.
As at December 31, 2016, Wajax’s management, under the supervision of its CEO and CFO, had designed internal control over financial reporting (“ICFR”) to provide reasonable assurance regarding the reliability of financial reporting and the preparation of financial statements for external purposes in accordance with International Financial Reporting Standards (“IFRS”). In completing the design, management used the criteria set forth by the Committee of Sponsoring Organizations of the Treadway Commission (“COSO”) in its 2013 version of Internal Control – Integrated Framework. With regard to general controls over information technology, management also used the set of practices
of Control Objectives for Information and related Technology (“COBIT”) created by the IT Governance Institute.
During the year, Wajax’s management, under the supervision of its CEO and CFO, evaluated the effectiveness and operation of its DC&P and ICFR. This evaluation included a risk evaluation, documentation of key processes and tests of effectiveness conducted on a sample basis throughout the year. Due to the inherent limitations in all control systems, an evaluation of the DC&P and ICFR can only provide reasonable assurance over the effectiveness of the controls. As a result, DC&P and ICFR are not expected to prevent and detect all misstatements due to error or fraud. The CEO and CFO have concluded that Wajax’s DC&P and ICFR were effective as at December 31, 2016.
During the three months ended December 31, 2016, Wajax has made material changes to its ICFR. In particular, there were changes to ICFR when the remainder of the Power Systems segment adopted the Equipment segment’s computer system as part of the transition to a new functional organization. See the Reorganization section.
Cautionary Statement Regarding Forward-Looking Information
This Annual Report and MD&A contains certain forward-looking statements and forward-looking information, as defined in applicable securities laws (collectively, “forward-looking statements”). These forward-looking statements relate to future events or the Corporation’s future performance. All statements other than statements of historical fact are forward-looking statements. Often, but not always, forward looking statements can be identified by the use of words such as “plans”, “anticipates”, “intends”, “predicts”, “expects”, “is expected”, “scheduled”, “believes”, “estimates”, “projects” or “forecasts”, or variations of, or the negatives of, such words and phrases or state that certain actions, events or results “may”, “could”, “would”, “should”, “might” or “will” be taken, occur or be achieved. Forward looking statements involve known and unknown risks, uncertainties and other factors beyond the Corporation’s ability to predict or control which may cause actual results, performance and achievements to differ materially from those anticipated or implied in such forward looking statements. There can be no assurance that any forward looking statement will materialize. Accordingly, readers should not place undue reliance on forward looking statements. The forward looking statements in this Annual Report and MD&A are made as of the date of this MD&A, reflect management’s current beliefs and are based on information currently available to management. Although management believes that the expectations represented in such forward-looking statements are reasonable, there is no assurance that such expectations will prove to be correct. Specifically, this Annual Report and MD&A includes forward looking statements regarding, among other things, the strategic reorganization we undertook during 2016 and the benefits we expect to achieve therefrom, including improved execution of our 4 Points of Growth strategy and full annualized cost savings of $17 million starting in 2017; our 4 Points of Growth Strategy and the goals of such strategy, including our goal of becoming Canada’s leading industrial products and services provider; our “4 Points of Growth” framework to grow the corporation; our target leverage ratio range of 1.5 – 2.0 times; our continued focus on and execution of investments and strategies with respect to our core capabilities, organic growth programs, acquisitions
Management’s Discussion and Analysis
18 WAJAX CORPORATION 2016 ANNUAL REPORT
MANAGEMENT’S DISCUSSION AND ANALYSIS
and information systems/technology, as well as the expected benefits therefrom; our belief that we can leverage our sales force and geographic footprint to significantly grow the Wilson Machine business; our financing, working and maintenance capital requirements, as well as our capital structure and leverage ratio; our foreign exchange risks and exposures, including the impact of fluctuations in foreign currency values; our obligation to fund pension benefits; the adequacy of our debt capacity; our intention and ability to access debt and equity markets should additional capital be required; our outlook for major resource and industrial markets in 2017; our areas of focus in 2017, including generating revenue sufficient to offset four large shovel deliveries made in 2016 which are not expected to repeat, effectively managing our margins, and delivering the operational improvements and full annualized savings expected from the strategic reorganization; and our outlook for 2017 net earnings should we be successful in achieving the forgoing objectives. These statements are based on a number of assumptions which may prove to be incorrect, including, but not limited to, assumptions regarding general business and economic conditions; the supply and demand for, and the level and volatility of prices for, oil and other commodities; financial market conditions, including interest rates; our ability to execute our 4 Points of Growth strategy, including our ability to develop our core capabilities, execute on our organic growth priorities, complete and effectively integrate acquisitions and to successfully implement new information technology platforms, systems and software; the future financial performance of the Corporation; our costs; market competition; our ability to attract and retain skilled staff; our ability to procure quality products and inventory; and our ongoing relations with suppliers, employees and customers. The foregoing list of assumptions is not exhaustive. Factors that may cause actual results to vary materially include, but are not limited to, a deterioration in general business and economic conditions; volatility in the supply and demand for, and the level of prices for, oil and other commodities; a continued or prolonged decrease in the price of oil; fluctuations in financial market conditions, including interest rates; the level of demand for, and prices of, the products and services we offer; levels of customer confidence and spending; market acceptance of the products we offer; termination of distribution or original equipment manufacturer agreements; unanticipated operational difficulties (including failure of plant, equipment or processes to operate in accordance with specifications or expectations, cost escalation, our inability to reduce costs in response to slow-downs in market activity, unavailability of quality products or inventory, supply disruptions, job action and unanticipated events related to health, safety and environmental matters); our ability to attract and retain skilled staff and our ability to maintain our relationships with suppliers, employees and customers. The foregoing list of factors is not exhaustive. Further information concerning the risks and uncertainties associated with these forward looking statements and the Corporation’s business may be found in this MD&A under the heading “Risk Management and Uncertainties” and in our Annual Information Form for the year ended December 31, 2016, filed on SEDAR. The forward-looking statements contained in this Annual Report and MD&A are expressly qualified in their entirety by this cautionary statement. The Corporation does not undertake any obligation to publicly update such forward-looking statements to reflect new information, subsequent events or otherwise unless so required by applicable securities laws. Readers are further cautioned that the preparation of financial statements in accordance with IFRS requires management to make certain judgements and estimates that affect the reported amounts of assets, liabilities, revenues and expenses. These estimates may change, having either a negative or positive effect on net earnings as further information becomes available, and as the economic environment changes.
Non-GAAP and Additional GAAP Measures
This Annual Report and MD&A contains both non-GAAP and additional GAAP measures that do not have a standardized meaning prescribed by GAAP. These measures are defined and reconciled to the most comparable GAAP measure in the Non-GAAP and Additional GAAP Measures section.
Wajax Corporation Overview
Wajax is a leading Canadian distributor engaged in the sale and service support of mobile equipment, power systems and industrial components through a network of 109 branch locations across Canada. Reflecting a diversified exposure to the Canadian economy, Wajax’s customer base covers core sectors of the Canadian economy, including construction, industrial and commercial, transportation, the oil sands, forestry, oil and gas, metal processing and mining.
On March 1, 2016, Wajax announced that it would transition from its current three independent product divisions to a leaner and more integrated functional organization. The new structure is intended to improve Wajax’s cross-company customer focus, closely align resources to the 4 Points of Growth strategy, improve operational leverage, and lower costs through productivity gains and the elimination of redundancy inherent in the previous structure. See the Reorganization section below.
Strategy
The Corporation’s goal is to be Canada’s leading industrial products and services provider, distinguished through: sales force excellence, breadth and efficiency of repair and maintenance operations and an ability to work closely with existing and new vendor partners to constantly expand its product offering to customers.
As one of Canada’s most diversified industrial distributors, the strategy builds upon the Corporation’s dedicated team, national branch network, diverse end market expertise, world-class vendor base and strong customer relationships. These existing strengths will be leveraged through the following “4 Points of Growth”:
(1) Development of Core Capabilities including Sales Force Excellence, Repair and Maintenance Operations and Product, Service and Vendor Development;
(2) Clear organic growth priorities;
(3) Building the Corporation’s capacity to complete and integrate Engineered Repair Services (“ERS”) acquisitions; and
(4) Investment in systems that will improve operational efficiencies and customer service.
As part of its long-term strategy, the Corporation established a target leverage ratio range of 1.5 – 2.0 times.
The Corporation has made progress moving forward on its strategy in 2016 and will continue to execute the initiatives that advance each of the components of the 4 Points of Growth Strategy as follows:
Core Capabilities: Core capabilities are the key organizational skills that create value for Wajax customers, vendors, investors and team members. Training, development and measurement systems are focused on three areas:
1. Sales Force Excellence: Wajax’s sales team of approximately 600 team members is composed of inside and outside sales personnel. The team’s focus is on achieving excellence in customer service, selling skills and technical expertise across the broadest range of industrial products and services in Canada. In 2016, Wajax:

WAJAX CORPORATION 2016 ANNUAL REPORT 19
MANAGEMENT’S DISCUSSION AND ANALYSIS
Continued the investment in the IMPACT™ sales training for sales representatives and sales management to ensure that the team has the required support in its structured sales process. The 6-step IMPACT™ process is designed to improve customer knowledge and sales team productivity and is embedded in the Corporation’s CRM (Customer Relationship Management system).
Completed the implementation of its CRM system to over 400 sales and management personnel, providing a consistent measurement, support and daily sales communications process across the company.
Reorganized and consolidated the sales force to maintain product technical expertise closest to the customer while standardizing the process for sales support and management. Key markets such as the oil sands and mining have specialized sales teams on-the-ground to work closely with major customers.
2. Repair and Maintenance Operations: A team of approximately 950 technicians, parts and service personnel operate 54 major repair and maintenance locations positioned to serve customers coast-to-coast. The Corporation’s objective is to achieve significant improvement, and ultimately leadership, in repair operations in terms of safety, customer service, breadth of repair services and profitability. In 2016, Wajax:
Achieved very strong improvements in safety results. Approximately 80% of all recordable injuries involve technicians and other trades personnel who work in high risk roles. Safety awareness, constant dialogue, ongoing improvements to support systems and enhanced training were significant contributors to a 39% reduction in recordable injuries and the Corporation’s safest year on record.
Reorganized and consolidated its service management team and implemented standard operating procedures, new service management training and a consistent operational system for all main service branches. Like the sales reorganization, the service management team is now under one leadership structure which has improved overall efficiency and provided a consistent focus on parts and service operations, shop profitability and customer service.
3. Product, Service and Vendor Development: Wajax works closely with world-class vendors to deliver a compelling range of products and services designed to meet the needs of customers across diverse markets in all regions of Canada. The ability to expand that range based on the needs of customers is an important factor in the growth of Wajax. In 2016, Wajax:
Continued to improve the vendor, product and service development process. The sales, business development, vendor and technical teams use customer feedback and market knowledge to determine the opportunities to expand the Corporation’s product and service range to increase its ability to grow with its customers.
Added important new products and/or services in areas such as energy storage, alternative fuel systems, turbines and marine products. Completed important internal research on the Canadian industrial services market in order to validate the Corporation’s target company acquisition pipeline and to review the opportunities to expand its acquisitions strategy.
Organic Growth: While market conditions, particularly in western Canada, made organic growth difficult in 2016, Wajax achieved wins in a number of important areas such as mining and protected its position in major categories such as construction, forestry, material handling, power generation and industrial components. 2016 highlights include:
Mining – The Equipment segment achieved a 71% increase in mining equipment, parts and service sales due to the delivery of four large Hitachi mining shovels and an improvement in parts and service volumes related to higher equipment utilization in the oil sands. In addition to the equipment category, multi-year mining supply contracts for industrial components remain an important focus to build sustained revenue. Mining is one of Wajax’s most important markets, contributing to the results of a broad range of product and service categories. Total sales to Wajax’s mining customers (including oil sands mining) were $254 million in 2016.
Material Handling – The Corporation signed multi-year equipment, parts and service contracts with major customers including the Department of National Defense. In addition, Wajax will support Canadian Tire Corporation’s project to use hydrogen fuel cell technology to replace lead acid batteries to power forklifts in two Ontario distribution centers. Canadian Tire conducted a comprehensive evaluation before selecting Hyster’s Nuvera hydrogen fuel cell technology which will be exclusively supported in Canada by Wajax. Total sales of the material handling category were $109 million in 2016.
Power Generation – Working closely with its partner MTU, Wajax provides gas and diesel standby, prime power and CHP (combined heat and power) systems for a broad range of applications including data centers, water treatment, mining, oil and gas and commercial and defense marine. Major projects in 2016 included work with Urbacon, a leading data center provider, to supply a turnkey 12.5 MW standby system for the initial stage of Urbacon’s Richmond Hill, Ontario site. Power Generation is an important area of organic growth due to growing demand from commercial, industrial, resource and marine markets. Total sales (including rental) of power generation were $73 million in 2016.
Engineered Repair Services (ERS) – The Corporation acquired and integrated the Wilson Machine Co. Ltd. (“Wilson Machine”) acquisition into its ERS group and continued to complete a range of engineering and repair and maintenance projects for customers with a primary focus on mining and oil sands customers. While market conditions in western Canada made organic growth challenging, management was pleased with the projects completed based on Wajax’s engineering capabilities, site teams and strong safety record. Total ERS sales were $58 million in 2016.
Acquisitions: The Corporation’s acquisition strategy is focused on building capacity to acquire and integrate regional engineered repair services companies into its overall ERS business. Typical target companies are $10 – $20 million in volume, have low capital requirements, excellent customer relationships and whose growth can be accelerated by Wajax’s sales force.
Following the acquisition of Wilson Machine in 2016, acquisition activities were slowed to focus efforts on the reorganization. The pipeline of possible ERS acquisitions remains robust and acquisitions are expected to continue to play an important role in the growth of the Corporation’s ERS business.
Systems: Technology plays an increasingly important role in Wajax’s business and systems development and implementation activity was significant in 2016. The focus was on the systems required to support the reorganization, the continued development of information systems for the sales force and the use of technology to improve the Corporation’s ability to increase access to, and the productivity of, training. In 2016, Wajax:

20 WAJAX CORPORATION 2016 ANNUAL REPORT
MANAGEMENT’S DISCUSSION AND ANALYSIS
Merged all main repair and service locations onto a single information systems platform and reduced the total number of ERP systems at Wajax to two (from four in 2015 and five in 2014). The ongoing consolidation of systems has both short-term and medium-term benefits. In the short-term, the reorganized teams have more consistency in the information systems used to manage the business day-to-day. In the medium-term, fewer base operating systems materially lowers the risk of the implementation of a new ERP which is planned to proceed with when conditions support investment in the project.
Reorganization
On March 1, 2016, Wajax announced that one of its main objectives for the year would be transitioning from its then present organizational structure of three independent product segments, to a leaner and more integrated functional organization. Sales and service functions will be supported by common support groups including supply chain, finance, human resources, information systems and environment, health and safety. During 2016, the Corporation implemented workforce reductions and role changes to align the organization to the new functional structure. The transition to the new structure was largely completed by the end of 2016 and external reporting under the new structure will commence in 2017.
Restructuring costs of $12.5 million, consisting principally of severance costs, were recorded in the first quarter of 2016. The net cost savings benefit of the reorganization was approximately $8.6 million for the year ended December 31, 2016 (approximately $3.6 million for the three months ended December 31, 2016), with estimated annualized cost savings of approximately $17 million expected to be realized beginning in 2017. The headcount reduction as at December 31, 2016 was 14.8% since the beginning of 2015. This reduction also reflects lower staffing levels related to reduced economic activity in western Canada, as well as the 2015 Power Systems segment restructuring.
Annual Consolidated Results
2016 2015
Revenue $ 1,221.9 $ 1,273.3
Gross profit $ 230.9 $ 253.9Selling and administrative expenses $ 195.2 $ 203.1Impairment of goodwill and intangible assets $ – $ 41.2Restructuring costs $ 12.5 $ 2.1Insurance recoveries $ (3.7) $ –
Earnings before finance costs and income taxes(1) $ 26.9 $ 7.5Finance costs $ 11.2 $ 12.2
Earnings (loss) before income taxes(1) $ 15.7 $ (4.7)Income tax expense $ 4.7 $ 6.3
Net earnings (loss) $ 11.0 $ (11.0)
Basic earnings (loss) per share(2) $ 0.55 $ (0.59)Diluted earnings (loss) per share(3) $ 0.54 $ (0.59)
Adjusted net earnings(1)(4) $ 20.1 $ 27.8
Adjusted basic earnings per share(1)(2)(4) $ 1.01 $ 1.50Adjusted diluted earnings per share(1)(3)(4) $ 1.00 $ 1.50
(1) These amounts do not have a standardized meaning prescribed by generally accepted accounting principles (“GAAP”). See the Non-GAAP and Additional GAAP Measures section.
(2) Weighted average shares outstanding for calculation of basic earnings (loss) per share 19,898,004 (2015 – 18,559,558)
(3) Weighted average shares outstanding for calculation of diluted earnings (loss) per share 20,203,771 (2015 – 18,559,558)
(4) Net earnings (loss) excluding after-tax restructuring costs of $9.1 million (2015 – $1.5 million) or $0.46 (2015 – $0.08) per share basic and impairment of goodwill and intangible assets of $37.3 million or $2.01 per share basic in 2015.
Revenue by Geographic Region
� Western Canada 40%� Central Canada 26%� Eastern Canada* 34%
* Includes Quebec and the Atlantic provinces.
2016
� Western Canada 44%� Central Canada 26%� Eastern Canada* 30%
2015
Revenue by Segment
� Equipment 49%� Power Systems 20%� Industrial Components 31%
2016
� Equipment 47%� Power Systems 22%� Industrial Components 31%
2015

WAJAX CORPORATION 2016 ANNUAL REPORT 21
MANAGEMENT’S DISCUSSION AND ANALYSIS
EBIT by Segment (1)
� Equipment 80%� Power Systems 0%� Industrial Components 20%
2016
� Equipment 62%� Power Systems 13%� Industrial Components 25%
2015
Overall, 2016 revenue decreased $51.4 million due primarily to ongoing weakness in most western Canada markets. In particular, Power Systems experienced declines in off-highway and power generation revenues, mainly attributable to continued weakness in oil and gas activity in western Canada. In the Equipment segment, lower sales to construction, material handling and forestry customers, as a result of lower demand and competitive market pressures, were offset by an increase in mining sector activity including the delivery of four large mining shovels to customers in the oil sands and eastern Canada mining markets. The Industrial Components segment’s western Canada operation was also negatively impacted by the decline in oil and gas and oil sands activity.
Revenue
Revenue in 2016 of $1,221.9 million decreased 4%, or $51.4 million, from $1,273.3 million in 2015. Equipment segment revenue decreased 1%, or $4.7 million, primarily due to lower volumes in the construction, material handling and forestry sectors in western Canada offset partially by higher volumes to oil sands and mining sector customers. Power Systems segment revenue decreased 12%, or $35.1 million, driven by a reduction in oil and gas related revenue in western Canada. Industrial Components segment revenue decreased 3%, or $10.9 million, as lower sales to oil and gas and oil sands customers in western Canada were offset partially by increased revenue resulting from the acquisition of Wilson Machine on April 20, 2016. See the Acquisition of Wilson Machine section.
Gross profit
The decrease in revenue and a lower gross profit margin percentage were the primary contributors to the $23.0 million, or 9%, decrease in gross profit in 2016 compared to last year. The gross profit margin percentage of 18.9% in 2016 decreased from 19.9% in 2015 mainly as a result of the negative impact of lower parts margins in the Power Systems and Industrial Components segments compared to last year and a $2.8 million gain on the monetization of six Hitachi mining trucks in the Equipment segment in the third quarter of 2015.
Selling and administrative expenses
Selling and administrative expenses decreased 4%, or $7.9 million, in 2016 compared to last year. The decrease in selling and administrative expenses was attributable to headcount reductions, resulting primarily from the Corporation’s 2016 strategic reorganization and reduced economic activity in western Canada, and lower sales related expenses. These decreases were partially offset by an increase in annual incentive accruals and a $1.0 million environmental remediation provision. Selling and administrative expenses as a percentage of revenue increased slightly to 16.0% in 2016 from 15.9% in 2015.
Impairment of goodwill and intangible assets
In 2015, the Corporation recorded an impairment of goodwill and intangible assets of $41.2 million ($37.3 million after-tax), comprised of $13.7 million related to the Power Systems segment and $27.5 million related to the Industrial Components segment. See the Critical Accounting Estimates section.
Restructuring costs
Restructuring costs of $12.5 million ($9.1 million after-tax), consisting principally of severance costs, were recorded in the first quarter of 2016 compared to restructuring costs of $2.1 million ($1.5 million after-tax), recorded in the second quarter of 2015 in the Power Systems segment.
The net cost savings benefit of the 2016 reorganization for the year ended December 31, 2016 was approximately $8.6 million, with an estimated $17 million of annualized cost savings expected to be realized beginning in 2017. See the Reorganization section.
Insurance recoveries
The Corporation recorded $3.7 million of expected compensation from insurers for business interruption losses, mainly related to the Fort McMurray wildfires, which occurred in early May 2016. Wajax’s branch facilities in the area of the wildfires incurred minimal damage and operations resumed in June 2016.
(1) Calculated based on segment earnings before impairment of goodwill and intangible assets and restructuring costs in 2015. See the Non-GAAP and Additional GAAP Measures section.
Revenue by Market
2016 2015
� Transportation 15%� Forestry 15%� Industrial/Commercial 15%� Construction 14%� Oil Sands 11%� Mining 9%� Metal Processing 6%� Government and Utilities 5%� Oil and Gas 2%� Other 8%
� Transportation 15%� Forestry 14%� Industrial/Commercial 14%� Construction 15%� Oil Sands 10%� Mining 9%� Metal Processing 6%� Government and Utilities 5%� Oil and Gas 5%� Other 7%

22 WAJAX CORPORATION 2016 ANNUAL REPORT
MANAGEMENT’S DISCUSSION AND ANALYSIS
Finance costs
Finance costs of $11.2 million decreased $1.0 million compared to 2015 due to lower funded net debt levels mainly as a result of the $71.4 million in proceeds from the issuance of share capital in the second quarter of 2015. See the Liquidity and Capital Resources section.
Income tax expense
The Corporation’s effective income tax rate was 30.0% (2015 – negative 134%) compared to the Corporation’s statutory income tax rate of 26.9% (2015 – 26.5%). The effective income tax rate of 30.0% in 2016 was higher compared to the statutory rate of 26.9% attributable to expenses not deductible for income tax purposes. The negative effective income tax rate in 2015 is due to expenses not deductible for income tax purposes, including $26.5 million relating to the impairment of goodwill and intangible assets. The statutory income tax rate of 26.9% increased compared to 2015, due to the full year impact of the increase in the July 1, 2015 Alberta provincial income tax rate.
Net earnings (loss)
In 2016, the Corporation generated net earnings of $11.0 million, or $0.55 per share, compared to a net loss of $11.0 million, or $0.59 per share, in 2015. The $22.0 million increase in net earnings resulted primarily from an impairment of goodwill and intangible assets of $37.3 million after-tax, or $2.01 per share, incurred in the fourth quarter of 2015, $3.7 million of insurance recoveries and reduced selling and administrative expenses and finance costs compared to last year. These increases were partially offset by lower volumes and gross profit margins and higher restructuring costs in 2016. The $1.14 per share increase in basic earnings per share reflects the increase in net earnings, as described above, combined with the impact of the equity offering completed in the second quarter of 2015, which reduced the basic earnings per share by $0.04, or 7%.
Adjusted net earnings (See the Non-GAAP and Additional GAAP Measures section)
Adjusted net earnings excludes restructuring costs of $9.1 million after-tax, or $0.46 per share (2015 – $1.5 million or $0.08 per share) and impairment of goodwill and intangible assets of $37.3 million after-tax, or $2.01 per share in 2015.
As such, adjusted net earnings decreased $7.7 million to $20.1 million, or $1.01 per share, in 2016 from $27.8 million, or $1.50 per share, in 2015. The $7.7 million decrease in adjusted net earnings resulted primarily from lower volumes and gross profit margins offset by $3.7 million of insurance recoveries and a reduction in selling and administrative expenses and finance costs compared to last year. The $0.49 per share decrease in adjusted basic earnings per share reflects the decrease in net earnings, as described above, combined with the impact of the equity offering completed in the second quarter of 2015, which reduced the basic earnings per share by $0.07, or 7%.
Comprehensive income
Total comprehensive income of $9.5 million in 2016 included net earnings of $11.0 million offset partially by an other comprehensive loss of $1.5 million. The other comprehensive loss resulted from after-tax actuarial losses on pension plans of $0.8 million and a $0.7 million change in the amount of losses on derivative instruments designated as cash flow hedges recorded in the year.
Funded net debt (See the Non-GAAP and Additional GAAP Measures section)
Funded net debt of $126.0 million at December 31, 2016 decreased $23.0 million compared to $149.0 million at December 31, 2015. The decrease during the year was mainly attributable to net cash generated from operating activities of $58.2 million, offset somewhat by dividends paid of $19.9 million, investing activities of $8.9 million, common shares purchased and held in trust of $3.2 million and a $2.2 million reduction in obligations under finance leases.
On September 6, 2016, the Corporation amended its bank credit facility, extending the maturity date from August 12, 2019 to August 12, 2020. In addition, the $30 million non-revolving term portion of the facility was repaid, using proceeds from a drawdown under the revolving term portion of the facility, and the $220 million revolving term portion of the facility was increased to $250 million. The $0.4 million cost of amending the facility has been capitalized and will be amortized over the remaining term of the facility. See the Liquidity and Capital Resources section.
Dividends
For the twelve months ended December 31, 2016, dividends declared totaled $1.00 per share. For the twelve months ended December 31, 2015 dividends declared totaled $1.23 per share.
Backlog (See the Non-GAAP and Additional GAAP Measures section)
Consolidated backlog at December 31, 2016 of $116.7 million decreased $52.5 million, or 31%, from $169.2 million at December 31, 2015. The decline was primarily attributable to decreases in the Equipment segment, driven by lower mining orders and the delivery of large mining shovels to customers in 2016 and lower crane and utility orders in central Canada. See the Annual Results of Operations section for further backlog detail by segment.
Acquisition of Wilson Machine
Effective April 20, 2016, the Corporation acquired the assets of Wilson Machine for $5.6 million. Wilson Machine is a North American leader in the manufacturing and repair of precision rotating machinery and gearboxes with annual sales of approximately $6 million and its major customers in eastern Canada align well with Wajax’s existing customer base. Wilson Machine’s service offerings are an ideal fit for Wajax’s 4 Points of Growth strategy and management believes it can leverage the Corporation’s sales force and larger geographic footprint to significantly grow the business.
Board Chair
On March 7, 2017, the Corporation announced that Paul Gagné, a director since 1996 and Chairman of the Board since 2006, will retire from the Board of Directors at the close of the Corporation’s 2017 annual meeting of shareholders. Rob Dexter has been nominated by his fellow directors to assume the duties of Chairman following the 2017 annual meeting. Rob has been a director since 1988 and has most recently served as Chair of the Human Resources and Compensation Committee of the board.
Senior Vice President, Finance and Chief Financial Officer
Effective March 8, 2017, Darren Yaworsky will assume the role of Senior Vice President, Finance and Chief Financial Officer. Mr. Yaworsky is an experienced finance executive with an extensive background in corporate finance, treasury and risk management. Most recently, he served as Vice President, Finance and Treasurer at Canadian Pacific Railway and, prior to that, held several senior financial executive roles within the Enbridge Group of Companies, including Treasurer of Enbridge Energy Partners LP and Treasurer of Enbridge Income Fund.

WAJAX CORPORATION 2016 ANNUAL REPORT 23
MANAGEMENT’S DISCUSSION AND ANALYSIS
Mr. Yaworsky succeeds John Hamilton, who joined Wajax as Senior Vice President, Finance and Chief Financial Officer in 1999. Mr. Hamilton’s planned retirement from Wajax in March 2017 was announced in August 2016.
Senior Vice President, Human Resources / Information Systems
In January 2017, the role of Stuart Auld, Senior Vice President, Information Systems was expanded to include leading the Corporation’s Human Resources team upon the departure of Kathleen Hassay, Senior Vice President, Human Resources, who left the organization in early 2017. Mr. Auld joined Wajax in 2014 and since that time has been instrumental in coordinating a number of change activities at Wajax.
Annual Results of Operations
Equipment
For the year ended December 31 2016 2015
Equipment(1) $ 369.6 $ 368.9Parts and service $ 227.6 $ 233.0
Segment revenue $ 597.2 $ 601.9
Segment earnings(2) $ 42.4 $ 38.4Segment earnings margin(2) 7.1% 6.4%
(1) Includes rental and other revenue.(2) Earnings before finance costs and income taxes.
Revenue by Product Type 2016 versus 2015
Market 2016 2015
n Construction 28% 34%n Mining/Oil Sands 25% 14%n Forestry 22% 24%n Material Handling 18% 21%n Crane and Utility 7% 7%
Revenue decreased 1%, or $4.7 million, to $597.2 million, from $601.9 million in 2015. Segment earnings increased 10%, or $4.0 million, to $42.4 million in 2016 compared to $38.4 million in 2015. The following factors contributed to the Equipment segment’s 2016 results compared to 2015:
Equipment revenue increased $0.7 million with specific year-over-year variances as follows:
Construction equipment revenue decreased $27.1 million, mainly as a result of decreases in Hitachi excavator and JCB equipment sales in western and central Canada due to lower market demand and competitive market pressures. These decreases were offset partially by increased Hitachi excavator and Bell articulated dump truck sales in eastern Canada.
Forestry equipment revenue decreased $10.9 million due to lower Hitachi equipment sales in western Canada, caused by lower market demand, offset partially by higher Tigercat equipment sales in central Canada.
Mining equipment sales increased $50.3 million as a result of four higher dollar value Hitachi mining shovel deliveries to customers in the oil sands and the eastern Canada mining market.
Crane and utility equipment revenue increased $0.3 million.
Material handling equipment revenue decreased $11.9 million, due primarily to the sale of higher dollar value units in western Canada in 2015 not repeated in 2016 and lower market demand.
Parts and service revenue decreased $5.4 million compared to last year. The decrease was mostly confined to the western Canada market where lower construction and material handling sales were offset by increases in mining volumes.
Segment earnings increased $4.0 million compared to last year as a $4.0 million reduction in selling and administrative expenses combined with $1.8 million of insurance recoveries, related to the Fort McMurray wildfires, more than offset the negative impact of lower volumes and gross profit margins. Lower gross profit margins resulted primarily from a $2.8 million gain on the monetization of six Hitachi mining trucks, in the third quarter of 2015, offset by higher equipment margins. The $4.0 million decrease in selling and administrative expenses, compared to last year, was mainly attributable to headcount reductions and lower sales related expenses, offset partially by higher annual incentive accruals. See the Insurance Recoveries section.
Backlog of $46.9 million at December 31, 2016 decreased $56.7 million compared to December 31, 2015, driven by lower mining orders in western Canada, due to the delivery of two large mining shovels to customers in the oil sands in 2016, and lower crane and utility orders.
Power Systems
For the year ended December 31 2016 2015
Equipment(1) $ 79.5 $ 92.1Parts and service $ 170.5 $ 193.0
Segment revenue $ 250.0 $ 285.1
Segment earnings before impairment of goodwill and intangible assets and restructuring costs(2) 0.1 7.8Impairment of goodwill and intangible assets – (13.7)Restructuring costs – (2.1)
Segment earnings (loss)(3) $ 0.1 $ (8.0)
Segment earnings margin before impairment of goodwill and intangible assets and restructuring costs(2) – 2.7%Impairment of goodwill and intangible assets – (4.8%)Restructuring costs – (0.7%)
Segment earnings (loss) margin(3) – (2.8%)
(1) Includes rental and other revenue.(2) Earnings before impairment of goodwill and intangible assets, restructuring costs,
finance costs and income taxes. See the Non-GAAP and Additional GAAP Measures section.
(3) Earnings (loss) before finance costs and income taxes.
Revenue by Market 2016 versus 2015
Market 2016 2015
n On-highway Transportation 48% 39%
n Industrial/Commercial 19% 15%n Oil Sands 9% 9%n Construction 8% 6%n Mining 6% 7%n Oil and Gas 2% 10%n Other 8% 14%
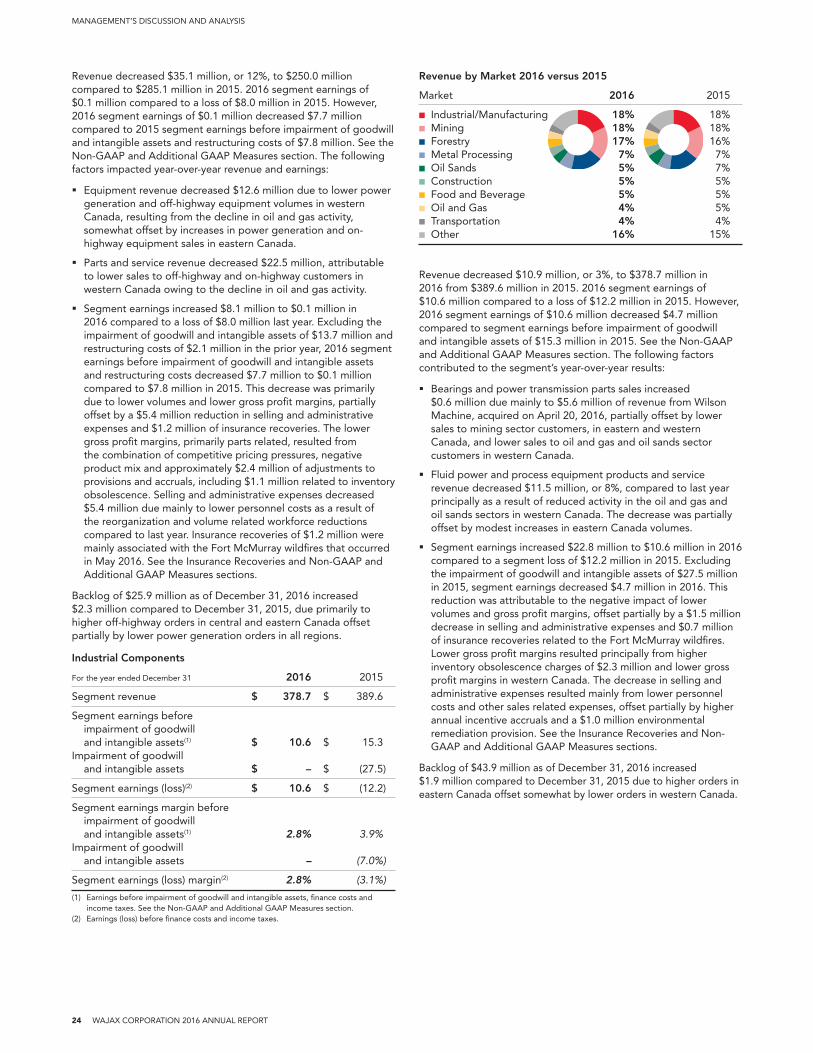
24 WAJAX CORPORATION 2016 ANNUAL REPORT
MANAGEMENT’S DISCUSSION AND ANALYSIS
Revenue decreased $35.1 million, or 12%, to $250.0 million compared to $285.1 million in 2015. 2016 segment earnings of $0.1 million compared to a loss of $8.0 million in 2015. However, 2016 segment earnings of $0.1 million decreased $7.7 million compared to 2015 segment earnings before impairment of goodwill and intangible assets and restructuring costs of $7.8 million. See the Non-GAAP and Additional GAAP Measures section. The following factors impacted year-over-year revenue and earnings:
Equipment revenue decreased $12.6 million due to lower power generation and off-highway equipment volumes in western Canada, resulting from the decline in oil and gas activity, somewhat offset by increases in power generation and on-highway equipment sales in eastern Canada.
Parts and service revenue decreased $22.5 million, attributable to lower sales to off-highway and on-highway customers in western Canada owing to the decline in oil and gas activity.
Segment earnings increased $8.1 million to $0.1 million in 2016 compared to a loss of $8.0 million last year. Excluding the impairment of goodwill and intangible assets of $13.7 million and restructuring costs of $2.1 million in the prior year, 2016 segment earnings before impairment of goodwill and intangible assets and restructuring costs decreased $7.7 million to $0.1 million compared to $7.8 million in 2015. This decrease was primarily due to lower volumes and lower gross profit margins, partially offset by a $5.4 million reduction in selling and administrative expenses and $1.2 million of insurance recoveries. The lower gross profit margins, primarily parts related, resulted from the combination of competitive pricing pressures, negative product mix and approximately $2.4 million of adjustments to provisions and accruals, including $1.1 million related to inventory obsolescence. Selling and administrative expenses decreased $5.4 million due mainly to lower personnel costs as a result of the reorganization and volume related workforce reductions compared to last year. Insurance recoveries of $1.2 million were mainly associated with the Fort McMurray wildfires that occurred in May 2016. See the Insurance Recoveries and Non-GAAP and Additional GAAP Measures sections.
Backlog of $25.9 million as of December 31, 2016 increased $2.3 million compared to December 31, 2015, due primarily to higher off-highway orders in central and eastern Canada offset partially by lower power generation orders in all regions.
Industrial Components
For the year ended December 31 2016 2015
Segment revenue $ 378.7 $ 389.6
Segment earnings before impairment of goodwill and intangible assets(1) $ 10.6 $ 15.3Impairment of goodwill and intangible assets $ – $ (27.5)
Segment earnings (loss)(2) $ 10.6 $ (12.2)
Segment earnings margin before impairment of goodwill and intangible assets(1) 2.8% 3.9%Impairment of goodwill and intangible assets – (7.0%)
Segment earnings (loss) margin(2) 2.8% (3.1%)
(1) Earnings before impairment of goodwill and intangible assets, finance costs and income taxes. See the Non-GAAP and Additional GAAP Measures section.
(2) Earnings (loss) before finance costs and income taxes.
Revenue by Market 2016 versus 2015
Market 2016 2015
n Industrial/Manufacturing 18% 18%n Mining 18% 18%n Forestry 17% 16%n Metal Processing 7% 7%n Oil Sands 5% 7%n Construction 5% 5%n Food and Beverage 5% 5%n Oil and Gas 4% 5%n Transportation 4% 4%n Other 16% 15%
Revenue decreased $10.9 million, or 3%, to $378.7 million in 2016 from $389.6 million in 2015. 2016 segment earnings of $10.6 million compared to a loss of $12.2 million in 2015. However, 2016 segment earnings of $10.6 million decreased $4.7 million compared to segment earnings before impairment of goodwill and intangible assets of $15.3 million in 2015. See the Non-GAAP and Additional GAAP Measures section. The following factors contributed to the segment’s year-over-year results:
Bearings and power transmission parts sales increased $0.6 million due mainly to $5.6 million of revenue from Wilson Machine, acquired on April 20, 2016, partially offset by lower sales to mining sector customers, in eastern and western Canada, and lower sales to oil and gas and oil sands sector customers in western Canada.
Fluid power and process equipment products and service revenue decreased $11.5 million, or 8%, compared to last year principally as a result of reduced activity in the oil and gas and oil sands sectors in western Canada. The decrease was partially offset by modest increases in eastern Canada volumes.
Segment earnings increased $22.8 million to $10.6 million in 2016 compared to a segment loss of $12.2 million in 2015. Excluding the impairment of goodwill and intangible assets of $27.5 million in 2015, segment earnings decreased $4.7 million in 2016. This reduction was attributable to the negative impact of lower volumes and gross profit margins, offset partially by a $1.5 million decrease in selling and administrative expenses and $0.7 million of insurance recoveries related to the Fort McMurray wildfires. Lower gross profit margins resulted principally from higher inventory obsolescence charges of $2.3 million and lower gross profit margins in western Canada. The decrease in selling and administrative expenses resulted mainly from lower personnel costs and other sales related expenses, offset partially by higher annual incentive accruals and a $1.0 million environmental remediation provision. See the Insurance Recoveries and Non-GAAP and Additional GAAP Measures sections.
Backlog of $43.9 million as of December 31, 2016 increased $1.9 million compared to December 31, 2015 due to higher orders in eastern Canada offset somewhat by lower orders in western Canada.

WAJAX CORPORATION 2016 ANNUAL REPORT 25
MANAGEMENT’S DISCUSSION AND ANALYSIS
Selected Annual Information
The following selected annual information is audited and has been prepared on the same basis as the 2016 annual audited Consolidated Financial Statements.
2016 2015 2014
Revenue $ 1,221.9 $ 1,273.3 $ 1,451.3
Net earnings (loss) $ 11.0 $ (11.0) $ 41.2Basic earnings (loss) per share $ 0.55 $ (0.59) $ 2.46Diluted earnings (loss) per share $ 0.54 $ (0.59) $ 2.42
Total assets $ 664.9 $ 677.5 $ 723.6Non-current liabilities $ 138.6 $ 169.5 $ 202.0
Dividends declared per share $ 1.00 $ 1.23 $ 2.40
Revenue in 2016 of $1,221.9 million decreased $51.4 million compared to 2015. The decrease is attributable to ongoing weakness in most western Canada markets, resulting in lower revenues in the Power Systems and Industrial Components segments. In the Equipment segment, lower sales to construction, material handling and forestry customers due to lower demand and competitive market pressures, were offset by an increase in mining sector activity including the delivery of four large mining shovels into the oil sands and eastern Canada mining markets. Revenue in 2015 of $1,273.3 million decreased $178.0 million compared
to 2014 due to a slowdown in western Canada, resulting in lower equipment and parts and service revenue in the Equipment and Power Systems segments and decreased revenue in the Industrial Components segment.
The net earnings of $11.0 million decreased $30.2 million, or $1.91 per share, from 2014 to 2016. Excluding the after-tax restructuring costs of $9.1 million ($0.46 per share) in 2016 and $2.1 million ($0.12 per share) in 2014, net earnings declined $23.2 million, or $1.57 per share, due principally to lower volumes and gross profit margins offset partially by reduced selling and administrative expenses. Decreased selling and administrative expenses of $21.7 million were primarily driven by lower personnel costs, as a result of headcount reductions of 14.8% since the beginning of 2015, and lower sales related expenses. See the Non-GAAP and Additional GAAP Measures and Liquidity and Capital Resources sections.
The $58.7 million decrease in total assets between December 31, 2014 and December 31, 2016 was mainly attributable to the $41.2 million impairment of goodwill and intangible assets writedown in 2015 and lower inventory in all segments, offset partially by higher trade receivables in the Equipment segment.
Non-current liabilities at December 31, 2016 of $138.6 million decreased $63.4 million from December 31, 2014 primarily attributable to a $59.0 million decrease in long-term debt. The decrease in long-term debt resulted mainly from $71.4 million in proceeds from the issuance of share capital in the second quarter of 2015.
Selected Quarterly Information
The following table summarizes unaudited quarterly consolidated financial data for the eight most recently completed quarters. This quarterly information is unaudited but has been prepared on the same basis as the 2016 annual audited Consolidated Financial Statements.
2016 2015 Q4 Q3 Q2 Q1 Q4 Q3 Q2 Q1
Revenue $ 313.7 $ 286.6 $ 336.6 $ 285.0 $ 324.4 $ 290.9 $ 340.7 $ 317.2
Net earnings (loss) $ 8.9 $ 7.6 $ 4.3 $ (9.7) $ (33.3) $ 7.5 $ 9.0 $ 5.7Net earnings (loss) per share Basic $ 0.45 $ 0.38 $ 0.22 $ (0.49) $ (1.66) $ 0.38 $ 0.52 $ 0.34 Diluted $ 0.44 $ 0.37 $ 0.21 $ (0.49) $ (1.66) $ 0.37 $ 0.51 $ 0.34
Although quarterly fluctuations in revenue and net earnings are difficult to predict, Wajax has experienced weaker first quarter results in 2016 and 2015 due to various factors including reduced activity in the oil and gas and mining markets. As well, large deliveries of mining trucks and shovels and power generation packages can shift the revenue and net earnings throughout the year.
The first quarter 2016 net loss of $9.7 million included after-tax restructuring costs of $9.1 million. Excluding the restructuring costs, first quarter 2016 adjusted net loss was $0.6 million. See the Non-GAAP and Additional GAAP Measures section.
The fourth quarter 2015 net loss of $33.3 million included after-tax impairment of goodwill and intangible assets of $37.3 million. Excluding the impairment of goodwill and intangible assets, fourth quarter 2015 adjusted net earnings was $4.0 million. See the Non-GAAP and Additional GAAP Measures section.
A discussion of Wajax’s previous quarterly results can be found in Wajax’s quarterly MD&A available on SEDAR at www.sedar.com.
Consolidated Financial Condition
Capital Structure and Key Financial Condition Measures
December 31 2016 2015
Shareholders’ equity $ 276.8 $ 288.5Funded net debt(1) 126.0 149.0
Total capital $ 402.8 $ 437.5
Funded net debt to total capital(1) 31.3% 34.1%Leverage ratio(1) 2.07 2.05
(1) See the Non-GAAP and Additional GAAP Measures section.
The Corporation’s objective is to maintain a leverage ratio between 1.5 times and 2.0 times. However, there may be instances where the Corporation is willing to maintain a leverage ratio outside this range to either support key growth initiatives or fluctuations in working capital levels during changes in economic cycles. See the Funded Net Debt section below.
26 WAJAX CORPORATION 2016 ANNUAL REPORT
MANAGEMENT’S DISCUSSION AND ANALYSIS
Shareholders’ Equity
The Corporation’s shareholders’ equity at December 31, 2016 of $276.8 million decreased $11.7 million from December 31, 2015, as earnings of $11.0 million were more than offset by $19.9 million of dividends declared and $3.2 million in shares purchased during the year through two employee benefit plan trusts funded by the Corporation (for future settlement of share-based compensation plan awards).
The Corporation’s share capital, included in shareholders’ equity on the balance sheet, consists of:
Issued and fully paid common shares as at December 31, 2016 Number Amount
Balance at the beginning of the year 19,986,241 $ 179.8Common shares issued to settle share-based compensation plans 40,578 0.7Common shares purchased for future settlement of share-based compensation plans (200,968) (1.8)
Balance at the end of the year 19,825,851 $ 178.8
At the date of this MD&A, the Corporation had 19,825,851 common shares issued and outstanding, net of shares held in trust.
At December 31, 2016, Wajax had four share-based compensation plans: the Wajax Share Ownership Plan (“SOP”), the Directors’ Deferred Share Unit Plan (“DDSUP”), the Mid-Term Incentive Plan for Senior Executives (“MTIP”) and the Deferred Share Unit Plan (“DSUP”).
SOP and DDSUP rights are granted to the participants and are settled in treasury issued common shares on a one-for-one basis. As of December 31, 2016, there were 345,458 (2015 – 325,144) SOP and DDSUP rights outstanding of which 339,504 (2015 – 319,553) were vested.
The MTIP and DSUP consist of annual grants that vest over three years and are subject to time and performance vesting criteria.
Rights granted under the MTIP and DSUP prior to 2016 are cash settled and a portion of the MTIP and the full amount of the DSUP grants are determined by the price of the Corporation’s shares.
Rights granted under the 2016 MTIP, comprised of restricted share units (“RSUs”) and performance share units (“PSUs”), and rights granted under the 2016 DSUP will be settled in market-purchased common shares of the Corporation on a one-for-one basis provided that the time and performance vesting criteria are met. As of December 31, 2016, there were 315,916 (2015 – nil) 2016 MTIP and DSUP rights outstanding, none of which were vested.
Compensation expense for the SOP, DDSUP and 2016 MTIP and DSUP is determined based upon the fair value of the rights at the date of grant and charged to earnings on a straight line basis over the vesting period, with an offsetting adjustment to contributed surplus. Compensation expense for the cash-settled DSUP and the cash settled share-based portion of the MTIP varies with the price of the Corporation’s shares and is recognized over the vesting period. Wajax recorded compensation expense of $2.7 million for the year (2015 – $1.0 million) in respect of these plans.
Funded Net Debt (See the Non-GAAP and Additional GAAP Measures section)
December 31 2016 2015
Cash $ (4.9) $ (13.6)Obligations under finance lease 8.9 11.0Long-term debt 122.0 151.6
Funded net debt(1) $ 126.0 $ 149.0
(1) See the Non-GAAP and Additional GAAP Measures section.
Funded net debt of $126.0 million at December 31, 2016 decreased $23.0 million compared to December 31, 2015. The decrease during the year was due mainly to $58.2 million of cash generated from operating activities being greater than: dividends paid of $19.9 million, investing activities of $8.9 million, common shares purchased and held in trust of $3.2 million and a $2.2 million reduction in obligations under finance leases. Investing activities included the $5.6 million acquisition of Wilson Machine. See the Wilson Machine Acquisition section.
The Corporation’s ratio of funded net debt to total capital decreased to 31.3% at December 31, 2016 from 34.1% at December 31, 2015 primarily due to the lower funded net debt level at December 31, 2016.
The Corporation’s leverage ratio of 2.07 times at December 31, 2016 increased slightly from the December 31, 2015 ratio of 2.05 times.
See the Liquidity and Capital Resources section.
Financial Instruments
Wajax uses derivative financial instruments in the management of its foreign currency and interest rate exposures. Wajax’s policy restricts the use of derivative financial instruments for trading or speculative purposes.
Wajax enters into short-term currency forward contracts to hedge the exchange risk associated with the cost of certain inbound inventory and foreign currency-denominated sales to customers along with the associated receivables as part of its normal course of business. As at December 31, 2016, Wajax had the following contracts outstanding:
to buy U.S. $55.1 million (December 31, 2015 – $31.8 million), and
to sell U.S. $10.8 million (December 31, 2015 – $2.0 million).
The U.S. dollar contracts expire between January 2017 and March 2018, with a weighted average U.S./Canadian dollar rate of 1.3270.
Wajax measures derivative instruments not accounted for as hedging items at fair value with subsequent changes in fair value being recorded in earnings. Derivatives designated as effective hedges are measured at fair value with subsequent changes in fair value being recorded in other comprehensive income until the related hedged item is recorded and affects income or inventory. The fair value of derivative instruments is estimated based upon market conditions using appropriate valuation models. The carrying values reported in the balance sheet for financial instruments are not significantly different from their fair values.
A change in foreign currency, relative to the Canadian dollar, on transactions with customers that include unhedged foreign currency exposures is not expected to have a material impact on the Corporation’s results of operations or financial condition over the longer term.

WAJAX CORPORATION 2016 ANNUAL REPORT 27
MANAGEMENT’S DISCUSSION AND ANALYSIS
Wajax will periodically institute price increases to offset the negative impact of foreign exchange rate increases and volatility on imported goods to ensure margins are not eroded. However, a sudden strengthening of the U.S. dollar relative to the Canadian dollar can have a negative impact mainly on parts margins in the short term prior to price increases taking effect.
Wajax is exposed to the risk of non-performance by counterparties to short-term currency forward contracts. These counterparties are large financial institutions that maintain high short-term and long-term credit ratings. To date, no such counterparty has failed to meet its financial obligations to Wajax. Management does not believe there is a significant risk of non-performance by these counterparties and will continue to monitor the credit risk of these counterparties.
Contractual Obligations
Contractual 1 – 5 AfterObligations Total < 1 year years 5 years
Senior notes(1) $ 125.0 $ – $ 125.0 $ –Operating leases $ 90.0 $ 18.5 $ 47.5 $ 24.0Obligations under finance leases(1) $ 8.9 $ 3.7 $ 5.2 $ –
Total $ 223.9 $ 22.2 $ 177.7 $ 24.0
(1) Amounts exclude finance costs.
The senior notes obligation relates to the Corporation’s issuance on October 23, 2013 of $125.0 million in senior notes bearing an annual interest rate of 6.125% per annum, payable semi-annually, maturing on October 23, 2020.
The operating leases relate primarily to contracts entered into for facilities, a portion of the long-term lift truck rental fleet in the Equipment segment and office equipment. See the Off Balance Sheet Financing section for additional information.
The obligations under finance leases relate to certain leased vehicles that have a minimum one year term and are extended on a monthly basis thereafter until termination.
The above table does not include obligations to fund pension benefits. Wajax sponsors certain defined benefit plans that cover executive employees, a small group of inactive employees and certain employees on long-term disability benefits. The defined benefit plans are subject to actuarial valuations in 2018. Management does not expect future cash contribution requirements to change materially from the 2016 contribution level of $0.9 million as a result of these valuations or any declines in the fair value of the defined benefit plans’ assets.
Related Party Transactions
The Corporation’s related party transactions, consisting of the compensation of the Board of Directors and key management personnel, totaled $6.6 million in 2016 (2015 – $4.5 million).
Off Balance Sheet Financing
Off balance sheet financing arrangements include operating lease contracts for facilities with various landlords, a portion of the long-term lift truck rental fleet in the Equipment segment and other equipment related mainly to office equipment. The total obligations for all operating leases are detailed in the Contractual Obligations section. At December 31, 2016, the non-discounted operating lease commitments for facilities totaled $88.9 million, for rental fleet totaled $1.0 million and for other equipment $0.1 million.
Although Wajax’s consolidated contractual annual lease commitments decline year-by-year, it is anticipated that existing leases will either be renewed or replaced, resulting in lease commitments being sustained at current levels. In the alternative, Wajax may incur capital expenditures to acquire equivalent capacity.
The Equipment segment had $44.4 million (2015 – $55.8 million) of consigned inventory on hand from a major manufacturer at December 31, 2016, net of deposits of $19.1 million (2015 – $21.1 million). In the normal course of business, Wajax receives inventory on consignment from this manufacturer which is generally rented or sold to customers or purchased by Wajax. Under the terms of the consignment program, Wajax is required to make periodic deposits to the manufacturer on the consigned inventory that is rented to Wajax customers or on hand for greater than nine months. This consigned inventory is not included in Wajax’s inventory as the manufacturer retains title to the goods. In the event the inventory consignment program was terminated, Wajax would utilize interest free financing, if any, made available by the manufacturer and/or utilize capacity under its credit facilities.
Although management currently believes Wajax has adequate debt capacity, Wajax would have to access the equity or debt markets, or reduce dividends to accommodate any shortfalls in Wajax’s credit facilities. See the Liquidity and Capital Resources section.
Liquidity and Capital Resources
The Corporation’s liquidity is maintained through various sources, including bank and non-bank credit facilities, senior notes and cash generated from operations.
Bank and Non-bank Credit Facilities and Senior Notes
On September 6, 2016, the Corporation amended its committed bank credit facility, extending the maturity date from August 12, 2019 to August 12, 2020. In addition, the $30 million non-revolving term portion of the facility was repaid, using proceeds from a drawdown under the revolving term portion of the facility, and the $220 million revolving term portion of the facility was increased to $250 million. The $0.4 million cost of amending the facility has been capitalized and will be amortized over the remaining term of the facility.
The terms of the $250 million revolving bank credit facility include the following:
The facility is fully secured and expires August 12, 2020.
Borrowing capacity is dependent upon the level of inventories on hand and the outstanding trade accounts receivable.
The bank credit facility contains customary restrictive covenants including limitations on the payment of cash dividends and the maintenance of certain financial ratios all of which were met as at December 31, 2016. In particular, the Corporation is restricted from declaring dividends in the event the Corporation’s leverage ratio, as defined in the bank credit facility agreement, exceeds 3.25 times.
Borrowings under the bank credit facility bear floating rates of interest at margins over Canadian dollar bankers’ acceptance yields, U.S. dollar LIBOR rates or prime. Margins on the facility depend on the Corporation’s leverage ratio at the time of borrowing and range between 1.5% and 3.0% for Canadian dollar bankers’ acceptances and U.S. dollar LIBOR borrowings, and 0.5% and 2.0% for prime rate borrowings.

28 WAJAX CORPORATION 2016 ANNUAL REPORT
MANAGEMENT’S DISCUSSION AND ANALYSIS
At December 31, 2016, Wajax had issued $6.4 million of letters of credit for a total utilization of $6.4 million of its $250 million bank credit facility. At December 31, 2016, borrowing capacity under the bank credit facility was equal to $250 million.
In addition, Wajax had $125 million of senior notes outstanding at December 31, 2016 bearing an interest rate of 6.125% per annum, payable semi-annually, maturing on October 23, 2020. The senior notes are unsecured and contain customary incurrence based covenants that, although different from those under the bank credit facility described above, are not expected to be any more restrictive than under the bank credit facility. All covenants were met as at December 31, 2016.
Under the terms of the bank credit facility, Wajax is permitted to have additional interest bearing debt of $15 million. As such, Wajax has up to $15 million of demand inventory equipment financing capacity with two non-bank lenders. At December 31, 2016, Wajax had no utilization of the interest bearing equipment financing facilities.
As of March 7, 2017, Wajax’s $250 million bank credit facility, of which $243.6 million was unutilized at the end of 2016, along with the additional $15 million of capacity permitted under the bank credit facility, should be sufficient to meet Wajax’s short-term normal course working capital and maintenance capital requirements and certain strategic investments. However, Wajax may be required to access the equity or debt markets to fund significant acquisitions.
In addition, the Corporation’s tolerance to interest rate risk decreases/increases as the Corporation’s leverage ratio increases/decreases. At December 31, 2016, $125 million of the Corporation’s funded net debt, or 99%, was at a fixed interest rate which is within the Corporation’s interest rate risk policy.
Cash Flow
The following table highlights the major components of cash flow as reflected in the Consolidated Statements of Cash Flows for the years ended December 31, 2016 and December 31, 2015.
For the year ended December 31 2016 2015 Change
Net earnings (loss) $ 11.0 $ (11.0) $ 22.0Items not affecting cash flow 43.4 84.4 (41.0)Net change in non-cash operating working capital 30.9 (20.0) 50.9Finance costs paid (10.3) (11.4) 1.1Income taxes paid (2.4) (10.3) 7.9Rental equipment additions (13.5) (23.0) 9.5Other non-current liabilities (0.9) (0.8) (0.1)
Cash generated from operating activities $ 58.2 $ 7.9 $ 50.3
Cash used in investing activities $ (8.9) $ (4.3) $ (4.6)
Cash (used in) generated from financing activities $ (58.1) $ 17.7 $ (75.8)
Cash Generated From Operating Activities
The $50.3 million year over year increase in cash flows generated from operating activities was mainly attributable to an increase in cash generated from changes in non-cash operating working capital of $50.9 million, increased net earnings of $22.0 million, reduced rental equipment additions of $9.5 million and a decrease in income taxes paid of $7.9 million. These increases were offset partially by a decrease in items not affecting cash flow of $41.0 million. Both the increase in net earnings and decrease in items not affecting cash flow include the 2015 impairment of goodwill and intangible assets of $41.2 million ($37.3 million after-tax).
Rental equipment additions in 2016 of $13.5 million (2015 – $23.0 million) related primarily to lift trucks in the Equipment segment.
Significant components of non-cash operating working capital, along with changes for years ended December 31, 2016 and December 31, 2015 include the following:
Changes in Non-cash Operating Working Capital(1) 2016 2015
Trade and other receivables $ (26.5) $ 16.6Contracts in progress (2.3) 4.2Inventories 29.5 19.0Deposits on inventory 2.0 (12.5)Prepaid expenses 1.6 0.9Accounts payable and accrued liabilities 25.9 (47.6)Provisions 0.6 (0.5)
Total Changes in Non-cash Operating Working Capital $ 30.9 $ (20.0)
(1) Increase (decrease) in cash flow.
Significant components of the changes in non-cash operating working capital for the year ended December 31, 2016 compared to the year ended December 31, 2015 are as follows:
Trade and other receivables increased $26.5 million in 2016 compared to a decrease of $16.6 million in 2015. The increase in 2016 resulted primarily from an increase in the Equipment segment including higher oil sands sales activity in western Canada compared to last year. The decrease in 2015 resulted primarily from reductions in the Power Systems and Industrial Components segments due to lower sales activity in the fourth quarter compared to the previous year.
Inventories decreased $29.5 million in 2016 compared to $19.0 million in 2015. The decrease in 2016 was attributable to lower inventory levels in all segments. The decrease in 2015 was due mainly to lower mining equipment inventory in the Equipment segment offset partially by higher parts inventory in the Industrial Components and Power Systems segments.
Deposits on inventory decreased $2.0 million in 2016 compared to an increase of $12.5 million in 2015. The increase in 2015 resulted from an increase in deposits on aged consignment inventory in the Equipment segment. See the Off Balance Sheet Financing section.
Accounts payable and accrued liabilities increased $25.9 million in 2016 compared to a decrease of $47.6 million in 2015. The increase in 2016 resulted primarily from higher trade payables related to mining equipment inventory in the Equipment segment. The decrease in 2015 resulted from lower trade payables in all segments, due in part to the payment of equipment inventory in the Equipment segment and decreased purchasing activity in all segments.

WAJAX CORPORATION 2016 ANNUAL REPORT 29
MANAGEMENT’S DISCUSSION AND ANALYSIS
Investing Activities
For the year ended December 31, 2016, Wajax invested $3.1 million in property, plant and equipment additions, net of disposals, compared to $4.1 million for the year ended December 31, 2015. In addition, during the second quarter of 2016, Wajax acquired the assets of Wilson Machine for $5.6 million. See the Acquisition of Wilson Machine section.
Financing Activities
The Corporation used $58.1 million of cash from financing activities in 2016 compared to $17.7 million generated from financing activities in 2015. Financing activities during the year included bank credit facility repayments of $30.0 million (2015 – $30.0 million), dividends paid to shareholders totaling $19.9 million (2015 – $21.5 million), finance lease payments of $4.3 million (2015 – $3.9 million) and common shares purchased and held in trust funded by the Corporation totaling $3.2 million (2015 – nil). In 2015, the Corporation generated $71.4 million proceeds from the issuance of share capital.
Dividends
Dividends to shareholders for the periods January 1, 2016 to December 31, 2016 and January 1, 2015 to December 31, 2015 were declared and payable to shareholders of record as follows:
2016 2015Month(1) Per Share Amount Per Share Amount
January $ – $ – $ 0.20 $ 3.4February – – 0.20 3.4March 0.25 5.0 0.08 1.4June 0.25 5.0 0.25 5.0September 0.25 4.9 0.25 5.0December 0.25 5.0 0.25 5.0
Total dividends for the years ended December 31 $ 1.00 $ 19.9 $ 1.23 $ 23.1
(1) In the second quarter of 2015, the Corporation commenced paying dividends on a quarterly basis. Dividends are generally payable to shareholders of record on or about the 15th business day of the last month of each quarter and paid on or about the 4th day of the following quarter.
For the year ended December 31, 2016, Wajax declared dividends to shareholders totaling $1.00 per share. For the year ended December 31, 2015, Wajax declared dividends to shareholders totaling $1.23 per share. Dividends paid in 2016 were funded from cash generated from operating activities.
On March 7, 2017, the Corporation declared a dividend of $0.25 per share for the first quarter of 2017, payable on April 4, 2017 to shareholders of record on March 15, 2017.
Fourth Quarter Consolidated Results
For the three months ended December 31 2016 2015
Revenue $ 313.7 $ 324.4
Gross profit $ 62.8 $ 59.9Selling and administrative expenses $ 50.3 $ 51.5Impairment of goodwill and intangible assets $ – $ 41.2Insurance recoveries $ (2.6) $ –
Earnings (loss) before finance costs and income taxes(1) $ 15.2 $ (32.8)Finance costs $ 2.8 $ 2.8
Earnings (loss) before income taxes(1) $ 12.4 $ (35.6)Income tax expense (recovery) $ 3.5 $ (2.3)
Net earnings (loss) $ 8.9 $ (33.3)
Basic earnings (loss) per share $ 0.45 $ (1.66) Diluted earnings (loss) per share $ 0.44 $ (1.66)
Adjusted net earnings(1)(4) $ 8.9 $ 4.0
Adjusted basic earnings per share(1)(2)(4) $ 0.45 $ 0.20 Adjusted diluted earnings per share(1)(3)(4) $ 0.44 $ 0.20
(1) These amounts do not have a standardized meaning prescribed by generally accepted accounting principles (“GAAP”). See the Non-GAAP and Additional GAAP Measures section.
(2) Weighted average shares outstanding for calculation of basic earnings (loss) per share 19,805,485 (2015 – 19,983,800)
(3) Weighted average shares outstanding for calculation of diluted earnings (loss) per share 20,250,820 (2015 – 19,983,800)
(4) Net earnings (loss) excluding after-tax impairment of goodwill and intangible assets in 2015 of $37.3 million, or $1.87 per share.
Fourth quarter revenue decreased $10.7 million, due in part to weakness in several western and central Canada markets. In the Equipment segment, lower western Canada sales to construction, material handling and forestry customers, attributable to lower demand and competitive market pressures, were offset by an increase in oil sands sector activity, including the delivery of a large mining shovel. The Power Systems segment experienced declines in power generation revenues, due mainly to continued weakness in oil and gas activity in western Canada. In addition, the Equipment segment was impacted by lower construction volumes in central Canada.
Revenue
Revenue in the fourth quarter of 2016 decreased 3%, or $10.7 million, to $313.7 million, from $324.4 million in the fourth quarter of 2015. Segment revenue decreased 5% in the Equipment segment on lower volumes in western Canada, 2% in the Power Systems segment due mainly to lower power generation revenues in western Canada and 2% in the Industrial Components segment driven by lower mining sector volumes in all regions.
Gross profit
Gross profit in the fourth quarter of 2016 increased $2.9 million or 5%, as an increase in the gross profit margin percentage offset the impact of lower volumes compared to the prior year. The gross profit margin percentage for the quarter of 20.0% increased from 18.5% in the fourth quarter of 2015 primarily due to higher parts and service margins in the Power Systems segment and higher equipment margins in the Equipment segment compared to last year.

30 WAJAX CORPORATION 2016 ANNUAL REPORT
MANAGEMENT’S DISCUSSION AND ANALYSIS
Selling and administrative expenses
Selling and administrative expenses decreased $1.2 million in the fourth quarter of 2016 compared to the same quarter last year as the benefit of headcount reductions resulting from the Corporation’s 2016 corporate reorganization and lower sales related expenses, were offset partially by higher annual employee incentives of $2.2 million and a $1.0 million environmental remediation provision. Selling and administrative expenses as a percentage of revenue increased slightly to 16.0% in the fourth quarter of 2016 from 15.9% in the same quarter of 2015. See the Reorganization section.
Insurance recoveries
The Corporation recorded $2.6 million of additional compensation expected from insurers for business interruption losses, mainly related to the Fort McMurray wildfires which occurred in early May 2016.
Finance costs
Quarterly finance costs of $2.8 million remained unchanged from the same period last year.
Income tax expense
The Corporation’s effective income tax rate of 28.2% for the fourth quarter of 2016 was higher compared to the statutory rate of 26.9% due to the impact of expenses not deductible for tax purposes. The Corporation’s effective income tax recovery rate of 6.5% for the fourth quarter of 2015 was lower compared to the statutory rate of 26.5% due to the impact of expenses not deductible for tax purposes including $26.5 million relating to the impairment of goodwill and intangible assets.
Net earnings (loss)
In the fourth quarter of 2016, the Corporation generated net earnings of $8.9 million, or $0.45 per share, compared to a net loss of $33.3 million, or $1.66 per share, in the fourth quarter of 2015. The $42.2 million increase in net earnings resulted from an impairment of goodwill and intangible assets of $37.3 million after-tax, or $1.87 per share, incurred in the fourth quarter of 2015, an increase in gross profit, $2.6 million of insurance recoveries and a reduction in selling and administrative expenses compared to the prior year.
Adjusted net earnings (See the Non-GAAP and Additional GAAP Measures section)
Adjusted net earnings exclude an impairment of goodwill and intangible assets of $37.3 million after-tax, or $1.87 per share, in 2015.
As such, adjusted net earnings increased $4.9 million to $8.9 million, or $0.45 per share, in 2016 from $4.0 million, or $0.20 per share, in 2015. The $4.9 million increase in adjusted net earnings resulted primarily from an increase in gross profit, $2.6 million of insurance recoveries and a reduction in selling and administrative expenses.
Comprehensive income
Total comprehensive income of $8.2 million in the fourth quarter of 2016 was comprised of net earnings of $8.9 million and an other comprehensive loss of $0.7 million. The other comprehensive loss resulted mainly from after-tax actuarial losses on pension plans of $0.8 million recorded in the year.
Funded net debt (See the Non-GAAP and Additional GAAP Measures section)
Funded net debt of $126.0 million at December 31, 2016 decreased $21.9 million compared to September 30, 2016. The decrease during the quarter was due mainly to $28.2 million of cash generated from operating activities exceeding dividends paid of $4.9 million, investing activities of $0.8 million and a reduction of obligations under finance leases of $0.7 million. See the Fourth Quarter Cash Flows and Liquidity and Capital Resources sections.
Dividends
For the fourth quarter ended December 31, 2016 dividends declared totaled $0.25 per share (2015 – $0.25 per share).
Backlog (See the Non-GAAP and Additional GAAP Measures section)
Consolidated backlog at December 31, 2016 of $116.7 million decreased $25.4 million, or 18%, compared to September 30, 2016 due to decreases in the Equipment and Power Systems segments that were partially offset by an increase in the Industrial Components segment. See the Fourth Quarter Results of Operations section for further backlog detail by segment.
Fourth Quarter Results of Operations
Equipment
For the three months ended December 31 2016 2015
Equipment(1) $ 93.5 $ 100.7Parts and service $ 58.8 $ 59.4
Segment revenue $ 152.3 $ 160.1
Segment earnings(2) $ 11.7 $ 9.4Segment earnings margin(2) 7.7% 5.9%
(1) Includes rental and other revenue.(2) Earnings before finance costs and income taxes.
Revenue in the fourth quarter of 2016 decreased $7.8 million, or 5%, to $152.3 million, from $160.1 million in the fourth quarter of 2015. Segment earnings for the quarter increased $2.3 million, to $11.7 million, compared to the fourth quarter of 2015. The following factors contributed to the Equipment segment’s fourth quarter results compared to the fourth quarter of 2015:
Equipment revenue decreased $7.2 million, or 7%, with specific year-over-year variances as follows:
Construction equipment revenue decreased $8.8 million as a result of decreases in Bell articulated dump truck, Hitachi excavator and JCB equipment volumes in both western and central Canada due to lower market demand and competitive market pressures.
Forestry equipment revenue decreased $3.8 million due to lower sales of Hitachi equipment in western Canada, offset partially by higher Tigercat and Peterson equipment sales in central Canada.
Mining equipment sales increased $12.8 million due primarily to a large Hitachi mining shovel delivery in western Canada.
Crane and utility equipment revenue increased $1.8 million as a result of higher sales to utility customers in eastern Canada.
Material handling equipment revenue decreased $9.2 million mainly related to the sale of lower dollar value unit sales in all regions in 2016 compared to 2015 and lower market demand.
Parts and service revenue decreased $0.6 million, or 1%.

WAJAX CORPORATION 2016 ANNUAL REPORT 31
MANAGEMENT’S DISCUSSION AND ANALYSIS
Segment earnings for the fourth quarter increased $2.3 million to $11.7 million. The increase was primarily attributable to higher equipment gross profit margins and a $1.3 million reduction in selling and administrative expenses combined with $1.0 million of Fort McMurray wildfires related insurance recoveries, offset partially by lower volumes. Selling and administrative expenses decreased $1.3 million as the benefit of headcount reductions and lower sales related expenses, more than offset higher annual employee incentives.
Backlog of $46.9 million at December 31, 2016 decreased $21.5 million compared to September 30, 2016 due mainly to a decrease in mining equipment orders.
Power Systems
For the three months ended December 31 2016 2015
Equipment(1) $ 26.6 $ 24.8Parts and service $ 43.0 $ 46.0
Segment revenue $ 69.6 $ 70.8
Segment earnings before impairment of goodwill and intangible assets(2) $ 6.5 $ 0.1Impairment of goodwill and intangible assets – (13.7)
Segment earnings (loss)(3) $ 6.5 $ (13.6)
Segment earnings before impairment of goodwill and intangible assets margin(2) 9.3% 0.2%Impairment of goodwill and intangible assets – (19.4%)
Segment earnings (loss) margin(3) 9.3% (19.2%)
(1) Includes rental and other revenue.(2) Earnings before impairment of goodwill and intangible assets, finance costs and
income taxes. See the Non-GAAP and Additional GAAP Measures section.(3) Earnings (loss) before finance costs and income taxes.
Revenue in the fourth quarter of 2016 decreased $1.2 million, or 2%, to $69.6 million, compared to $70.8 million in the fourth quarter of 2015. The segment recorded earnings of $6.5 million in the fourth quarter of 2016 compared to a loss of $13.6 million in 2015. Excluding the impairment of goodwill and intangible assets costs of $13.7 million in the fourth quarter of 2015, segment earnings increased $6.4 million. The following factors impacted quarterly revenue and earnings compared to last year:
Equipment revenue increased $1.8 million, due principally to higher on-highway sales in eastern Canada and higher power generation sales in central and eastern Canada.
Parts and service revenue decreased $3.0 million compared to last year, mainly attributable to lower power generation sales in all regions.
Segment earnings increased $20.1 million to $6.5 million in 2016 compared to a segment loss of $13.6 million in the fourth quarter of 2015. Excluding the impairment of goodwill and intangible assets charge of $13.7 million in the fourth quarter of 2015, segment earnings increased $6.4 million due to higher gross profit margins, a $1.3 million decrease in selling and administrative expenses and $1.1 million of insurance recoveries, mainly related to the Fort McMurray wildfires. The increase in gross profit margins resulted primarily from parts pricing initiatives, favorable product mix, lower service department overheads and a reduction in inventory obsolescence expense. The decrease in selling and administrative expenses was driven mainly by workforce reductions.
Backlog of $25.9 million as of December 31, 2016 decreased $7.1 million compared to September 30, 2016 as lower power generation orders in central and eastern Canada were only partially offset by higher off-highway orders in central Canada.
Industrial Components
For the three months ended December 31 2016 2015
Segment revenue $ 92.8 $ 94.3
Segment earnings before impairment of goodwill and intangible assets(1) $ 1.3 $ 1.9Impairment of goodwill and intangible assets – (27.5)
Segment earnings (loss)(2) $ 1.3 $ (25.6)
Segment earnings margin before impairment of goodwill and intangible assets(1) 1.4% 2.0%Impairment of goodwill and intangible assets – (29.2%)
Segment earnings (loss) margin(2) 1.4% (27.2%)
(1) Earnings before impairment of goodwill and intangible assets, finance costs and income taxes. See the Non-GAAP and Additional GAAP Measures section.
(2) Earnings (loss) before finance costs and income taxes.
Revenue of $92.8 million in the fourth quarter of 2016 decreased $1.5 million, or 2%, from $94.3 million in the fourth quarter of 2015. The segment recorded earnings of $1.3 million in the fourth quarter of 2016 compared to a loss of $25.6 million in the fourth quarter of 2015. Excluding the impairment of goodwill and intangible assets of $27.5 million in the fourth quarter of 2015, segment earnings decreased $0.6 million in the fourth quarter of 2016. The following factors contributed to the segment’s fourth quarter year-over-year results:
Bearings and power transmission parts sales increased $0.8 million, or 1%, primarily due to increased sales to oil sands customers in western Canada and $1.1 million of revenues realized from the Wilson Machine acquisition, offset partially by weakness in the mining sector in eastern Canada.
Fluid power and process equipment products and service revenue in the fourth quarter of 2016 decreased $2.3 million, or 6%, driven by lower mining sector sales in all regions and lower sales to oil sands customers in western Canada.
Segment earnings increased $26.9 million to $1.3 million in the fourth quarter of 2016 compared to a segment loss of $25.6 million in the prior year. Excluding the impairment of goodwill and intangible assets charge of $27.5 million in the fourth quarter of 2015, segment earnings decreased $0.6 million in the fourth quarter of 2016 due to lower volumes and gross profit margins and increased selling and administrative expenses. These decreases were offset partially by $0.5 million of insurance recoveries related to the Fort McMurray wildfires. Lower gross profit margins resulted principally from higher inventory obsolescence expenses of $0.5 million. Selling and administrative expenses increased slightly as the benefit of headcount reductions and lower sales related expenses, were more than offset by higher annual employee incentives and a $1.0 million environmental remediation provision.
Backlog of $43.9 million as of December 31, 2016 increased $3.2 million compared to September 30, 2016 due primarily to higher orders in eastern Canada partially reduced by lower orders in western Canada. See the Non-GAAP and Additional GAAP Measures section.
32 WAJAX CORPORATION 2016 ANNUAL REPORT
MANAGEMENT’S DISCUSSION AND ANALYSIS
Fourth Quarter Cash Flows
Cash Flow
The following table highlights the major components of cash flow as reflected in the Consolidated Statements of Cash Flows for the quarters ended December 31, 2016 and December 31, 2015.
For the quarter
ended December 31 2016 2015 Change
Net earnings (loss) $ 8.9 $ (33.3) $ 42.2Items not affecting cash flow 13.4 48.6 (35.2)Net change in non-cash operating working capital 14.2 21.9 (7.7)Finance costs paid (4.5) (4.6) 0.1Income taxes paid – (1.9) 1.9Rental equipment additions (3.8) (4.5) 0.7Other non-current liabilities – (0.1) 0.1
Cash generated from operating activities $ 28.2 $ 26.1 $ 2.1
Cash used in investing activities $ (0.8) $ (1.2) $ 0.4
Cash used in financing activities $ (23.0) $ (9.8) $ (13.2)
Cash Generated From Operating Activities
The $2.1 million increase in cash flows generated from operating activities was mainly attributable to an increase in net earnings of $42.2 million offset partially by a decrease in items not affecting cash flow of $35.2 million and a decrease in cash generated from changes in non-cash operating working capital of $7.7 million. Both the increase in net earnings and decrease in items not affecting cash flow include the 2015 impairment of goodwill and intangible assets of $41.2 million ($37.3 million after-tax).
Significant components of non-cash operating working capital, along with changes for the quarters ended December 31, 2016 and December 31, 2015 include the following:
Changes in Non-cash Operating Working Capital(1) 2016 2015
Trade and other receivables $ (18.5) $ 9.6Contracts in progress (2.7) 4.6Inventories 8.8 4.3Deposits on inventory 2.5 (4.7)Prepaid expenses 1.1 (0.6)Accounts payable and accrued liabilities 21.5 8.4Provisions 1.5 0.2
Total Changes in Non-cash Operating Working Capital $ 14.2 $ 21.9
(1) Increase (decrease) in cash flow.
Significant components of the changes in non-cash operating working capital for the quarter ended December 31, 2016 compared to the quarter ended December 31, 2015 are as follows:
Trade and other receivables increased $18.5 million in 2016 compared to a decrease of $9.6 million in 2015. The increase in 2016 resulted primarily from an increase in the Equipment segment due to higher sales activity in the fourth quarter compared to the previous quarter. The decrease in 2015 resulted mainly from improved collections in the Power Systems segment compared to the previous quarter.
Inventories decreased $8.8 million in the current quarter compared to a decrease of $4.3 million in 2015. The decrease in 2016 was due to inventory reduction measures executed in all segments. The decrease in 2015 was primarily due to lower inventory in the Equipment segment.
Accounts payable and accrued liabilities increased $21.5 million in 2016 compared to an increase of $8.4 million in 2015. The increase in 2016 resulted primarily from higher trade payables related to mining equipment inventory in the Equipment segment and higher inventory trade payables in the Power Systems segment. The increase in 2015 resulted primarily from higher inventory trade payables in the Equipment segment.
Investing Activities
During the fourth quarter of 2016, Wajax invested $0.7 million in property, plant and equipment additions, net of disposals, compared to $1.1 million in the fourth quarter of 2015.
Financing Activities
The Corporation used $23.0 million of cash in financing activities in the fourth quarter of 2016 compared to $9.8 million of cash used in the same quarter of 2015. Financing activities in the quarter included bank credit facility repayments of $17.0 million (2015 – $4.0 million), dividends paid to shareholders totaling $4.9 million (2015 – $5.0 million) and finance lease payments of $1.0 million (2015 – $1.0 million). See the Liquidity and Capital Resources section.
Non-GAAP and Additional GAAP Measures
The MD&A contains certain non-GAAP and additional GAAP measures that do not have a standardized meaning prescribed by GAAP. Therefore, these financial measures may not be comparable to similar measures presented by other issuers. Investors are cautioned that these measures should not be construed as an alternative to net earnings or to cash flow from operating, investing, and financing activities determined in accordance with GAAP as indicators of the Corporation’s performance. The Corporation’s management believes that:
(i) these measures are commonly reported and widely used by investors and management,
(ii) the non-GAAP measures are commonly used as an indicator of a company’s cash operating performance, profitability and ability to raise and service debt,
(iii) the additional GAAP measures are commonly used to assess a company’s earnings performance excluding its capital, tax structures, impairment of goodwill and intangible assets and restructuring costs, and
(iv) “Adjusted net earnings”, “Adjusted basic earnings per share”, “Adjusted diluted earnings per share” and “segment earnings before impairment of goodwill and intangible assets and restructuring costs” provide indications of the results by the Corporation’s principal business activities prior to recognizing the impairment of goodwill and intangible assets and

WAJAX CORPORATION 2016 ANNUAL REPORT 33
MANAGEMENT’S DISCUSSION AND ANALYSIS
restructuring costs that are outside the Corporation’s normal course of business. “Adjusted EBITDA” used in calculating the Leverage Ratio excludes the impairment of goodwill and intangible assets and restructuring costs which is consistent with the leverage ratio calculations under the Corporation’s bank credit and senior note agreements. See the Annual Consolidated Results – Impairment of Goodwill and Intangible Assets and the Annual Consolidated Results – Restructuring Costs sections.
Non-GAAP financial measures are identified and defined below:
Funded net debt
Funded net debt includes bank indebtedness, long-term debt and obligations under finance leases, net of cash. Funded net debt is a component relevant in calculating the Corporation’s Funded Net Debt to Total Capital, which is a non-GAAP measure commonly used as an indicator of a company’s ability to raise and service debt.
Debt Debt is funded net debt plus letters of credit. Debt is a component relevant in calculating the Corporation’s Leverage Ratio, which is a non-GAAP measure commonly used as an indicator of a company’s ability to raise and service debt.
EBITDA Net earnings (loss) before finance costs, income tax expense, depreciation and amortization. EBITDA is a non-GAAP measure commonly used as an indicator of a company’s cash operating performance.
Adjusted net earnings
Net earnings (loss) before after tax impairment of goodwill and intangible assets and restructuring costs.
Adjusted basic and diluted earnings per share
Basic and diluted earnings per share before after tax impairment of goodwill and intangible assets and restructuring costs.
Adjusted EBITDA
EBITDA before impairment of goodwill and intangible assets and restructuring costs.
Leverage ratio The leverage ratio is defined as debt at the end of a particular quarter divided by trailing 12-month Adjusted EBITDA. The Corporation’s objective is to maintain this ratio between 1.5 times and 2.0 times.
Funded net debt to total capital
Defined as funded net debt divided by total capital. Total capital is the funded net debt plus shareholder’s equity.
Backlog Backlog includes the total sales value of customer purchase commitments for future delivery or commissioning of equipment, parts and related services.
Additional GAAP measures are identified and defined below:
Earnings (loss) before finance costs and income taxes (EBIT)
Earnings (loss) before finance costs and income taxes, as presented on the Consolidated Statements of Earnings.
Earnings (loss) before income taxes (EBT)
Earnings (loss) before income taxes, as presented on the Consolidated Statements of Earnings.
Segment earnings before impairment of goodwill and intangible assets and restructuring costs
Segment earnings before impairment of goodwill and intangible assets, restructuring costs, finance costs and income taxes.
Segment earnings margin before impairment of goodwill and intangible assets and restructuring costs
Segment earnings before impairment of goodwill and intangible assets, restructuring costs, finance costs and income taxes divided by segment revenue.
Reconciliation of the Corporation’s net earnings (loss) to adjusted net earnings and basic and diluted adjusted earnings per share is as follows:
Three months ended Twelve months ended December 31 December 31 2016 2015 2016 2015
Net earnings (loss) $ 8.9 $ (33.3) $ 11.0 $ (11.0)Impairment of goodwill and intangible assets, after tax – 37.3 – 37.3Restructuring costs, after-tax – – 9.1 1.5
Adjusted net earnings $ 8.9 $ 4.0 $ 20.1 $ 27.8
Adjusted basic earnings per share(1)(2) $ 0.45 $ 0.20 $ 1.01 $ 1.50Adjusted diluted earnings per share(1)(2) $ 0.44 $ 0.20 $ 1.00 $ 1.50
(1) At December 31, 2016 the numbers of basic and diluted weighted average shares outstanding were 19,805,485 and 20,250,820, respectively for the three months ended and 19,898,004 and 20,203,771, respectively for the twelve months ended.
(2) At December 31, 2015 the numbers of basic and diluted weighted average shares outstanding were 19,983,800 and 19,983,800, respectively for the three months ended and 18,559,558 and 18,559,558, respectively for the twelve months ended.

34 WAJAX CORPORATION 2016 ANNUAL REPORT
MANAGEMENT’S DISCUSSION AND ANALYSIS
Reconciliation of the Corporation’s net earnings to EBT, EBIT, EBITDA and Adjusted EBITDA is as follows:
Twelve months ended December 31 2016 2015
Net earnings (loss) $ 11.0 $ (11.0)Income tax expense 4.7 6.3
EBT 15.7 (4.7)Finance costs 11.2 12.2
EBIT 26.9 7.5Depreciation and amortization 24.5 24.5
EBITDA 51.5 32.0Impairment of goodwill and intangible assets – 41.2Restructuring costs(1) 12.5 2.1
Adjusted EBITDA $ 64.0 $ 75.3
(1) For the twelve months ended December 31, 2016 - Includes the $12.5 million restructuring provision recorded in the first quarter of 2016. For the twelve months ended December 31, 2015 – Includes the $2.1 million Power Systems segment restructuring provision recorded in the second quarter of 2015.
Calculation of the Corporation’s funded net debt, debt and leverage ratio is as follows:
December 31 2016 2015
Cash $ (4.9) $ (13.6)Obligations under finance leases 8.9 11.0Long-term debt 122.0 151.6
Funded net debt $ 126.0 $ 149.0Letters of credit 6.4 5.1
Debt 132.4 154.1
Leverage ratio(1) 2.07 2.05
(1) Calculation uses trailing four-quarter Adjusted EBITDA. This leverage ratio is calculated for purposes of monitoring the Corporation’s objective target leverage ratio of between 1.5 times and 2.0 times. The calculation contains some differences from the leverage ratios calculated under the Corporation’s bank credit facility and senior note agreements (“the agreements”). The resulting leverage ratios under the agreements are not significantly different. See the Liquidity and Capital Resources section.
Critical Accounting Estimates
The preparation of the consolidated financial statements in conformity with IFRS requires management to make judgements, estimates and assumptions that affect the application of accounting policies and the reported amounts and disclosures made in these consolidated financial statements. Actual results could differ from those judgements, estimates and assumptions. Note 3 of the annual Consolidated Financial Statements describes the significant accounting policies and methods used in preparation of the annual Consolidated Financial Statements. The Corporation bases its estimates on historical experience and various other assumptions that are believed to be reasonable in the circumstances.
The key assumptions concerning the future and other key sources of estimation uncertainty that have a significant risk of resulting in a material adjustment to the carrying amount of assets and liabilities within the next fiscal year are as follows:
Allowance for doubtful accounts
The Corporation is exposed to credit risk with respect to its trade and other receivables. However, this is somewhat minimized by the Corporation’s large customer base of over 30,000 customers with no single customer accounting for more than 10% of the Corporation’s annual consolidated revenue. In addition, the Corporation’s customer base spans large public companies, small independent contractors, OEMs and various levels of government and covers most business sectors across Canada. The Corporation follows a program of credit evaluations of customers and limits the amount of credit extended when deemed necessary. The Corporation maintains provisions for possible credit losses, and any such losses to date have been within management’s expectations. The provision for doubtful accounts is determined on an account-by-account basis. The $1.1 million provision for doubtful accounts at December 31, 2016 remained unchanged from the prior year. As economic conditions deteriorate, there is risk that the Corporation could experience a greater number of defaults compared to 2016 which would result in an increased charge to earnings.
Inventory obsolescence
The value of the Corporation’s new and used equipment is evaluated by management throughout the year, on a unit-by-unit basis. When required, provisions are recorded to ensure that the book value of equipment is valued at the lower of cost or estimated net realizable value. The Corporation performs an aging analysis to identify slow moving or obsolete parts inventories and estimates appropriate obsolescence provisions related thereto. The Corporation takes advantage of supplier programs that allow for the return of eligible parts for credit within specified time periods. The inventory obsolescence charged to earnings for 2016 was $10.3 million compared to $6.0 million in 2015. As economic conditions deteriorate or customer demand changes, there is risk that the Corporation could have an increase in inventory obsolescence compared to 2016 which would result in an increased charge to earnings.
Goodwill and intangible assets
The value in use of goodwill and intangible assets has been estimated using the forecasts prepared by management for the next three years. The key assumptions for the estimate are those regarding revenue growth, gross margin, discount rate and the level of working capital required to support the business. These estimates are based on past experience and management’s expectations of future changes in the market and forecasted growth initiatives.
During the year, the Corporation performed impairment tests, based on value in use, of the goodwill and intangible assets with an indefinite life in each of its cash generating unit groups and concluded that no impairment existed. During 2015, the Corporation performed impairment tests, based on value in use, of its goodwill and intangible assets with an indefinite life and concluded that impairments existed in the cash generating unit groups of the Power Systems segment and the Industrial Components segment totaling $41.2 million. See the Annual Consolidated Results – Impairment of Goodwill and Intangible Assets section.
WAJAX CORPORATION 2016 ANNUAL REPORT 35
MANAGEMENT’S DISCUSSION AND ANALYSIS
Changes in Accounting Policies
No new standards have been adopted in the current year:
New standards and interpretations not yet adopted
The new standards or amendments to existing standards that may be significant to the Corporation set out below are not yet effective for the year ended December 31, 2016 and have not been applied in preparing these consolidated financial statements.
On January 1, 2018, the Corporation will be required to adopt IFRS 15 Revenue from Contracts with Customers. The standard contains a single model that applies to contracts with customers and two approaches to recognizing revenue: at a point in time or over time. The model features a contract-based five-step analysis of transactions to determine whether, how much and when revenue is recognized. New estimates and judgemental thresholds have been introduced, which may affect the amount and/or timing of revenue recognized. The Corporation is currently assessing the impact of this standard on its consolidated financial statements and business.
On January 1, 2018, the Corporation will be required to adopt IFRS 9 Financial Instruments, which will replace IAS 39 Financial Instruments: Recognition and Measurement. The new standard replaces the current multiple classification and measurement models for financial assets and liabilities with a single model that has only two classification categories: amortized cost and fair value. Additional changes to the new standard will align hedge accounting more closely with risk management. The Corporation is currently assessing the impact of this standard on its consolidated financial statements and business.
On January 1, 2019, the Corporation will be required to adopt IFRS 16 Leases. The new standard contains a single lease accounting model for lessees, whereby all leases with a term longer than 12 months are recognized on-balance sheet through a right-of-use asset and lease liability. The model features a front-loaded total lease expense recognized through a combination of depreciation and interest. Lessor accounting remains similar to current requirements. The Corporation is currently assessing the impact of this standard on its consolidated financial statements and business.
Risk Management and Uncertainties
As with most businesses, Wajax is subject to a number of marketplace and industry related risks and uncertainties which could have a material impact on operating results, Wajax’s ability to meet its established financial targets as set out in the Strategy section, Wajax’s ability to achieve the expected benefits of transitioning to its new structure as set out in the Reorganization section and Wajax’s ability to pay cash dividends to shareholders. Wajax attempts to minimize many of these risks through diversification of core businesses and through the geographic diversity of its operations. In addition, Wajax has adopted an annual enterprise risk management assessment which is prepared by the Corporation’s senior management and overseen by the Board of Directors and Committees of the Board. The enterprise risk management framework sets out principles and tools for identifying, evaluating, prioritizing and managing risk effectively and consistently across Wajax.
The following are a number of risks that deserve particular comment:
Manufacturer relationships and product access
Wajax seeks to distribute leading product lines in each of its regional markets and its success is dependent upon continuing relations with the manufacturers it represents. Wajax endeavours to align itself in long-term relationships with manufacturers that are committed to achieving a competitive advantage and long-
term market leadership in their targeted market segments. In the Equipment and Power Systems segments, and in certain cases in the hydraulics and process pumps portion of the Industrial Components segment, manufacturer relationships are governed through effectively exclusive distribution agreements. Distribution agreements are for the most part open-ended, but are cancellable within a relatively short notification period specified in each agreement. Although Wajax enjoys good relationships with its major manufacturers and seeks to develop additional strong long-term partnerships, a loss of a major product line without a comparable replacement would have a significantly adverse effect on Wajax’s results of operations or cash flow.
There is a continuing consolidation trend among industrial equipment and component manufacturers. Consolidation may impact the products distributed by Wajax, in either a favourable or unfavourable manner. Consolidation of manufacturers may have a negative impact on the results of operations or cash flow if product lines Wajax distributes become unavailable as a result of the consolidation.
Suppliers generally have the ability to unilaterally change distribution terms and conditions, product lines or limit supply of product in times of intense market demand. Supplier changes in the area of product pricing and availability can have a negative or positive effect on Wajax’s revenue and margins. A change in one of a supplier’s product lines can result in conflicts with another supplier’s product lines that may have a negative impact on the results of operations or cash flow if one of the suppliers cancels its distribution with Wajax due to the conflict. As well, from time to time suppliers make changes to payment terms for distributors. This may affect Wajax’s interest-free payment period or consignment terms, which may have a materially negative or positive impact on working capital balances such as cash, inventories, deposits on inventory, trade and other payables and bank debt.
Economic conditions/Business cyclicality
Wajax’s customer base consists of businesses operating in the natural resources, construction, transportation, manufacturing, industrial processing and utilities industries. These industries can be capital intensive and cyclical in nature, and as a result, customer demand for Wajax’s products and services may be affected by economic conditions at both a global or local level. Changes in interest rates, consumer and business confidence, corporate profits, credit conditions, foreign exchange, commodity prices and the level of government infrastructure spending may influence Wajax’s customers’ operating, maintenance and capital spending, and therefore Wajax’s sales and results of operations. Although Wajax has attempted to address its exposure to business and industry cyclicality by diversifying its operations by geography, product offerings and customer base, there can be no assurance that Wajax’s results of operations or cash flows will not be adversely affected by changes in economic conditions.
Commodity prices
Many of Wajax’s customers are directly and indirectly affected by fluctuations in commodity prices in the forestry, metals and minerals and petroleum and natural gas industries, and as a result Wajax is also indirectly affected by fluctuations in these prices. In particular, each of Wajax’s businesses is exposed to fluctuations in the price of oil and natural gas. A downward change in commodity prices, and particularly in the price of oil and natural gas, could therefore adversely affect Wajax’s results of operations or cash flows.

36 WAJAX CORPORATION 2016 ANNUAL REPORT
MANAGEMENT’S DISCUSSION AND ANALYSIS
Growth initiatives, integration of acquisitions and project execution
As part of its long-term strategy, the Corporation established its 4 Points of Growth strategy including a target leverage ratio range of 1.5 – 2.0 times. See the Strategy section and the Non-GAAP and Additional GAAP Measures sections. While conditions remain challenging, the Corporation has a strong strategy and is confident in its growth prospects. The Corporation’s confidence is strengthened by the enhanced earnings potential of a reorganized Corporation and by relationships with its customers and vendors. See the Reorganization section. Wajax’s ability to develop core capabilities and successfully grow its business through organic growth will be dependent on the segments’ achieving their individual growth initiatives. Wajax’s ability to successfully grow its business through acquisitions will be dependent on a number of factors including: identification of accretive new business or acquisition opportunities; negotiation of purchase agreements on satisfactory terms and prices; prior approval of acquisitions by third parties, including regulatory authorities; securing attractive financing arrangements; and integration of newly acquired operations into the existing business. All of these activities associated with growing the business, realizing enhanced earnings potential from the new structure and investments made in systems may be more difficult to implement or may take longer to execute than management anticipates. Further, any significant expansion of the business may increase the operating complexity of Wajax, and divert management away from regular business activities. Any failure of Wajax to reorganize into a new structure and manage its growth strategy, including acquisitions, successfully could have a material adverse impact on Wajax’s business, results of operations or financial condition.
Key personnel
The success of Wajax is largely dependent on the abilities and experience of its senior management team and other key personnel. Its future performance will also depend on its ability to attract, develop and retain highly qualified employees in all areas of its business. Competition for skilled management, sales and technical personnel is intense, particularly in certain markets where Wajax competes. Wajax continuously reviews and makes adjustments to its hiring, training and compensation practices in an effort to attract and retain a highly competent workforce. However, there can be no assurance that Wajax will be successful in its efforts and a loss of key employees, or failure to attract and retain new talent as needed, in particular through the reorganization into a new structure in 2016, may have an adverse impact on Wajax’s current operations or future prospects. See the Reorganization section.
Leverage, credit availability and restrictive covenants
Wajax has a $250 million revolving bank credit facility which expires August 12, 2020. Wajax also has $125 million of senior notes outstanding bearing an annual interest rate of 6.125%, payable semi-annually, and maturing on October 23, 2020. The bank credit facility and senior notes contain restrictive covenants which place restrictions on, among other things, the ability of Wajax to encumber or dispose of its assets, the amount of finance costs incurred and dividends declared relative to earnings and certain reporting obligations. A failure to comply with the obligations of the facility or senior notes could result in an event of default which, if not cured or waived, could require an accelerated repayment of the facility or senior notes. There can be no assurance that Wajax’s assets would be sufficient to repay the facility or senior notes in full.
Wajax’s short-term normal course working capital requirements can swing widely quarter-to-quarter due to timing of large inventory purchases and/or sales and changes in market activity. In general,
as Wajax experiences growth, there is a need for additional working capital as was the case in 2012. Conversely, as Wajax experiences economic slowdowns working capital reduces reflecting the lower activity levels. While management believes the bank credit facility will be adequate to meet the Corporation’s normal course working capital requirements, maintenance capital requirements and certain strategic investments, there can be no assurance that additional credit will become available if required, or that an appropriate amount of credit with comparable terms and conditions will be available when the bank credit facility and senior notes mature.
Wajax may be required to access the equity or debt markets or reduce dividends in order to fund significant acquisitions and growth related working capital and capital expenditures.
The amount of debt service obligations under the bank credit facility will be dependent on the level of borrowings and fluctuations in interest rates to the extent the rate is unhedged. As a result, fluctuations in debt servicing costs may have a detrimental effect on future earnings or cash flow.
Wajax also has credit lines available with other financial institutions for purposes of financing inventory. These facilities are not committed lines and their future availability cannot be assured, which may have a negative impact on cash available for dividends and future growth opportunities.
Quality of products distributed
The ability of Wajax to maintain and expand its customer base is dependent upon the ability of the manufacturers represented by Wajax to improve and sustain the quality of their products. The quality and reputation of such products are not within Wajax’s control, and there can be no assurance that manufacturers will be successful in meeting these goals. The failure of these manufacturers to maintain a market presence could adversely affect Wajax’s results of operations or cash flow.
Inventory obsolescence
Wajax maintains substantial amounts of inventories in all three core businesses. While Wajax believes it has appropriate inventory management systems in place, variations in market demand for the products it sells can result in certain items of inventory becoming obsolete. This could result in a requirement for Wajax to take a material write down of its inventory balance resulting in Wajax not being able to realize expected revenue and cash flows from its inventory, which would negatively affect results from operations or cash flow.
Government regulation
Wajax’s business is subject to evolving laws and government regulations, particularly in the areas of taxation, the environment, and health and safety. Changes to such laws and regulations may impose additional costs on Wajax and may adversely affect its business in other ways, including requiring additional compliance measures by Wajax.
Insurance
Wajax maintains a program of insurance coverage that is ordinarily maintained by similar businesses, including property insurance and general liability insurance. Although the limits and deductibles of such insurance have been established through risk analysis and the recommendation of professional advisors, there can be no assurance that such insurance will remain available to Wajax at commercially reasonable rates or that the amount of such coverage will be adequate to cover all liability incurred by Wajax. If Wajax is held liable for amounts exceeding the limits of its insurance coverage or for claims outside the scope of that coverage, its business, results of operations or financial condition could be adversely affected.

WAJAX CORPORATION 2016 ANNUAL REPORT 37
MANAGEMENT’S DISCUSSION AND ANALYSIS
Information systems and technology
Information systems are an integral part of Wajax’s business processes, including marketing of equipment and support services, inventory and logistics, and finance. Some of these systems are integrated with certain suppliers’ core processes and systems. Any disruptions to these systems or new systems due, for example, to the upgrade or conversion thereof, or the failure of these systems or new systems to operate as expected could, depending on the magnitude of the problem, adversely affect Wajax’s operating results by limiting the ability to effectively monitor and control Wajax’s operations.
Credit risk
Wajax extends credit to its customers, generally on an unsecured basis. Although Wajax is not substantially dependent on any one customer and it has a system of credit management in place, the loss of a large receivable would have an adverse effect on Wajax’s profitability.
Labour relations
Wajax has approximately 2,318 employees. Wajax is party to thirteen collective agreements covering a total of approximately 311 employees. Of these, two collective agreements covering 31 employees have been renegotiated (one with a two year mandate), one collective agreement covering 49 employees has been ratified, but is still pending signatures, and one collective agreement covering 7 employees expired in 2016 and is currently being re-negotiated. Of the remaining nine collective agreements, five will expire in 2017 and preparations for re-negotiations are under way. Of the remaining four collective agreements, three expire in 2018 and one expires in 2019. Overall, Wajax believes its labour relations to be satisfactory and does not anticipate it will be unable to renew the collective agreements. If Wajax is unable to renew or negotiate collective agreements from time to time, it could result in work stoppages and other labour disturbances. The failure to renew collective agreements upon satisfactory terms could have a material adverse impact on Wajax’s businesses, results of operations or financial condition.
Foreign exchange exposure
Wajax’s operating results are reported in Canadian dollars. While the majority of Wajax’s sales are in Canadian dollars, significant portions of its purchases are in U.S. dollars. Changes in the U.S. dollar exchange rate can have a negative or positive impact on Wajax’s revenue, margins and working capital balances. Wajax mitigates certain exchange rate risks by entering into short-term foreign currency forward contracts to fix the cost of certain inbound inventory and to hedge certain foreign-currency denominated sales to customers. In addition, Wajax will periodically institute price increases to offset the negative impact of foreign exchange rate increases on imported goods. The inability of Wajax to mitigate exchange rate risks or increase prices to offset foreign exchange rate increases, including sudden and volatile changes in the U.S. dollar exchange rate, may have a material adverse effect on the results of operations or financial condition of Wajax.
A declining U.S. dollar relative to the Canadian dollar can have a negative effect on Wajax’s revenue and cash flows as a result of certain products being imported from the U.S. In some cases market conditions require Wajax to lower its selling prices as the U.S. dollar declines. As well, many of Wajax’s customers export products to the U.S., and a strengthening Canadian dollar can negatively impact their overall competitiveness and demand for their products, which in turn may reduce product purchases from Wajax.
A strengthening U.S. dollar relative to the Canadian dollar can have a positive effect on Wajax’s revenue, as Wajax will periodically institute price increases on inventory imported from the U.S. to
offset the negative impact of foreign exchange rate increases to ensure margins are not eroded. However, a sudden strengthening U.S. dollar relative to the Canadian dollar can have a negative impact mainly on parts margins in the short-term prior to price increases taking effect.
Wajax maintains a hedging policy whereby significant transactional currency risks are identified and hedged.
Competition
The equipment, power systems and industrial components distribution industries in which Wajax competes are highly competitive. In the Equipment segment, Wajax primarily competes against regional equipment distributors that tend to handle a dedicated product line, such as those offered by John Deere, Komatsu and Caterpillar. There can be no assurance that Wajax will be able to continue to compete on the basis of product quality and price of product lines, distribution and servicing capabilities as well as proximity of its distribution sites to customers.
The Power Systems business competes with other major diesel engine distributors representing such products as Cummins and Caterpillar and primarily with Freightliner and Western Star truck dealers for on-highway business. Competition is based primarily on product quality, pricing and the ability to service the product after the sale.
In terms of the Industrial Components segment, the hydraulics and process equipment branches compete with other distributors of hydraulics components and process equipment on the basis of quality and price of the product lines, the capacity to provide custom engineered solutions and high service standards. The bearings and power transmission product branches compete with a number of distributors representing the same or competing product lines and rely primarily on high service standards, price and value added services to gain market advantage.
There can be no assurance that Wajax will be able to continue to effectively compete. Increased competitive pressures or the inability of Wajax to maintain the factors which have enhanced its competitive position could adversely affect its results of operations or cash flow.
Litigation and product liability claims
In the ordinary course of its business, Wajax may be party to various legal actions, the outcome of which cannot be predicted with certainty. One category of potential legal actions is product liability claims. Wajax carries product liability insurance, and management believes that this insurance is adequate to protect against potential product liability claims. Not all risks, however, are covered by insurance, and no assurance can be given that insurance will be consistently available, or will be consistently available on an economically feasible basis, or that the amounts of insurance will at all times be sufficient to cover each and every loss or claim that may occur involving Wajax’s assets or operations.
Guaranteed residual value, recourse and buy-back contracts
In some circumstances Wajax makes certain guarantees to finance providers on behalf of its customers. These guarantees can take the form of assuring the resale value of equipment, guaranteeing a portion of customer lease payments, or agreeing to buy back the equipment at a specified price. These contracts are subject to certain conditions being met by the customer, such as maintaining the equipment in good working condition. Historically, Wajax has not incurred substantial losses on these types of contracts, however, there can be no assurance that losses will not be incurred in the future. See the Contractual Obligations section.

38 WAJAX CORPORATION 2016 ANNUAL REPORT
MANAGEMENT’S DISCUSSION AND ANALYSIS
Future warranty claims
Wajax provides manufacturers’ and/or dealer warranties for most of the product it sells. In some cases, the product warranty claim risk is shared jointly with the manufacturer. In addition, Wajax provides limited warranties for workmanship on services provided. Accordingly, Wajax has some liability for warranty claims. There is a risk that a possible product quality erosion or a lack of a skilled workforce could increase warranty claims in the future, or may be greater than management anticipates. If Wajax’s liability in respect of such claims is greater than anticipated, it may have a material adverse impact on Wajax’s business, results of operations or financial condition.
Maintenance and repair contracts
Wajax frequently enters into long-term maintenance and repair contracts with its customers, whereby Wajax is obligated to maintain certain fleets of equipment at various negotiated performance levels. The length of these contracts varies significantly, often ranging up to five or more years. The contracts are generally fixed price, although many contracts have additional provisions for inflationary adjustments. Due to the long-term nature of these contracts, there is a risk that significant cost overruns may be incurred. If Wajax has miscalculated the extent of maintenance work required, or if actual parts and service costs increase beyond the contracted inflationary adjustments, the contract profitability will be adversely affected. In order to mitigate this risk, Wajax closely monitors the contracts for early warning signs of cost overruns. In addition, the manufacturer may, in certain circumstances, share in the cost overruns if profitability falls below a certain threshold. Any failure by Wajax to effectively price and manage these contracts could have a material adverse impact on Wajax’s business, results of operations or financial condition.
Environmental factors
From time to time, Wajax experiences environmental incidents, emissions or spills in the course of its normal business activities. Wajax has established environmental compliance and monitoring programs, including an internal compliance audit function, which management believes are appropriate for its operations. In addition, Wajax retains environmental engineering consultants to conduct the following activities: environmental site assessments prior to the acquisition or occupation by Wajax; ongoing monitoring of soil and groundwater contamination; and remediation of contaminated sites. To date, these environmental incidents, emissions and spills have not resulted in any material liabilities to the Corporation, however, there can be no assurance that any future incidents, emissions or spills will not result in a material adverse effect on Wajax’s results of operations or cash flows. Management is not aware of any material environmental concerns for which a provision has not been recorded.
Cyber security
Wajax’s business relies on information technology including third party service providers, to process, transmit and store electronic information including that related to customers, vendors and employees. A breach in the security of the Corporation’s information technology, or that of its third party service providers, could expose the business to a risk of loss, misuse of confidential information and/or business interruption.
The Corporation has general security controls in place, including security tools, and is currently implementing recommendations from a recently completed security review performed by a third party. In addition, the Corporation has policies in place regarding security over confidential customer, vendor and employee information, commenced employee security training in late 2016, and has recovery plans in place in the event of a cyber-attack.
Despite such security controls, there is no assurance that cyber security threats can be fully detected, prevented or mitigated. Should such threats materialize and depending on the magnitude of the problem, they could have a material impact on Wajax’s business, results of operations or financial condition.
Strategic Direction and Outlook
Despite the continuing challenging market conditions, Wajax delivered improved results in the fourth quarter. On an adjusted net earnings basis and excluding the impact of insurance recoveries and the environmental provision, fourth quarter results increased over the previous year as higher gross margins and lower selling and administrative costs more than made up for the reduction in revenue. Management is pleased with the improvement in the Power Systems segment, where cost reduction and margin improvement initiatives significantly benefitted fourth quarter results.
The reorganization announced in March 2016 is now complete and the Corporation will begin reporting externally under the new functional structure in 2017. Through much hard work by the entire Wajax team, the reorganization efforts are expected to improve the execution of the Corporation’s strategy. Additionally, the Corporation realized approximately $8.6 million of savings in 2016 and expects to begin realizing approximately $17 million of annualized cost savings in 2017.
Higher quarterly earnings combined with $14.2 million of cash generated from reduced operating working capital resulted in a $21.9 million reduction in funded net debt in the quarter. As a result, the year end leverage ratio was 2.1X, just slightly above the Corporation’s target range of 1.5X – 2.0X.
Looking forward to 2017, although there have been some announced increases in planned investments by Canadian oil and gas companies, management expects that most major resource and industrial markets will remain under continuing spending and resultant competitive pressure. The focus in 2017 will be to generate revenue sufficient to offset the four large shovel deliveries made in 2016 (which are not expected to be repeated), effectively manage margins and ensure the Corporation delivers the operational improvements and full annualized savings expected from the reorganization. Assuming the achievement of these objectives, management anticipates net earnings in 2017 will increase compared to 2016 adjusted net earnings.
See the Non-GAAP and Additional GAAP Measures section.
Additional information, including Wajax’s Annual Report and Annual Information Form, are available on SEDAR at www.sedar.com.

WAJAX CORPORATION 2016 ANNUAL REPORT 39
MANAGEMENT’S DISCUSSION AND ANALYSIS
The consolidated financial statements of Wajax Corporation are the responsibility of management and have been prepared in accordance with International Financial Reporting Standards. Where appropriate, the information reflects management’s judgement and estimates based on the available information. Management is also responsible for all other information in the Annual Report and for ensuring that this information is consistent with the consolidated financial statements.
Wajax maintains a system of internal control designed to provide financial information and the safeguarding of its assets. Wajax also maintains an internal audit function, which reviews the system of internal control and its application.
The Audit Committee of the Board, consisting solely of outside directors, meets regularly during the year with management, internal auditors and the external auditors, to review their respective activities and the discharge of their responsibilities.
To the Shareholders of Wajax Corporation
We have audited the accompanying consolidated financial statements of Wajax Corporation, which comprise the consolidated statements of financial position as at December 31, 2016 and December 31, 2015, the consolidated statements of earnings, comprehensive income, changes in shareholders’ equity and cash flows for the years then ended, comprising a summary of significant accounting policies and other explanatory information.
Management’s Responsibility for the Consolidated Financial Statements
Management is responsible for the preparation and fair presentation of these consolidated financial statements in accordance with International Financial Reporting Standards, and for such internal control as management determines is necessary to enable the preparation of consolidated financial statements that are free from material misstatement, whether due to fraud or error.
Auditors’ Responsibility
Our responsibility is to express an opinion on these consolidated financial statements based on our audits. We conducted our audits in accordance with Canadian generally accepted auditing standards. Those standards require that we comply with ethical requirements and plan and perform the audit to obtain reasonable assurance about whether the consolidated financial statements are free from material misstatement.
An audit involves performing procedures to obtain audit evidence about the amounts and disclosures in the consolidated financial statements. The procedures selected depend on our
Both the external and internal auditors have free and independent access to the Audit Committee to discuss the scope of their audits, the adequacy of the system of internal control and the adequacy of financial reporting. The Audit Committee reports its findings to the Board, which reviews and approves the consolidated financial statements.
Wajax’s external auditors, KPMG LLP, are responsible for auditing the consolidated financial statements and expressing an opinion thereon.
Mark Foote John J. Hamilton President and Senior Vice President and Chief Executive Officer Chief Financial Officer
Mississauga, Canada, March 7, 2017
judgment, including the assessment of the risks of material misstatement of the consolidated financial statements, whether due to fraud or error. In making those risk assessments, we consider internal control relevant to the entity’s preparation and fair presentation of the consolidated financial statements in order to design audit procedures that are appropriate in the circumstances, but not for the purpose of expressing an opinion on the effectiveness of the entity’s internal control. An audit also includes evaluating the appropriateness of accounting policies used and the reasonableness of accounting estimates made by management, as well as evaluating the overall presentation of the consolidated financial statements.
We believe that the audit evidence we have obtained in our audits is sufficient and appropriate to provide a basis for our audit opinion.
Opinion
In our opinion, the consolidated financial statements present fairly, in all material respects, the consolidated financial position of Wajax Corporation as at December 31, 2016 and December 31, 2015, and its consolidated financial performance and its consolidated cash flows for the years then in accordance with International Financial Reporting Standards.
Chartered Professional Accountants, Licensed Public Accountants Toronto, Canada, March 7, 2017
Management’s Responsibility for Financial Reporting
Independent Auditors’ Report

40 WAJAX CORPORATION 2016 ANNUAL REPORT
CONSOLIDATED FINANCIAL STATEMENTS
As at December 31 (in thousands of Canadian dollars) Note 2016 2015
Assets
Current
Cash $ 4,854 $ 13,614Trade and other receivables 5 194,613 167,176Contracts in progress 6 7,095 4,842Inventories 7 283,421 305,669Deposits on inventory 19,407 21,419Income taxes receivable – 841Prepaid expenses 5,463 6,978Derivative instruments 553 1,611
515,406 522,150
Non-Current
Rental equipment 8 58,106 64,104Property, plant and equipment 9 45,658 46,217Intangible assets 11 41,205 41,767Deferred tax asset 22 4,573 3,230
149,542 155,318
$ 664,948 $ 677,468
Liabilities And Shareholders’ Equity
Current
Accounts payable and accrued liabilities 14 $ 232,715 $ 204,999Provisions 12 5,839 5,244Dividends payable 4,956 4,997Income taxes payable 2,287 –Obligations under finance leases 10 3,701 4,198
249,498 219,438
Non-Current
Provisions 12 2,305 3,300Employee benefits 13 8,106 6,752Other liabilities 1,118 1,048Obligations under finance leases 10 5,154 6,844Long-term debt 15 121,952 151,582
138,635 169,526
Shareholders’ Equity
Share capital 18 178,764 179,829Contributed surplus 20 7,137 5,930Retained earnings 90,812 101,916Accumulated other comprehensive income 102 829
Total shareholders’ equity 276,815 288,504
$ 664,948 $ 677,468
On behalf of the Board:
Paul E. Gagné Douglas A. Carty Chairman Director
Consolidated Statements of Financial Position

WAJAX CORPORATION 2016 ANNUAL REPORT 41
CONSOLIDATED FINANCIAL STATEMENTS
For the years ended December 31 (in thousands of Canadian dollars, except per share data) Note 2016 2015
Revenue 27 $ 1,221,908 $ 1,273,308Cost of sales 990,966 1,019,408
Gross profit 230,942 253,900Selling and administrative expenses 195,203 203,087Impairment of goodwill and intangible assets 11 – 41,220Restructuring costs 28 12,500 2,060Insurance recoveries 30 (3,663) –
Earnings before finance costs and income taxes 26,902 7,533Finance costs 19 11,181 12,233
Earnings (loss) before income taxes 15,721 (4,700)Income tax expense 22 4,722 6,315
Net earnings (loss) $ 10,999 $ (11,015)
Basic earnings (loss) per share 23 $ 0.55 $ (0.59)Diluted earnings (loss) per share 23 $ 0.54 $ (0.59)
For the years ended December 31 (in thousands of Canadian dollars) Note 2016 2015
Net earnings (loss) $ 10,999 $ (11,015)
Items that will not be reclassified to income
Actuarial (losses) gains on pension plans, net of tax recovery of $293 (2015 – expense of $279) 13 (797) 758
Items that may subsequently be reclassified to income
Losses (gains) on derivative instruments designated as cash flow hedges in prior periods reclassified to cost of inventory or finance costs during the period, net of tax recovery of $147 (2015 – expense of $815) 408 (2,301) (Losses) gains on derivative instruments outstanding at the end of the period designated as cash flow hedges, net of tax recovery of $418 (2015 – expense of $891) (1,135) 2,513
Other comprehensive (loss) income, net of tax (1,524) 970
Total comprehensive income (loss) $ 9,475 $ (10,045)
Consolidated Statements of Earnings
Consolidated Statements of Comprehensive Income

42 WAJAX CORPORATION 2016 ANNUAL REPORT
CONSOLIDATED FINANCIAL STATEMENTS
Accumulated other comprehensive income (loss)
For the year ended December 31, 2016 Share Contributed Retained Cash flow (in thousands of Canadian dollars) Note capital surplus earnings hedges Total
December 31, 2015 $ 179,829 5,930 101,916 829 $ 288,504
Net earnings – – 10,999 – 10,999Other comprehensive loss – – (797) (727) (1,524)
Total comprehensive income (loss) for the year – – 10,202 (727) 9,475Shares issued to settle share-based compensation plans 20 743 (743) – – –Shares purchased and held in trust 18 (1,808) – (1,437) – (3,245)Dividends 17 – – (19,869) – (19,869)Share-based compensation expense 20 – 1,950 – – 1,950
December 31, 2016 $ 178,764 7,137 90,812 102 $ 276,815
Accumulated other comprehensive income
For the year ended December 31, 2015 Share Contributed Retained Cash flow (in thousands of Canadian dollars) Note capital surplus earnings hedges Total
December 31, 2014 $ 107,454 5,176 135,269 617 $ 248,516
Net loss – – (11,015) – (11,015)Other comprehensive income – – 758 212 970
Total comprehensive (loss) income for the year – – (10,257) 212 (10,045)Issuance of common shares 18 72,278 – – – 72,278Shares issued to settle share-based compensation plans 20 97 (97) – – –Dividends 17 – – (23,096) – (23,096)Share-based compensation expense 20 – 851 – – 851
December 31, 2015 $ 179,829 5,930 101,916 829 $ 288,504
Consolidated Statements of Changes in Shareholders’ Equity

WAJAX CORPORATION 2016 ANNUAL REPORT 43
CONSOLIDATED FINANCIAL STATEMENTS
For the years ended December 31 (in thousands of Canadian dollars) Note 2016 2015
Operating Activities
Net earnings (loss) $ 10,999 $ (11,015)Items not affecting cash flow:Depreciation and amortization: Rental equipment 8 14,578 13,879 Property, plant and equipment 9 9,161 9,114 Intangible assets 11 809 1,471(Gain) loss on disposal of property, plant and equipment (197) 56Impairment of goodwill and intangible assets 11 – 41,220Share-based compensation expense 20 1,950 851Non-cash rental expense 476 173Employee benefits expense, net of payments 264 532Change in fair value of non-hedge derivative instruments 475 (1,404)Finance costs 19 11,181 12,233Income tax expense 22 4,722 6,315
54,418 73,425
Changes in non-cash operating working capital 24 30,900 (20,023)Rental equipment additions 8 (13,538) (22,952)Other non-current liabilities (925) (849)Finance costs paid (10,299) (11,433)Income taxes paid (2,373) (10,292)
Cash generated from operating activities 58,183 7,876
Investing Activities
Property, plant and equipment additions (3,888) (4,643)Proceeds on disposal of property, plant and equipment 833 513Intangible assets additions 11 (247) (144)Acquisition of business 29 (5,565) –
Cash used in investing activities (8,867) (4,274)
Financing Activities
Net decrease in bank debt (30,000) (30,000)Proceeds from issuance of share capital 18 – 71,366Common shares purchased and held in trust 18 (3,245) –Deferred financing costs 15 (367) –Finance lease payments (4,254) (3,884)Settlement of non-hedge derivative instruments (300) 1,698Dividends paid (19,910) (21,455)
Cash (used in) generated from financing activities (58,076) 17,725
Change in cash (bank indebtedness) (8,760) 21,327Cash (bank indebtedness) - beginning of period 13,614 (7,713)
Cash – end of period $ 4,854 $ 13,614
Consolidated Statements of Cash Flows

44 WAJAX CORPORATION 2016 ANNUAL REPORT
NOTES TO CONSOLIDATED FINANCIAL STATEMENTS
December 31, 2016 (amounts in thousands of Canadian dollars, except share and per share data)
1. Corporation Profile
Wajax Corporation (the “Corporation”) is incorporated in Canada. The address of the Corporation’s registered office is 2250 Argentia Road, Mississauga, Ontario, Canada. The Corporaton is a leading Canadian distributor engaged in the sale and service support of mobile equipment, power systems and industrial components. Reflecting a diversified exposure to the Canadian economy, the Corporation has three distinct product divisions which operate through a network of 109 branch locations across Canada.
The Corporation’s customer base covers core sectors of the Canadian economy, including construction, industrial and commercial, transportation, the oil sands, forestry, oil and gas, metal processing and mining.
2. Basis of Preparation
Statement of compliance
These consolidated financial statements have been prepared in accordance with International Financial Reporting Standards (“IFRS”) as published by the International Accounting Standards Board (“IASB”).
These consolidated financial statements were authorized for issue by the Board of Directors on March 7, 2017.
Basis of measurement
These consolidated financial statements have been prepared under the historical cost basis except for derivative financial instruments and liabilities for cash-settled share-based payment arrangements that have been measured at fair value. The defined benefit liability is recognized as the net total of the fair value of the plan assets and the present value of the defined benefit obligation.
Functional and presentation currency
These consolidated financial statements are presented in Canadian dollars, which is the Corporation’s functional currency. All financial information presented in Canadian dollars has been rounded to the nearest thousand, unless otherwise stated and except share and per share data.
Judgements and estimation uncertainty
The preparation of these consolidated financial statements in conformity with IFRS requires management to make judgements, estimates and assumptions that affect the application of accounting policies and the reported amounts and disclosures made in these consolidated financial statements. Actual results could differ from those judgements, estimates and assumptions. The Corporation bases its estimates on historical experience and various other assumptions that are believed to be reasonable in the circumstances.
The key assumptions concerning the future and other key sources of estimation uncertainty that have a significant risk of resulting in a material adjustment to the carrying amount of assets and liabilities within the next fiscal year are as follows:
Allowance for doubtful accounts
The Corporation is exposed to credit risk with respect to its trade and other receivables. However, this is somewhat minimized by the Corporation’s large customer base which covers most business sectors across Canada. The Corporation follows a program of credit evaluations of customers and limits the amount of credit extended
when deemed necessary. The Corporation maintains provisions for possible credit losses, and any such losses to date have been within management’s expectations. The provision for doubtful accounts is determined on an account-by-account basis.
Inventory obsolescence
The value of the Corporation’s new and used equipment is evaluated by management throughout the year, on a unit-by-unit basis. When required, provisions are recorded to ensure that the book value of equipment is valued at the lower of cost and estimated net realizable value. The Corporation performs an aging analysis to identify slow moving or obsolete parts inventories and estimates appropriate obsolescence provisions related thereto. The Corporation takes advantage of supplier programs that allow for the return of eligible parts for credit within specified time periods.
Goodwill and intangible assets
The value in use of goodwill and intangible assets has been estimated using the forecasts prepared by management for the next three years. The key assumptions for the estimate are those regarding revenue growth, gross margin, discount rate and the level of working capital required to support the business. These estimates are based on past experience and management’s expectations of future changes in the market and forecasted growth initiatives.
3. Significant Accounting Policies
Principles of consolidation
These consolidated financial statements include the accounts of Wajax Corporation and its subsidiary entities, which are all wholly-owned. Intercompany balances and transactions are eliminated on consolidation.
Revenue recognition
Revenue is measured at the fair value of consideration received or receivable and is recognized as it is earned in accordance with the following:
Revenue from the sale of equipment, parts and internally-manufactured or assembled products is generally recorded at the time goods are shipped to customers or when all contracted-upon conditions have been fulfilled.
Revenue from the sale of equipment that involves the design, installation, and assembly of power and energy equipment systems is recognized based on the percentage of contract costs incurred in relation to total estimated contract costs.
Revenue from the rental of equipment is recognized on a straight-line basis over the term of the lease.
Revenue from the provision of engineering and technical services to customers is recognized upon completion of contracted–upon services with the customer.
Revenue for separately priced extended warranty or product maintenance contracts is recognized over the contract period in proportion to the costs expected to be incurred in performing the services under the contract. If insufficient historical evidence exists to support this pattern, then revenue is recognized on a straight-line basis over the term of the contract.
Provision is made for expected returns, collection losses and warranty costs based on past performance, and for estimated costs to fulfill contractual obligations and other sales-related contingencies depending on the terms of each individual contract.
Notes to Consolidated Financial Statements

WAJAX CORPORATION 2016 ANNUAL REPORT 45
Derivative financial instruments
The Corporation uses derivative financial instruments in the management of its foreign currency exposures related to certain inventory purchases and customer sales commitments. The Corporation’s policy is not to utilize derivative financial instruments for trading or speculative purposes.
Where the Corporation intends to apply hedge accounting it formally documents the relationship between the derivative and the risk being hedged, as well as the risk management objective and strategy for undertaking the hedge transaction. The documentation links the derivative to a specific asset or liability or to specific firm commitments or forecasted transactions. The Corporation also assesses, at the hedge’s inception as well as on an ongoing basis, whether the hedge is effective in offsetting changes in fair values or cash flows of the risk being hedged. Should a hedge become ineffective, hedge accounting will be discontinued prospectively.
All derivative instruments are recorded in the consolidated statements of financial position at fair value unless exempted from derivative treatment as a normal purchase and sale. All changes in fair value are recorded in earnings unless cash flow hedge accounting is applied, in which case changes in fair value are recorded in other comprehensive income. If the cash flow hedge of a firm commitment or forecast transaction results in the recognition of a non-financial asset or liability, then, at the time the asset or liability is recognized, the associated gains or losses on the derivative that had previously been recognized in other comprehensive income are included in the initial measurement of the asset or liability.
Contracts in progress
Contracts in progress represent unbilled amounts expected to be collected from customers for contract work performed to date. The amount is measured at cost plus profit recognized to date less progress billings and recognized losses. Costs include all expenditures directly related to specific projects. Contracts in progress is presented as a current asset for all contracts in which costs incurred plus recognized profits exceeds the progress billings and the amounts are expected to be billed and recovered within twelve months. If progress billings exceed costs incurred plus recognized profits, the difference represents amounts billed in advance for contract work yet to be performed and is presented as deferred income.
Inventories
Inventories are valued at the lower of cost and net realizable value.
Cost is determined using the weighted average method except where the items are not ordinarily interchangeable, in which case the specific identification method is used.
Cost of equipment and parts includes purchase cost, conversion cost, if applicable, and the cost incurred in bringing inventory to its present location and condition.
Cost of work-in-process and cost of conversion includes cost of direct labour, direct materials and a portion of direct and indirect overheads, allocated based on normal capacity.
Net realizable value is the estimated selling price in the ordinary course of business, less the estimated costs to sell.
Deposits on inventory
In the normal course of business, the Corporation receives inventory on consignment from a major manufacturer which is either rented, sold to customers, or purchased. Under the terms of the consignment program, the Corporation is required to make periodic deposits to the manufacturer on the consigned inventory that is rented to customers or on-hand for greater than nine months. This consigned inventory is not included in the Corporation’s inventory as the manufacturer retains title to the goods, however the deposits paid to the manufacturer are recorded as deposits on inventory. Other inventory prepayments are also included in deposits on inventory.
Rental equipment
Rental equipment assets are recorded at cost less accumulated depreciation. Cost includes all expenditures directly attributable to the acquisition of the asset. Assets are depreciated over their estimated useful lives using the declining balance method at a rate of 20% – 30% per year for material handling equipment and a straight line method for power generation equipment.
Property, plant and equipment
Property, plant and equipment are recorded at cost less accumulated depreciation. Cost includes all expenditures directly attributable to the acquisition of the asset. Assets are depreciated over their estimated useful lives based on the following methods and annual rates:
Asset Method Rate
Buildings declining balance 5% – 10%Equipment and vehicles declining balance 20% – 30%Computer hardware straight-line 3 – 5 yearsFurniture and fixtures declining balance 10% – 20%Leasehold improvements straight-line over the remaining terms of the leases
Assets under finance leases are depreciated over the shorter of the lease term and their useful life.
Leases
As lessor:
The Corporation’s equipment rentals and leases are classified as operating leases with amounts received included in revenue on a straight-line basis over the term of the lease.
As lessee:
Leases are classified as finance leases when the terms of the lease transfer substantially all the risks and rewards of ownership to the Corporation. Under finance leases the asset is recorded at the lower of its fair value and the present value of the minimum lease payments at the inception of the lease. A liability is recorded and is classified as current and non-current liabilities. The interest component of the lease is charged to earnings over the period of the lease using the effective interest rate method.
All other leases are classified as operating leases. The cost of operating leases is charged to earnings on a straight-line basis over the periods of the leases.
46 WAJAX CORPORATION 2016 ANNUAL REPORT
NOTES TO CONSOLIDATED FINANCIAL STATEMENTS
Intangible assets
Product distribution rights represent the fair value attributed to these rights pursuant to an acquisition and are classified as indefinite life intangible assets because the Corporation is generally able to renew these rights with minimal cost of renewal.
Goodwill and indefinite life intangible assets are not amortized but are tested for impairment at least annually, or more frequently if certain indicators arise that indicate the assets might be impaired. Goodwill and indefinite life intangible assets are allocated to cash-generating units (“CGUs”) that are expected to benefit from the synergies of the acquisition.
Customer lists and non-competition agreements are amortized on a straight-line basis over their useful lives which range from 2 to 7 years. Computer application software is classified as an intangible asset and is amortized on a straight-line basis over the useful life ranging from 1 to 7 years.
Impairment
Property, plant and equipment, rental equipment and definite life intangible assets are reviewed at the end of each year to determine if any indicators of impairment exist. If an indicator of impairment is identified, an impairment loss would be recognized equal to the amount by which the asset’s carrying amount exceeds its recoverable amount. Where the asset does not generate cash flows that are independent of other assets, impairment is considered for the CGU to which the asset belongs.
Goodwill and indefinite life intangible assets are tested at least annually for impairment. To test for impairment, the Corporation compares each CGU’s carrying value to its recoverable amount. Recoverable amount is the higher of value in use or fair value less costs of disposal, if the fair value can be readily determined. The value in use is the present value of future cash flows using a pre-tax discount rate that reflects the time value of money and the risk specific to the assets. The fair value less costs of disposal is determined either by an adjusted net asset-based approach or by the present value of future cash flows from a market participant perspective. Any impairment of goodwill or indefinite life intangible assets would be recorded as a charge against earnings.
Cash and bank indebtedness
Cash and bank indebtedness includes cash on hand, demand deposits, bank overdrafts and outstanding cheques. The Corporation considers bank indebtedness to be an integral part of the Corporation’s cash management. Cash and bank indebtedness are offset and the net amount presented in the consolidated statements of financial position to the extent that there is a right to set off and a practice of net settlement.
Financing costs
Transaction costs directly attributable to the acquisition or amendment of bank debt and the issuance of the senior unsecured notes (“senior notes”) are deferred and amortized to finance costs over the term of the long-term debt using the effective interest rate method. Deferred financing costs are included in the carrying amount of the related long-term debt.
Provisions
The Corporation provides for customer warranty claims that may not be covered by the manufacturer’s standard warranty. Warranties relate to products sold and generally cover a period of 6 months to 5 years. The reserve is determined by applying a claim rate to the value of each machine sold. The rate is developed using
management’s best estimate of actual warranty expense, generally based on recent claims experience, and is adjusted as required. The provision is not discounted to reflect the time value of money because the impact is not material.
Financial instruments
Long-term debt instruments are initially measured at fair value, which is the consideration received, net of transaction costs incurred. Derivative instruments are measured at fair value. All changes in the fair value of derivative instruments are recorded in earnings unless cash flow hedge accounting is used, in which case changes in fair value are recorded in other comprehensive income with any ineffectiveness charged to earnings.
Share-based compensation plans
The fair value of share-based compensation plan rights is based on the trading price of a Wajax Corporation common share on the Toronto Stock Exchange (“TSX”). Compensation expense for share-settled plans is based upon the fair value of the rights at the date of grant and is charged to selling and administrative expenses on a straight-line basis over the vesting period, with an offsetting adjustment to contributed surplus. Compensation expense for cash-settled plans varies with the price of the Corporation’s shares and is recognized over the vesting period with an offset to accounts payable and accrued liabilities.
Employee benefits
The Corporation has defined contribution pension plans for most of its employees. The cost of the defined contribution plans is recognized in earnings based on the contributions required to be made each year.
The Corporation also has defined benefit plans covering some of its employees. The benefits are based on years of service and the employees’ earnings. Defined benefit plan obligations are accrued as the employees render the services necessary to earn the pension benefits. The Corporation has adopted the following policies:
The cost of pension benefits earned by employees is actuarially determined using the projected unit credit method for defined benefit plans and management’s best estimate of salary escalation, and retirement ages of employees.
For purposes of calculating expected return on plan assets, those assets are valued at fair value.
The charge to earnings for the defined benefit plans is split between an operating cost and a finance charge. The finance charge represents the net interest cost on the defined benefit obligation net of the expected return on plan assets and is included in selling and administrative expenses.
Actuarial gains and losses are recognized in full in other comprehensive income in the year in which they occur.
Income taxes
Income tax expense comprises current and deferred tax. Current tax and deferred tax are recognized in earnings except to the extent that they relate to a business combination or to items recognized directly in equity or in other comprehensive income.
Current tax is the expected tax payable or receivable on the taxable income or loss for the year, using tax rates enacted or substantively enacted at the reporting date, and any adjustment to income taxes payable in respect of previous years.
Deferred tax is recognized in respect of temporary differences between the carrying amounts of assets and liabilities for financial reporting purposes and the amounts used for taxation purposes.
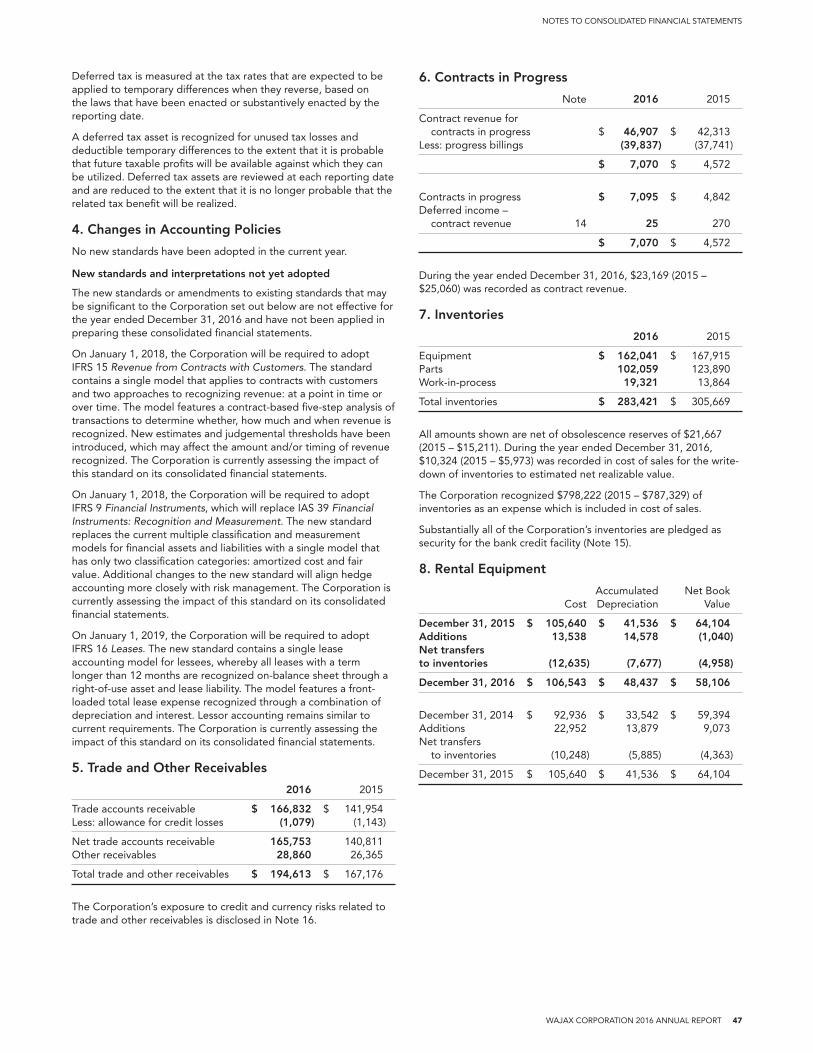
WAJAX CORPORATION 2016 ANNUAL REPORT 47
NOTES TO CONSOLIDATED FINANCIAL STATEMENTS
Deferred tax is measured at the tax rates that are expected to be applied to temporary differences when they reverse, based on the laws that have been enacted or substantively enacted by the reporting date.
A deferred tax asset is recognized for unused tax losses and deductible temporary differences to the extent that it is probable that future taxable profits will be available against which they can be utilized. Deferred tax assets are reviewed at each reporting date and are reduced to the extent that it is no longer probable that the related tax benefit will be realized.
4. Changes in Accounting Policies
No new standards have been adopted in the current year.
New standards and interpretations not yet adopted
The new standards or amendments to existing standards that may be significant to the Corporation set out below are not effective for the year ended December 31, 2016 and have not been applied in preparing these consolidated financial statements.
On January 1, 2018, the Corporation will be required to adopt IFRS 15 Revenue from Contracts with Customers. The standard contains a single model that applies to contracts with customers and two approaches to recognizing revenue: at a point in time or over time. The model features a contract-based five-step analysis of transactions to determine whether, how much and when revenue is recognized. New estimates and judgemental thresholds have been introduced, which may affect the amount and/or timing of revenue recognized. The Corporation is currently assessing the impact of this standard on its consolidated financial statements.
On January 1, 2018, the Corporation will be required to adopt IFRS 9 Financial Instruments, which will replace IAS 39 Financial Instruments: Recognition and Measurement. The new standard replaces the current multiple classification and measurement models for financial assets and liabilities with a single model that has only two classification categories: amortized cost and fair value. Additional changes to the new standard will align hedge accounting more closely with risk management. The Corporation is currently assessing the impact of this standard on its consolidated financial statements.
On January 1, 2019, the Corporation will be required to adopt IFRS 16 Leases. The new standard contains a single lease accounting model for lessees, whereby all leases with a term longer than 12 months are recognized on-balance sheet through a right-of-use asset and lease liability. The model features a front-loaded total lease expense recognized through a combination of depreciation and interest. Lessor accounting remains similar to current requirements. The Corporation is currently assessing the impact of this standard on its consolidated financial statements.
5. Trade and Other Receivables
2016 2015
Trade accounts receivable $ 166,832 $ 141,954Less: allowance for credit losses (1,079) (1,143)
Net trade accounts receivable 165,753 140,811Other receivables 28,860 26,365
Total trade and other receivables $ 194,613 $ 167,176
The Corporation’s exposure to credit and currency risks related to trade and other receivables is disclosed in Note 16.
6. Contracts in Progress
Note 2016 2015
Contract revenue for contracts in progress $ 46,907 $ 42,313Less: progress billings (39,837) (37,741)
$ 7,070 $ 4,572
Contracts in progress $ 7,095 $ 4,842Deferred income – contract revenue 14 25 270
$ 7,070 $ 4,572
During the year ended December 31, 2016, $23,169 (2015 – $25,060) was recorded as contract revenue.
7. Inventories
2016 2015
Equipment $ 162,041 $ 167,915Parts 102,059 123,890Work-in-process 19,321 13,864
Total inventories $ 283,421 $ 305,669
All amounts shown are net of obsolescence reserves of $21,667 (2015 – $15,211). During the year ended December 31, 2016, $10,324 (2015 – $5,973) was recorded in cost of sales for the write-down of inventories to estimated net realizable value.
The Corporation recognized $798,222 (2015 – $787,329) of inventories as an expense which is included in cost of sales.
Substantially all of the Corporation’s inventories are pledged as security for the bank credit facility (Note 15).
8. Rental Equipment
Accumulated Net Book Cost Depreciation Value
December 31, 2015 $ 105,640 $ 41,536 $ 64,104Additions 13,538 14,578 (1,040)Net transfers to inventories (12,635) (7,677) (4,958)
December 31, 2016 $ 106,543 $ 48,437 $ 58,106
December 31, 2014 $ 92,936 $ 33,542 $ 59,394Additions 22,952 13,879 9,073Net transfers to inventories (10,248) (5,885) (4,363)
December 31, 2015 $ 105,640 $ 41,536 $ 64,104

48 WAJAX CORPORATION 2016 ANNUAL REPORT
NOTES TO CONSOLIDATED FINANCIAL STATEMENTS
9. Property, Plant and Equipment
Land and Equipment Computer Furniture Leasehold buildings and vehicles hardware and fixtures improvements Total
CostDecember 31, 2015 $ 37,522 72,964 5,665 11,867 9,070 $ 137,088Additions 176 4,069 737 399 590 5,971Additions from business acquisition 1,922 1,360 – – – 3,282Disposals – (4,032) (36) (263) (72) (4,403)
December 31, 2016 $ 39,620 74,361 6,366 12,003 9,588 $ 141,938
Accumulated depreciation December 31, 2015 $ 17,218 53,182 4,842 8,495 7,134 $ 90,871Charge for the year 778 6,395 437 734 817 9,161Disposals – (3,457) (33) (204) (58) (3,752)
December 31, 2016 $ 17,996 56,120 5,246 9,025 7,893 $ 96,280
Carrying amount
December 31, 2016 $ 21,624 18,241 1,120 2,978 1,695 $ 45,658
Cost December 31, 2014 $ 37,269 71,543 5,955 11,533 8,520 $ 134,820Additions 253 5,688 106 684 562 7,293Disposals – (4,267) (396) (350) (12) (5,025)
December 31, 2015 $ 37,522 72,964 5,665 11,867 9,070 $ 137,088
Accumulated depreciationDecember 31, 2014 $ 16,447 50,208 4,858 8,178 6,464 $ 86,155Charge for the year 771 6,638 382 651 672 9,114Disposals – (3,664) (398) (334) (2) (4,398)
December 31, 2015 $ 17,218 53,182 4,842 8,495 7,134 $ 90,871
Carrying amountDecember 31, 2015 $ 20,304 19,782 823 3,372 1,936 $ 46,217
Included in property, plant and equipment are vehicles held under finance leases as follows:
2016 2015
Cost, beginning of year $ 22,313 $ 21,446Additions 2,083 2,650Disposals (177) (58)Purchased at end of lease (3,985) (1,725)
Cost, end of year $ 20,234 $ 22,313
Accumulated depreciation, beginning of year $ 13,417 $ 11,530Charge for the year 2,957 3,242Disposals (162) (58)Purchased at end of lease (3,277) (1,297)
Accumulated depreciation, end of year 12,935 13,417
Carrying amount $ 7,299 $ 8,896
All property, plant and equipment except land and buildings and vehicles held under finance leases have been pledged as security for bank debt (Note 15).
10. Operating and Finance Leases
Operating leases – as lessor
The Corporation rents equipment to customers under rental agreements with terms of up to 5 years. The rentals have been classified as operating leases. The rentals may be cancelled subject to a cancellation fee. The future minimum lease payments receivable under the agreements are as follows:
2016 2015
Less than one year $ 10,354 $ 10,080Between one and five years 14,678 16,578More than five years – 20
$ 25,032 $ 26,678
Operating leases – as lessee
The Corporation leases certain land and buildings, rental equipment and office equipment. Some of the lease terms can be extended at the option of the Corporation.
The future minimum non-cancellable payments due under the agreements are as follows:
2016 2015
Less than one year $ 18,449 $ 18,499Between one and five years 47,523 53,149More than five years 23,978 23,690
$ 89,950 $ 95,338
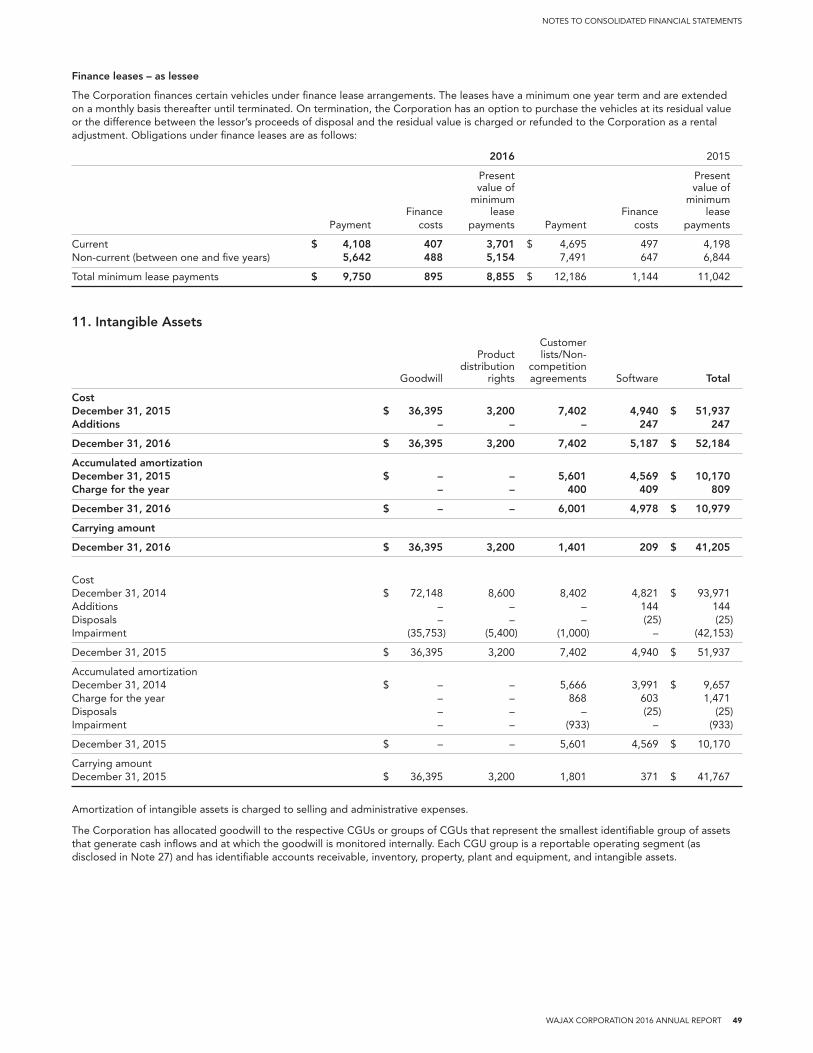
WAJAX CORPORATION 2016 ANNUAL REPORT 49
NOTES TO CONSOLIDATED FINANCIAL STATEMENTS
Finance leases – as lessee
The Corporation finances certain vehicles under finance lease arrangements. The leases have a minimum one year term and are extended on a monthly basis thereafter until terminated. On termination, the Corporation has an option to purchase the vehicles at its residual value or the difference between the lessor’s proceeds of disposal and the residual value is charged or refunded to the Corporation as a rental adjustment. Obligations under finance leases are as follows:
2016 2015
Present Present value of value of minimum minimum Finance lease Finance lease Payment costs payments Payment costs payments
Current $ 4,108 407 3,701 $ 4,695 497 4,198Non-current (between one and five years) 5,642 488 5,154 7,491 647 6,844
Total minimum lease payments $ 9,750 895 8,855 $ 12,186 1,144 11,042
11. Intangible Assets
Customer Product lists/Non- distribution competition Goodwill rights agreements Software Total
CostDecember 31, 2015 $ 36,395 3,200 7,402 4,940 $ 51,937Additions – – – 247 247
December 31, 2016 $ 36,395 3,200 7,402 5,187 $ 52,184
Accumulated amortizationDecember 31, 2015 $ – – 5,601 4,569 $ 10,170Charge for the year – – 400 409 809
December 31, 2016 $ – – 6,001 4,978 $ 10,979
Carrying amount
December 31, 2016 $ 36,395 3,200 1,401 209 $ 41,205
CostDecember 31, 2014 $ 72,148 8,600 8,402 4,821 $ 93,971Additions – – – 144 144Disposals – – – (25) (25)Impairment (35,753) (5,400) (1,000) – (42,153)
December 31, 2015 $ 36,395 3,200 7,402 4,940 $ 51,937
Accumulated amortizationDecember 31, 2014 $ – – 5,666 3,991 $ 9,657Charge for the year – – 868 603 1,471Disposals – – – (25) (25)Impairment – – (933) – (933)
December 31, 2015 $ – – 5,601 4,569 $ 10,170
Carrying amountDecember 31, 2015 $ 36,395 3,200 1,801 371 $ 41,767
Amortization of intangible assets is charged to selling and administrative expenses.
The Corporation has allocated goodwill to the respective CGUs or groups of CGUs that represent the smallest identifiable group of assets that generate cash inflows and at which the goodwill is monitored internally. Each CGU group is a reportable operating segment (as disclosed in Note 27) and has identifiable accounts receivable, inventory, property, plant and equipment, and intangible assets.
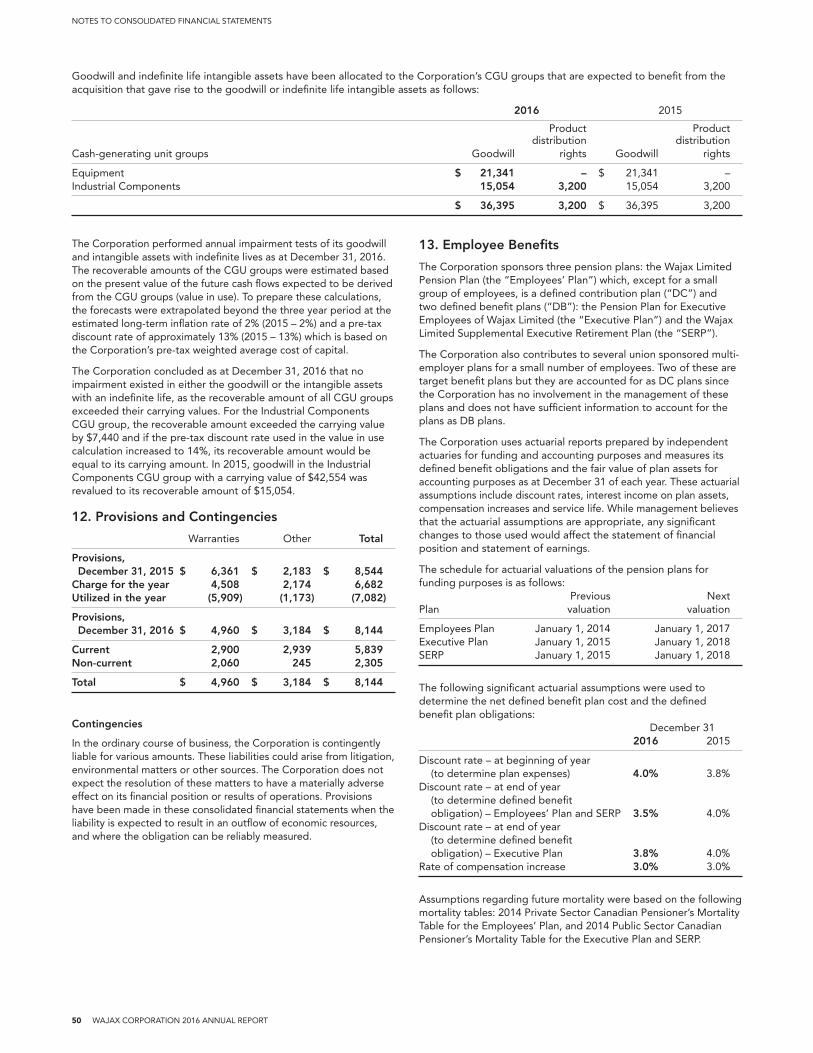
50 WAJAX CORPORATION 2016 ANNUAL REPORT
NOTES TO CONSOLIDATED FINANCIAL STATEMENTS
Goodwill and indefinite life intangible assets have been allocated to the Corporation’s CGU groups that are expected to benefit from the acquisition that gave rise to the goodwill or indefinite life intangible assets as follows:
2016 2015
Product Product distribution distributionCash-generating unit groups Goodwill rights Goodwill rights
Equipment $ 21,341 – $ 21,341 –Industrial Components 15,054 3,200 15,054 3,200
$ 36,395 3,200 $ 36,395 3,200
The Corporation performed annual impairment tests of its goodwill and intangible assets with indefinite lives as at December 31, 2016. The recoverable amounts of the CGU groups were estimated based on the present value of the future cash flows expected to be derived from the CGU groups (value in use). To prepare these calculations, the forecasts were extrapolated beyond the three year period at the estimated long-term inflation rate of 2% (2015 – 2%) and a pre-tax discount rate of approximately 13% (2015 – 13%) which is based on the Corporation’s pre-tax weighted average cost of capital.
The Corporation concluded as at December 31, 2016 that no impairment existed in either the goodwill or the intangible assets with an indefinite life, as the recoverable amount of all CGU groups exceeded their carrying values. For the Industrial Components CGU group, the recoverable amount exceeded the carrying value by $7,440 and if the pre-tax discount rate used in the value in use calculation increased to 14%, its recoverable amount would be equal to its carrying amount. In 2015, goodwill in the Industrial Components CGU group with a carrying value of $42,554 was revalued to its recoverable amount of $15,054.
12. Provisions and Contingencies
Warranties Other Total
Provisions, December 31, 2015 $ 6,361 $ 2,183 $ 8,544Charge for the year 4,508 2,174 6,682Utilized in the year (5,909) (1,173) (7,082)
Provisions, December 31, 2016 $ 4,960 $ 3,184 $ 8,144
Current 2,900 2,939 5,839Non-current 2,060 245 2,305
Total $ 4,960 $ 3,184 $ 8,144
Contingencies
In the ordinary course of business, the Corporation is contingently liable for various amounts. These liabilities could arise from litigation, environmental matters or other sources. The Corporation does not expect the resolution of these matters to have a materially adverse effect on its financial position or results of operations. Provisions have been made in these consolidated financial statements when the liability is expected to result in an outflow of economic resources, and where the obligation can be reliably measured.
13. Employee Benefits
The Corporation sponsors three pension plans: the Wajax Limited Pension Plan (the “Employees’ Plan”) which, except for a small group of employees, is a defined contribution plan (“DC”) and two defined benefit plans (“DB”): the Pension Plan for Executive Employees of Wajax Limited (the “Executive Plan”) and the Wajax Limited Supplemental Executive Retirement Plan (the “SERP”).
The Corporation also contributes to several union sponsored multi-employer plans for a small number of employees. Two of these are target benefit plans but they are accounted for as DC plans since the Corporation has no involvement in the management of these plans and does not have sufficient information to account for the plans as DB plans.
The Corporation uses actuarial reports prepared by independent actuaries for funding and accounting purposes and measures its defined benefit obligations and the fair value of plan assets for accounting purposes as at December 31 of each year. These actuarial assumptions include discount rates, interest income on plan assets, compensation increases and service life. While management believes that the actuarial assumptions are appropriate, any significant changes to those used would affect the statement of financial position and statement of earnings.
The schedule for actuarial valuations of the pension plans for funding purposes is as follows: Previous NextPlan valuation valuation
Employees Plan January 1, 2014 January 1, 2017Executive Plan January 1, 2015 January 1, 2018SERP January 1, 2015 January 1, 2018
The following significant actuarial assumptions were used to determine the net defined benefit plan cost and the defined benefit plan obligations: December 31 2016 2015
Discount rate – at beginning of year (to determine plan expenses) 4.0% 3.8%Discount rate – at end of year (to determine defined benefit obligation) – Employees’ Plan and SERP 3.5% 4.0%Discount rate – at end of year (to determine defined benefit obligation) – Executive Plan 3.8% 4.0%Rate of compensation increase 3.0% 3.0%
Assumptions regarding future mortality were based on the following mortality tables: 2014 Private Sector Canadian Pensioner’s Mortality Table for the Employees’ Plan, and 2014 Public Sector Canadian Pensioner’s Mortality Table for the Executive Plan and SERP.

WAJAX CORPORATION 2016 ANNUAL REPORT 51
NOTES TO CONSOLIDATED FINANCIAL STATEMENTS
Plan assets for the DC plans are invested according to the directions of the plan members. Plan assets for defined benefit plans are invested in the following major categories of plan assets as a percentage of total plan assets: December 31 2016 2015
Cash 2.9% 3.2%Fixed Income 35.4% 33.8%Canadian Equities 28.4% 27.6%Foreign Equities 33.3% 35.4%
100.0% 100.0%
The history of adjustments on the defined benefit plans for the current and prior year are as follows: 2016 2015
Actuarial loss (gain) on defined benefit obligation arising from: Experience adjustment $ 151 $ 15 Demographic assumption changes – – Economic assumption changes 1,103 (681)
$ 1,254 $ (666)Actuarial gain on plan assets, excluding interest income $ 164 $ 371
Total cash payments
Total cash payments for employee future benefits for 2016, consisting of cash contributed by the Corporation to its funded pension plans, cash payments directly to beneficiaries for its unfunded pension plans, and cash contributed to its DC plans was $7,718 (2015 – $8,419).
The Corporation expects to contribute $624 to the defined benefit pension plans in the year ended December 31, 2017.
The plan expenses recognized in earnings are as follows:
2016 2015
Defined contribution plans Current service cost $ 7,114 $ 7,751Defined benefit plans Current service cost 534 543 Administration expenses 613 307 Finance cost on defined benefit obligation 827 797 Expected return on plan assets (554) (515)
1,420 1,132
Total plan expense recognized in the statement of earnings $ 8,534 $ 8,883
Of the amounts recognized in earnings, $2,560 (2015 – $3,251) is included in cost of sales and $5,974 (2015 – $5,632) is included in selling and administrative expenses.
The amounts recognized in other comprehensive income are as follows: 2016 2015
Net actuarial losses (gains) $ 1,090 $ (1,037)Deferred tax (recovery) expense (293) 279
Amount recognized in other comprehensive loss (income) $ 797 $ (758)
Cumulative actuarial losses, net of tax $ 3,375 $ 2,578
Information about the Corporation’s defined benefit pension plans, in aggregate, is as follows:
Present value of benefit obligation 2016 2015
Present value of benefit obligation, beginning of year $ 21,168 $ 21,722Current service cost 534 543Participant contributions 49 49Finance cost on defined benefit obligation 827 797Actuarial loss (gain) 1,254 (666)Benefits paid (1,807) (1,277)
Present value of benefit obligation, end of year $ 22,025 $ 21,168
Plan assets 2016 2015
Fair value of plan assets, beginning of year $ 14,062 $ 13,853Actual return 697 948Participant contributions 49 49Employer contributions 907 796Benefits paid (1,807) (1,277)Administration expenses (613) (307)
Fair value of plan assets, end of year $ 13,295 $ 14,062
Funded Status 2016 2015
Fair value of plan assets, end of year $ 13,295 $ 14,062Present value of benefit obligation, end of year (22,025) (21,168)
Plan deficit $ (8,730) $ (7,106)
The accrued benefit liability is included in the Corporation’s statement of financial position as follows:
2016 2015
Accounts payable and accrued liabilities $ (624) $ (354)Employee benefits (8,106) (6,752)
Plan deficit $ (8,730) $ (7,106)
Present value of benefit obligation includes a benefit obligation of $6,126 (2015 – $5,488) related to the SERP that is not funded. This obligation is secured by a letter of credit of $6,377 (2015 – $5,017).
14. Accounts Payable and Accrued Liabilities
Note 2016 2015
Trade payables $ 130,043 $ 91,090Deferred income – contract revenue 6 25 270Deferred income – other 15,300 7,431Supplier payables with extended terms 29,232 44,255Payroll, bonuses and incentives 22,223 18,235Restructuring accrual 4,687 1,667Accrued liabilities 31,205 42,051
Accounts payable and accrued liabilities $ 232,715 $ 204,999

52 WAJAX CORPORATION 2016 ANNUAL REPORT
NOTES TO CONSOLIDATED FINANCIAL STATEMENTS
15. Long-term Debt
On September 6, 2016, the Corporation amended its committed bank credit facility, extending the maturity date from August 12, 2019 to August 12, 2020. In addition, the $30,000 non-revolving term portion of the facility was repaid, using proceeds from a drawdown under the revolving term portion of the facility, and the $220,000 revolving term portion of the facility was increased to $250,000. The $367 cost of amending the facility has been capitalized and will be amortized over the remaining term of the facility.
Borrowing capacity under the bank credit facility is dependent upon the level of the Corporation’s inventories on hand and the outstanding trade accounts receivable. In addition, the bank credit facility contains customary restrictive covenants including limitations on the declaration of cash dividends and an interest coverage maintenance ratio, all of which were met as at December 31, 2016.
Borrowings under the bank credit facility bear floating rates of interest at margins over Canadian dollar bankers’ acceptance yields, U.S. dollar LIBOR rates or prime. Margins on the facility depend on the Corporation’s leverage ratio at the time of borrowing and range between 1.5% and 3.0% for Canadian dollar bankers’ acceptances and U.S. dollar LIBOR borrowings, and 0.5% and 2.0% for prime rate borrowings.
The senior notes bear an annual interest rate of 6.125%, are payable semi-annually, and mature on October 23, 2020. The senior notes are unsecured and contain customary incurrence based covenants, all of which were met as at December 31, 2016.
2016 2015
Bank credit facility Non-revolving term portion $ – $ 30,000 Revolving term portion – –
– 30,000Senior notes 125,000 125,000Deferred financing costs, net of accumulated amortization of $1,983 (2015 – $1,246) (3,048) (3,418)
Total long-term debt $ 121,952 $ 151,582
The Corporation had $6,417 (2015 – $5,059) letters of credit outstanding at the end of the year.
Finance costs on long-term debt amounted to $10,685 (2015 – $11,659).
16. Financial Instruments
The Corporation categorizes its financial assets and financial liabilities as follows:
2016 2015
Loans and receivables:Cash (bank indebtedness) $ 4,854 $ 13,614Trade and other receivables 194,613 167,176
Other financial liabilities:Accounts payable and accrued liabilities (232,715) (204,999)Dividends payable (4,956) (4,997)Other liabilities (1,118) (1,048)Obligations under finance leases (8,855) (11,042)Long-term debt (121,952) (151,582)
Derivative instruments – cash flow hedges: Foreign exchange forward contracts $ 553 $ 1,611
The Corporation measures loans and receivables and other financial liabilities at amortized cost. Derivatives designated as effective hedges are measured at fair value with subsequent changes in fair value recorded in other comprehensive income. Cash and bank indebtedness were designated as loans and receivables upon initial recognition. The fair values of loans and receivables and other financial liabilities, excluding the senior notes, approximate their recorded values due to the short-term maturities of these instruments. The fair value of the senior notes is estimated based on the trading price of the notes, which takes into account the Corporation’s own credit risk. At December 31, 2016, the Corporation has estimated the fair value of its senior notes to be approximately $128,125 (2015 – $119,688).
The following method and assumptions were used in 2016 and 2015 to determine the fair value of each class of assets and liabilities recorded at fair value on the consolidated statement of financial position:
Derivative instruments
The fair value of foreign exchange forward contracts is determined by discounting contracted future cash flows using a discount rate derived from forward rate curves for comparable assets and liabilities adjusted for changes in credit risk of the counterparties.
Credit risk
The Corporation is exposed to credit risk with respect to its trade and other receivables. This risk is somewhat minimized by the Corporation’s large customer base which covers many business sectors across Canada. The Corporation follows a program of credit evaluations of customers and limits the amount of credit extended when deemed necessary. The Corporation’s trade and other receivables consist of trade accounts receivable from customers and other accounts receivable, generally from suppliers for warranty and rebates. The aging of the trade accounts receivable is as follows:
2016 2015
Current $ 100,953 $ 91,491Less than 60 days overdue 58,766 48,282More than 60 days overdue 7,113 2,181
Total trade accounts receivable $ 166,832 $ 141,954
The carrying amounts of accounts receivable represent the maximum credit exposure.
The Corporation maintains provisions for possible credit losses by performing an analysis of specific accounts. Any such losses to date have been within management’s expectations. Movement of the allowance for credit losses is as follows:
2016 2015
Opening balance $ 1,143 $ 1,603Additions 981 1,419Utilization (1,045) (1,879)
Closing balance $ 1,079 $ 1,143
The Corporation is also exposed to the risk of non-performance by counterparties to short-term currency forward contracts. These counterparties are large financial institutions that maintain high short-term and long-term credit ratings. To date, no such counterparty has failed to meet its financial obligations to the Corporation. Management does not believe there is a significant risk of non-performance by these counterparties and will continue to monitor the credit risk of these counterparties.

WAJAX CORPORATION 2016 ANNUAL REPORT 53
NOTES TO CONSOLIDATED FINANCIAL STATEMENTS
Liquidity risk
Liquidity risk is the risk that the Corporation will encounter difficulty in meeting obligations associated with its financial liabilities as they become due. The contractual maturities of the bank credit facility and senior notes are August 12, 2020 and October 23, 2020, respectively. At December 31, 2016 the Corporation had borrowed $nil (2015 – $30,000) from the bank credit facility and $125,000 (2015 – $125,000) from the issuance of senior notes. The Corporation issued $6,417 (2015 – $5,059) of letters of credit for a total utilization of $6,417 (2015 – $35,059) of its $250,000 (2015 – $250,000) bank credit facility and had not utilized any (2015 – nil) of its $15,000 (2015 – $15,000) equipment financing facility.
As of March 1, 2017, Wajax’s $250,000 bank credit facility, of which $243,583 was unutilized at the end of the year, along with the additional $15,000 of capacity permitted under the bank credit facility, should be sufficient to meet Wajax’s short-term normal course working capital and maintenance capital requirements and certain strategic investments. However, Wajax may be required to access the equity or debt markets to fund significant acquisitions.
Financial risk management policy
The Corporation has in place a financial risk management policy that addresses the Corporation’s financial exposure to currency risk and interest rate risk. The Corporation’s tolerance to interest rate risk decreases as the Corporation’s leverage ratio increases and
interest coverage ratio decreases. To manage this risk prudently, guideline percentages of floating interest rate debt decrease as the Corporation’s leverage ratio increases. The policy also defines acceptable levels of exposure to transactional currency risk. The exposure to currency and interest rate risk is managed through the use of various derivative instruments.
Currency risk
The Corporation enters into short-term currency forward contracts to hedge the exchange risk associated with the cost of certain inbound inventory and certain foreign currency-denominated sales to customers along with the associated receivables as part of its normal course of business. A change in foreign currency relative to the Canadian dollar would not have a material impact on the Corporation’s unhedged foreign currency-denominated sales to customers along with the associated receivables, or on the Corporation’s unhedged foreign currency-denominated purchases from vendors along with the associated payables. The Corporation will periodically institute price increases to offset the negative impact of foreign exchange rate increases and volatility on imported goods to ensure margins are not eroded. However, a sudden strengthening of the U.S. dollar relative to the Canadian dollar can have a negative impact mainly on parts margins in the short term prior to price increases taking effect. The Corporation’s contracts to buy and sell foreign currencies are summarized as follows:
Average Notional Fair ExchangeDecember 31, 2016 Amount Value Rate Maturity
Purchase contracts USD $ 55,076 760 1.3281 January 2017 to February 2018 Sales contracts USD $ 10,767 (207) 1.3209 January 2017 to March 2018
Average Notional Fair ExchangeDecember 31, 2015 Amount Value Rate Maturity
Purchase contracts USD $ 31,836 1,770 1.3358 January to November 2016Sales contracts USD $ 2,044 (159) 1.3205 January to October 2016
The Corporation maintains a hedging policy whereby significant transactional currency risks are usually identified and hedged.
Interest rate risk
The Corporation’s borrowing costs are impacted by changes in interest rates. The impact of changes in interest rates is reduced by the fixed interest rate of the senior notes. As at December 31, 2016 and 2015 the Corporation had not entered into any interest rate swaps with its lenders.
A 1.00 percentage point change in interest rates on the average amount outstanding under the bank credit facility for 2016 would result in a change to earnings before income taxes of approximately $360 for the year.
17. Dividends Declared
During 2016 the Corporation declared cash dividends of $1.00 per share, or $19,869 (2015 – dividends of $1.23 per share or $23,096).
On March 7, 2017, the Corporation declared a first quarter 2017 dividend of $0.25 per share or $4,956.
18. Share Capital
The Corporation is authorized to issue an unlimited number of no par value common shares and an unlimited number of no par value preferred shares. Each common share entitles the holder of record to one vote at all meetings of shareholders. All issued common shares are fully paid. There were no preferred shares outstanding as at December 31, 2016 (2015 – nil). Each common share represents an equal beneficial interest in any distributions of the Corporation and in the net assets of the Corporation in the event of its termination or winding-up.

54 WAJAX CORPORATION 2016 ANNUAL REPORT
NOTES TO CONSOLIDATED FINANCIAL STATEMENTS
Number of Common Note Shares Amount
Issued and outstanding, December 31, 2014 16,778,883 $ 107,454Issuance of common shares 3,197,000 72,278Common shares issued to settle share-based compensation plans 20 10,358 97
Issued and outstanding, December 31, 2015 19,986,241 $ 179,829Common shares issued to settle share-based compensation plans 20 40,578 743
Issued and outstanding, December 31, 2016 20,026,819 $ 180,572Shares purchased and held in trust for future settlement of DSUs, RSUs and PSUs (200,968) (1,808)
Issued and outstanding, net of shares held in trust, December 31, 2016 19,825,851 $ 178,764
During 2016, for the future settlement of DSUs, RSUs, and PSUs the Corporation purchased 200,968 common shares on the open market through Employee Benefit Plan Trusts. The cash consideration paid for the purchase was $3,245, the reduction in share capital was $1,808 and the premium charged to Retained Earnings was $1,437.
19. Finance Costs
2016 2015
Interest on long-term debt $ 10,685 $ 11,659Interest on finance leases 496 574
Finance costs $ 11,181 $ 12,233
20. Share-Based Compensation Plans
The Corporation has four share-based compensation plans: the Wajax Share Ownership Plan (“SOP”), the Directors’ Deferred Share Unit Plan (“DDSUP”), the Mid-Term Incentive Plan for Senior Executives (“MTIP”) and the Deferred Share Unit Plan (“DSUP”).
a) Treasury share rights plans
Under the SOP and the DDSUP, rights are issued to the participants which, upon satisfaction of certain time and performance vesting conditions, are settled by issuing Wajax Corporation shares for no cash consideration. Vested rights are settled when the participant is no longer employed by the Corporation or one of its subsidiary entities or no longer sits on its board.
Whenever dividends are paid on the Corporation’s shares, additional rights (dividend equivalents) with a value equal to the dividends are credited to the participants’ accounts.
The Corporation recorded compensation cost of $731 (2015 – $851) in respect of these plans.
December 31, 2016 December 31, 2015
Number Fair value at Number Fair value at of Rights time of grant of Rights time of grant
Outstanding at beginning of year 325,144 $ 6,008 287,550 $ 5,420Granted in the year – new grants 39,164 670 32,997 685
– dividend equivalents 21,728 – 14,955 –Settled in the year (40,578) (743) (10,358) (97)
Outstanding at end of year 345,458 $ 5,935 325,144 $ 6,008
At December 31, 2016, 339,504 share rights were vested (December 31, 2015 – 319,553).
The outstanding aggregate number of shares issuable to satisfy entitlements under these plans is as follows:
2016 2015
Number Number of Shares of Shares
Approved by shareholders 1,050,000 1,050,000Exercised to date (247,289) (206,711)Rights outstanding (345,458) (325,144)
Available for future grants 457,253 518,145
b) Market-purchased share rights plans
In March 2016, the MTIP and DSUP were amended such that all new grants under the MTIP, comprised of restricted share units (“RSUs”) and performance share units (“PSUs”), and all new grants under the DSUP will be settled in market-purchased common shares of the Corporation on a one-for-one basis provided that the time and performance vesting criteria are met. Whenever dividends
are paid on the Corporation’s shares, additional rights with a value equal to the dividends are credited to the participants’ accounts with the same vesting conditions as the original MTIP and DSUP rights. Grants prior to March 2016 under these plans will be settled in cash. The Corporation recorded compensation cost of $1,219 (2015 – $nil) in respect of these plans. The following new MTIP and DSUP rights are outstanding:
December 31, 2016
Number Fair value at of Rights time of grant
Outstanding at beginning of year – $ –Granted in the year – new grants 324,702 5,549 – dividend equivalents 11,007 –Forfeitures (19,793) (338)
Outstanding at end of year 315,916 $ 5,211
At December 31, 2016, no rights were vested.

WAJAX CORPORATION 2016 ANNUAL REPORT 55
NOTES TO CONSOLIDATED FINANCIAL STATEMENTS
c) Cash-settled rights plans
MTIP and DSUP grants before March 2016 are settled in cash and vest over three years where a portion is determined by the price of the Corporation’s shares. A part of the grant is also subject to performance vesting conditions. Compensation expense varies with the price of the Corporation’s shares and is recognized over the vesting period. Vested DSUP rights are settled when the participant is no longer employed by the Corporation or one of its subsidiary entities. The Corporation recorded compensation cost of $776 (2015 – $115) in respect of the share-based portion of the MTIP and DSUP for grants dated before March 2016. The carrying amount of the share-based portion of these liabilities was $1,634 (2015 – $858).
21. Employee Costs
Employee costs for the Corporation during the year amounted to:
2016 2015
Wages and salaries, including bonuses $ 206,641 $ 205,843Other benefits 33,762 30,843Pension costs – defined contribution plans 7,114 7,751Pension costs – defined benefit plans 1,420 1,132Share-based compensation expense 2,726 966
$ 251,663 $ 246,535
22. Income Taxes
Income tax expense comprises current and deferred tax as follows:
2016 2015
Current $ 5,501 $ 9,482Deferred – Origination and reversal of temporary difference (779) (3,167)
Income tax expense $ 4,722 $ 6,315
The calculation of current tax is based on a combined federal and provincial statutory income tax rate of 26.9% (2015 – 26.5%). The tax rate for the current year is 0.4% higher than in 2015 due to the effect of increased statutory tax rates. Deferred tax assets and liabilities are measured at tax rates that are expected to apply to the period when the asset is realized or the liability is settled. Deferred tax assets and liabilities have been measured using an expected average combined statutory income tax rate of 26.9% based on the tax rates in years when the temporary differences are expected to reverse.
The reconciliation of effective income tax is as follows:
2016 2015
Combined statutory income tax rate 26.9% 26.5%Expected income tax expense (recovery) at statutory rates $ 4,229 $ (1,246)Non-deductible impairment of goodwill and intangible assets – 7,012Other non-deductible expenses 474 575Other 19 (26)
Income tax expense $ 4,722 $ 6,315
Recognized deferred tax assets and liabilities and the movement in temporary differences during the year are as follows:
Recognized Recognized in other Recognized December 31 in profit comprehensive in share December 31 2015 or loss income capital 2016
Property, plant and equipment $ (3,803) 17 – – $ (3,786)Finance leases 579 (158) – – 421Intangible assets 637 (163) – – 474Accrued liabilities 2,440 1,102 – – 3,542Provisions 2,176 (60) – – 2,116Derivative instruments (296) – 271 – (25)Employee benefits 1,816 71 293 – 2,180Deferred financing costs 375 (255) – – 120Partnership income not currently taxable (674) 205 – – (469)Tax loss carryforwards (20) 20 – – –
Net deferred tax assets $ 3,230 779 564 – $ 4,573
Recognized Recognized in other Recognized December 31 in profit comprehensive in share December 31 2014 or loss income capital 2015
Property, plant and equipment $ (3,472) (331) – – $ (3,803)Finance leases 633 (54) – – 579Intangible assets (3,088) 3,725 – – 637Accrued liabilities 2,945 (505) – – 2,440Provisions 2,612 (436) – – 2,176Derivative instruments (220) – (76) – (296)Employee benefits 1,894 201 (279) – 1,816Deferred financing costs (291) (246) – 912 375Partnership income not currently taxable (1,493) 819 – – (674)Tax loss carryforwards (14) (6) – – (20)
Net deferred tax (liabilities) assets $ (494) 3,167 (355) 912 $ 3,230

56 WAJAX CORPORATION 2016 ANNUAL REPORT
NOTES TO CONSOLIDATED FINANCIAL STATEMENTS
23. Earnings Per Share
The following table sets forth the computation of basic and diluted earnings per share:
2016 2015
Numerator for basic and diluted earnings per share: – net earnings (loss) $ 10,999 $ (11,015)
Denominator for basic earnings per share: – weighted average shares, net of shares held in trust 19,898,004 18,559,558
Denominator for diluted earnings per share: – weighted average shares, net of shares held in trust 19,898,004 18,559,558 – effect of dilutive share rights 305,767 –
Denominator for diluted earnings per share 20,203,771 18,559,558
Basic earnings (loss) per share $ 0.55 $ (0.59)
Diluted earnings (loss) per share $ 0.54 $ (0.59)
No share rights were excluded from the above calculation (2015 – 303,865 anti-dilutive share rights excluded) as all share rights were dilutive.
24. Changes In Non-Cash Operating Working Capital
2016 2015
Trade and other receivables $ (26,462) $ 16,583Contracts in progress (2,253) 4,161Inventories 29,506 18,994Deposits on inventory 2,012 (12,456)Prepaid expenses 1,567 858Accounts payable and accrued liabilities 25,935 (47,649)Provisions 595 (514)
Total $ 30,900 $ (20,023)
25. Capital Management
Objective
The Corporation defines its capital as the total of its shareholders’ equity and long-term debt and obligations under finance leases (“interest bearing debt”). The Corporation’s objective when managing capital is to have a capital structure and capacity to support the Corporation’s operations and strategic objectives set by the Board of Directors.
Management of capital
As part of the Corporation’s renewed long-term strategy, its capital structure will continue to be managed such that it maintains a prudent leverage ratio, defined below, in order to provide funds available to invest in strategic growth initiatives, provide liquidity in times of economic uncertainty and to allow for the payment of dividends. In addition, the Corporation’s tolerance to interest rate risk decreases/increases as the Corporation’s leverage ratio increases/decreases. The Corporation’s objective is to maintain a leverage ratio between 1.5 times and 2.0 times. However, there may be instances where the Corporation is willing to maintain a leverage ratio outside the range to either support key growth initiatives or fluctuations in working capital levels during changes in economic cycles.
The leverage ratio at the end of a particular quarter is defined as funded net debt divided by trailing 12-month EBITDA. Funded net debt includes bank indebtedness, long-term debt, obligations under finance leases, and letters of credit, net of cash. EBITDA is calculated as earnings before impairment of goodwill and intangible assets, restructuring costs, finance costs, income tax expense, depreciation and amortization.
Although management currently believes the Corporation has adequate debt capacity, the Corporation may have to access the equity or debt markets, or temporarily reduce dividends to accommodate any shortfalls in the Corporation’s credit facilities or significant growth capital requirements.
There were no significant changes in the Corporation’s approach to capital management during the year.
Restrictions on capital
The interest bearing debt includes a $250,000 bank credit facility which expires August 12, 2020. The bank credit facility contains the following key covenants:
Borrowing capacity is dependent upon the level of the Corporation’s inventories on hand and the outstanding trade accounts receivable (“borrowing base”). The Corporation’s borrowing base was in excess of the $250,000 revolving term portion at December 31, 2016 and, as a result, did not restrict the borrowing capacity under the bank credit facility.
The Corporation will be restricted from the declaration of cash dividends in the event the Corporation’s leverage ratio, as defined under the bank credit facility, exceeds 3.25 times.
An interest coverage maintenance ratio.
The $125,000 senior notes which expire October 23, 2020 are unsecured and contain customary incurrence based covenants that, although different from those under the bank credit facility described above, are not expected to be any more restrictive than under the bank credit facility.
At December 31, 2016, the Corporation was in compliance with all covenants and there were no restrictions on the declaration of quarterly cash dividends.
Under the terms of the $250,000 bank credit facility, the Corporation is permitted to have additional interest bearing debt of $15,000. As a result, the Corporation has up to $15,000 of demand inventory equipment financing capacity with two lenders. The equipment notes payable under the facilities bear floating rates of interest at margins over Canadian dollar bankers’ acceptance yields and U.S. LIBOR rates. Principal repayments are generally due the earlier of 12 months from the date of financing and the date the equipment is sold. At December 31, 2016, the Corporation had no utilization of its interest bearing equipment financing facilities.
26. Related Party Transactions
The Corporation’s related party transactions consist of the compensation of the Board of Directors and key management personnel which is set out in the following table:
2016 2015
Salaries, bonus and other short-term employee benefits $ 4,223 $ 2,900Pension costs – defined contribution plans 30 69Pension costs – defined benefit plans 553 683Share-based compensation expense 1,813 823
Total compensation $ 6,619 $ 4,475

WAJAX CORPORATION 2016 ANNUAL REPORT 57
NOTES TO CONSOLIDATED FINANCIAL STATEMENTS
Power Industrial Segment2016 Equipment Systems Components Eliminations Total
Equipment $ 332,231 $ 69,037 $ – $ – $ 401,268Parts 158,130 119,506 361,282 – 638,918Service 69,445 51,027 17,427 – 137,899Rental and other 37,358 10,387 – (3,922) 43,823
Revenue $ 597,164 $ 249,957 $ 378,709 $ (3,922) $ 1,221,908
Earnings before restructuring costs, finance costs and income taxes $ 42,389 $ 75 $ 10,569 $ (13,631) $ 39,402Restructuring costs – – – 12,500 12,500
Earnings before finance costs and income taxes $ 42,389 $ 75 $ 10,569 $ (26,131) $ 26,902Finance costs 11,181Income tax expense 4,722
Net earnings $ 10,999
Segment assets excluding intangible assets $ 327,710 $ 150,326 $ 133,142 $ – $ 611,178Intangible assets 21,549 131 19,488 37 41,205Corporate and other assets – – – 12,565 12,565
Total assets $ 349,259 $ 150,457 $ 152,630 $ 12,602 $ 664,948
Segment liabilities $ 136,376 $ 39,367 $ 60,966 $ – $ 236,709Corporate and other liabilities – – – 151,424 151,424
Total liabilities $ 136,376 $ 39,367 $ 60,966 $ 151,424 $ 388,133
Asset additionsRental equipment $ 11,794 $ 1,744 $ – $ – $ 13,538Property, plant and equipment 1,289 2,654 4,744 566 9,253Intangible assets 11 187 26 23 247
$ 13,094 $ 4,585 $ 4,770 $ 589 $ 23,038
Asset depreciationRental equipment $ 11,499 $ 3,079 $ – $ – $ 14,578Property, plant and equipment 3,454 3,238 2,099 370 9,161Intangible assets 9 54 667 79 809
$ 14,962 $ 6,371 $ 2,766 $ 449 $ 24,548
27. Operating Segments
The Corporation operates through a network of 109 branch locations in Canada in three core businesses which reflect the internal organization and management structure according to the nature of the products and services provided. The Corporation’s three core businesses are: i) the distribution, modification and servicing of equipment; ii) the distribution, servicing and assembly of power systems; and iii) the distribution, servicing and assembly of industrial components.
Management has exercised judgement in aggregating the Corporation’s Power Systems East and Power Systems West &
Central operating segments together into a single reportable segment, Power Systems. The operating segments are substantially similar in the following characteristics: nature of revenue sources, nature of regulatory environment, products and services (distribution, servicing and assembly of power systems), customer markets, and distribution methods.
Performance is measured based on segment earnings before finance costs and income taxes, as included in the internal management reports that are reviewed by the Corporation’s chief operating decision maker. Information regarding the results of each reportable segment is shown below.

58 WAJAX CORPORATION 2016 ANNUAL REPORT
NOTES TO CONSOLIDATED FINANCIAL STATEMENTS
Power Industrial Segment2015 Equipment Systems Components Eliminations Total
Equipment $ 325,426 $ 82,091 $ – $ – $ 407,517Parts 160,004 129,188 378,501 – 667,693Service 72,974 63,755 11,118 – 147,847Rental and other 43,512 10,042 – (3,303) 50,251
Revenue $ 601,916 $ 285,076 $ 389,619 $ (3,303) $ 1,273,308
Earnings before impairment of goodwill and intangible assets, restructuring costs, finance costs and income taxes $ 38,371 $ 7,820 $ 15,308 $ (10,686) $ 50,813Impairment of goodwill and intangible assets – 13,720 27,500 – 41,220Restructuring costs – 2,060 – – 2,060
Earnings before finance costs and income taxes $ 38,371 $ (7,960) $ (12,192) $ (10,686) $ 7,533Finance costs 12,233Income tax expense 6,315
Net loss $ (11,015)
Segment assets excluding intangible assets $ 324,977 $ 155,603 $ 134,800 $ – $ 615,380Intangible assets 21,549 – 20,127 91 41,767Corporate and other assets – – – 20,321 20,321
Total assets $ 346,526 $ 155,603 $ 154,927 $ 20,412 $ 677,468
Segment liabilities $ 121,701 $ 41,751 $ 56,873 $ – $ 220,325Corporate and other liabilities – – – 168,639 168,639
Total liabilities $ 121,701 $ 41,751 $ 56,873 $ 168,639 $ 388,964
Asset additions Rental equipment $ 20,107 $ 2,845 $ – $ – $ 22,952Property, plant and equipment 2,049 2,540 2,607 97 7,293Intangible assets 7 10 26 101 144
$ 22,163 $ 5,395 $ 2,633 $ 198 $ 30,389
Asset depreciationRental equipment $ 12,236 $ 1,643 $ – $ – $ 13,879Property, plant and equipment 3,754 2,989 2,131 240 9,114Intangible assets 10 252 1,119 90 1,471
$ 16,000 $ 4,884 $ 3,250 $ 330 $ 24,464
Segment eliminations include costs, assets and liabilities related to the corporate office. Corporate office assets and liabilities include deferred financing costs, income taxes, cash and bank indebtedness, bank debt, employee benefits, and dividends payable.
28. Restructuring Costs
On March 1, 2016, the Corporation announced that one of its main objectives for the year would be transitioning from its then present organizational structure, to a leaner and more integrated functional organization. During 2016, the Corporation implemented workforce reductions and role changes to align the organization to the new functional structure. The transition to the new structure was largely completed by the end of 2016 and reporting under the new structure will commence in 2017. The Corporation recorded restructuring costs of $12,500 year to date relating to the strategic reorganization.
29. Acquisition of Business
On April 20, 2016, the Corporation’s Industrial Components segment acquired the assets of Montreal-based Wilson Machine Co. Ltd. (“Wilson”), a North American leader in the manufacturing and repair of precision rotating machinery and gearboxes with annual revenues of approximately $6,000.
Recognized amounts of identifiable assets acquired and liabilities assumed for the acquisition are equal to their fair values, and are as follows:
Trade and other receivables $ 821Inventories 2,300Prepaid expenses 52Property, plant and equipment 3,282Accounts payable and accrued liabilities (890)
Tangible net assets acquired $ 5,565
Consideration paid $ 5,565
30. Insurance Recoveries
The Corporation recorded $3,663 of expected compensation from insurers for business interruption losses, mainly related to the Fort McMurray wildfires in early May 2016. The branch facilities incurred minimal damage and operations resumed in June 2016.
31. Comparative information
Certain comparative information have been reclassified to conform to the current year’s presentation.

WAJAX CORPORATION 2016 ANNUAL REPORT 59
Additional Financial Information
Summary of Quarterly Data – Unaudited
2016 2015
(in millions of dollars, except per share data) Q1 Q2 Q3 Q4 Q1 Q2 Q3 Q4
Revenue $ 285.0 $ 336.6 $ 286.6 $ 313.7 $ 317.2 $ 340.7 $ 290.9 $ 324.4
Net (loss) earnings (9.7) 4.3 7.6 8.9 5.7 9.0 7.5 (33.3)
(Loss) earnings per share – Basic $ (0.49) $ 0.22 $ 0.38 $ 0.45 $ 0.34 $ 0.52 $ 0.38 $ (1.66)
(Loss) earnings per share – Diluted (0.49) 0.21 0.37 0.44 0.34 0.51 0.37 (1.66)
Eleven Year Summary – Unaudited
2016 2015 2014 2013 2012 2011 2010 2009 2008 2007 2006
Operating Results
Revenue* $ 1,221.9 $ 1,273.3 $ 1,451.3 $ 1,428.5 $ 1,466.0 $ 1,377.1 $ 1,110.9 $ 1,007.2 $ 1,213.5 $ 1,192.3 $ 1,206.5
Net earnings (loss)* 11.0 (11.0) 41.2 47.7 65.9 63.8 56.4 34.2 75.8 72.0 71.5
Interest expense 11.2 12.2 13.0 9.0 4.4 4.6 5.2 4.5 4.7 4.9 4.5
Property, plant and equipment expenditures – net 6.5 4.1 5.4 3.9 5.6 5.3 1.7 7.0 7.4 4.0 8.3
Rental equipment expenditures – net 13.5 23.0 23.1 20.0 25.1 20.2 5.8 0.4 7.0 8.6 7.9
Depreciation and amortization 24.5 24.5 22.5 21.6 17.8 13.5 11.2 9.7 9.7 9.9 10.0
Per Share
Net earnings (loss) – Basic* $ 0.55 $ (0.59) $ 2.46 $ 2.85 $ 3.95 $ 3.84 $ 3.39 $ 2.06 $ 4.57 $ 4.34 $ 4.31
Dividends declared 1.00 1.23 2.40 2.68 3.10 2.14 – – – – –
Distributions declared – – – – – – 3.40 2.47 4.13 4.36 4.43
Equity 13.96 14.44 14.82 14.77 14.45 13.69 12.00 12.07 12.40 11.94 11.89
Financial Position
Working capital* $ 265.9 $ 302.7 $ 258.2 $ 272.7 $ 230.1 $ 167.0 $ 77.9 $ 160.1 $ 198.8 $ 147.4 $ 147.8
Rental equipment 58.1 64.1 59.4 52.3 43.7 28.1 15.8 16.4 21.8 21.7 18.9
Property, plant and equipment – net 45.7 46.2 48.7 49.7 50.7 47.9 43.3 36.2 33.6 29.5 33.3
Long-term debt excluding current portion 122.0 151.6 180.9 195.9 151.7 59.0 – 79.5 116.2 53.9 59.0
Shareholders’ equity 276.8 288.5 248.5 247.2 241.9 227.6 199.3 200.4 205.7 198.1 197.2
Total assets* 664.9 677.5 723.6 682.1 671.9 589.9 522.5 448.2 529.6 468.2 500.6
Other Information
Number of employees 2,318 2,609 2,725 2,766 2,833 2,738 2,382 2,291 2,662 2,551 2,566
Shares outstanding (000s) 19,826 19,986 16,779 16,744 16,736 16,629 16,629 16,603 16,585 16,585 16,585
Price range of shares
High $ 25.76 $ 30.93 $ 39.56 $ 46.24 $ 53.43 $ 44.94 $ 38.50 $ 23.40 $ 35.75 $ 37.95 $ 47.00
Low 13.34 14.81 28.75 29.38 38.59 27.80 21.65 10.95 14.00 24.80 24.60
* 2006 and 2005 exclude discontinued operations.

Directors
Paul E. Gagné Chairman, Wajax Corporation Corporate Director
Thomas M. Alford 2, 3 Corporate Director
Edward M. Barrett 1, 2 Chairman and Co-Chief Executive Officer, Barrett Corporation
Ian A. Bourne 1 Corporate Director
Douglas A. Carty 1, 3 Corporate Director and Chairman and Co-Founder of Switzer-Carty Transportation Inc.
Sylvia D. Chrominska 1, 2 Corporate Director
Robert P. Dexter, q.c. 2, 3 Chairman and Chief Executive Officer, Maritime Travel Inc.
John C. Eby 1, 3 Corporate Director and a Founder and the President of Developing Scholars
A. Mark Foote President and Chief Executive Officer, Wajax Corporation
Alexander S. Taylor 2, 3 President, Power Group, SNC-Lavalin
1 Member of the Audit Committee 2 Member of the Human Resources and
Compensation Committee
3 Member of the Governance Committee
Honourary Director
H. Gordon MacNeill
Officers
A. Mark Foote President and Chief Executive Officer
Darren Yaworsky Senior Vice President, Finance and Chief Financial Officer
Steve C. Deck Senior Vice President, Business Development
Thomas Plain Senior Vice President, Service Operations
Michael Gross Senior Vice President, Power and Marine
Stuart H. Auld Senior Vice President, Human Resources and Information Systems
Donna Baratto Vice President, Supply Chain
Cristian Rodriguez Vice President, Environment, Health and Safety
Linda J. Corbett Treasurer
Andrew W. H. Tam General Counsel and Corporate Secretary
Home Office
2250 Argentia Road Mississauga, ON L5N 6A5 Telephone: (905) 212-3300
Fax: (905) 212-3350
Shareholder Information
Transfer Agent and Registrar
For information relating to shareholdings, dividends, lost certificates, changes of address or estate transfers, please contact our transfer agent:
Computershare Investor Services Inc. 100 University Avenue, 8th Floor Toronto, ON M5J 2Y1 Telephone: (514) 263-9200 or
1-800-564-6253 Fax: 1-888-453-0330
Web: www.investorcentre.com/service
AuditorsKPMG LLP
Exchange ListingToronto Stock Exchange
Symbol WJX
Wajax Corporation Share Trading Information(January 1 – December 31, 2016)
Volume of Shares Open High Low Close Traded
$16.77 $25.76 $13.34 $23.06 10,760,974
Quarterly Earnings ReportsQuarterly earnings for 2017 are anticipated to be announced on May 2, August 11 and November 7, 2017 and March 6, 2018.
2017 Dividend DatesQuarterly dividends are payable to shareholders of record on the 15th day of the last month in each quarter and will generally be paid in the first week of the following month.
Investor InformationDarren Yaworsky Senior Vice President, Finance and Chief Financial Officer Telephone: (905) 212-3300
Fax: (905) 212-3350E-mail: [email protected]
To obtain a delayed share quote, read news releases, listen to the latest analysts’ conference call, and stay abreast of other Corporation news, visit our website at www.wajax.com.
Annual MeetingShareholders are invited to attend the Annual Meeting of Wajax Corporation, to be held at the Sheraton Gateway Hotel, Toronto International Airport, Toronto, Ontario, on Tuesday, May 2, 2017, at 11:00 a.m.
Vous pouvez obtenir la version française de ce rapport en écrivant à la Secrétaire, Corporation Wajax, 2250 Argentia Road, Mississauga, (ON) L5N 6A5
Corporate Information
60 WAJAX CORPORATION 2016 ANNUAL REPORT tenm
ay.c
om

Fort St. John, BCKamloops, BCLangley, BCNanaimo, BCPrince George, BC (2)Sparwood, BCSurrey, BC
Blackfalds, ABCalgary, AB (3)Clairmont, ABEdmonton, AB (4)Fort MacKay, ABFort McMurray, AB (2)Grande Prairie, ABNisku, ABRed Deer, ABRedcliff, AB
Regina, SK (2)Saskatoon, SK (3)
Flin Flon, MBThompson, MBWinnipeg, MB (3)
Yellowknife, NT
Belleville, ON (2)Concord, ONCornwall, ONEspanola, ON Guelph, ONHamilton, ONKapuskasing, ONKitchener, ON London, ON (2)Mississauga, ON (3)Niagara Falls, ONOttawa, ON (3)Pembroke, ONSault Ste. Marie, ON Stoney Creek, ON (2)Sudbury, ON (3)Thunder Bay, ON (4)Timmins, ON (2)Toronto, ONWindsor, ON
Chambly, QCChicoutimi, QCDorval, QCDrummondville, QC (2)Granby, QCLachine, QCLasalle, QCLaval, QC (2)Longueuil, QCNoranda, QCQuébec City, QC (3)Rimouski, QCSept-Iles, QCSherbrooke, QCSt-Félicien, QCTemiscaming, QCTracy, QC Trois-Rivières, QCVal d’Or, QC (2)Valleyfield, QCVille d’Anjou, QC
Bathurst, NB Edmundston, NBMoncton, NB (2)
Charlottetown, PEI
Dartmouth, NS (3)Port Hawkesbury, NSStellarton, NS
Corner Brook, NLMount Pearl, NL (2)Pasadena, NLWabush, NL
Western Canada (35) Ontario (33) Eastern Canada (41)
Branch Locations
Photo Credits
Cover Page: Danny Grant, Technician. Lasalle, Quebec
Page 6: Mark Foote, President and CEO. Mississauga, Ontario
Page 7: (left to right) Martin Deschênes, Program Manager, Rick Byers, Manager, Fluid Handling, John Kupka, Director, Bearings and Power Transmission, Donald Charbonneau, Manager, Safety and Mill Supplies, Justin Warren, Vice President, Industrial. Lachine, Quebec
Page 11: Jorge Patrocinio, Master Gear Technician. Lasalle, Quebec
Page 12: George (Aima) Aimalohi, Richard Atkinson, Yusuff Bamigbade, Cara Brant, Jeff Chan, Shawn Cusack, Lyle Dorie, Kyle Fairman, Danny Fellingham, Rounuel Florendo, Ivan Ford, Bryan Hart, Kimberly House, Robert Janes, James Nelson, Barry Scheideman, Lee Seokdong, Colin Welby, Lawrence Wheeler, Kim Yunsuk. Fort McMurray, Alberta
Page 13: Reggie Bodoosingh, Material Handling Technician. Mississauga, Ontario
Page 16: Terrence Adu-Waife, Construction Technician. Mississauga, Ontario
Back Cover: (left to right) Michel Gignac, Mechanic, Marc-André Barbeau, Welder Machinist, Marc-André Pelletier, Mechanic, Julien Landry, Assistant Engineering, Jason Martel, Application Engineer, François Morrisson, Mechanic. Quebec City, Quebec

WAJAX.COM
2250 Argentia RoadMississauga, ON L5N 6A5Telephone: (905) 212-3300Fax: (905) 212-3350wajax.com