online news platforms
TRANSCRIPT

ComEx: Comment Exploration onOnline News PlatformsJulian Rischa,b, Tim Repkea,b, Lasse Kohlmeyera and Ralf Krestela
aHasso Plattner Institute, University of Potsdam, GermanybBoth authors contributed equally.
AbstractThe comment sections of online news platforms have shaped the way in which people express their opinion online. However,due to the overwhelming number of comments, no in-depth discussions emerge. To foster more interactive and engagingdiscussions, we propose our ComEx interface for the exploration of reader comments on online news platforms. Potentialdiscussion participants can get a quick overview and are not discouraged by an abundance of comments. It is our goal torepresent the discussion in a graph of comments that can be used in an interactive user interface for exploration. To thisend, a processing pipeline fetches comments from several different platforms and adds edges in the graph based on topicalsimilarity or meta-data and ranks nodes on metrics such as controversy or toxicity. By interacting with the graph, users canexplore and react to single comments or entire threads they are interested in.
KeywordsOnline Discussions, Discourse Mining, Corpus Visualization
1. IntroductionIn the past, newspaper readers could only interact withand express their opinion on an article by writing aletter to the editor. The editor could then decide topublish and/or to reply to the letter in the next issueof the newspaper. The considerable effort of writingand mailing such letters, was a natural limiting factorfor the number of interactions. Now, users of onlinenews platforms can easily post comments and discussarticle topics with others. The simplicity and ubiquityof expressing one’s opinion online was therefore termedas democratization of opinion. On the downside, readerscan be overwhelmed by the volume of comments. Re-peated arguments, Troll comments, or attention-seekingunrelated opinions hinder the emergence of meaningfuldiscussions. Long discussions across multiple pages maydiscourage readers from scrolling through more than thetop ten comments.
We envision a platform that focuses on providing aspace for discussions where people listen to and referto each other’s comments. To this end, we part from atraditional “linear” list to a two-dimensional canvas thatgroups comments using different features for a betteroverview. This allows for new interaction paradigmsthat could inspire readers of news comments to engagein an already ongoing discussion.
Joint Proceedings of the ACM IUI 2021 Workshops, April 13-17, 2021,College Station, USA" [email protected] (J. Risch); [email protected] (T. Repke);[email protected] (R. Krestel)� 0000-0001-9661-6325 (T. Repke); 0000-0002-5036-8589(R. Krestel)
© 2021 Copyright for this paper by its authors. Use permitted under CreativeCommons License Attribution 4.0 International (CC BY 4.0).
CEURWorkshopProceedings
http://ceur-ws.orgISSN 1613-0073 CEUR Workshop Proceedings (CEUR-WS.org)
In this paper, we present ComEx, a platform forvisualizing of and interacting with online discussions.We present a novel concept of stipulating engagementthrough improved information visualization. In thisregard, we identified three components that are crucialto reach this goal:
1. More engagement: more users who were passivein the past should become active contributors indiscussions.
2. More in-depth: more comments should refer toone another and more dialogues should emerge.
3. More insights: users should read more relevantand less redundant or off-topic comments.
Besides these user-centered aspects, technical aspectsare also currently preventing a better user experience.Online discussion spaces are fragmented across variousindividual platforms. Although the topics discussed aretypically similar, e.g. daily news events. We are the firstto introduce the idea of a common, shared discussionplatform with the goal of increasing engagement ofdiscussion participants and facilitating interaction. Tothis end, we present a novel interface for exploringlarge amounts of reader comments across different newsplatforms. The core of the visualization is based ona graph representation of comments, where nodes aresentences and edges describe how they relate to oneanother. This graph allows us to incorporate severalviews on the data and enrich the comments with syntacticand semantic features, such as topical similarity ortemporal proximity. It is our goal, to find a graphrepresentation that captures arguments and the evolutionof the discourse. By clustering, filtering, and merging,
the interface enables users to reduce the complexity byexploring the comments at different levels or granularity.
The following sections provide an overview of the sys-tem architecture of ComEx and describe the visualizationparadigms behind it. Furthermore, we discuss our workin progress towards a meaningful graph representationand showcase initial results applied in a case study onreader comments about bushfires in Australia.1
2. Related WorkIn this section, we discuss related work on visualizationsof written discourse and relevant text mining methods.The goal for our interactive visualization is to formvisual clusters of comments that make it easy to com-prehend the inherent semantic structure of a large set ofcomments. To achieve this goal, the underlying layoutmodel reflects not only the structural information, e.g.,sentences belonging to the same comment, but also thekey topics and arguments made. Appropriately mappingthe nuances of a discussion, the size of the dataset, andthe text lengths pose as hard problems for languagemodels. Attempts using topic models have been made tovisualize political speeches [1] as moving particles or textcollections as glyphs symbolizing topic distributions [2].Others use document embeddings and dimensionalityreduction to create a partial map of Wikipedia articles [3]or scatterplots of forum posts [4]. Both examples arenot applicable here, as they rely on a large, manuallylabeled dataset. We propose to use pre-trained sentenceembeddings. All comments of one story are clusteredinto key discussion points. The layout within each clusteris done using attracting and repelling forces betweenparticles based on sentiment or keywords. Thereby, webenefit from sentence embeddings to get a global layoutand achieve a nuanced local layout by using mined meta-data (clusters, keywords, sentiment, etc.).
Related work in the area of text mining forms clustersof comments mentioning the same entities [5] or andvisualizes discussions with pie charts [6] or topic-model-based graphs [7]. Zhang et al. [8] focus on summarizingsocial media posts to provide aggregates of all reposts andreplies in a conversation. They form pseudo-documentsas context used in an encoder of a recurrent neural net-work from which the summary is generated. Leveragingsentiment analysis and stance detection, there is alsorelated work on allowing users to search for diverseperspectives on the same topic [9, 10]. In their analysisof millions of comments, Ambroselli et al. [11] identifiedthree main causes for increased user engagement: reac-tions to personal stories, hate speech, or comments bythe article’s author. Our system allows integrating such
1Interactive demo and code available at https://hpi.de/naumann/s/comex
Comment
Metadata
Clustering & Classification
Edge Discovery
2
• Comment text, user
• Votes, replies, timestamp
4
5
1
• Semantic (textual, …) • Syntactic (temporal, …)
3
Filtering & Merging
• Emphasize latent structure
• Semantic clustering• Toxicity classification• Engagement prediction• Ranking
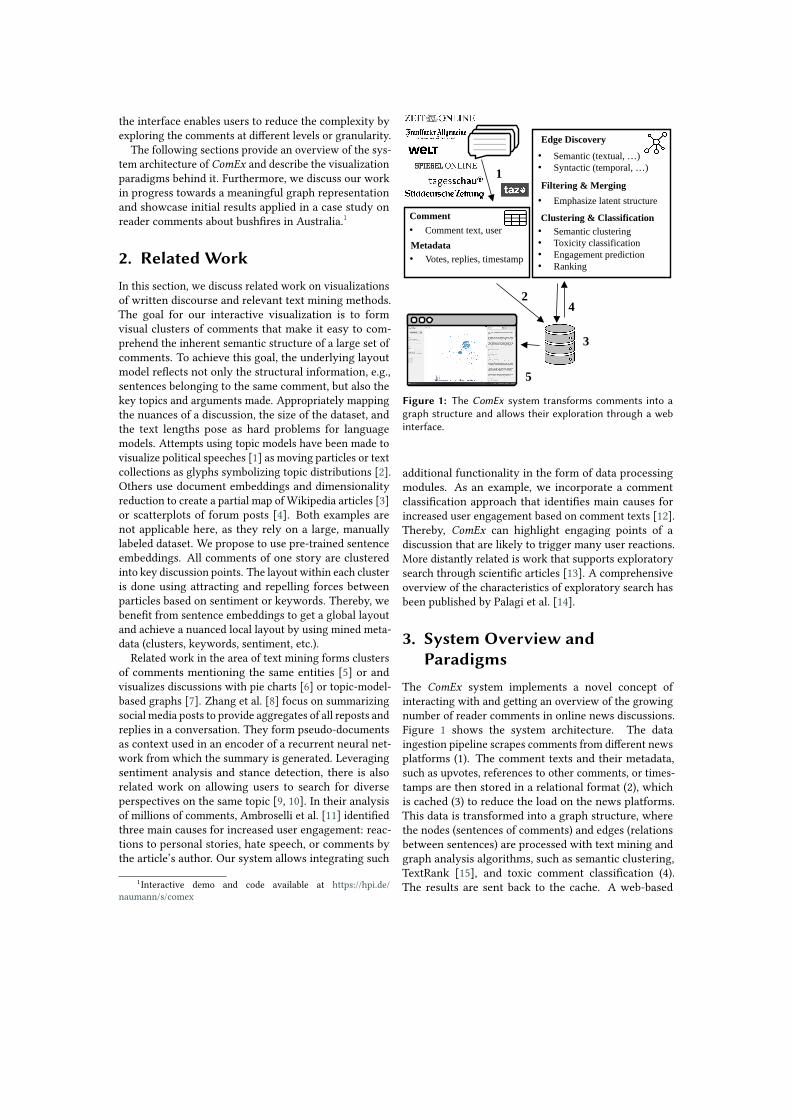
Figure 1: The ComEx system transforms comments into agraph structure and allows their exploration through a webinterface.
additional functionality in the form of data processingmodules. As an example, we incorporate a commentclassification approach that identifies main causes forincreased user engagement based on comment texts [12].Thereby, ComEx can highlight engaging points of adiscussion that are likely to trigger many user reactions.More distantly related is work that supports exploratorysearch through scientific articles [13]. A comprehensiveoverview of the characteristics of exploratory search hasbeen published by Palagi et al. [14].
3. System Overview andParadigms
The ComEx system implements a novel concept ofinteracting with and getting an overview of the growingnumber of reader comments in online news discussions.Figure 1 shows the system architecture. The dataingestion pipeline scrapes comments from different newsplatforms (1). The comment texts and their metadata,such as upvotes, references to other comments, or times-tamps are then stored in a relational format (2), whichis cached (3) to reduce the load on the news platforms.This data is transformed into a graph structure, wherethe nodes (sentences of comments) and edges (relationsbetween sentences) are processed with text mining andgraph analysis algorithms, such as semantic clustering,TextRank [15], and toxic comment classification (4).The results are sent back to the cache. A web-based

user interface allows exploring the enriched graph atdifferent levels of detail (5). The architecture of thesystem is designed in such a way, that text and graphprocessing modules are interchangeable and can easilybe configured. More details on that are highlighted inthe following section. The representation model andpipeline can be used programmatically for experimentsor other applications. In the scope of our system, thedata is accessed through a highly customizable API byour interactive frontend.
We enrich our graph representation through textmining and graph analysis beyond the comment meta-data. These steps of analysis and aggregation come withloss of details, which has to be balanced with the benefitsof a better overview. Although we refer to the commentson online news platforms as a discussion or discourse,many statements and arguments are frequently repeatedby different users without referring to an already existingcomment. Our graph representation helps to identify andvisualize these inherent semantic clusters of comments.
In the most simplified view, the graph representationis used to draw particles on a two-dimensional can-vas.Hereby, the comment positions reflect semantic simi-larity and cluster affiliation. To convey more additionalinformation, particles can be drawn as glyphs or vary insize or color. The canvas can be enriched by overlays ofcluster contours, heat maps, and explanatory keyphrases.
We embed comment threads originating from multiplenews platforms in the same space, thus merging topicallyrelated discussions from various articles. In this way,we provide a global view and increase the diversity ofrepresented opinions following our three key goals. Thesummarizing visualization aims for more engagement,reducing potential bias in discussions by having a broadergroup of contributors and novel playful ways of inter-action, such as reacting to clusters of comments. Weanticipate a larger number of replies in general anddeeper threads, which means more in-depth replies. Ifa user receives a reply to his or her comment, this replyis an acknowledgment for the user and demonstratesthat the comment is relevant to others. Readers shouldbe able to easily navigate to comments that are mostinteresting to them, as reading every single commentbecomes infeasible for popular articles. Our interactivevisualization condenses long discussions into groups ofsimilar comments for more insights. In this way, weare still able to show all contributed comments, whileusers can make an informed decision on which subsetof comments to actually read. This overview could alsogive information on different viewpoints, such as howmany commentators share a particular point of view. Byretaining data provenance information, users are able toswitch back and forth between the generalized overviewand the underlying data for more details. Further, thesystem includes a full-text search and time or lasso
selection in the interface to filter the list of comments.Afterwards, users can jump back to the original platformto comment, or react to a selection of comments directlyin the visualization.
4. Graph Representation ofReader Comments
The processing pipeline transforms the tabular commentdata retrieved by the scrapers into a graph and furtherenriches the information it contains. Each comment maycontain more than one main semantic aspect, such asdifferent arguments or responses to other comments.Thus, we heuristically assume sentences to be the small-est “atomic” semantic unit of a comment. Each sentenceis added as a node in the graph representation of adiscussion. By adding edges between sentences of thesame comment, we are able to maintain data provenancealong with meta-data about the original content. In thissection, we discuss possible data mining methods toenrich the graph representation.
The first step is the discovery of relations betweensentences and adding edges to represent these relations.Second, we assign class labels and scores to the nodesand edges. This allows us to rank and cluster them basedon these assignments. Finally, the number of nodes andedges is reduced by filtering or merging them to providea comprehensible entry point. Note, that edges of thegraph are only the basis to internally represent readercomments and the layout. Edges won’t be directly visiblein the interface to reduce visual clutter.
Edge Discovery. Our approach builds on ideas byBarker and Gaizauskas [16], who represent arguments incomments (assertions or viewpoints) in a graph. Giventhis graph, they generate textual summaries of an entirediscussion. In contrast to their laborious process ofmanually constructing the nodes and edges, we generatethem automatically and present them in an interactivevisualization. To this end, we construct a networkof sentences as nodes adding edges if their pairwisesemantic similarity is above a certain threshold. Thissimilarity is the cosine similarity of the sentence em-bedding vectors calculated with fastText [17]. Syntacticedges are added between all sentences that belong tothe same comment and also to its replies. Thereby,structural information of the comments and the discourseis incorporated. The resulting network is drawn using aforce-based layout algorithm. Edges are hidden for theuser, so that the comment landscape only shows clustersof points representing sentences. Since we include bothsemantic and syntactic edges, the layout can providean overview of the key topics of the discussion, whileprevailing its overall structure.

Clustering and Classification. On the node level,the TextRank algorithm [15] ranks sentences and assignsweights to identify key statements, which we assumeto be strongly connected and to form similarity commu-nities. The clustering progressively removes edges andthereby conforms to our idea of reducing the discussionto its most essential statements for a comprehensibleoverview. Further, a neural network model detectstoxic comments, such as insults or threats, which arecomments that make other users leave a discussion [18].Another neural network model from related work [12]detects engaging comments, such as questions or factualstatements, which are likely to receive many reactionsby other users.
Filtering andMerging. The class labels generated bythe two neural networks are used to put more visualemphasis on the engaging comments than on the toxiccomments. Nodes with a small number of edges representsentences that are only loosely connected. In a simplifiedview, these nodes are either filtered completely or mergedwith a neighbored node. Nodes for sentences with almostsimilar embeddings are grouped together.
5. User InterfaceThe ComEx user interface is structured into three maincomponents: the news outlet selection, the interactivegraph, and the detailed comment view (Figure 2).
News Outlet Selection. The panel on the left-handside of the interface allows selecting a set of readerdiscussions on articles from different news outlets. Thereare presets of news stories that were covered by manyplatforms but users are free to select (the comments of)any news article that is published on one of the sevenplatforms currently supported. Users can add an articleby simply pasting its URL. Comments on this article arethen retrieved by our server and merged with previouslyselected comments to construct a graph representation.Mckay et al. [19] suggested to build systems that supportusers in reflecting on their own view by comparing it withdiverse views of others. By incorporating comments frommany different news outlets, we implement this designidea in the context of online discussions.
Interactive Graph. In the center of the interface is thegraph layout of all the comments. Note that the edges ofthe underlying graph are used only by the force-layoutand are not shown for simplicity. This visualizationenables users to interact with single keyphrases oflonger comments or with multiple comments at once
— instead of only appending a reply to an existing list.2
Additionally, they can rearrange or filter the nodes andnavigate the canvas by zooming and panning. Whenusing a lasso to select nodes, comments on the rightpanel are automatically filtered. By selecting an intervalon the time histogram at the bottom, additional filtersare applied. As stated before, nodes in the graph areindividual sentences of comments. By clicking a node, allother nodes belonging to the comment are highlightedand the comment is shown in the right panel. Once a lassoselection is active, users can vote up or down on multiplecomments to signal their agreement or disagreement.The fill color of the nodes is updated to convey areasof predominantly positive or negative sentiment. Thesize of nodes can be determined by multiple factors.In Figure 2 the TextRank score is used, but the votesor number of replies on the originating platform hassimilar effects. Sliding a selection window over the timehistogram shows how the discussion evolves over time.For example, it reveals which topics came up early in thecourse of the discussion.
Detailed Comment View. The panel on the right-hand side lists the comment texts where the text ofthe currently selected comment is highlighted. With asearch bar, users can quickly find comments that mentionkeywords they are interested in. At the top of the panelare also parameter controls to adjust the number of nodesand edges displayed. This view is also updated by filtersapplied to the interactive graph.
Additional Possibilities. In this section, we de-scribed features of the interface we thought to be es-sential for exploring the comment landscape. All thesefeatures are implemented in a prototype system. Furtherfeatures could be added to enable users to analyze thedata in more depth. The underlying graph representationof reader comments provides the basis for additionalcapabilities. As the graph implicitly maintains dataprovenance, tools for filtering comments based on meta-data is possible at all times. Furthermore, the informationcould also be used to control the shape, color, or size ofthe visualized nodes. For example, a user might want tocolor all nodes based on the news outlet the respectivecomments were extracted from.
6. Case StudyA meaningful, thorough evaluation of the proposedconcepts and platform requires many active users anda sophisticated experimental setup. Such an evaluation
2In the context of our demo, the effects of voting on or replyingto one or multiple comments are not transmitted back to the newsplatforms.

“These fires are not the result of climate change!
They were set on purpose! [...]”
“I am not aware of any statisticsthat the periods of drouts areincreasing, otherwise it would
be mentioned in IPCC reports. [...]”
Search...
E
A
F
G
B
D
H
C2
C1
Figure 2: ComEx user interface; Users select news articles (E), comments are visualized in the center and can be filtered bytime (F) or search terms (B); different modes are available (A), such as exploration by zooming, panning and reading a selectedcomment (H) by clicking nodes, or users can lasso-select and express their sentiment on groups of comments (D), nodes arecolored based on average sentiment and greyed out when filtered (G). Two example comments (C1, C2) are shown.
Table 1The interaction features of comment sections of online news platforms in our study are limited to upvotes, downvotes, andreplies as well as ranking comments by time or popularity with regard to the number of received upvotes or replies. Theselimitations motivate our research on an interactive user interface for comment exploration.
Ranking byPlatform Upvotes Downvotes Replies Time Votes Replies
Frankfurter Allg. Zeitung ✓ – ✓ ✓ ✓ –Spiegel Online ✓ ✓ ✓ ✓ ✓ ✓Süddeutsche Zeitung ✓ ✓ ✓ ✓ ✓ –Tagesschau – – ✓ ✓ – –Die Welt ✓ – ✓ ✓ ✓ –Die Tageszeitung – – ✓ ✓ – –Zeit Online ✓ – ✓ ✓ ✓ –
is beyond the scope of this paper and deferred to futurework. Nevertheless, we conducted a small-scale casestudy to validate the presented ideas.
The system described in this paper was designedfor the purpose of visualizing comments from differentplatforms on a single topic. We therefore use the notion
of a news story, which is covered by several news articleson the same emerging news event.
Our initial findings are based on hand-selected newsstories of seven different German news platforms: faz.net,tagesschau.de, spiegel.de, sz.de, taz.de, welt.de and zeit.de.Each day between November 2019 and February 2020, we

manually selected the most prevalent news stories. Foreach story, the annotators manually collected respectivearticles from the previously mentioned news platforms.The resulting dataset comprises 150 news stories and1,350 news articles. Only 570 of these articles havepublicly available reader comments, which we retrievedprogrammatically. In total, we retrieved 111,000 com-ments and the average comment length is 45 tokens. Togive an example, one of the most discussed stories inthis dataset contains 4,696 comments and is covered by4 news platforms. It is about the UN Climate ChangeConference held in Madrid, 2019.
The interaction features of the seven popular German-language news outlets we selected are limited to com-ment replies, upvotes, and downvotes as well as rankingby time or number of votes or replies (summarized inTable 1). ComEx, on the other hand, could drasticallychange how users interact with online comments. Itprovides a feature-rich exploration interface for a globaloverview of comments from across multiple onlinenews platforms. Going through the processing pipelineby hand, the annotators printed all comments of twoexemplary stories and collaboratively assigned semanticgroups similar to the argument graph described by Barkerand Gaizauskas [16]. Our manual results in generalconfirmed the graph layout automatically generated byComEx.
Figure 2 shows the interface for four articles onAustralian wildfires in 2020 with 413 reader comments.If a user wants to add additional news articles, shecan add a URL on the left pane (E). The ComEx sys-tem will then extract comments from the website inthe background, update the comment graph and thevisualization in the center pane. In the displayed usecase, we opted to visualize topical similarity leading toclusters of topically similar comments. The cluster at thetop contains comments (C1) discussing climate change,while another cluster of comments (C2) on the bottomprimarily concerns droughts. The timeline at the bottomindicates the date the comments were published. Byselecting a time-window (F), comments can be filtered.Comment outside the selected window are greyed outin the visualization and removed from the commentpane (H). Users may also filter comments using full-textsearch (B). There are two modes (A) in which the usercan interact with the data displayed in the center pane.The first mode supports exploration, including zoomingand panning the visualization. Furthermore, clicking anode in the visualization highlights the correspondingcomment in the comment pane (H) and vice versa. Thesecond mode supports engagement, by providing a lassotool to select several comments at once. Users can thenexpress their sentiment by voting up or down. We storethis information and use color (G) to indicate the averagesentiment of all votes from negative (red), neutral (blue),
to positive (green).With this case study we have shown the novel way
our ComEx system enables users to interact with readercomments. More evaluation is necessary to validate theuser-centered aspects of being more engaging and morein-depth, and providing more insights.
7. Conclusions and Future WorkTo improve the way people exchange ideas online andto foster in-depth discussions, we studied the noveltask of comment exploration for users of online newsplatforms. Previous work on conversation or discourseexploration developed analytics tools for experts. Incontrast, we focused on letting comment readers andcomment writers interact with the exploration tool. Tothis end, we presented ComEx, a comment explorationsystem that implements different methodologies for theinteractive analysis and visualization of comments inonline discussions.
A promising path for future work is to study theimpact of novel visualization and exploration methodson online discussions. One exemplary research questionin this context would be how visualizations could helpto establish a higher conversion rate of comment readersinto comment writers. Potential next steps are to conductuser studies to evaluate our prototype and identifyinteraction patterns. The presented system is not limitedto the news comments use case, but can be employed inall kinds of scenarios where user-generated content canbe linked to each other.
Although some examples we looked at in depthshowed initially promising results, we see room for im-provement and potential for future work in the construc-tion and filtering of the underlying graph representation.Our modular architecture for node enrichment and edgegeneration and filtering allows for a simple configurationof the pipeline. One of the major challenges is to limitthe number of generated edges, e.g., by introducinglocality-sensitive thresholds for similarity-based edges,such as those based on sentence embedding distances.The visualization uses a force-based layout algorithm.We experimented with several approaches to incorporateweighted aggregates of edge weights produced fromdifferent sources, i.e., for combining cluster assignment,embedding similarity, temporal proximity, and replystructure. Finding a robust and ideally self-adjustingapproach remains a task for future work. Furthermore,we found, that a keyword overlay to briefly describe the“meaning” of a visual neighborhood could be a usefuladdition to the interface.

References[1] M. El-Assady, V. Gold, C. Acevedo, C. Collins,
D. Keim, Contovi: Multi-party conversation explo-ration using topic-space views, Computer GraphicsForum 35 (2016) 431–440.
[2] P. Riehmann, D. Kiesel, M. Kohlhaas, B. Froehlich,Visualizing a thinker’s life, Transactions on Visual-ization and Computer Graphics (TVCG) 25 (2018)1803–1816.
[3] S. Sen, A. B. Swoap, Q. Li, B. Boatman, I. Dippenaar,R. Gold, M. Ngo, S. Pujol, B. Jackson, B. Hecht, Car-tograph: Unlocking spatial visualization throughsemantic enhancement, in: Proceedings of theConference on Intelligent User Interfaces (IUI),ACM, 2017, pp. 179–190.
[4] J. Peltonen, Z. Lin, K. Järvelin, J. Nummenmaa, Pi-hvi: Online forum posting analysis with interactivehierarchical visualization, in: Proceedings of theWorkshop on Exploratory Search and InteractiveData Analytics (ESIDA@IUI), CEUR-WS, 2018.
[5] R. E. Prasojo, M. Kacimi, W. Nutt, Entity andaspect extraction for organizing news comments,in: Proceedings of the Conference on Informationand Knowledge Management (CIKM), ACM, 2015,pp. 233–242.
[6] A. Funk, A. Aker, E. Barker, M. L. Paramita,M. Hepple, R. Gaizauskas, The sensei overview ofnewspaper readers’ comments, in: Proceedings ofthe European Conference on Information Retrieval(ECIR), Springer, 2017, pp. 758–761.
[7] A. Aker, E. Kurtic, A. Balamurali, M. Paramita,E. Barker, M. Hepple, R. Gaizauskas, A graph-basedapproach to topic clustering for online comments tonews, in: Proceedings of the European Conferenceon Information Retrieval (ECIR), Springer, 2016, pp.15–29.
[8] Y. Zhang, J. Li, Y. Song, C. Zhang, Encoding conver-sation context for neural keyphrase extraction frommicroblog posts, in: Proceedings of the Conferenceof the Association for Computational Linguistics(NAACL), ACL, 2018, pp. 1676–1686.
[9] C. Harris, Searching for diverse perspectives innews articles: Using an lstm network to classifysentiment, in: Proceedings of the Workshop onExploratory Search and Interactive Data Analytics(ESIDA@IUI), 2018.
[10] K. Kucher, R. M. Martins, C. Paradis, A. Kerren,Stancevis prime: visual analysis of sentiment andstance in social media texts, Journal of Visualization23 (2020) 1015–1034.
[11] C. Ambroselli, J. Risch, R. Krestel, A. Loos, Predic-tion for the newsroom: Which articles will get themost comments?, in: Proceedings of the Conferenceof the Association for Computational Linguistics
(NAACL), ACL, 2018, pp. 193–199.[12] J. Risch, R. Krestel, Top comment or flop comment?
predicting and explaining user engagement inonline news discussions, in: Proceedings of theInternational Conference on Web and Social Media(ICWSM), AAAI, 2020, pp. 579–589.
[13] Y. Nedumov, A. Babichev, I. Mashonsky, N. Semina,Scinoon: Exploratory search system for scientificgroups, in: Proceedings of the Workshop onExploratory Search and Interactive Data Analytics(ESIDA@IUI), 2019.
[14] E. Palagi, F. Gandon, A. Giboin, R. Troncy, Asurvey of definitions and models of exploratorysearch, in: Proceedings of the Workshop onExploratory Search and Interactive Data Analytics(ESIDA@IUI), 2017, pp. 3–8.
[15] R. Mihalcea, P. Tarau, Textrank: Bringing orderinto text, in: Proceedings of the Conference onEmpirical Methods in Natural Language Processing(EMNLP, 2004, pp. 404–411.
[16] E. Barker, R. J. Gaizauskas, Summarizing multi-party argumentative conversations in reader com-ment on news, in: Proceedings of the AnnualMeeting of the Association for ComputationalLinguistics (ACL), ACL, 2016, pp. 12–20.
[17] P. Bojanowski, E. Grave, A. Joulin, T. Mikolov,Enriching word vectors with subword information,Transactions of the Association for ComputationalLinguistics (TACL) 5 (2017) 135–146.
[18] J. Risch, R. Krestel, Bagging BERT models forrobust aggression identification, in: Proceedingsof the Workshop on Trolling, Aggression andCyberbullying (TRAC@LREC), European LanguageResources Association (ELRA), 2020, pp. 55–61.
[19] D. Mckay, S. Makri, M. Gutierrez-Lopez, A. MacFar-lane, S. Missaoui, C. Porlezza, G. Cooper, We arethe change that we seek: Information interactionsduring a change of viewpoint, in: Proceedings ofthe Conference on Human Information Interactionand Retrieval (CHIIR), ACM, 2020, p. 173–182.