online resources: key features k–12 student … · sources are color coded for relative...
TRANSCRIPT
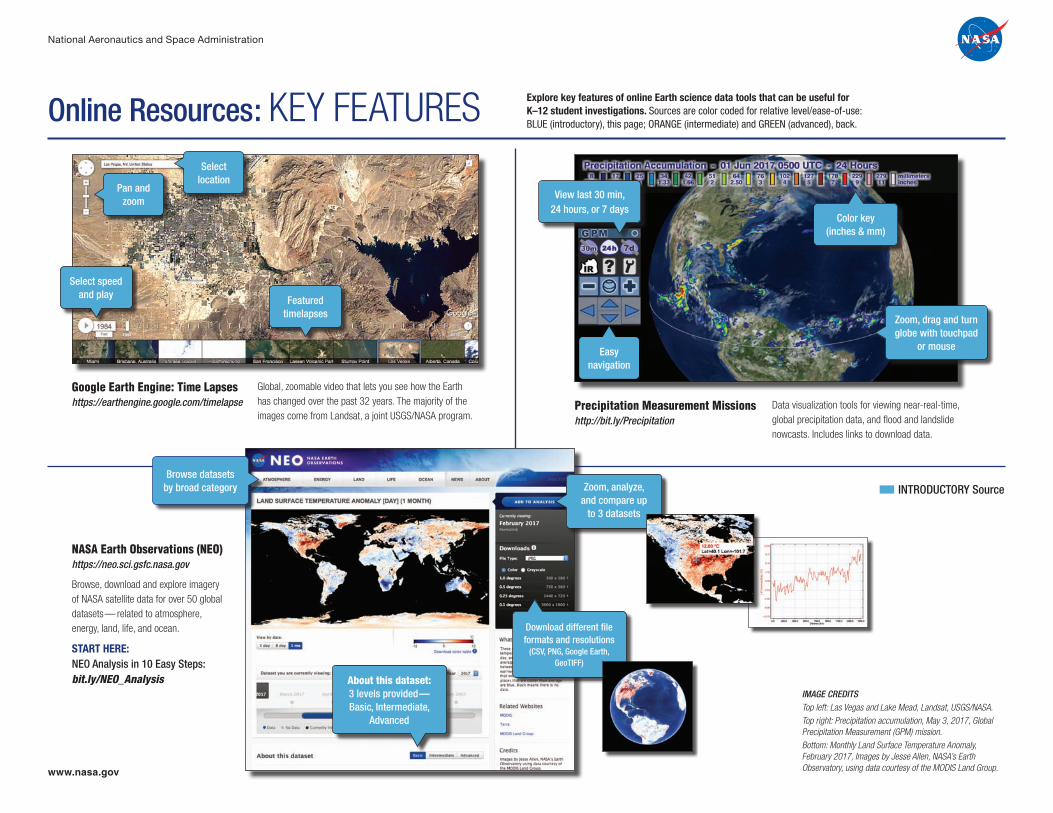
Online Resources: KEY FEATURES Explore key features of online Earth science data tools that can be useful for K–12 student investigations. Sources are color coded for relative level/ease-of-use: BLUE (introductory), this page; ORANGE (intermediate) and GREEN (advanced), back.
National Aeronautics and Space Administration
Google Earth Engine: Time Lapseshttps://earthengine.google.com/timelapse Precipitation Measurement Missions
http://bit.ly/Precipitation
NASA Earth Observations (NEO)https://neo.sci.gsfc.nasa.gov
Browse, download and explore imagery of NASA satellite data for over 50 global datasets— related to atmosphere, energy, land, life, and ocean.
START HERE: NEO Analysis in 10 Easy Steps:bit.ly/NEO_Analysis
Global, zoomable video that lets you see how the Earth has changed over the past 32 years. The majority of the images come from Landsat, a joint USGS/NASA program.
Data visualization tools for viewing near-real-time, global precipitation data, and flood and landslide nowcasts. Includes links to download data.
n INTRODUCTORY Source
www.nasa.gov
Select location
Pan and zoom
Select speed and play Featured
timelapses
Easy navigation
Color key (inches & mm)
View last 30 min, 24 hours, or 7 days
Zoom, drag and turn globe with touchpad
or mouse
Zoom, analyze, and compare up
to 3 datasets
About this dataset: 3 levels provided—Basic, Intermediate,
Advanced
Download different file formats and resolutions
(CSV, PNG, Google Earth, GeoTIFF)
Browse datasets by broad category
IMAGE CREDITSTop left: Las Vegas and Lake Mead, Landsat, USGS/NASA.
Top right: Precipitation accumulation, May 3, 2017, Global Precipitation Measurement (GPM) mission.
Bottom: Monthly Land Surface Temperature Anomaly, February 2017, Images by Jesse Allen, NASA’s Earth Observatory, using data courtesy of the MODIS Land Group.

The GLOBE Program: Visualization System & Advanced Data Access Tool (ADAT)https://www.globe.gov/globe-data/visualize-and-retrieve-data
NASA Worldviewhttps://worldview.earthdata.nasa.gov
Interactively browse global, full-resolution satellite imagery and download the underlying data. Most of the 400+ available products are updated within three hours of observation, essentially showing the entire Earth as it looks “right now.”
This supports time-critical application areas such as wildfire management, air quality measure-ments, and flood monitoring. Arctic and Antarctic views of several products are also available for a “full globe” perspective. Browsing on tablet and smartphone devices is generally supported.
MY NASA DATA: Earth System Data Explorerhttps://mynasadata.larc.nasa.gov/EarthSystemLAS/UI.vm
Browse, download, print and explore NASA satellite data available for Earth system’s spheres: atmosphere, biosphere, hydrosphere, and pedosphere (soils). Overview of the datasets and time periods covered: https://mynasadata.larc.nasa.gov/live-access-server
n INTERMEDIATE Source
n ADVANCED Source
IMAGE CREDITS
Top left: Cloud cover observations by GLOBE Schools and GLOBE Observer citizen scientists on April 21, 2017.
Top right: Daily Sea Surface Temperature, Group for High Resolution Sea Surface Temperature (GHRSST), Jan. 1, 2016.
Bottom: Corrected reflectance (true color), May, 31, 2017, Terra/MODIS.
Pan and zoom
Additional tools: create a URL, switch projection, and take a snapshot of
your image to download (JPEG, PNG, or GeoTIFF).
Drag timeline to see past imagery or to
animate the timescale.
1) Select Datasets by Sphere
2) Select Date
3) Update Plot
4) Further exploration: Select more than 1 plot for
comparison and data analysis (up to 4 plots).
Select line plot to see change over time.
Add up to 5 data layers.
Filter by location & elevation.
Selectdate
Click individual data icon to display & download
data for a site.
Click legend for key to data icon values.
International GLOBE schools and citizen scientists collect environmental data related to the atmosphere, biosphere, hydrosphere, and soils. Use the visualization system to locate and visualize GLOBE data, with maps, graphs, and data tables.
Start with tutorial at the URL above.
Use the ADAT to find, retrieve, and download the data into a csv file for detailed analysis—https://www.globe.gov/globe-data/retrieve-data
Download data and find images of recent events
(e.g., severe storms, volcanoes, fires).
Choose base map, including satellite data.
Share filters to create a URL to the
data map created.
Browse and choose imagery to display.
Add image layers to explore correlations.
Click the “eye” icon to show/hide layers.