online virtual machine migration for renewable energy ...adel/pdf/ccpe2017.pdf · is analyzed...
TRANSCRIPT

CONCURRENCY AND COMPUTATION: PRACTICE AND EXPERIENCE
Concurrency Computat.: Pract. Exper. 2010; 00:2–32
Published online in Wiley InterScience (www.interscience.wiley.com). DOI: 10.1002/cpe
Online Virtual Machine Migration for Renewable Energy Usage
Maximization in Geographically Distributed Cloud Data Centers
Atefeh Khosravi∗, Adel Nadjaran Toosi and Rajkumar Buyya
Cloud Computing and Distributed Systems (CLOUDS) Laboratory, Department of Computing and Information Systems,
The University of Melbourne, Australia.
SUMMARY
Energy consumption and its associated costs represent a huge part of cloud providers’ operational costs.
In this paper, we explore how much energy cost savings can be made knowing the future level of renewable
energy (solar/wind) available in data centers. Since renewable energy sources have intermittent nature, we
take advantage of migrating Virtual Machines (VMs) to the nearby data centers with excess renewable
energy. In particular, we first devise an optimal offline algorithm with full future knowledge of renewable
level in the system. Since in practice, accessing long-term and exact future knowledge of renewable energy
level is not feasible, we propose two online deterministic algorithms, one with no future knowledge called
deterministic and one with limited knowledge of the future renewable availability called future-aware. We
show that the deterministic and future-aware algorithms are 1 + 1/s and 1 + 1/s− ω/s.Tm competitive in
comparison to the optimal offline algorithm, respectively, where s is the network to the brown energy cost, ω
is the look-ahead window-size, and Tm is the migration time. The effectiveness of the proposed algorithms
is analyzed through extensive simulation studies using real-world traces of meteorological data and Google
cluster workload. Copyright c© 2010 John Wiley & Sons, Ltd.
Received . . .
KEY WORDS: cloud computing; green computing; renewable energy; energy cost; data center; VM
migration; online algorithms
Copyright c© 2010 John Wiley & Sons, Ltd.
Prepared using cpeauth.cls [Version: 2010/05/13 v3.00]

2 A. KHOSRAVI AND OTHERS
1. INTRODUCTION
Cloud computing is a paradigm focused on the realization and long held dream of delivering
computing as a utility [1]. Nowadays, the number of individuals and organizations shifting
their workload to cloud data centers is growing more than ever. Cloud services are delivered
via data center sites each containing tens of thousands of servers, which are distributed across
geographical locations. The geographical diversity of computing resources brings several benefits,
such as high availability, effective disaster recovery, uniform access to users in different regions,
and access to different energy sources.
Data centers as the heart of a cloud computing system are energy intensive. This is due to the high
power required to run the IT equipment, power, and cooling infrastructure [2]. Based on the report
by Koomey [3], data centers were responsible for 1% of the world’s total energy consumption in the
year 2005, equivalent to 152 billion kilowatt-hours (kWh) that has been almost doubled from the
year 2000. Besides the high energy consumption of data centers, the cost associated with the energy
is a big concern as well. According to Hamilton [4], the energy costs are estimated to be around
42% of the data center’s operational costs. Furthermore, the issue of high energy consumption by
data centers makes them responsible for 2% of the world’s total CO2 emission [5].
To overcome the problem of high energy consumption that leads to high energy costs for the cloud
provider and environmental concerns due to the high CO2 emission of energy sources, there are two
possible solutions: 1) improving the data center’s efficiency or 2) replacing the brown energy sources
with clean energy sources. By making data centers energy efficient and aware of energy sources,
cloud providers are able to reduce their costs significantly [6]. Recently, large IT companies started
to build their own on-site renewable energy sources, such as Facebook’s solar-powered data center
in Oregon [7], its newly build wind-powered data center in Texas [8], Amazon [9], Apple [10],
∗ Correspondence to: Atefeh Khosravi, CLOUDS Lab, Department of Computing and Information Systems, The
University of Melbourne, Melbourne, Australia. E-mail: [email protected]
Copyright c© 2010 John Wiley & Sons, Ltd. Concurrency Computat.: Pract. Exper. (2010)
Prepared using cpeauth.cls DOI: 10.1002/cpe
ONLINE VIRTUAL MACHINE MIGRATION FOR RENEWABLE ENERGY USAGE MAXIMIZATION 3
Google [11], and Microsoft [12] renewable energy farms. To this end, we consider access to on-
site renewable energy sources†, which is becoming popular for modern data center sites. However,
due to the intermittent nature of renewable energy sources, these data centers consider access to
off-site electrical grid (also known as brown energy) to power their infrastructure in the absence
of renewables. The on-site energy sources considered are solar and wind, the two fastest growing
renewables. As discussed earlier, these energy sources are not available all the time. Solar energy is
only available during the day and it has its peak during noon, while wind energy fluctuates during the
day and does not follow any particular pattern. Yet, cloud providers try to minimize their energy cost
through maximizing on-site renewable energy usage. However, maximizing renewable energy usage
in one data center site is challenging, because of intermittent and the limited nature of solar and wind
energy. One solution to achieve this goal is to migrate the load (VMs) from one data center without
currently available renewable energies to a data center with excess renewable energy. Moreover,
migrating the VMs requires the knowledge of the time that migration should take place to avoid
brown energy usage.
In this paper, we are motivated by the following question: “with limited or no priori knowledge of
the future level of renewable energies, when should VM migration take place such that the energy
cost is minimized and accordingly the overall renewable energy consumption is maximized?” For
this, we study cost-minimizing VM migration algorithms targeting a cloud provider with distributed
data center sites within a region‡ with access to disparate renewable energy sources. We model the
cost minimizing VM migration problem, and determine the cost of offline algorithm, as well as the
competitive ratio for the optimal online deterministic algorithm. Moreover, we enhance the online
algorithm by adding limited future knowledge of available renewable energy in the system. We
evaluate the proposed algorithms through extensive simulation using CloudSim toolkit [14], traces
† Renewable and green energy sources are used interchangeably in the paper.‡ A region is a separate geographic area with multiple and isolated locations known as availability zones connected
through dedicated low latency links. This is the same definition used by Amazon EC2 architecture [13].
Copyright c© 2010 John Wiley & Sons, Ltd. Concurrency Computat.: Pract. Exper. (2010)
Prepared using cpeauth.cls DOI: 10.1002/cpe

4 A. KHOSRAVI AND OTHERS
of wind and solar energy undertaken by the National Renewable Energy Laboratory (NREL) [15],
and real-world workload traces from Google [16].
The main contributions of this paper are:
• Formulation of the offline cost optimization problem for VM migration, across geographically
distributed cloud data centers, with respect to the availability of renewable energy.
• Proof and competitive ratio analysis of the optimal online deterministic algorithm with no
future knowledge against the optimal offline algorithm.
• Design of an online VM migration solution with limited future knowledge regarding the
solar/wind power availability.
• Evaluation of the proposed algorithms through extensive simulations using real-world
renewable energy (solar and wind) traces and workload traces of a Google cluster.
The remainder of the paper is organized as follows. The next section discusses the related work.
The system model and cost optimization problem are formalized in Section 3. Section 4 presents the
optimal offline solution followed, in Section 5, by introducing the online deterministic and future-
aware online algorithms. Evaluation results are presented in Section 6 and Section 7 concludes the
paper.
2. RELATED WORK
The context of energy-efficient resource management has gained considerable attention over the
last few years. Moreover, along with the objective of energy consumption optimization, the
problem of reducing carbon footprint has been an ongoing research due to environmental concerns,
rise in global warming, social and governmental pressure (impose of carbon tax), and more
importantly increase in the usage of renewable energy sources to power data center sites by
cloud providers [17]. Most of the early works on energy efficiency focus on a single server and
intra-data center optimization techniques, such as CPU DVFS (dynamic voltage and frequency
Copyright c© 2010 John Wiley & Sons, Ltd. Concurrency Computat.: Pract. Exper. (2010)
Prepared using cpeauth.cls DOI: 10.1002/cpe

ONLINE VIRTUAL MACHINE MIGRATION FOR RENEWABLE ENERGY USAGE MAXIMIZATION 5
scaling) [18], virtualization [19], VM migration and consolidation for switching off idle servers
and power management [20, 21]. An extensive taxonomy and survey by Beloglazov et al. [22]
discusses different techniques on energy-efficient data centers. Similar to our work, Beloglazov
and Buyya [23] formulated cost for the single VM migration and dynamic VM consolidation
problems within a single data center environment. They conducted competitive-ratio analysis to
characterize the performance of optimal online algorithms against the optimal offline competitor. On
the contrary, we focus on energy cost minimization by applying VM migration between data center
sites considering access to renewable energy sources and limiting brown energy usage. While they
consider Service Level Agreement (SLA) violation cost due to server over-subscription, we consider
inter-data center network cost and additional brown energy usage.
Following the high energy consumption by data centers, increase in their operational costs, and
the issue of carbon footprint encouraged cloud providers to have their own on-site renewable energy
sources and power their data centers completely or partially through clean energy sources [7, 24].
Kong and Liu [25] investigated research works towards green-energy-aware power management
for single and multi data centers. Recently, there has been a large body of literature considering
reducing energy costs targeting inter-data center sites. They achieve this goal either by considering
spatial (different electricity prices in different geographical locations) or temporal changes (different
electricity prices during different times of the day) of the electricity derived from off-site grid or by
maximizing renewable energy usage, which leads to minimizing brown energy consumption as well.
One of the earliest studies that targets reducing the costs associated with brown energy
consumption is done by Le et al. [26]. They consider the amount of load each data center can
accommodate based on its electricity price and energy source, whether it is brown or green
energy and within a specific time period and budget. A similar work by Liu et al. [27] considers
geographical load balancing to minimize brown energy consumption through an optimal mix of
renewable energy sources (solar and wind) as well as storage of these renewables in data centers.
An extension to that work has been done by Lin et al. [28] to explore the optimal combination of
brown and green (solar/wind) energy sources aiming a net-zero brown energy system. To tackle the
Copyright c© 2010 John Wiley & Sons, Ltd. Concurrency Computat.: Pract. Exper. (2010)
Prepared using cpeauth.cls DOI: 10.1002/cpe

6 A. KHOSRAVI AND OTHERS
same problem, Toosi and Buyya [29] proposed a fuzzy logic-based load balancing algorithm that
needs no knowledge of future. All these works consider routing of incoming load to the data centers
based on their initial renewable/brown state by the time of users’ requests submission. Whilst, we
consider VM migration between data center sites, due to the limited and intermittent nature of
renewable energy sources.
Rao et al. [30] aimed at minimizing total cost by considering electricity pricing data to route
delay-constraint applications. Ren et al. [31] proposed online algorithms to route jobs to the
data centers with low electricity prices or suspend jobs and resume them later, if necessary.
Buchbinder et al. [32] has the same objective of reducing energy cost for a cloud provider. They
take advantage of dynamic electricity pricing to migrate running batch jobs to the data center with
lower electricity price. Comparatively, we focus on VM migration and taking advantage of available
renewable energy sources in data centers.
Towards reducing energy cost and limiting brown energy consumption, Chen et al. [33] proposed
scheduling algorithms to forward incoming jobs to the data centers considering energy source at the
data center and requests’ deadline to process the incoming requests for further execution. Celesti et
al. [34] proposed a framework to allocate VM requests to the data centers with the highest level of
solar energy and lowest cost. Le et al. [35] used the same idea of assigning incoming requests to the
data center considering green energy sources and electricity price in order to minimize brown energy
consumption. Luo et al. [36] leverage both the spatial and temporal variation of electricity price to
route the incoming requests between geographically distributed data centers targeting energy cost
minimization.
The comparison of the existing literature with our proposed work is summarized in Table I. Our
work is different from the discussed studies, since we consider VM migration between data centers
to maximize renewable energy (solar/wind) consumption. The targeted system here has several
data centers located within a region (geographically near locations). We analyze the VM migration
problem by calculating the optimal offline cost and computing the competitive ratio for an online
Copyright c© 2010 John Wiley & Sons, Ltd. Concurrency Computat.: Pract. Exper. (2010)
Prepared using cpeauth.cls DOI: 10.1002/cpe

ONLINE VIRTUAL MACHINE MIGRATION FOR RENEWABLE ENERGY USAGE MAXIMIZATION 7
Table I. Comparison of proposed work with existing literature.
Energy cost
minimization
Brown energy
minimization
Renewable
energy
maximization
Migration
Competitive-
ratio
analysis
Le et al. [26] X X X
Liu et al. [27] X X
Lin et al. [28] X X X X
Rao et al. [30] X
Le et al. [37] X X X
Ren et al. [31] X X
Buchbinder et al. [32] X X X
Chen et al. [33] X X
Celesti et al. [34] X X X
Le et al. [35] X X X
Luo et al. [36] X
Toosi and Buyya [29] X X X
Our work X X X X X
deterministic algorithm, without any future knowledge of renewable energy level, and a future-
aware online algorithm with a look-ahead window and limited knowledge, up to a window-size, of
future level of solar and wind energy.
3. SYSTEM SPECIFICATION AND PROBLEM DEFINITION
3.1. System Model
The targeted system in this paper is an IaaS cloud provider offering virtual machine (VM) resources
to its clients similar to Elastic Compute Cloud (EC2) service by Amazon Web Services [13]. The
cloud provider, as shown in Figure 1, consists of several geographically distributed regions. Each
region is isolated from other regions and consists of several availability zones. The availability
Copyright c© 2010 John Wiley & Sons, Ltd. Concurrency Computat.: Pract. Exper. (2010)
Prepared using cpeauth.cls DOI: 10.1002/cpe

8 A. KHOSRAVI AND OTHERS
Figure 1. System model.
zones in the regions are data centers connected through low latency links. Hereafter, whenever we
talk about data centers, we refer to the availability zones within one region. We only consider VM
migration between data center sites belonging to the same region, as the network cost and delay
associated with that is acceptable [13]. To the best of knowledge, we are the first considering VM
migration between cloud data centers to maximize renewable energy utilization.
A cloud user (hereafter called user) at the time of submitting a VM provisioning request can
choose the availability zone he/she wants to run the VM in or leaves the availability zone selection
up to the cloud provider. Users submit VM provisioning requests through a cloud interface called
a cloud broker (hereafter called broker). This connects them to the cloud provider and enables
the users to monitor and follow the status of their requests. Broker, as discussed in our previous
work [38], is a major component of the provider. It is responsible for receiving VM requests,
performing the VM placement and migrating the currently running VM to another data center,
in case of failure, maximizing renewable energy usage, or any other purpose. The information
needed by the broker to function is provided by the directory called Energy and Carbon Efficient
Cloud Information Service (ECE-CIS). Data centers register themselves at the ECE-CIS and keep
it updated regarding any changes in their current state. The information sent by data centers to
Copyright c© 2010 John Wiley & Sons, Ltd. Concurrency Computat.: Pract. Exper. (2010)
Prepared using cpeauth.cls DOI: 10.1002/cpe

ONLINE VIRTUAL MACHINE MIGRATION FOR RENEWABLE ENERGY USAGE MAXIMIZATION 9
the ECE-CIS include: available physical resources, data center’s PUE, energy source(s), amount of
available renewable energy, carbon footprint rate, and physical servers’ current utilization. Note that
PUE stands for power usage effectiveness and is a metric coined by the Green Grid consortium [39]
to represent a data center’s energy efficiency. PUE is the ratio of total power consumed by the data
center to its power consumed by IT devices.
As shown in Figure 1, data centers might use their own on-site renewable energy sources to power
their infrastructure and servers in addition to the electricity delivered from off-site grid. The off-site
grid energy is usually derived from polluting sources, known as brown energy, so cloud providers are
deploying their own on-site renewable energy sources with the aim of cost saving and social impact.
Two renewable energy sources considered in this work are solar photovoltaic (PV) and wind, since
they are the most common and the fastest growing ones. Solar energy, as can be seen in Figure 4a,
has a raised cosine distribution during the day, therefore its peak energy level varies by change in
time zone for different locations. In contrast, wind energy does not have a clear predictable pattern,
as shown in Figure 4b. Having these two renewable sources in a data center provides access to clean
energy to run requests during different times of the day.
3.2. Preliminaries
We consider a cloud provider with a set of n data center sites, shown as D = {d1, d2, ..., dn},
distributed in a geographical region. Each data center is referred to as an availability zone which
consists of a set of h servers/hosts shown as S = {s1, s2, .., sh}. The list of all the symbols used in
this paper are given in Table II.
Total Cost. The total cost of energy, Equation (1), is the cost of energy used to run/execute VMs in
the data center and the extra cost.
Ctotal = Cexecution + Cextra . (1)
Extra Cost. Extra cost, Equation (2), is associated with the energy used to migrate VMs between
data center sites and the additional brown energy usage in the source data center while VM migration
Copyright c© 2010 John Wiley & Sons, Ltd. Concurrency Computat.: Pract. Exper. (2010)
Prepared using cpeauth.cls DOI: 10.1002/cpe

10 A. KHOSRAVI AND OTHERS
Table II. Description of symbols.
Symbol Description Symbol Description
D Set of data center sites n Number of data center sites
SSet of physical servers (hosts) in a
data centerh Number of physical servers (hosts)
Cexecution Energy cost to execute the VMs Cextra Extra cost due to VM migration
Cmigration Energy cost to migrate the VMs CaddBrown
Additional brown energy consumption
at the source data center during VM
migration
Cs Cost of server energy consumption Co Cost of overhead energy consumption
cn
Cost of network to migrate the VM per
unit timecb Cost of brown energy per unit time
pr Price of renewable energy per unit usage pb Price of brown energy per unit usage
Er
Servers total renewable energy
consumptionEb Servers total brown energy consumption
tm
Start time of VM migration at the source
data centerTm Duration to migrate the VM
tb
Start time of brown energy consumption
at the source data centerTb
Duration of brown energy usage during
VM migration at the source data center
takes place.
Cextra = Cmigration + CaddBrown . (2)
The aforementioned costs (execution, migration, and additional brown) can be detailed as follows:
Execution Cost. Execution cost is the energy cost to run VMs in the data center and is shown in
Equation (3). The energy cost to run VMs consists of server (Cs) and overhead (Co) costs imposed
due to running VMs within a data center.
Cexecution = Cs + Co . (3)
Copyright c© 2010 John Wiley & Sons, Ltd. Concurrency Computat.: Pract. Exper. (2010)
Prepared using cpeauth.cls DOI: 10.1002/cpe

ONLINE VIRTUAL MACHINE MIGRATION FOR RENEWABLE ENERGY USAGE MAXIMIZATION 11
In order to calculate overhead energy, we use PUE that is equal to the total energy goes to a
data center divided by the total energy consumed by IT devices and is computed as:
PUE =Cs + Co
Cs. (4)
As a result,
Cexecution = Cs × PUE . (5)
Server Cost. Servers host the incoming workload and based on their configuration are capable to
accommodate different number of VMs. The cost of servers Cs is computed as follows:
Cs = pr × Er + pb × Eb , (6)
where Er and Eb are the energy consumption of servers using renewable and brown energy sources
and pr and pb are the related prices, respectively.
The energy consumption of servers is the product of the power consumption of servers and the
time period they have been working under that power. The power consumption depends on several
hardware resources including CPU, memory, and disks [40]. According to Blackburn and Grid [41],
the total power consumed by a server is determined by the incoming load to that server, which
is shown as CPU utilization. The relationship between the server power consumption and CPU
utilization can be a constant, cubic, or quadratic [42].
Migration Cost. Migration cost is part of the extra cost and is the energy consumed by the network
to migrate the VMs between data center sites. Live migration of VMs requires relocating the VMs
and placing them in their new destination [43]. The cost due to transferring the VMs is proportional
to the VM size and the number of bytes that need to be transferred between data center sites, similar
to AWS EC2 pricing [13]. For the sake of simplicity, we limit the migration cost to a specific type of
VM with a constant network cost cn per unit time for the live migration and Tm is the time required
to perform and complete the migration. Equation (7) represents the migration cost.
Cmigration = cn × Tm . (7)
Copyright c© 2010 John Wiley & Sons, Ltd. Concurrency Computat.: Pract. Exper. (2010)
Prepared using cpeauth.cls DOI: 10.1002/cpe

12 A. KHOSRAVI AND OTHERS
Additional Brown Energy Cost. This part represents the penalty of brown energy consumption
while VM migration takes place at the source data center. As mentioned earlier, we consider two
different types of energy sources: brown and renewable. The renewable energy is drawn from on-site
solar and wind power generators. Therefore, there is a one-time installation and fixed maintenance
cost for them; which leads to very low price per unit usage in their lifespan. On the other hand,
brown energy is derived from off-site electricity that, besides its high per unit usage cost, also leaves
carbon dioxide in the environment. We show the brown energy cost for the specific type of VM as
cb per unit time and the time duration brown energy has been used while migration takes place as
Tb. Therefore, the cost of additional brown energy usage can be shown as:
CaddBrown = cb × Tb . (8)
3.3. System Objective
Considering prices of different energy sources and their environmental impact, running VMs using
renewable energy sources eventually leads to a lower total cost. We consider powering data centers
using renewable energy unless it is not available. Since renewable energy sources have intermittent
nature, there is the possibility of their shortage in the lifetime of a VM running in the data center. In
this case, cloud provider could migrate the VM to another availability zone with excess renewable
energy available. Performing VM migration could lead to lowering and even eliminating brown
energy usage, but it imposes extra costs to the system. In this work, our objective is to minimize
the total cost of running VMs in the system through VM migration. As shown in Equation (9), the
objective function consists of energy used in data centers to run VMs, and extra energy used to
migrate VMs to the data center with access to renewable energy and the additional brown energy
used in the source data center while migration takes place.
minimize Cexecution + Cextra . (9)
The first part (execution cost) in the objective function is inevitable even if no migration takes
place. Therefore, to achieve our goal we restate the objective function as to minimize the extra cost
Copyright c© 2010 John Wiley & Sons, Ltd. Concurrency Computat.: Pract. Exper. (2010)
Prepared using cpeauth.cls DOI: 10.1002/cpe

ONLINE VIRTUAL MACHINE MIGRATION FOR RENEWABLE ENERGY USAGE MAXIMIZATION 13
due to VM migration. However, optimal cost minimization within a data center with very large
number of VMs is a complex problem. We narrow down our formulation to a single VM migration
problem, which eventually leads to overall cost minimization when the cost for the individual VM
is minimized.
3.4. VM Migration Problem
To maximize renewable energy usage and be aligned with the system objective, we perform VM
migration in the absence of renewable energy. The extra energy, Equation (2), consists of the energy
used by the network, Equation (7), and additional brown energy used at the source data center,
Equation (8), while the VM migration takes place.
We break down the extra cost into three different cases, as shown in Equation (10) and Figure 2.
Cextra =
C1 if tm < tb and tb − tm ≥ Tm,
C2 if tm < tb and tb − tm < Tm,
C3 if tm ≥ tb.
(10)
where,
C1 = cn.Tm ,
C2 = C3 = cn.Tm + cb.(tm − tb + Tm) .
(11)
The first case (C1) indicates when the VM migration starts at tm and finishes before the start of
brown energy consumption tb. This is shown in case (a) in Figure 2 as well and can be formulated as:
tm < tb and tb − tm ≥ Tm. Therefore, the time duration required for VM migration to be completed
Tm comes to at end before the data center starts to use brown energy sources and the only extra
cost in this case is the migration cost as shown in Equation (11). C2, case (b) of Figure 2, occurs
when migration starts before finishing of renewable energy tm < tb but it completes after start of
brown energy usage tb − tm < Tm. As shown in Equation 11, besides the migration cost, the cost
of brown energy usage in the source data center is added to the extra cost as well. Finally, C3 which
is the case (c) in Figure 2, occurs after the time no renewable energy is available in the data center,
i.e.,tm ≥ tb.
Copyright c© 2010 John Wiley & Sons, Ltd. Concurrency Computat.: Pract. Exper. (2010)
Prepared using cpeauth.cls DOI: 10.1002/cpe

14 A. KHOSRAVI AND OTHERS
tm tb
Tm
tTb=0
tm tb
Tm
tTb=tm-tb+Tm
tmtb
Tm
t
Case (a)
Case (b)
Case (c) Tb=tm-tb+Tm
Figure 2. Example of migration time (tm) versus start time of brown energy consumption (tb).
4. OPTIMAL OFFLINE VM MIGRATION
In this section, we study the offline solution of a single VM migration problem among data center
sites to increase the usage of renewable energy sources. Without loss of generality, we assume that
the brown energy cost per unit time to be 1 and normalize the network cost cn to the brown energy
cost, as shown in Equation (12).
cb = 1 and cn = s; where s ∈ R+ . (12)
Moreover, we consider the following relation for tb, tm, and Tm.
tb − tm = aTm; where a ∈ R . (13)
Considering Equations (12) and (13), we rewrite Equations (10) and (11) as follows:
Cextra =
C1 = s.Tm if a ≥ 1,
C2 = C3 = s.Tm + (1− a)Tm if a < 1.
(14)
Theorem 1
The optimal offline (OPT) cost is s.Tm.
Proof
However, finding the optimal offline cost associated with Equation (14) is straight forward, we
provide the detailed proof for better understanding of VM migration problem under different system
Copyright c© 2010 John Wiley & Sons, Ltd. Concurrency Computat.: Pract. Exper. (2010)
Prepared using cpeauth.cls DOI: 10.1002/cpe

ONLINE VIRTUAL MACHINE MIGRATION FOR RENEWABLE ENERGY USAGE MAXIMIZATION 15
conditions. In order to find the optimal offline solution, we need to find the condition where the cost
function has the minimum cost. Based on Equation (14), we have:
1. C1 equals s.Tm, where a ≥ 1.
2. If a < 1 then 1− a is always a positive value and C2 or C3 are always greater than s.Tm,
which means C2 > C1 or C3 > C1.
As a result, the optimal offline happens at a ≥ 1 or tb − tm ≥ Tm. This means that the optimal
offline happens when migration starts and finishes before the start of brown energy usage in the
data center. This leads to the optimal offline cost s.Tm.
5. ONLINE VM MIGRATION
In this section, we construct two online algorithms to minimize cost of VM migration. The reason
for proposing online algorithms is that optimal offline algorithm is only attainable when we have full
future knowledge about the system and renewable energy level. Here we propose two deterministic
online VM migration algorithms: optimal online deterministic (OOD) VM migration with no future
knowledge and future-aware dynamic provisioning (FDP) VM migration with limited knowledge
(up to a window-size) regarding renewable energy level. Our online algorithms are inspired by ski-
rental problem [44]. We decide when to migrate a VM to another data center with excess renewable
energy to minimize brown energy consumption. It should be noted that the decision to whether or
not to migrate a VM to another data center is considered to be happening in serial. Making decision
to migrate the VMs in this way, we assume that we only make decision regarding migration of one
VM at a time and our knowledge about the renewable energy level at the destined data center is
precise to large extent. Moreover, in our model we keep two copies of VM while migration and
switching is happening. Keeping a copy of the VM in the source data center till VM migration fully
completes assures that user experience in terms of latency and response time would not be affected
by the migration time and network delay.
Copyright c© 2010 John Wiley & Sons, Ltd. Concurrency Computat.: Pract. Exper. (2010)
Prepared using cpeauth.cls DOI: 10.1002/cpe
16 A. KHOSRAVI AND OTHERS
In order to be able to evaluate the performance of our online algorithms, we use the competitive
ratio analysis [45].
Definition
An online algorithm is called c-competitive if, for all possible inputs, the outcome of the online
algorithm (CA) in comparison to the optimal offline outcome (COPT ) has the following relation:
CA/COPT ≤ c.
5.1. Optimal Online Deterministic VM Migration
Our goal is to propose an algorithm that could achieve optimal result using only the current
information available. Theorem 2 shows the optimal online deterministic algorithm for a single VM
migration problem is attained when migration takes place by the beginning time of brown energy
usage, that is, tm = tb.
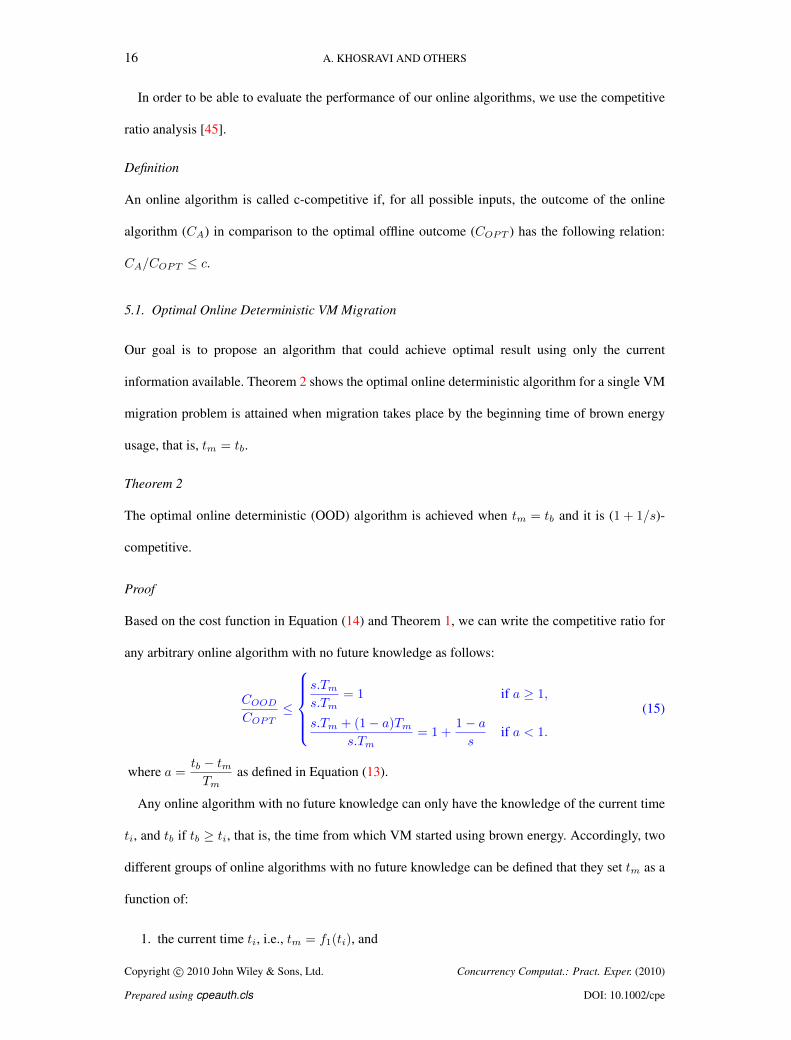
Theorem 2
The optimal online deterministic (OOD) algorithm is achieved when tm = tb and it is (1 + 1/s)-
competitive.
Proof
Based on the cost function in Equation (14) and Theorem 1, we can write the competitive ratio for
any arbitrary online algorithm with no future knowledge as follows:
COOD
COPT≤
s.Tm
s.Tm= 1 if a ≥ 1,
s.Tm + (1− a)Tm
s.Tm= 1 +
1− a
sif a < 1.
(15)
where a =tb − tmTm
as defined in Equation (13).
Any online algorithm with no future knowledge can only have the knowledge of the current time
ti, and tb if tb ≥ ti, that is, the time from which VM started using brown energy. Accordingly, two
different groups of online algorithms with no future knowledge can be defined that they set tm as a
function of:
1. the current time ti, i.e., tm = f1(ti), and
Copyright c© 2010 John Wiley & Sons, Ltd. Concurrency Computat.: Pract. Exper. (2010)
Prepared using cpeauth.cls DOI: 10.1002/cpe

ONLINE VIRTUAL MACHINE MIGRATION FOR RENEWABLE ENERGY USAGE MAXIMIZATION 17
2. the start time of brown energy usage, i.e., tm = f2(tb).
For algorithms from the former group, a =tb − f1(ti)
Tm, since a is not a function of tb, a can
grow arbitrarily large when the adversary will select tb such that it is infinitely greater than f(ti),
i.e., a→∞, and as a resultCOOD
COPT→∞. Therefore, all algorithms from the first group are not
competitive.
For algorithms from the latter group, a =tb − f2(tb)
Tm, the time of migration tm is dependent to
the start time of brown energy usage tb which is known for the algorithm, therefore:
tm ≥ tb ,
as a =tb − tmTm
⇒ a ≤ 0 .
(16)
Considering a ≤ 0, the minimum competitive ratio is achieved when a = 0 for the second inequality
in Equation (15). This means migration starts by the beginning of brown energy usage, i.e., tm = tb.
As a result, the best competitive ratio is 1 +1
s.
5.2. Future-Aware Dynamic Provisioning VM Migration
As mentioned earlier, we consider access to renewable energy sources along with the electricity
derived from off-site grid. Two renewable sources consider in this paper, solar and wind, have
different pattern during the day. As shown in the Figure 4a, solar energy has a predictable pattern
during the day and its peak is foreseeable. In contrast, wind energy does not have a predictable
diurnal pattern. But one can use the average temporal pattern of wind energy, which can be captured
in the region [46]. It is often assumed that the renewable energy availability in the near look-ahead
window can be predicted with a good accuracy in reality, such as auto-regressive techniques used in
the works by Kansal et al. [47] and Cox [48]. If there are prediction errors in the model, decisions
would be affected by the same error margin as prediction errors. For example, 10% prediction
error causes 10% error in decision making. If the time window is small enough, such as minutely
windows, then renewable energy prediction can be predicted with considerably high precision
almost similar to real time measuring; therefore, it will not affect the decisions significantly. The
Copyright c© 2010 John Wiley & Sons, Ltd. Concurrency Computat.: Pract. Exper. (2010)
Prepared using cpeauth.cls DOI: 10.1002/cpe

18 A. KHOSRAVI AND OTHERS
question is how much knowledge can help and get the online algorithm performance close to the
optimal offline algorithm.
We assume that at any given time, ti, the future renewable energy is predictable for a window-size
ω, which means the amount of renewable energy in the system is known for the period [ti, ti + ω].
Now we elaborate on how the window-size affects the decision making process and improves the
online algorithm performance. The following two cases are plausible:
• If window-size is greater or equal to the time required to perform the migration, ω ≥ Tm, it
would be the same as the scenario for optimal offline algorithm. Therefore, there is enough
time to migrate the VM to a data center with access to renewable energy and avoid brown
energy usage.
• If window-size is smaller than the time of migration, ω < Tm, then tm + ω ≥ tb.
Theorem 3
The competitive ratio for the future-aware dynamic provisioning (FDP) algorithm is:CFDP
COPT≤
1 +1
s− ω
s.Tm, where w ≤ Tm.
Proof
The optimal offline algorithm migrates the VM, Tm unit of time earlier than tb and the optimal
online deterministic algorithm with no future knowledge migrates the VM by the time of tb. The
FDP algorithm with limited future knowledge minimizes the cost when migrates the VM as soon
as tb is known. That is, FDP can migrate the VM at most up to ω unit of time earlier, when tb
can be seen within the look-ahead window. Therefore, there would be ω unit less brown energy
consumption which improves the online algorithm cost. Equation (17) shows the competitive ratio
for future-aware online algorithm.
CFDP
COPT≤ s.Tm + Tm − ω
s.Tm= 1 +
1
s− ω
s.Tm, (17)
where w ≤ Tm, as competitive ratio is always greater or equal to 1.
Copyright c© 2010 John Wiley & Sons, Ltd. Concurrency Computat.: Pract. Exper. (2010)
Prepared using cpeauth.cls DOI: 10.1002/cpe

ONLINE VIRTUAL MACHINE MIGRATION FOR RENEWABLE ENERGY USAGE MAXIMIZATION 19
Algorithm 1: Most Available Renewable Energy (MARE) VM Placement AlgorithmInput: datacenterList, hostList
Output: destination
1 while vmRequest do
2 Get data centers’ Information from ECE-CIS;
3 foreach datacenter in datacenerList do
4 availSolar ← Get Current availableSolar;
5 availWind← Get Current availableWind;
6 availRenewable← availSolar + availWind;
7 Sort datacenerList in a descending order of availRenewable;
8 foreach datacenter in datacenterList do
9 foreach host in hostList do
10 if host is suitable for vm then
11 destination← (data center, host);
12 return destination;
13 destination← null; //rejection of request;
14 return destination;
5.3. VM Placement
By the arrival of each VM request, the broker should allocate resources to the VM and for this
purpose it needs to decide where to place the VM. We treat VM placement as a bin-packing problem
with different bin sizes, which are physical servers in this context. Since bin-packing is an NP-hard
problem, we use derivation of best-fit heuristic to solve it. To be aligned with our purpose and taking
the most from available renewable energy in distributed data centers, we consider a modification of
the best-fit heuristic that we proposed in our previous work [38]. The modification to the Energy and
Carbon-Efficient (ECE) algorithm [38] is denoted as Most Available Renewable Energy (MARE).
Copyright c© 2010 John Wiley & Sons, Ltd. Concurrency Computat.: Pract. Exper. (2010)
Prepared using cpeauth.cls DOI: 10.1002/cpe

20 A. KHOSRAVI AND OTHERS
MARE sorts data center sites according to the amount of available renewable energy and submits
the VM to the data center with the highest available amount. The pseudo-code of the VM placement
algorithm is presented in Algorithm 1.
The time complexity of Algorithm 1 with v VM requests, n data center sites, and h physical
servers within each data center, in detail is as follows: Lines 3-6 take O(n) and the sort function
in Line 7 can be done in O(n log(n)). Lines 8-12 take O(nh), in the worst case. Thus, the total
running time for the algorithm is O(v(n+ n log(n) + nh)). Since the number of VM requests and
hosts dominate the total number of data center sites (n), the total time complexity of the algorithm
is O(vnh).
In addition, we consider another VM placement algorithm without any knowledge regarding
renewable energy availability, denoted as Random algorithm. By the arrival of a new VM request,
Random algorithm chooses a random data center uniformly.
6. PERFORMANCE EVALUATION
We perform simulation-based experiments to evaluate our proposed algorithms. Our aim is to
measure the energy cost savings incurred due to migration of VMs to data centers with access to
renewable energy sources. Moreover, we measure the improvement made by applying the proposed
approaches in cutting the amount of carbon emission.
Workload Data. We use Google cluster-usage traces [16] for workload as there is no other publicly
available real-world workload traces for IaaS cloud providers to the best of our knowledge. The
Google dataset has records of one cluster’s usage (which is a set of 12,000 physical machines)
and includes submitted requests to that cluster over a period of one month. Each request has
requirements shown as amount of requested CPU, memory, and storage. Since these traces are
user requests not representing VM instances demand, we need to make a mapping between request
submissions from users to IaaS computing demand. We use the same technique used by Toosi et al.
in [49] as part of their workload generation to generate VM request traces.
Copyright c© 2010 John Wiley & Sons, Ltd. Concurrency Computat.: Pract. Exper. (2010)
Prepared using cpeauth.cls DOI: 10.1002/cpe

ONLINE VIRTUAL MACHINE MIGRATION FOR RENEWABLE ENERGY USAGE MAXIMIZATION 21
7206004803602401200
6000
5000
4000
3000
2000
1000
0
hour
VM
Figure 3. One month Google workload trace.
Google traces include record of users, each submitting several tasks, with specific resource
requirements. Considering the fact that 93% of the Google cluster machines have the same
computing capability, we assume all physical machines in the cluster have the same resources (in
terms of CPU, memory, etc.) and map our VM size to that of the physical machine. In order to
derive VM request traces from Google traces, whenever a user submits a task we check if there is
already a VM instantiated by that user in the system with enough computing resources to run the
new task. Otherwise, if there is no VM owned by the user with enough capacity to accommodate the
new task, we instantiate a new VM to serve the user’s task [49]. We also terminate a VM when there
is no task running on it. By this, we can create a trace of VM requests submitted from users. The
trace contains 250,171 VM requests, each has the start time and holding time in the data center. We
consider the VM specifications in our model similar to the standard small instances introduced by
Amazon EC2 [13]. Figure 3 shows the number of VM requests per hour received by the provider,
generated based on the scheduling algorithm we used to generate VM requests according Google
cluster traces. This figure shows the shape of the workload and its fluctuation in our simulations.
Data Centers’ Configuration. We consider 3 data center sites located in the US-West region. The
locations are chosen from the Data centers Map [50], and are as follows: Phoenix in Arizona,
Copyright c© 2010 John Wiley & Sons, Ltd. Concurrency Computat.: Pract. Exper. (2010)
Prepared using cpeauth.cls DOI: 10.1002/cpe

22 A. KHOSRAVI AND OTHERS
Los Angeles in California, and Cedar City in Utah. The number of servers in each data center is set
in a way that data centers’ capacity would not be a limitation for not being able to take advantage
of available renewable energy. Based on the previous discussion, the servers in the data centers
are homogeneous with equal processing capacity. We model servers in data centers based on the
latest HP ProLiant DL360 Gen9 server [51], with following specifications: Intel Xeon E5-2670v3,
10 cores × 2.3 GHz, 256 GB memory. The power consumed by each request running on a server
within a data center is assumed to be on average a constant rate per time slot (e.g., 550W/hour).
We consider PUE value of 1.4 for all data center sites to calculate the overhead energy
usage. The reason is that we aim to evaluate algorithms in a setting where PUE values are
not determinative. We select the carbon footprint = 0.350Tones/MWh for the off-site grid
electricity, derived from the US Department of Energy Electricity Emission Factors [52]. The
electricity price of pb = 6.22 cents/kWh is chosen for the off-site electricity from the US Energy
Information Administration [53]. This price represents the electricity price for the on-peak period,
between 8AM and 10PM. We opt the off-peak price to be half of the on-peak. Moreover, as discussed
earlier, we consider a fixed price for renewable energy usage per unit as pr = 1.0 cents.kWh.
Renewable Energy Traces. We use the measurements reported by NREL [15] for irradiance and
meteorological data from different stations to capture wind and solar energy with 1-hour granularity
from May, 1st to May, 29th 2013. To calculate the output for PV power, we use the hourly solar
irradiance reported for flat plates on tilted surface at a 45-degree angle and PV efficiency of 30%.
We calculate the solar output based on [54] and the total area for the flat plates is considered to be
100m2, derived from the configuration by Solarbayer [55]. To generate hourly wind energy, we use
the proposed method by Fripp et al. [46]. The hourly wind speed, air temperature, and air pressure,
derived from NREL measurements, are fed to the model and the generated power is computed
accordingly, assuming each data center uses a GE 1.5MW wind turbine. Figures 4a and 4b show the
solar and wind energy availability for three different cities in our system model, respectively.
Copyright c© 2010 John Wiley & Sons, Ltd. Concurrency Computat.: Pract. Exper. (2010)
Prepared using cpeauth.cls DOI: 10.1002/cpe

ONLINE VIRTUAL MACHINE MIGRATION FOR RENEWABLE ENERGY USAGE MAXIMIZATION 23
7206004803602401200
1200
1000
800
600
400
200
0
hour
GH
I (
W/m
^2
)
Cedar City, UT
Los Angeles, LA
Phoenix, AZ
(a) Global horizontal irradiance (GHI).
7206004803602401200
14
12
10
8
6
4
2
0
hour
Win
d S
peed
(m
/s)
Cedar City, UT
Los Angeles, LA
Phoenix, AZ
(b) Wind speed.
Figure 4. Renewable energy traces.
6.1. Experiment Setup
Benchmark Algorithm. We compare the proposed offline, optimal online, and future-aware
algorithms with a baseline benchmark algorithm with no VM migration. The benchmark does not
take any further action and does not perform any migration after initial placement and instantiation
of the VMs in the data ceners. The benchmark is referred to as No-Migration (NM) policy.
Copyright c© 2010 John Wiley & Sons, Ltd. Concurrency Computat.: Pract. Exper. (2010)
Prepared using cpeauth.cls DOI: 10.1002/cpe

24 A. KHOSRAVI AND OTHERS
NMOODFDPOPT
600
500
400
300
200
100
0
NMOODFDPOPT
MARE
En
ergy
Cost
(D
oll
ar)
Random
OPT
FDP
OOD
NM
Figure 5. Total energy cost.
NMOODFDPOPT
8000
7000
6000
5000
4000
3000
2000
1000
0
NMOODFDPOPT
MARE
Bro
wn
En
ergy
(k
Wh
)
Random
OPT
FDP
OOD
NM
Figure 6. Brown energy consumption.
6.2. Experiment Results and Analysis
In the experiments, we use the real-world traces derived from Google to study the performance of
the proposed offline, optimal online, and future-aware algorithms all in combination with two VM
placement policies against the benchmark algorithm. The results are shown in Figures 5 to 7.
Figure 5 shows the total energy cost incurred by all algorithms, when the window-size for
future-aware algorithm is set to 4.5 minutes. The results indicate that having initial knowledge
Copyright c© 2010 John Wiley & Sons, Ltd. Concurrency Computat.: Pract. Exper. (2010)
Prepared using cpeauth.cls DOI: 10.1002/cpe

ONLINE VIRTUAL MACHINE MIGRATION FOR RENEWABLE ENERGY USAGE MAXIMIZATION 25
NMOODFDPOPT
3000
2500
2000
1500
1000
500
0
NMOODFDPOPT
MARE
Ca
rbo
n F
oo
tpri
nt
(kg
)
Random
OPT
FDP
OOD
NM
Figure 7. Carbon footprint.
about the current renewable energy level in the data centers has a substantial effect in the amount
of cost reduction. It can be seen that there is a significant cost reduction for policies under the
MARE placement in comparison to the Random. Since offline policy has the full knowledge of
renewable energy in the system, it achieves the lowest cost, 14% and 18.5% energy cost reduction in
comparison to future-aware and online policies, respectively. Future-aware policy performs slightly
better than optimal online algorithm and reduces the total cost by 4% in comparison to the optimal
online policy that makes decision instantly without any future knowledge. The benchmark policy
has the highest cost, since after placement of VMs and when there is no renewable energy available
in the data center it does not take any further action. The benchmark policy on average consumes
26% more energy cost in comparison to the optimal offline policy under different VM placement
algorithms.
We also measured the amount of brown energy consumption as well as carbon footprint in the
system as shown in Figures 6 and 7, respectively. Policies under MARE VM placement achieved
considerable reduction in brown energy consumption in comparison to the case when VM placement
randomly chooses destined data center. Within each category, offline with full knowledge of
renewable energy consumes less brown energy, 5.6% and 12.9% less brown energy in comparison
Copyright c© 2010 John Wiley & Sons, Ltd. Concurrency Computat.: Pract. Exper. (2010)
Prepared using cpeauth.cls DOI: 10.1002/cpe
26 A. KHOSRAVI AND OTHERS
11.710.59.38.16.95.74.5
370
360
350
340
330
320
Window Size (minutes)
En
erg
y C
ost
(D
oll
ar)
(a) Energy cost.
11.710.59.38.16.95.74.5
3850
3800
3750
3700
3650
3600
Window Size (minutes)
Bro
wn
En
erg
y (
kW
h)
(b) Brown energy consumption.
11.710.59.38.16.95.74.5
1340
1330
1320
1310
1300
1290
1280
1270
1260
Window Size (minutes)
Carb
on
Footp
rin
t (k
g)
(c) Carbon footprint.
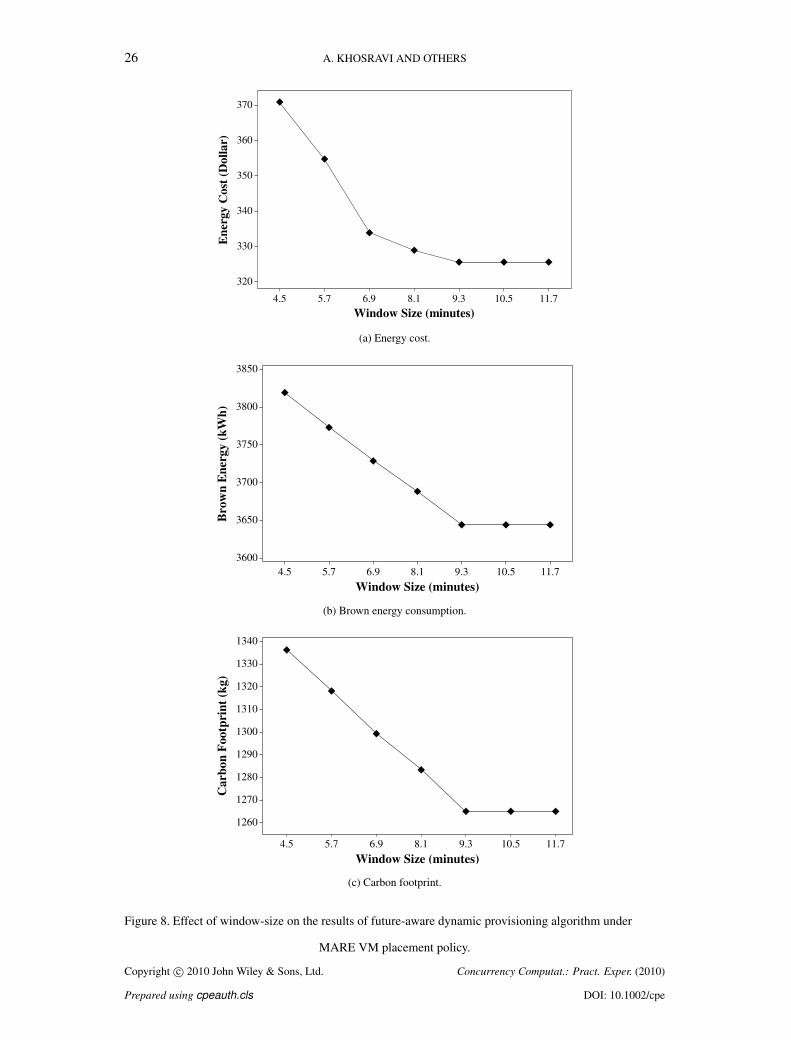
Figure 8. Effect of window-size on the results of future-aware dynamic provisioning algorithm under
MARE VM placement policy.
Copyright c© 2010 John Wiley & Sons, Ltd. Concurrency Computat.: Pract. Exper. (2010)
Prepared using cpeauth.cls DOI: 10.1002/cpe

ONLINE VIRTUAL MACHINE MIGRATION FOR RENEWABLE ENERGY USAGE MAXIMIZATION 27
to future-aware and online policies, respectively. Future-aware and online policies reduce brown
energy consumption by 30.5% and 22%, respectively, in comparison to the benchmark with no
migration. The same behavior can be seen for carbon footprint in Figure 7, since reduction in brown
energy consumption eventually leads to lower carbon footprint.
As shown, future-aware policy achieves results that fall between the outcome of the offline
algorithm with full knowledge, and optimal online with no knowledge about future renewable
energy level. We change the window-size to see its impact on the performance of the future-aware
dynamic processioning algorithm. As Figure 8 illustrates, increase in the window-size reduces
total cost, brown energy consumption, and carbon footprint. Increase in the window-size makes
future-aware algorithm closer to its offline competitor. The performance of the future-aware policy
improves and gets close to the optimal offline until window-size reaches 9 minutes. After this point
no improvement is achieved, since this is the point that window-size reaches the VM migration time
in our experiments. This supports the theoretically proven supposition in Section 1 that if enough
knowledge of future is available, the optimal decision suggests a VM migration that finishes before
the start of brown energy usage in the data center.
As per Figure 5, the cost ratio of deterministic and future-aware online policies versus the optimal
offline algorithm are 1.18 and 1.13, respectively. Moreover, based on the simulation setup s = 3.5,
which leads to deterministic and future-aware online algorithms be 1.28 and 1.14 competitive in
comparison to the optimal offline algorithm, respectively. The simulation results are compatible
with the calculated competitive ratio as per the provided definition of c-competitive in Section 5.
Figure 9 depicts the total number of migrations happening in the system for each policy during
the one-month simulation period and total of 250,171 VM requests. We observe that migration
policies under MARE placement achieve lower number of migrations in comparison to the same
migration policies under Random placement. The reason is that under MARE placement, a wise
data center selection is made for initial VM request placement which reduces the need for possible
future migrations. Amongst three different migration policies, offline has the highest number of
VM migrations. Since it has full knowledge of the amount of renewable energy in the system and
Copyright c© 2010 John Wiley & Sons, Ltd. Concurrency Computat.: Pract. Exper. (2010)
Prepared using cpeauth.cls DOI: 10.1002/cpe

28 A. KHOSRAVI AND OTHERS
OODFDPOPT
60
55
50
45
40
35
30
OODFDPOPT
MARE
VM
Mig
rati
on
s, x
10
00
Random
OPT
FDP
OOD
Figure 9. Number of VM migrations.
begins to migrate the VMs before the start time of brown energy usage, unless there is no renewable
available in other data centers. Similarly, future-aware policy makes more VM migrations than
online policy, due to further knowledge regarding renewable energy level.
7. CONCLUSIONS AND FUTURE DIRECTIONS
Using on-site renewable energy sources instead of electricity derived from off-site grid helps cloud
providers reduce their energy cost and their reliance on polluting energy sources. Since the nature
of renewable energy sources (solar/wind) is intermittent, we take advantage of having access to
several geographically distributed data center sites of a cloud provider to perform intra-region
VM migration and take the most of the available renewable energy. In this paper, we introduced
algorithms with full and partial knowledge of future availability of renewable energy levels to
migrate the VMs to another data center within a region in the absence of renewable at the host
data center. We first introduced the optimal offline algorithm to minimize the energy cost. Due to
the necessity of having full knowledge of future level of renewable energy for optimal offline, we
propose two online algorithms. The first online algorithm is a deterministic algorithm that does not
Copyright c© 2010 John Wiley & Sons, Ltd. Concurrency Computat.: Pract. Exper. (2010)
Prepared using cpeauth.cls DOI: 10.1002/cpe

ONLINE VIRTUAL MACHINE MIGRATION FOR RENEWABLE ENERGY USAGE MAXIMIZATION 29
have any knowledge regarding the future level of renewable energy and the second one is denoted
as future-aware online algorithm with limited knowledge, up to a window-size (ω), of future level of
renewable energy. We have compared the results of the proposed optimal offline, optimal online, and
future-aware algorithms with a basic benchmark algorithm, that does not perform any migration, all
in combination with two VM placement algorithms. One VM placement is aware of the current
renewable level, known as MARE, and the other one randomly chooses the destined data center.
We have evaluated the proposed algorithms through extensive simulations using real-world traces
for renewable energy (solar and wind) and one-month workload trace of a Google cluster usage. The
offline algorithm with full knowledge of renewable energy level performs the best in comparison to
the future-aware and optimal online algorithms. The optimal online algorithm incurs 18.5% more
cost compared to the offline algorithm when no future knowledge is available. Moreover, simulation
results show that future-aware algorithm’s performance gets competitive with offline algorithm by
the increase in its window-size until the window-size reaches the network delay or the time needed
that a migration takes place and gets completed.
As a future direction, one can study the effect of inter-region migrating of VMs to evaluate
the improvements in energy cost versus network delay. Moreover, studying selection of VMs to
perform VM migration is another issue that could be investigated; since there are situations that VM
migration could lead to violating service level agreement of some users’ with special requirements
or VM migration needs large amount of data transfer over the network due to data unavailability in
the destination. Another important topic of future research is considering a more complex problem,
which involves the migration of multiple VMs, the effect of sharing the network on the transfer time,
and evaluating the competitiveness of the possible online algorithms in comparison to the optimal
offline algorithm.
REFERENCES
1. Armbrust M, Fox A, Griffith R, Joseph AD, Katz R, Konwinski A, Lee G, Patterson D, Rabkin A, Stoica I, et al..
A view of cloud computing. Communications of the ACM 2010; 53(4):50–58.
Copyright c© 2010 John Wiley & Sons, Ltd. Concurrency Computat.: Pract. Exper. (2010)
Prepared using cpeauth.cls DOI: 10.1002/cpe

30 A. KHOSRAVI AND OTHERS
2. Brown R, et al.. Report to congress on server and data center energy efficiency: Public law 109-431. Lawrence
Berkeley National Laboratory 2008; .
3. Koomey JG. Worldwide electricity used in data centers. Environmental Research Letters 2008; 3(034008).
4. Hamilton J. Cooperative expendable micro-slice servers (cems): low cost, low power servers for internet-scale
services. Proc. of the Conference on Innovative Data Systems Research (CIDR), 2009.
5. Mankoff J, Kravets R, Blevis E. Some computer science issues in creating a sustainable world. IEEE Computer
2008; 41(8):102–105.
6. Smith JW, Sommerville I. Green cloud: A literature review of energy-aware computing. University of St Andrews
2010; .
7. Facebook Installs Solar Panels at New Data Center. http://www.datacenterknowledge.com/
archives/2011/04/16/facebook-installs-solar-panels-at-new-data-center/.
8. Facebook in Fort Worth: Our newest data center. https://code.facebook.com/posts/
1014459531921764/facebook-in-fort-worth-our-newest-data-center/.
9. AWS and Sustainable Energy. http://aws.amazon.com/about-aws/sustainable-energy/.
10. Apple and the Environment. http://www.apple.com/environment/.
11. Renewable energy. http://www.google.com/green/energy/.
12. Microsoft To Use Solar Panels in New Data Center. http://www.datacenterknowledge.com/
archives/2008/09/24/microsoft-uses-solar-panels-in-new-data-center/.
13. Amazon Web Services. http://aws.amazon.com/.
14. Calheiros R, Ranjan R, Beloglazov A, De Rose C, Buyya R. Cloudsim: a toolkit for modeling and simulation
of cloud computing environments and evaluation of resource provisioning algorithms. Software: Practice and
Experience 2011; 41(1):23–50.
15. Measurement and Instrumentation Data Center (MIDC). http://www.nrel.gov/midc/.
16. Reiss C, Wilkes J, Hellerstein JL. Google cluster-usage traces: format+ schema. Google Inc., White Paper 2011; .
17. Wind-Powered Data Center in Wyoming. http://www.datacenterknowledge.com/archives/
2007/11/29/wind-powered-data-center-in-wyoming/.
18. Wu CM, Chang RS, Chan HY. A green energy-efficient scheduling algorithm using the dvfs technique for cloud
datacenters. Future Generation Computer Systems 2014; 37:141–147.
19. Brey T, Lamers L. Using virtualization to improve data center efficiency. The Green Grid, Whitepaper 2009; 19.
20. Srikantaiah S, Kansal A, Zhao F. Energy aware consolidation for cloud computing. Proc. of the Conference on
Power Aware Computing and Systems. USENIX Association, 2008; 10–10.
21. Harney E, Goasguen S, Martin J, Murphy M, Westall M. The efficacy of live virtual machine migrations over the
internet. Proc. of the 2nd International Workshop on Virtualization Technology in Distributed Computing. ACM,
2007; 1–7.
22. Beloglazov A, Buyya R, Lee YC, Zomaya A. A taxonomy and survey of energy-efficient data centers and cloud
computing systems. Advances in Computers 2011; 82(2):47–111.
Copyright c© 2010 John Wiley & Sons, Ltd. Concurrency Computat.: Pract. Exper. (2010)
Prepared using cpeauth.cls DOI: 10.1002/cpe

ONLINE VIRTUAL MACHINE MIGRATION FOR RENEWABLE ENERGY USAGE MAXIMIZATION 31
23. Beloglazov A, Buyya R. Optimal online deterministic algorithms and adaptive heuristics for energy and
performance efficient dynamic consolidation of virtual machines in cloud data centers. Concurrency and
Computation: Practice and Experience 2012; 24(13):1397–1420.
24. Apple Plans 20MW of Solar Power for iDataCenter. http://www.datacenterknowledge.com/
archives/2012/02/20/apple-plans-20mw-of-solar-power-for-idatacenter/.
25. Kong F, Liu X. A survey on green-energy-aware power management for datacenters. ACM Computing Surveys
(CSUR) 2014; 47(2):30.
26. Le K, Bianchini R, Martonosi M, Nguyen T. Cost-and energy-aware load distribution across data centers. Proc. of
Workshop on Power-Aware Computing and Systems (HotPower), 2009; 1–5.
27. Liu Z, Lin M, Wierman A, Low SH, Andrew LL. Geographical load balancing with renewables. ACM SIGMETRICS
Performance Evaluation Review 2011; 39(3):62–66.
28. Lin M, Liu Z, Wierman A, Andrew LL. Online algorithms for geographical load balancing. Proc. of the
International Green Computing Conference (IGCC), IEEE, 2012; 1–10.
29. Toosi AN, Buyya R. A fuzzy logic-based controller for cost and energy efficient load balancing in geo-distributed
data centers. Proc. of the 8th IEEE/ACM International Conference on Utility and Cloud Computing (UCC), 2015.
30. Rao L, Liu X, Xie L, Liu W. Minimizing electricity cost: optimization of distributed internet data centers in a
multi-electricity-market environment. Proc. of INFOCOM, IEEE, 2010; 1–9.
31. Ren S, He Y, Xu F. Provably-efficient job scheduling for energy and fairness in geographically distributed data
centers. Proc. of the 32nd International Conference on Distributed Computing Systems (ICDCS), IEEE, 2012; 22–
31.
32. Buchbinder N, Jain N, Menache I. Online job-migration for reducing the electricity bill in the cloud. Proc. of the
International IFIP TC 6 Networking Conference. Springer, 2011; 172–185.
33. Chen C, He B, Tang X. Green-aware workload scheduling in geographically distributed data centers. Proc. of the
IEEE International Conference on Cloud Computing Technology and Science (CloudCom), 2012; 82–89.
34. Celesti A, Puliafito A, Tusa F, Villari M. Energy sustainability in cooperating clouds. Proc. of the 3rd International
Conference on Cloud Computing and Services Science (CLOSER), 2013; 83–89.
35. Le K, Bianchini R, Nguyen TD, Bilgir O, Martonosi M. Capping the brown energy consumption of internet services
at low cost. Proc. of the International Green Computing Conference, IEEE, 2010; 3–14.
36. Luo J, Rao L, Liu X. Spatio-temporal load balancing for energy cost optimization in distributed internet data centers.
IEEE Transactions on Cloud Computing 2015; 3(3):387–397.
37. Le K, Bilgir O, Bianchini R, Martonosi M, Nguyen TD. Managing the cost, energy consumption, and carbon
footprint of internet services. ACM SIGMETRICS Performance Evaluation Review 2010; 38(1):357–358.
38. Khosravi A, Garg SK, Buyya R. Energy and carbon-efficient placement of virtual machines in distributed cloud
data centers. Proc. of Euro-Par 2013 Parallel Processing. Springer, 2013; 317–328.
39. Belady C, Rawson A, Pfleuger J, Cader T. Green grid data center power efficiency metrics: Pue and dcie. Technical
Report, Technical report, Green Grid 2008.
Copyright c© 2010 John Wiley & Sons, Ltd. Concurrency Computat.: Pract. Exper. (2010)
Prepared using cpeauth.cls DOI: 10.1002/cpe

32 A. KHOSRAVI AND OTHERS
40. Minas L, Ellison B. Energy efficiency for information technology: How to reduce power consumption in servers
and data centers. Intel Press, 2009.
41. Blackburn M, Grid G. Five ways to reduce data center server power consumption. The Green Grid, 2008.
42. Pelley S, Meisner D, Wenisch TF, VanGilder JW. Understanding and abstracting total data center power. Proc. of
the Workshop on Energy-Efficient Design, 2009.
43. Clark C, Fraser K, Hand S, Hansen JG, Jul E, Limpach C, Pratt I, Warfield A. Live migration of virtual machines.
Proc. of the 2nd Symposium on Networked Systems Design & Implementation-Volume 2, USENIX, 2005; 273–286.
44. Karlin AR, Manasse MS, Rudolph L, Sleator DD. Competitive snoopy caching. Algorithmica 1988; 3(1-4):79–119.
45. Borodin A, El-Yaniv R. Online computation and competitive analysis. Cambridge University Press, New York,
2005.
46. Fripp M, Wiser RH. Effects of temporal wind patterns on the value of wind-generated electricity in california and
the northwest. IEEE Transactions on Power Systems 2008; 23(2):477–485.
47. Kansal A, Hsu J, Zahedi S, Srivastava MB. Power management in energy harvesting sensor networks. ACM
Transactions on Embedded Computing Systems (TECS) 2007; 6(4):32.
48. Cox DR. Prediction by exponentially weighted moving averages and related methods. Journal of the Royal
Statistical Society. Series B (Methodological) 1961; :414–422.
49. Toosi AN, Vanmechelen K, Ramamohanarao K, Buyya R. Revenue maximization with optimal capacity control in
infrastructure as a service cloud markets. IEEE Transactions on Cloud Computing 2015; 3(3):261–274.
50. Data center map. http://www.datacentermap.com/.
51. HP ProLiant DL360 Generation9 (Gen9). http://h20195.www2.hp.com/v2/gethtml.aspx?
docname=c04375623.
52. US Department of Energy, Appendix F, Electricity Emission Factors. http://www.eia.doe.gov/oiaf/
1605/pdf/Appendix%20F_r071023.pdf.
53. EIA-electricity data. http://www.eia.gov/electricity/monthly/pdf/epm.pdf.
54. Photovoltaic Education Network. http://pveducation.org/.
55. Solarbayer. http://www.solarbayer.com/.
Copyright c© 2010 John Wiley & Sons, Ltd. Concurrency Computat.: Pract. Exper. (2010)
Prepared using cpeauth.cls DOI: 10.1002/cpe