onslow townsite strategy background report townsite strategy background report january 2010 4 the...
TRANSCRIPT

1 Onslow Townsite Strategy Background Report January 2010
2010
Shire of Ashburton
January 2010
Onslow Townsite Strategy Background Report

Onslow Townsite Strategy Background Report January 2010
2
Contents Page 1. INTRODUCTION
1.1 Purpose
3 1.2 Background
3
1.3 Statutory Context
3
2. NATURAL HERITAGE
2.1 Context 6 2.2 Natural Landscape
6
2.3 Climatic Processes
6 2.4 Biodiversity Conservation 10
2.5 Planning Implications
10
3. CULTURAL HERITAGE
3.1 Culture & Heritage 12 3.2 Indigenous Culture
12
3.3 European Built Heritage
13 3.4 Planning Implications
14
4. DEMOGRAPHIC PROFILE
4.1 Demographic Profile 15 4.2 Household Structure & Trends
17
4.3 Socio-Economic Structure& Trends
18 4.4 Planning Implications
18
5. HOUSING
5.1 Dwelling Structure 19 5.2 Housing Tenure
19
5.3 Housing Age & Condition
20 5.4 Planning Implications
20
6. COMMUNITY FACILITIES
6.1 Overview 21 6.2 Education
21
6.3 Health Services
22 6.4 Recreation 22
6.5 Community Support
24 6.6 Community Security
24
6.7 Commercial & Other Facilities 25 6.8 Planning Implications
25
7. ECONOMIC DRIVERS
7.1 Economic Base 26 7.2 Service Sector
29
7.3 Planning Implications
29
8. ROADS & TRANSPORT
8.1 Road Transport 30 8.2 Water Transport
30
8.3 Air Transport
31 8.4 Planning Implications
32
9. UTILITY INFRASTRUCTURE
9.1 Water Supply 33 9.2 Energy
33
9.3 Waste Water
34 9.4 Communications
34
9.5 Waste Management
35 9.6 Planning Implications
35
10. URBAN GROWTH SCENARIOS
10.1 Context 36 10.2 Base Population
36
10.3 Development Scenarios
36 Attachment A Shire of Ashburton Town Planning Scheme No 7: Onslow Townsite
Section One

Onslow Townsite Strategy Background Report January 2010
3
INTRODUCTION
1.1 PURPOSE
This Background Document provides supporting material and rationale for the draft Onslow Townsite Strategy, which provides a framework for the sustainable development of Onslow. The document covers: trends in population growth and household structure formation; supply of housing and community facilities; economic drivers; provision of utility and transport infrastructure; and the impact of the natural environment - in particular climate.
1.2 BACKGROUND
1.2.1 Establishment & Development
Onslow is a small town situated on the coast 82 kilometres from the turn-off on the North West Coastal Highway. Despite its rather isolated location, it attracts many tourists travelling the North West Coastal Highway and is a popular holiday and recreation centre for the residents of the inland mining towns.
Onslow developed on its current site between Beadon Creek and Beadon Point in 1925, after the original town sited near the mouth of the Ashburton River was abandoned due to cyclone damage. It has developed into a pleasant town with tree-lined streets, an attractive beachfront and recreation areas. It has a primary school, hospital, shops, hotel/motel, a caravan park, and other forms of holiday accommodation. The Shire of Ashburton had its main administrative centre in Onslow, until its relocation to Tom Price in 1990. However, it still retains an office in the town. Onslow has a small fishing industry and is a service centre for the pastoral industry and for offshore oil and gas exploration and development. Beadon Creek has been developed as a safe anchorage for boats and provides wharf facilities for the fishing and service industry. 1.2.2 Impact of Off-Shore Hydrocarbon Development
Onslow is a strategic location of interest to resource companies due to factors such as its location, deep-water access and proximity to off-shore gas reserves. A number of industry feasibility studies have identified the Onslow area in their assessments. More recently, off-shore gas discoveries near Onslow have raised the possibility for Onslow to support a gas processing industry, This, combined with a potential change in operational practices at Onslow Salt and the gas processing opportunities, which arise when gas and salt are available, has led to the potential for substantial further development in Onslow.
1.3 STATUTORY CONTEXT
The planning of Onslow is obliged to take into consideration a number of relevant state planning, environmental and strategic development policies and strategies.
1.3.1 State Planning Strategy
The State Planning Strategy (SPS) provides a strategic guide for land use planning through to the year 2029 aimed at developing a land use planning system to help the State achieve a number of key goals. These include generating wealth, conserving and enhancing the environment, and building vibrant and safe communities for the enjoyment of current and future generations of Western Australians.

Onslow Townsite Strategy Background Report January 2010
4
The SPS identifies a broad regional vision statement and key planning priorities for each of the State’s 10 regions, which provide the focus for integrated planning to enhance the future prospects of each region. The vision for the Pilbara Region is:
'In the next three decades, the Pilbara Region will be a world leading resource development area focusing on mineral extraction, petroleum exploration and production and the primary stages of downstream processing. The region’s population will grow in the future, fuelled by specific resource development projects, the sustainable development of Karratha and Port Hedland and a more diverse economy. A growing tourism industry will have developed based on the region’s unique natural environment.'
1.3.2 State Planning Policy No 2.6 State Coastal Planning
This policy addresses land use planning and development issues specifically as they relate to the protection and management of the coast and requires strategic plans to guide local planning, development setbacks for protection against coastal processes such as erosion and storms, and the provision of coastal foreshore reserves.
The objectives of this policy are to:
protect, conserve and enhance coastal values, particularly in areas of landscape, nature conservation, indigenous and cultural significance;
provide for public foreshore areas and access to these on the coast;
ensure the identification of appropriate areas for the sustainable use of the coast for housing, tourism, recreation, ocean access, maritime industry, commercial and other activities; and
ensure that the location of coastal facilities and development takes into account coastal processes including erosion, accretion, storm surge, tides, wave conditions, sea level change and biophysical criteria.
The Policy is currently under review to address critical issues such as climate change and coastal erosion. The application of this policy to Onslow is further covered in Section 2.3.3 of this report.
1.3.3 The Shire of Ashburton 2007- 2011 Strategic Plan
The Shire of Ashburton' has adopted a Strategic Plan with the following vision, mission and
objectives:
Vision: 'The Shire of Ashburton will be a vibrant and prosperous place for work, leisure and living'
Mission: 'Working together, enhancing lifestyle and economic vitality'
Objectives:
Diversify and strengthen the economy
Include and engage our community
A connected and accessible region
Conserve and enhance the environment and cultural heritage
Community safety and security
A well managed and contemporary corporation.
1.3.4 Town Planning Scheme No. 7
The Shire of Ashburton Town Planning Scheme No. 7 (TPS7) covers the entire Shire and is the primary statutory control for land use and development. Attachment A shows the Scheme as it applies to the Onslow town area. This Townsite Strategy will seek to identify

Onslow Townsite Strategy Background Report January 2010
5
future zones and reserves required to accommodate future urban growth, in particular within the area indicated on the scheme map as "Urban Development"
1.3.5 Onslow Structure Plan (2003)
The WAPC endorsed Onslow Structure Plan (2003) was developed to facilitate the accommodation of emerging and strategic industrial opportunities with a particular focus on local and regional assets such as salt and natural gas. The plan was intended to have an outlook of 20-25 years, however, the discovery of large off shore gas supplies and recent booming economy have identified future opportunities that were not considered in the development of the Onslow Structure Plan 2003. A review of the Structure Plan was commenced in 2006 to address the implications of the development of gas processing in the Strategic Industrial Area south of the town. The review has been replaced by this current Onslow Townsite Strategy and the associated planning work currently being undertaken for the Ashburton North area.

Onslow Townsite Strategy Background Report January 2010
6
Section Two
NATURAL HERITAGE
2.1 CONTEXT
Onslow is part of the Roebourne bio-subregion, one of four bio-subregions within the Pilbara Bioregion, which is, in turn, one of seven bioregions that, in whole or in part, make up the Pilbara region. The bio-subregion includes the Pilbara coastal plain, with its periodic rocky ridges and the system of off-shore islands that include Barrow Island and the Mackerel Islands.
Key elements of Onslow's natural heritage are its:
Natural landscape
Climatic processes and hazards
Biodiversity.
2.2 NATURAL LANDSCAPE
The Onslow district is characterised by extensive sandy plains with longitudinal dunes trending north-east or north and by broad clay plains and circular grassy depressions. Much of the coastal area consists of low-lying salt flats, with minimal vegetation. The landform tends to be subdued, although occasional dune crests may be up to 30 metres higher than the surrounding coastal plain. Numerous termite mounds punctuate the low, gently undulating skyline that characterises the Onslow district. Vegetation generally consists of low-lying scrub and spinifex with some small shrubs and trees.
Ashburton River
The Ashburton River is one of the region's most significant river systems. It meanders through the plains of the northern part of the district in a north-north-west direction for about 110 kilometres to the Indian Ocean near Onslow. Many of the land systems of the province are old floodplain deposits of the Ashburton River, that appear to have altered course across the plains a number of times. Alluvial plains flank the river to the width of up to 8-9 kilometres. However, the river does not generally flood out to more than 4-5 kilometres from its course on to these alluvial plains. The Cane River bore field, located some 30 kilometres to the east of Onslow, is an important water source for the town.
2.3 CLIMATIC PROCESSES
The development of Onslow is significantly influenced by its semi-arid-coastal climate. This is characterised by high temperatures; low and variable rainfall; and high evaporation. Being located on the coast, Onslow tends to have higher humidity than the inland settlements. Onslow enjoys a mild winter season, which attracts many tourists from colder southern climates, predominantly between May and October. In comparison, Onslow’s mean maximum temperature is 31.3 °C to Perth’s 24.5 °C. Onslow’s mean minimum temperature is 18 °C to Perth’s 12.6 °C. Significantly, Onslow receives approximately one third the amount of rainfall per year and less than a one quarter of the number of days of rain compared with Perth.

Onslow Townsite Strategy Background Report January 2010
7
Cyclonic Activity & Storm Surge
In common with the other Pilbara coastal settlements, Onslow is susceptible to cyclone activity between November and April. Since 1910, a cyclone impact causing wind gusts in excess of 90 km/h at Onslow has occurred about once every two years on average. Half of these are category 1 impacts (wind gusts less than 125 km/h). However, the frequency is not evenly distributed. Between 1953 and 1963 Onslow suffered five severe cyclone impacts having wind gusts exceeding 170 km/h and a further three cyclones causing some damage, some flood related. No other Australian town has endured such a period of intense cyclone activity. Although the inadequacy of early wind records make it difficult to compare events, it is estimated that there have been eight severe cyclone impacts in terms of wind speed since 1910: 1934, 1953, 1958 (two), 1961, 1963, 1975 (Trixie) and 1999 (Vance) (Bureau of Meteorology 2008).
Since the 1960s the development of the mining and offshore oil and gas industries (solar salt mining at Onslow and the oil and gas facilities on Barrow Island) has increased the damage potential of cyclones in the region. Substantial economic losses can be incurred even with the threat of a cyclone impact owing to lost production or disruptions to shipping activities. Fortunately modern structures are built according to cyclone wind ratings and are far less susceptible to damaging winds than those constructed in earlier times.
Table 2.1: Cyclonic Activity in the Onslow Area
1975 February Tropical Cyclone 'Trixie', one of the most severe cyclones to affect the Pilbara, passed over Mardie. Damage was reported all along the Pilbara coast. Mardie recorded a wind gust of 259 km/h and Onslow reported 247 km/h, at that time the highest recorded wind gust in Australia. The Onslow Meteorological Office was destroyed and many houses seriously damaged. Onslow recorded 246 mm of rain.
1995 February Tropical Cyclone 'Bobby' crossed the coast just east of Onslow before 1 am on the 25th. Seven lives were lost when two fishing trawlers were sunk off the coast from Onslow. Very heavy rain (Onslow 425 mm / 25-26th) caused widespread flooding in the west Pilbara, Gascoyne, Goldfields and Eucla regions. A motorist was drowned inland from Carnarvon while attempting to cross a flooded creek. Wind damage was relatively minor at Onslow.
1996 April Tropical Cyclone 'Olivia' crossed the coast near Mardie causing extensive damage, particularly to the offshore oil and gas industry around Barrow Island. Varanus Island recorded wind gusts to 267 km/h, the highest ever gusts in Australia at the time, and a minimum pressure of 927 hPa. Mardie reported gusts to 257 km/h. The inland towns of Pannawonica and Paraburdoo also received damaging winds.
1999 March One of the strongest cyclones to ever affect mainland Australia, Tropical Cyclone 'Vance' passed down Exmouth Gulf about 80 km west of Onslow. Damage to Exmouth was considerable. At Onslow the estimated 4 m storm surge inundated the lower parts of the town. Further west the storm surge was estimated at 5 m and caused severe coastal erosion and widespread denudation of vegetation.
2006 March Tropical Cyclone 'Glenda' was a small and intense system that developed very rapidly after moving off the northwest Kimberley coast. Glenda reached Category 5 intensity but weakened as it approached the Pilbara coast. Although threatening to cross the coast near the populated Dampier/Karratha region as a Category 4 system close to the time of high tide, Glenda took a more SW course towards Onslow and weakened before finally crossing the coast near Onslow at 10pm on 30 March as a marginal category 3 system. Very destructive winds were recorded on the coast at Mardie prior to crossing
Bureau of Meteorology 2008

Onslow Townsite Strategy Background Report January 2010
8
2.3.1 Onslow Storm Surge Studies & Investigations
Two significant storm surge studies and investigations have been undertaken for the Onslow district. These are:
Onslow Storm Surge Study - Halpern Glick and Maunsell (2000).
Onslow Foreshore Investigations - MP Rogers & Associates (2002) The first study sought to more accurately define the flood risk in Onslow, which is notionally identified by the Onslow Coastal Hazard Area in TPS 7. A feature of the study was to identify opportunities for flood mitigation in respect of cyclonic flood risk. The modelling was undertaken by Global Environmental Modelling Systems (GEMS). The second study investigated coastal processes, flooding regimes and options for coastal protection. In its review of the Onslow Structure Plan, GHD reviewed these studies and also reviewed two independent sources, dealing with flood risk in the region. GHD found in these sources, modelled flood levels of up to 7 metres AHD, compared with GEMS' modelled flood levels of 4.9 metres AHD. Additionally, the GEMS modelling did not take into account the impact of global climate change. Therefore, there is a need to undertake an additional coastal vulnerability assessment work for Onslow.
2.3.2 Tsunami Impact Scenarios
In the wake of the 2004 Boxing Day Tsunami, the Australian Government and the Fire and Emergency Services Authority of WA (FESA) conducted tsunami impact modelling for Onslow. Geoscience Australia (GA), together with FESA produced the Professional Opinion 2007/07: Tsunami Impact Scenarios for the North West Shelf, Western Australia document to provide an operational framework for emergency response teams. GA and FESA agreed to build a tsunami risk assessment model and from that develop tools to assist their response teams in a tsunami emergency event. The document describes a range of impact assessments for three tsunami events that affected several communities along the North West coast, including Onslow. One assessment indicated that up to 48 houses in the Onslow area could be inundated in a tsunami emergency event. Between the three tsunami events modelled, the run-up height of the water in Onslow in a tsunami event would range between 9.5 metres and 16 metres, depending on the initial sea level. This report supports the emerging need to conduct more detailed modelling of the coastal processes impacting on the Onslow coastline.
2.3.3 Planning Policy Responses
State Coastal Policy: State Planning Policy 2.6
The key policy response, influencing urban development in areas subject to coastal processes, has been SPP 2.6 Coastal Policy. Development setbacks from the coast are determined by Schedule 1 of this policy, which states that the setback for development in cyclone prone areas (north of latitude 30o) should be defined with regard to existing foreshore protection and to local topography and waterways. However, Onslow can be considered a development node on the coast, that provides for a range of facilities to benefit the broader public and as such under Schedule 1 of the policy, is exempt from the coastal processes setbacks. State Coastal Policy Review: The Western Australian Planning Commission (WAPC) has been made aware of concern regarding the current provisions and interpretation of SPP 2.6. Accordingly the WAPC is undertaking a review SPP 2.6. It is anticipated that by early 2010,

Onslow Townsite Strategy Background Report January 2010
9
an interim position statement may be considered by the WAPC. This may include a revised figure for projected sea level rise in Western Australia (for planning purposes), and how that figure should be applied. National Coastal Risk Assessment Report: The National Coastal Risk Assessment Report was recently launched by Senator the Hon Penny Wong, Commonwealth Minister for Climate Change and Water. Analysis undertaken for the report (undertaken for risk assessment, not land use planning) is based on a 'plausible' sea level rise of 1.1 metres by 2100. Nationally, sea level rise planning policies of individual State jurisdictions are being amended to reflect the latest predictions:
New South Wales has adopted an increase above 1990 mean sea levels of 0.4 metre by 2050 and 0.9 metre by 2100 as planning benchmarks;
Victoria requires planning proposals to be based on a sea level rise of not less than 0.8 metre by 2100;
South Australia uses 0.3 metre to 2050 and 1 metre by 2100; and
Queensland uses 0.3 metre to 2050 and 0.8 metre to 2100). Onslow Coastal Plan
In 1994, the then Department of Planning and Urban Development (DPUD) released the Onslow Coastal Plan. This plan examined a number of planning alternatives for the future development of the town, recognising that most of the existing town and desirable locations for tourist development, are within a storm surge hazard area. The key recommendation from the report was to impose strict development conditions in the hazard area. TPS No. 7 has a number of provisions relating to the Onslow Coastal Hazard Area. The Onslow Coastal Plan estimated that storm surge events could raise the sea level to approximately 4 metres AHD, which proved to be accurate when Tropical Cyclone Vance crossed the coast in March 1999 with an estimated surge of 4 metres.
Onslow Coastal Hazard Area
The Shire of Ashburton has completed a storm surge study to determine 'safe' development levels and possible surge mitigation approaches and the development of emergency evacuation plans for areas subject to inundation. Further, the State Government provided funding for the construction of a seawall/breakwater structure, which was completed in 2003. Development standards within the current Onslow Coastal Hazard Area and the boundary of the hazard area itself are currently based upon a 1 in 100 year recurrence flooding event, in line with the current guidelines of SPP 2.6. The review and updating of the SPP is a continuing activity as new technologies are developed and more accurate derived. Available data for Onslow indicates the 1 in 200 year recurrence flood level as being slightly higher in some areas to the northeastern side of the Onslow townsite, but most significantly, shows flooding coming in from the northwestern side of the Onslow townsite through the land cut for the Onslow Salt conveyor. This data exposes a secondary flooding impact and should be seriously considered in the future planning of the townsite.
Building Code of Australia
Under the Building Code of Australia (BCA) provisions, Onslow is in Region D, a Category 2 area. Most of northern Australia is in Region D. The Category 2 rating relates to the likely ferocity of winds in the area should a cyclone occur and is the highest rating for winds. This rating applies generally between Onslow and Cape Keraudren.
Onslow Townsite Strategy Background Report January 2010
10
2.4 BIODIVERSITY CONSERVATION
2.4.1 Vegetation
The vegetation of the Onslow subregion away from the coastal areas is shrub on sand hills and clay pans. Acacia and Hakea are the main shrubs, the steppe groundcover Triodia and there are occasionally small trees of Eucalyptus sp. Large areas of hyper saline tidal mudflats preclude the growth of larger vegetation on the coast. These are interspersed with mangrove communities of Avicennia marina and samphire communities of Arthrocnumum.
Ecological Communities: There are no threatened ecological communities in the Roebourne bio-subregion, which includes the Onslow district.
2.4.2 Conservation Areas
The Department of Environment and Conservation (DEC) has two main interests in the Onslow area:
The Cane River and Mt Minnie Pastoral Stations, as well as a part of Nanutarra Station, were purchased by the then Department of Conservation and Land Management (CALM) in 1998. It is proposed that these properties be given an appropriate conservation vesting within the DEC Estate at some stage; and
The coastal strip along the Onslow coast, particularly east of Beadon Creek, which contains mangrove communities, but is not part of the DEC Estate.
The pastoral stations were purchased with Commonwealth funds and certain commitments in respect of the land have been made between the then CALM and the Commonwealth Government. The Onslow area is home to several species of mangrove. Mangroves are plant formations, which inhabit sheltered tropical and subtropical coastlines. They act as nursery, feeding and breeding grounds, and as buffer zones against wave action, thereby reducing erosion and storm surge damage to coastal areas. They are considered an integral part of coastal and marine processes. The Environmental Protection Authority (EPA) has a guidance statement for the protection of tropical arid zone mangroves along the Pilbara coastline (EPA Guidance Statement No. 1 – Tropical Arid Zone Mangroves along the Pilbara coastline, April 2001). Although the Beadon Creek mangrove communities were not listed in the 2001 publication, their environmental significance will need to be considered.
2.4.3 Acid Sulphate Soils
Acid Sulphate Soils (ASS) are naturally occurring soils, sediments or organic substrates
formed under waterlogged conditions that contain iron sulphide minerals. When exposed to
air (through drainage or excavation), the sulphides in the soil oxidise and release sulphuric
acid and iron into the soil and groundwater, often in harmful quantities. This has implications
for all forms of structures.
2.5 PLANNING IMPLICATIONS
2.5.1 Storm Surge
The key planning implications of the natural environment relate to the impact of climatic forces on the Onslow district. The townsite of Onslow regularly experiences the impact of cyclones and cyclonic activity, including high winds, saltwater

Onslow Townsite Strategy Background Report January 2010
11
inundation and wave action. A large area of the existing townsite is in a storm surge hazard area and the State Government and the Shire of Ashburton have a responsibility for maintaining community safety and not allow inappropriate development in areas subject to storm surge hazard. To meet future demands for urban expansion, the structure of the town will need to be modified to take account of this hazard. 2.5.2 Biodiversity Conservation
The environmental significance of the Beadon Creek mangrove communities will need to be considered in any future urban development of this area. 2.5.3 Acid Sulphate Soils
There is a small site of ‘moderate to low risk’ ASS on the northern tip of the Onslow townsite, that will require investigation prior to any disturbance as outlined by the Draft Identification and Investigation of Acid Sulphate Soils prepared by DEC.

Onslow Townsite Strategy Background Report January 2010
12
Section Three
CULTURAL HERITAGE
3.1 CULTURE & HERITAGE
Culture and heritage define both the place and the people. In Onslow both the Aboriginal and the European cultures and traditions are important in shaping the character of the town and its environs.
3.1.1 Historical Perspective
The original Onslow was proclaimed a town in 1883 and named after Sir Alexander Onslow, the acting Governor and Chief Magistrate of Western Australia at the time. It supported the nearby pastoral stations that had been established along the Ashburton River and the goldmines that had developed in the hinterland. One of the first recorded stations was Minderoo, established in 1882. By 1890, all land along the river had been taken up, running mainly sheep, but also a few cattle. Today, it is predominantly cattle with a few sheep. In the early settlement days good pearls were found in the Exmouth Gulf and the town became the home port to a fleet of pearling luggers. By 1925, the port facilities at the mouth of the Ashburton River were affected by increasing silting causing more and more problems in the loading and unloading of visiting ships. Surveys proved that there was deep water at Beadon Point and so the town was moved some 20 kilometress to the east to its present location. As a result of its relatively deep water approach and its location, the Onslow area was utilised for servicing submarines during World War II, and the evidence of this still exits in large tanks located throughout the town site which once contained aviation spirit, ‘Bunker C’ fuel (fuel grade for ships) and diesel fuel. 3.2 INDIGENOUS CULTURE
3.2.1 Recent Aboriginal History
The introduction of the Pastoral Award in 1968 led to large numbers of Aboriginal people leaving their traditional lands which, with the arrival of Europeans in the 19th Century, had been taken up as pastoral stations. While most Aboriginal people lived in inland areas, the government established camps in the coastal areas of Onslow and Roebourne. As such, Onslow accommodates Aboriginal people from the inland Pilbara. The main language groups in town are:
Nhuwala, Thalanyji and Burama - from the Cane and Ashburton River area ( the determined Traditional Land Owners 18 September 2008)
Punjima (Bunjima) and Innawonga - from the Wittenoom and Tom Price area
Yindjibarndi - people from the Millstream area (one of the larger language groups)
Ngarluma - from the Roebourne and Whim Creek area
Martuthinira - traditionally from the coast around the mouth of the Fortescue River and south to the Robe River.
Aboriginal people in the area are now moving back to their traditional homeland areas, and becoming increasingly nomadic in the Onslow area, which perhaps contributes to differential ABS counts in the population of Onslow.

Onslow Townsite Strategy Background Report January 2010
13
3.2.2 The Thalanyji People
The Thalanyji people are the local Traditional Owners in the Onslow area. (determined 18 September 2008). The Thalanyji cultural tradition is associated with the rainbow serpent Burra Balanyji that created underground tunnels in the area which link all of the water bodies around Onslow – the rivers, the creeks and all the fresh water soaks. The areas where freshwater exists inland are considered sacred, as are the hunting grounds of the creek and river. The people were named after this serpent - Burra Balanyji Thalanyji. There has been consultation with the Thalanyji people in the review of the Structure Plan (2003), and the review identifies areas of cultural sensitivity.
3.2.3 Implications of the Aboriginal Heritage Act 1972
The Aboriginal Heritage Act 1972 requires that management or research on Aboriginal sites be subject to permission under Section 16 from the Aboriginal Cultural Materials Committee. This is an advisory body to the Minister for Indigenous Affairs. Permission is usually conditional on the approval and involvement of the Aboriginal custodians of the site, and on the input of a professional heritage conservator. The involvement of Aboriginal people in the management of their heritage is paramount. Moreover, there is a need for sensitivity in the treatment of cultural material, which can often only be ensured by the involvement of a heritage consultant. Development of vacant land generally requires clearance under the Act.
3.2.4 Implications of the Native Title Act 1993
The Native Title Act 1993 was created to recognise and protect Aboriginal and Torres Strait Islander people’s native title rights and interests. The amended Act continues to provide ways to determine native title and protect the existing rights of governments, industry and the general public. The Act also provides ways to negotiate future public works and business activity on land or waters where indigenous people may have native title rights and interests. Much of the area surrounding Onslow is subject to native title, although developed areas of the Onslow townsite are exempt from claim.
3.3 EUROPEAN BUILT HERITAGE
Onslow and surrounds have a range of European heritage sites both in the old and current townsites.
3.3.1 Old Onslow Townsite
The Old Onslow townsite is currently on the Heritage Council of Western Australia’s Register of Heritage Places and is being considered for inclusion on the Register of the National Estate, however, it has not been formally nominated and is still considered an ‘indicative place’ (Commonwealth Department of Environment and Water Resources). In 1998, the Shire of Ashburton adopted a conservation plan for Old Onslow townsite, which provides guidance for the preservation and enhancement of an important historical feature in the region. The conservation plan details a series of projects that could be undertaken to secure the history of the region and ensure that tourists visiting the site gain a greater appreciation of the townsite. The primary objectives of the Old Onslow conservation plan have been adopted by the Shire of Ashburton as a policy, which formalises Council’s stance on the site and assists in the implementation of the conservation plan. An important focus of the policy is the management of tourists and the development of facilities (camping, toilets, BBQs) along the Ashburton

Onslow Townsite Strategy Background Report January 2010
14
River approach. However, these are to be kept to a minimum distance of 500 metres from the townsite. Restoration works to the old police and jail complex have been undertaken to stabilise the ruins and conserve the structure, however, more work is needed to adequately protect the future of these structures.
3.3.2 Onslow Municipal Heritage Inventory
The Shire of Ashburton has prepared a Municipal Heritage Inventory in accordance with the Heritage of Western Australia Act 1990, which was adopted by Council in August 1999. Twenty-nine sites have been nominated within the Shire, with eight sites/buildings located within the Onslow townsite (Table 3.1).
Table 3.1: Onslow Municipal Heritage Inventory - Place List
Place No.
Name of Place Address Management Category
2 Beadon Bay Hotel Lot Second Avenue B
4 Former Police Residence-Onslow 1-3 Second Avenue B
5 Former Post Office & Residence-Onslow 19 Second Avenue B
13 Onslow Goods Shed/Museum Second Avenue C
18 Residence 26 Third Avenue 26 Third Avenue C
19 Residence: Sweeting 18 Third Avenue C
20 Residence: Turner 26 Third Avenue C
22 St Nicholas Church 19 Third Avenue B
Source: Shire of Ashburton Municipal Heritage Inventory - Place List
A Municipal Heritage Inventory is expected to undergo reviews every five years, however, this is rarely the practice, and no review has yet occurred to assess those sites or properties listed on the Review List in the Inventory. Council has identified several additional sites in the Onslow area, which may be considered as part of the next review. In addition to the Municipal Heritage Inventory, the Peedamulla Homestead ruin is listed on the Heritage Council of Western Australia’s Register of Heritage Places.
3.4 PLANNING IMPLICATIONS
It is important that Onslow's Aboriginal community be consulted at an early stage in order that their valued heritage places in and around the townsite be identified so that 'no-go' areas can be identified. It is important that the cultural landscape of Onslow's eight listed places be given due respect in the future planning and urban design of the townsite.

Onslow Townsite Strategy Background Report January 2010
15
Section Three
DEMOGRAPHIC PROFILE
4.1 DEMOGRAPHIC PROFILE
According to the 2006 Census, Onslow has a total resident population of 574, living in a townsite that occupies an area of 514 hectares. The Shire considers these figures to be a significant undercounting of the true population - particularly with the Aboriginal community.
The town is culturally diverse, with the Aboriginal community accounting for almost 37% of the population, the majority being from the Thalanyji, Yindjibarndi and Banyjima groups - the Thalanyji people being the traditional owners of lands in the Onslow district.
The key features of Onslow's population age structure are:
Above average proportion in the pre-school age group (0-4)
Relatively low proportion in the school-age population (5-14)
Relatively low proportion in the high school/college age population (15-24)
High proportion in the prime working age group (25-54)
Relatively high proportion in the pre-retirement age group (55-64)
Relatively high proportion in the retiree age group (65+)
This pattern tends to be more consistent with metropolitan Perth and WA than the other Pilbara mining towns (Table 4.1).
Table 4.1: Onslow Population Age Structure
Age groups: Males Females Total %
0-4 years 25 20 45 7.8
5-14 years 42 27 69 12.0
15-19 years 7 16 23 4.0
20-24 years 10 23 33 5.7
25-34 years 44 47 91 15.8
35-44 years 53 32 85 14.8
45-54 years 65 58 123 21.4
55-64 years 32 21 53 9.2
65-74 years 21 14 35 6.1
75-84 years 8 4 12 2.1
85 years and over 3 3 6 1.0
Total: 310 265 575 100.0
Source: ABS 2006 Census: Basic Community Profile: Onslow Urban Centre (2007)
The male/female ratio of Onslow is 54:46 in favour of males (Pilbara - 55:45; Perth - 49:51; WA - 50:50) and the median age of the Onslow population is 37 (Perth/WA - 36). Approximately 16% of the population is in the 5-19 age group (Perth/WA - 21%)(Table 4.2).
4.1.1 Ethnicity
People of Aboriginal ancestry make up 37% of the population of Onslow. At the 2006 Census, 77.4% of persons usually resident in Onslow stated that they were born in Australia. Other places of birth stated were: New Zealand 3.1%; British Isles 4.3%; Northern Europe 1.6%; South East Asia 1.6%; Africa (south of the Sahara) 0.7%; the Middle East and North Africa 0.5%; and North America 0.5%.

Onslow Townsite Strategy Background Report January 2010
16
Table 4.2: Onslow Comparative Population Age Structure: 2006
Onslow Pilbara Perth WA
Age Group % % % %
0-4 years 7.8 9.1 6.2 6.4
5-14 years 12.0 16.6 13.3 13.9
15-24 years 9.7 13.3 14.8 14.1
25-54 years 52.0 52.0 42.9 42.8
55-64 years 9.2 6.8 10.7 10.9
65 years and over 9.3 2.3 12.0 12.0
Total 100.0 100.0 100.0 100.0
Median Age 37 31 36 36
Source: ABS 2006 Census: Basic Community Profile: Onslow Urban Centre (2007) & comparative profiles.
4.1.2 Population Stability:
81% of residents lived at their current address 1 year ago.
48% of residents lived at their current address 5 years ago. Onslow has a relatively stable population with a low resident churn factor compared with the Pilbara and is more aligned with Metropolitan Perth and WA (Table 4.3).
Table 4.3: Onslow Churn Factor Compared with Perth & WA
Churn Factor Onslow Pilbara Perth WA
% % % %
Lived at current address 1 year ago 81.1 69.4 81.1 80.1
Lived at current address 5 years ago 48.3 34.2 54.9 53.9
Source: ABS 2006 Census: Basic Community Profile: Onslow Urban Centre (2007) & comparative profiles.
FIFO Population
Onslow's current FIFO population is estimated to be in the order of 150-200. This is a highly variable component, depended on the ebb and flow of resource project activity in the Onslow area. The proposed development of the Ashburton North area will generate further FIFO activity, which must be categorised according to whether the workers are 'construction – short term' or operational – long term'.
4.1.3 Population Growth Trends
With two notable exceptions, Onslow has recorded a steady increase in its population at the Censuses since 1966 (Table 4.4 and Figure 4.1). These figures are inflated with holiday visitors but they serve to demonstrate a general trend.
Table 4.4: Shire of Ashburton Town Population Trends: 1966-2006
Town 1966 1971 1976 1981 1986 1991 1996 2001 2006
Onslow 300 349 220 594 738 881 588 795 936
Pannawonica 0 0 0 1170 992 815 779 632 769
Paraburdoo 0 2,977 2,402 2,357 2,287 2,218 1,980 1,207 1,734
Tom Price 549 3,426 3,193 3,540 3,587 3,634 3,872 3,156 3,048
Shire Towns 849 6,752 5,815 7,661 7,604 7,548 7,219 5,790 6,487
Source: ABS 1996-2006 Censuses: Urban Centre recorded populations.

Onslow Townsite Strategy Background Report January 2010
17
Figure 4.1: Shire of Ashburton Town Population Trends: 1966-2006
4.2 HOUSEHOLD STRUCTURE & TRENDS
The average Onslow household size is 2.3 persons. Families make up the lion's share of households 67%; lone persons account for 32%; and group households 1% (Tables 4.5). Table 4.6 illustrates that Onslow has fewer family households and significantly more lone person households than Pilbara, Perth and WA as a whole.
Table 4.5: Onslow Townsite Household Structure
Household Type No %
Family households Couple families with children 45 19.7
Couple families without children 78 34.6
One parent families 23 10.1
Other families 5 2.2
Total family households 151 66.5
Lone person households 73 32.2
Group households 3 1.3
Total Households 227 100.0
Source: ABS 2006 Census: Basic Community Profile: Onslow Urban Centre (2007)
0
500
1000
1500
2000
2500
3000
3500
4000
4500
1966 1971 1976 1981 1986 1991 1996 2001 2006
Year
Peo
ple
Onslow
Pannaw onica
Paraburdoo
Tom Price

Onslow Townsite Strategy Background Report January 2010
18
Table 4.6: Onslow Comparative Household Structure: 2006
Household Type Onslow Pilbara Perth WA
Family households % 66.5 76.5 71.2 71.7
Lone person household % 32.2 20.2 25.0 24.7
Group households % 1.3 3.3 3.8 3.6
Average Household Size 2.3 2.9 2.5 2.5
Source: ABS 2006 Census: Basic Community Profile: Onslow Urban Centre (2007) & comparative profiles.
4.3 SOCIO-ECONOMIC STRUCTURE & TRENDS
Onslow's population is below par relative to Perth and WA against a number of key socio-economic indicators (Table 4.7). The key features are Onslow's low individual incomes; slightly above par household incomes; and low monthly home loan repayments and weekly rents.
Table 4.7: Onslow Socio-Economic Indicators
Household Type Onslow Pilbara Perth WA
Median individual income $/week $ 428 $ 887 $ 513 $ 500
Median household income $/week $ 961 $ 1,969 $ 1,086 $ 1,066
Median housing loan repayment $/month $ 870 $ 1,062 $ 1,300 $ 1,213
Median rent $/week $ 90 $ 80 $ 180 $ 170
Average number of cars per household 1.4 1.8 1.8 1.8
Source: ABS 2006 Census: Basic Community Profile: Onslow Urban Centre (2007)
4.4 PLANNING IMPLICATIONS
Onslow has one of the more stable populations in the Pilbara and many of its characteristics are atypical of the region. A potential influx of a new population would place significant pressure on the town's community structure. However, new long term residents would provide a critical population mass, justifying a higher level of community service and facility provision.

Onslow Townsite Strategy Background Report January 2010
19
Section Five
HOUSING
5.1 DWELLING STRUCTURE
According to the 2006 Census, Onslow had 467 dwellings (all forms), with 422 of them occupied (90%). A housing stock age and condition survey conducted in September 2009 recorded 269 permanent dwellings (205 detached and 64 attached dwellings). The majority of Onslow's residents live in a detached house, which accounts for 47% of the town's total dwelling stock. Caravans and cabins represent a highly significant proportion of the town's dwelling stock, mainly occupied by FIFO workers (Table 5.1).
Table 5.1: Onslow Housing Stock
Dwelling Type
Occupied Dwellings
Total Occupants %
Occupied Dwellings
Resident Occupants %
Separate house 198 46.9 177 77.6
Attached house (row, townhouse) 0 0.0 0 0.0
Flat unit apartment 18 4.3 20 8.8
Caravan/cabin (tourists & FIFO workers) 184 43.6 22 9.6
Other dwelling: 22 5.2 9 3.9
Total 422 100.0 228 100.0
Source: ABS 2006 Census: Basic Community Profile - Place of Enumeration & Place of Residence: Onslow Urban Centre.
5.2 HOUSING TENURE
The majority of the dwellings (62%) in the Onslow townsite are rented, with 30% of dwellings owner occupied (owned or being purchased).
The tenure pattern for Onslow correlates closely with the Pilbara region (33% owner occupied and 63% rented); and comparative figures for metropolitan Perth are 71% owner occupied and 26% rented; whilst the figures for WA are 69% owner occupied and 27% rented (Table 5.2).
Table 5.2: Onslow Comparative Housing Tenure Pattern
Household Tenure Onslow
% Pilbara
% Perth
% WA %
Owner Occupied (owned & being purchased) 30.1 33.1 70.8 69.0
Rented: Real Estate Agent 1.8 10.4 11.7 11.1
Rented: State Housing Authority 16.8 11.8 3.5 4.2
Rented: Private 9.3 3.2 8.6 8.4
Rented: Housing Cooperative/Community 11.9 2.4 0.4 0.7
Rented: Company & Other 20.4 33.0 0.8 2.0
Rented: Not Stated 1.8 2.0 0.6 0.8
Other Tenure & Not Stated 7.9 4.0 3.6 3.8
Total 100.0 100.0 100.0 100.0
Source: ABS 2006 Census: Basic Community Profile: Onslow Urban Centre (2007)

Onslow Townsite Strategy Background Report January 2010
20
Housing Providers: the main providers of non-private housing are:
Onslow Salt: 39 dwellings Department of Housing (Social): 38 dwellings Department of Housing (GROH): 20 dwellings (18 owned, 2 leased) Bindi Bindi Community: 23 dwellings (+3 visitors units) Shire of Ashburton: 7 dwellings
Department of Housing Dwellings
The Department of Housing owns a total of 38 dwellings in the Onslow township. Family 3-bedroom houses account for the majority (74%) of the housing stock (Table 5.3). The majority of the properties are of cement construction (53%) with steel cladding accounting for the lion's share of the balance (37%).
Table 5.3: Onslow Department of Housing (social) Dwelling Stock
Household Tenure 2 Bedrooms 3 Bedrooms 4 Bedrooms Total
Family Houses 4 28 2 34
Singles Houses 4 0 0 4
Total 8 28 2 38
Source: Department of Housing July 2009
Department of Housing (GROH) owns two vacant duplex lots and a single house lot in Onslow (total yield 5 dwellings). The Department of Housing anticipates construction of five dwellings in 2010/11 under its Back-up Program. The Department also has plans to build three 3 bedroom town houses on Lot 661 27 Simpson Street in Fiscal 2009/10. Any future housing development will be informed by the Pilbara Housing study and budget allocation.
5.3 HOUSING AGE & CONDITION
In general, Onslow's housing stock tends to be aging and in relatively poor condition as evidenced by a survey undertaken by the Department of Planning in mid 2009. The average age of the Department of Housing's properties is 39 years, with ages ranging from 16 years to 50 years. The most recent house was constructed in 1993.
5.3.1 House Values & Prices
There are relatively few houses for sale or rent and in consequence there has been a significant rise in house prices over recent months. Most of the available properties are older, of substandard building materials, and generally in poor condition. In most cases, the value is in the land rather than the dwelling structure.
5.3.2 Temporary Housing
The supply of transit workforce accommodation (TWA) has increased significantly over the past decade. The largest establishment providing TWA is Beadon Creek Caravan Park (Beadon Village), which has 80 units (72 single, 4 double and 4 cabins sleeping 4).
5.4 PLANNING IMPLICATIONS
There is a latent demand for appropriate housing within the existing community which needs to be taken into account when forecasting Onslow's future housing requirements. Consideration needs to be given to the condition of the existing housing stock and the potential to renovate or redevelop. Additional land needs to be allocated for the development of new housing, together with the provision of associated community and utility infrastructure.

Onslow Townsite Strategy Background Report January 2010
21
Section Five
COMMUNITY FACILITIES
6.1 OVERVIEW
Apart from a job and a house, the provision of education and health services are considered to be the key factors that attract workforces and retain families. The quality of the local environment and opportunities for recreation are also significant determinants. As a relatively remote settlement, Onslow is required to be self-contained in the provision of community facilities. The town's coastal location provides an attractive setting and offers opportunities for various forms of marine recreation.
6.2 EDUCATION
Onslow has one multi-functional school, which was built in late 2005. The school has a student population of around 110 students from Kindergarten to Year 12. Approximately 65% of these students are Aboriginal. The school's regional location makes it part of the Department of Education's Remote Teaching Service, whereby staff are appointed through a merit selection process. Onslow Primary School supports programs that provide equal access for remote students. Literacy, numeracy and community partnerships are the school's priorities.
Table 6.1: Onslow School Enrolment Trends: 2004-2008
Education Level 2004 2005 2006 2007 2008
Pre-Compulsory 12 12 8 12 5
Primary 63 71 67 71 77
Lower Secondary 18 23 19 20 18
Upper Secondary 2 5 7 9 10
Total 95 111 101 112 110
Source: Department of Education & Training 2008.
Table 6.2: Shire of Ashburton Education Facilities: 2020
Primary Schools Secondary Schools TAFE Colleges
Settlement Existing Potential Existing Potential Existing Potential
Onslow 1 1 ? 0 1 1
Pannawonica 1 0 0 0 1 1
Paraburdoo 1 1 0 0 1 1
Tom Price 2 2 1 1 1 1
Karratha 5 6 2 2 1 1
Note: TAFE colleges to be verified
6.2.1 Expansion Capacity
Anticipated resource development has the potential to significantly increase the demand for school places. The existing primary school has the potential to expand its capacity of 8 classrooms to 16 with the use of 8 demountables. If the current average class size of 20 was increased to 30 (the recommended maximum), the school would have a capacity for 480 students. This is considered to be achievable but it would result in an overcrowded school site. The entire block has an area of 3.2 hectares of which the school occupies approximately 2.4 hectares.

Onslow Townsite Strategy Background Report January 2010
22
6.3 HEALTH SERVICES
The sole health facility in the town is the Onslow District Hospital, which functions as an eight (8) bed emergency-nursing post facility. Doctor services are provided on a fly-in fly-out basis a couple of days a week, and most specialist medical services are accessible only once every few months. During the peak holiday season (June-September), the town's population swells to 3,000 to 4,000 with grey nomads, which puts significant pressure on the town's health services - justifying a resident doctor in Onslow (Pilbara News 14 May 2008). To provide access to higher order health facilities, great reliance is placed on the Royal Flying Doctor Service (RFDS) and the Patient Assisted Transport Scheme (PATS).
Table 6.3: Shire of Ashburton Health Facilities Status & Size: 2020
Settlement Facility Type Medical Nursing Support Admin Other
Onslow District Hospital 0.2 9.1 - 1.7 4.7
Paraburdoo District Hospital - 7.2 - 0.6 3.6
Tom Price District Hospital - 10.9 1.1 2.3 5.9
Karratha District Hospital 9.9 43.0 2.1 21.0 18.8
Note: Full time equivalent staff numbers Source: HRIS Data Warehouse 2008
The existing hospital was built in 1970 and a significant proportion of its walls are made of asbestos. Anticipated resource development has the potential to place significant demands on the hospital's services - both from the construction workforce and from the operational workforce and their families. Whilst it is expected that the potential resource industries would have on-site medical facilities and staff, the expanded residential workforce and their families would require the services of a public hospital. In addition, the town's ageing population will require increasing access to public health services - this is particularly the case with the rapidly increasing indigenous aging population. Should significant resource development occur, It would be preferable to construct a new hospital facility, rather than upgrade and expand the existing structure. To enable this to occur, an adjacent tract of land has been set aside for future hospital expansion purposes. The whole site, which includes 10 nurses units, has an area of 4.02ha.
Health Support Services
There is a need to improve health support services in Onslow, such as aged care facilities and respite care. Some consideration of this has been given in the Structure Plan Review, with additional land available for public purposes being located near to the commercial and civic area. Additional land included in the hospital site could also be used for expanded aged care and/or other health related services.
6.4 RECREATION
The Pilbara's high daytime temperatures in the summer months generally discourage daytime active sport participation, as well as walking and cycling to schools and local centres. Active sport usually takes place in the evenings, whilst walking and cycling tends to take place in the early mornings as well as the evenings. Greater participation in active recreation throughout the day does, however, occur in the cooler winter months. The demand for open space and recreation facilities in Onslow is a function of recreation trends, the town's demographic profile, as well as the town's coastal location. The arid climate of the Pilbara imposes a significant constraint on use patterns and the provision of open space and recreation facilities.

Onslow Townsite Strategy Background Report January 2010
23
Sports facilities in the town include:
1 fully lit oval (AFL and cricket)
2 tennis courts,
2 basketball courts,
2 netball courts
1 bowling green.
Multi-Purpose Centre
A multi-purpose centre is planned to be built by the end of 2010 at a cost of $5.2 million. This will provide a multi-purpose indoor sports court with spectator seating, gymnasium, day care facility, kitchen and change room facilities. The centre would also be used as an emergency evacuation centre for adverse natural events such as cyclones, flooding and bush fires.
Ashburton (Onslow) Race Club
The club is located approximately 12 kilometres from the Onslow townsite. The Race Club was developed in its current location at around the time of the relocation of the Onslow Townsite, in the late 1920s to early 1930s. In addition to regular race meetings, a rodeo is held each winter.
Marine & Beach Recreation
Onslow's residents and visitors undertake marine based recreation such as swimming, boating, fishing and diving at venues such as Sunrise and Sunset Beaches, Four Mile Creek, Thevernard and Direction Islands and the Ashburton River. There are public boat ramps at Beadon Creek and Four Mile Creek. Almost 15% of Onslow households own a motorised recreational vessel (Table 6.5). Because of the size of the town and its coastal location there is currently no swimming pool in Onslow.
Table 6.4: Shire of Ashburton Major Recreation Facilities
Settlement Indoor Sports
Complex Fully Lit Ovals
Swimming Pools Marine Facilities
50m 25m Harbour Boat Ramp
Onslow 1 1 2
Pannawonica 1 1
Paraburdoo 1 1
Tom Price 1 1 1
Table 6.5: Shire of Ashburton Boat Ownership: 2006
Settlement: Post Code
Registered Boats Residents Households
% Residents Owning Boats
% Household Owning Boats
Onslow (6710) 76 845 518 9.0% 14.7%
Pannawonica (6716) 62 686 232 9.0% 26.7%
Tom Price (6751) 104 2,721 999 3.8% 10.4%
Paraburdoo (6754) 66 1,940 693 3.4% 9.5%
Total 308 6,192 2,442 5.0% 12.6%
Source: DPI Boat Registrations 2006; Australian Bureau of Statistics 2006 Census Postal Areas

Onslow Townsite Strategy Background Report January 2010
24
6.5 COMMUNITY SUPPORT
Child Care
Onslow has one occasional childcare centre providing 14 places (Table 6.6). The majority of community and stakeholder surveys in the Pilbara in recent years have highlighted the need for improved child care services. Industry places a high value on childcare places. Child care allows the primary care giver the opportunity to rejoin the workforce, thus increasing the size of the local labour force without the need for additional housing. This has direct productivity and cost saving benefits for industry.
Table 6.6: Shire of Ashburton childcare centres: 2008
Long Day Care Occasional Care Family Day Care
Outside school hours
Settlement No. of
Centres No. of Places
No of Centres
No of Places No of Centres No of Centres
Onslow - - 1 14 - -
Pannawonica 1 28 - - - -
Paraburdoo 1 23 - - 1 1
Tom Price 1 36 - - 1 -
Total 3 87 1 14 2 1
Source: PDC Licensed Child Care Providers May 2008
Child Protection
An office of the Department of Child Protection (DCP) is located in Onslow. Council Offices
The Shire operates its coastal services from Onslow. It occupies a building with an area of
1100m2
(GFA), which includes a community library and hall.
Places of Worship
There is one place of worship in Onslow - St Nicholas Anglican Church. The Catholic community also makes use of the facility on a periodic basis.
6.6 COMMUNITY SECURITY
Onslow has a police station and a separate courthouse (Table 6.7). The court is serviced by a Carnarvon-based magistrate and a Pilbara prosecutor.
Table 6.7: Shire of Ashburton Police Stations & Courthouses
Settlement Station Status Courthouse Sworn Officers
Onslow Station Courthouse 5
Pannawonica Station in station 2
Paraburdoo Station in station 2
Tom Price Station Courthouse 8
Karratha New Station U/C Courthouse 29
Source: WA Police: Karratha District Office 2008
Onslow Townsite Strategy Background Report January 2010
25
6.7 COMMERCIAL & OTHER FACILITIES
Commercial Facilities
The town centre has an estimated retail floorspace of approximately 1,360m2 which
accommodates a limited range of commercial facilities:
Supermarket
Post Office
Hardware shop
Café Second Avenue
Trick Electronicks
Nikki's Restaurant
There is no bank in Onslow - the nearest bank is in Karratha. Access to cash is provided by ATMs in the supermarket and hotel. Onslow residents need to travel to Karratha for higher order retail services.
Other Facilities
Government services, such as motor registrations and boat licenses are located at the Onslow police station.
The nearest office for most other government services is in Karratha, for example: Centrelink and the Department of Housing. However, some government departments provide 'head office' services from the Gascoyne Region.
Standard of Service Provision
An audit carried out in 2003 on the infrastructure and services owned by the council, found that most of the recreational and community facilities in the town are over 40 years old and in poor condition (CCWA: Northern Strategic Industry Areas ESE Study 2003). Since that time however the Shire has committed significant resources to the upgrade of these facilities. Service providers have indicated that the welfare and wellbeing of the community is not limited to the availability of housing. The general health of the community is affected by activity, recreation, community involvement, community development, strategic planning for all uses, integration and efficiency. 6.8 PLANNING IMPLICATIONS
The basic level of servicing is a function of the size of the Onslow township and its relative isolation. This may have implications for Onslow’s ability to attract and retain new residents. While potential new residents from other country areas could accept the servicing issues, the majority of city residents may find it difficult to accept the servicing trade-offs that come with the relaxed lifestyle of a smaller town. The anticipated influx of new long term residents would justify a higher threshold of community facility and service provision.

Onslow Townsite Strategy Background Report January 2010
26
Section Seven
ECONOMIC DRIVERS
7.1 ECONOMIC BASE
Onslow Salt is currently the most significant enterprise in the township, employing over 20% of the town's working population (Table 7.1). Table 7.1: Onslow Employment Structure
Industrial Sector Male Female Total
No % No % No %
Agriculture & fishing 9 6.4 0 0.0 9 3.6
Mining 46 32.6 5 4.5 51 20.2
Manufacturing 9 6.4 0 0.0 9 3.6
Construction 24 17.0 3 2.7 27 10.7
Retail, wholesale, hospitality & services 12 8.5 37 33.0 49 19.4
Business, property, media, IT & consulting 3 2.1 12 10.7 15 5.9
Community & governance 21 14.9 52 46.4 73 28.9
Other 17 12.1 3 2.7 20 7.9
Total (excludes not stated) 141 100.0 112 100.0 253 100.0
Source: ABS 2006 Census: Basic Community Profile: Onslow Urban Centre (2007)
7.1.1 Onslow Salt
Onslow Solar Salt Pty Ltd wholly owned by Mitsui and Co Ltd. operates a 2.5 million tonne per annum solar salt field. Mitsui and Co. Ltd. acquired the solar salt field from AKZO Nobel in 2006. The proposal was first raised in the 1960’s although development did not progress until 1989, when Gulf Holdings submitted a proposal to the EPA to produce and ship salt from Onslow - the project cost $80 million. Specific project infrastructure includes a 2.5 million tonnes per annum wash plant, salt stockpile area, ship loading jetty and conveyors and a 10 kilometre dredged shipping channel to cater for 45,000 tonnage (dead weight) ships. The project has provided a significant boost to the Onslow economy, and has seen considerable activity in the town. Onslow Solar Salt currently has 65 employees and owns 39 homes in the town. Additionally a number of personnel employed by haulage, maintenance and engineering contractors are supported by the site. The Onslow Solar Salt Agreement Act 1992 and the EPA environmental conditions that have been applied to the Onslow Solar Salt Project also set out a number of community infrastructure contributions to be made by the proponent. Section 14 of the Act requires the company to: 'Achieve assimilation of workers employed by the company into Onslow; and pay the State the capital cost of establishing and providing additional services, works and facilities and associated equipment where those additional items are made necessary due to the operations of the company in Onslow'.

Onslow Townsite Strategy Background Report January 2010
27
7.1.2 Oil & Gas Industries
In late 2008, Chevron, BHPB Petroleum and Exxon Mobil advised the State that they favour the Ashburton North area as the site for liquefied natural gas (LNG) facilities to commercialise the off-shore Wheatstone and Scarborough fields. BHPB Petroleum is also considering locating a domestic gas plant at Ashburton North to process gas from its Macedon field. In December 2008, the Premier announced, in a media statement, that a new Strategic Industrial Area would be created at Ashburton North, 11 kilometres south-west of Onslow.
The business case for locating the LNG facilities at the proposed Ashburton North Strategic Industrial Area (Ashburton North SIA) is to provide gas processing services to a number of relatively small gas fields in the southern Carnarvon Basin, which are currently sub-economic due to high infrastructure costs, but which could become commercial if costs are shared, particularly the shipping channel, the jetty and the LNG processing plant.
The Ashburton North SIA port and industrial land is to be restricted to LNG and hydrocarbon industries to facilitate infrastructure sharing, ensure safety and product compatibility and minimise disruption to neighbouring industries. It is proposed that the Ashburton North SIA would comprise:
Port Area, including marine approaches. The port area is to comprise a shipping channel, berthing pockets and turning basin(s), trunkline, common-use facilities (e.g. Materials Offloading Facilities, LNG Jetty);
Common User Coastal Area (CUCA), including laydown area, administration facilities and dedicated proponent areas (e.g. LNG tank(s), slugcatcher(s) and pipeline areas);
Industrial land area, consisting of dedicated proponent sites, a common-use camp site and some unallocated land areas; and
Common-use infrastructure corridor(s), including transport corridors and domgas pipeline(s).
The high-risk nature of LNG developments, the constrained area of coastal land at Ashburton North and differing proponent timeframes means that successful development of the Ashburton North SIA to allow all proponents to efficiently use the site will be a complex task, requiring well thought out planning and design.
7.1.3 Onslow Fisheries
The Ashburton Fisheries and Fresh Fish Onslow (discussed collectively as AF) are local to Onslow and make use of the Beadon Creek Harbour and property in the light industrial area as part of their business. AF supplies fresh fish to the Pilbara region, including Karratha, Port Hedland and Tom Price, and is one of the regions only fresh food providers. AF also delivers to the Metropolitan Region, supplying supermarket chains such as IGA and Action. AF employs four staff members in Onslow. The catch is affected by similar environmental factors operating in Exmouth and the success of tiger prawn breeding stock management. Environmental factors can also vary catch composition in this fishery - high rainfall years may result in a decline of tiger prawn catch and a corresponding increase in the banana prawn catch. The annual catch for the Pilbara Demersal Finfish Fisheries in 2005 was 3005 tonnes, with an estimated value of $11.6 million through trawl, trap and line fishing methods (Department

Onslow Townsite Strategy Background Report January 2010
28
of Fisheries 2006). The annual catch in the Onslow Prawn Managed Fishery in 2005 was 85 tonnes with an estimated value of $1 million.
7.1.4 Beadon Creek Marine Servicing
Maritime servicing companies, such as JAG Marine, Australian Marine Services, JB Marine, Bagwan Marine and Svitzer currently operate from Beadon Creek. 7.1.5 Tourism
Tourism is recognised as a small but significant economic activity in Onslow. Attractions in and around Onslow include fishing and boating, and tourists may visit Old Onslow and the nearby offshore islands. The existing tourism infrastructure in the townsite of Onslow generally caters for 'in-transit' visitors (mainly 'grey nomads') and drive-in support agency personnel. The use of tourism facilities in Onslow is highly seasonal, responding to weather conditions and nature-based activities. The months between May and September represent the most active period of the year for tourism operators, when visitors come to enjoy the moderate temperatures and pleasant sea breezes.
Onslow tourism operators confirm there to be a shortage of sites, to cater for the mobile visitor population during peak periods. Additionally, tourism operators indicate that some of the tourism accommodation is being occupied by permanent residents. This type of residential use of tourism facilities and the evident lack of capacity in the town significantly constrains the 'real' tourism capability of the town. Table 7.2 provides a summary of the accommodation available in Onslow and nearby Mackerel islands during 2007/08. Since then there has been a significant increase in the number of units in response to a growing demand for accommodation by resource sector workers.
Table 7.2: Onslow Visitor Accommodation
Visitor Facility Rooms Units Powered Sites
Un-Powered Sites
Camp Sites
Beadon Bay Hotel 14
Onslow Mackerel Motel 13 4
Onslow Sun Chalets 7 9
Beadon Bay Village 28 4 53 10
Ocean View Caravan Park 8 101 4 14
Mackerel Island 30 1
Total 92 26 154 4 24
Source: GHD tourism operator survey 2007
7.1.6 Pastoral Industry
A number of pastoral stations operate around the Onslow area, including Minderoo, Peedamulla and Urala. These stations use Onslow as a service centre and are the only pastoral stations with post office boxes in Onslow, demonstrating their close relationship with the town. Minderoo Station runs a mixture of sheep and cattle. Urala runs sheep and cattle and has some support infrastructure for the Griffen Gas project and Peedamulla is a cattle station.

Onslow Townsite Strategy Background Report January 2010
29
7.2 SERVICE SECTOR
The government and community sectors employ 29% and the retail, wholesale and hospitality services employ 19% of Onslow's working population. Estimates of employment in the main service sectors are:
Retail centre (30)
Hotels, motels and caravan parks (20)
School (40)
District Hospital (10)
Police/Licensing (5)
Other State services (5)
Shire (5)
7.3 PLANNING IMPLICATIONS
7.3.1 Industrial Land
Almost all of the industrial lots are being utilised. Over 60% of the industrial land available is subject to inundation during cyclone events. Much of the industrial land is utilised for storage and material lay-down. The general quality of the built form tends to be poor.
Table 7.3: Industrial & Commercial Zonings
Landuse LPS Zone Area ha LPS Area %
Industry Industry 11.12 2.16
Strategic Industry 11.48 2.23
Commercial Commercial & Civic 8.99 1.75
Tourism 24.88 4.84
7.3.2 Commercial Land
A significant proportion of available commercial land in Onslow is not used for commercial or civic purposes. Residential dwellings largely occupy commercial land available to the east end of the commercial area, and these dwellings are generally kept to a lesser standard than exists in the southern areas of the town. The existing commercial area is subject to flooding during extreme weather events, and this has been associated with the lack of utilisation for commercial purposes and would account for the general standard of building maintenance in this area. Earlier consultation with the business community indicates that commercial land located on higher ground would be more likely to be developed and maintained based on the reasonable assurance that the land would not be regularly impacted by frequent severe weather events.
7.3.3 Tourism Land
Land is available for tourism in Onslow at several locations, with vacant land located near Bindi Bindi Community on Sunset Beach and along Beadon Creek Road near Beadon Creek. The majority of this land is currently not utilised, with no plans currently proposed for the land to be developed. Again, nearly all of this land is located in flood prone areas, making large-scale infrastructure expenditure unlikely, however, potential industrial workforces may utilise these land areas for their transient, construction and maintenance workforce.

Onslow Townsite Strategy Background Report January 2010
30
Section Eight
ROADS & TRANSPORT
8.1 ROAD TRANSPORT
Road access to Onslow is via Onslow Road, an 80 kilometre branch off the North West Coastal Highway. Main Roads Western Australia is responsible for this road. Twitchen Road also provides an unsealed link to the highway, although this is not accessible at all times of the year. Access to Ashburton North is via Twitchen Road. There is likely to be a need to improve large sections of Onslow Road between the town and the North West Costal Highway. Although the road is considered adequate for current uses this may not be the case if rapid expansion of industry was to occur. Most of the road pavement is over 40 years old. The primary town access road is prone to flooding in cyclonic and storm related events, cutting the townsite of Onslow off from evacuation or emergency support via road in an extreme event. This also affects the aerodrome, with flooding disconnecting the townsite from the aerodrome. The need to create an all weather sealed link between the town site and the aerodrome has been identified since a 1985 Department of Land Administration Structure Plan. This requirement has been supported by the Shire of Ashburton ever since and is considered essential in future planning for any expansion of Onslow. There is no public transport in Onslow, but there are two local taxi services, licensed by the Department of Transport.
8.2 WATER TRANSPORT
8.2.1 Beadon Creek Harbour
Beadon Creek Harbour provides access, anchorage and support to smaller vessels, with an approach area dredged to -3 metres AHD. Beadon Creek is developing into a significant maritime servicing base and is the principal boat-launching facility for recreational craft, accessing the Onslow coastal waters. The Harbour features a pontoon jetty and supports local fisheries and some tourist activities in the form of fishing charters and boat trips to the Mackerel Islands. Maritime servicing companies, such as JAG Marine, Australian Marine Services, JB Marine, Bagwan Marine and Svitzer currently operate from Beadon Creek. The recent announcement of the Gorgon project has resulted in further requests for the use of the boat harbour. The Department of Transport (DoT) estimates that approximately a third of off-shore servicing activity associated with the Gorgon development at Barrow Island would use Onslow as a base. DoT reports that there may be an additional 24 vessels associated with the project, making use of the Beadon Creek facility for re-fuelling purposes. This will have significant implications on the harbour's capacity particularly during the Cyclone Season. This anticipated increased level of demand may necessitate the expansion of the fuel tank farm's capacity of 100 kilolitres. It is anticipated that the need to expand the servicing of off-shore oil and gas developments, such as the Wheatstone and Gorgon projects, will cause greater utilisation of the harbour for

Onslow Townsite Strategy Background Report January 2010
31
commercial activities. Construction of new wharfs and increased dredging of the channel may be necessary. However, the harbour's recreational function would need to be maintained. The Shire of Ashburton Strategic Plan 2004-2009 identified as one its goals the facilitation of a sustainable fishing industry at Onslow. The Shire of Ashburton Strategic Plan 2007-2011 further identified fishing in the area one as of the qualities that people in the area most valued.
8.2.2 Onslow Salt Export Wharf
Onslow Salt operates a jetty and loading platform to the west of Beadon Creek and a 10 kilometre dredged channel is maintained to a depth of 10.8m, to facilitate access and berthing of ships exporting solar salt. It is not anticipated that third party access to these facilities would be permitted.
8.3 AIR TRANSPORT
Onslow is served by Karratha airport, located some 335 kilometres by road to the north east, which provides the West Pilbara with schedule air services to Perth and other destinations in Australia. However, Onslow has a sealed landing strip managed by the Shire of Ashburton.
Onslow Airport
The Onslow airport currently consists of two gravel runways of 1,600m and 990m in length. Use of the airport is restricted to Code 3 aircraft and is not suitable for large passenger aircraft. The main runway is limited to a take off mass of 20 tonnes due to the length and strength of the runway. Both runways are 30m wide and have recently been upgraded (2002-03) to raise their level and reduce the risk of flooding. Some work is still required to meet Civil Aviation Safety Authority (CASA) standards. The Shire of Ashburton has also applied for funding to seal the airport however the pavement proposed would require further strengthening to accommodate large aircraft such as Boeing 717’s or 737’s. The upgrade of Onslow Airport is required if larger passenger aircraft are required to service the town. It is most likely that demand will be highest during the construction phases of each project with demand in the longer term heavily dependent on the overall level of development achieved at Ashburton North. The Onslow Multi-User Infrastructure Study identifies an order of magnitude cost of $7.67 million for upgrading the airport to accommodate larger passenger aircraft. An alternative to this would be the creation of a new airport, the cost of this is identified as being in the order of $13.46 million. Further work is required to fully assess the implications of expanding airport facilities at Onslow. Likely demand and potential service operators must be considered as well as the potential to serve demand by other transport modes.
Table 8.1: Onslow Airport
Characteristic
Operating Agency: Shire of Ashburton
Daily Passenger Services (RPT): Nil
Aircraft Suitability (type): Code 3 (Fokker 50)
Runways (No): 2
Runway Lengths: (1): 1600m; (2): 990m
Runway Widths: (1): 30m; (2): 30m
Runway Surface: Gravel base with bitumen seal
Navigational Aids & Runway Lighting Nil
Customs & Immigration Facilities: No

Onslow Townsite Strategy Background Report January 2010
32
8.4 PLANNING IMPLICATIONS
8.4.1 Primary Town Access
The main access road is prone to flooding in cyclonic and storm related events, cutting the townsite of Onslow off from evacuation or emergency support via road in an extreme event. This also affects the aerodrome, with flooding disconnecting the townsite from the aerodrome. To remedy this, it is proposed to establish primary access to the Onslow townsite from the south of the existing residential areas. The primary access road proposed would connect with the proposed main street/boulevard extension of the commercial area, creating a clear access to the town centre from the entrance road.
8.4.2 Airport
Should an expansion of services be required at the airport as a result of major industrial developments, there will be constraints on its future development in its existing location. As a consequence, a site for a new airport will need to be identified.
8.4.3 Beadon Creek
The servicing of off-shore oil and gas developments, such as the Wheatstone and Gorgon projects, will cause greater utilisation of the harbour for commercial activities. Construction of new wharfs and increased dredging of the channel may be necessary. However, the harbour's local fishing and recreational function would need to be maintained.

Onslow Townsite Strategy Background Report January 2010
33
Section Nine
UTILITY INFRASTRUCTURE
9.1 WATER SUPPLY
The Onslow town water supply services the town of Onslow, which is a regional support centre for the offshore oil and gas industry, as well as supporting tourism, pastoral, fishing and the salt mining industry. Water for Onslow is sourced from the Cane River alluvial aquifer and there is a water source protection plan for the borefield. The Onslow township's current water use is 0.243 gigalitres/annum (2008/09) and its existing supply is considered to be close to capacity. The water supply in Onslow is generally considered by the community to be insufficient and unreliable. Investigations undertaken by the Water Corporation are addressing this issue, and more detailed investigations are ongoing.
Table 9.1: Onslow Water Consumption: 2008/09
Landuse Class Accounts Total Consumption Consumption/Unit
No. kL kL
Residential 273 121,549 445
Commercial 52 66,200 1273
Other 36 55,200 1533
Total 361 242,949 673
Source: Water Corporation 2009
Water pressure is an important component of the water supply issue, and the development of an additional gravity fed tank would be a significant improvement. The Water Corporation is considering establishing a new water supply tank on the 15m AHD hill in the north west corner of the existing reserve near the aerodrome. The site identified will have good access to an infrastructure corridor and is supported by the Water Corporation. The Water Corporation’s potential desalination plant can also be accommodated on a site adjacent to the new water supply tank referred to above. An additional benefit of this proposed site is the servicing of proposed industrial land near the aerodrome, which would not otherwise be able to be serviced by Water Corporation.
Water Supply Review
The key features of a water supply review would include:
Identification of a possible location for a future water supply tank, and potentially
collocation of desalination plant should this occur.
Opportunities for detailed water supply planning as a result of more accurate lot/dwelling
yields in Onslow.
9.2 ENERGY
Electricity is provided to the Onslow townsite by a 3.6MW gas turbine power plant operated by Onslow Electric Power. The power plant is fuelled by natural gas until recently from the Griffin Venture and now from the Dampier trunk pipeline. This generation capacity is augmented by emergency diesel generators provided with 15 days of fuel supply.

Onslow Townsite Strategy Background Report January 2010
34
The power plant supplies Onslow Salt directly and provides power to the township by a reticulation network operated by Horizon Power. Onslow's power is distributed via a 11kVA overhead network. The existing power supply is considered to be inadequate as the voltage is too low (200 volts) and the supply is considered to be 25% under capacity. This forces occasional Onslow salt stockpiling shut downs when ship loading. There is an urgent need to significantly upgrade the town's power supply capacity, to satisfy both current and future demand.
9.3 WASTE WATER
The Onslow wastewater treatment plant (WWTP) has a capacity for 1,000 EP (equivalent population), which was previously considered sufficient to cater for natural growth in the town, however, there is anticipated further requirement of land for the water treatment ponds, the nature of which will be confirmed once lot/dwelling yields have been analysed by the Water Corporation. An expansion of the water treatment ponds to accommodate future growth at Onslow would be subject to an odour risk impact assessment. The WWTP provides benefits to the community and the environment such as improved public health and amenity, more efficient utilisation of land and certainty for the land development industry and potential for improved recycling, re-use and recovery of useful by-products, for instance: bio-solids. Use of treated effluent from the WWTP will be discussed with the Shire should the need arise. Ideas for re-use include the watering of a golf course, however, Water Corporation consider that the volume of waste water currently produced/treated at Onslow would not be significant enough to use on a whole golf course, but might be able to service parts of it. To ensure the protection of this essential piece of public infrastructure from encroachment of incompatible land uses, there is a 500m buffer zone around the WWTP. Notwithstanding its benefits, its location has considerable impact on the potential for residential expansion. The 500 metre buffer required for odour constrains future development to the south. Whilst this is not the only constraint to expansion in this area, it should be considered in more detail, and an alternative site may be required to accommodate additional townsite expansion in the long term.
Bindi Bindi Wastewater Treatment Ponds
The Bindi Bindi Community is serviced by its own effluent treatment pond, which is located in the future residential expansion area. Negotiations with the Aboriginal Lands Trust, Department of Housing and Works, the Community, Water Corporation and the Shire are underway for the decommissioning of the facility to allow for the expansion of the residential area. In the interests of efficiency of land and infrastructure, the community would be connected to the Water Corporation facility.
9.4 COMMUNICATIONS
The following modes of communications are provided to the Onslow township:
Telstra telephone landlines
ADSL, wireless and satellite Internet access
Telstra's Next G mobile phone network. In addition, there are a number of significant communications towers in the town for television, emergency services and other functions.

Onslow Townsite Strategy Background Report January 2010
35
9.5 WASTE MANAGEMENT
Onslow has a landfill site located to the south of the proposed urban extension area. The facility is licensed by the Department of Environmental Protection (DEP) as a Class 2 site, meaning that it can only cater for putrescible waste and low-level hazardous material. This site is nearing the end of its operational life and is in the process of being relocated. A transfer station will be constructed on part of the existing site, or other appropriate site, to provide a convenient and more hygienic service to the community. The future location of the transfer station, whilst currently proposed within the existing site, could be negotiated to best respond to the proposed town expansion. The transfer station would require a 200 metre buffer. The Pilbara local governments, through the Pilbara Regional Council, have developed a Regional Waste Management Plan to improve the management and use of landfills, extend the life of existing landfills and if possible replace the smaller landfills with transfer stations equipped to meet the needs of the people and the environment.
9.6 PLANNING IMPLICATIONS
The supply of potable water and energy are major constraints to the development of the townsite. Expansion of their capacities is fundamental to Onslow's expansion. The existing capacities constrain even modest new development, including small infill sites within the current town site. The odour buffer for the waste water treatment plant represents a major constraint to the town's southward urban development. However, the capacity of the plant to accommodate further urban development could be achieved within the existing buffer zone with the provision of additional treatment ponds.

Onslow Townsite Strategy Background Report January 2010
36
Section Ten
URBAN GROWTH SCENARIOS
10.1 CONTEXT
The potential development of the Ashburton North SIA will result in significant population growth in Onslow, since it will be required to accommodate the residential operations workforce and accompanying families. To facilitate this development, there will need to be significant changes to Onslow's urban structure to accommodate the residential, community and civic needs of an anticipated residential population expansion. 10.2 BASE POPULATION
At the 2006 Census the resident population of Onslow, as defined by the ABS, was 573 persons. However, the Shire contends that the Census for 2006 in Onslow and other areas was significantly flawed. The Shire has evidence to indicate that the 2006 population for Onslow was closer to 700 persons. However, the ABS Census data provides guidance in relation to the general characteristics of the population.
10.3 DEVELOPMENT SCENARIOS
The 8,000 hectare Ashburton North SIA site will be accessible by multiple users (anticipated to be Chevron, BHP Billiton/ExxonMobil). Ashburton North SIA is expected to place development pressures on Onslow and will result in the need for new residential, commercial, industrial and recreational areas.
Due to the uncertainties regarding the scale of development at Ashburton North, development scenarios have been generated to gauge the potential range of demand for housing and residential land. Five scenarios have been considered:
Scenario 1: Base Case - additional base employment of 100, without the development of Ashburton North (ANSIA) - 160 additional working population.
Scenario 2: Low Growth - additional base employment of 250 with 25% development of
ANSIA - 400 additional working population. Scenario 3: Medium Growth additional base employment of 500 with 75% development of
ANSIA - 800 additional working population. Scenario 4: High Growth - additional base employment of 1000 with 100% development
of ANSIA - 1600 additional working population. Scenario 5: Extreme Growth - additional base employment of 1500 with over 100%
development of ANSIA - 2400 additional working population.
Table 10.1 details the base and indirect employment and the resulting household formation, housing demand and residential land required to provide for the additional dwellings.
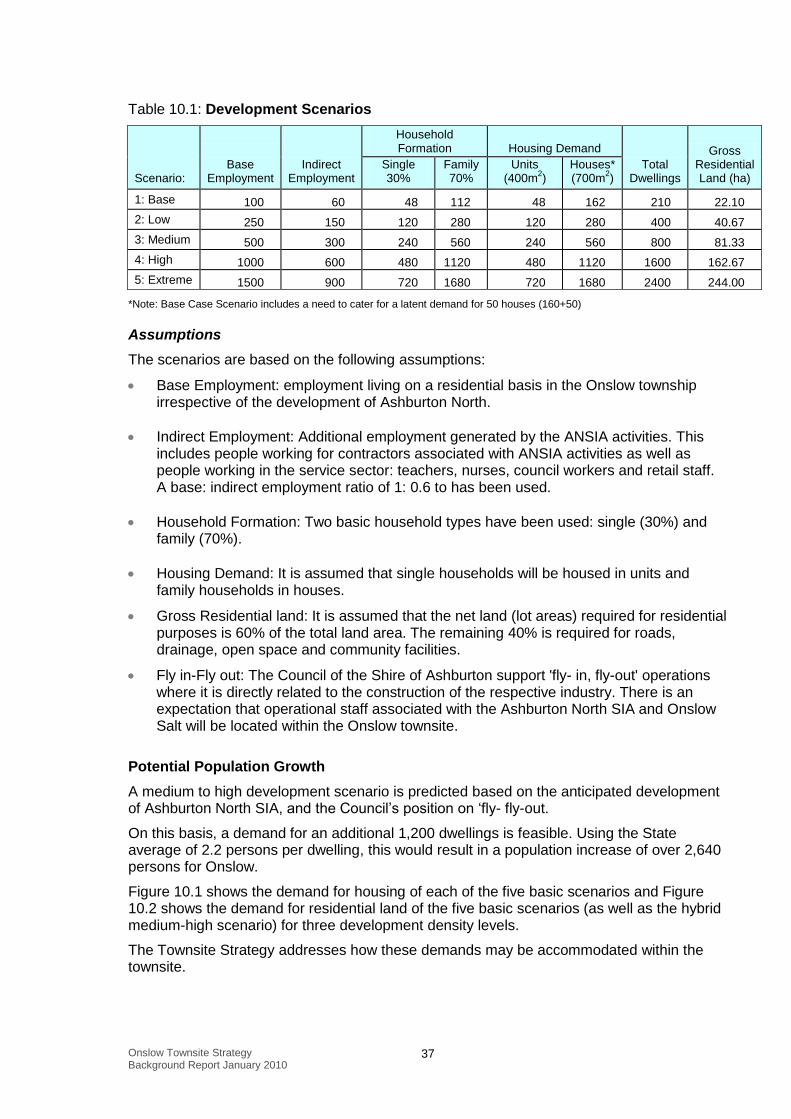
Onslow Townsite Strategy Background Report January 2010
37
Table 10.1: Development Scenarios
Scenario:
Base
Employment Indirect
Employment
Household Formation Housing Demand
Total Dwellings
Gross Residential Land (ha)
Single 30%
Family 70%
Units (400m
2)
Houses* (700m
2)
1: Base 100 60 48 112 48 162 210 22.10
2: Low 250 150 120 280 120 280 400 40.67
3: Medium 500 300 240 560 240 560 800 81.33
4: High 1000 600 480 1120 480 1120 1600 162.67
5: Extreme 1500 900 720 1680 720 1680 2400 244.00
*Note: Base Case Scenario includes a need to cater for a latent demand for 50 houses (160+50)
Assumptions
The scenarios are based on the following assumptions:
Base Employment: employment living on a residential basis in the Onslow township irrespective of the development of Ashburton North.
Indirect Employment: Additional employment generated by the ANSIA activities. This includes people working for contractors associated with ANSIA activities as well as people working in the service sector: teachers, nurses, council workers and retail staff. A base: indirect employment ratio of 1: 0.6 to has been used.
Household Formation: Two basic household types have been used: single (30%) and family (70%).
Housing Demand: It is assumed that single households will be housed in units and family households in houses.
Gross Residential land: It is assumed that the net land (lot areas) required for residential purposes is 60% of the total land area. The remaining 40% is required for roads, drainage, open space and community facilities.
Fly in-Fly out: The Council of the Shire of Ashburton support 'fly- in, fly-out' operations where it is directly related to the construction of the respective industry. There is an expectation that operational staff associated with the Ashburton North SIA and Onslow Salt will be located within the Onslow townsite.
Potential Population Growth
A medium to high development scenario is predicted based on the anticipated development of Ashburton North SIA, and the Council’s position on ‘fly- fly-out.
On this basis, a demand for an additional 1,200 dwellings is feasible. Using the State average of 2.2 persons per dwelling, this would result in a population increase of over 2,640 persons for Onslow.
Figure 10.1 shows the demand for housing of each of the five basic scenarios and Figure 10.2 shows the demand for residential land of the five basic scenarios (as well as the hybrid medium-high scenario) for three development density levels.
The Townsite Strategy addresses how these demands may be accommodated within the townsite.

Onslow Townsite Strategy Background Report January 2010
38
Figure 10.1: Housing Demand
Figure 10.2: Residential Land Requirement
Onslow Development Scenarios: Housing Demand
0
500
1000
1500
2000
2500
3000
1: Base 2: Low 3: Medium 4: High 5: Extreme
Development Scenario
Dw
ellin
gs
New Houses
New Units
Existing Dwellings
Onslow Develoment Scenarios: Residential Land Requirement
0.00
50.00
100.00
150.00
200.00
250.00
300.00
1: Base 2: Low 3: Medium 4: Medium-High 5: High 6: Extreme
Development Scenario
Lan
d R
eq
uir
em
en
t (h
a)
Standard Densities
Higher Densities
Even Higher Densities

Onslow Townsite Strategy Background Report January 2010
39