ontario tourism market assessment research study - ministry of
TRANSCRIPT
Ontario Tourism Market Assessment Research Study
Final Report
Presented to:
Ontario Ministry of Tourism Competitiveness Study
February 2009

2
© Queen’s Printer for Ontario, 2009
Although copyright in the research papers is held by the Queen's Printer for Ontario, the papers were prepared by external companies and their conclusions do not necessarily represent the views of the
Government of Ontario.
ISBN 978-1-4249-8933-1 (PDF)
3
Table of Contents
At TNS, we know that being successful in today’s dynamic business environment requires more understanding, clearer direction and greater certainty than ever before. While accurate information is the foundation of our business, we focus our expertise, services and resources to give you greater insight into your customers’ behavior and needs.
Our integrated, consultative approach exploits our depth of coverage across all the research, analysis, marketing, and industry issues that will be required for this work. That is what sets TNS apart.
Thank you for allowing us to explore your business needs. The comprehensive program that follows is designed to help you achieve your goals. We hope you will trust TNS to provide the insight you need to sharpen your competitive edge.
Executive Summary ................................ 4
Strategic Overview and Recommendations .................................. 16
Detailed General Summary ..................... 22
Overview of Visitation and Spending - Domestic versus U.S. versus Overseas .. 23
Overview of Visitation and Spending - U.S. versus Overseas.............................. 26
North American Opportunity Markets....... 32
Overseas Opportunity Markets ................ 37
Domestic Markets.................................... 44
Quebec Market........................................ 46
United States........................................... 57
Detroit...................................................... 69
New York................................................. 71
Massachusetts ........................................ 82
Illinois ...................................................... 93
New Jersey/Connecticut........................... 104
Florida ............................. 115
Texas .............................. 126
California ......................... 137
Overseas Markets ........... 148
Europe............................. 150
The U.K. .......................... 152
France ............................. 163
Germany ......................... 178
South America................. 193
Central America............... 195
Mexico............................. 197
Asia ................................. 210
Korea............................... 212
Japan .............................. 224
China............................... 236
India ................................ 248
Australia .......................... 257

4
Executive Summary
5
Study Overview
Although the global tourism market is growing, Ontario is competing with more destinations than ever before:
The global tourism industry is characterized by newly popular destinations;
Intensified competition; and
Growing disposable incomes worldwide.
For Ontario to be competitive, it needs to strategically pursue markets with the highest potential for growth over the next 10 years or so, in terms of total tourist expenditures, while nurturing its current base of source markets.
This Study provides recommendations for the Province on:
Best prospect markets (Canadian provinces, U.S. states and Overseas markets) which present Ontario with the highest potential for growth over the next several years in terms of total tourist expenditures by targeting:
Populations that are interested in Ontario; and Populations offering the best prospects for translating interest in Ontario to a behavioural response and increased tourism volume.

6
MethodologyThis Study undertook research in the following markets:
Domestic Markets including Quebec and Western Canada.Tier One/Near U.S. markets to provide recommendations on the potential of various consumer groups within these border regions.Tier Three and Tier Four U.S. potential markets.High potential Overseas growth markets.
Attention was given to:
Size
Nature of these markets
Needs and interests of the target populations
Based on available data, this study produced expenditure projections for various potential markets.Within the identified markets, consumer segments were identified that represent Ontario’s most likely consumers.

7
Overview Key Findings
Domestic Markets - Ontario’s domestic market continues to be the anchor for the province’s tourism industry and its main source of volume:
Ontario’s domestic market is 4.5 times larger than the U.S. market in terms of numbers of visitors (person visits) and 3.5 times larger than the U.S. market in terms of total dollars spent.Ontario’s proximity to major U.S. population centres and relatively ease of access to many overseas destinations via Toronto’s transportation hub is a double-edged sword. It presents opportunities to attract large numbers of visitors from the U.S. and overseas but also facilitates the outbound movement of domestic travellers. Although recent currency exchange rates may have moderated the outbound effects, the potential for this sort of “leakage”is always present.
While Canada’s western provinces (B.C., Alberta, Saskatchewan) and Quebec hold the largest untapped pools of potential visitors to Ontario, Quebec is a better prospect than the West. In fact, U.S. Tier One markets are a better opportunity than the western provinces and should be pursued ahead of Western Canada.
U.S. - The U.S. market is eight times larger than the overseas market in terms of visitors (person visits) and U.S. overnight visitors spend more per person, per night in Ontario than do overnight travellers from other overseas markets:
U.S. Tier One is Ontario’s key U.S. market: Eastern Michigan (including Detroit); Northern Ohio and Western New York; Tier Three U.S. markets hold considerable potential: New York City, Chicago, New Jersey, Philadelphia and Washington D.C.; and Tier Four U.S. markets hold some potential (principally, California, Texas, Florida, Arizona, Georgia and North Carolina). However, potential visitors are scattered across these states making them less attractive than the aforementioned Tier Three U.S. markets. There is, however, potential to strategically target large population centres in this Tier such as Los Angeles, San Francisco-Oakland, Phoenix and Dallas-Fort Worth.
Overseas - While the UK will remain the top overseas market through 2012, it is clear that China will be overtaking the traditional markets of Germany and France in terms of total visitor spending in Ontario in the next year or two. Mexican tourism expenditures are also expected to overtake those of Germany and France. Indian tourism expenditures may overtake those of Germany by 2012. Although a lower priority, monitor Brazil and South Korea.
8
Ontario’s Best Prospect Markets: Quebec
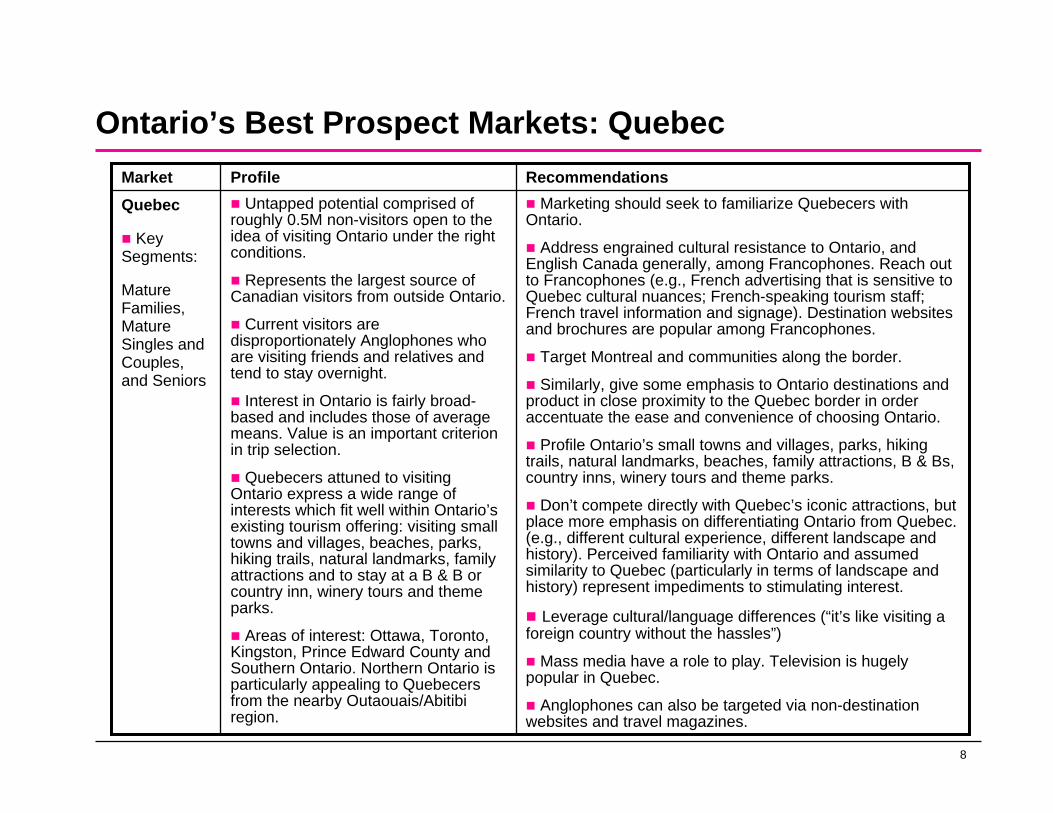
Quebec
Key Segments:
Mature Families, Mature Singles and Couples, and Seniors
Market RecommendationsProfileMarketing should seek to familiarize Quebecers with
Ontario.
Address engrained cultural resistance to Ontario, and English Canada generally, among Francophones. Reach out to Francophones (e.g., French advertising that is sensitive to Quebec cultural nuances; French-speaking tourism staff; French travel information and signage). Destination websites and brochures are popular among Francophones.
Target Montreal and communities along the border.
Similarly, give some emphasis to Ontario destinations and product in close proximity to the Quebec border in order accentuate the ease and convenience of choosing Ontario.
Profile Ontario’s small towns and villages, parks, hiking trails, natural landmarks, beaches, family attractions, B & Bs, country inns, winery tours and theme parks.
Don’t compete directly with Quebec’s iconic attractions, but place more emphasis on differentiating Ontario from Quebec. (e.g., different cultural experience, different landscape and history). Perceived familiarity with Ontario and assumed similarity to Quebec (particularly in terms of landscape and history) represent impediments to stimulating interest.
Leverage cultural/language differences (“it’s like visiting a foreign country without the hassles”)
Mass media have a role to play. Television is hugely popular in Quebec.
Anglophones can also be targeted via non-destination websites and travel magazines.
Untapped potential comprised of roughly 0.5M non-visitors open to the idea of visiting Ontario under the right conditions.
Represents the largest source of Canadian visitors from outside Ontario.
Current visitors are disproportionately Anglophones who are visiting friends and relatives and tend to stay overnight.
Interest in Ontario is fairly broad-based and includes those of average means. Value is an important criterion in trip selection.
Quebecers attuned to visiting Ontario express a wide range of interests which fit well within Ontario’s existing tourism offering: visiting small towns and villages, beaches, parks, hiking trails, natural landmarks, family attractions and to stay at a B & B or country inn, winery tours and theme parks.
Areas of interest: Ottawa, Toronto, Kingston, Prince Edward County and Southern Ontario. Northern Ontario is particularly appealing to Quebecers from the nearby Outaouais/Abitibi region.
9
Ontario’s Best Prospect Markets: Tier 1 U.S. Markets
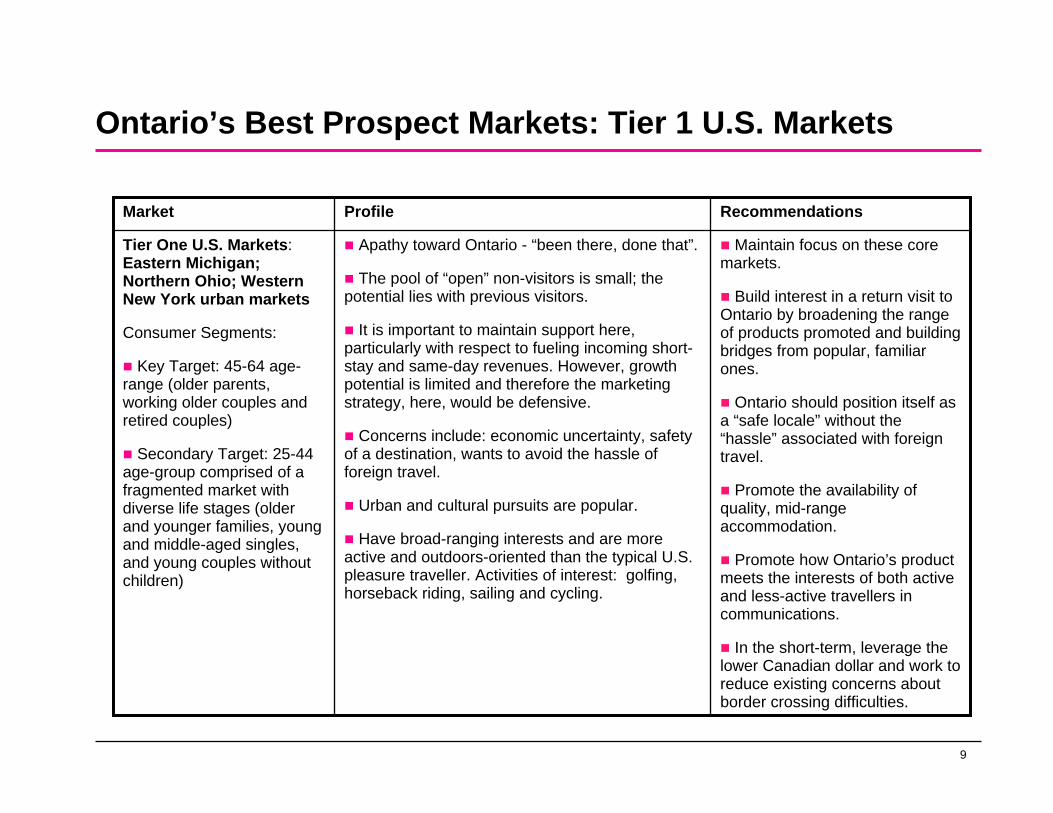
Tier One U.S. Markets: Eastern Michigan; Northern Ohio; Western New York urban markets
Consumer Segments:
Key Target: 45-64 age-range (older parents, working older couples and retired couples)
Secondary Target: 25-44 age-group comprised of a fragmented market with diverse life stages (older and younger families, young and middle-aged singles, and young couples without children)
Market RecommendationsProfile
Maintain focus on these core markets.
Build interest in a return visit to Ontario by broadening the range of products promoted and building bridges from popular, familiar ones.
Ontario should position itself as a “safe locale” without the “hassle” associated with foreign travel.
Promote the availability of quality, mid-range accommodation.
Promote how Ontario’s product meets the interests of both active and less-active travellers in communications.
In the short-term, leverage the lower Canadian dollar and work to reduce existing concerns about border crossing difficulties.
Apathy toward Ontario - “been there, done that”.
The pool of “open” non-visitors is small; the potential lies with previous visitors.
It is important to maintain support here, particularly with respect to fueling incoming short-stay and same-day revenues. However, growth potential is limited and therefore the marketing strategy, here, would be defensive.
Concerns include: economic uncertainty, safety of a destination, wants to avoid the hassle of foreign travel.
Urban and cultural pursuits are popular.
Have broad-ranging interests and are more active and outdoors-oriented than the typical U.S. pleasure traveller. Activities of interest: golfing, horseback riding, sailing and cycling.
10
Ontario’s Best Prospect Markets: Tier 3 U.S. Markets
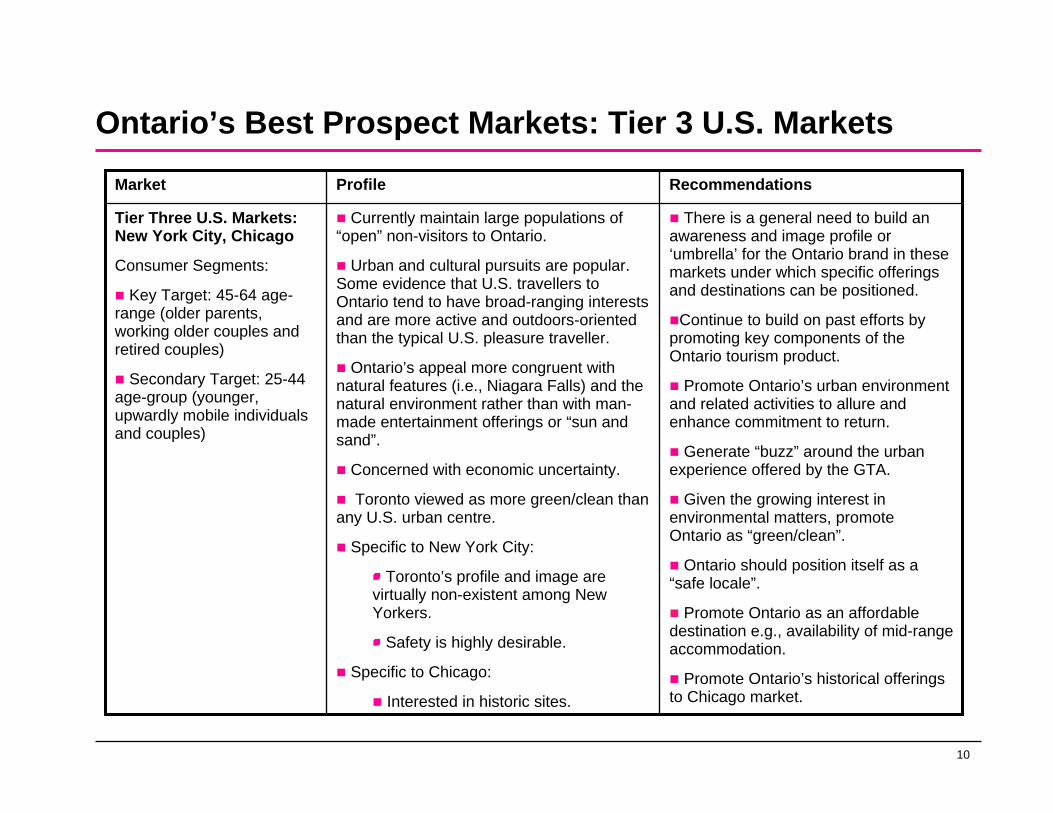
Tier Three U.S. Markets:New York City, Chicago
Consumer Segments:
Key Target: 45-64 age-range (older parents, working older couples and retired couples)
Secondary Target: 25-44 age-group (younger, upwardly mobile individuals and couples)
Market RecommendationsProfile
There is a general need to build an awareness and image profile or ‘umbrella’ for the Ontario brand in these markets under which specific offerings and destinations can be positioned.
Continue to build on past efforts by promoting key components of the Ontario tourism product.
Promote Ontario’s urban environment and related activities to allure and enhance commitment to return.
Generate “buzz” around the urban experience offered by the GTA.
Given the growing interest in environmental matters, promote Ontario as “green/clean”.
Ontario should position itself as a “safe locale”.
Promote Ontario as an affordable destination e.g., availability of mid-range accommodation.
Promote Ontario’s historical offerings to Chicago market.
Currently maintain large populations of“open” non-visitors to Ontario.
Urban and cultural pursuits are popular. Some evidence that U.S. travellers to Ontario tend to have broad-ranging interests and are more active and outdoors-oriented than the typical U.S. pleasure traveller.
Ontario’s appeal more congruent with natural features (i.e., Niagara Falls) and the natural environment rather than with man-made entertainment offerings or “sun and sand”.
Concerned with economic uncertainty.
Toronto viewed as more green/clean than any U.S. urban centre.
Specific to New York City:
Toronto’s profile and image are virtually non-existent among New Yorkers.
Safety is highly desirable.
Specific to Chicago:
Interested in historic sites.
11
Ontario’s Best Prospect Markets: Tier 3 & 4 U.S. Markets
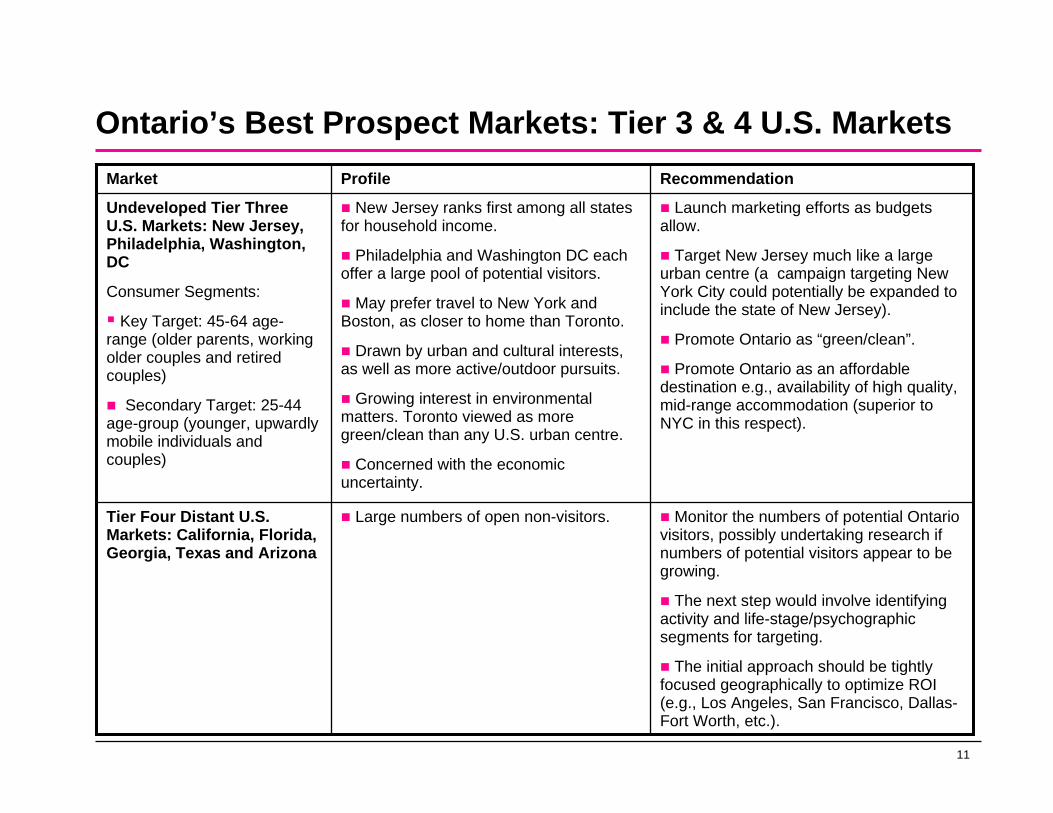
Tier Four Distant U.S. Markets: California, Florida, Georgia, Texas and Arizona
Undeveloped Tier Three U.S. Markets: New Jersey, Philadelphia, Washington, DC
Consumer Segments:
Key Target: 45-64 age-range (older parents, working older couples and retired couples)
Secondary Target: 25-44 age-group (younger, upwardly mobile individuals and couples)
Market RecommendationProfile
Monitor the numbers of potential Ontario visitors, possibly undertaking research if numbers of potential visitors appear to be growing.
The next step would involve identifying activity and life-stage/psychographic segments for targeting.
The initial approach should be tightly focused geographically to optimize ROI (e.g., Los Angeles, San Francisco, Dallas-Fort Worth, etc.).
Large numbers of open non-visitors.
Launch marketing efforts as budgets allow.
Target New Jersey much like a large urban centre (a campaign targeting New York City could potentially be expanded to include the state of New Jersey).
Promote Ontario as “green/clean”.
Promote Ontario as an affordable destination e.g., availability of high quality, mid-range accommodation (superior to NYC in this respect).
New Jersey ranks first among all states for household income.
Philadelphia and Washington DC each offer a large pool of potential visitors.
May prefer travel to New York and Boston, as closer to home than Toronto.
Drawn by urban and cultural interests, as well as more active/outdoor pursuits.
Growing interest in environmental matters. Toronto viewed as more green/clean than any U.S. urban centre.
Concerned with the economic uncertainty.

12
Ontario’s Best Prospect Markets: United Kingdom
United Kingdom
Average age of a British visitor to Canada has fallen from 51 (in 1997) to 44 years of age (in 2007
Market RecommendationProfileIncrease awareness of Ontario destinations within
Canada and Ontario’s unique regional product offer.
Promote the natural beauty of wilderness areas, rivers and lakes, as well as Ontario’s historical sites particularly in relation to British colonial history.
Promote Ontario’s diversity in terms of urban/rural product, and use this to continue to attract larger numbers of younger travellers on their first trip to Canada.
As with all overseas destinations, don’t shy away from the possibility of packaging Ontario with other Canadian provinces to enhance drawing power within a national (CTC) strategy.
Promote Ontario as an affordable destination.
Use clear and comprehensive personalized web services that offer clear travel plans and itineraries.
Testimonies and word-of-mouth (given that U.K. travellers who have visited Canada are typically satisfied and rate Canada ahead of the U.S. and Australia as a destination they want to visit).
TV commercials and travel shows which would highlight the various parts of Ontario should also be considered for U.K. television programming.
While travel to Canada and in particular to Ontario has been decreasing in recent years, the U.K. is Ontario’s largest overseas source of tourism revenue and will continue to be for at least the next 5 to 10 years.
As a commonwealth country, UK travellers feel a high level of comfort in visiting Canada. and view Canadians as warm and friendly.
One of the key motivational factors for visiting Canada is the natural scenery which seems to intermingle with large cities and urban destinations.
Visiting friends and relatives (“VFR”) is a key reason for British travel to Canada.
Lack of sufficient knowledge about Canada as a destination and the product available are the largest barriers to visiting. Canada is often viewed as too vast and can be intimidating to visitors who are used to travelling shorter distances.
British very commonly use the internet to book travel .

13
Ontario’s Best Prospect Markets: China
China
Well-established, middle-aged families with a visiting friends and relatives (“VFR”) connection.
Nouveau riche.
Managerial employees likely Joint Venture, foreign company.
35 - 54 years of age.
Canton province strongest market followed by Beijing.
Market RecommendationProfileConcentrate on increasing awareness for
future travel rather than short term gain.
Lack of familiarity with Canada (Ontario) needs to be addressed. Create a strong brand image that has cache value that will stand out against competitive destinations.
Use the web to promote all of Ontario’s product providing details on how to get the most out of a trip as this market wants to see as much as possible. Again, links to neighbouring provinces could increase overall drawing power.
Create a risk-free itinerary to make travel as easy as possible.
TV has strong influence on choice of travel destination (investigate the success of Dashan television show featuring Canada to determine if it would be useful to do a follow-up in the same format).
VFR from Canton province constitutes most immediate potential.
Try to leverage Vancouver 2010 games to benefit Ontario as a necessary destination if you visit Canada.
China’s growing middle class presents the best opportunity to increase visitation. But, without ADS there continue to be limitations.
VFR tends to be the key reason for Chinese to visit Canada, particularly from Guangzhou/Canton province.
Canada is not perceived as a destination with lots to see or do.
Growth of consumerism in China could dissuade travel in near future as consumers purchase household conveniences.
The internet is a strong source of information for Chinese overseas travellers.
Great lack of awareness of Ontario, and its tourism offerings. Ontario/Canada seen as a destination for immigration or education but not necessarily for travel.
14
Ontario’s Best Prospect Markets: Mexico
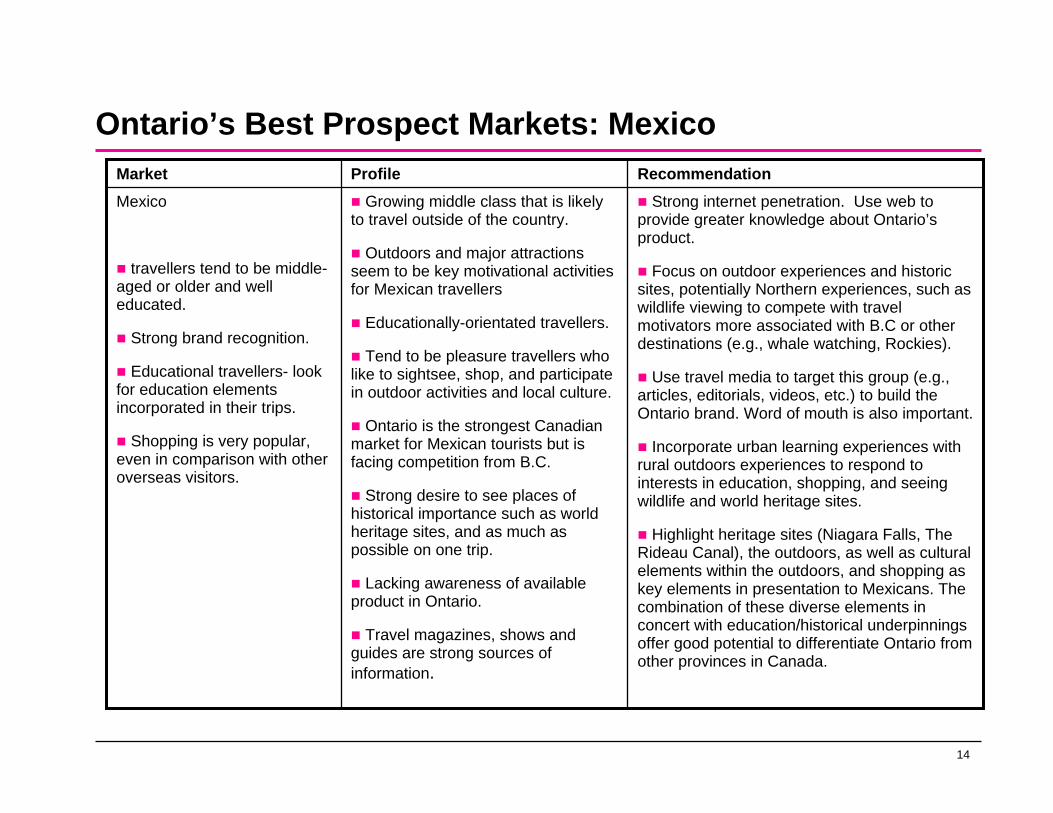
Mexico
travellers tend to be middle-aged or older and well educated.
Strong brand recognition.
Educational travellers- look for education elements incorporated in their trips.
Shopping is very popular, even in comparison with other overseas visitors.
Market RecommendationProfileStrong internet penetration. Use web to
provide greater knowledge about Ontario’s product.
Focus on outdoor experiences and historic sites, potentially Northern experiences, such as wildlife viewing to compete with travel motivators more associated with B.C or other destinations (e.g., whale watching, Rockies).
Use travel media to target this group (e.g., articles, editorials, videos, etc.) to build the Ontario brand. Word of mouth is also important.
Incorporate urban learning experiences with rural outdoors experiences to respond to interests in education, shopping, and seeing wildlife and world heritage sites.
Highlight heritage sites (Niagara Falls, The Rideau Canal), the outdoors, as well as cultural elements within the outdoors, and shopping as key elements in presentation to Mexicans. The combination of these diverse elements in concert with education/historical underpinnings offer good potential to differentiate Ontario from other provinces in Canada.
Growing middle class that is likely to travel outside of the country.
Outdoors and major attractions seem to be key motivational activities for Mexican travellers
Educationally-orientated travellers.
Tend to be pleasure travellers who like to sightsee, shop, and participate in outdoor activities and local culture.
Ontario is the strongest Canadian market for Mexican tourists but is facing competition from B.C.
Strong desire to see places of historical importance such as world heritage sites, and as much as possible on one trip.
Lacking awareness of available product in Ontario.
Travel magazines, shows and guides are strong sources of information.
15
Ontario’s Best Prospect Markets: India
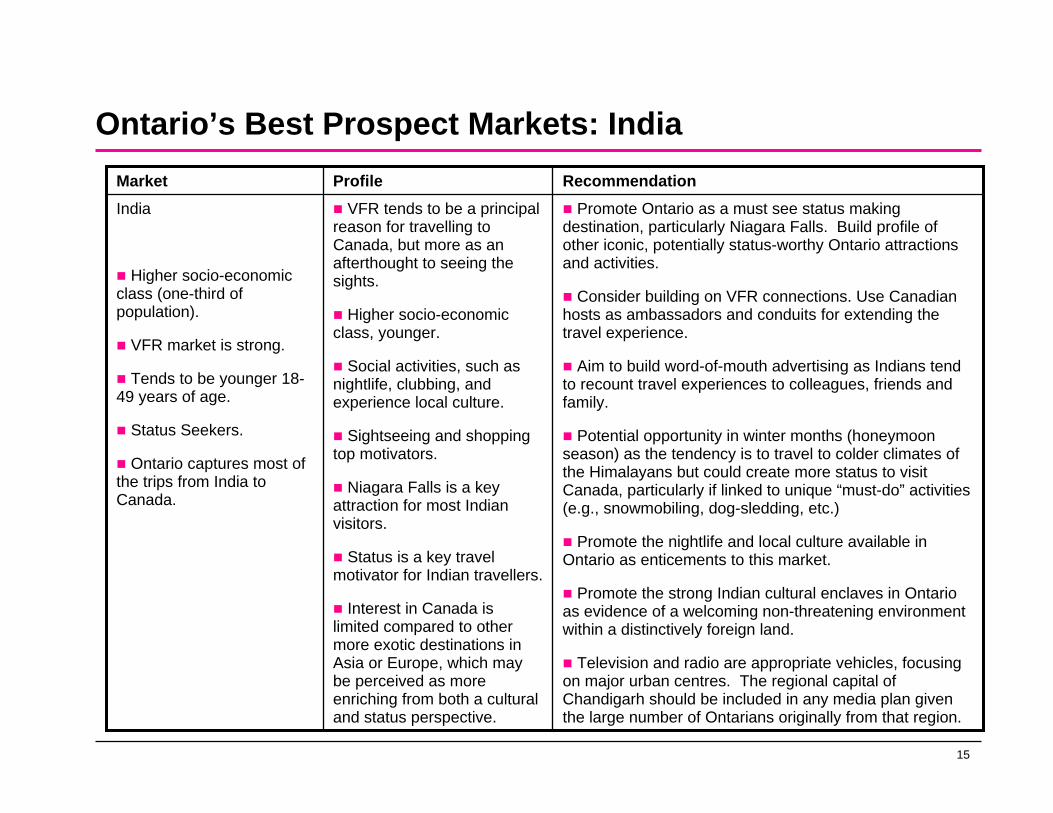
India
Higher socio-economic class (one-third of population).
VFR market is strong.
Tends to be younger 18-49 years of age.
Status Seekers.
Ontario captures most of the trips from India to Canada.
Market RecommendationProfilePromote Ontario as a must see status making
destination, particularly Niagara Falls. Build profile of other iconic, potentially status-worthy Ontario attractions and activities.
Consider building on VFR connections. Use Canadian hosts as ambassadors and conduits for extending the travel experience.
Aim to build word-of-mouth advertising as Indians tend to recount travel experiences to colleagues, friends and family.
Potential opportunity in winter months (honeymoon season) as the tendency is to travel to colder climates of the Himalayans but could create more status to visit Canada, particularly if linked to unique “must-do” activities (e.g., snowmobiling, dog-sledding, etc.)
Promote the nightlife and local culture available in Ontario as enticements to this market.
Promote the strong Indian cultural enclaves in Ontario as evidence of a welcoming non-threatening environment within a distinctively foreign land.
Television and radio are appropriate vehicles, focusing on major urban centres. The regional capital of Chandigarh should be included in any media plan given the large number of Ontarians originally from that region.
VFR tends to be a principal reason for travelling to Canada, but more as an afterthought to seeing the sights.
Higher socio-economic class, younger.
Social activities, such as nightlife, clubbing, and experience local culture.
Sightseeing and shopping top motivators.
Niagara Falls is a key attraction for most Indian visitors.
Status is a key travel motivator for Indian travellers.
Interest in Canada is limited compared to other more exotic destinations in Asia or Europe, which may be perceived as more enriching from both a cultural and status perspective.
16
Strategic Overview and Recommendations
17
Strategic Overview
Focus
Spend to Ontario’s strengths, i.e., where knowledge of Ontario and pools of convertible interest are greatest. This is especially important in the current economic climate. Indeed, even maintaining current volume may be a challenge.
A three-tier planning and investment strategy is recommended:
1. Regional Markets
Focus on markets where there is high potential for return on investment now. In a weaker economy, travellers may be restricting their destination options geographically allowing Ontario to tap into a relatively larger pool of potential visitorscloser to home. Key markets include, Ontario, U.S. near markets, select U.S. mid-markets and Quebec.
This does not imply accepting the status quo. To the contrary, these markets need to be approached with growing sophistication in terms of reaching relevant target groups with appropriate product and messages, and making use of emerging media to engage potential visitors with greater assurance. Packaging product will also become increasingly important as a means of simultaneously adding value and encouraging extended stays.
18
Strategic Overview
2. Traditional Overseas Markets
It is important for Ontario to maintain its standing in the traditional overseas markets, where the province already has a presence.
While these markets are not necessarily growing, they will continue to provide valuable revenue streams for the foreseeable future. In particular, the U.K. market is expected to remain the largest source of overseas visitors for at least the next five to ten years.
Work with the Canadian Tourism Commission (CTC) and independently to educate U.K. travellers and provide them with trip-planning information.
Online sources will be a cost-effective medium for communicating the desired message. Customize websites for other major overseas markets such as Germany and Japan.
3. New Overseas Markets
Plan longer-term to build new overseas markets. Monitor and consider assigning higher priority to budgets for Mexico, China and India. First steps should include online educational and promotional efforts, tailoring the site for each market. Co-ordinate and collaborate with the CTC to ensure that Ontario’s desired message and images are included in CTC
efforts.
19
Strategic Overview
Although a lower priority than the aforementioned three countries, South Korea and Brazil have also been identified as holding potential. In particular, Brazilian spending in Ontario currently surpasses that of Australians and is projected to grow to match that of visitors from France by 2012.
Significant budgets should not be devoted to developing these emerging markets immediately. Instead, emphasis should be placed on the exploration of opportunities and the eventual crafting of growth plans. Some fundamental questions still need to be answered, such as:
How should these markets be segmented and target groups defined in a manner that best serves Ontario’s interests?
What messages and product are relevant to these target groups?
How much will it cost to break into these markets, and which media and communications approaches will be most effective?
It is also likely necessary to come to terms with the CTC’s leading role in marketing Canadian destinations overseas and whether Ontario’s objectives can be accommodated effectively within the existing structure. Is it possible for Ontario to gain the leverage it needs within these emerging markets and, if not, what are the alternatives? It may very well be that Ontario’s objectives can be well accommodated within the overseas marketing program for the Canadian brand, and certainly this would be desirable. Regardless, it will be necessary to work closely with the CTC to ensure that strategic directions are congruent, that Ontario receives appropriate attention, and that budgets are sufficient and media mix optimized to achieve success.
20
Overview – Recommendations and Priorities
Canada
Don’t ignore Ontario as a source market. It is absolutely vital to the health of the domestic industry and open to competitive encroachment.Continue to develop the Quebec market, placing particular emphasis addressing Francophone sensibilities, emphasizing points of differentiation from Quebec and aligning product to interest (both in terms of geographical proximity and activities).The three western provinces (B.C., Alberta, Saskatchewan) do not represent high potential for Ontario at the present time.
United States
Maintain a presence in all Tier One markets as an important defensive/ maintenance measure.Pursue the Tier Three markets of New York City and also Chicago.Develop New Jersey, Philadelphia and Washington D.C. as budgets allow.Consider a targeted strategy for major Tier Four markets longer term.
21
Overview – Recommendations and Priorities
Overseas
Work with the CTC to ensure that Ontario’s desired presence and positioning is appropriately represented in overseas marketing for Canada (coordination of strategic direction).Maintain a presence in the traditional core European countries (Germany, France) and Japan.Focus on the U.K. as it will continue to be the overseas revenue leader.Develop China, followed by Mexico and India, as budgets allow. Due to proximity, Mexico represents a better immediate target than India. Mexicans travellers’ interests in nature and outdoor experiences, history and educational experiences fit well with the Ontario offering.Monitor the growth of the middle-class in India and develop communication and advertising programs as budgets allow. Determine whether a low-cost ‘host strategy’ targeted to major ethnic communities in Canada (Chinese, Indian) is viable as a means of generating greater tourism revenue from incoming VFR.Although a lower priority, monitor Brazil and South Korea

22
Detailed General Summary

23
Overview of Visitation and Spending - Domestic versus U.S. versus Overseas
24
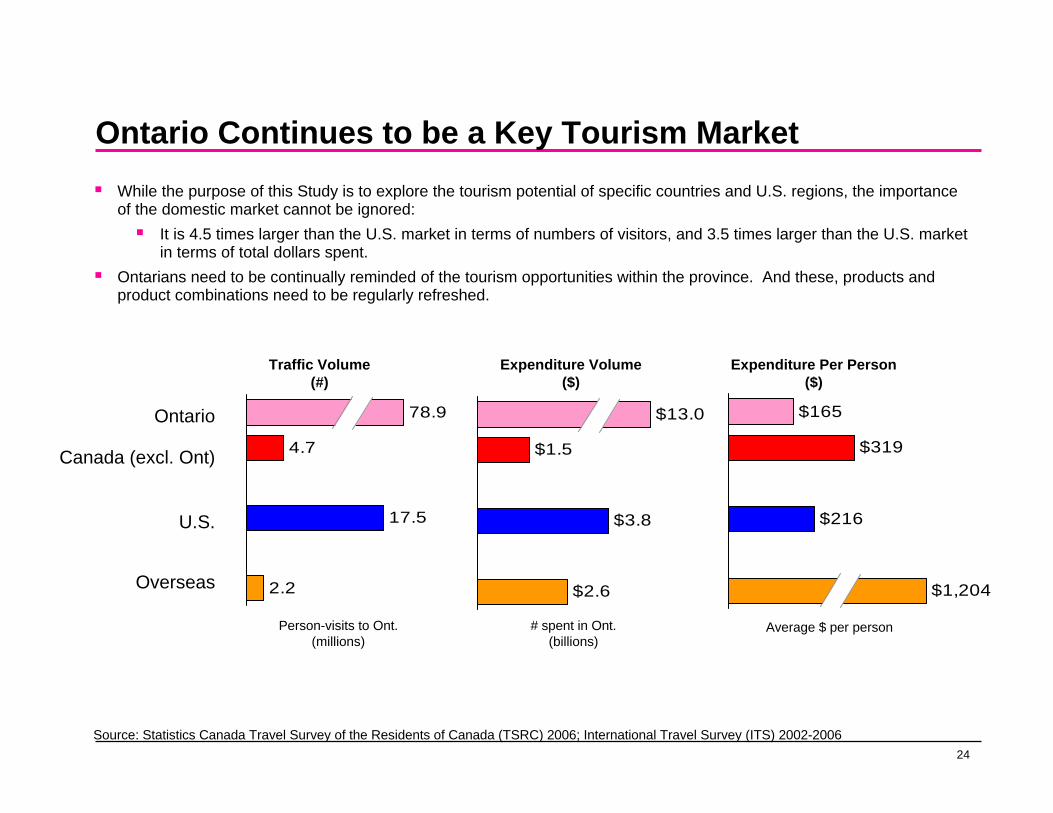
Ontario Continues to be a Key Tourism MarketWhile the purpose of this Study is to explore the tourism potential of specific countries and U.S. regions, the importance of the domestic market cannot be ignored:
It is 4.5 times larger than the U.S. market in terms of numbers of visitors, and 3.5 times larger than the U.S. market in terms of total dollars spent.
Ontarians need to be continually reminded of the tourism opportunities within the province. And these, products and product combinations need to be regularly refreshed.
4.7
17.5
2.2
78.9
$1.5
$3.8
$2.6
$13.0 $165
$319
$216
$1,204
Ontario
Canada (excl. Ont)
U.S.
Overseas
Traffic Volume(#)
Expenditure Volume($)
Expenditure Per Person($)
Person-visits to Ont.(millions)
# spent in Ont.(billions)
Average $ per person
Source: Statistics Canada Travel Survey of the Residents of Canada (TSRC) 2006; International Travel Survey (ITS) 2002-2006
25
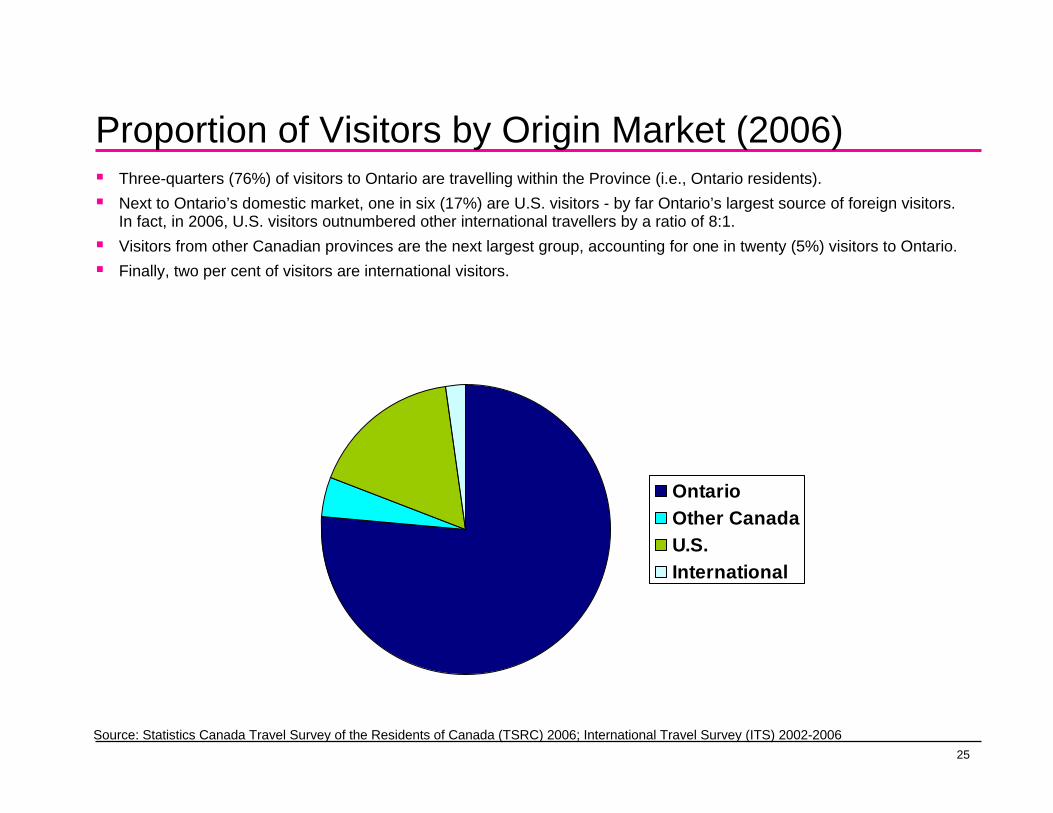
Proportion of Visitors by Origin Market (2006)Three-quarters (76%) of visitors to Ontario are travelling within the Province (i.e., Ontario residents).Next to Ontario’s domestic market, one in six (17%) are U.S. visitors - by far Ontario’s largest source of foreign visitors. In fact, in 2006, U.S. visitors outnumbered other international travellers by a ratio of 8:1.Visitors from other Canadian provinces are the next largest group, accounting for one in twenty (5%) visitors to Ontario.Finally, two per cent of visitors are international visitors.
OntarioOther CanadaU.S.International
Source: Statistics Canada Travel Survey of the Residents of Canada (TSRC) 2006; International Travel Survey (ITS) 2002-2006

26
Overview of Visitation and Spending - U.S. versus Overseas
27
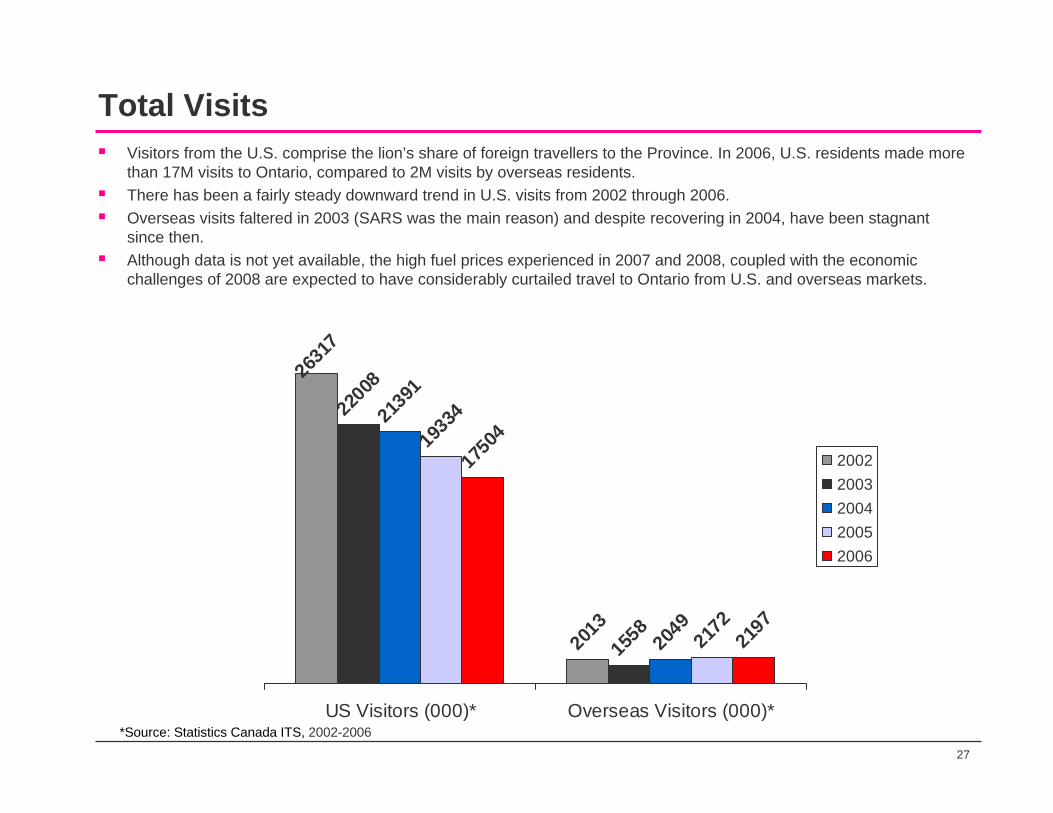
Total VisitsVisitors from the U.S. comprise the lion’s share of foreign travellers to the Province. In 2006, U.S. residents made more than 17M visits to Ontario, compared to 2M visits by overseas residents.There has been a fairly steady downward trend in U.S. visits from 2002 through 2006.Overseas visits faltered in 2003 (SARS was the main reason) and despite recovering in 2004, have been stagnant since then.Although data is not yet available, the high fuel prices experienced in 2007 and 2008, coupled with the economic challenges of 2008 are expected to have considerably curtailed travel to Ontario from U.S. and overseas markets.
2631
7
2013
2200
8
1558
2139
1
2049
1933
4
2172
1750
4
2197
US Visitors (000)* Overseas Visitors (000)*
20022003200420052006
*Source: Statistics Canada ITS, 2002-2006
28
Total Visitors
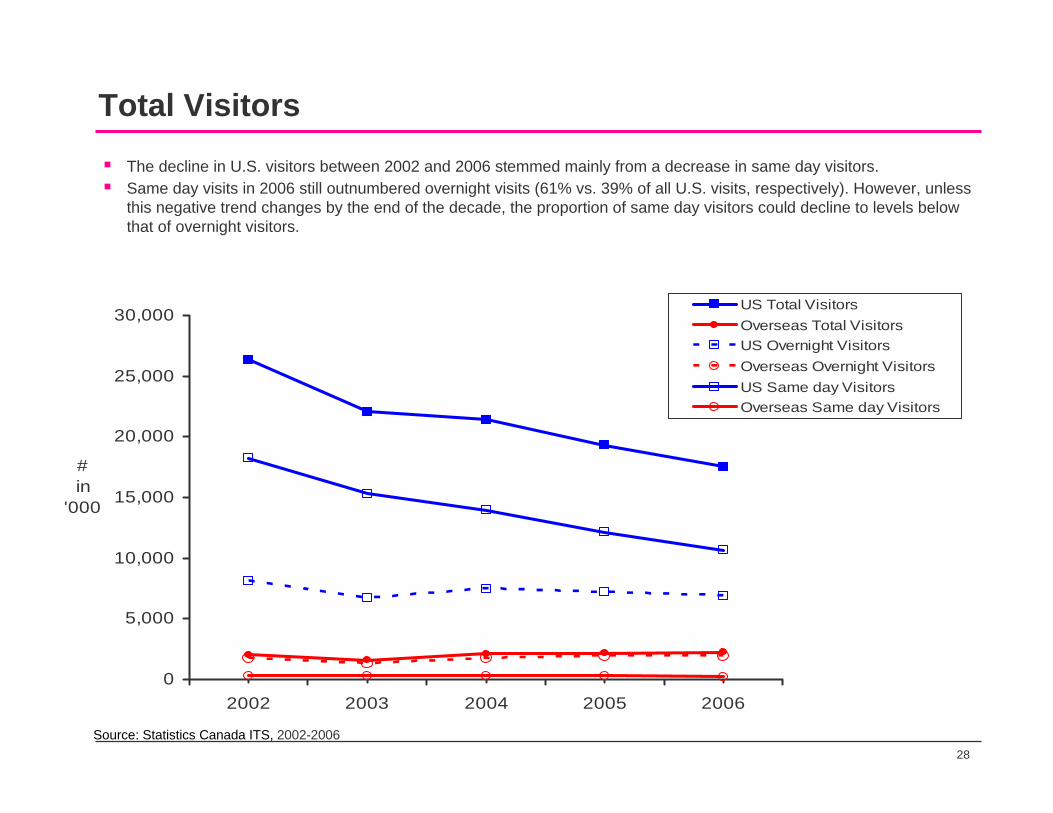
The decline in U.S. visitors between 2002 and 2006 stemmed mainly from a decrease in same day visitors.Same day visits in 2006 still outnumbered overnight visits (61% vs. 39% of all U.S. visits, respectively). However, unless this negative trend changes by the end of the decade, the proportion of same day visitors could decline to levels below that of overnight visitors.
0
5,000
10,000
15,000
20,000
25,000
30,000
2002 2003 2004 2005 2006
#in
'000
US Total VisitorsOverseas Total VisitorsUS Overnight VisitorsOverseas Overnight VisitorsUS Same day VisitorsOverseas Same day Visitors
Source: Statistics Canada ITS, 2002-2006

29
Same Day Spending
1,385
1,1421,058
885771
191 136 143 118 127
0
500
1,000
1,500
2002 2003 2004 2005 2006
$in
million
USOverseas
Source: Statistics Canada ITS, 2002-2006
Same-day visitors’ spending patterns generally reflect the same trends as same-day visits to the province, with a significant downward trend in spending among U.S. visitors.Overseas same-day visitors are more lucrative to Ontario than U.S. same-day visitors, as the former likely compress more tourist activities into a single day. While overseas visitors represent only 2% of the total same-day visitors in 2006, they account for a disproportionately large share (14%) of the total dollars spent by same-day visitors in Ontario.
30
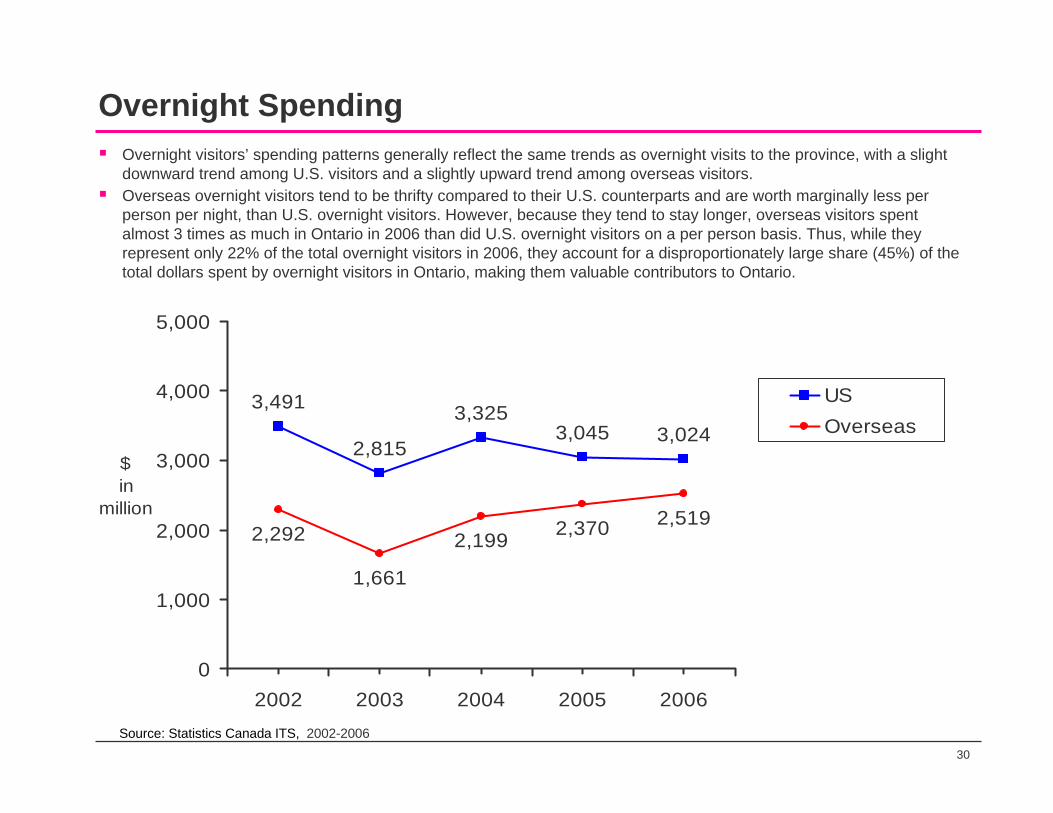
Overnight Spending
3,491
2,815
3,3253,045 3,024
2,292
1,661
2,199 2,370 2,519
0
1,000
2,000
3,000
4,000
5,000
2002 2003 2004 2005 2006
$in
million
USOverseas
Overnight visitors’ spending patterns generally reflect the same trends as overnight visits to the province, with a slight downward trend among U.S. visitors and a slightly upward trend among overseas visitors.Overseas overnight visitors tend to be thrifty compared to their U.S. counterparts and are worth marginally less per person per night, than U.S. overnight visitors. However, because they tend to stay longer, overseas visitors spent almost 3 times as much in Ontario in 2006 than did U.S. overnight visitors on a per person basis. Thus, while they represent only 22% of the total overnight visitors in 2006, they account for a disproportionately large share (45%) of the total dollars spent by overnight visitors in Ontario, making them valuable contributors to Ontario.
Source: Statistics Canada ITS, 2002-2006
31
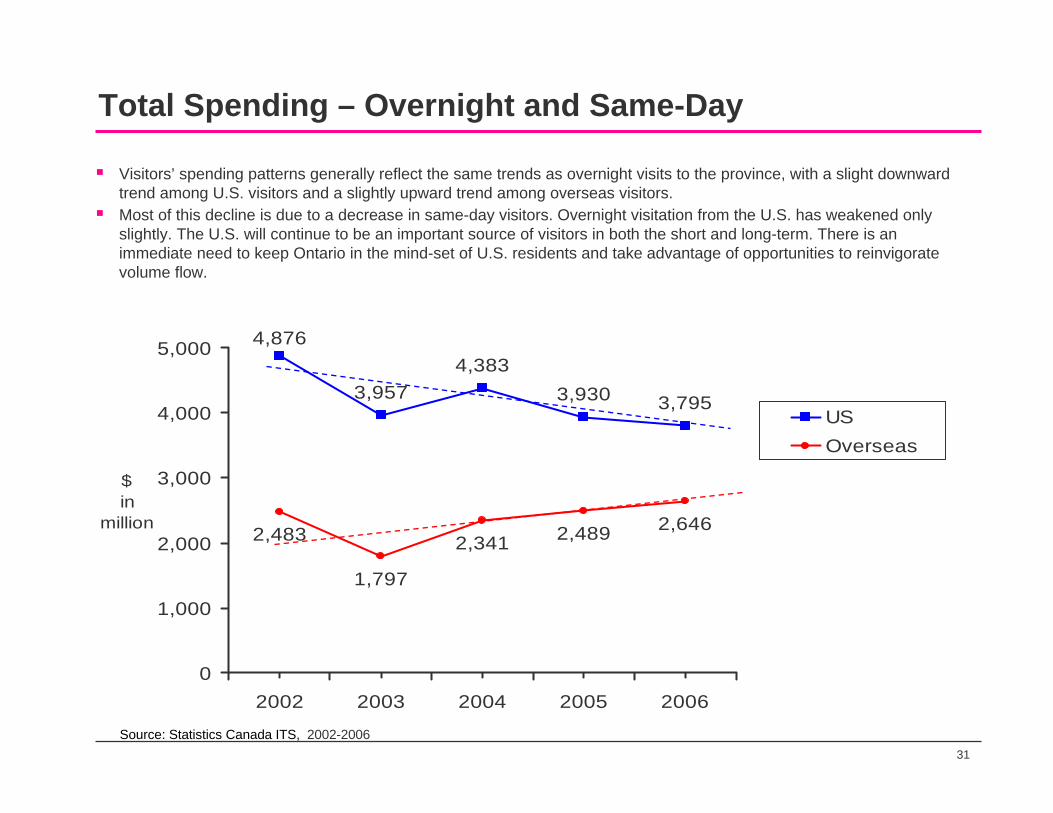
Total Spending – Overnight and Same-Day
4,876
3,9574,383
3,930 3,795
2,483
1,797
2,341 2,489 2,646
0
1,000
2,000
3,000
4,000
5,000
2002 2003 2004 2005 2006
$in
million
USOverseas
Visitors’ spending patterns generally reflect the same trends as overnight visits to the province, with a slight downward trend among U.S. visitors and a slightly upward trend among overseas visitors.Most of this decline is due to a decrease in same-day visitors. Overnight visitation from the U.S. has weakened only slightly. The U.S. will continue to be an important source of visitors in both the short and long-term. There is an immediate need to keep Ontario in the mind-set of U.S. residents and take advantage of opportunities to reinvigorate volume flow.
Source: Statistics Canada ITS, 2002-2006

32
North American Opportunity Markets

33
Ontario’s Best Prospect Markets: North America
RecommendationMarket
Monitor the numbers of potential Ontario visitors, possibly undertaking research if numbers of potential visitors appear to be growing.
The next step would involve identifying activity and life-stage/psychographic segments for targeting within significant population clusters.
Distant U.S. markets with large numbers of open non-visitors such as California, Florida, Georgia, Texas and Arizona (Tier Four)
5.
Launch marketing efforts as budgets allow.New Jersey, Philadelphia, Washington DC (undeveloped Tier Three markets)
4.
Target Montreal and Quebec communities along the Ontario border.
Quebec3.
Continue to build on past efforts.New York City, Chicago (Tier Three)2.
Maintain focus on core markets.Eastern Michigan/Northern Ohio/ Western New York urban markets (Tier One)
1.
34
$99 $105 $106 $120 $134
$261
$739
$213 $465
$127 $659
$13,059 $14,523
$612
$232 $178 $150$146
All CanadaOntario
QuebecManitoba
Western CanadaAtlantic Canada
MichiganNY State
OhioCalifornia
PennsylvaniaIllinois
MinnesotaFloridaTexas
WisconsinMassachusetts
New Jersey
North American Opportunity Markets
Source: Statistics Canada Travel Survey of the Residents of Canada (TSRC) 2006 ; International Travel Survey (ITS) 2002-2006,
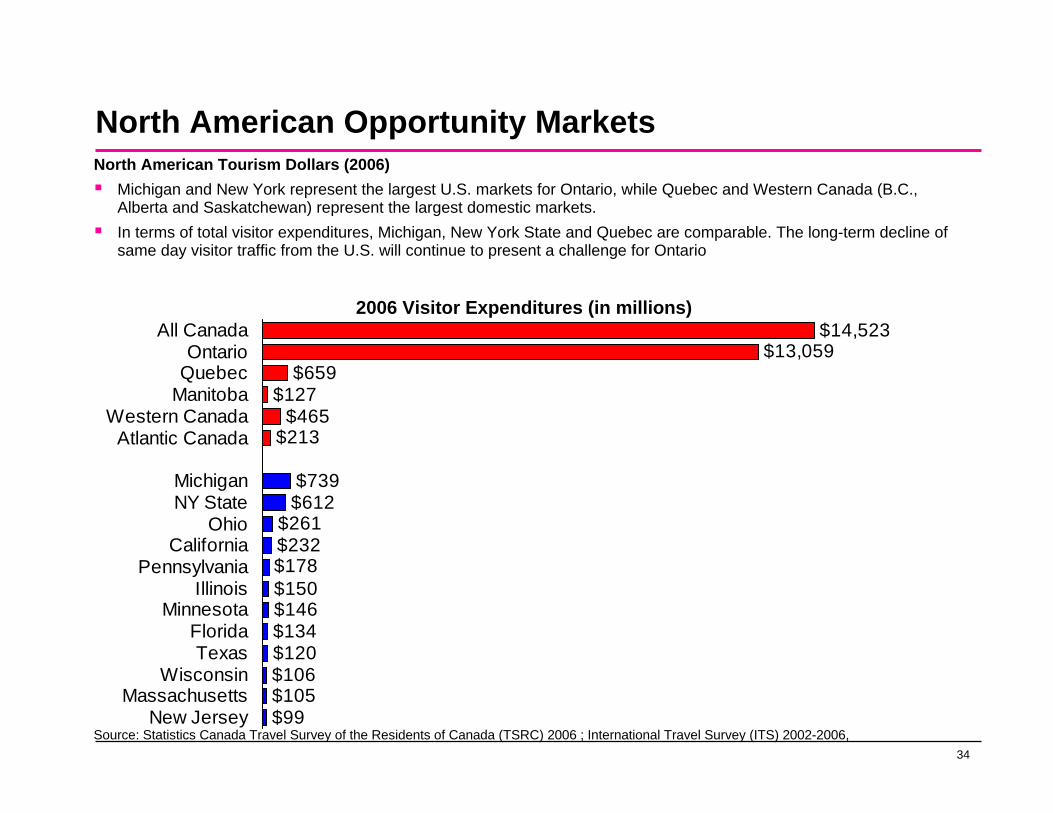
North American Tourism Dollars (2006)Michigan and New York represent the largest U.S. markets for Ontario, while Quebec and Western Canada (B.C., Alberta and Saskatchewan) represent the largest domestic markets.In terms of total visitor expenditures, Michigan, New York State and Quebec are comparable. The long-term decline of same day visitor traffic from the U.S. will continue to present a challenge for Ontario
2006 Visitor Expenditures (in millions)
35
North American Opportunity MarketsNorth America - Important Core Markets:
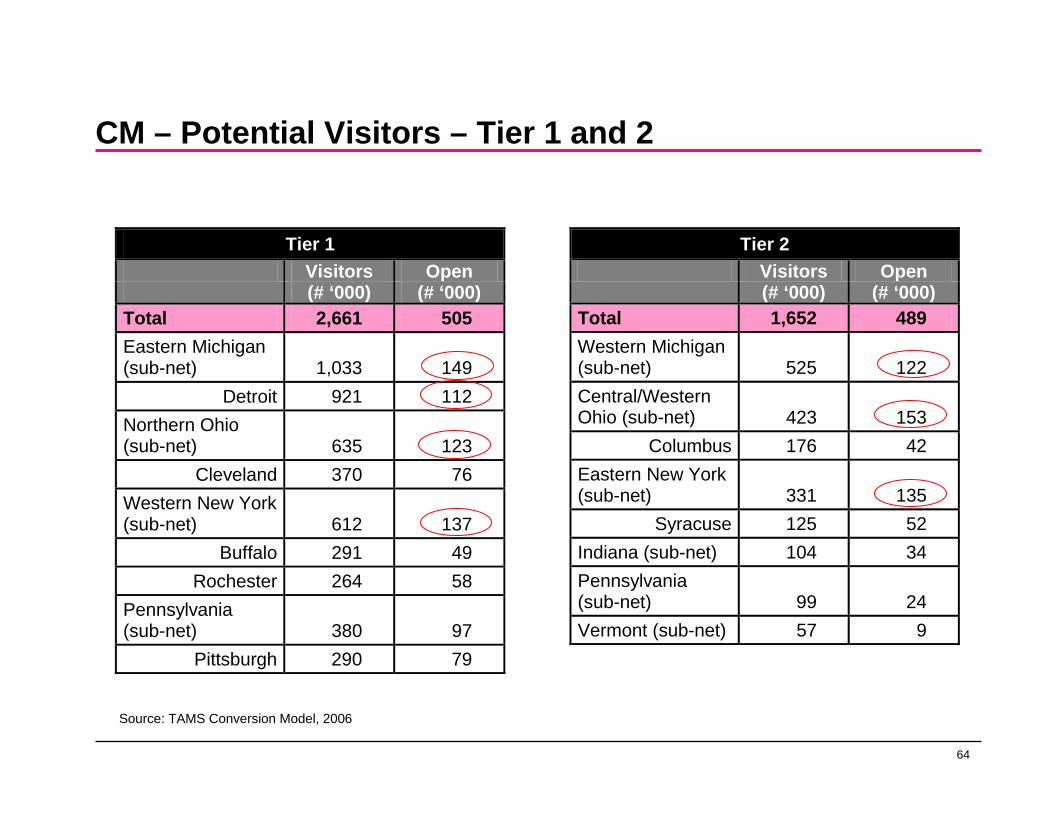
The U.S. market currently offers Ontario a much more attractive opportunity than individual overseas markets. The U.S. market is eight times larger than the overseas market in terms of visitors and U.S. overnight visitors spend more per person per night, in Ontario than do overnight overseas market visitors. Tier One markets will continue to be key. Within Tier One, there are several markets that carry particular weight: Eastern Michigan (including Detroit), Northern Ohio and Western New York are each home to more than 100,000 non-visitors who are open to the idea of travelling to Ontario if the right opportunity were to be presented to them. More importantly, there is strong support for Ontario among the 4.7M visitors from these states who might be encouraged to make a return visit.
North America - Potential Markets:
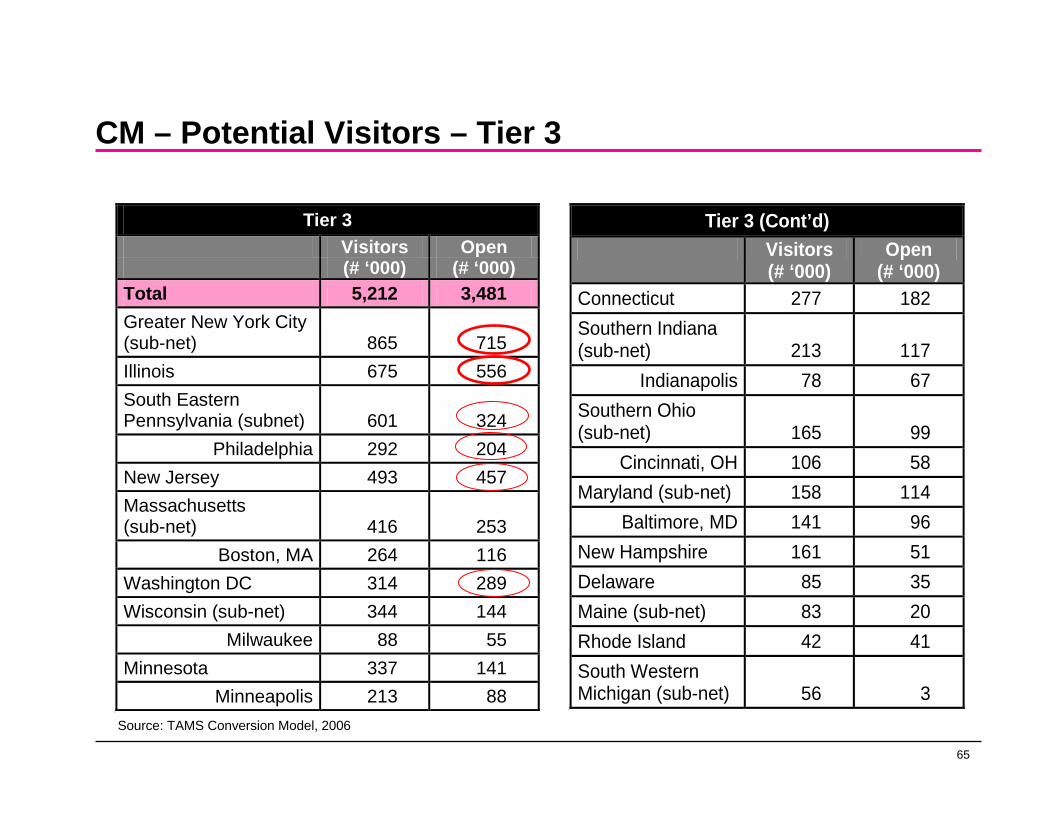
Tier Three markets hold considerable potential. The top two, in terms of numbers of potential visitors are New York City and Illinois (largely Chicago), each with more than 500,000 residents who are non-visitors to Ontario but who are quite open to choosing it for a future trip.Southeastern Pennsylvania (principally Philadelphia), New Jersey and Washington D.C. also hold considerable promise and should be included in future planning as budgets allow:
Southeastern Pennsylvania has 324,000 who are open to visiting Ontario (with 204,000 residing in Philadelphia).New Jersey has 457,000 who are open to visiting Ontario.Washington D.C. has 289,000 who are open to visiting Ontario.
36
North American Opportunity Markets
North America - Potential Markets:
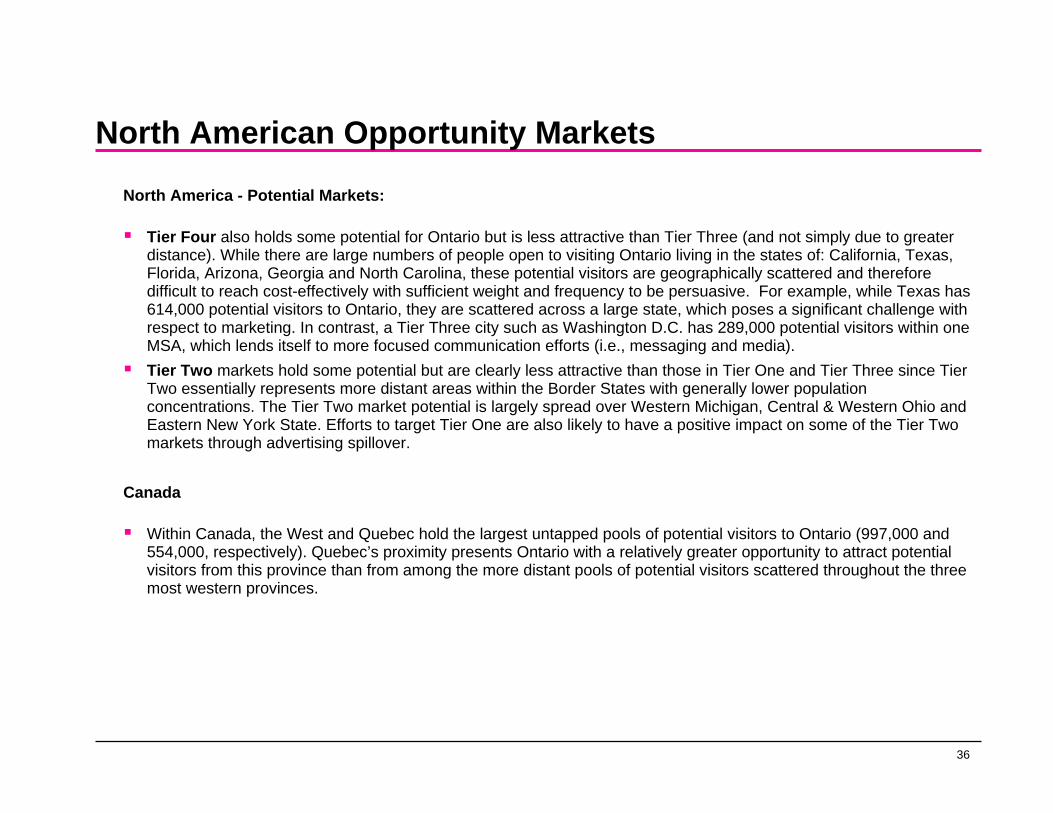
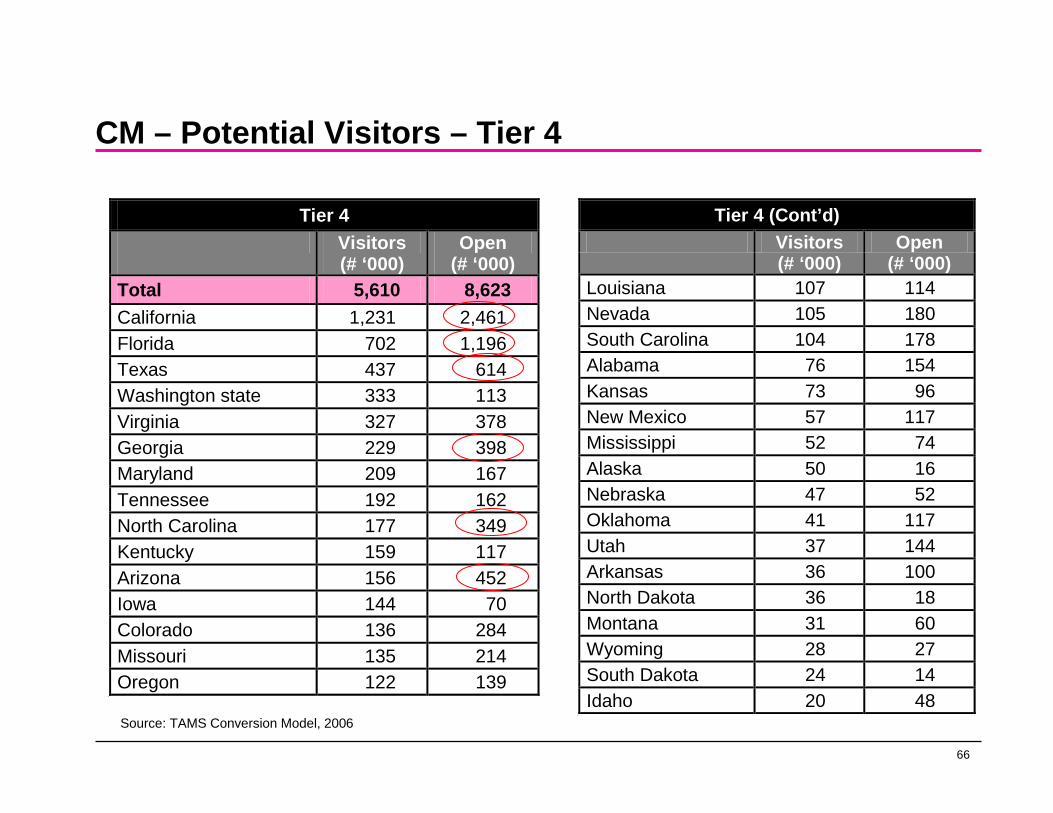
Tier Four also holds some potential for Ontario but is less attractive than Tier Three (and not simply due to greater distance). While there are large numbers of people open to visiting Ontario living in the states of: California, Texas, Florida, Arizona, Georgia and North Carolina, these potential visitors are geographically scattered and therefore difficult to reach cost-effectively with sufficient weight and frequency to be persuasive. For example, while Texas has 614,000 potential visitors to Ontario, they are scattered across a large state, which poses a significant challenge with respect to marketing. In contrast, a Tier Three city such as Washington D.C. has 289,000 potential visitors within one MSA, which lends itself to more focused communication efforts (i.e., messaging and media).Tier Two markets hold some potential but are clearly less attractive than those in Tier One and Tier Three since Tier Two essentially represents more distant areas within the Border States with generally lower population concentrations. The Tier Two market potential is largely spread over Western Michigan, Central & Western Ohio and Eastern New York State. Efforts to target Tier One are also likely to have a positive impact on some of the Tier Two markets through advertising spillover.
Canada
Within Canada, the West and Quebec hold the largest untapped pools of potential visitors to Ontario (997,000 and 554,000, respectively). Quebec’s proximity presents Ontario with a relatively greater opportunity to attract potential visitors from this province than from among the more distant pools of potential visitors scattered throughout the three most western provinces.
37
Overseas Opportunity Markets
38
Ontario’s Best Prospect Markets: Overseas
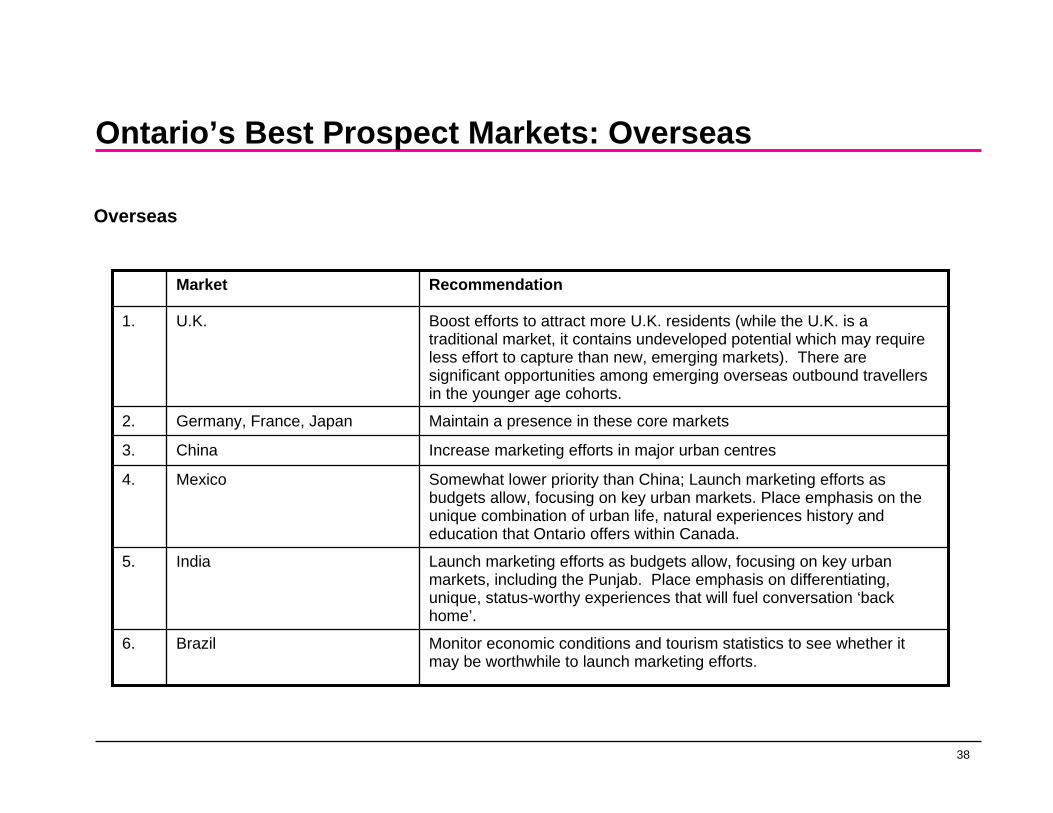
Overseas
Somewhat lower priority than China; Launch marketing efforts as budgets allow, focusing on key urban markets. Place emphasis on the unique combination of urban life, natural experiences history and education that Ontario offers within Canada.
Mexico4.
RecommendationMarket
Monitor economic conditions and tourism statistics to see whether it may be worthwhile to launch marketing efforts.
Brazil6.
Launch marketing efforts as budgets allow, focusing on key urbanmarkets, including the Punjab. Place emphasis on differentiating, unique, status-worthy experiences that will fuel conversation ‘back home’.
India 5.
Increase marketing efforts in major urban centresChina3.
Maintain a presence in these core marketsGermany, France, Japan2.
Boost efforts to attract more U.K. residents (while the U.K. is a traditional market, it contains undeveloped potential which may require less effort to capture than new, emerging markets). There are significant opportunities among emerging overseas outbound travellersin the younger age cohorts.
U.K.1.

39
$24$48$66$69$92$104$113$116$151$154
$250$530
$612$739Michigan
NY State
UK Japan China
Germany Mexico France
India Brazil
South KoreaAustralia
NetherlandsSpain
Source: Statistics Canada ITS, 2002- 2006
Overseas Opportunity MarketsTo help set the overseas markets into context, U.S. visitors provide an extremely important revenue stream. Visitors from Michigan and New York State spend more in Ontario annually than do overseas visitors from the top six countries combined.The U.K. and to a lesser extent Japan are currently the two most attractive overseas sources of tourism spending in Ontario.
2006 Visitor Expenditures (in millions)
40
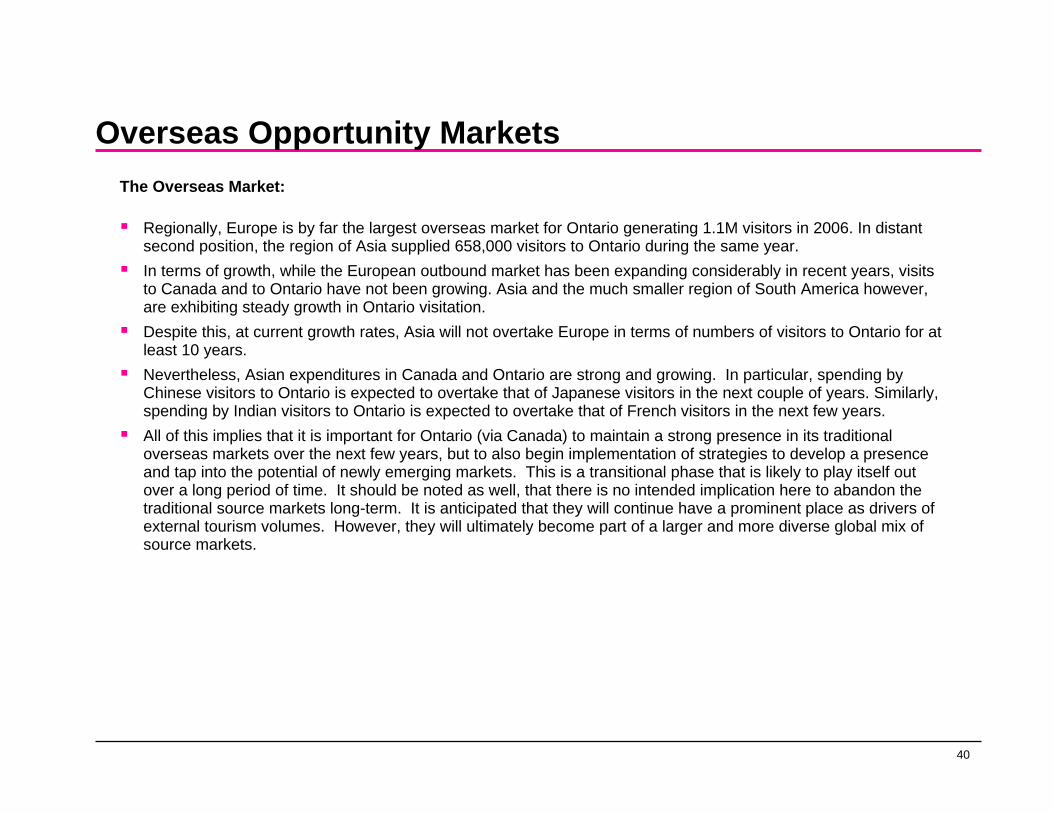
Overseas Opportunity MarketsThe Overseas Market:
Regionally, Europe is by far the largest overseas market for Ontario generating 1.1M visitors in 2006. In distant second position, the region of Asia supplied 658,000 visitors to Ontario during the same year.In terms of growth, while the European outbound market has been expanding considerably in recent years, visits to Canada and to Ontario have not been growing. Asia and the much smaller region of South America however, are exhibiting steady growth in Ontario visitation.Despite this, at current growth rates, Asia will not overtake Europe in terms of numbers of visitors to Ontario for at least 10 years.Nevertheless, Asian expenditures in Canada and Ontario are strong and growing. In particular, spending by Chinese visitors to Ontario is expected to overtake that of Japanese visitors in the next couple of years. Similarly, spending by Indian visitors to Ontario is expected to overtake that of French visitors in the next few years.All of this implies that it is important for Ontario (via Canada) to maintain a strong presence in its traditional overseas markets over the next few years, but to also begin implementation of strategies to develop a presence and tap into the potential of newly emerging markets. This is a transitional phase that is likely to play itself out over a long period of time. It should be noted as well, that there is no intended implication here to abandon the traditional source markets long-term. It is anticipated that they will continue have a prominent place as drivers of external tourism volumes. However, they will ultimately become part of a larger and more diverse global mix of source markets.
41
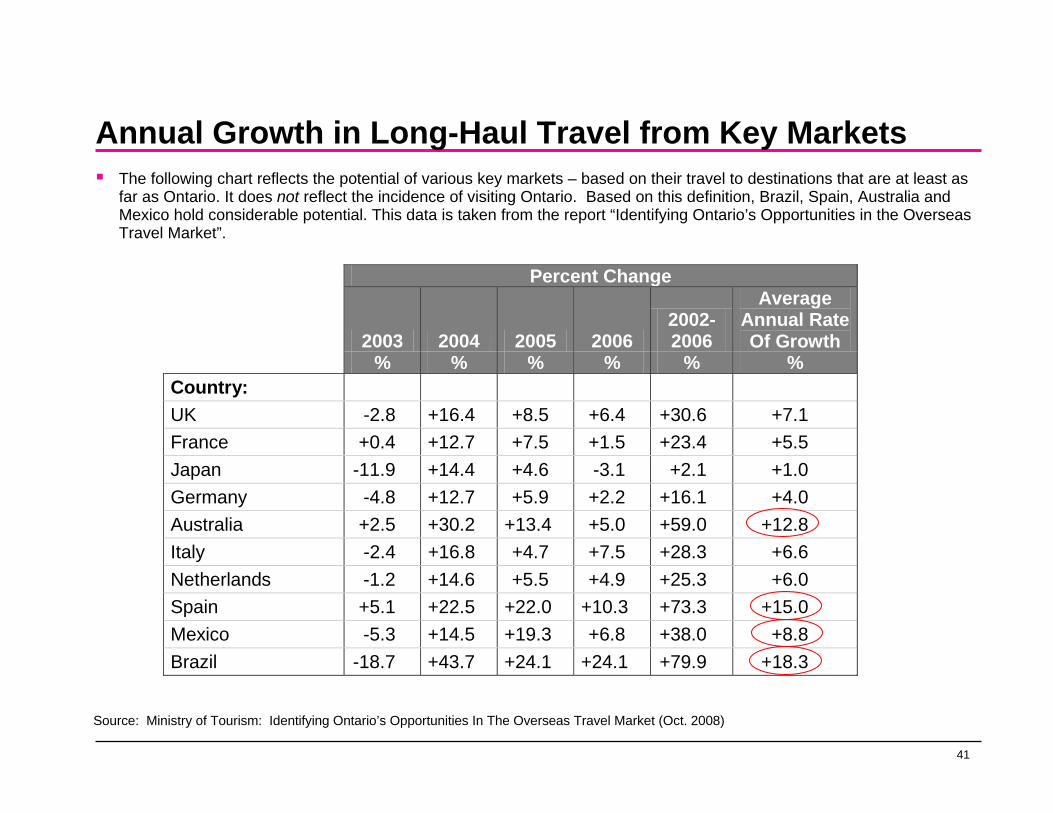
Annual Growth in Long-Haul Travel from Key MarketsThe following chart reflects the potential of various key markets – based on their travel to destinations that are at least as far as Ontario. It does not reflect the incidence of visiting Ontario. Based on this definition, Brazil, Spain, Australia and Mexico hold considerable potential. This data is taken from the report “Identifying Ontario’s Opportunities in the Overseas Travel Market”.
Percent Change
2003 2004 2005 2006 2002-2006
Average Annual Rate Of Growth
% % % % % % Country: UK -2.8 +16.4 +8.5 +6.4 +30.6 +7.1 France +0.4 +12.7 +7.5 +1.5 +23.4 +5.5 Japan -11.9 +14.4 +4.6 -3.1 +2.1 +1.0 Germany -4.8 +12.7 +5.9 +2.2 +16.1 +4.0 Australia +2.5 +30.2 +13.4 +5.0 +59.0 +12.8 Italy -2.4 +16.8 +4.7 +7.5 +28.3 +6.6 Netherlands -1.2 +14.6 +5.5 +4.9 +25.3 +6.0 Spain +5.1 +22.5 +22.0 +10.3 +73.3 +15.0 Mexico -5.3 +14.5 +19.3 +6.8 +38.0 +8.8 Brazil -18.7 +43.7 +24.1 +24.1 +79.9 +18.3
Source: Ministry of Tourism: Identifying Ontario’s Opportunities In The Overseas Travel Market (Oct. 2008)
42
Overseas Opportunity MarketsOverseas Market – Projected Change in Long-Haul Travel
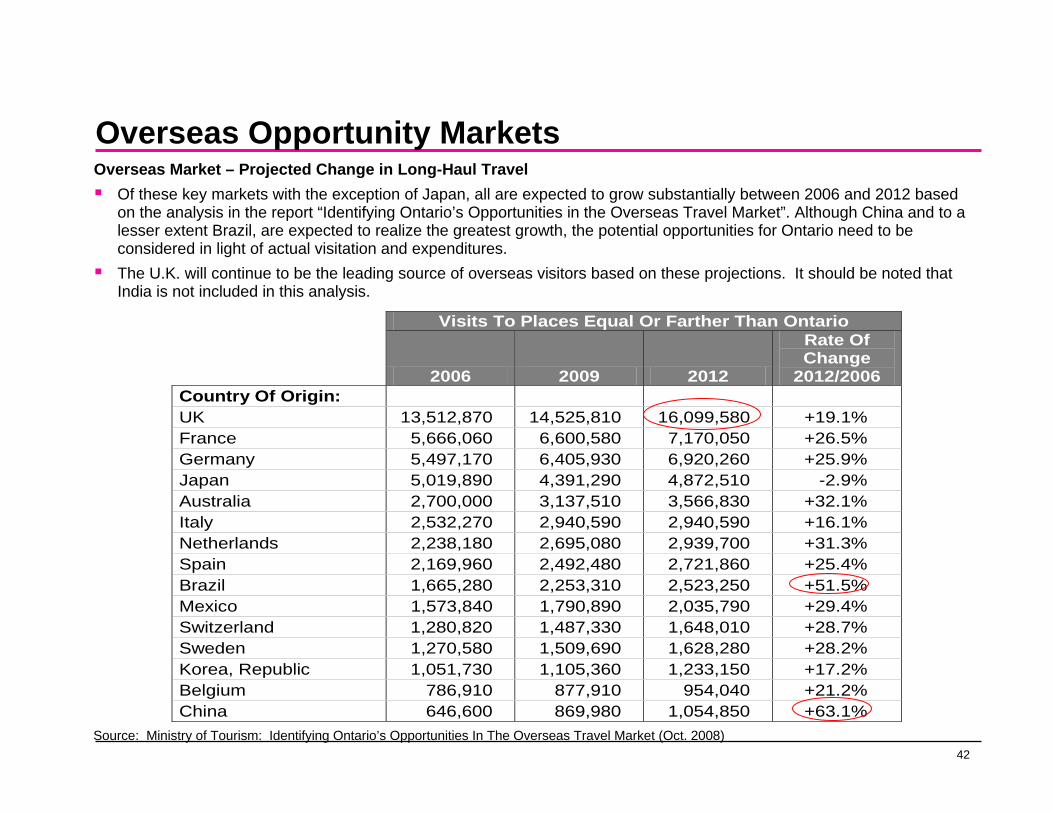
Of these key markets with the exception of Japan, all are expected to grow substantially between 2006 and 2012 based on the analysis in the report “Identifying Ontario’s Opportunities in the Overseas Travel Market”. Although China and to a lesser extent Brazil, are expected to realize the greatest growth, the potential opportunities for Ontario need to be considered in light of actual visitation and expenditures. The U.K. will continue to be the leading source of overseas visitors based on these projections. It should be noted that India is not included in this analysis.
Visits To Places Equal Or Farther Than Ontario
2006 2009 2012
Rate Of Change
2012/2006 Country Of Origin: UK 13,512,870 14,525,810 16,099,580 +19.1% France 5,666,060 6,600,580 7,170,050 +26.5% Germany 5,497,170 6,405,930 6,920,260 +25.9% Japan 5,019,890 4,391,290 4,872,510 -2.9% Australia 2,700,000 3,137,510 3,566,830 +32.1% Italy 2,532,270 2,940,590 2,940,590 +16.1% Netherlands 2,238,180 2,695,080 2,939,700 +31.3% Spain 2,169,960 2,492,480 2,721,860 +25.4% Brazil 1,665,280 2,253,310 2,523,250 +51.5% Mexico 1,573,840 1,790,890 2,035,790 +29.4% Switzerland 1,280,820 1,487,330 1,648,010 +28.7% Sweden 1,270,580 1,509,690 1,628,280 +28.2% Korea, Republic 1,051,730 1,105,360 1,233,150 +17.2% Belgium 786,910 877,910 954,040 +21.2% China 646,600 869,980 1,054,850 +63.1% Source: Ministry of Tourism: Identifying Ontario’s Opportunities In The Overseas Travel Market (Oct. 2008)
43
Potential Spending based on Visitation Forecasts
20122010200820062012201020082006
$30,000,000$29,000,000$27,000,000$23,995,98338,211 36,988 33,693 30,313 Spain
$132,000,000$118,000,000$109,000,000$91,744,95166,318 59,258 54,721 45,983 Brazil
$53,000,000$48,000,000$51,000,000$47,745,13063,144 56,987 59,914 56,519Netherlands
$77,000,000$72,000,000$72,000,000$65,597,37170,866 65,636 65,609 60,125 Australia
$102,000,000$87,000,000$89,000,000$68,877,591101,103 85,757 88,370 68,046 South Korea
$282,000,000$234,000,000$215,000,000$154,198,155157,134 130,623 119,596 85,952 China
$171,000,000$145,000,000$135,000,000$103,573,942143,339 121,195 112,654 86,691 India
$186,000,000$165,000,000$165,000,000$115,528,089159,370 140,913 141,318 98,949 Mexico
$129,000,000$118,000,000$114,000,000$112,521,878149,000136,000132,000130,124 France
$160,000,000$155,000,000$154,000,000$151,266,219138,000134,000133,000130,704 Germany
$219,000,000$204,000,000$195,000,000$250,095,230159,000148,000142,000181,771 Japan
$528,000,000$499,000,000$509,000,000$530,334,577419,000396,000404,000421,847 UK
Current and Projected Spending in OntarioCurrent and Projected Total Visits in OntarioOrigin
Source: Ministry of Tourism: Identifying Ontario’s Opportunities In The Overseas Travel Market (Oct. 2008); ITS 2002-2006
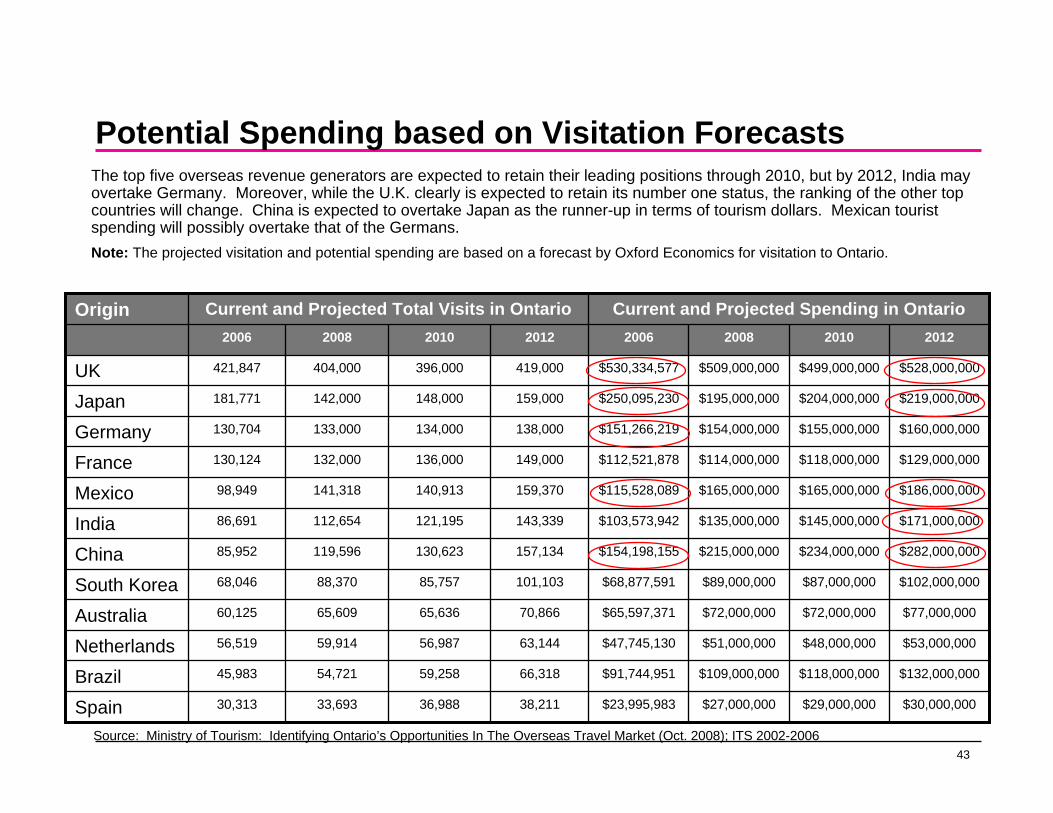
The top five overseas revenue generators are expected to retain their leading positions through 2010, but by 2012, India may overtake Germany. Moreover, while the U.K. clearly is expected to retain its number one status, the ranking of the other top countries will change. China is expected to overtake Japan as the runner-up in terms of tourism dollars. Mexican tourist spending will possibly overtake that of the Germans.Note: The projected visitation and potential spending are based on a forecast by Oxford Economics for visitation to Ontario.

44
Domestic Markets
45
Canada – Current and Potential Domestic VisitorsDomestic Market
Border Provinces
Manitoba
The West
Atlantic
Ontario
Quebec
Rest of Canada
VisitorOpen
# in '000
433 299
Atlantic
1,436554
Quebec
316 53
OntarioPermanentResidents
1996 - 2006
5,679
565
Total Ontario
255 252
Manitoba
149997
The West
Source: TAMS Conversion Model, 2006
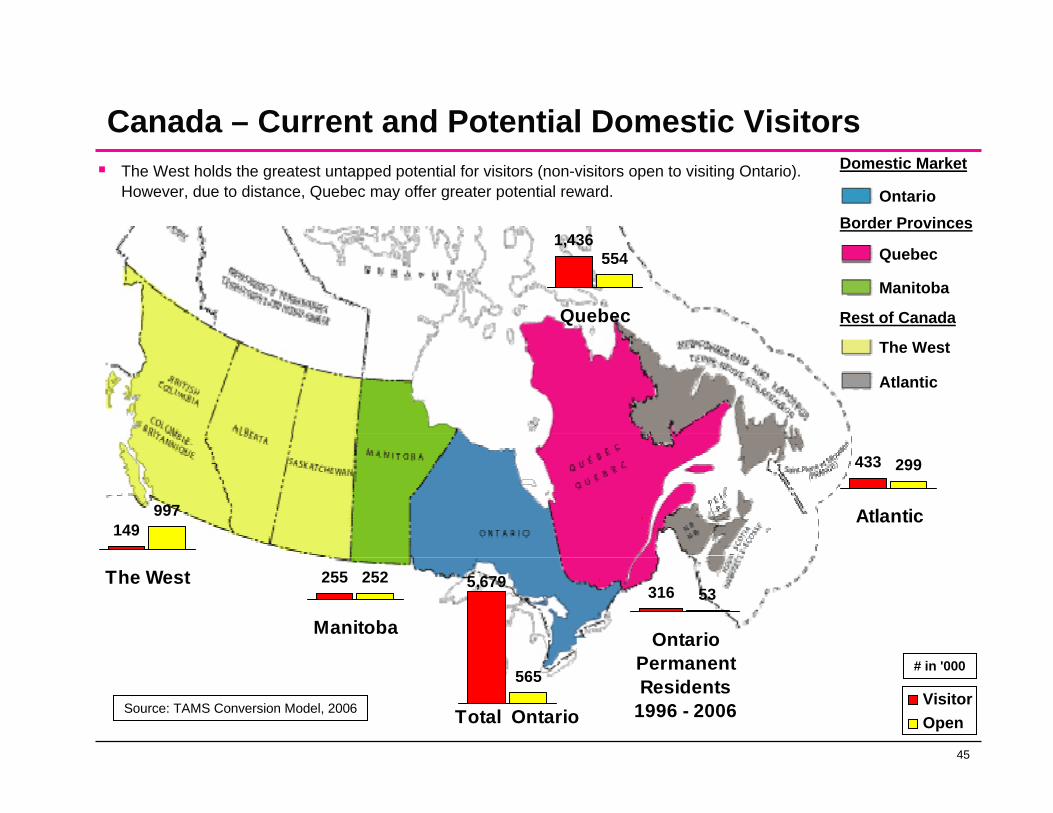
The West holds the greatest untapped potential for visitors (non-visitors open to visiting Ontario). However, due to distance, Quebec may offer greater potential reward.
46
Quebec Market

47
Quebec Summary
The Quebec market represents the largest source of Canadian visitors from outside Ontario. Overnight visitors constitute the majority of visitors from Quebec.However, these visitors are disproportionately Anglophone and visiting friends and relatives.Quebec also holds untapped potential, with roughly 0.5M non-visitors open to the idea of visiting Ontario under the right conditions.Quebecers who express any interest in visiting Ontario, express a wide range of interests which fit well with the existing tourism offering. In particular they mention that they would like to visit small towns and villages, parks, hiking trails, natural landmarks, family attractions and to stay at a B&B or country inn. Winery tours and theme parks are also high on the list of intended activities.Interest in Ontario is centered around the cities of Ottawa, Toronto and Kingston, but also extends to include southern Ontario. Northern Ontario is particularly appealing to those from the nearby Outaouais/Abitibi region.To make inroads into Quebec, Ontario needs to reach out to Francophone travellers as well as Anglophones. This requires French advertising that is sensitive to Quebec cultural nuances and does not appear to compromise. Travel information also needs to be provided in French. French signage will also create positive touch-points. The key to advertising and communications is to address the lack of familiarity with Ontario and perceptions of Ontarians as being unfriendly/unwelcoming people. There is also a need to focus on what is distinctive relative to Quebec itself. This is a challenge given similarities in geography, environment (the outdoors) and the strength of Montreal and other centres in Quebec as focal points for culture and entertainment.Strategies need to be developed to make Francophones feel welcome in Ontario. Having staff who can reach out to Francophones in their own language could be leveraged to make French Quebecers feel comfortable in Ontario.

48
Quebec Summary
Interest in Ontario is fairly broad-based, and includes those of average means. Value is an important criterion in trip selection.Mature Families, Mature Singles and Couples and Seniors are the best prospects.Given its population, the Greater Montreal area is a good target.However, all regions along the Quebec/Ontario border offer good prospects, particularly if an effort is made to attract Quebecers to specific local events and attractions in close proximity to their point of origin.Similarly, give some emphasis to Ontario destinations and product in close proximity to the Quebec border in order accentuate the ease and convenience of choosing Ontario.Profile Ontario’s small towns and villages, parks, hiking trails, natural landmarks, beaches, family attractions, B & Bs, country inns, winery tours and theme parks.Don’t compete directly with Quebec’s iconic attractions. Place more emphasis on differentiating Ontario from Quebec (e.g., different cultural experience, different landscape and history). Perceived familiarity with Ontario and assumed similarity to Quebec (particularly in terms of landscape and history) represent impediments to stimulating interest.Leverage cultural/language differences (“it’s like visiting a foreign country without the hassles”).Mass media have a role to play. In particular, television is hugely popular in Quebec.Destination websites and brochures are popular among Francophones and provide good means of delivering secondary support to broadcast and print.Other means of targeting Francophones include non-destination websites and government tourism offices.In addition to mass media and brochures, Anglophones can also be targeted via non-destination websites and travel magazines.
49
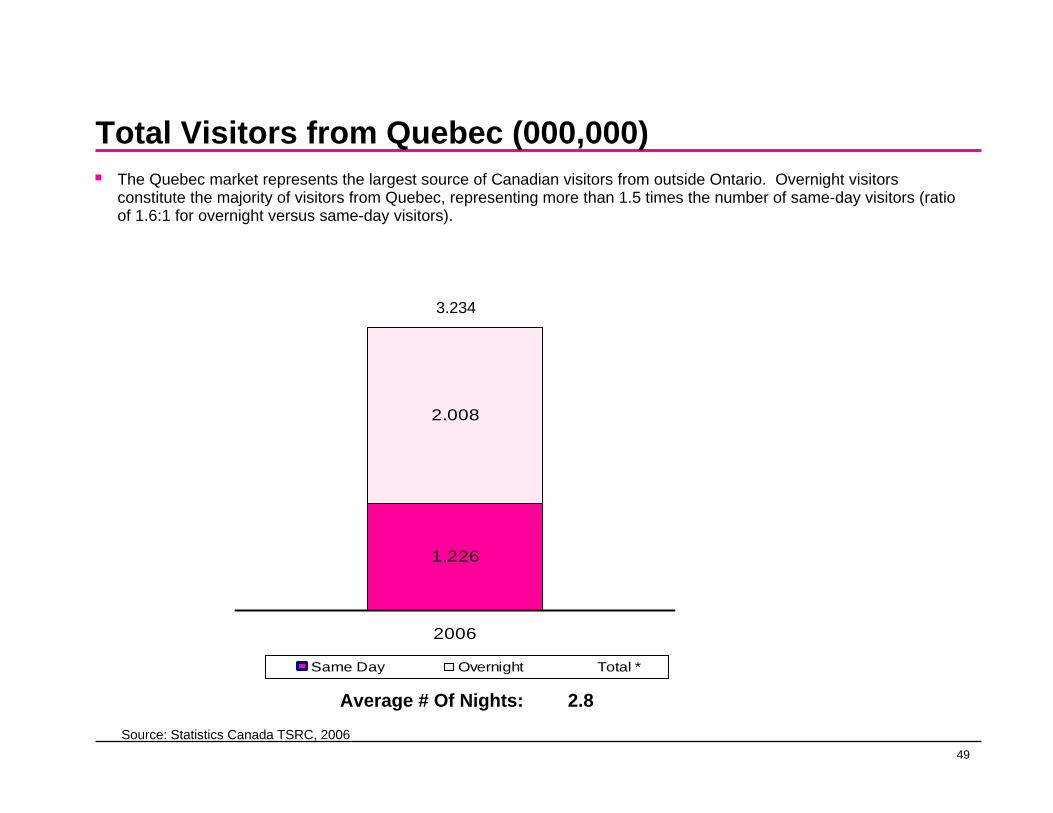
Total Visitors from Quebec (000,000)
1.226
2.008
2006
Same Day Overnight Total *
Average # Of Nights: 2.8
Source: Statistics Canada TSRC, 2006
3.234
The Quebec market represents the largest source of Canadian visitors from outside Ontario. Overnight visitors constitute the majority of visitors from Quebec, representing more than 1.5 times the number of same-day visitors (ratio of 1.6:1 for overnight versus same-day visitors).

50
Main Purpose of TripVisiting friends and relatives is the main reason for Quebecers to visit Ontario, accounting for one-half (49%) of all trips to Ontario.
5%
11%
35%
49% VFR
Pleasure
Other
Busi-ness
Sources Statistics Canada TSRC 2006 Base: All visitors from Quebec 3,234,000
51
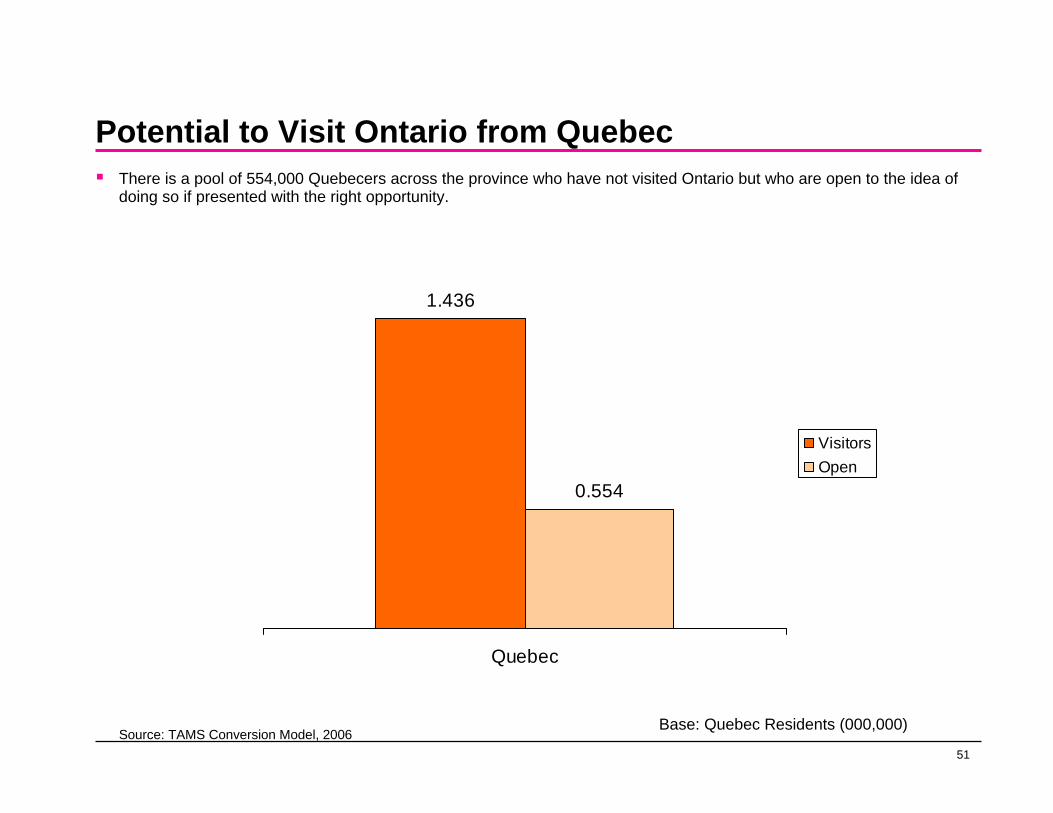
Potential to Visit Ontario from QuebecThere is a pool of 554,000 Quebecers across the province who have not visited Ontario but who are open to the idea of doing so if presented with the right opportunity.
1.436
0.554
Quebec
VisitorsOpen
Source: TAMS Conversion Model, 2006Base: Quebec Residents (000,000)
52
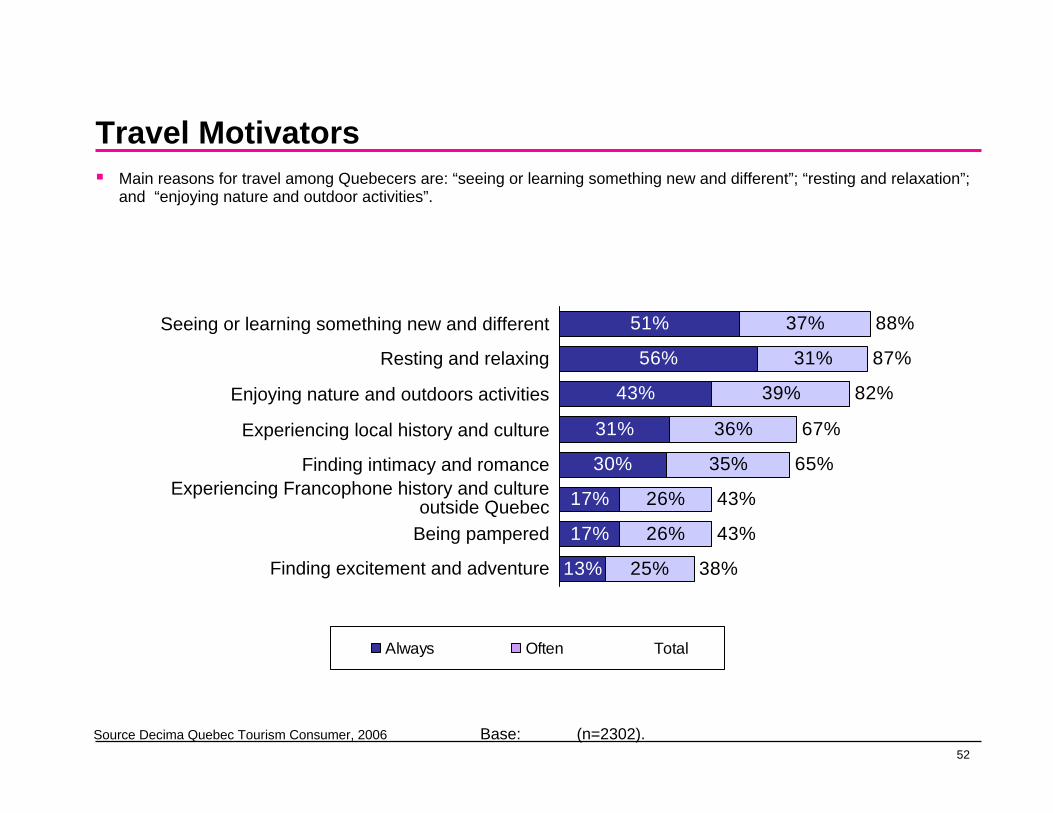
Travel Motivators
51%
56%
43%
31%
30%
17%
17%
13%
37%
31%
39%
36%
35%
26%
26%
25%
88%
87%
82%
67%
65%
43%
43%
38%
Main reasons for travel among Quebecers are: “seeing or learning something new and different”; “resting and relaxation”; and “enjoying nature and outdoor activities”.
Seeing or learning something new and different
Resting and relaxing
Enjoying nature and outdoors activities
Experiencing local history and culture
Finding intimacy and romanceExperiencing Francophone history and culture
outside QuebecBeing pampered
Finding excitement and adventure
Always Often Total
Source Decima Quebec Tourism Consumer, 2006 Base: (n=2302).
53
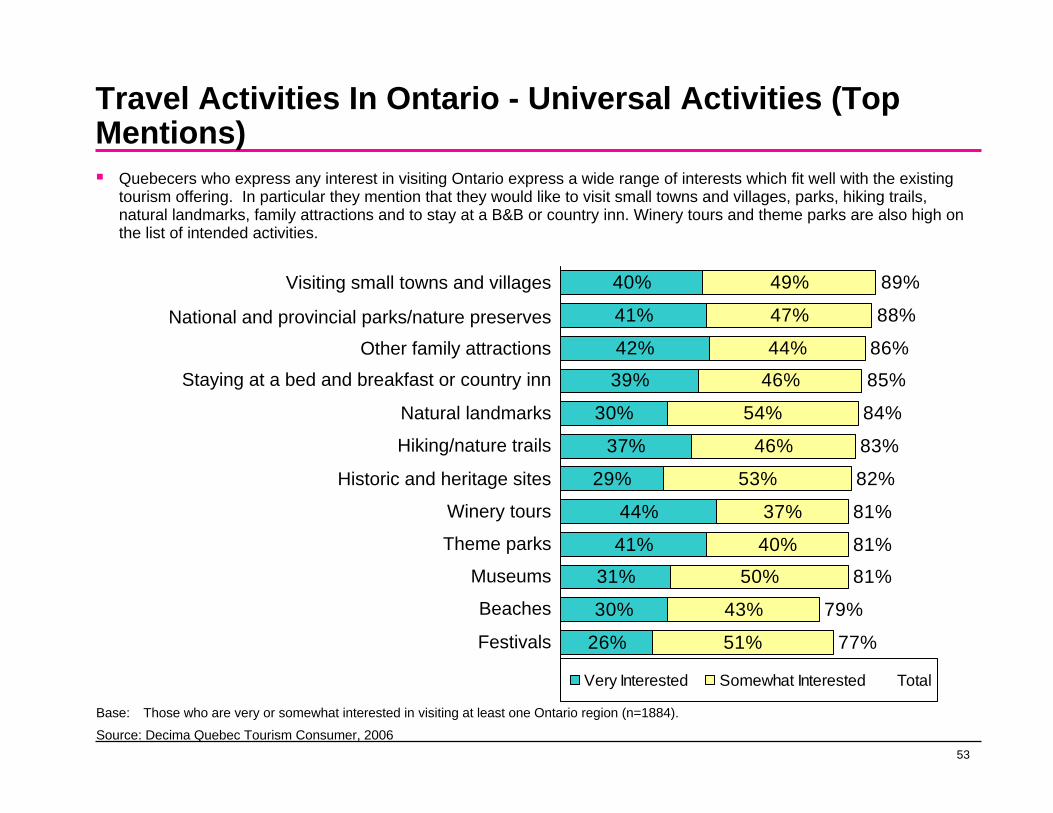
Travel Activities In Ontario - Universal Activities (Top Mentions)
Quebecers who express any interest in visiting Ontario express a wide range of interests which fit well with the existing tourism offering. In particular they mention that they would like to visit small towns and villages, parks, hiking trails, natural landmarks, family attractions and to stay at a B&B or country inn. Winery tours and theme parks are also high on the list of intended activities.
40%
41%
42%
39%
30%
37%
29%
44%
41%
31%
30%
26%
49%
47%
44%
46%
54%
46%
53%
37%
40%
50%
43%
51%
89%
88%
86%
85%
84%
83%
82%
81%
81%
81%
79%
77%
Visiting small towns and villages
National and provincial parks/nature preserves
Other family attractions
Staying at a bed and breakfast or country inn
Natural landmarks
Hiking/nature trails
Historic and heritage sites
Winery tours
Theme parks
Museums
Beaches
Festivals
Very Interested Somewhat Interested Total
Base: Those who are very or somewhat interested in visiting at least one Ontario region (n=1884).
Source: Decima Quebec Tourism Consumer, 2006
54
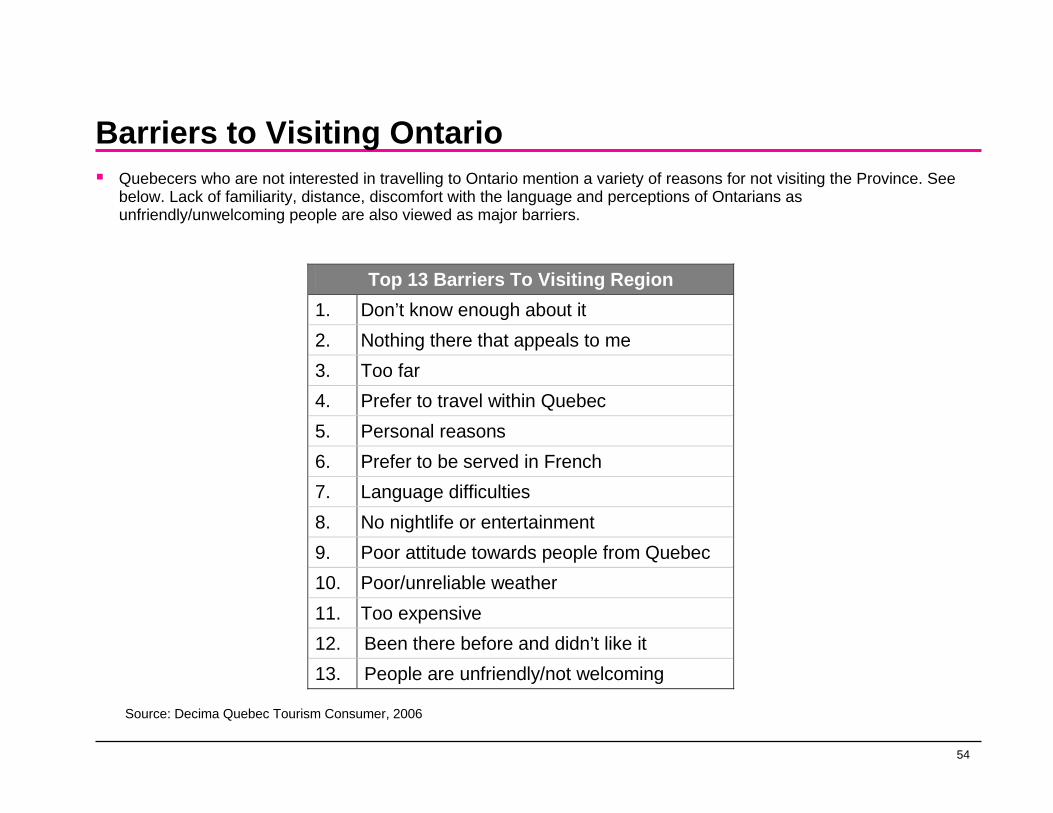
Barriers to Visiting OntarioQuebecers who are not interested in travelling to Ontario mention a variety of reasons for not visiting the Province. See below. Lack of familiarity, distance, discomfort with the language and perceptions of Ontarians as unfriendly/unwelcoming people are also viewed as major barriers.
Top 13 Barriers To Visiting Region 1. Don’t know enough about it 2. Nothing there that appeals to me 3. Too far 4. Prefer to travel within Quebec 5. Personal reasons 6. Prefer to be served in French 7. Language difficulties 8. No nightlife or entertainment 9. Poor attitude towards people from Quebec 10. Poor/unreliable weather 11. Too expensive 12. Been there before and didn’t like it 13. People are unfriendly/not welcoming
Source: Decima Quebec Tourism Consumer, 2006
55
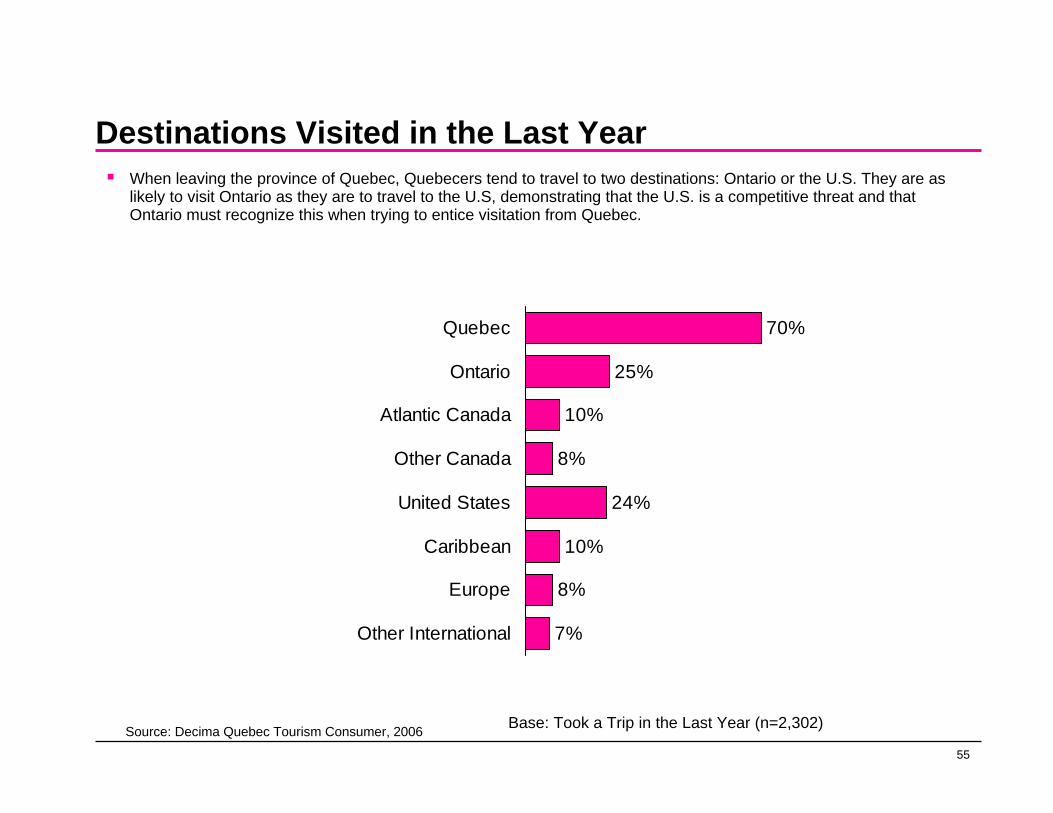
Destinations Visited in the Last Year
70%
25%
10%
8%
24%
10%
8%
7%
Quebec
Ontario
Atlantic Canada
Other Canada
United States
Caribbean
Europe
Other International
When leaving the province of Quebec, Quebecers tend to travel to two destinations: Ontario or the U.S. They are as likely to visit Ontario as they are to travel to the U.S, demonstrating that the U.S. is a competitive threat and that Ontario must recognize this when trying to entice visitation from Quebec.
Source: Decima Quebec Tourism Consumer, 2006 Base: Took a Trip in the Last Year (n=2,302)
56
70%
72%
79%
40%
43%
27%
83%
72%
English Montreal81%
70%
59%
57%
46%
34%
74%
71%
79%
66%
58%
64%
61%
46%
79%
69%
84%
67%
53%
65%
45%
71%
64%
86%
66%
51%
50%
Total Montreal
na
na
na
na
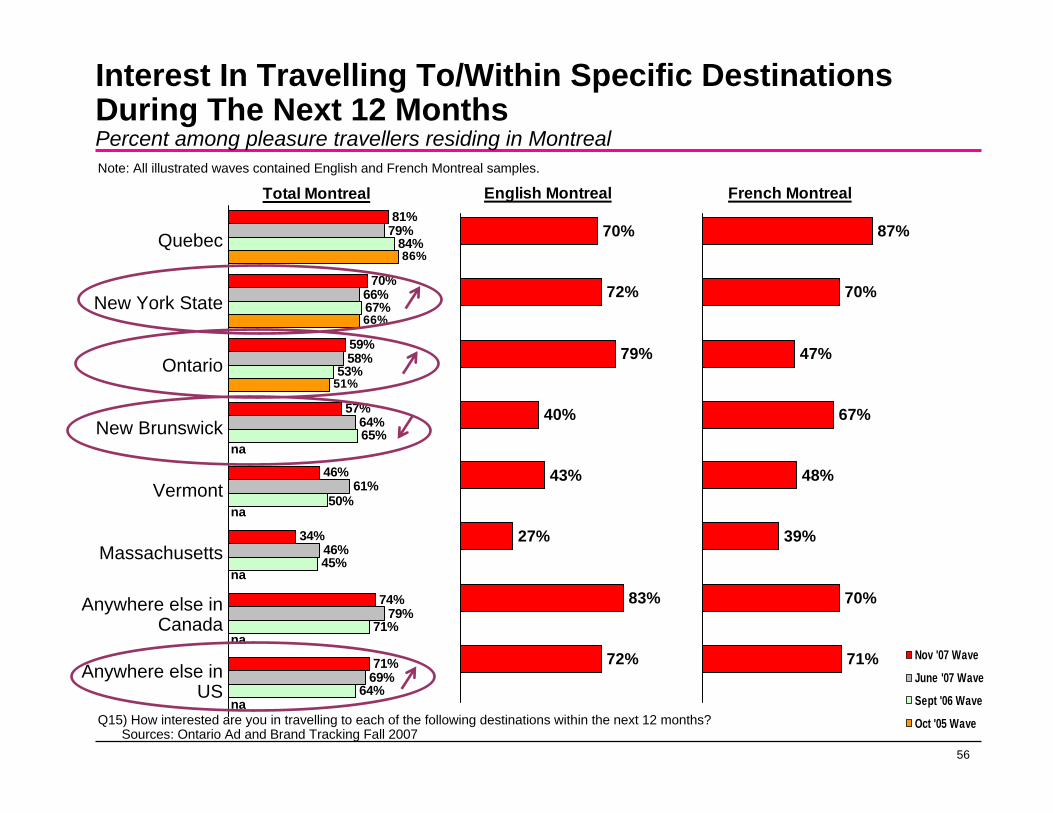
naQ15) How interested are you in travelling to each of the following destinations within the next 12 months?
Sources: Ontario Ad and Brand Tracking Fall 2007
Interest In Travelling To/Within Specific Destinations During The Next 12 MonthsPercent among pleasure travellers residing in Montreal
87%
70%
47%
67%
48%
39%
70%
71%
French MontrealNote: All illustrated waves contained English and French Montreal samples.
Quebec
New York State
Ontario
New Brunswick
Vermont
Massachusetts
Anywhere else in Canada
Anywhere else in US
Nov '07 Wave
June '07 Wave
Sept '06 Wave
Oct '05 Wave

57
United States
58
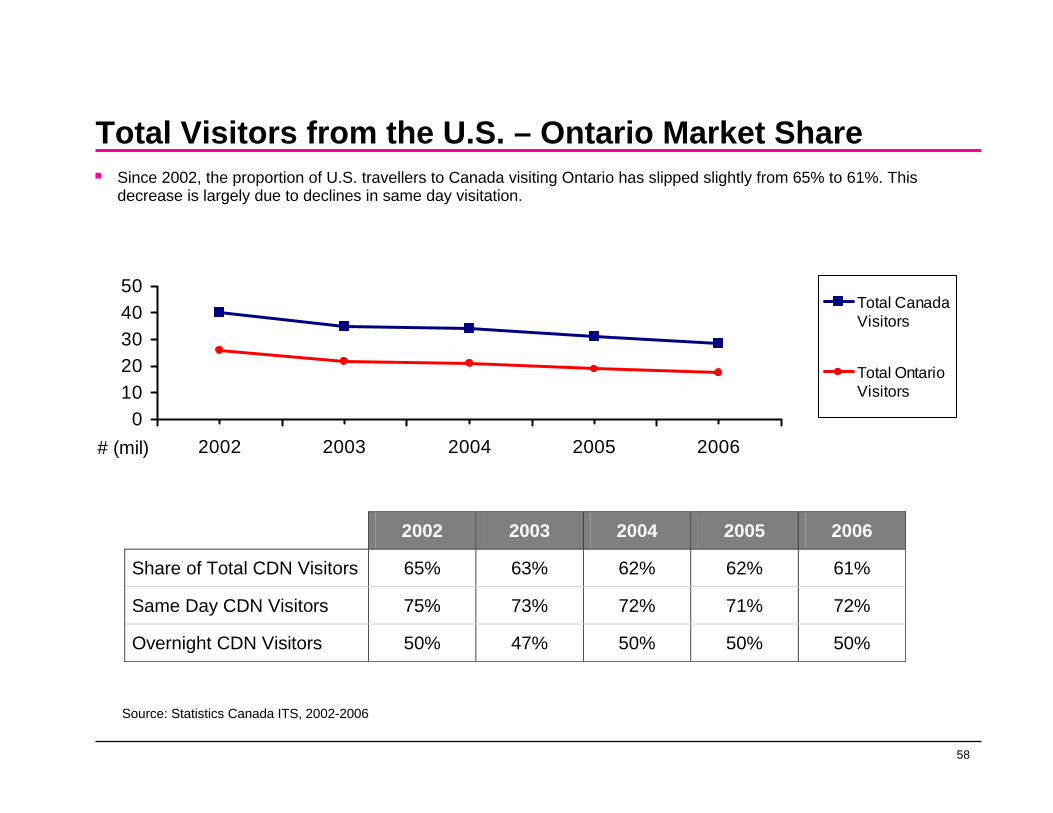
Total Visitors from the U.S. – Ontario Market Share
01020304050
2002 2003 2004 2005 2006# (mil)
Total Canada Visitors
Total OntarioVisitors
2002 2003 2004 2005 2006
Share of Total CDN Visitors 65% 63% 62% 62% 61%
Same Day CDN Visitors 75% 73% 72% 71% 72%
Overnight CDN Visitors 50% 47% 50% 50% 50%
Source: Statistics Canada ITS, 2002-2006
Since 2002, the proportion of U.S. travellers to Canada visiting Ontario has slipped slightly from 65% to 61%. This decrease is largely due to declines in same day visitation.
59
All Reasons For Travel To Ontario – U.S. Visitors (2006)
24%20%
14%10%9%
7%7%6%5%4%4%3%3%2%2%1%
ShoppingSightseeing
VFRHistoric SitesBar/Nightclub
Museum/Art GalleriesNature Parks
Cultural PerformancesFishing
CasinosBoating
Festival/FairsZoos/Botanical Gardens
Sports EventsTheme Parks
Golfing ± 0
+1
± 0
+1
± 0
+1
+1
+1
± 0
± 0
+1
+2
+2
+4
+3
+4
Change vs. 2002
Source: Statistics Canada ITS, 2002-2006
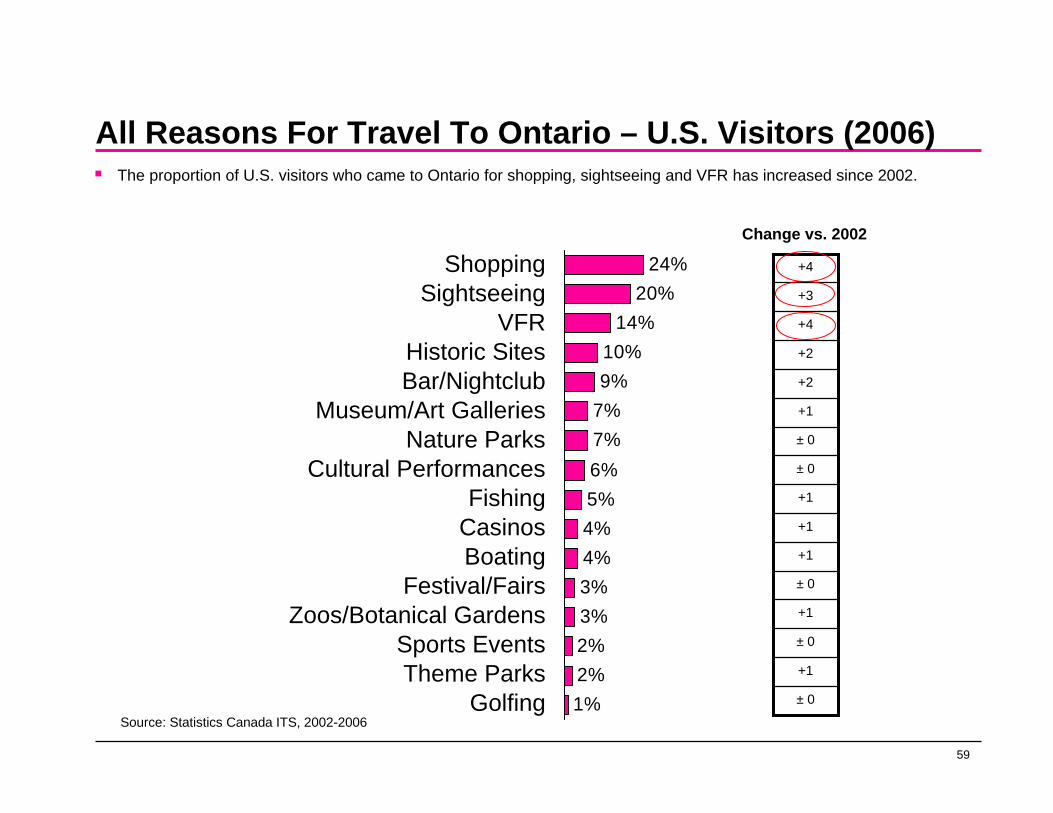
The proportion of U.S. visitors who came to Ontario for shopping, sightseeing and VFR has increased since 2002.
60
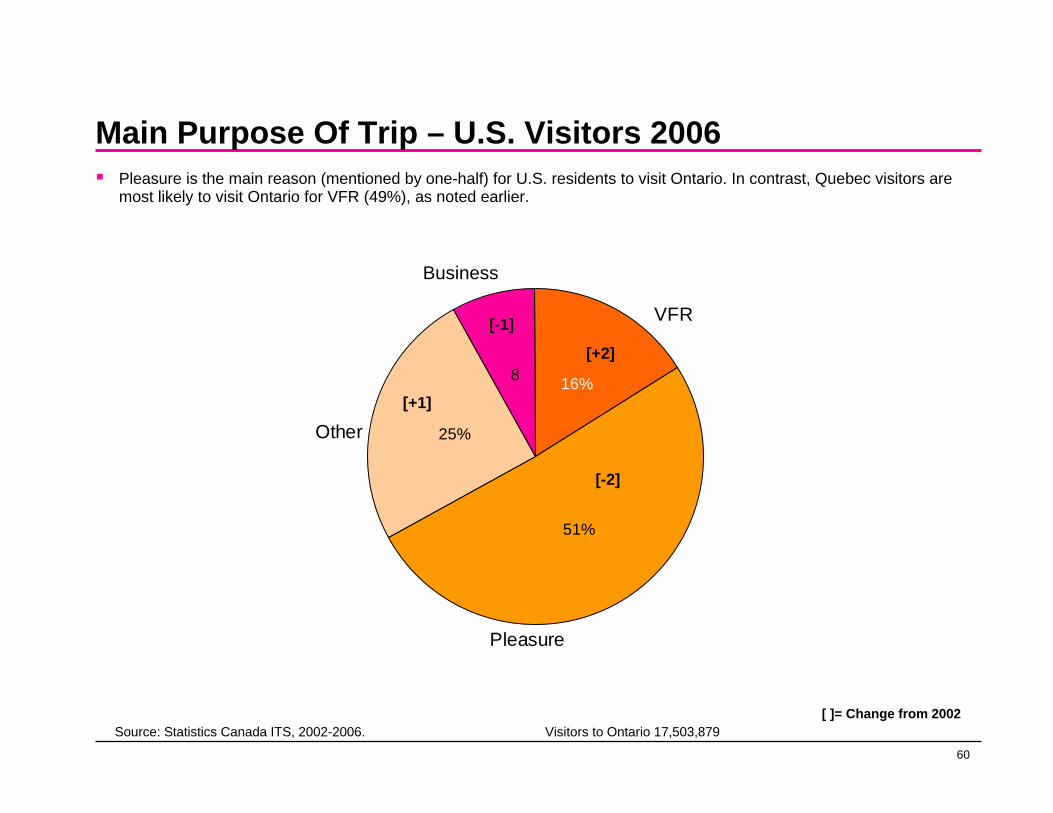
Main Purpose Of Trip – U.S. Visitors 2006Pleasure is the main reason (mentioned by one-half) for U.S. residents to visit Ontario. In contrast, Quebec visitors are most likely to visit Ontario for VFR (49%), as noted earlier.
16%
51%
25%
8
VFR
Pleasure
Other
Business
[+1]
[-2]
[-1]
[+2]
Source: Statistics Canada ITS, 2002-2006. Visitors to Ontario 17,503,879[ ]= Change from 2002
61
Destinations Visited In Past 3 Years – TravelsAmerica
15%
14%
14%
10%
5%
3%
3%
3%
2%
2%
2%
2%
60%
Mexico
Canada
Caribbean/Bermuda
Western Europe
Ontario
Asia
Eastern Europe
Central America
South America
Pacific
Middle East/Africa
Other
NoneSource: TravelsAmerica 2008 Q1/Q2
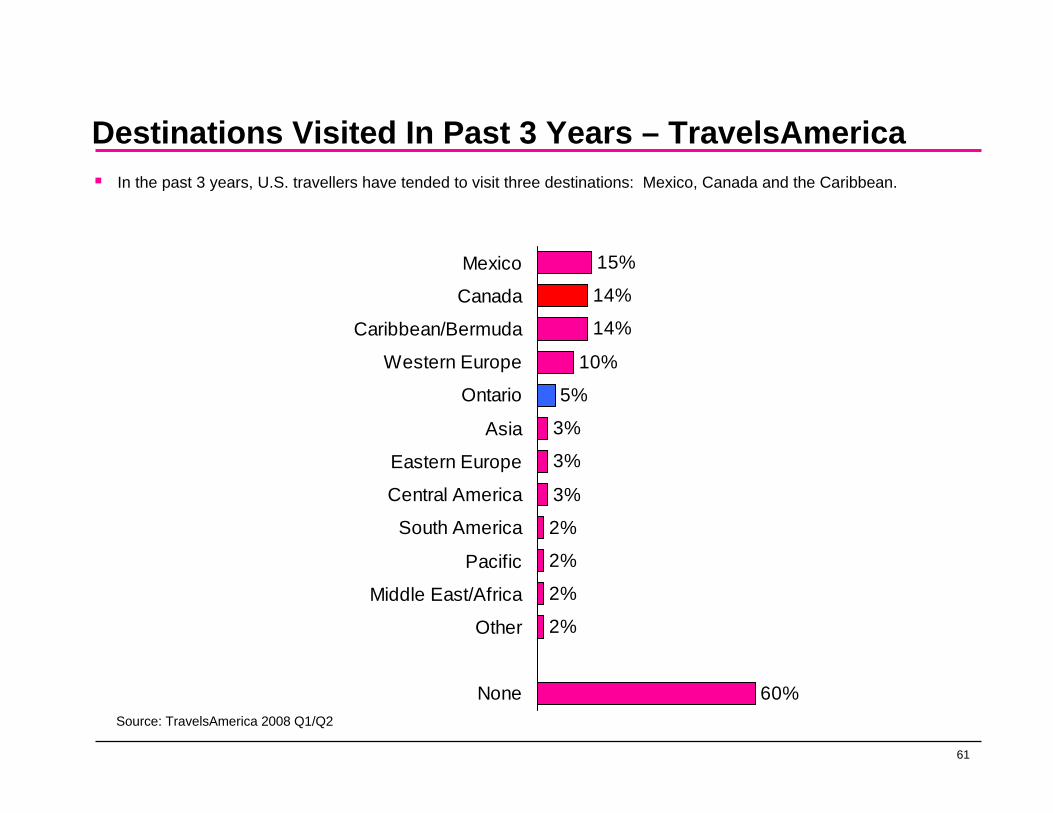
In the past 3 years, U.S. travellers have tended to visit three destinations: Mexico, Canada and the Caribbean.
62
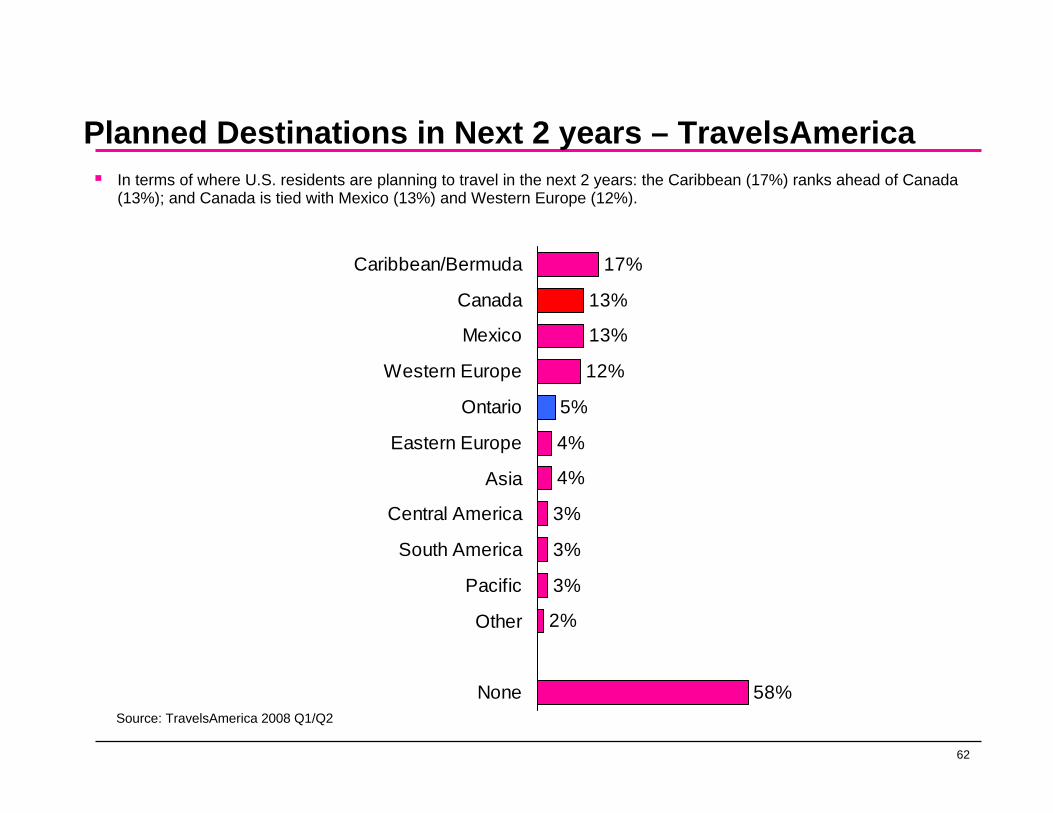
Planned Destinations in Next 2 years – TravelsAmerica
17%
13%
13%
12%
5%
4%
4%
3%
3%
3%
2%
58%
Caribbean/Bermuda
Canada
Mexico
Western Europe
Ontario
Eastern Europe
Asia
Central America
South America
Pacific
Other
NoneSource: TravelsAmerica 2008 Q1/Q2
In terms of where U.S. residents are planning to travel in the next 2 years: the Caribbean (17%) ranks ahead of Canada (13%); and Canada is tied with Mexico (13%) and Western Europe (12%).

63
U.S. – Current and Potential Visitors from the U.S.
2,306
4,041
West
VisitorOpen
5,047
2,093
Midwest
4,431
2,418
Northeast
1,016 553
NewEngland
1,9542,772
SouthAtlantic
478 506
East SouthCentral
620 945
West SouthCentral
# in '000Source: TAMS Conversion Model, 2006
64
CM – Potential Visitors – Tier 1 and 2
Tier 1 Visitors Open (# ‘000) (# ‘000)
Total 2,661 505 Eastern Michigan (sub-net) 1,033 149
Detroit 921 112 Northern Ohio (sub-net) 635 123
Cleveland 370 76 Western New York (sub-net) 612 137
Buffalo 291 49 Rochester 264 58
Pennsylvania (sub-net) 380 97
Pittsburgh 290 79 11
Tier 2 Visitors Open (# ‘000) (# ‘000)
Total 1,652 489 Western Michigan (sub-net) 525 122 Central/Western Ohio (sub-net) 423 153
Columbus 176 42 Eastern New York (sub-net) 331 135
Syracuse 125 52 Indiana (sub-net) 104 34 Pennsylvania (sub-net) 99 24 Vermont (sub-net) 57 9
11
Source: TAMS Conversion Model, 2006
65
CM – Potential Visitors – Tier 3
Tier 3 Visitors Open (# ‘000) (# ‘000)
Total 5,212 3,481 Greater New York City (sub-net) 865 715 Illinois 675 556 South Eastern Pennsylvania (subnet) 601 324
Philadelphia 292 204 New Jersey 493 457 Massachusetts (sub-net) 416 253
Boston, MA 264 116 Washington DC 314 289 Wisconsin (sub-net) 344 144
Milwaukee 88 55 Minnesota 337 141
Minneapolis 213 88 11
Tier 3 (Cont’d) Visitors Open (# ‘000) (# ‘000)
Connecticut 277 182 Southern Indiana (sub-net) 213 117
Indianapolis 78 67 Southern Ohio (sub-net) 165 99
Cincinnati, OH 106 58 Maryland (sub-net) 158 114
Baltimore, MD 141 96 New Hampshire 161 51 Delaware 85 35 Maine (sub-net) 83 20 Rhode Island 42 41 South Western Michigan (sub-net) 56 3
11
Source: TAMS Conversion Model, 2006
66
CM – Potential Visitors – Tier 4
Tier 4 Visitors Open (# ‘000) (# ‘000)
Total 5,610 8,623 California 1,231 2,461 Florida 702 1,196 Texas 437 614 Washington state 333 113 Virginia 327 378 Georgia 229 398 Maryland 209 167 Tennessee 192 162 North Carolina 177 349 Kentucky 159 117 Arizona 156 452 Iowa 144 70 Colorado 136 284 Missouri 135 214 Oregon 122 139
11
Tier 4 (Cont’d) Visitors Open (# ‘000) (# ‘000)
Louisiana 107 114 Nevada 105 180 South Carolina 104 178 Alabama 76 154 Kansas 73 96 New Mexico 57 117 Mississippi 52 74 Alaska 50 16 Nebraska 47 52 Oklahoma 41 117 Utah 37 144 Arkansas 36 100 North Dakota 36 18 Montana 31 60 Wyoming 28 27 South Dakota 24 14 Idaho 20 48
11
Source: TAMS Conversion Model, 2006

67
CM – Potential Visitors by Origin State Visitors Open (# ‘000) (# ‘000)
New York 1,903 1,022 New York City 597 514
Michigan 1,615 274 California 1,231 2,461 Ohio 1,187 350 Pennsylvania 1,019 386
Philadelphia 292 204Pittsburgh 290 79
Florida 702 1,196 Tampa 128 144Miami 96 203Orlando 82 117
Illinois 675 556 Chicago 487 430
New Jersey 493 457 Minnesota 444 150 Texas 437 614 Massachusetts 354 234
Boston 264 116 Wisconsin 349 146
11
Visitors Open (# ‘000) (# ‘000)
Washington 333 113 Virginia 327 378 Indiana 318 152 Washington, D.C 314 289 Connecticut 277 182 Georgia 229 398
Atlanta 148 231Maryland 209 167 Tennessee 192 162 North Carolina 177 349 New Hampshire 161 51 Kentucky 159 117 Arizona 156 452 Iowa 144 70 Colorado 136 284 Missouri 135 214 Oregon 122 139 Louisiana 107 114 Nevada 105 180 South Carolina 104 178
11
Source: TAMS Conversion Model, 2006
68
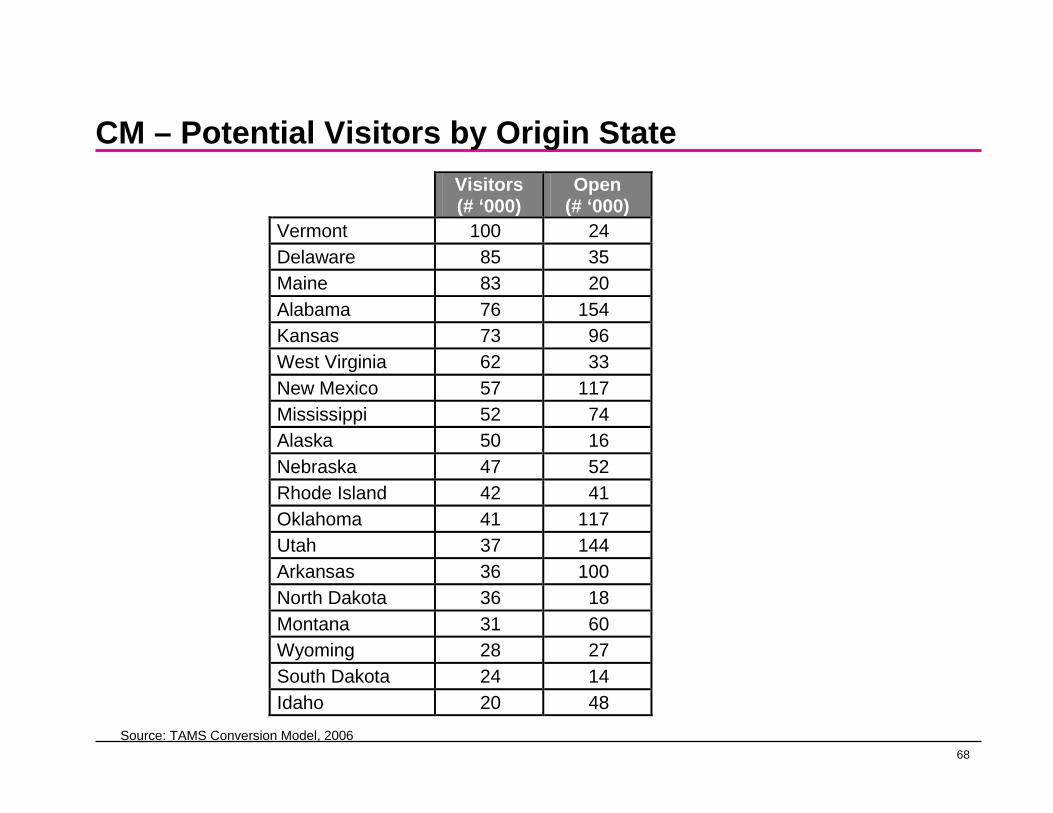
CM – Potential Visitors by Origin State Visitors Open (# ‘000) (# ‘000)
Vermont 100 24 Delaware 85 35 Maine 83 20 Alabama 76 154 Kansas 73 96 West Virginia 62 33 New Mexico 57 117 Mississippi 52 74 Alaska 50 16 Nebraska 47 52 Rhode Island 42 41 Oklahoma 41 117 Utah 37 144 Arkansas 36 100 North Dakota 36 18 Montana 31 60 Wyoming 28 27 South Dakota 24 14 Idaho 20 48
11
Source: TAMS Conversion Model, 2006

69
Detroit
70
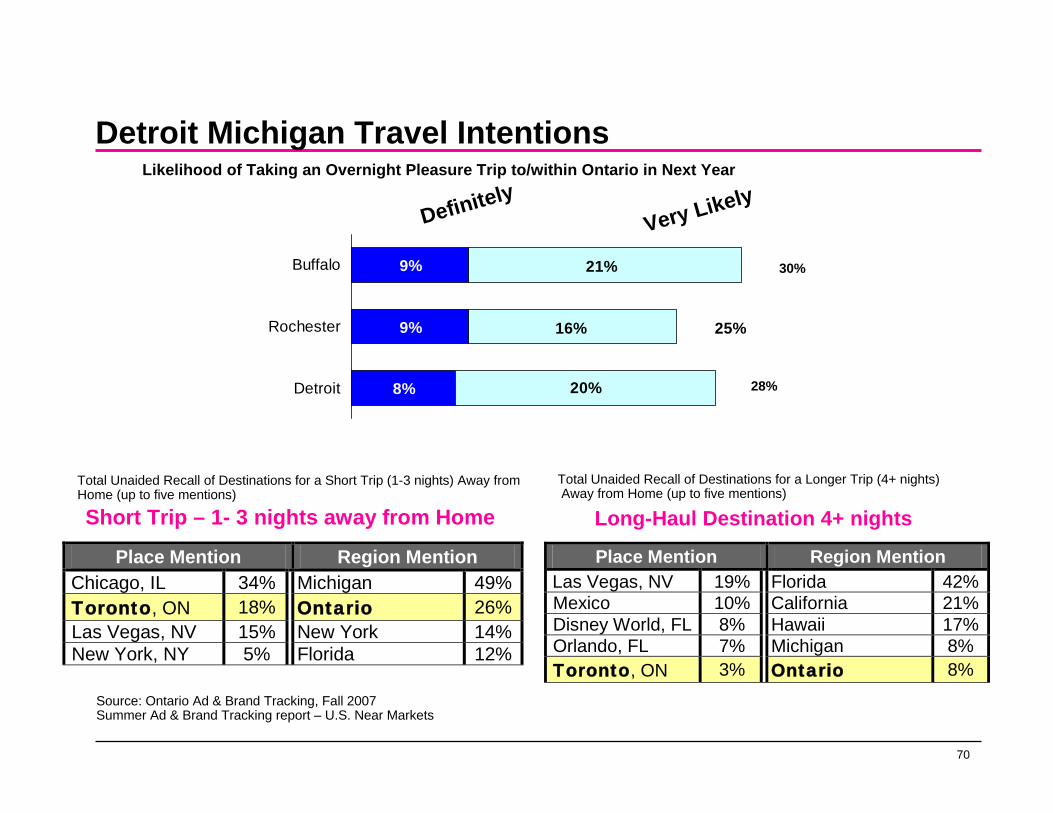
Short Trip – 1- 3 nights away from Home
Place Mention Region Mention Chicago, IL 34% Michigan 49%Toronto, ON 18% Ontario 26%Las Vegas, NV 15% New York 14%New York, NY 5% Florida 12%
Long-Haul Destination 4+ nights
Place Mention Region Mention Las Vegas, NV 19% Florida 42%Mexico 10% California 21%Disney World, FL 8% Hawaii 17%Orlando, FL 7% Michigan 8% Toronto, ON 3% Ontario 8%
Very LikelyDefinitely
9%
9%
8%
21%
16%
20%
25%
Buffalo
Rochester
Detroit
Total Unaided Recall of Destinations for a Short Trip (1-3 nights) Away from Home (up to five mentions)
Likelihood of Taking an Overnight Pleasure Trip to/within Ontario in Next Year
Detroit Michigan Travel Intentions
Total Unaided Recall of Destinations for a Longer Trip (4+ nights)Away from Home (up to five mentions)
30%
28%
Source: Ontario Ad & Brand Tracking, Fall 2007Summer Ad & Brand Tracking report – U.S. Near Markets

71
New York

72
Total Visitors (‘000)
2,0002,5003,0003,5004,0004,5005,0005,5006,0006,5007,0007,5008,0008,5009,0009,500
2002 2003 2004 2005 2006
#
Total CanadaVisitors FromNew York
Total OntarioVisitors FromNew York
Source: Statistics Canada ITS, 2002-2006
As would be expected, Ontario continues to holds the lion’s share of Canadian visits from New York State residents. However, there has been a negative trend in Canadian visits since 2002, also negatively affecting visits to Ontario.
73
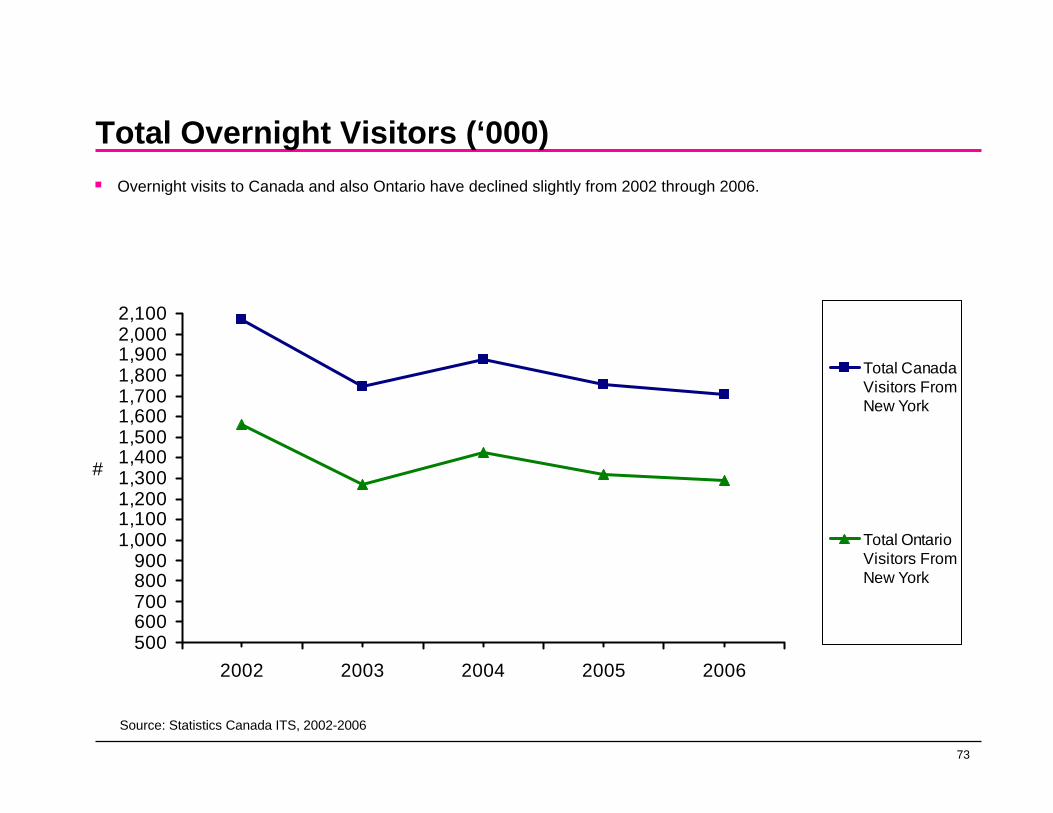
Total Overnight Visitors (‘000)
500600700800900
1,0001,1001,2001,3001,4001,5001,6001,7001,8001,9002,0002,100
2002 2003 2004 2005 2006
#
Total CanadaVisitors FromNew York
Total OntarioVisitors FromNew York
Source: Statistics Canada ITS, 2002-2006
Overnight visits to Canada and also Ontario have declined slightly from 2002 through 2006.
74
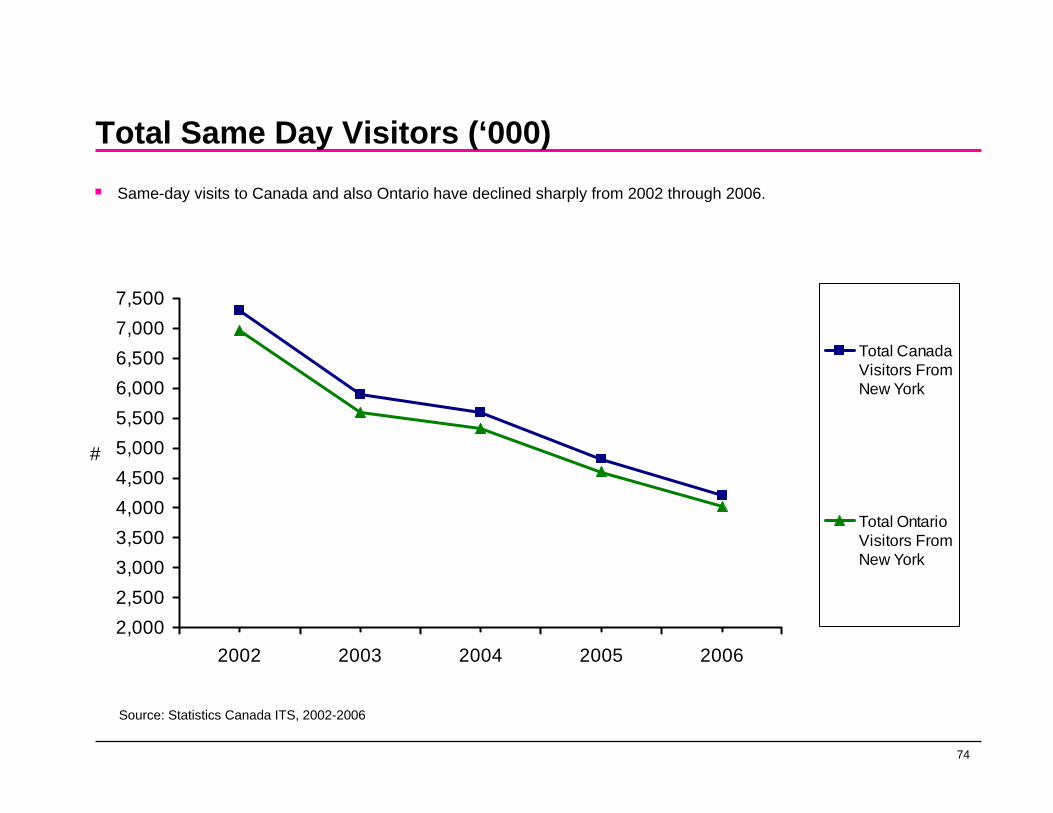
Total Same Day Visitors (‘000)
2,0002,5003,0003,5004,0004,5005,0005,5006,0006,5007,0007,500
2002 2003 2004 2005 2006
#
Total Canada Visitors FromNew York
Total OntarioVisitors FromNew York
Source: Statistics Canada ITS, 2002-2006
Same-day visits to Canada and also Ontario have declined sharply from 2002 through 2006.

75
Ontario Market Share Of Canadian TripsOntario holds an extremely large share of the same-day trips to Canada from New York State (96%) and a large proportion (75%) of overnight visits to Canada.
Ontario Market Share… 2002 2003 2004 2005 2006
From New York: % % % % %
Total 91 90 90 90 90
Overnight 75 73 76 75 75
Same Day 95 95 95 96 96
Source: Statistics Canada ITS, 2002-2006
76
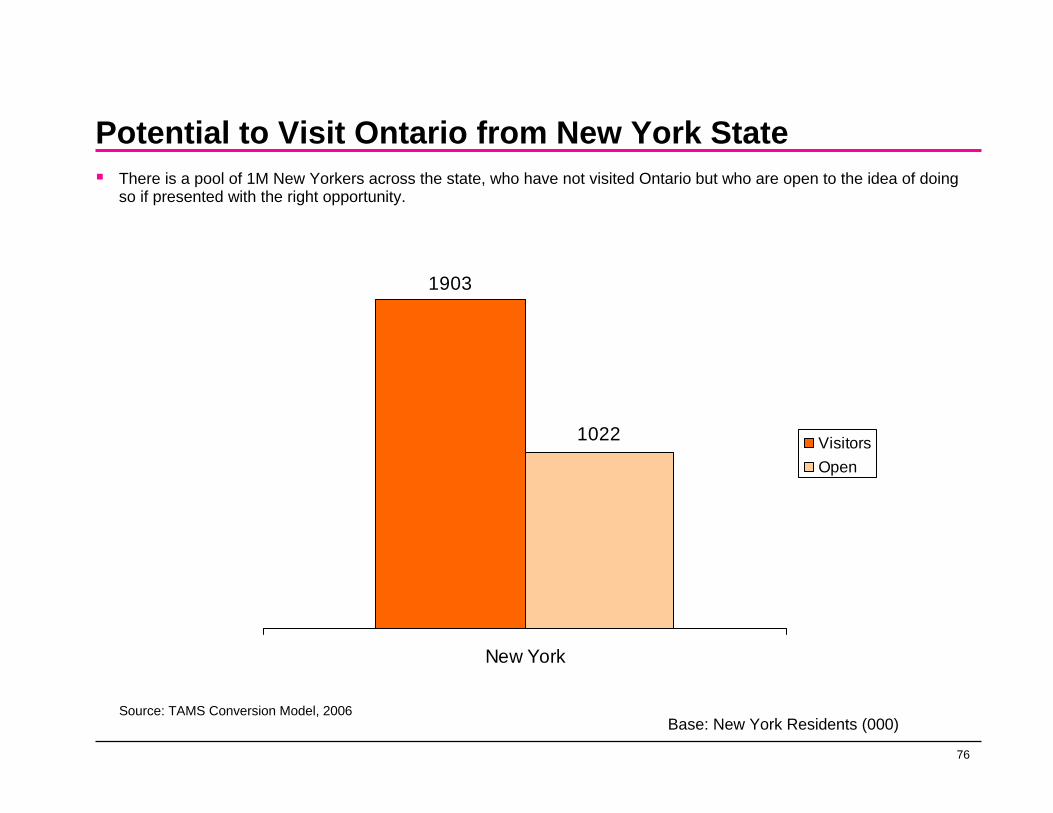
Potential to Visit Ontario from New York StateThere is a pool of 1M New Yorkers across the state, who have not visited Ontario but who are open to the idea of doing so if presented with the right opportunity.
1903
1022
New York
VisitorsOpen
Source: TAMS Conversion Model, 2006Base: New York Residents (000)

77
Main Purpose Of Trip - Leisure Travellers To Canada From New York
Pleasure is the main reason for New Yorkers to travel to Canada, whether they come by air or by auto. However, those who fly are more likely to be planning to visit friends or relatives than those who travel by car.
Air
14%
37%
49% Pleasure
VFR
Other
Auto
68%
19%
12%
Pleasure
VFR
Other
Source: CTC Air and Auto Leisure Market For Canada, 2007

78
Average ExpenditureAir travellers spend more per person, and more per night, and stay a day longer, on average, than their counterparts who travel by car.
Leisure Travellers To Canada From New York
Air Auto
Per person per trip $693 $291
Per person per night $165 $92
Average # of nights 4.2 3.0
Source: CTC Air and Auto Leisure Market For Canada, 2007
79
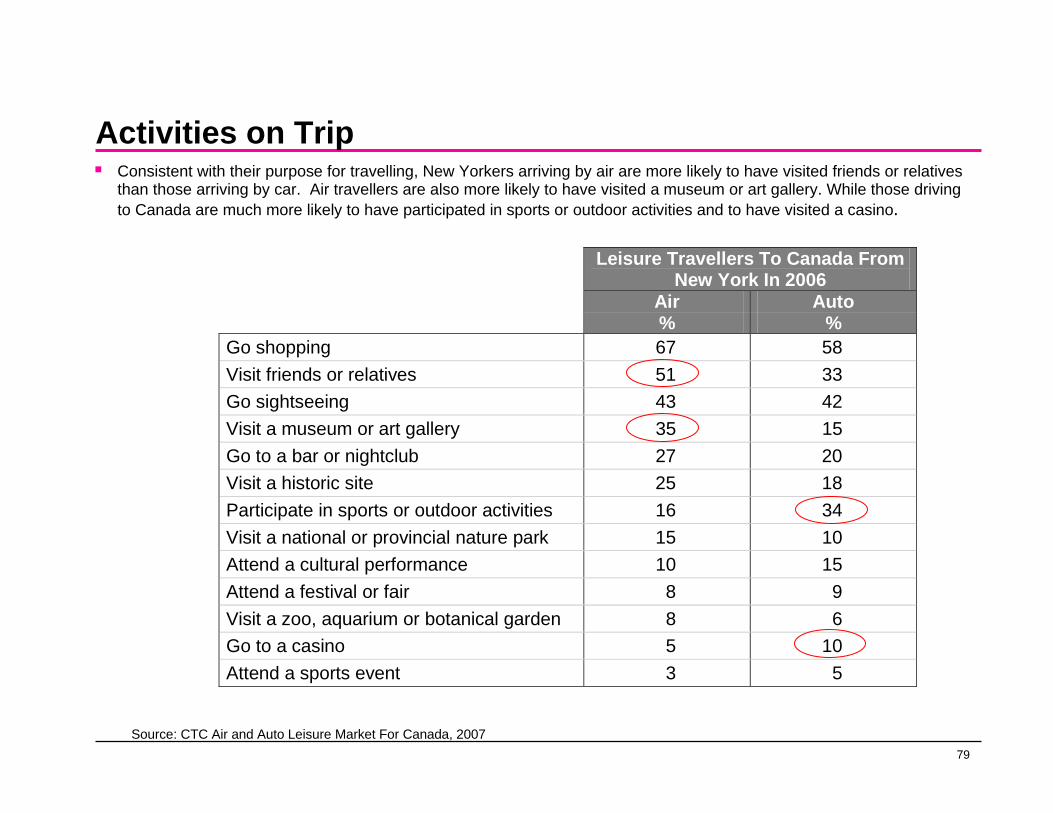
Activities on TripConsistent with their purpose for travelling, New Yorkers arriving by air are more likely to have visited friends or relatives than those arriving by car. Air travellers are also more likely to have visited a museum or art gallery. While those driving to Canada are much more likely to have participated in sports or outdoor activities and to have visited a casino.
Leisure Travellers To Canada From New York In 2006
Air Auto % % Go shopping 67 58 Visit friends or relatives 51 33 Go sightseeing 43 42 Visit a museum or art gallery 35 15 Go to a bar or nightclub 27 20 Visit a historic site 25 18 Participate in sports or outdoor activities 16 34 Visit a national or provincial nature park 15 10 Attend a cultural performance 10 15 Attend a festival or fair 8 9 Visit a zoo, aquarium or botanical garden 8 6 Go to a casino 5 10 Attend a sports event 3 5
Source: CTC Air and Auto Leisure Market For Canada, 2007
80
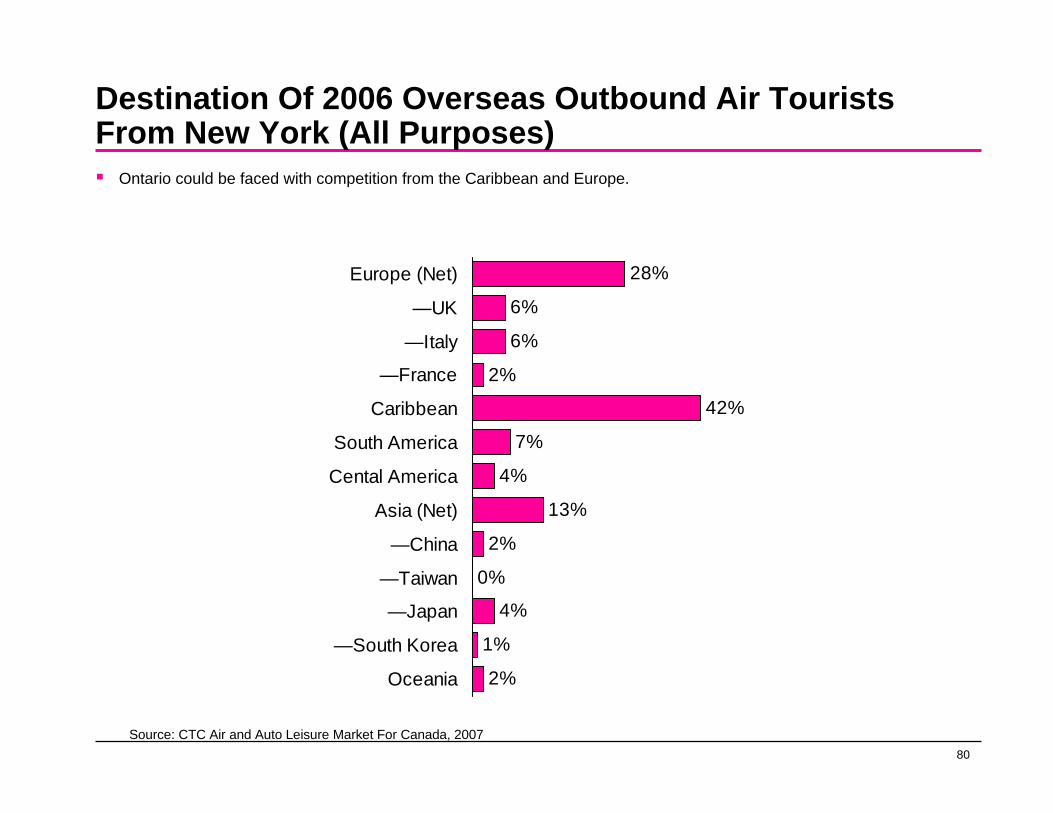
Destination Of 2006 Overseas Outbound Air Tourists From New York (All Purposes)
Ontario could be faced with competition from the Caribbean and Europe.
28%
6%
6%
2%
42%
7%
4%
13%
2%
0%
4%
1%
2%
Europe (Net)
—UK
—Italy
—France
Caribbean
South America
Cental America
Asia (Net)
—China
—Taiwan
—Japan
—South Korea
Oceania
Source: CTC Air and Auto Leisure Market For Canada, 2007

81
Characteristics Of 2006 Overseas Outbound Air Tourists From New York (All Purposes)
Dining and shopping, top the list of activities of overseas air travellers from New York.
Top 10 Activities
Dining in restaurants 80%
Shopping 70%
Visit historical places 41%
Visit small towns 36%
Sightseeing in cities 35%
Touring countryside 30%
Nightclubs/dancing 29%
Cultural Heritage sites 27%
Art gallery/museum 20%
Guided tours 14% 11
Source: CTC Air and Auto Leisure Market For Canada, 2007

82
Massachusetts
83
Total Visitors (‘000)
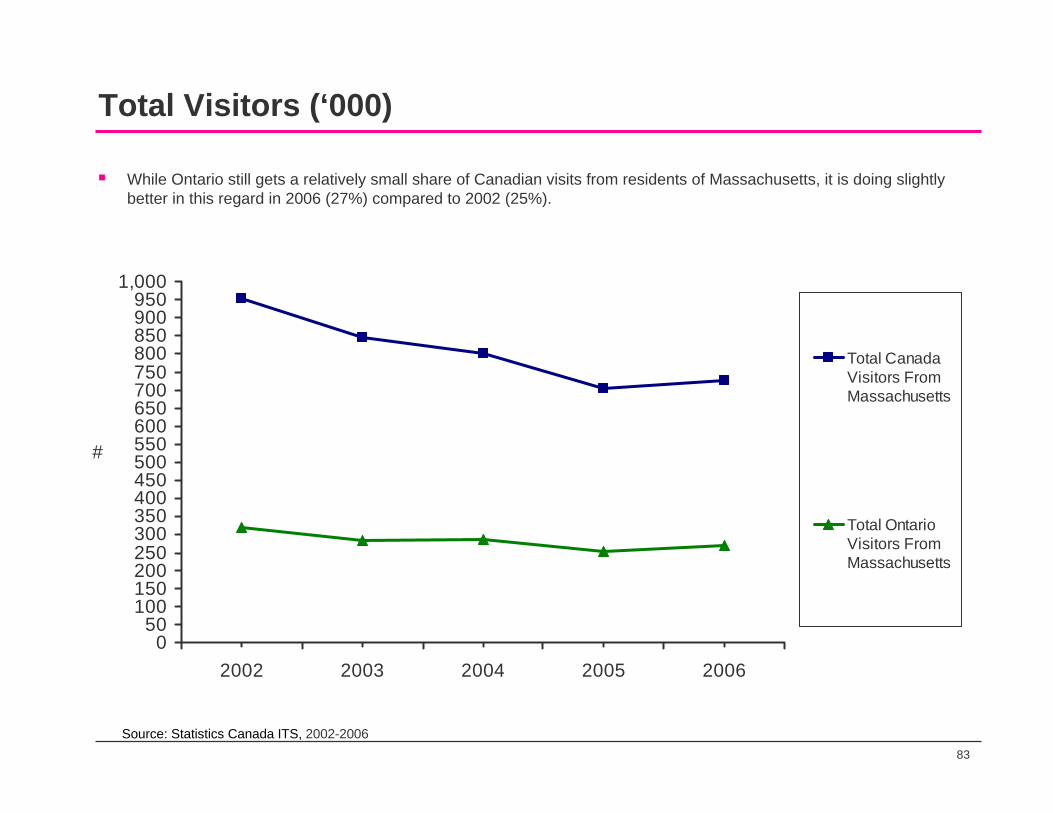
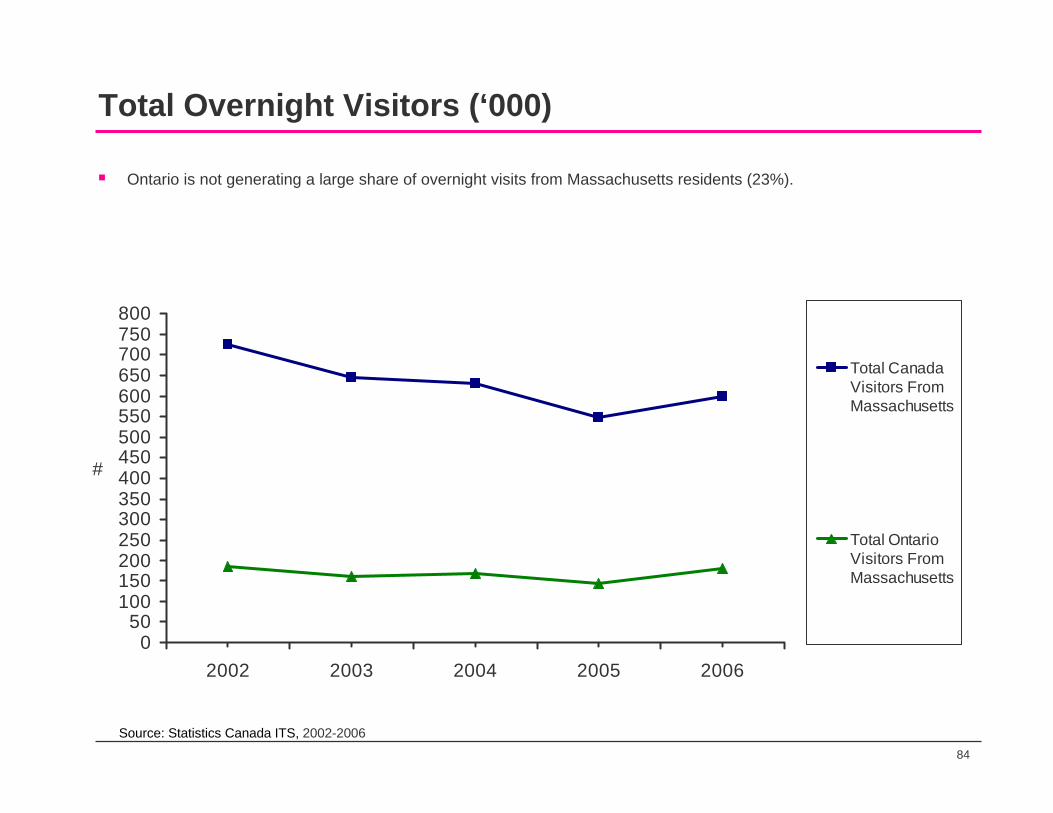
While Ontario still gets a relatively small share of Canadian visits from residents of Massachusetts, it is doing slightly better in this regard in 2006 (27%) compared to 2002 (25%).
050
100150200250300350400450500550600650700750800850900950
1,000
2002 2003 2004 2005 2006
#
Total CanadaVisitors FromMassachusetts
Total OntarioVisitors FromMassachusetts
Source: Statistics Canada ITS, 2002-2006
84
Total Overnight Visitors (‘000)
Ontario is not generating a large share of overnight visits from Massachusetts residents (23%).
050
100150200250300350400450500550600650700750800
2002 2003 2004 2005 2006
#
Total CanadaVisitors FromMassachusetts
Total OntarioVisitors FromMassachusetts
Source: Statistics Canada ITS, 2002-2006

85
Total Same Day Visitors (‘000)
However, Ontario is getting a large share of same-day visitors from Massachusetts to Canada.
0
25
50
75
100
125
150
175
200
225
250
2002 2003 2004 2005 2006
#
Total Canada Visitors FromMassachusetts
Total OntarioVisitors FromMassachusetts
Source: Statistics Canada ITS, 2002-2006
86
Ontario Market Share Of Canadian Trips (‘000)
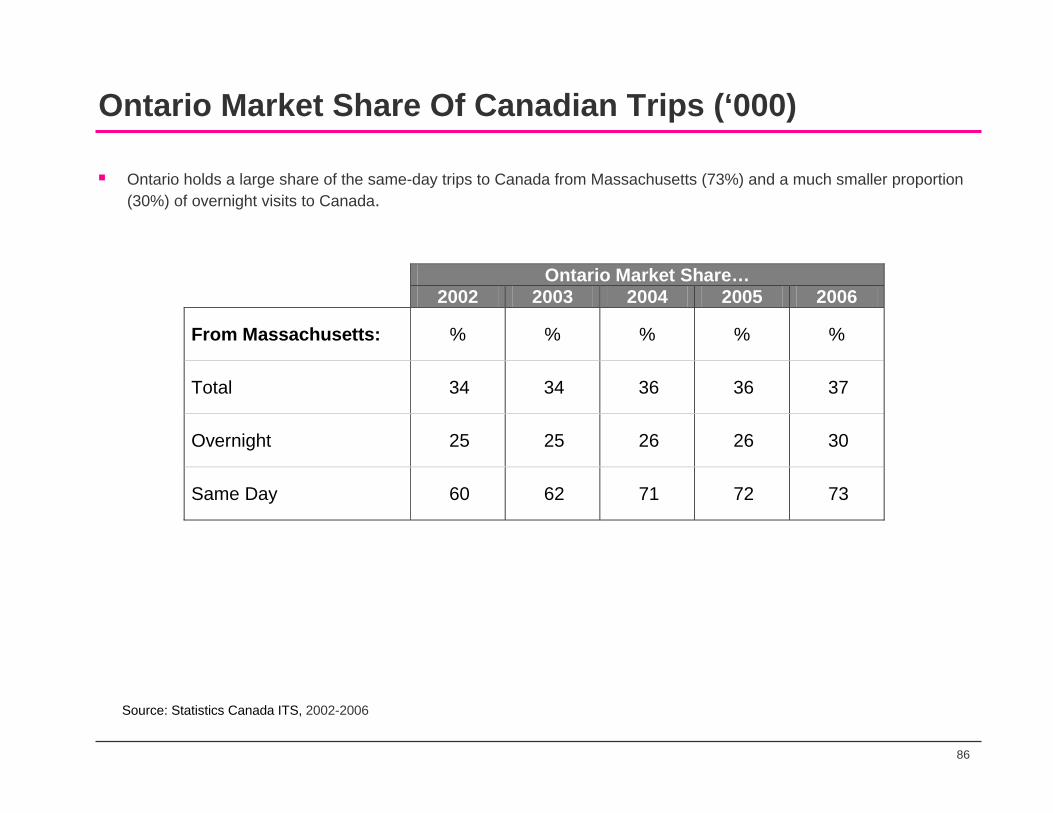
Ontario holds a large share of the same-day trips to Canada from Massachusetts (73%) and a much smaller proportion (30%) of overnight visits to Canada.
Ontario Market Share… 2002 2003 2004 2005 2006
From Massachusetts: % % % % %
Total 34 34 36 36 37
Overnight 25 25 26 26 30
Same Day 60 62 71 72 73
Source: Statistics Canada ITS, 2002-2006
87
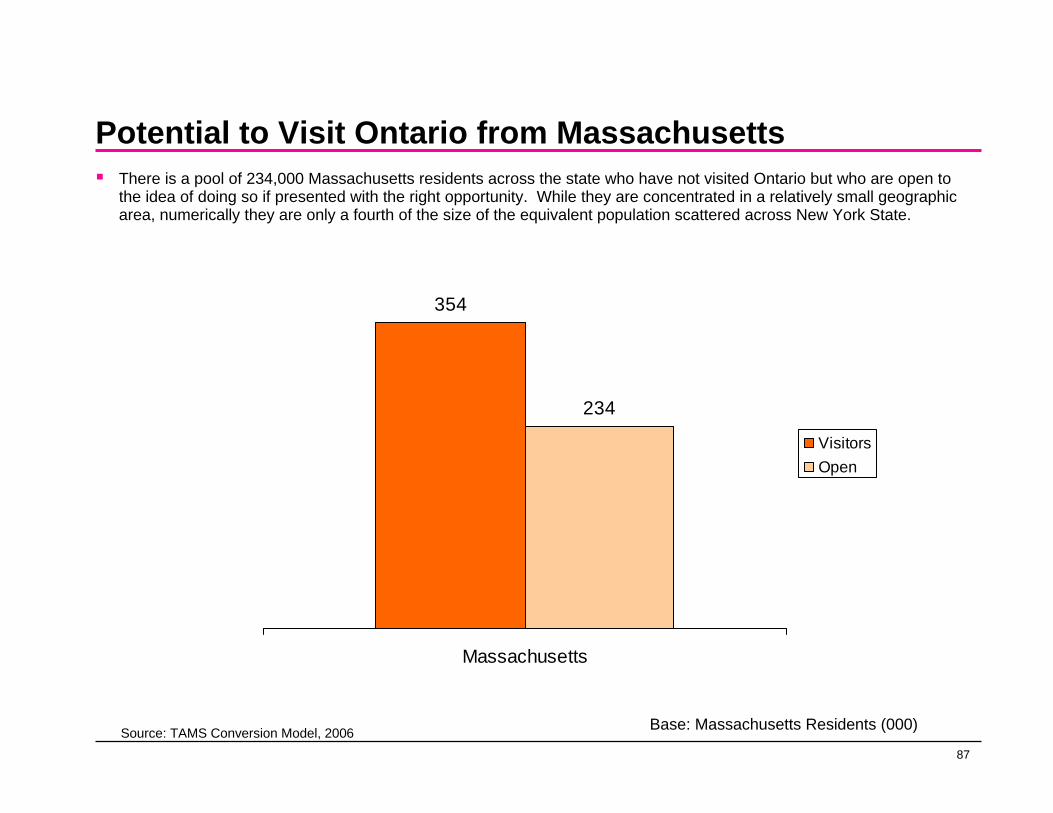
Potential to Visit Ontario from MassachusettsThere is a pool of 234,000 Massachusetts residents across the state who have not visited Ontario but who are open to the idea of doing so if presented with the right opportunity. While they are concentrated in a relatively small geographic area, numerically they are only a fourth of the size of the equivalent population scattered across New York State.
354
234
Massachusetts
VisitorsOpen
Source: TAMS Conversion Model, 2006 Base: Massachusetts Residents (000)
88
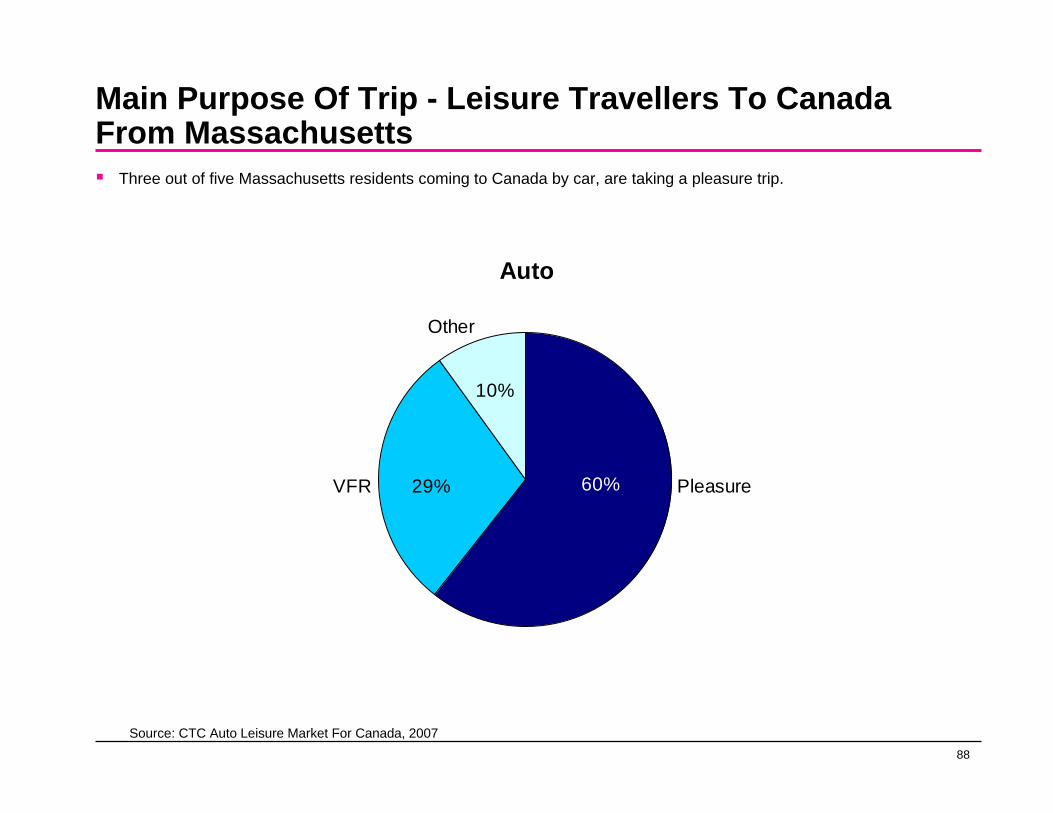
Main Purpose Of Trip - Leisure Travellers To Canada From Massachusetts
Three out of five Massachusetts residents coming to Canada by car, are taking a pleasure trip.
Auto
60%29%
10%
PleasureVFR
Other
Source: CTC Auto Leisure Market For Canada, 2007
89
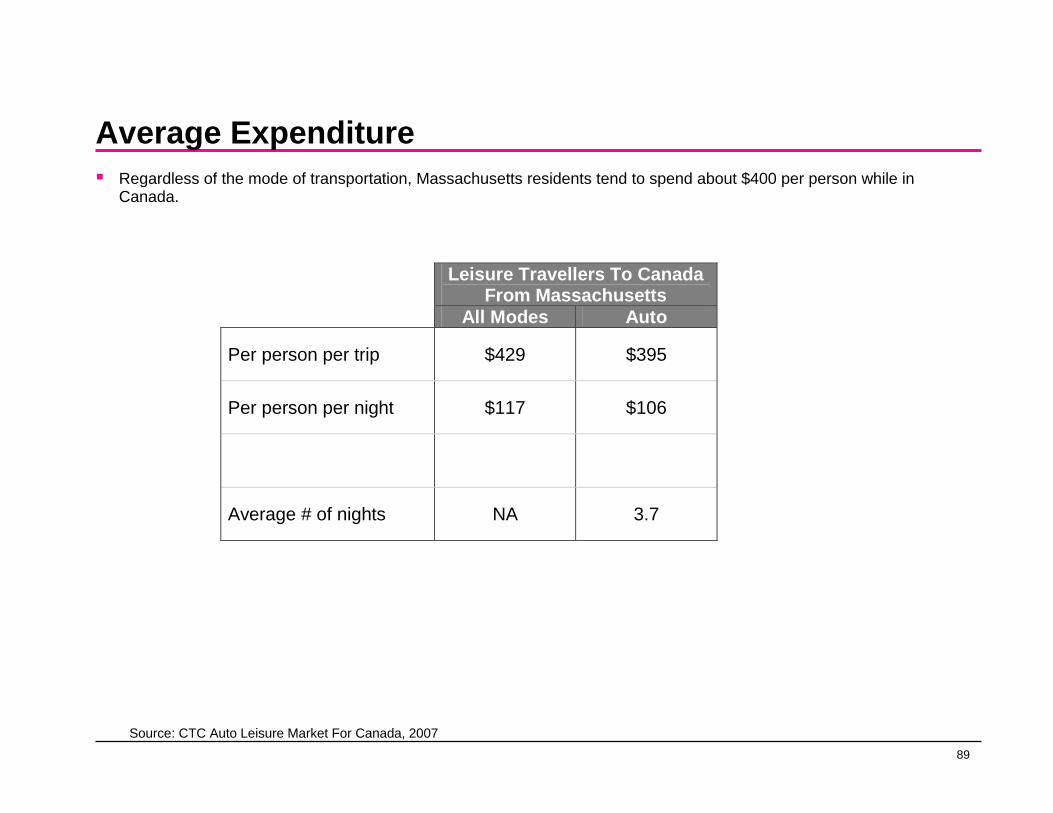
Average ExpenditureRegardless of the mode of transportation, Massachusetts residents tend to spend about $400 per person while in Canada.
Leisure Travellers To Canada From Massachusetts
All Modes Auto
Per person per trip $429 $395
Per person per night $117 $106
Average # of nights NA 3.7
Source: CTC Auto Leisure Market For Canada, 2007

90
Activities On TripIn contrast to New York State residents whose activities differed somewhat by mode of transportation, those travelling to Canada from Massachusetts by car are not substantially different from those using other modes of transportation.
Leisure Travellers To Canada From Massachusetts In 2006
All Modes Auto % % Go shopping 62 65 Go sightseeing 57 59 Visit a historic site 36 36 Visit friends or relatives 34 43 Visit a museum or art gallery 28 26 Go to a bar or nightclub 26 30 Visit a national or provincial nature park 25 24 Attend a cultural performance 22 13 Participate in sports or outdoor activities 21 25 Visit a zoo, aquarium or botanical garden 13 11 Go to a casino 12 7 Attend a festival or fair 11 12 Attend a sports event 7 9
Source: CTC Auto Leisure Market For Canada, 2007
91
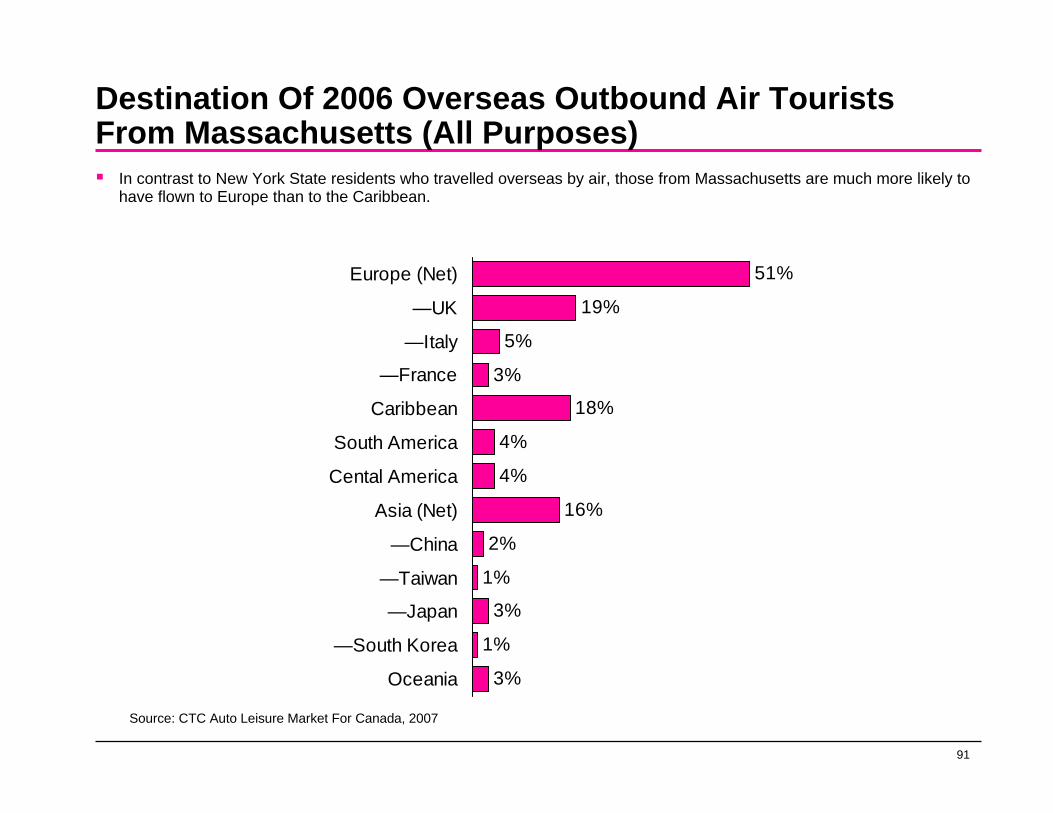
Destination Of 2006 Overseas Outbound Air Tourists From Massachusetts (All Purposes)
In contrast to New York State residents who travelled overseas by air, those from Massachusetts are much more likely to have flown to Europe than to the Caribbean.
51%
19%
5%
3%
18%
4%
4%
16%
2%
1%
3%
1%
3%
Europe (Net)
—UK
—Italy
—France
Caribbean
South America
Cental America
Asia (Net)
—China
—Taiwan
—Japan
—South Korea
Oceania
Source: CTC Auto Leisure Market For Canada, 2007
92
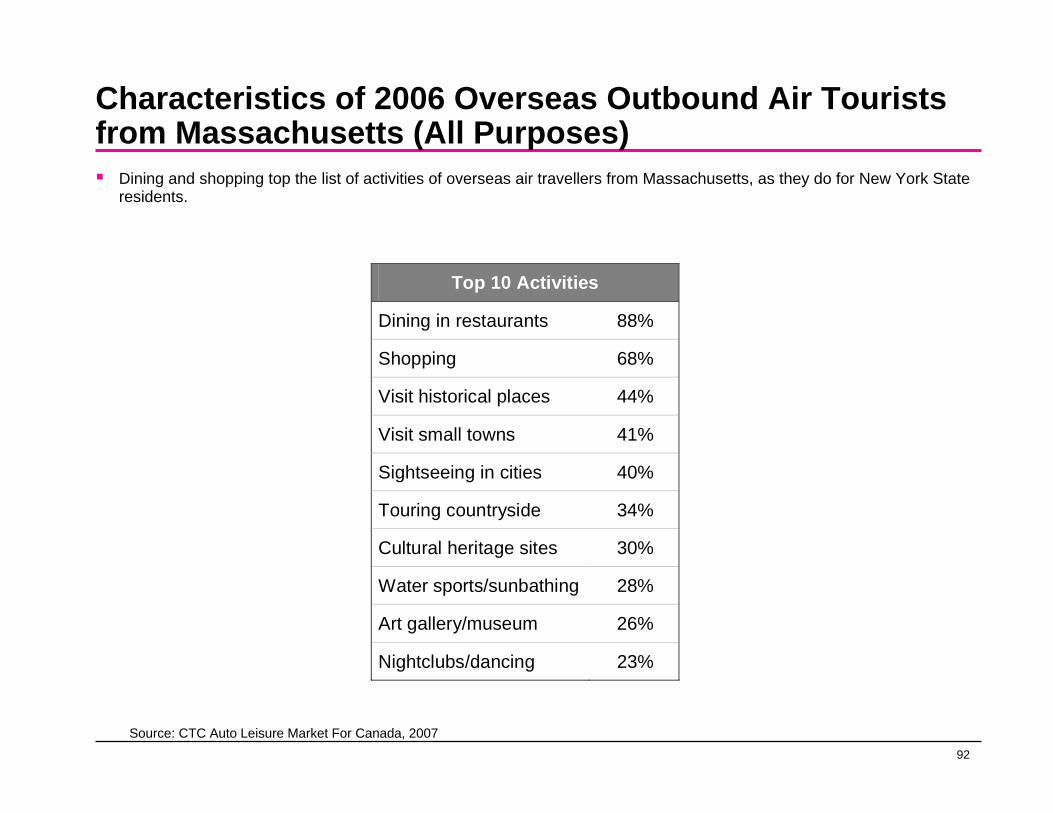
Characteristics of 2006 Overseas Outbound Air Tourists from Massachusetts (All Purposes)
Dining and shopping top the list of activities of overseas air travellers from Massachusetts, as they do for New York State residents.
Top 10 Activities
Dining in restaurants 88%
Shopping 68%
Visit historical places 44%
Visit small towns 41%
Sightseeing in cities 40%
Touring countryside 34%
Cultural heritage sites 30%
Water sports/sunbathing 28%
Art gallery/museum 26%
Nightclubs/dancing 23% 11
Source: CTC Auto Leisure Market For Canada, 2007

93
Illinois

94
Total Visitors (‘000)
While visits to Canada from Illinois fell from 2002 through 2006, Ontario continued to get a reasonable share of Canadian visits from residents of Illinois. In 2006 Ontario’s share stood at 41%.
100150200250300350400450500550600650700750800
2002 2003 2004 2005 2006
#
Total CanadaVisitors FromIllinois
Total OntarioVisitors FromIllinois
Source: Statistics Canada ITS, 2002-2006
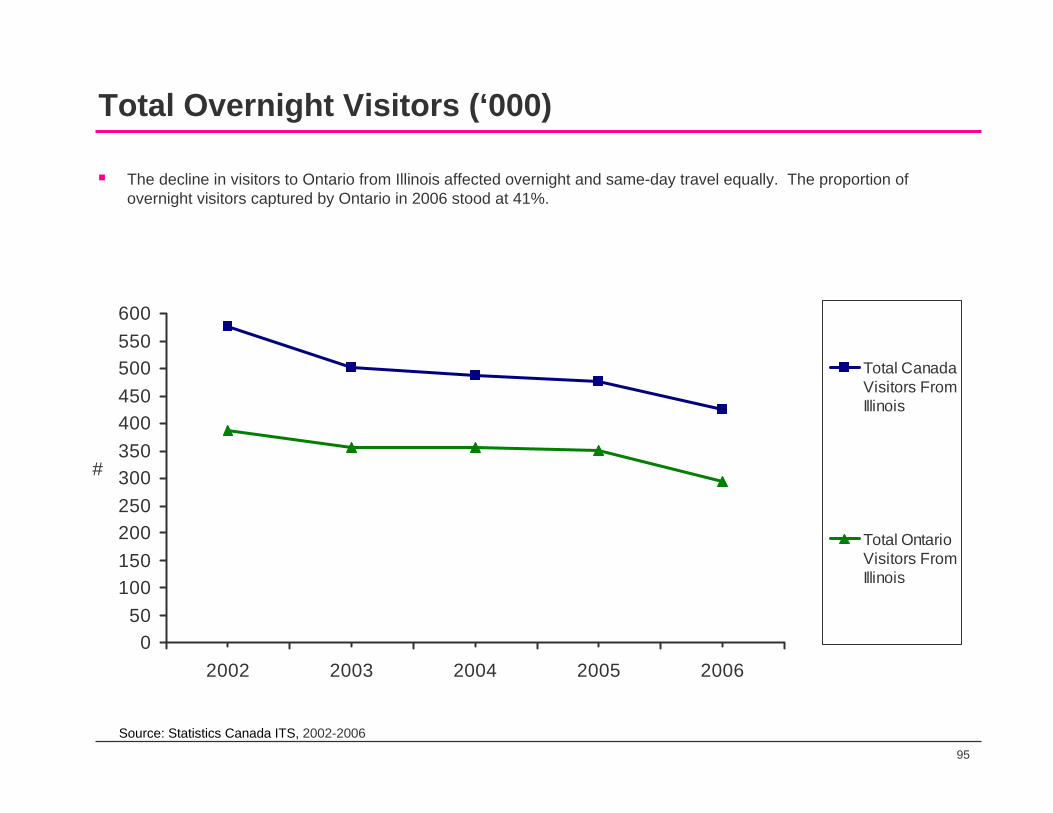
95
Total Overnight Visitors (‘000)
The decline in visitors to Ontario from Illinois affected overnight and same-day travel equally. The proportion of overnight visitors captured by Ontario in 2006 stood at 41%.
050
100150200250300350400450500550600
2002 2003 2004 2005 2006
#
Total CanadaVisitors FromIllinois
Total OntarioVisitors FromIllinois
Source: Statistics Canada ITS, 2002-2006

96
Total Same Day Visitors (‘000)
The decline in visitors to Ontario from Illinois affected overnight and same-day travel equally. The proportion of same-day visitors captured by Ontario in 2006 stood at 42%.
0
25
50
75
100
125
150
175
200
2002 2003 2004 2005 2006
#
Total Canada Visitors FromIlinois
Total OntarioVisitors FromIllinois
Source: Statistics Canada ITS, 2002-2006
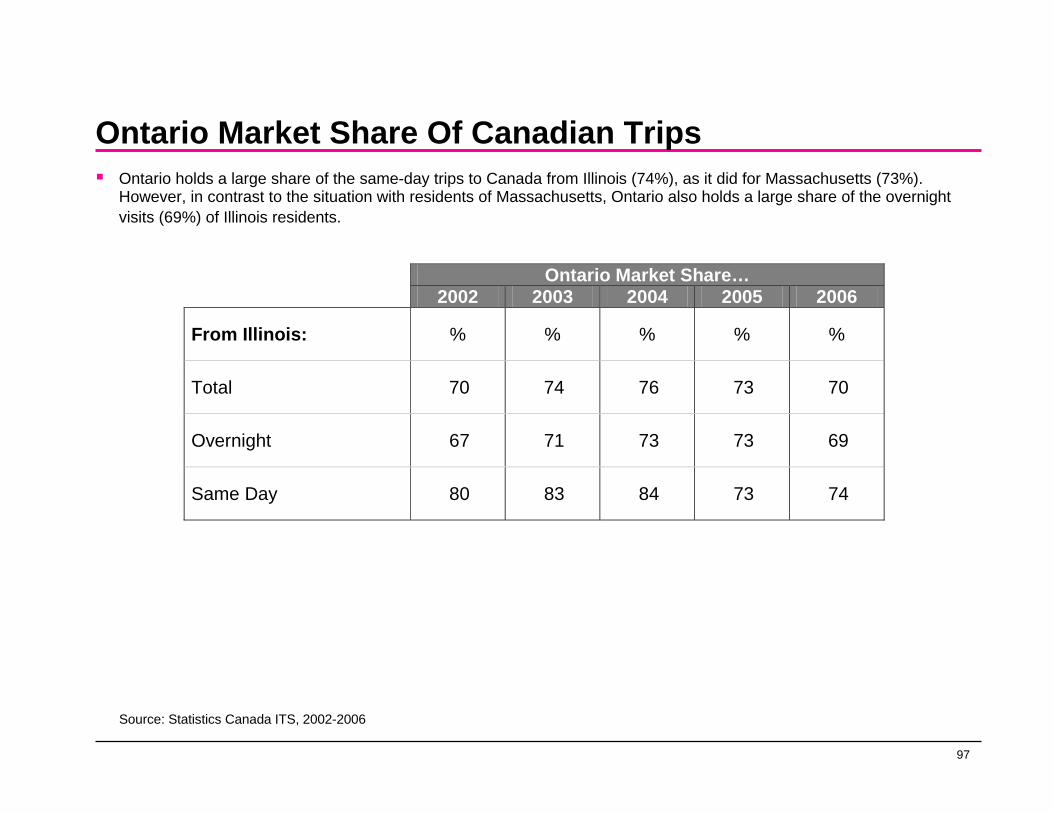
97
Ontario Market Share Of Canadian TripsOntario holds a large share of the same-day trips to Canada from Illinois (74%), as it did for Massachusetts (73%). However, in contrast to the situation with residents of Massachusetts, Ontario also holds a large share of the overnight visits (69%) of Illinois residents.
Ontario Market Share… 2002 2003 2004 2005 2006
From Illinois: % % % % %
Total 70 74 76 73 70
Overnight 67 71 73 73 69
Same Day 80 83 84 73 74
Source: Statistics Canada ITS, 2002-2006
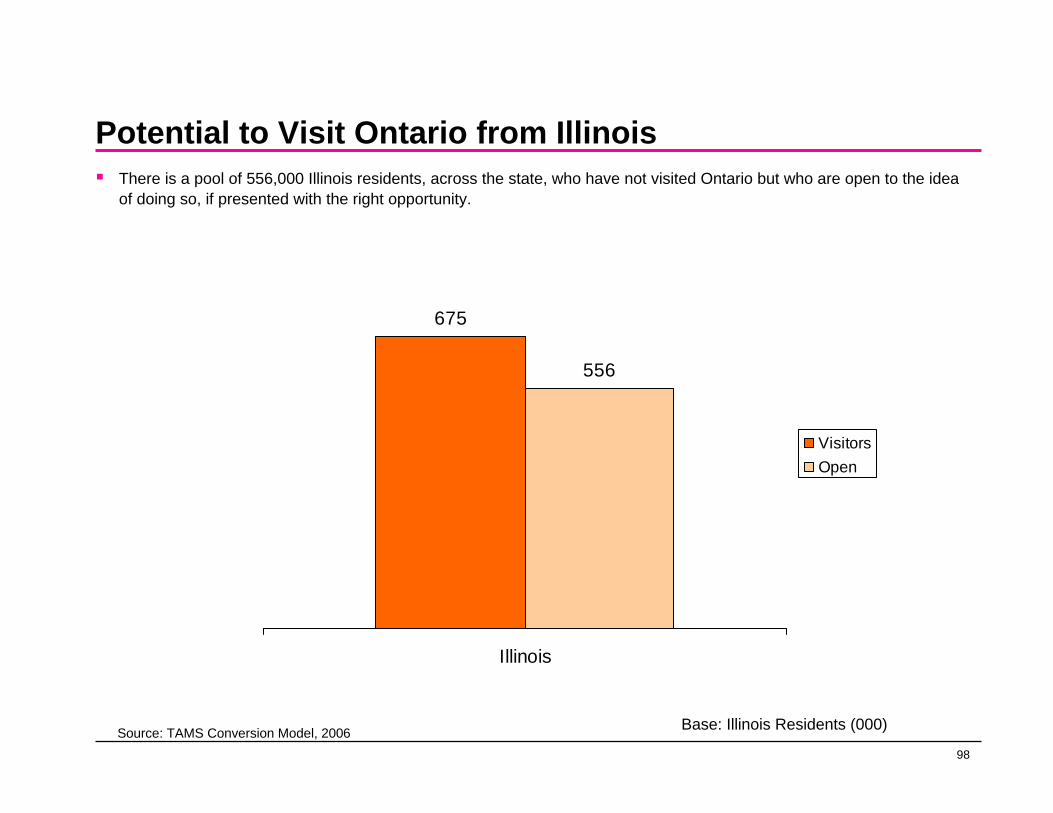
98
Potential to Visit Ontario from IllinoisThere is a pool of 556,000 Illinois residents, across the state, who have not visited Ontario but who are open to the idea of doing so, if presented with the right opportunity.
675
556
Illinois
VisitorsOpen
Source: TAMS Conversion Model, 2006 Base: Illinois Residents (000)
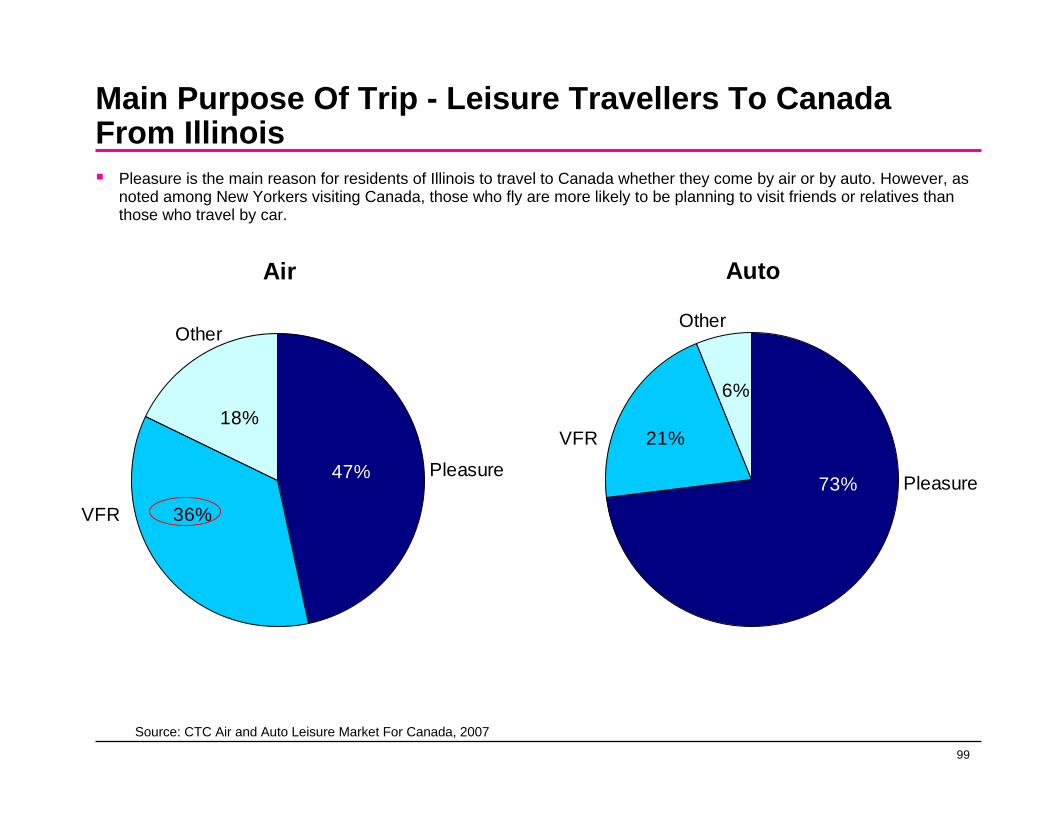
99
Main Purpose Of Trip - Leisure Travellers To Canada From Illinois
Pleasure is the main reason for residents of Illinois to travel to Canada whether they come by air or by auto. However, as noted among New Yorkers visiting Canada, those who fly are more likely to be planning to visit friends or relatives than those who travel by car.
Air
18%
36%
47% Pleasure
VFR
Other
Auto
73%
21%
6%
Pleasure
VFR
Other
Source: CTC Air and Auto Leisure Market For Canada, 2007
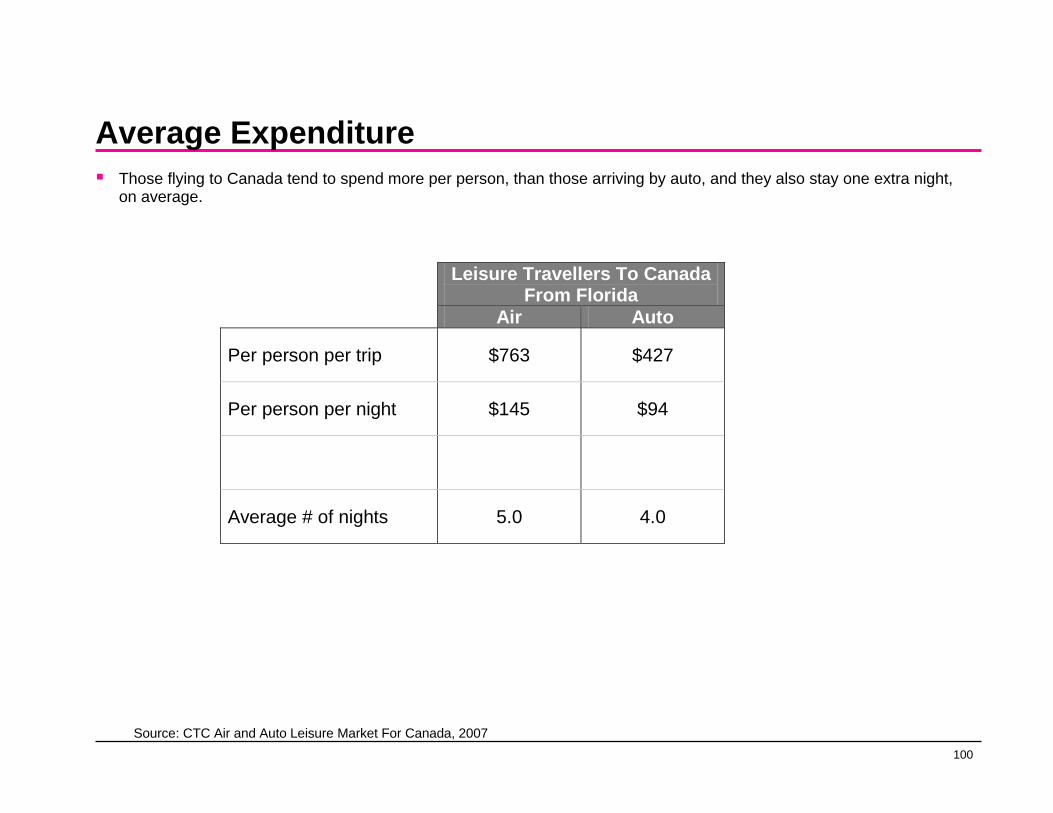
100
Average ExpenditureThose flying to Canada tend to spend more per person, than those arriving by auto, and they also stay one extra night, on average.
Leisure Travellers To Canada From Florida
Air Auto
Per person per trip $763 $427
Per person per night $145 $94
Average # of nights 5.0 4.0
Source: CTC Air and Auto Leisure Market For Canada, 2007
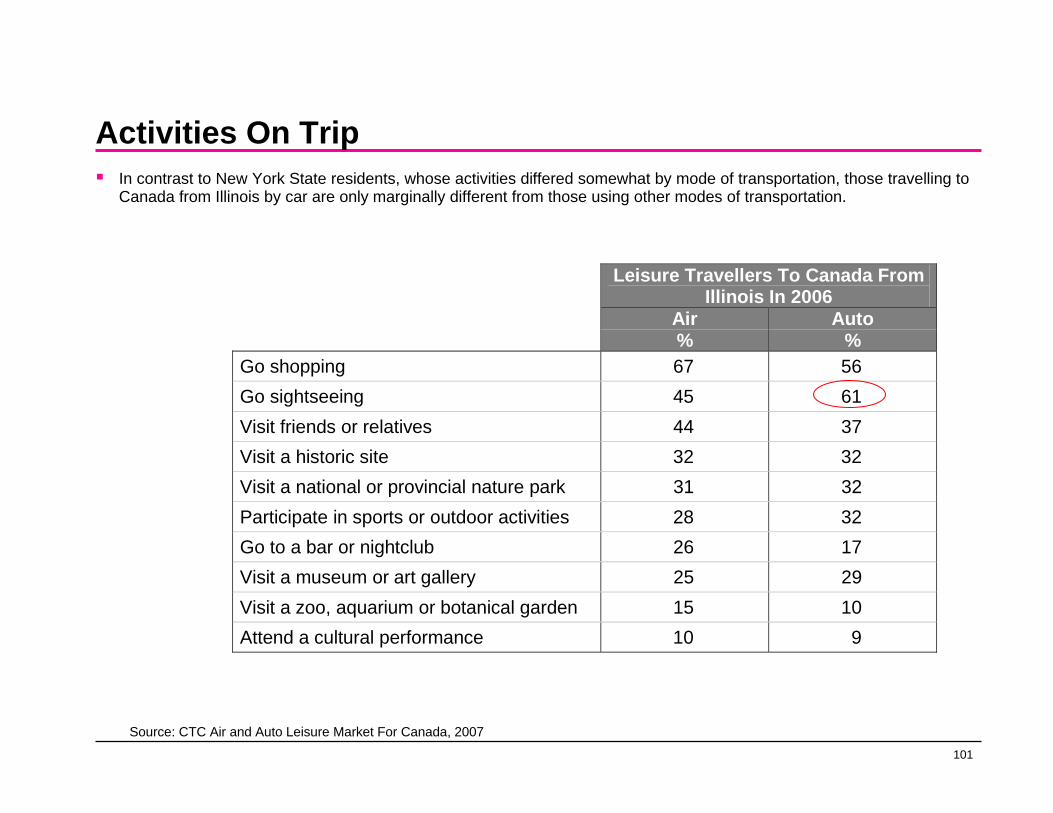
101
Activities On TripIn contrast to New York State residents, whose activities differed somewhat by mode of transportation, those travelling to Canada from Illinois by car are only marginally different from those using other modes of transportation.
Leisure Travellers To Canada From Illinois In 2006
Air Auto % % Go shopping 67 56 Go sightseeing 45 61 Visit friends or relatives 44 37 Visit a historic site 32 32 Visit a national or provincial nature park 31 32 Participate in sports or outdoor activities 28 32 Go to a bar or nightclub 26 17 Visit a museum or art gallery 25 29 Visit a zoo, aquarium or botanical garden 15 10 Attend a cultural performance 10 9
Source: CTC Air and Auto Leisure Market For Canada, 2007
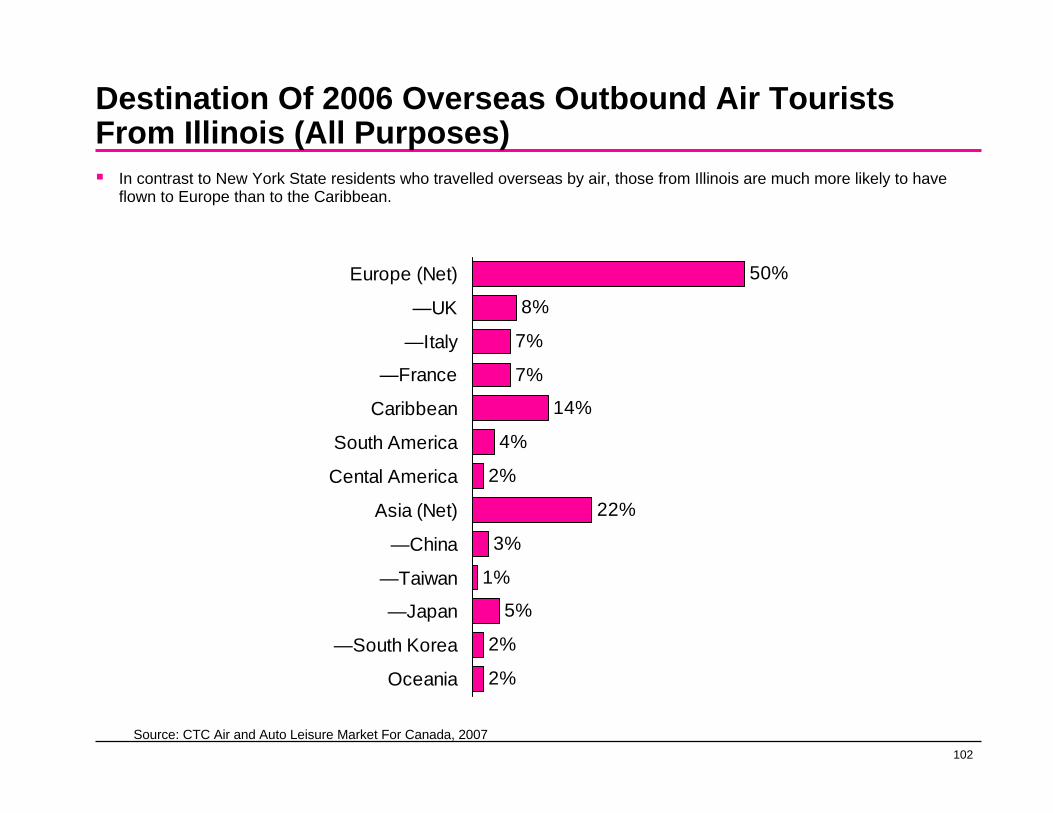
102
Destination Of 2006 Overseas Outbound Air Tourists From Illinois (All Purposes)
In contrast to New York State residents who travelled overseas by air, those from Illinois are much more likely to have flown to Europe than to the Caribbean.
50%
8%
7%
7%
14%
4%
2%
22%
3%
1%
5%
2%
2%
Europe (Net)
—UK
—Italy
—France
Caribbean
South America
Cental America
Asia (Net)
—China
—Taiwan
—Japan
—South Korea
Oceania
Source: CTC Air and Auto Leisure Market For Canada, 2007
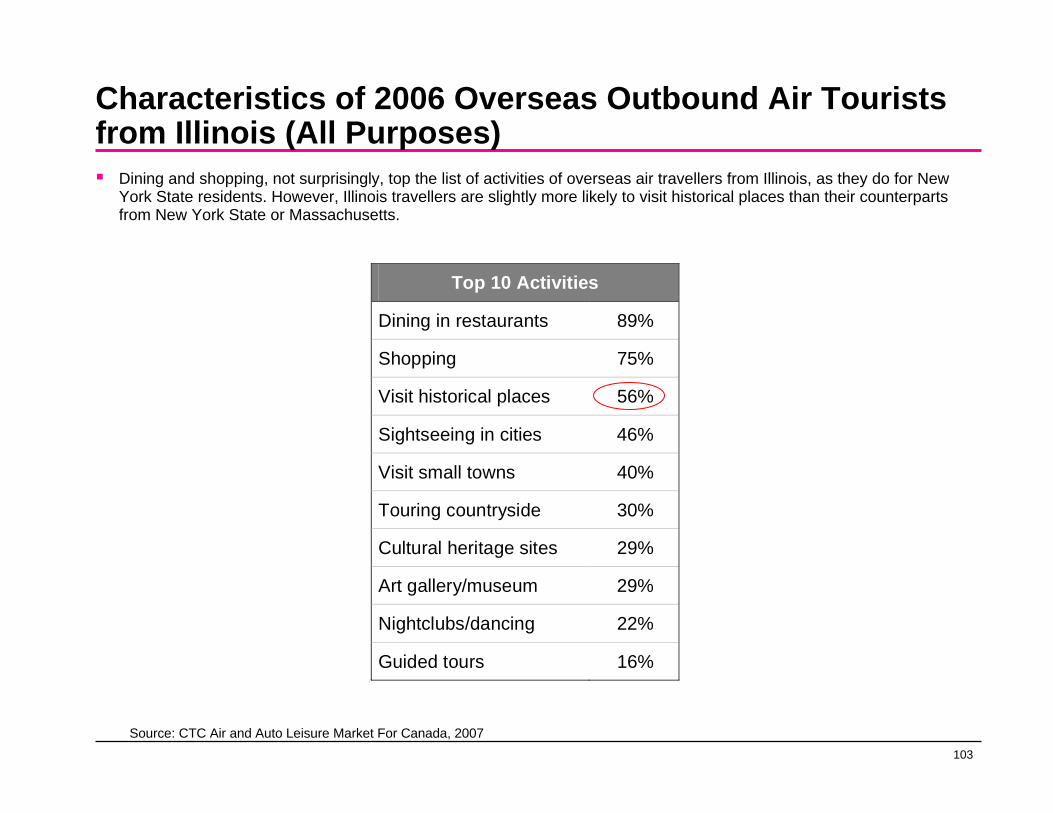
103
Characteristics of 2006 Overseas Outbound Air Tourists from Illinois (All Purposes)
Dining and shopping, not surprisingly, top the list of activities of overseas air travellers from Illinois, as they do for New York State residents. However, Illinois travellers are slightly more likely to visit historical places than their counterparts from New York State or Massachusetts.
Top 10 Activities
Dining in restaurants 89%
Shopping 75%
Visit historical places 56%
Sightseeing in cities 46%
Visit small towns 40%
Touring countryside 30%
Cultural heritage sites 29%
Art gallery/museum 29%
Nightclubs/dancing 22%
Guided tours 16% 11
Source: CTC Air and Auto Leisure Market For Canada, 2007

104
New Jersey/Connecticut

105
Total Visitors (‘000)
While visits to Canada from New Jersey and Connecticut fell from 2002 through 2006, Ontario continued to get a reasonable share of Canadian visits from residents of both states. In 2006, Ontario’s share of New Jersey visitors stood at 51% and of Connecticut visitors at 44%.
0
100
200
300
400
500
600
2002 2003 2004 2005 2006
#
Total CanadaVisitors FromNew Jersey
Total CanadaVisitors FromConnecticut
Total OntarioVisitors FromNew Jersey
Total OntarioVisitors FromConnecticut
Source: Statistics Canada ITS, 2002-2006
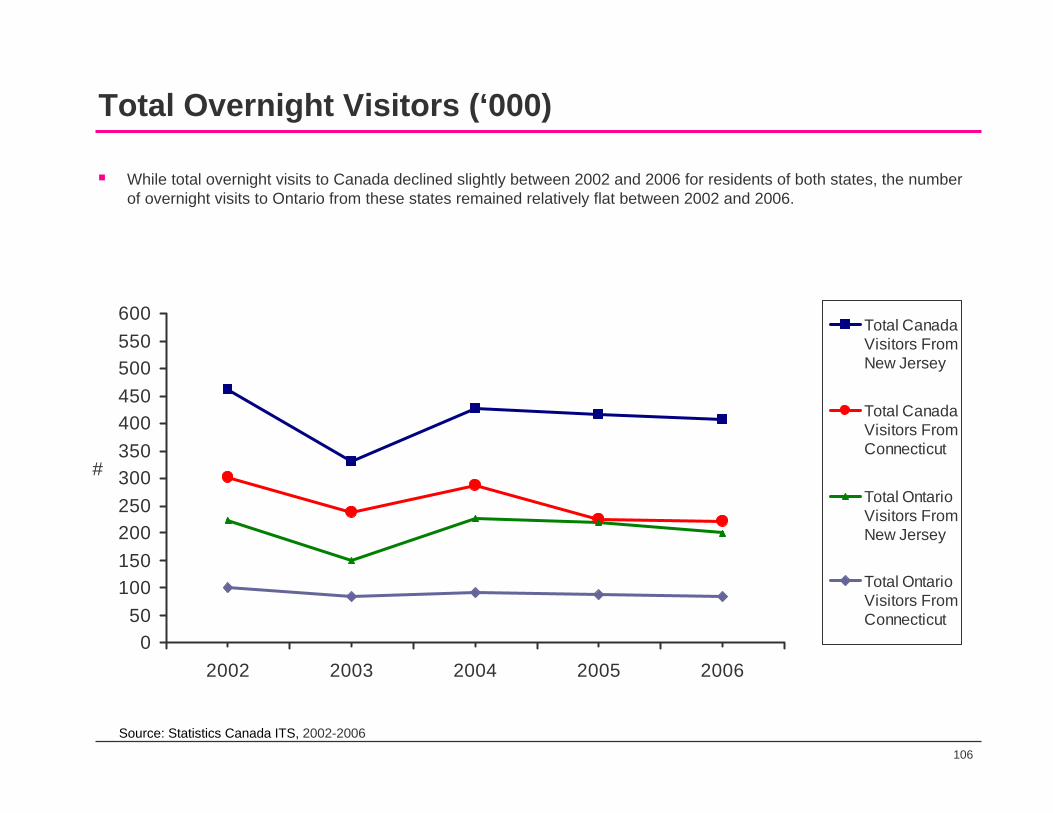
106
Total Overnight Visitors (‘000)
While total overnight visits to Canada declined slightly between 2002 and 2006 for residents of both states, the number of overnight visits to Ontario from these states remained relatively flat between 2002 and 2006.
050
100150200250300350400450500550600
2002 2003 2004 2005 2006
#
Total CanadaVisitors FromNew Jersey
Total CanadaVisitors FromConnecticut
Total OntarioVisitors FromNew Jersey
Total OntarioVisitors FromConnecticut
Source: Statistics Canada ITS, 2002-2006
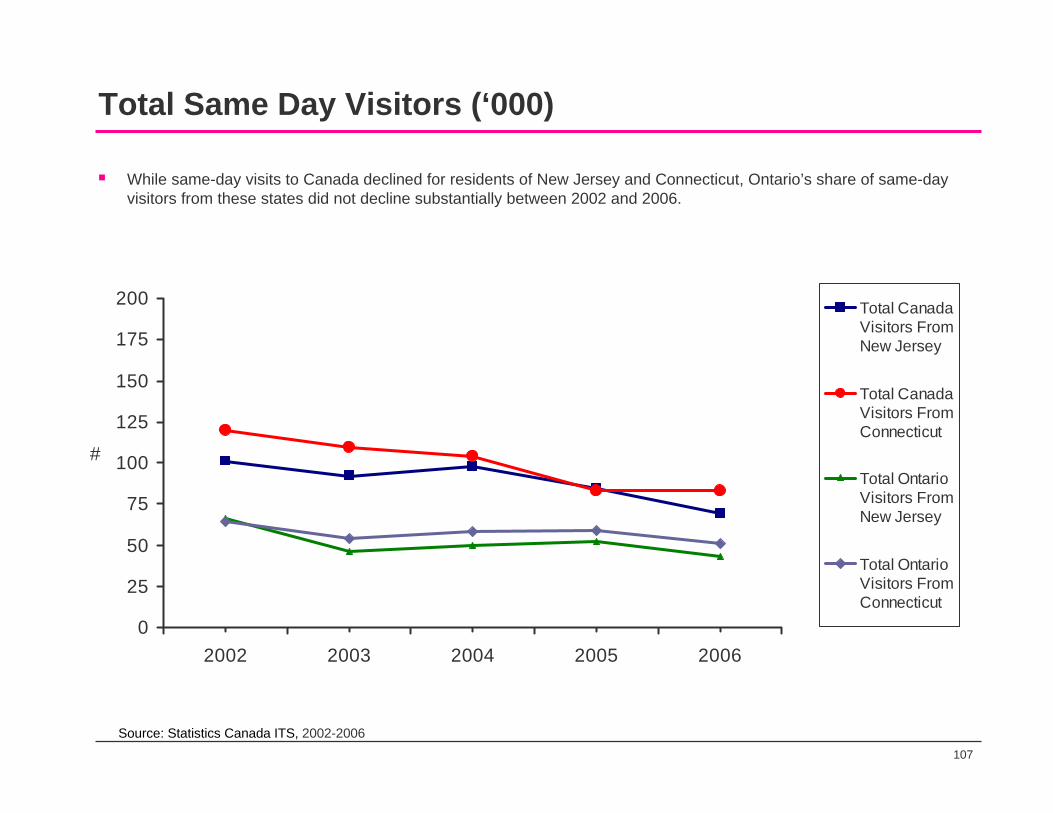
107
Total Same Day Visitors (‘000)
While same-day visits to Canada declined for residents of New Jersey and Connecticut, Ontario’s share of same-day visitors from these states did not decline substantially between 2002 and 2006.
0
25
50
75
100
125
150
175
200
2002 2003 2004 2005 2006
#
Total Canada Visitors FromNew Jersey
Total CanadaVisitors FromConnecticut
Total OntarioVisitors FromNew Jersey
Total OntarioVisitors FromConnecticut
Source: Statistics Canada ITS, 2002-2006

108
Ontario Market Share of Canadian TripsOntario holds a large share of the same-day trips to Canada from New Jersey (62%), as it does for Illinois (74%) and Massachusetts (73%). However, Ontario only gets half (49%) of overnight visits from New Jersey travellers. Ontario captures a large share of the same-day trips from Connecticut (61%), but only gets 38 per cent of overnight visits from Connecticut travellers.
Ontario Market Share 2002 2003 2004 2005 2006 From New Jersey: % % % % %
Total 52 46 53 54 51
Overnight 49 45 53 53 49
Same Day 65 50 50 62 62
From Connecticut: % % % % %
Total 39 40 38 47 44
Overnight 33 35 32 39 38
Same Day 53 49 56 71 61
Source: Statistics Canada ITS, 2002-2006
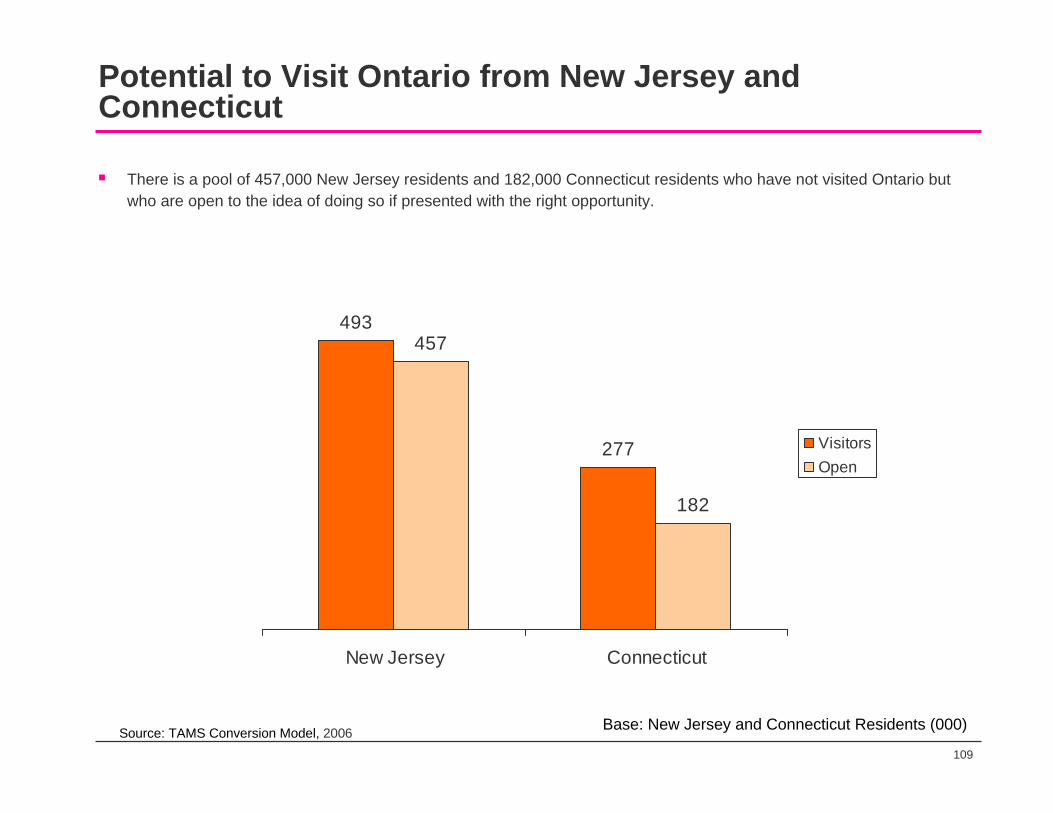
109
Potential to Visit Ontario from New Jersey and Connecticut
There is a pool of 457,000 New Jersey residents and 182,000 Connecticut residents who have not visited Ontario but who are open to the idea of doing so if presented with the right opportunity.
493
277
457
182
New Jersey Connecticut
VisitorsOpen
Source: TAMS Conversion Model, 2006 Base: New Jersey and Connecticut Residents (000)
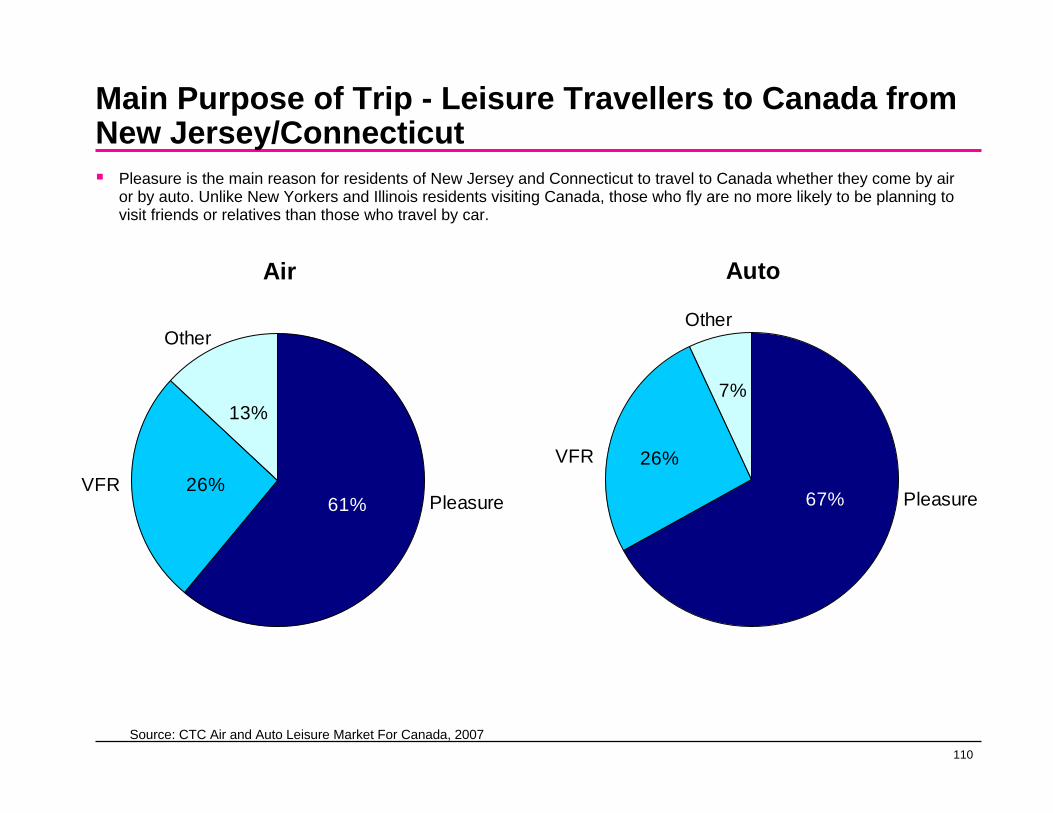
110
Main Purpose of Trip - Leisure Travellers to Canada from New Jersey/Connecticut
Pleasure is the main reason for residents of New Jersey and Connecticut to travel to Canada whether they come by air or by auto. Unlike New Yorkers and Illinois residents visiting Canada, those who fly are no more likely to be planning to visit friends or relatives than those who travel by car.
Air
13%
26%61% Pleasure
VFR
Other
Auto
67%
26%
7%
Pleasure
VFR
Other
Source: CTC Air and Auto Leisure Market For Canada, 2007

111
Average Expenditure
Those flying to Canada tend to spend more per person, than those arriving by auto. Both groups tend to stay four or five days on average.
Leisure Travellers To Canada From New Jersey/Connecticut
Air Auto
Per person per trip $776 $465
Per person per night $180 $101
Average # of nights 4.3 4.6
Source: CTC Air and Auto Leisure Market For Canada, 2007
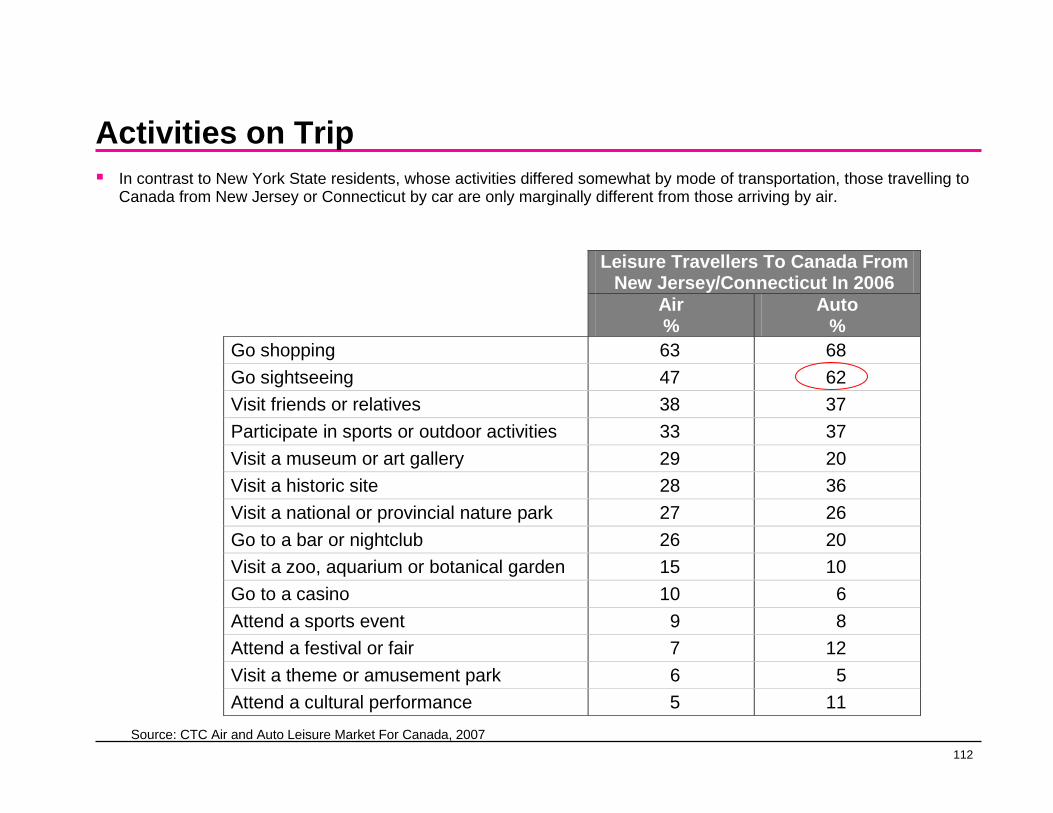
112
Activities on TripIn contrast to New York State residents, whose activities differed somewhat by mode of transportation, those travelling to Canada from New Jersey or Connecticut by car are only marginally different from those arriving by air.
Leisure Travellers To Canada From New Jersey/Connecticut In 2006
Air Auto % % Go shopping 63 68 Go sightseeing 47 62 Visit friends or relatives 38 37 Participate in sports or outdoor activities 33 37 Visit a museum or art gallery 29 20 Visit a historic site 28 36 Visit a national or provincial nature park 27 26 Go to a bar or nightclub 26 20 Visit a zoo, aquarium or botanical garden 15 10 Go to a casino 10 6 Attend a sports event 9 8 Attend a festival or fair 7 12 Visit a theme or amusement park 6 5 Attend a cultural performance 5 11 Source: CTC Air and Auto Leisure Market For Canada, 2007

113
Destination of 2006 Overseas Outbound Air Tourists from New Jersey (All Purposes)
In contrast to New York State residents who travelled overseas by air, those from New Jersey and Connecticut are as likely to have flown to Europe as to the Caribbean. Asia also figures more prominently as a destination among New Jersey and Connecticut residents compared to those living in New York State.
29%
9%
5%
2%
27%
11%
4%
20%
3%
1%
3%
2%
2%
Europe (Net)
—UK
—Italy
—France
Caribbean
South America
Central America
Asia (Net)
—China
—Taiwan
—Japan
—South Korea
Oceania
Source: CTC Air and Auto Leisure Market For Canada, 2007
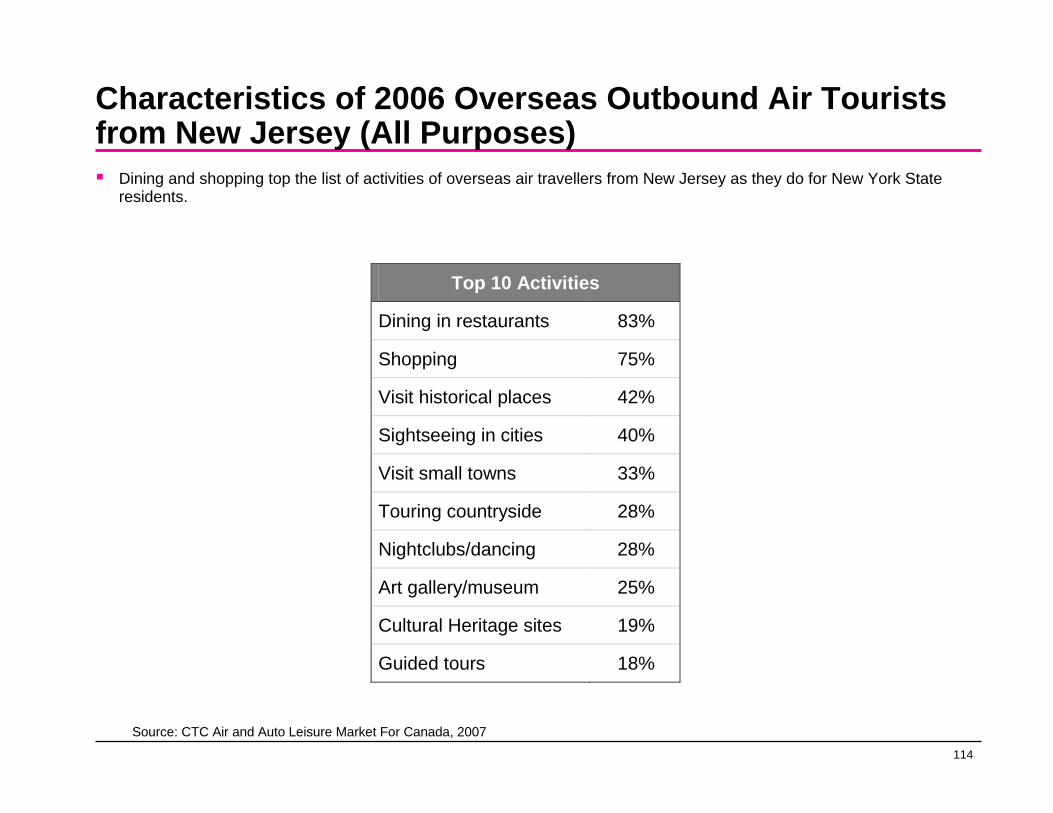
114
Characteristics of 2006 Overseas Outbound Air Tourists from New Jersey (All Purposes)
Dining and shopping top the list of activities of overseas air travellers from New Jersey as they do for New York State residents.
Top 10 Activities
Dining in restaurants 83%
Shopping 75%
Visit historical places 42%
Sightseeing in cities 40%
Visit small towns 33%
Touring countryside 28%
Nightclubs/dancing 28%
Art gallery/museum 25%
Cultural Heritage sites 19%
Guided tours 18% 11
Source: CTC Air and Auto Leisure Market For Canada, 2007

115
Florida
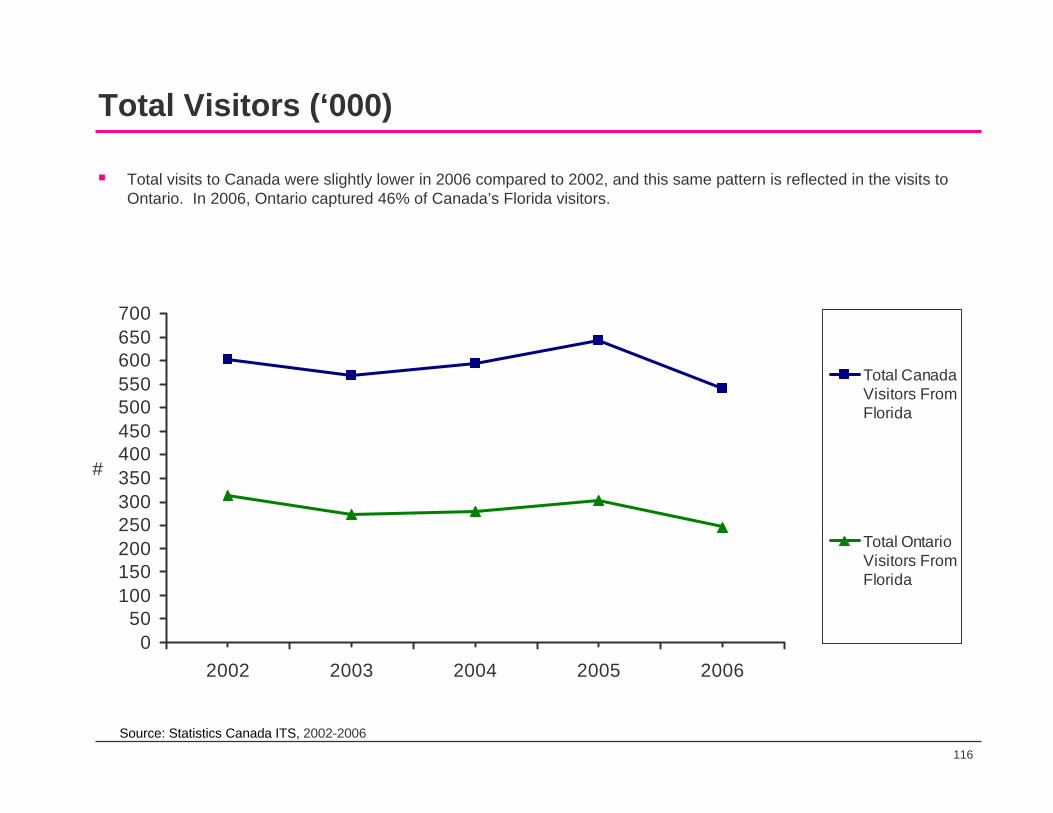
116
Total Visitors (‘000)
Total visits to Canada were slightly lower in 2006 compared to 2002, and this same pattern is reflected in the visits to Ontario. In 2006, Ontario captured 46% of Canada’s Florida visitors.
050
100150200250300350400450500550600650700
2002 2003 2004 2005 2006
#
Total CanadaVisitors FromFlorida
Total OntarioVisitors FromFlorida
Source: Statistics Canada ITS, 2002-2006
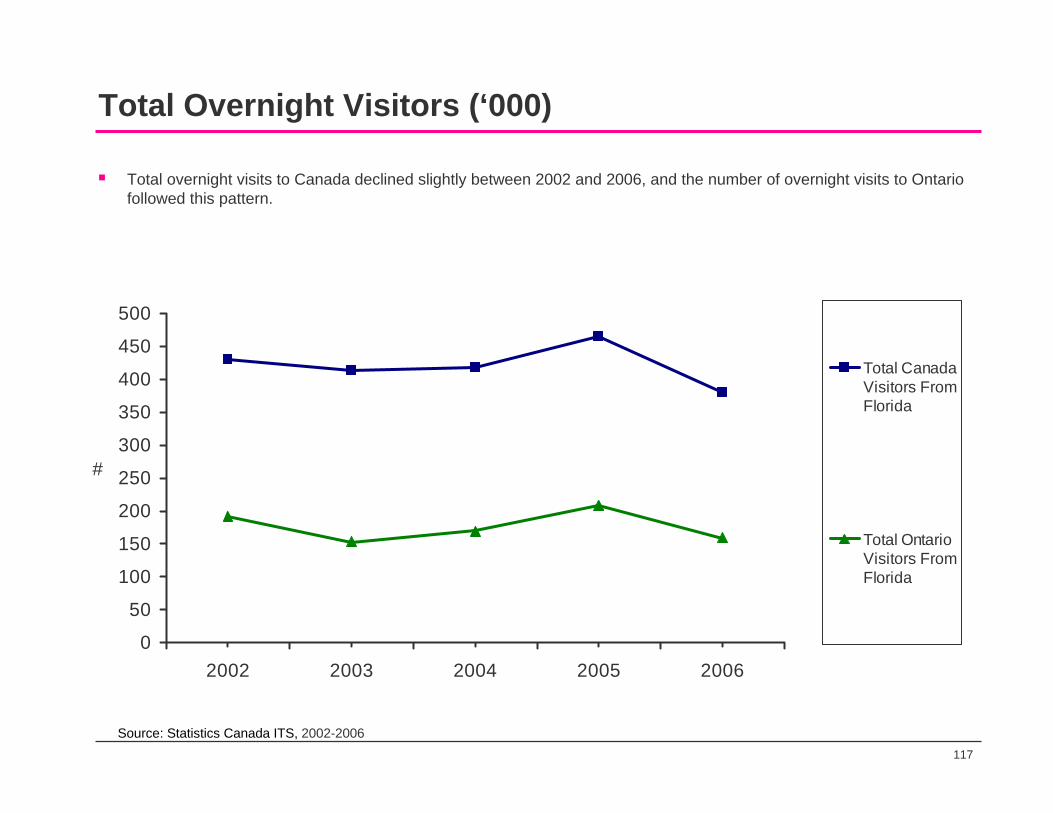
117
Total Overnight Visitors (‘000)
Total overnight visits to Canada declined slightly between 2002 and 2006, and the number of overnight visits to Ontario followed this pattern.
0
50
100
150
200
250
300
350
400
450
500
2002 2003 2004 2005 2006
#
Total CanadaVisitors FromFlorida
Total OntarioVisitors FromFlorida
Source: Statistics Canada ITS, 2002-2006
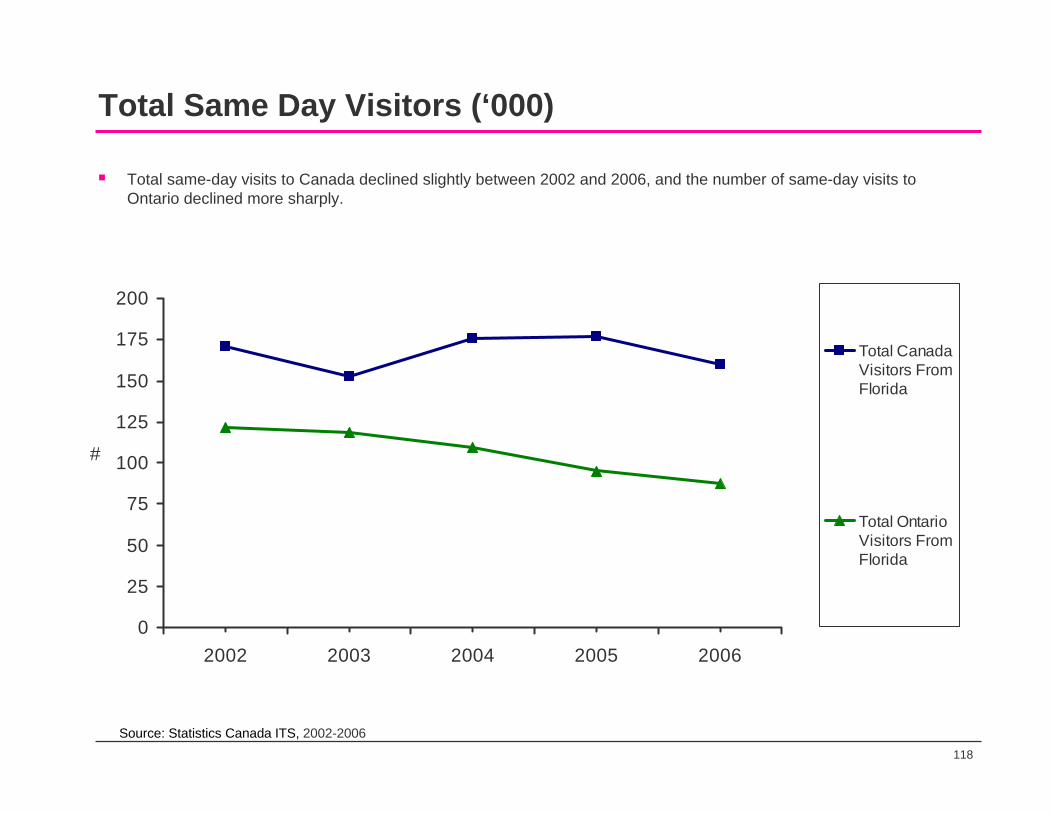
118
Total Same Day Visitors (‘000)
Total same-day visits to Canada declined slightly between 2002 and 2006, and the number of same-day visits to Ontario declined more sharply.
0
25
50
75
100
125
150
175
200
2002 2003 2004 2005 2006
#
Total Canada Visitors FromFlorida
Total OntarioVisitors FromFlorida
Source: Statistics Canada ITS, 2002-2006
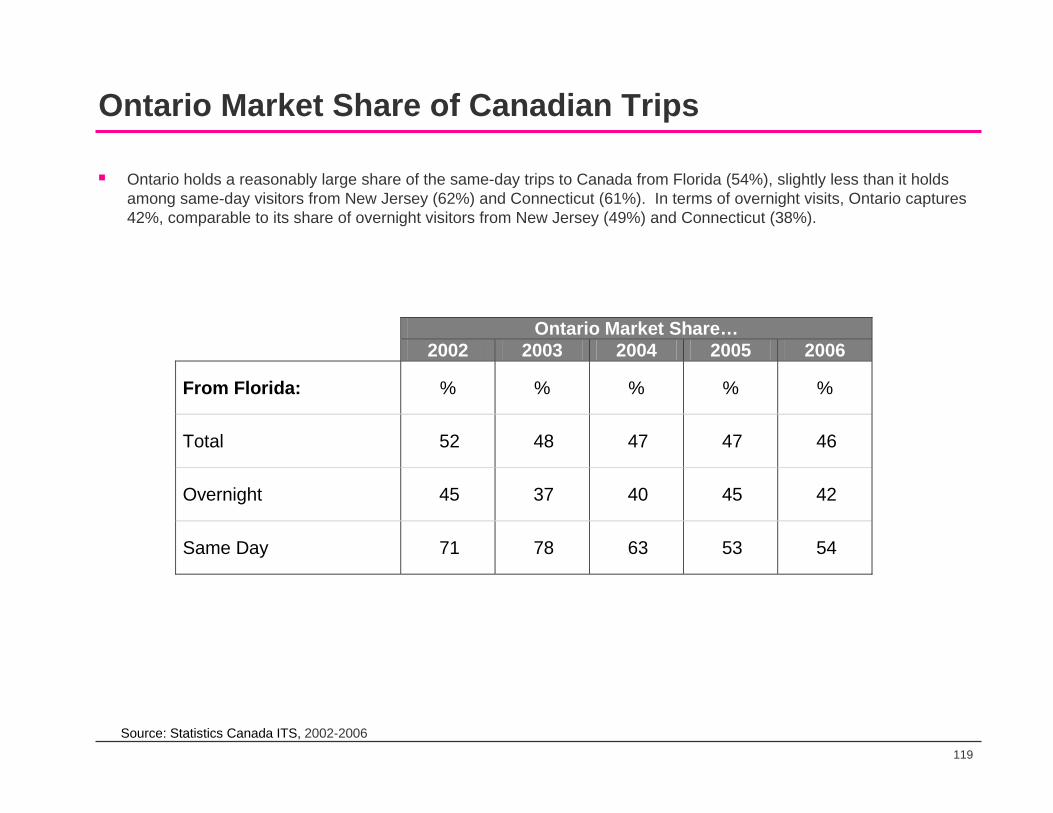
119
Ontario Market Share of Canadian Trips
Ontario holds a reasonably large share of the same-day trips to Canada from Florida (54%), slightly less than it holds among same-day visitors from New Jersey (62%) and Connecticut (61%). In terms of overnight visits, Ontario captures 42%, comparable to its share of overnight visitors from New Jersey (49%) and Connecticut (38%).
Ontario Market Share… 2002 2003 2004 2005 2006
From Florida: % % % % %
Total 52 48 47 47 46
Overnight 45 37 40 45 42
Same Day 71 78 63 53 54
Source: Statistics Canada ITS, 2002-2006
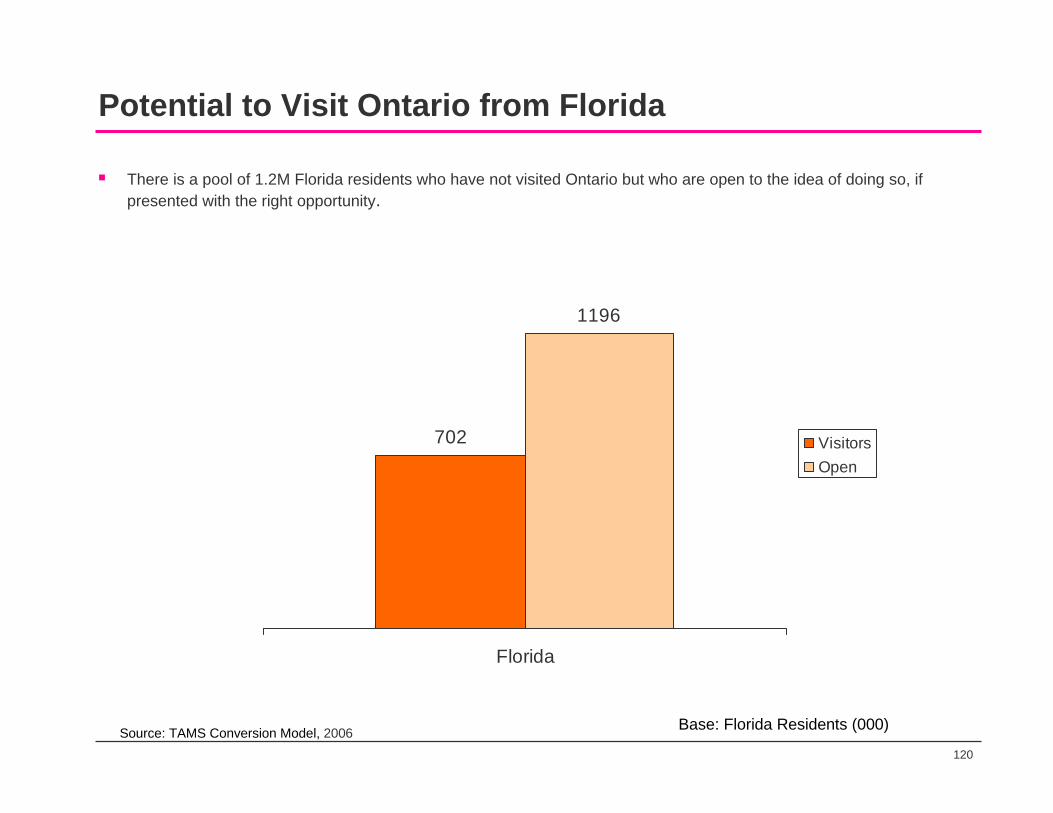
120
Potential to Visit Ontario from Florida
There is a pool of 1.2M Florida residents who have not visited Ontario but who are open to the idea of doing so, if presented with the right opportunity.
702
1196
Florida
VisitorsOpen
Source: TAMS Conversion Model, 2006 Base: Florida Residents (000)
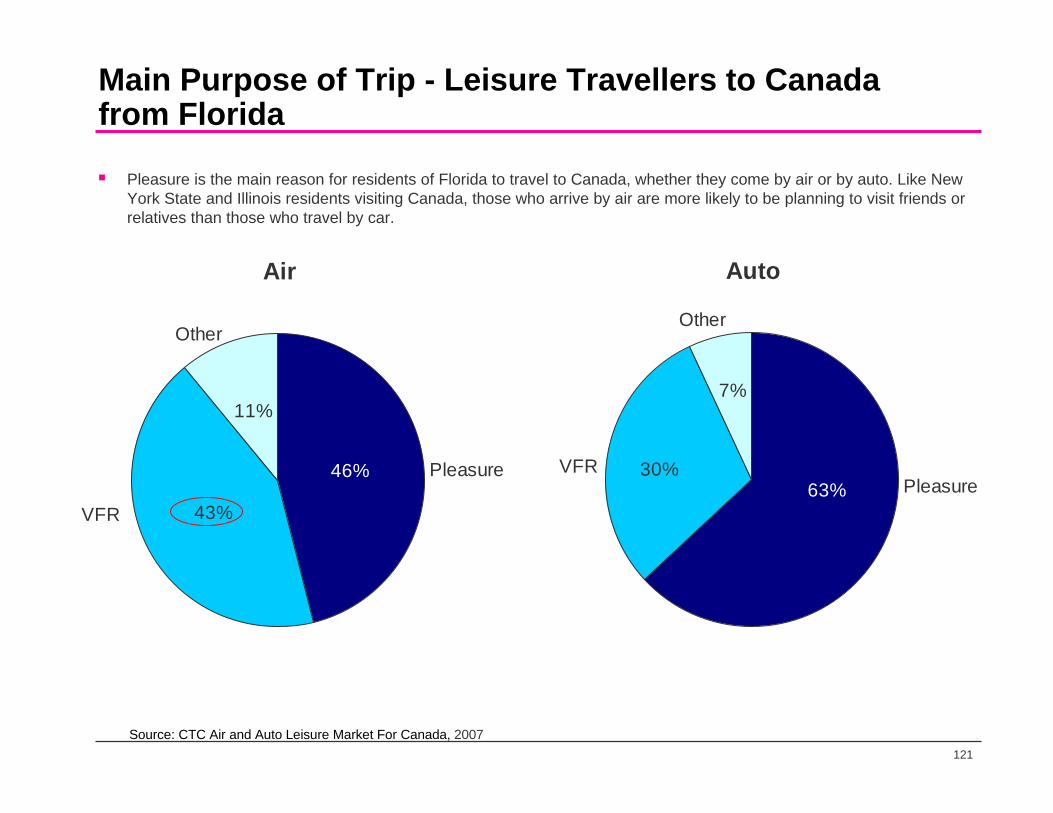
121
Main Purpose of Trip - Leisure Travellers to Canada from Florida
Pleasure is the main reason for residents of Florida to travel to Canada, whether they come by air or by auto. Like New York State and Illinois residents visiting Canada, those who arrive by air are more likely to be planning to visit friends or relatives than those who travel by car.
Air
11%
43%
46% Pleasure
VFR
Other
Auto
63%30%
7%
PleasureVFR
Other
Source: CTC Air and Auto Leisure Market For Canada, 2007
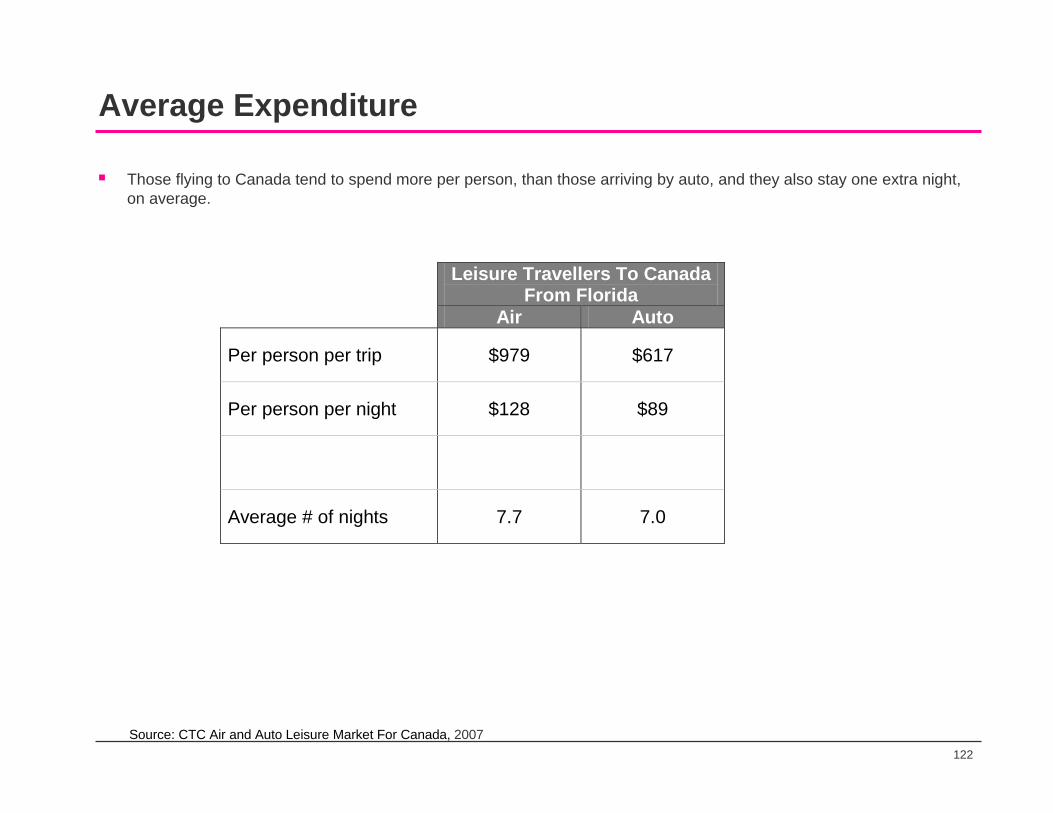
122
Average Expenditure
Those flying to Canada tend to spend more per person, than those arriving by auto, and they also stay one extra night, on average.
Leisure Travellers To Canada From Florida
Air Auto
Per person per trip $979 $617
Per person per night $128 $89
Average # of nights 7.7 7.0
Source: CTC Air and Auto Leisure Market For Canada, 2007
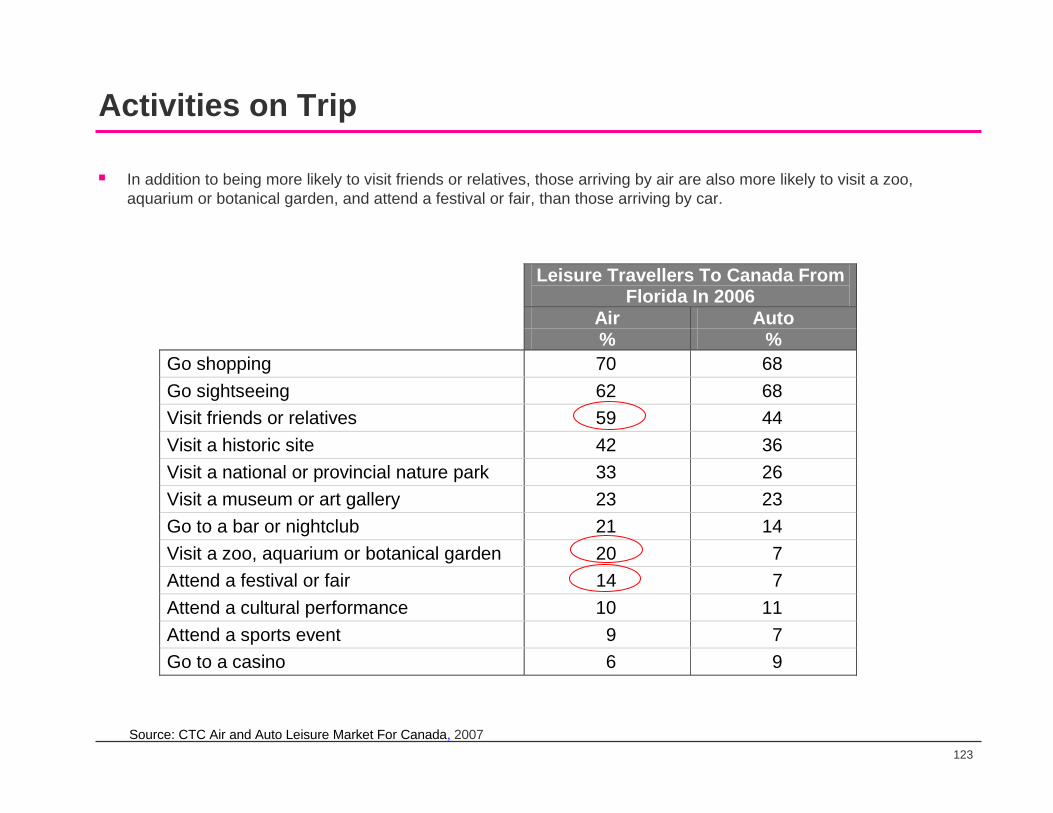
123
Activities on Trip
In addition to being more likely to visit friends or relatives, those arriving by air are also more likely to visit a zoo, aquarium or botanical garden, and attend a festival or fair, than those arriving by car.
Leisure Travellers To Canada From Florida In 2006
Air Auto % % Go shopping 70 68 Go sightseeing 62 68 Visit friends or relatives 59 44 Visit a historic site 42 36 Visit a national or provincial nature park 33 26 Visit a museum or art gallery 23 23 Go to a bar or nightclub 21 14 Visit a zoo, aquarium or botanical garden 20 7 Attend a festival or fair 14 7 Attend a cultural performance 10 11 Attend a sports event 9 7 Go to a casino 6 9
Source: CTC Air and Auto Leisure Market For Canada, 2007
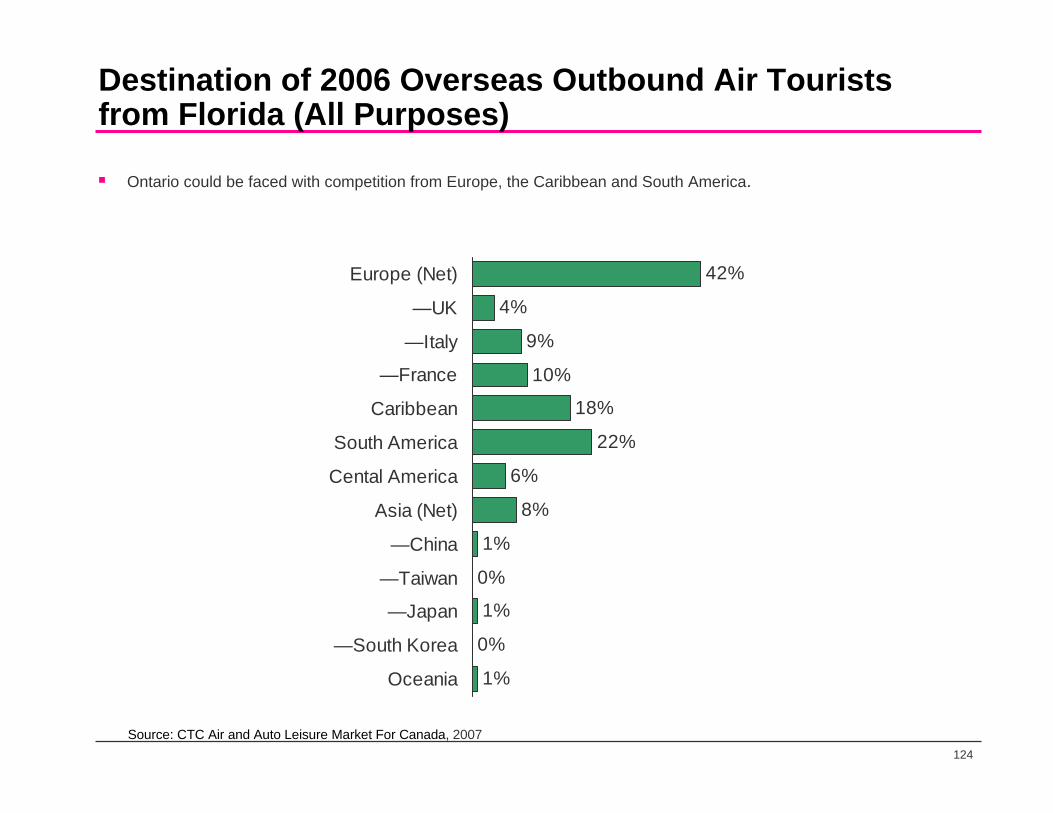
124
Destination of 2006 Overseas Outbound Air Tourists from Florida (All Purposes)
Ontario could be faced with competition from Europe, the Caribbean and South America.
42%
4%
9%
10%
18%
22%
6%
8%
1%
0%
1%
0%
1%
Europe (Net)
—UK
—Italy
—France
Caribbean
South America
Cental America
Asia (Net)
—China
—Taiwan
—Japan
—South Korea
Oceania
Source: CTC Air and Auto Leisure Market For Canada, 2007

125
Characteristics of 2006 Overseas Outbound Air Tourists from Florida (All Purposes)
Those travelling overseas from Florida were likely to have dined in restaurants and shopped. Like residents of Illinois, they are relatively more likely to have visited historical places, compared to residents of New York State, Massachusetts, New Jersey or Connecticut.
Top 10 Activities
Dining in restaurants 77%
Shopping 65%
Visit historical places 55%
Visit small towns 41%
Sightseeing in cities 40%
Touring countryside 30%
Cultural Heritage sites 27%
Nightclubs/dancing 25%
Art gallery/museum 22%
Guided tours 19% 11
Source: CTC Air and Auto Leisure Market For Canada, 2007

126
Texas

127
Total Visitors (‘000)
The proportions of visitors from Texas to Canada and to Ontario have both decreased slightly since 2002. Ontario captured 44% of all Texas visitors to Canada in 2006.
050
100150200250300350400450500550600
2002 2003 2004 2005 2006
#
Total CanadaVisitors FromTexas
Total OntarioVisitors FromTexas
Source: Statistics Canada ITS, 2002-2006
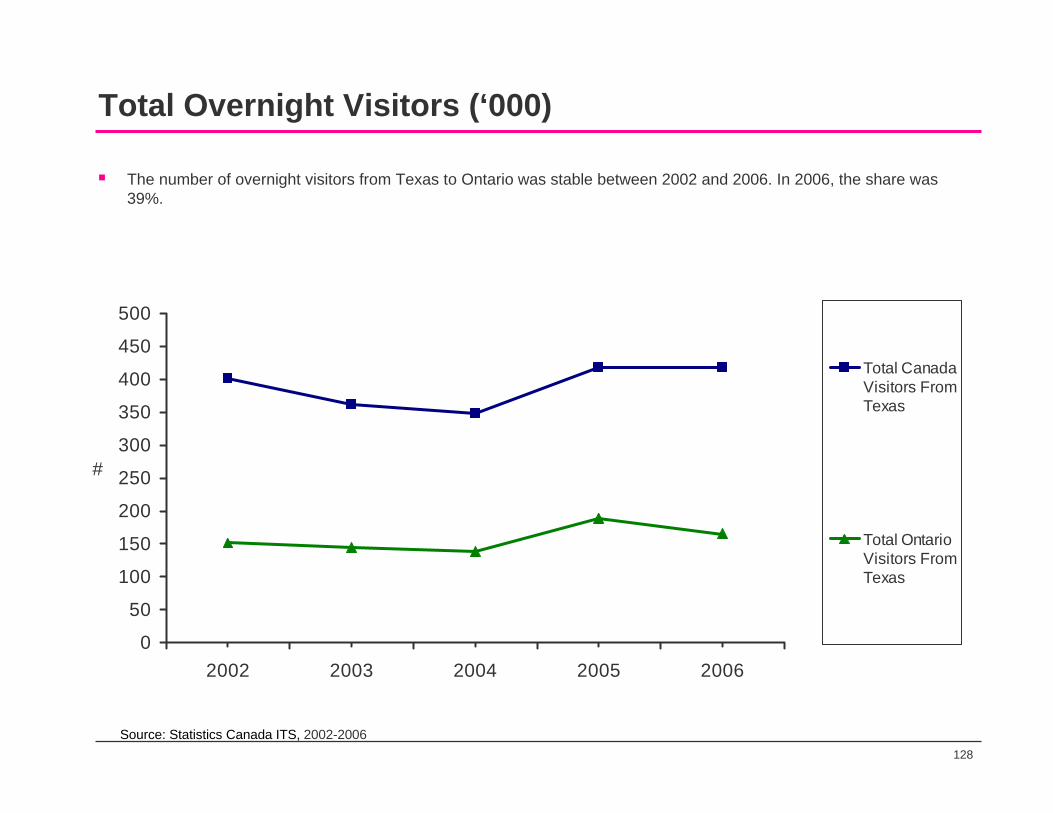
128
Total Overnight Visitors (‘000)
The number of overnight visitors from Texas to Ontario was stable between 2002 and 2006. In 2006, the share was 39%.
0
50
100
150
200
250
300
350
400
450
500
2002 2003 2004 2005 2006
#
Total CanadaVisitors FromTexas
Total OntarioVisitors FromTexas
Source: Statistics Canada ITS, 2002-2006
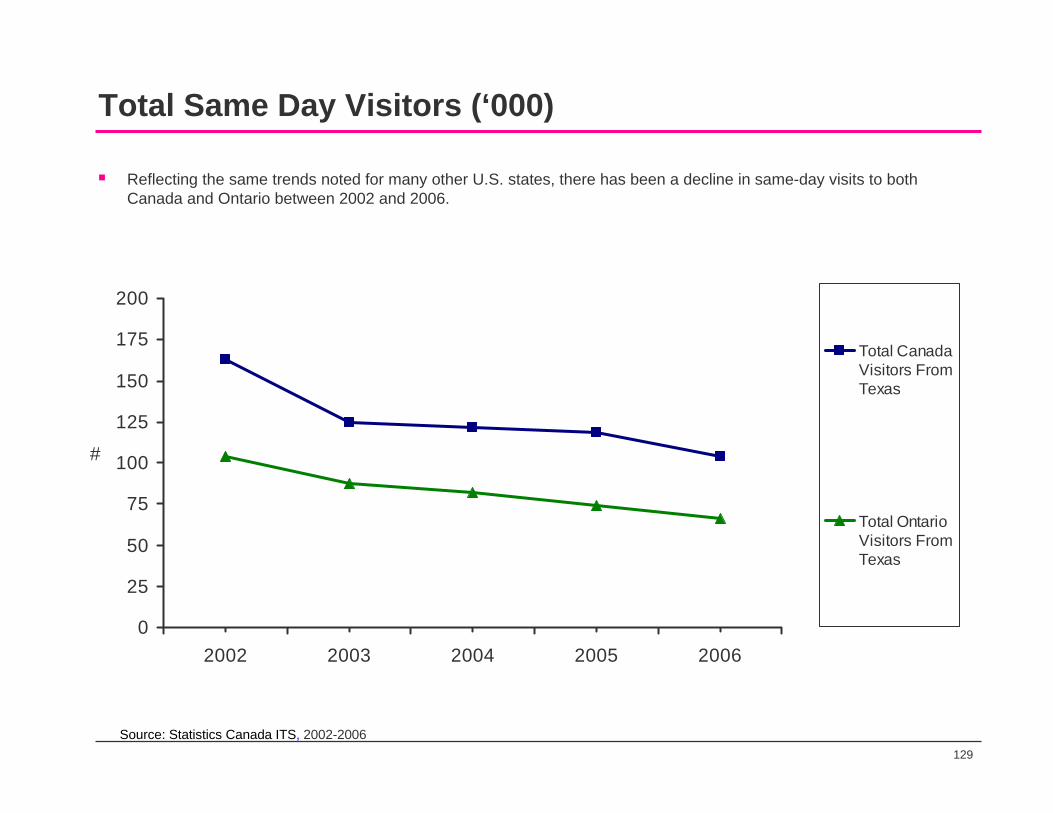
129
Total Same Day Visitors (‘000)
Reflecting the same trends noted for many other U.S. states, there has been a decline in same-day visits to both Canada and Ontario between 2002 and 2006.
0
25
50
75
100
125
150
175
200
2002 2003 2004 2005 2006
#
Total Canada Visitors FromTexas
Total OntarioVisitors FromTexas
Source: Statistics Canada ITS, 2002-2006

130
Ontario Market Share of Canadian TripsOntario holds a reasonably large share of the same-day trips to Canada from Texas (64%), not far below the proportion of same-day trips from Illinois (74%) and Massachusetts (73%). In terms of overnight visits, Ontario captures 40%, comparable to its share of overnight visitors from New Jersey (49%) and Connecticut (38%).
Ontario Market Share… 2002 2003 2004 2005 2006
From Texas: % % % % %
Total 45 47 47 49 44
Overnight 38 40 40 46 40
Same Day 64 70 67 62 64
Source: Statistics Canada ITS, 2002-2006

131
Potential to Visit Ontario from TexasAs noted for Florida, Texas holds a substantial population (614,000) who have not visited Ontario but who would be open to the idea of travelling to Ontario if they were presented with the appropriate package.
437
614
Texas
VisitorsOpen
Source: TAMS Conversion Model, 2006Base: Texas Residents (000)

132
Main Purpose of Trip - Leisure Travellers to Canada from Texas
Pleasure is the main reason for residents of Texas to travel to Canada, whether they come by air or by auto. Like New York State, Illinois and Florida residents visiting Canada, those who arrive by air are more likely to be planning to visit friends or relatives than those who travel by car.
Air
20%
31%49%
Pleasure
VFR
Other
Auto
68%22%
11%
PleasureVFR
Other
Source: CTC Air and Auto Leisure Market For Canada, 2007
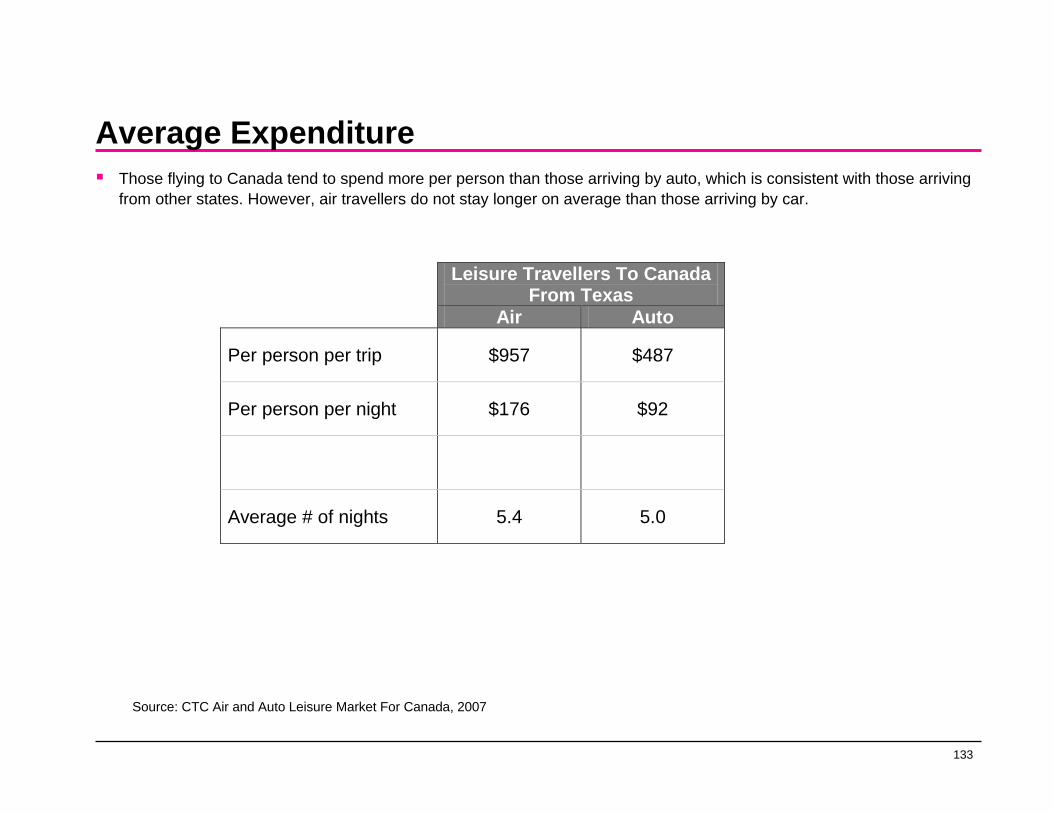
133
Average ExpenditureThose flying to Canada tend to spend more per person than those arriving by auto, which is consistent with those arriving from other states. However, air travellers do not stay longer on average than those arriving by car.
Leisure Travellers To Canada From Texas
Air Auto
Per person per trip $957 $487
Per person per night $176 $92
Average # of nights 5.4 5.0
Source: CTC Air and Auto Leisure Market For Canada, 2007
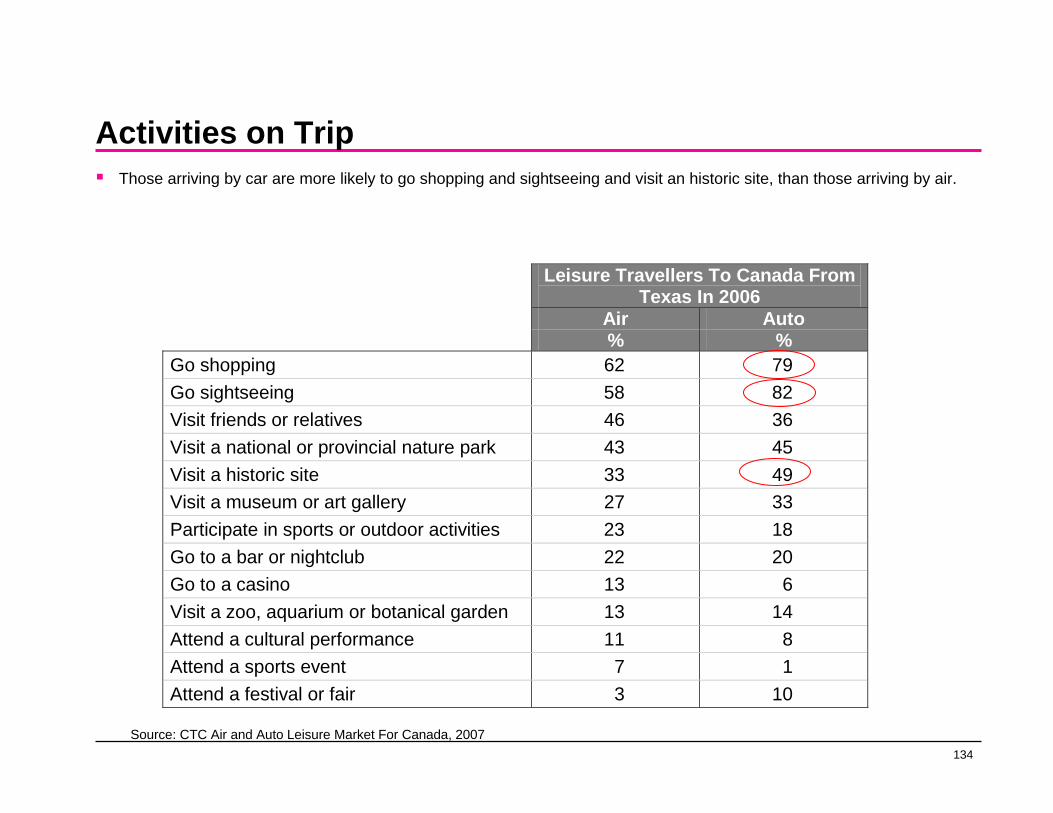
134
Activities on TripThose arriving by car are more likely to go shopping and sightseeing and visit an historic site, than those arriving by air.
Leisure Travellers To Canada From Texas In 2006
Air Auto % % Go shopping 62 79 Go sightseeing 58 82 Visit friends or relatives 46 36 Visit a national or provincial nature park 43 45 Visit a historic site 33 49 Visit a museum or art gallery 27 33 Participate in sports or outdoor activities 23 18 Go to a bar or nightclub 22 20 Go to a casino 13 6 Visit a zoo, aquarium or botanical garden 13 14 Attend a cultural performance 11 8 Attend a sports event 7 1 Attend a festival or fair 3 10
Source: CTC Air and Auto Leisure Market For Canada, 2007
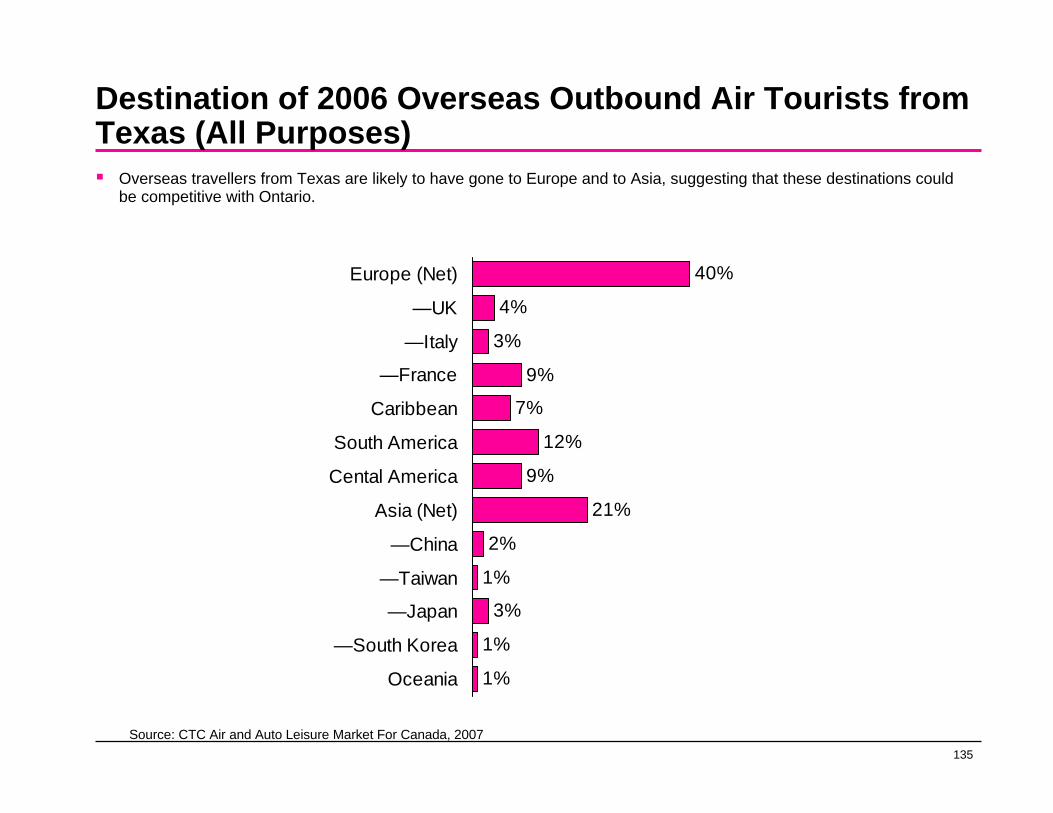
135
Destination of 2006 Overseas Outbound Air Tourists from Texas (All Purposes)
Overseas travellers from Texas are likely to have gone to Europe and to Asia, suggesting that these destinations could be competitive with Ontario.
40%
4%
3%
9%
7%
12%
9%
21%
2%
1%
3%
1%
1%
Europe (Net)
—UK
—Italy
—France
Caribbean
South America
Cental America
Asia (Net)
—China
—Taiwan
—Japan
—South Korea
Oceania
Source: CTC Air and Auto Leisure Market For Canada, 2007
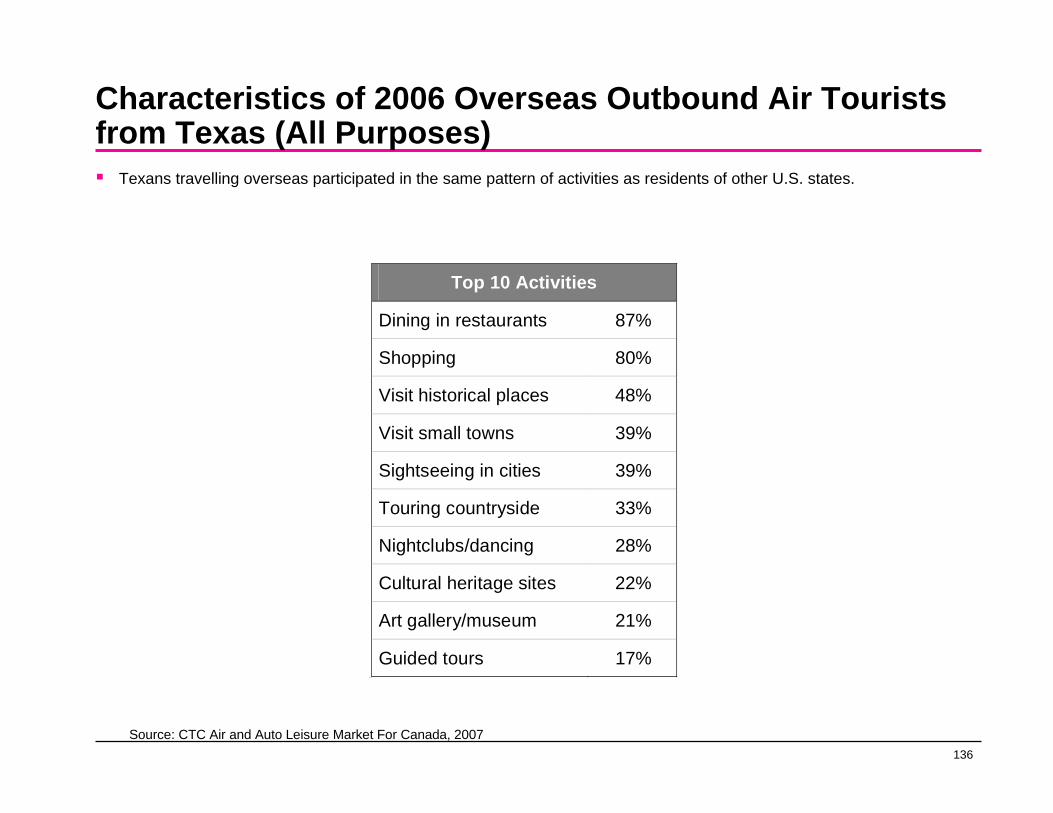
136
Characteristics of 2006 Overseas Outbound Air Tourists from Texas (All Purposes)
Texans travelling overseas participated in the same pattern of activities as residents of other U.S. states.
Top 10 Activities
Dining in restaurants 87%
Shopping 80%
Visit historical places 48%
Visit small towns 39%
Sightseeing in cities 39%
Touring countryside 33%
Nightclubs/dancing 28%
Cultural heritage sites 22%
Art gallery/museum 21%
Guided tours 17% 11
Source: CTC Air and Auto Leisure Market For Canada, 2007
137
California
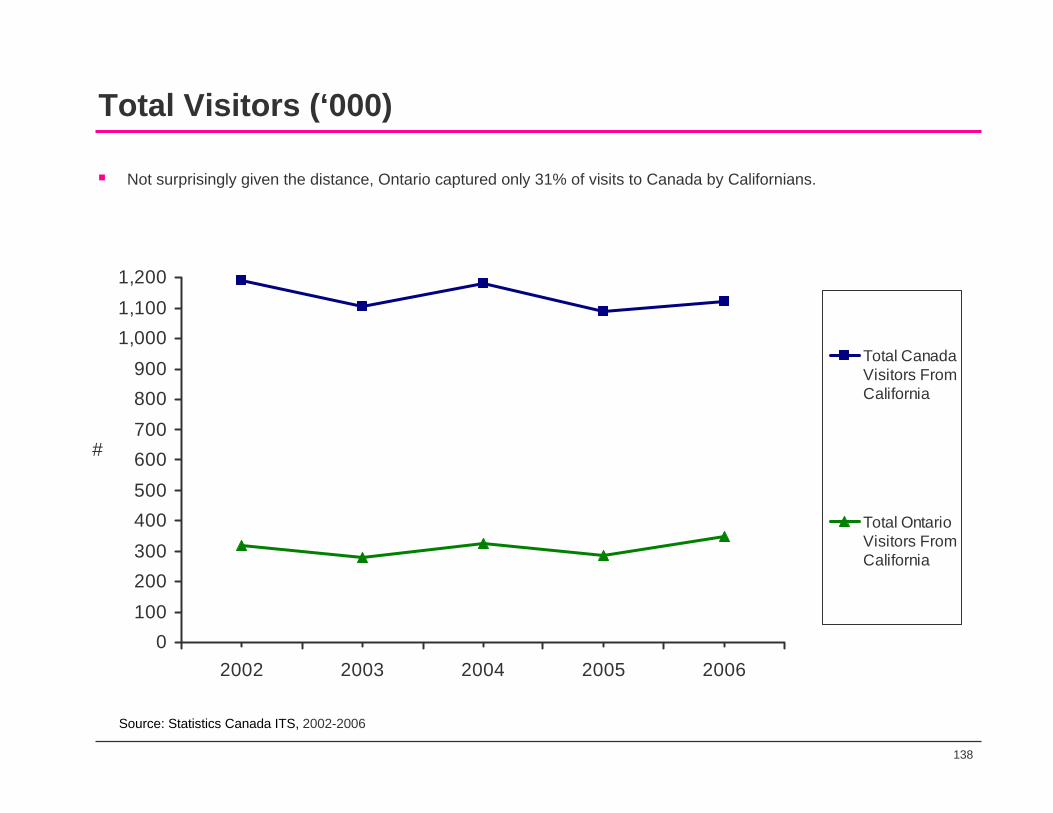
138
Total Visitors (‘000)
Not surprisingly given the distance, Ontario captured only 31% of visits to Canada by Californians.
0100200300400500600700800900
1,0001,1001,200
2002 2003 2004 2005 2006
#
Total CanadaVisitors FromCalifornia
Total OntarioVisitors FromCalifornia
Source: Statistics Canada ITS, 2002-2006
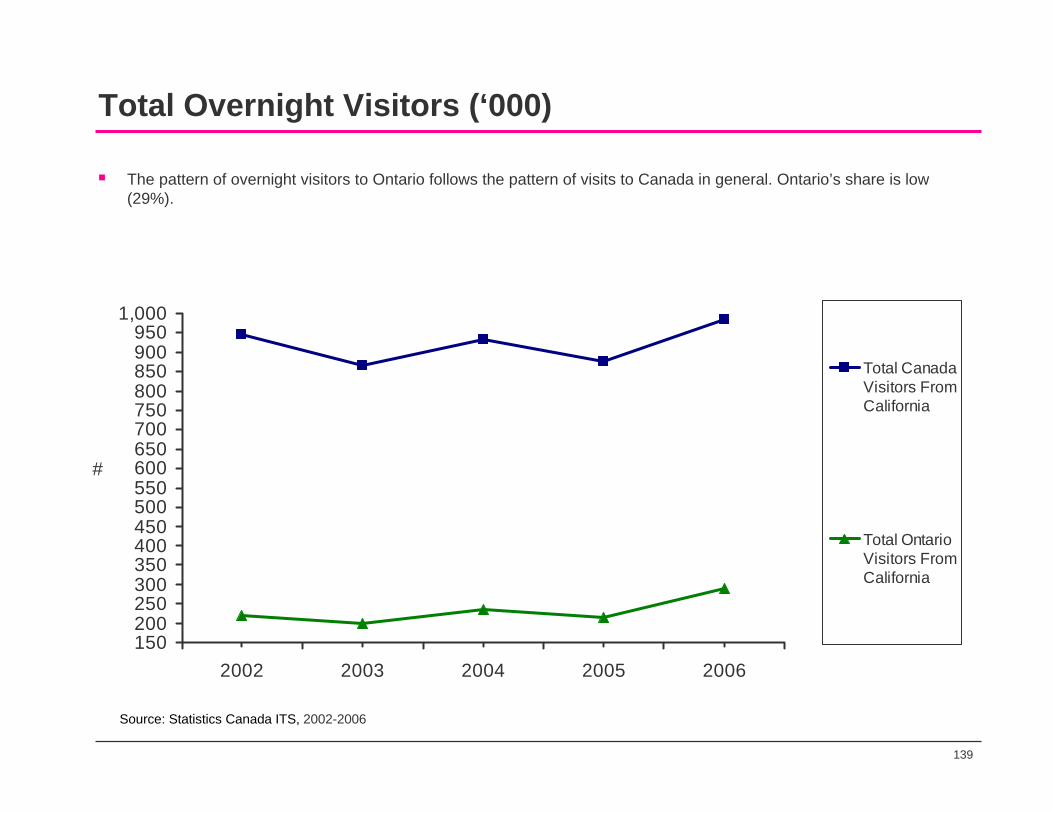
139
Total Overnight Visitors (‘000)
The pattern of overnight visitors to Ontario follows the pattern of visits to Canada in general. Ontario’s share is low (29%).
150200250300350400450500550600650700750800850900950
1,000
2002 2003 2004 2005 2006
#
Total CanadaVisitors FromCalifornia
Total OntarioVisitors FromCalifornia
Source: Statistics Canada ITS, 2002-2006

140
Total Same Day Visitors (‘000)
The number of same-day visitors to Ontario declined between 2002 and 2006, although not as sharply as to Canada as a whole.
0255075
100125150175200225250275300
2002 2003 2004 2005 2006
#
Total Canada Visitors FromCalifornia
Total OntarioVisitors FromCalifornia
Source: Statistics Canada ITS, 2002-2006
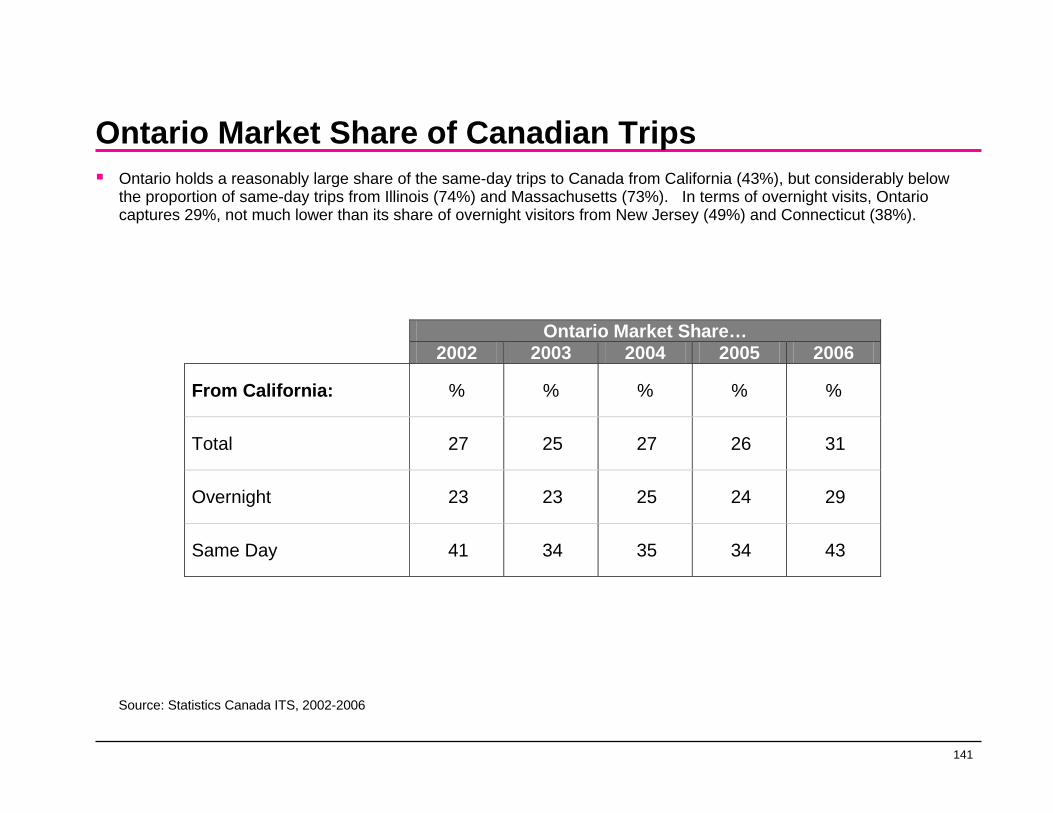
141
Ontario Market Share of Canadian TripsOntario holds a reasonably large share of the same-day trips to Canada from California (43%), but considerably below the proportion of same-day trips from Illinois (74%) and Massachusetts (73%). In terms of overnight visits, Ontario captures 29%, not much lower than its share of overnight visitors from New Jersey (49%) and Connecticut (38%).
Ontario Market Share… 2002 2003 2004 2005 2006
From California: % % % % %
Total 27 25 27 26 31
Overnight 23 23 25 24 29
Same Day 41 34 35 34 43
Source: Statistics Canada ITS, 2002-2006
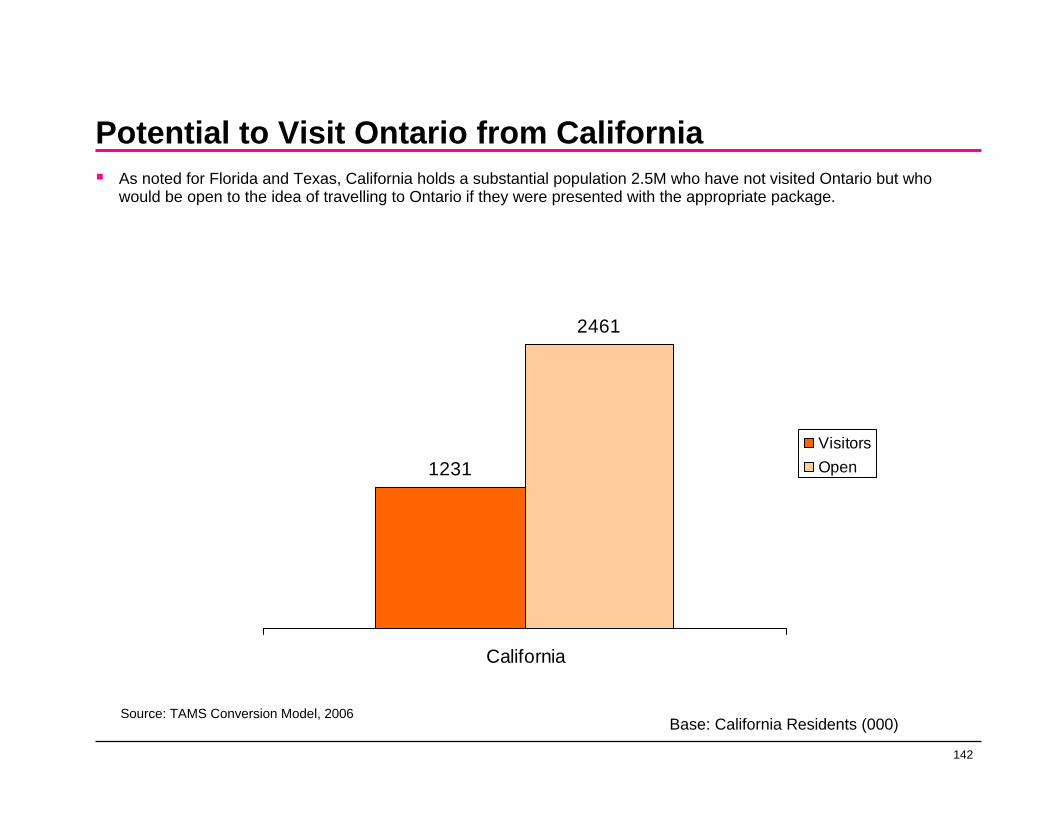
142
Potential to Visit Ontario from CaliforniaAs noted for Florida and Texas, California holds a substantial population 2.5M who have not visited Ontario but who would be open to the idea of travelling to Ontario if they were presented with the appropriate package.
1231
2461
California
VisitorsOpen
Source: TAMS Conversion Model, 2006Base: California Residents (000)
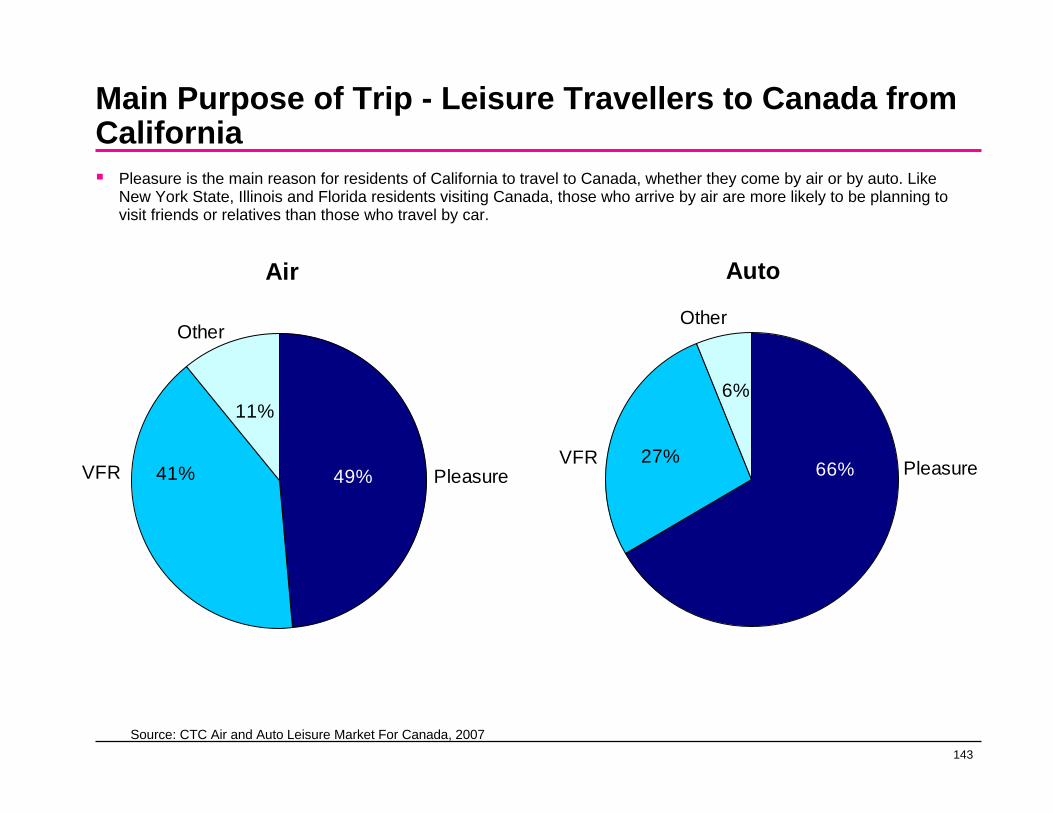
143
Main Purpose of Trip - Leisure Travellers to Canada from California
Pleasure is the main reason for residents of California to travel to Canada, whether they come by air or by auto. Like New York State, Illinois and Florida residents visiting Canada, those who arrive by air are more likely to be planning to visit friends or relatives than those who travel by car.
Air
11%
41% 49% PleasureVFR
Other
Auto
66%27%
6%
PleasureVFR
Other
Source: CTC Air and Auto Leisure Market For Canada, 2007
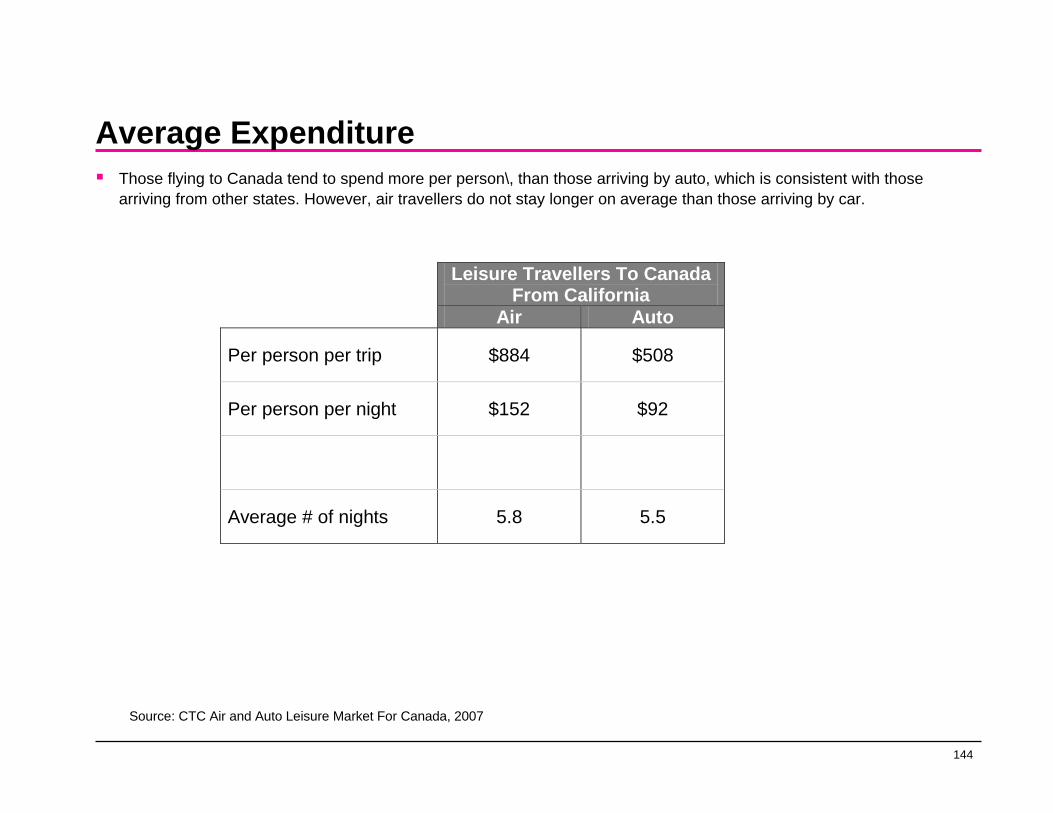
144
Average ExpenditureThose flying to Canada tend to spend more per person\, than those arriving by auto, which is consistent with those arriving from other states. However, air travellers do not stay longer on average than those arriving by car.
Leisure Travellers To Canada From California
Air Auto
Per person per trip $884 $508
Per person per night $152 $92
Average # of nights 5.8 5.5
Source: CTC Air and Auto Leisure Market For Canada, 2007
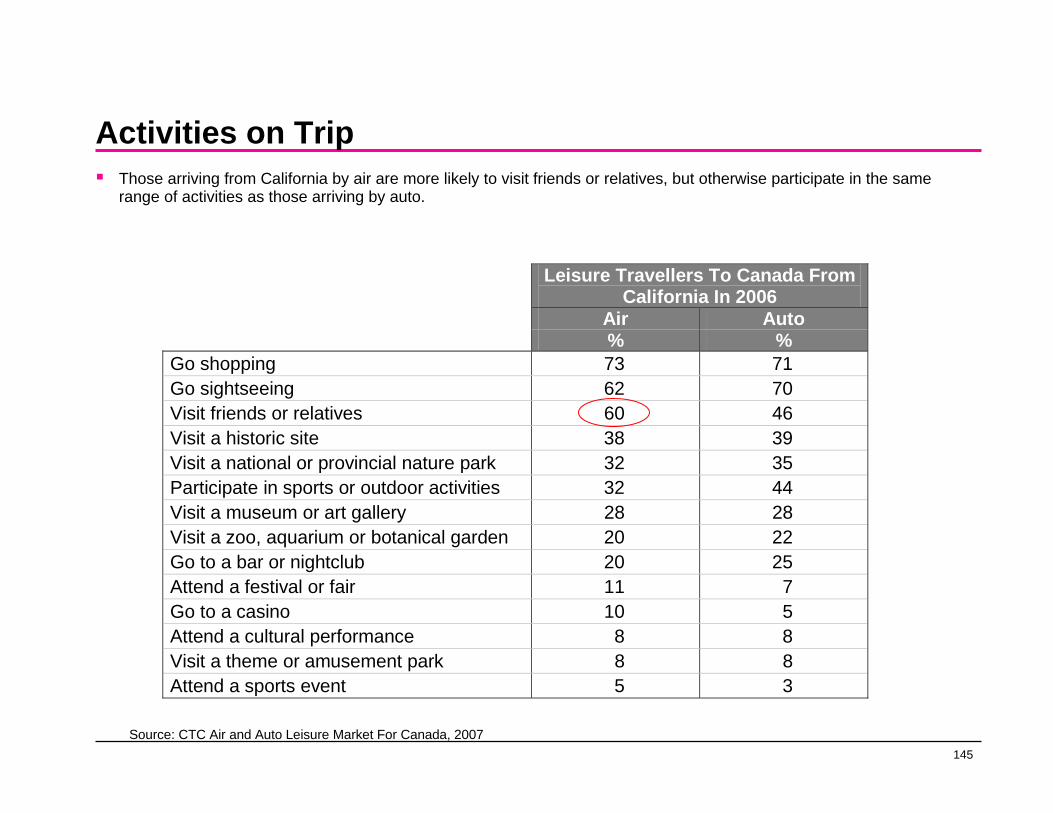
145
Activities on TripThose arriving from California by air are more likely to visit friends or relatives, but otherwise participate in the same range of activities as those arriving by auto.
Leisure Travellers To Canada From California In 2006
Air Auto % % Go shopping 73 71 Go sightseeing 62 70 Visit friends or relatives 60 46 Visit a historic site 38 39 Visit a national or provincial nature park 32 35 Participate in sports or outdoor activities 32 44 Visit a museum or art gallery 28 28 Visit a zoo, aquarium or botanical garden 20 22 Go to a bar or nightclub 20 25 Attend a festival or fair 11 7 Go to a casino 10 5 Attend a cultural performance 8 8 Visit a theme or amusement park 8 8 Attend a sports event 5 3
Source: CTC Air and Auto Leisure Market For Canada, 2007
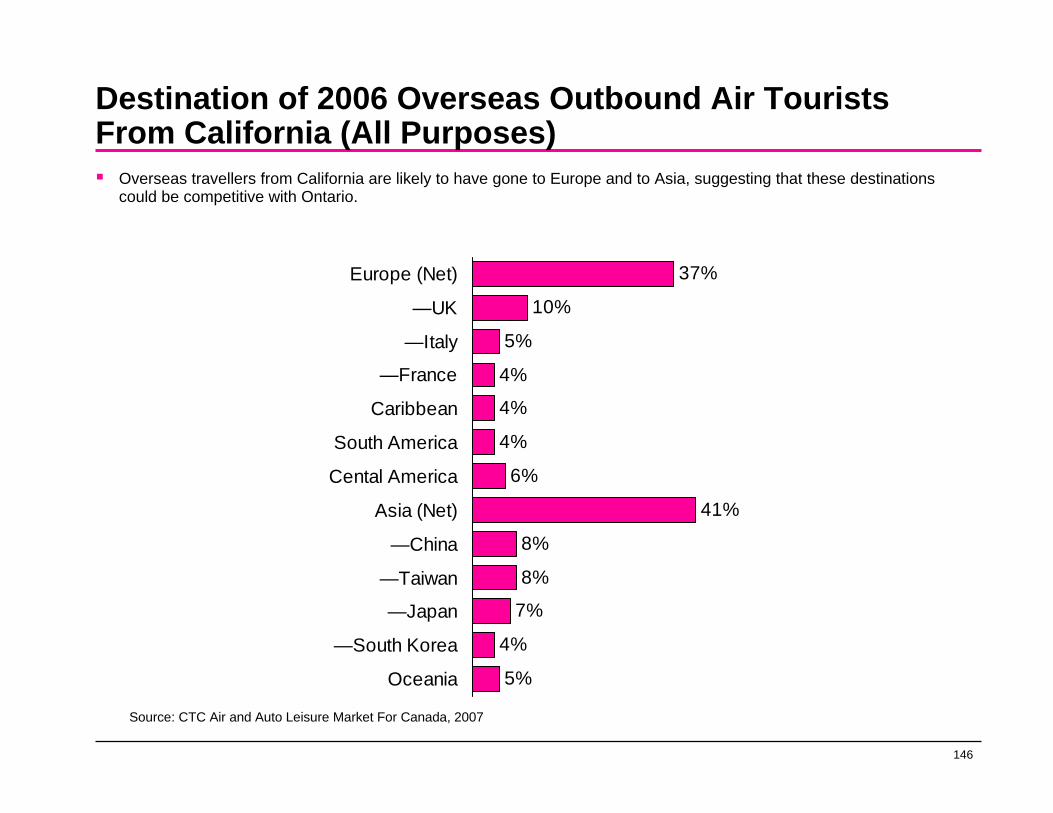
146
Destination of 2006 Overseas Outbound Air Tourists From California (All Purposes)
Overseas travellers from California are likely to have gone to Europe and to Asia, suggesting that these destinations could be competitive with Ontario.
37%
10%
5%
4%
4%
4%
6%
41%
8%
8%
7%
4%
5%
Europe (Net)
—UK
—Italy
—France
Caribbean
South America
Cental America
Asia (Net)
—China
—Taiwan
—Japan
—South Korea
Oceania
Source: CTC Air and Auto Leisure Market For Canada, 2007
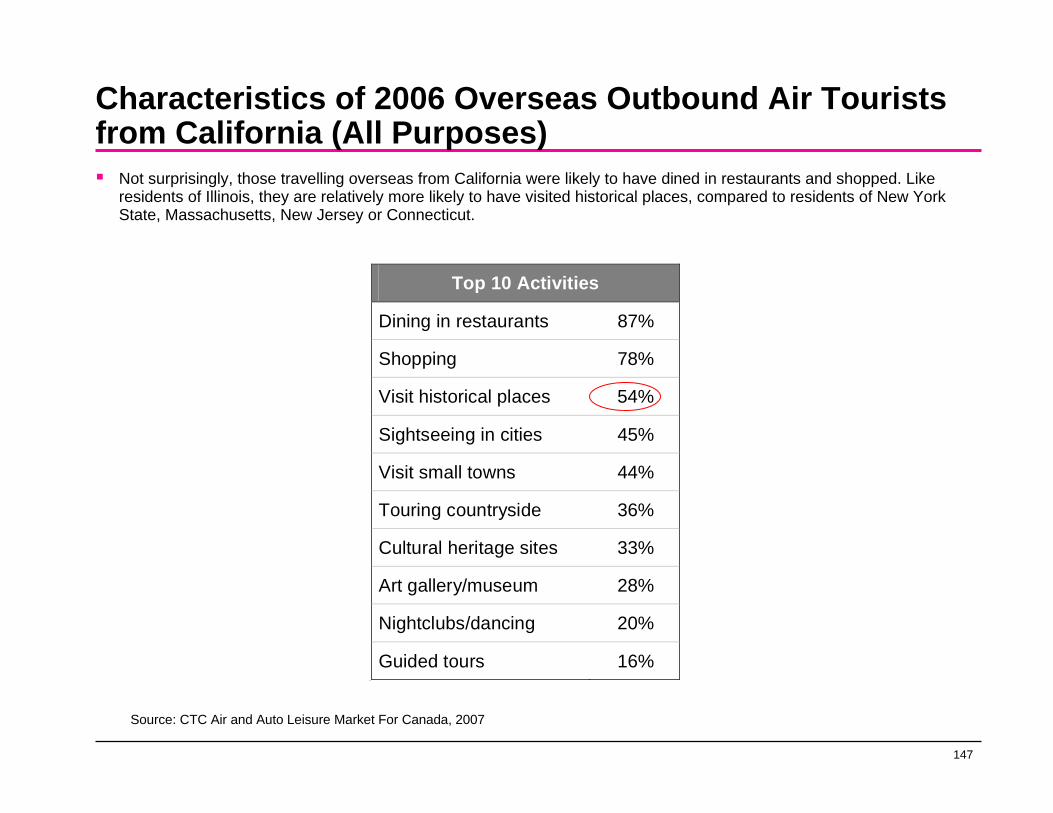
147
Characteristics of 2006 Overseas Outbound Air Tourists from California (All Purposes)
Not surprisingly, those travelling overseas from California were likely to have dined in restaurants and shopped. Like residents of Illinois, they are relatively more likely to have visited historical places, compared to residents of New York State, Massachusetts, New Jersey or Connecticut.
Top 10 Activities
Dining in restaurants 87%
Shopping 78%
Visit historical places 54%
Sightseeing in cities 45%
Visit small towns 44%
Touring countryside 36%
Cultural heritage sites 33%
Art gallery/museum 28%
Nightclubs/dancing 20%
Guided tours 16% 11
Source: CTC Air and Auto Leisure Market For Canada, 2007
148
Overseas Markets
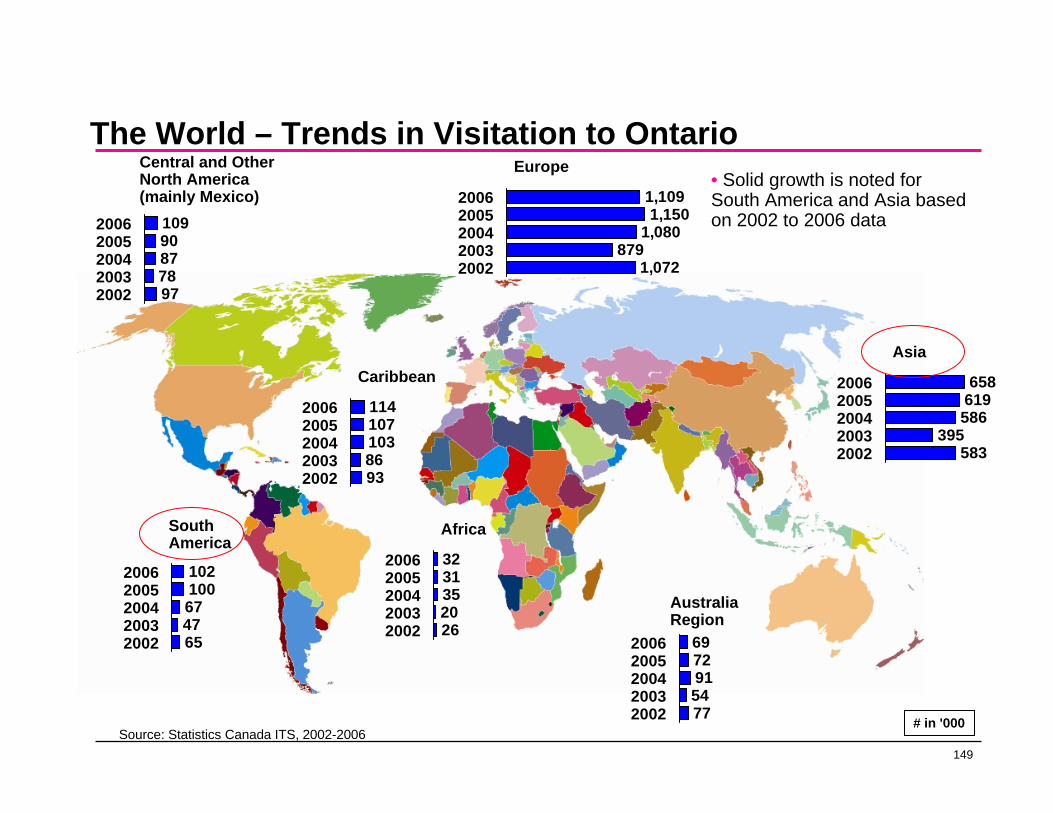
149
1,1091,150
1,080879
1,072
20062005200420032002
Europe
658619586
395583
20062005200420032002
Asia
1141071038693
20062005200420032002
Caribbean
Central and Other North America (mainly Mexico)
10990877897
20062005200420032002
102100674765
20062005200420032002
South America
6972915477
20062005200420032002
Australia Region
3231352026
20062005200420032002
Africa
# in '000Source: Statistics Canada ITS, 2002-2006
• Solid growth is noted for South America and Asia based on 2002 to 2006 data
The World – Trends in Visitation to Ontario

150
Europe
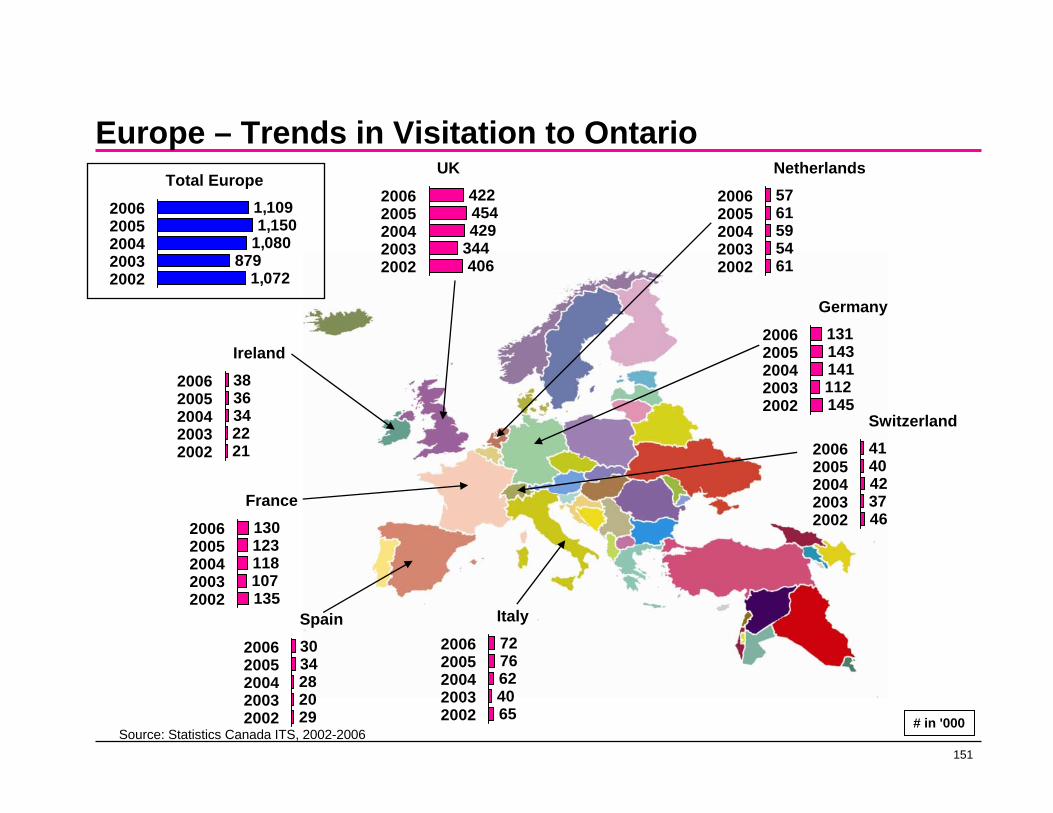
151
Europe – Trends in Visitation to Ontario
422454429
344406
20062005200420032002
UK5761595461
20062005200420032002
Netherlands
131143141112145
20062005200420032002
Germany
4140423746
20062005200420032002
Switzerland
7276624065
20062005200420032002
Italy
3034282029
20062005200420032002
Spain
130123118107135
20062005200420032002
France
3836342221
20062005200420032002
Ireland
# in '000
1,1091,150
1,080879
1,072
20062005200420032002
Total Europe
Source: Statistics Canada ITS, 2002-2006
152
The U.K.
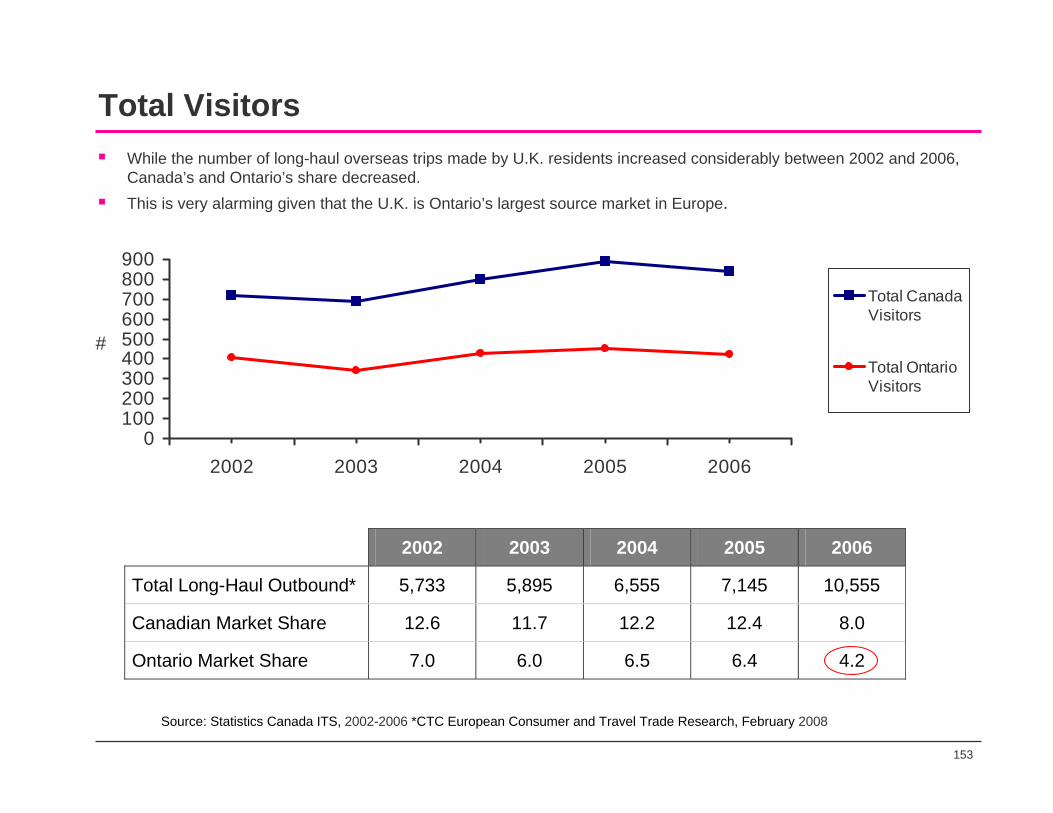
153
Total VisitorsWhile the number of long-haul overseas trips made by U.K. residents increased considerably between 2002 and 2006, Canada’s and Ontario’s share decreased.This is very alarming given that the U.K. is Ontario’s largest source market in Europe.
0100200300400500600700800900
2002 2003 2004 2005 2006
#
Total Canada Visitors
Total OntarioVisitors
2002 2003 2004 2005 2006
Total Long-Haul Outbound* 5,733 5,895 6,555 7,145 10,555
Canadian Market Share 12.6 11.7 12.2 12.4 8.0
Ontario Market Share 7.0 6.0 6.5 6.4 4.2
Source: Statistics Canada ITS, 2002-2006 *CTC European Consumer and Travel Trade Research, February 2008
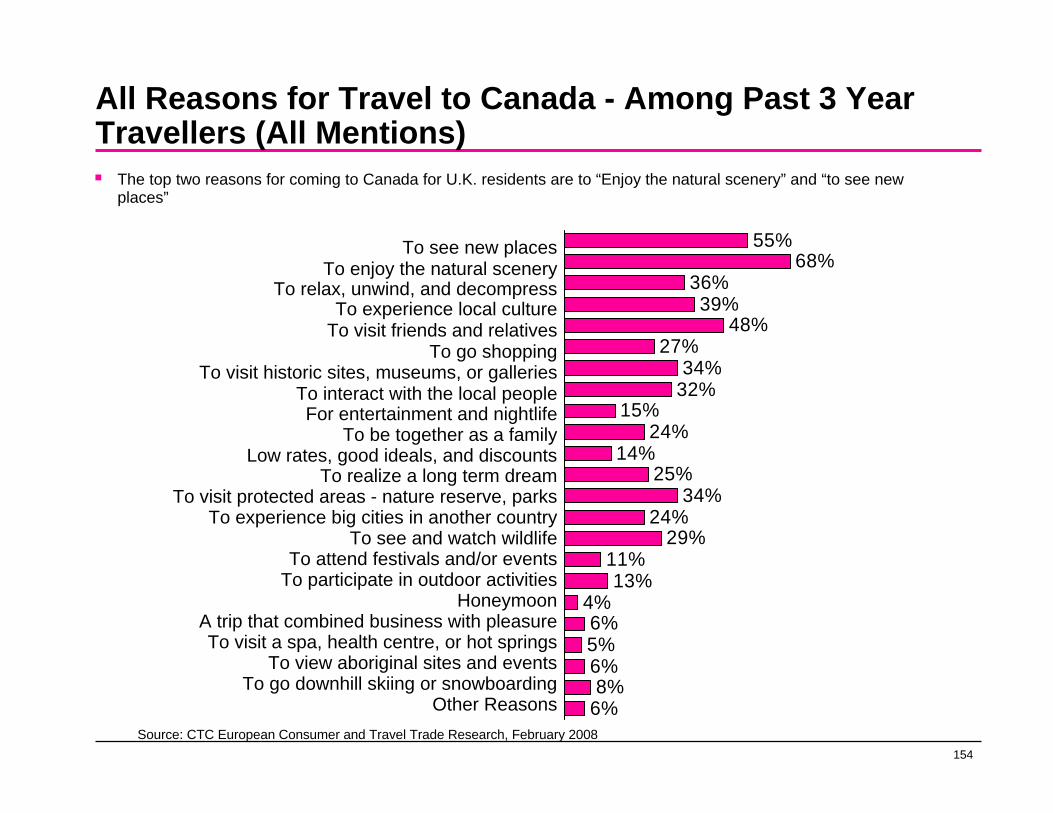
154
All Reasons for Travel to Canada - Among Past 3 Year Travellers (All Mentions)
55%68%
36%39%
48%27%
34%32%
15%24%
14%25%
34%24%
29%11%13%
4%6%5%6%8%
6%
To see new placesTo enjoy the natural scenery
To relax, unwind, and decompressTo experience local culture
To visit friends and relativesTo go shopping
To visit historic sites, museums, or galleriesTo interact with the local peopleFor entertainment and nightlife
To be together as a familyLow rates, good ideals, and discounts
To realize a long term dreamTo visit protected areas - nature reserve, parks
To experience big cities in another countryTo see and watch wildlife
To attend festivals and/or eventsTo participate in outdoor activities
HoneymoonA trip that combined business with pleasureTo visit a spa, health centre, or hot springs
To view aboriginal sites and eventsTo go downhill skiing or snowboarding
Other ReasonsSource: CTC European Consumer and Travel Trade Research, February 2008
The top two reasons for coming to Canada for U.K. residents are to “Enjoy the natural scenery” and “to see new places”
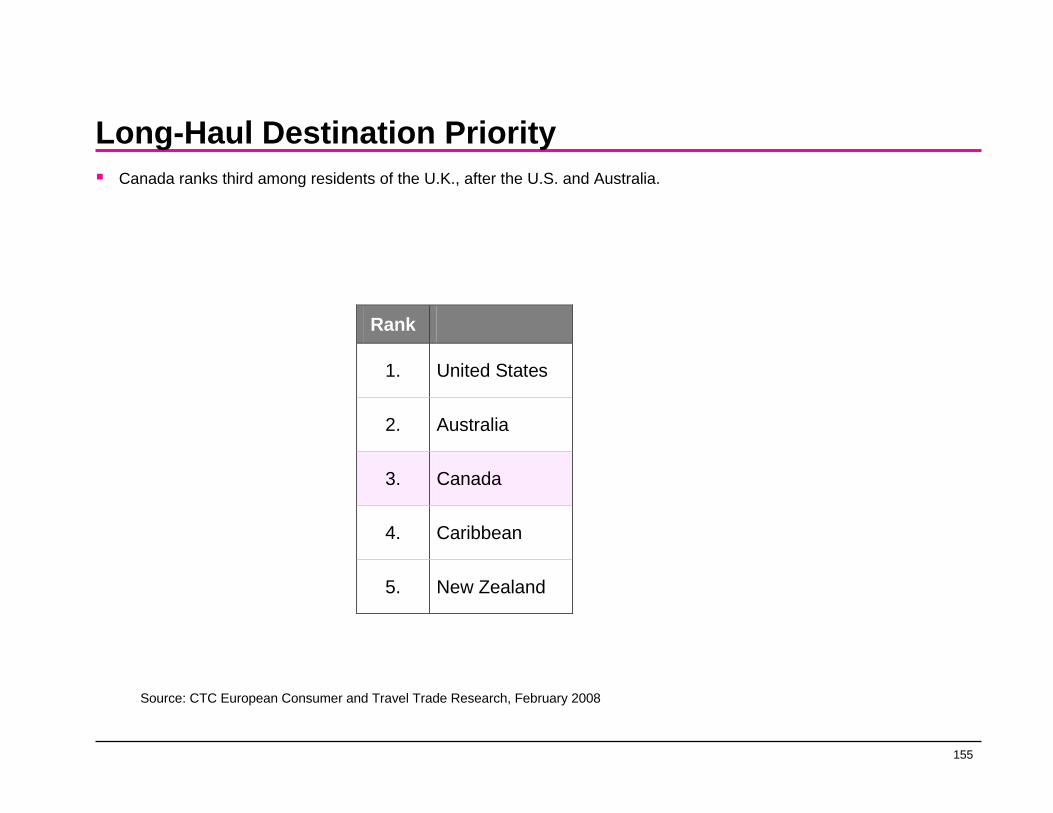
155
Long-Haul Destination PriorityCanada ranks third among residents of the U.K., after the U.S. and Australia.
Rank
1. United States
2. Australia
3. Canada
4. Caribbean
5. New Zealand
Source: CTC European Consumer and Travel Trade Research, February 2008
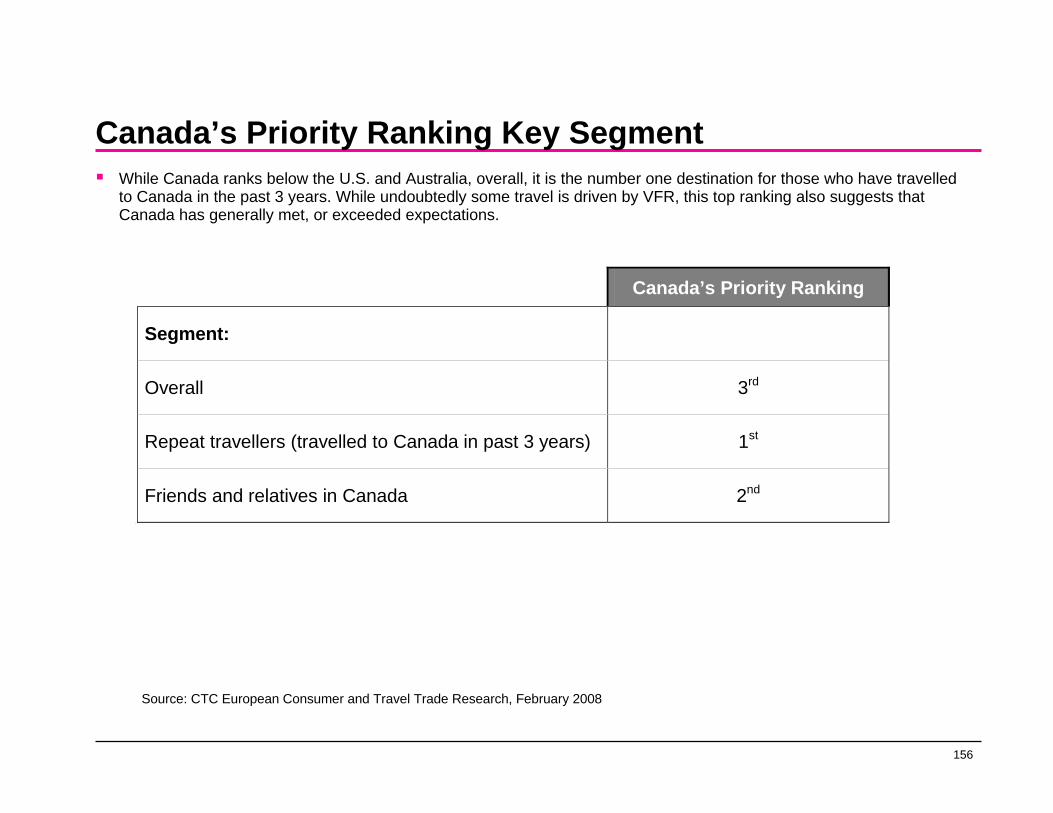
156
Canada’s Priority Ranking Key Segment
Canada’s Priority Ranking
Segment:
Overall 3rd
Repeat travellers (travelled to Canada in past 3 years) 1st
Friends and relatives in Canada 2nd 11
While Canada ranks below the U.S. and Australia, overall, it is the number one destination for those who have travelled to Canada in the past 3 years. While undoubtedly some travel is driven by VFR, this top ranking also suggests that Canada has generally met, or exceeded expectations.
Source: CTC European Consumer and Travel Trade Research, February 2008

157
Interest in Canada’s ActivitiesConsistent with reasons for travelling to Canada, activities of interest among prospective travellers are “rivers and waterfalls”, “mountains”, “places of historical interest” and “visiting small towns”.With the exception of mountains, Ontario has the potential to deliver on the other nine activities.
Prospective Markets Ideal Trip To Canada (Next 2 Years)
Top 10 Activities (In Order)
1. Viewing rivers or waterfalls
2. Viewing mountains
3. Visiting places of historical interest
4. Visiting small towns
5. Observing wildlife in their natural environment
6. Visiting wilderness areas
7. Getting to know the local inhabitants
8. Taking city tours
9. Seeing beautiful beaches and coastlines
10. Visiting world heritage sites 11
Source: CTC European Consumer and Travel Trade Research, February 2008
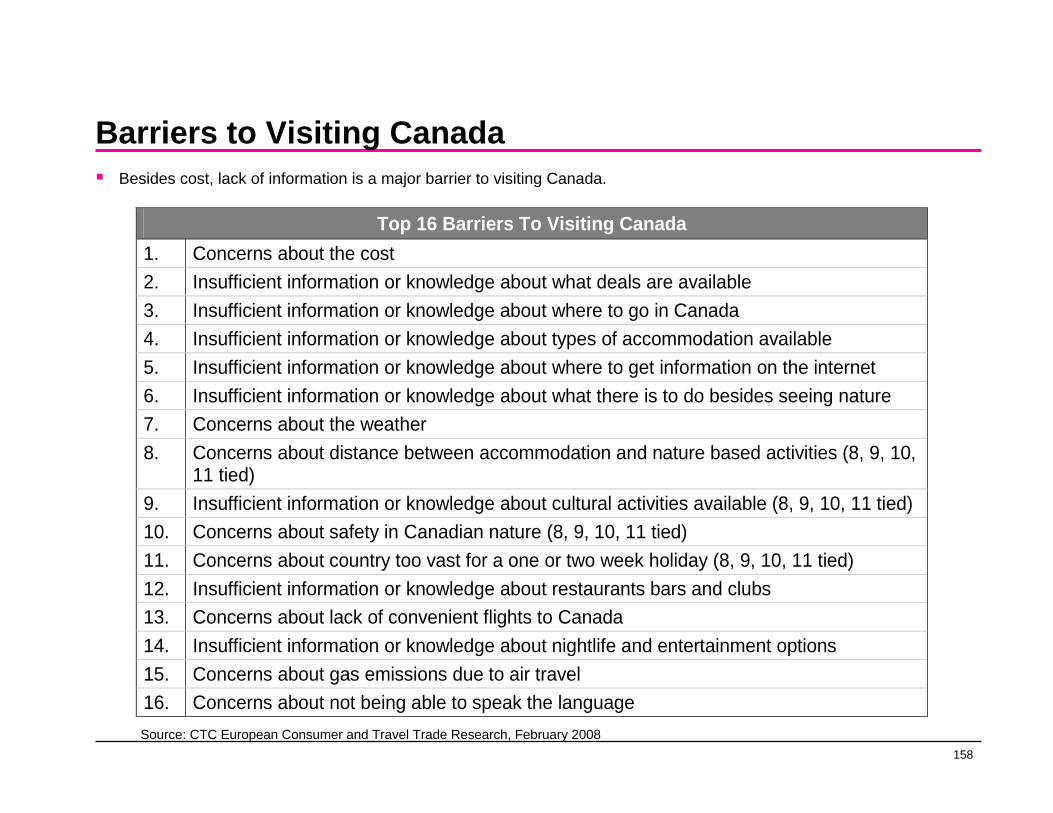
158
Barriers to Visiting Canada
Top 16 Barriers To Visiting Canada 1. Concerns about the cost 2. Insufficient information or knowledge about what deals are available 3. Insufficient information or knowledge about where to go in Canada 4. Insufficient information or knowledge about types of accommodation available 5. Insufficient information or knowledge about where to get information on the internet 6. Insufficient information or knowledge about what there is to do besides seeing nature 7. Concerns about the weather 8. Concerns about distance between accommodation and nature based activities (8, 9, 10,
11 tied) 9. Insufficient information or knowledge about cultural activities available (8, 9, 10, 11 tied) 10. Concerns about safety in Canadian nature (8, 9, 10, 11 tied) 11. Concerns about country too vast for a one or two week holiday (8, 9, 10, 11 tied) 12. Insufficient information or knowledge about restaurants bars and clubs 13. Concerns about lack of convenient flights to Canada 14. Insufficient information or knowledge about nightlife and entertainment options 15. Concerns about gas emissions due to air travel 16. Concerns about not being able to speak the language
Besides cost, lack of information is a major barrier to visiting Canada.
Source: CTC European Consumer and Travel Trade Research, February 2008
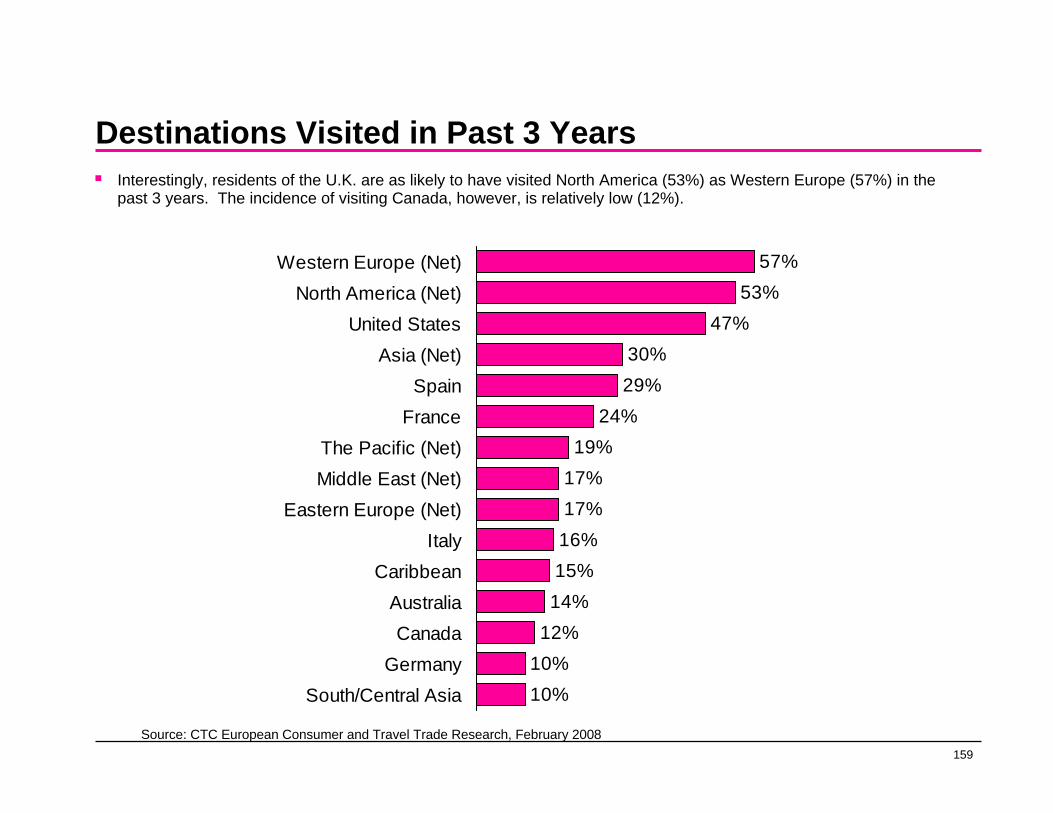
159
Destinations Visited in Past 3 Years
57%53%
47%30%29%
24%19%
17%17%16%15%14%
12%10%10%
Western Europe (Net)North America (Net)
United StatesAsia (Net)
SpainFrance
The Pacific (Net)Middle East (Net)
Eastern Europe (Net)Italy
CaribbeanAustraliaCanada
GermanySouth/Central Asia
Source: CTC European Consumer and Travel Trade Research, February 2008
Interestingly, residents of the U.K. are as likely to have visited North America (53%) as Western Europe (57%) in the past 3 years. The incidence of visiting Canada, however, is relatively low (12%).
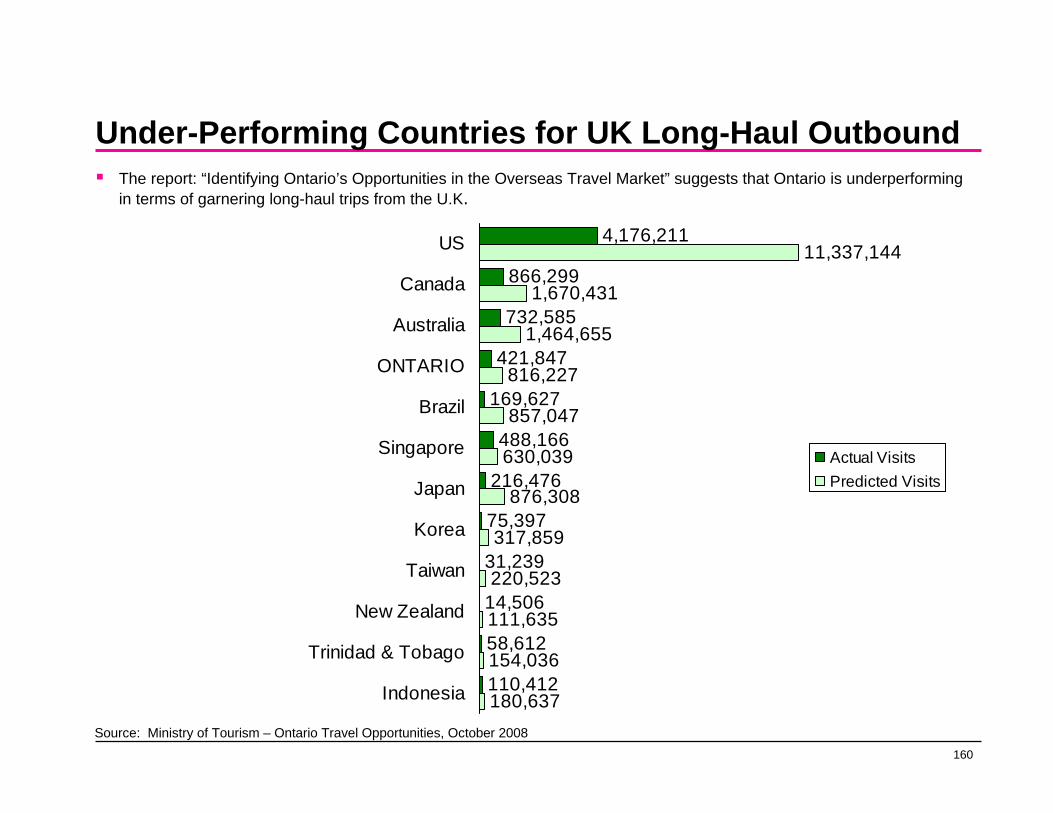
160
Under-Performing Countries for UK Long-Haul OutboundThe report: “Identifying Ontario’s Opportunities in the Overseas Travel Market” suggests that Ontario is underperforming in terms of garnering long-haul trips from the U.K.
4,176,211
866,299
732,585
421,847
169,627
488,166
216,476
75,397
31,239
14,506
58,612
110,412
11,337,144
1,670,431
1,464,655
816,227
857,047
630,039
876,308
317,859
220,523
111,635
154,036
180,637
US
Canada
Australia
ONTARIO
Brazil
Singapore
Japan
Korea
Taiwan
New Zealand
Trinidad & Tobago
Indonesia
Actual VisitsPredicted Visits
Source: Ministry of Tourism – Ontario Travel Opportunities, October 2008
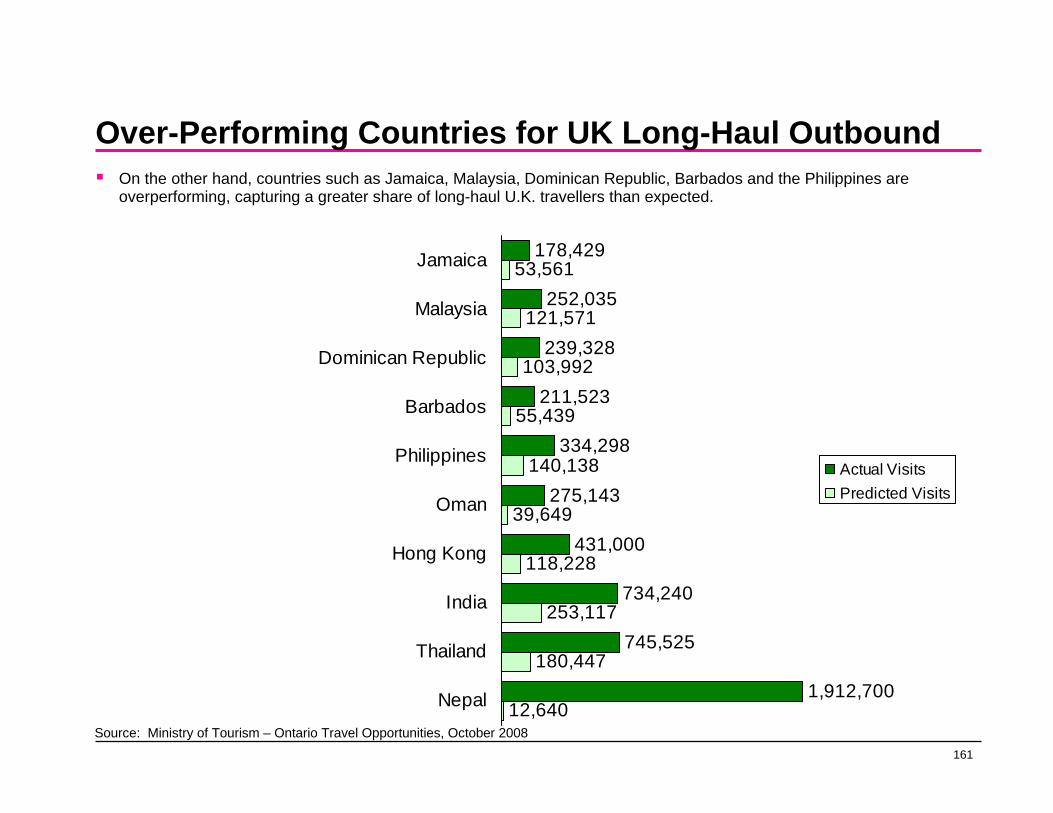
161
Over-Performing Countries for UK Long-Haul OutboundOn the other hand, countries such as Jamaica, Malaysia, Dominican Republic, Barbados and the Philippines are overperforming, capturing a greater share of long-haul U.K. travellers than expected.
178,429
252,035
239,328
211,523
334,298
275,143
431,000
734,240
745,525
1,912,700
53,561
121,571
103,992
55,439
140,138
39,649
118,228
253,117
180,447
12,640
Jamaica
Malaysia
Dominican Republic
Barbados
Philippines
Oman
Hong Kong
India
Thailand
Nepal
Actual VisitsPredicted Visits
Source: Ministry of Tourism – Ontario Travel Opportunities, October 2008
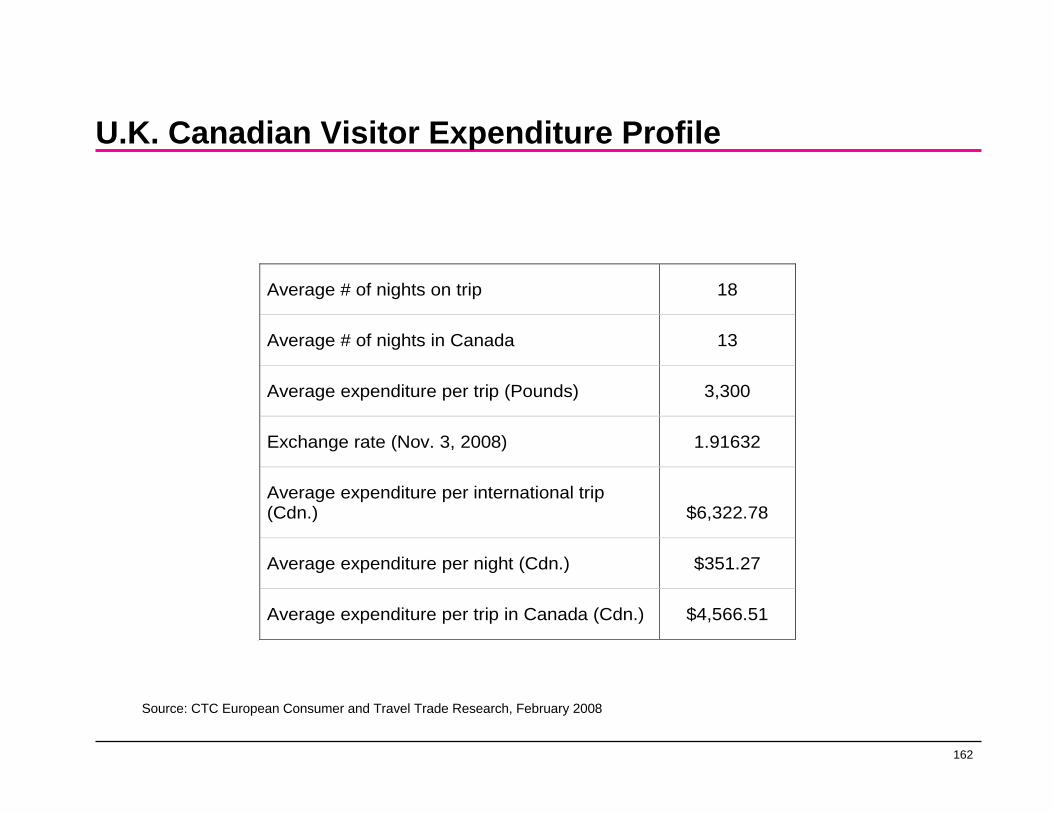
162
U.K. Canadian Visitor Expenditure Profile
Average # of nights on trip 18
Average # of nights in Canada 13
Average expenditure per trip (Pounds) 3,300
Exchange rate (Nov. 3, 2008) 1.91632
Average expenditure per international trip (Cdn.) $6,322.78
Average expenditure per night (Cdn.) $351.27
Average expenditure per trip in Canada (Cdn.) $4,566.51 11
Source: CTC European Consumer and Travel Trade Research, February 2008

163
France
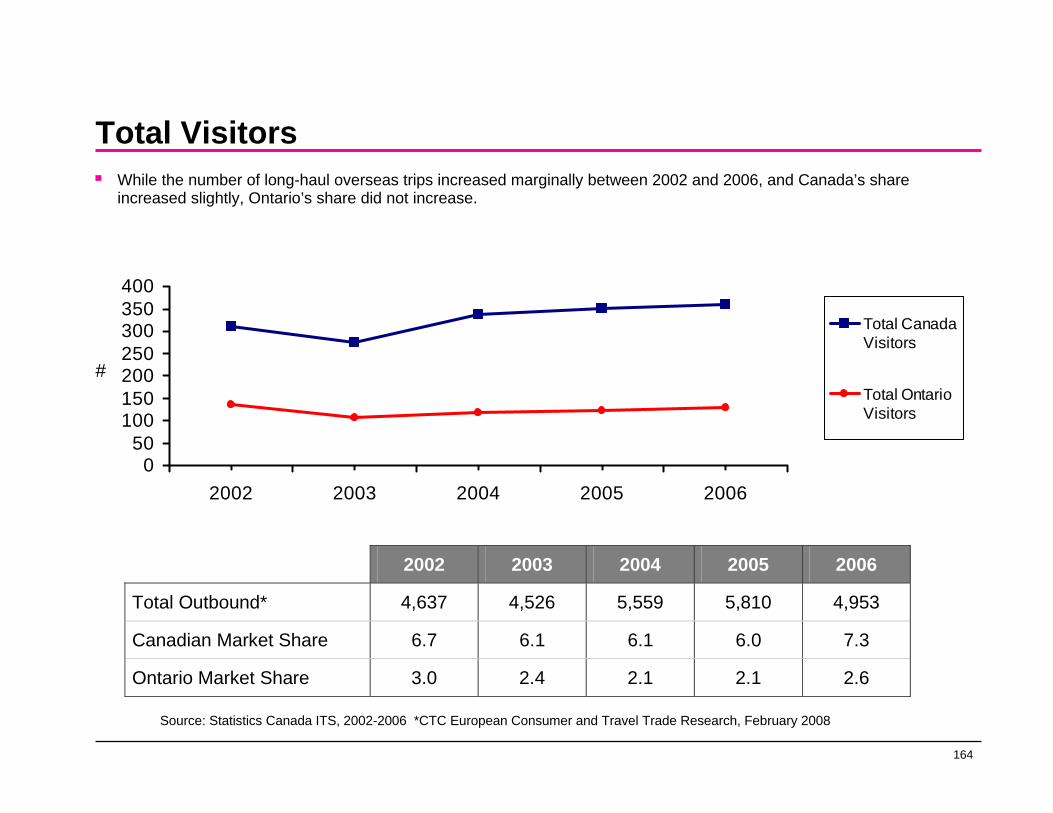
164
Total Visitors
050
100150200250300350400
2002 2003 2004 2005 2006
#
Total Canada Visitors
Total OntarioVisitors
2002 2003 2004 2005 2006
Total Outbound* 4,637 4,526 5,559 5,810 4,953
Canadian Market Share 6.7 6.1 6.1 6.0 7.3
Ontario Market Share 3.0 2.4 2.1 2.1 2.6
Source: Statistics Canada ITS, 2002-2006 *CTC European Consumer and Travel Trade Research, February 2008
While the number of long-haul overseas trips increased marginally between 2002 and 2006, and Canada’s share increased slightly, Ontario’s share did not increase.
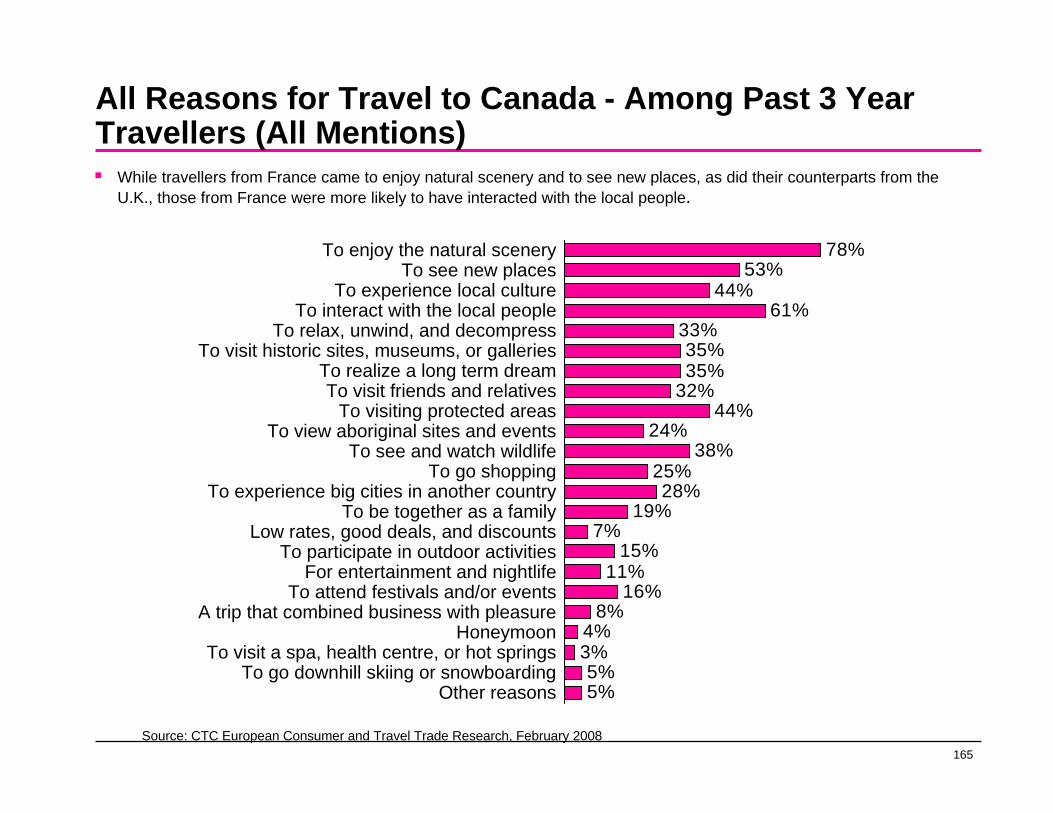
165
All Reasons for Travel to Canada - Among Past 3 Year Travellers (All Mentions)
78%53%
44%61%
33%35%35%
32%44%
24%38%
25%28%
19%7%
15%11%
16%8%
4%3%5%5%
To enjoy the natural sceneryTo see new places
To experience local cultureTo interact with the local people
To relax, unwind, and decompressTo visit historic sites, museums, or galleries
To realize a long term dreamTo visit friends and relatives
To visiting protected areasTo view aboriginal sites and events
To see and watch wildlifeTo go shopping
To experience big cities in another countryTo be together as a family
Low rates, good deals, and discountsTo participate in outdoor activities
For entertainment and nightlifeTo attend festivals and/or events
A trip that combined business with pleasureHoneymoon
To visit a spa, health centre, or hot springsTo go downhill skiing or snowboarding
Other reasons
Source: CTC European Consumer and Travel Trade Research, February 2008
While travellers from France came to enjoy natural scenery and to see new places, as did their counterparts from the U.K., those from France were more likely to have interacted with the local people.
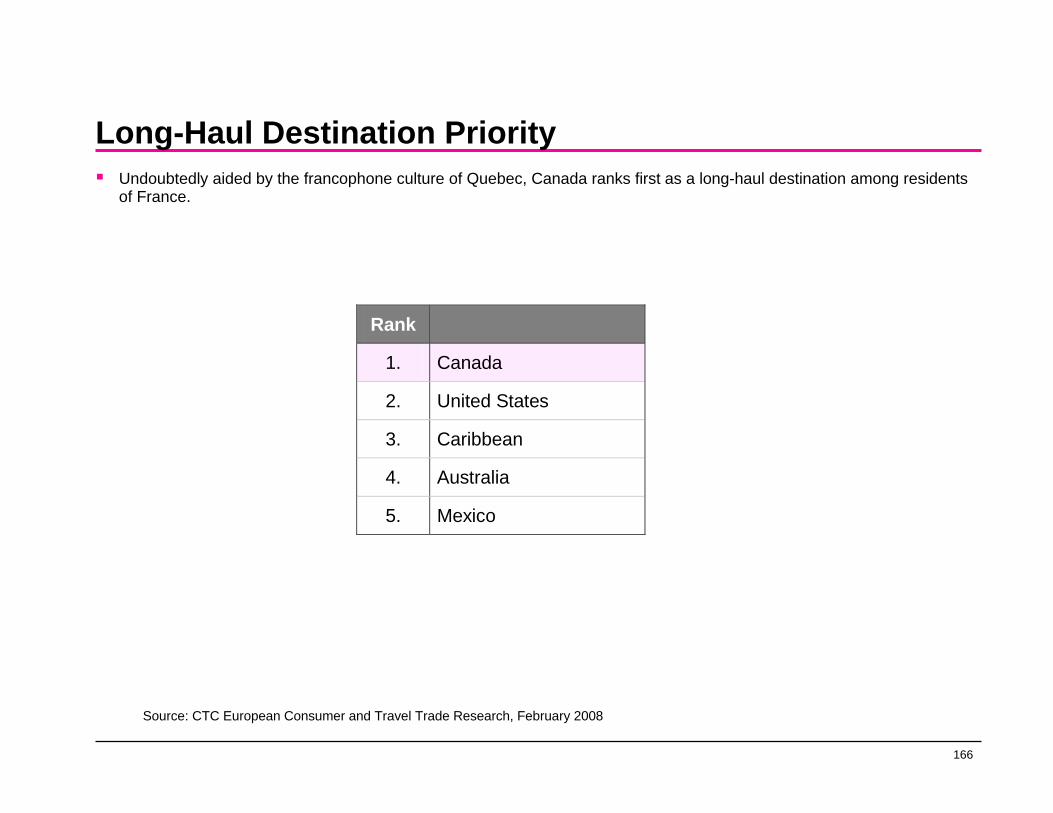
166
Long-Haul Destination PriorityUndoubtedly aided by the francophone culture of Quebec, Canada ranks first as a long-haul destination among residents of France.
Rank
1. Canada
2. United States
3. Caribbean
4. Australia
5. Mexico
Source: CTC European Consumer and Travel Trade Research, February 2008

167
Canada’s Priority Ranking Key Segment
Canada’s Priority Ranking
Segment:
Overall 1st
Repeat travellers (travelled to Canada in past 3 years) 2nd
Friends and relatives in Canada 2nd 11
Canada ranks first overall, and second for repeat travellers and those visiting friends and relatives.
Source: CTC European Consumer and Travel Trade Research, February 2008
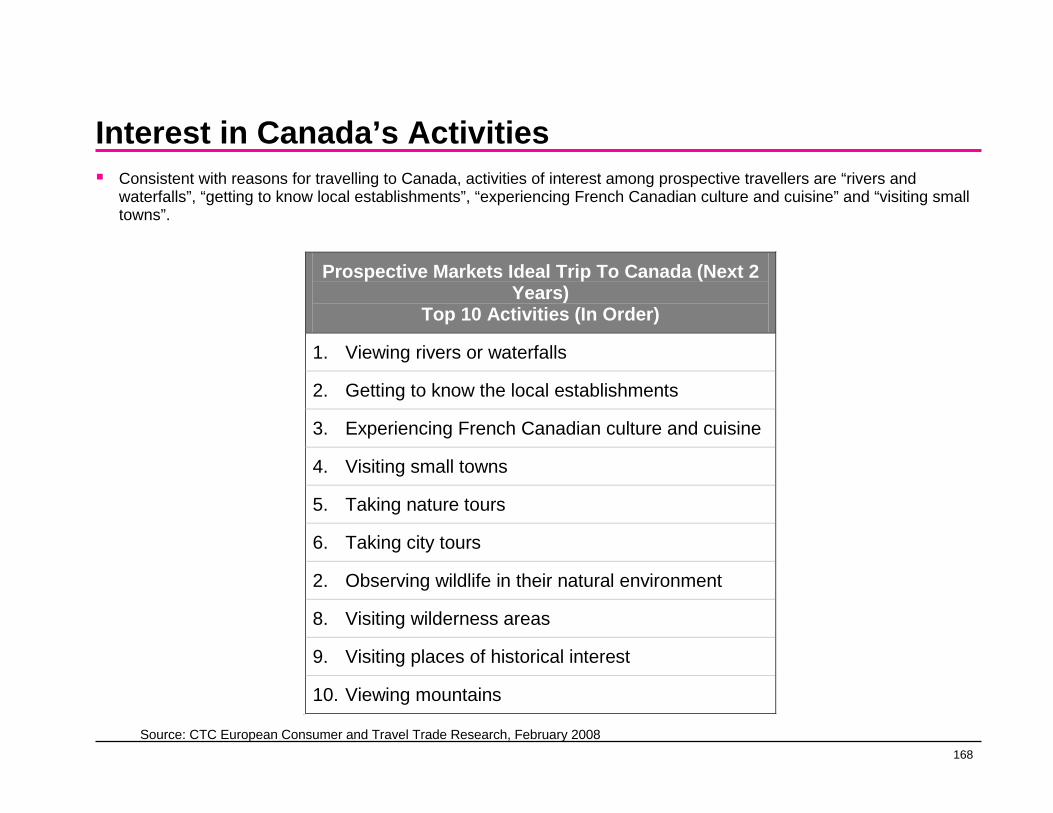
168
Interest in Canada’s ActivitiesConsistent with reasons for travelling to Canada, activities of interest among prospective travellers are “rivers and waterfalls”, “getting to know local establishments”, “experiencing French Canadian culture and cuisine” and “visiting small towns”.
Prospective Markets Ideal Trip To Canada (Next 2 Years)
Top 10 Activities (In Order)
1. Viewing rivers or waterfalls
2. Getting to know the local establishments
3. Experiencing French Canadian culture and cuisine
4. Visiting small towns
5. Taking nature tours
6. Taking city tours
2. Observing wildlife in their natural environment
8. Visiting wilderness areas
9. Visiting places of historical interest
10. Viewing mountains 11
Source: CTC European Consumer and Travel Trade Research, February 2008
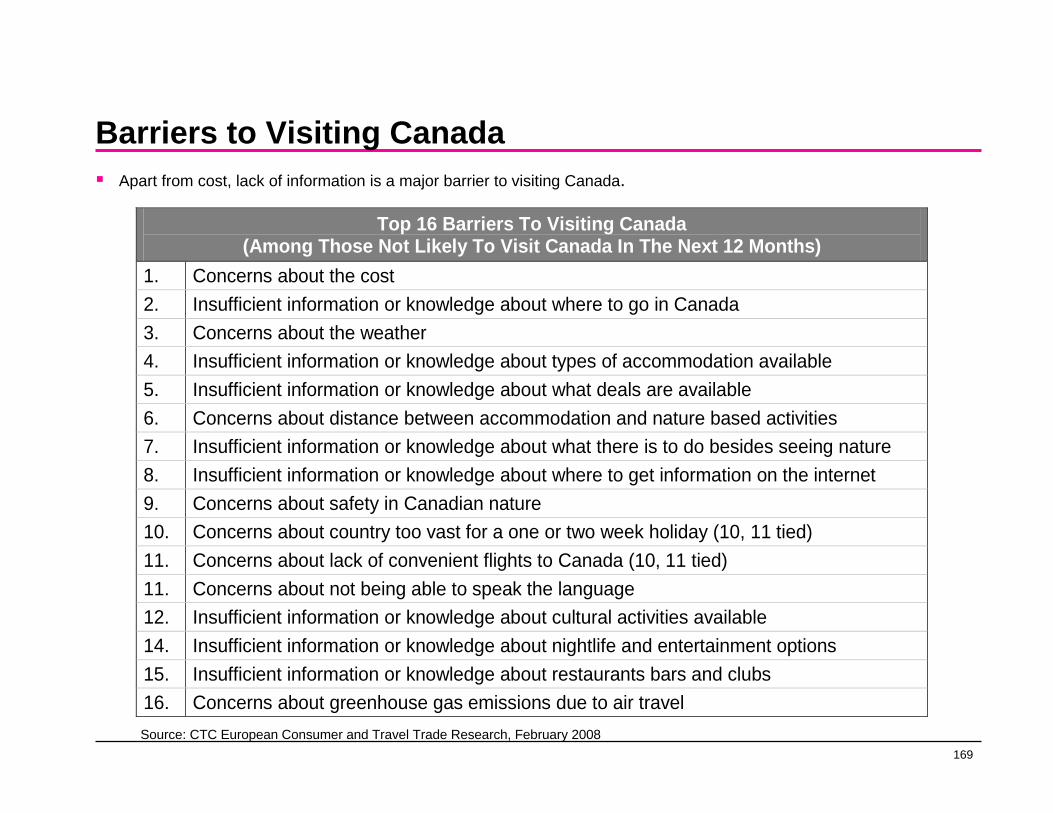
169
Barriers to Visiting Canada
Top 16 Barriers To Visiting Canada (Among Those Not Likely To Visit Canada In The Next 12 Months)
1. Concerns about the cost 2. Insufficient information or knowledge about where to go in Canada 3. Concerns about the weather 4. Insufficient information or knowledge about types of accommodation available 5. Insufficient information or knowledge about what deals are available 6. Concerns about distance between accommodation and nature based activities 7. Insufficient information or knowledge about what there is to do besides seeing nature 8. Insufficient information or knowledge about where to get information on the internet 9. Concerns about safety in Canadian nature 10. Concerns about country too vast for a one or two week holiday (10, 11 tied) 11. Concerns about lack of convenient flights to Canada (10, 11 tied) 11. Concerns about not being able to speak the language 12. Insufficient information or knowledge about cultural activities available 14. Insufficient information or knowledge about nightlife and entertainment options 15. Insufficient information or knowledge about restaurants bars and clubs 16. Concerns about greenhouse gas emissions due to air travel
Apart from cost, lack of information is a major barrier to visiting Canada.
Source: CTC European Consumer and Travel Trade Research, February 2008

170
Destinations Visited in Past 3 Years
45%
33%
30%
28%
20%
19%
19%
16%
15%
13%
12%
12%
11%
11%
Western Europe (Net)
Africa (Net)
Asia (Net)
North America (Net)
Caribbean
United States
Spain
South/Central America
Italy
Morocco
UK
Canada
Tunisia
Turkey
Source: CTC European Consumer and Travel Trade Research, February 2008
Not surprisingly given the common language, one in three travellers from France have visited Africa in the past 3 years, about the same proportion that has visited Asia.
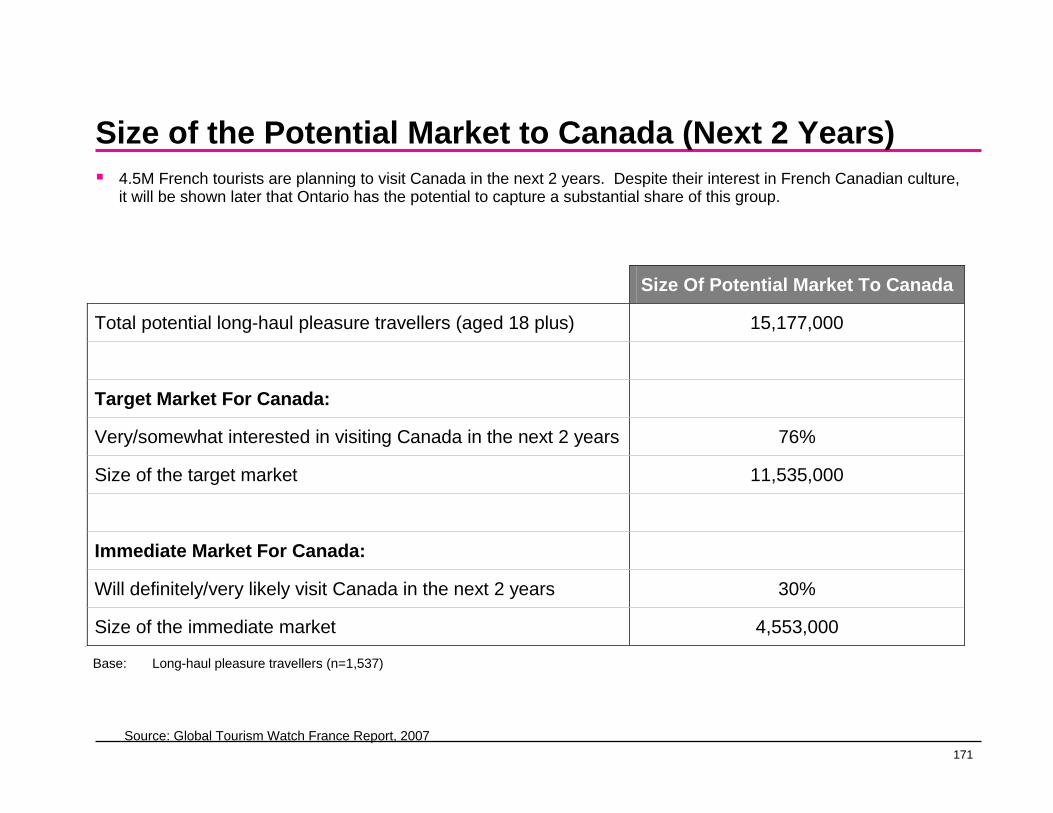
171
Size of the Potential Market to Canada (Next 2 Years)4.5M French tourists are planning to visit Canada in the next 2 years. Despite their interest in French Canadian culture, it will be shown later that Ontario has the potential to capture a substantial share of this group.
Base: Long-haul pleasure travellers (n=1,537)
Size Of Potential Market To Canada
Total potential long-haul pleasure travellers (aged 18 plus) 15,177,000
Target Market For Canada:
Very/somewhat interested in visiting Canada in the next 2 years 76%
Size of the target market 11,535,000
Immediate Market For Canada:
Will definitely/very likely visit Canada in the next 2 years 30%
Size of the immediate market 4,553,000 11
Source: Global Tourism Watch France Report, 2007
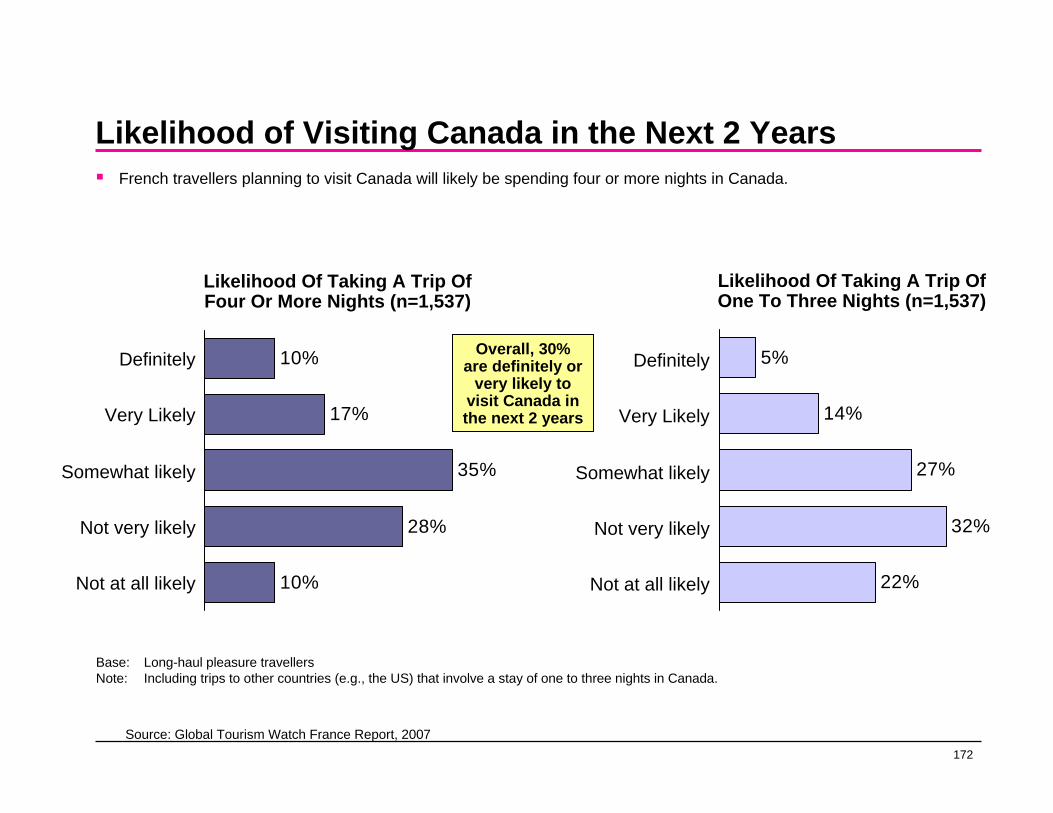
172
Likelihood of Visiting Canada in the Next 2 Years
10%
17%
35%
28%
10%
French travellers planning to visit Canada will likely be spending four or more nights in Canada.
Likelihood Of Taking A Trip Of Four Or More Nights (n=1,537)
Likelihood Of Taking A Trip Of One To Three Nights (n=1,537)
Definitely
Very Likely
Somewhat likely
Not very likely
Not at all likely
5%
14%
27%
32%
22%
Definitely
Very Likely
Somewhat likely
Not very likely
Not at all likely
Overall, 30% are definitely or
very likely to visit Canada in the next 2 years
Base: Long-haul pleasure travellersNote: Including trips to other countries (e.g., the US) that involve a stay of one to three nights in Canada.
Source: Global Tourism Watch France Report, 2007

173
Market Potential for the Provinces
BC MB ON ATL NORTH
Size of immediate market to Canada 4,553,000
Likely to visit province 67% 21% 84% 50% 30%
Size of immediate market for the provinces 3,051,000
956,000 3,825,000 2,277,000 1,366,000
11
Next to Quebec, Ontario stands to capture a large share of French travellers to Canada.
Base: Long-haul pleasure travellers (n=1,537)Note: Provincial estimates are not additive since travellers may visit more than one province on a single trip.
Source: Global Tourism Watch France Report, 2007
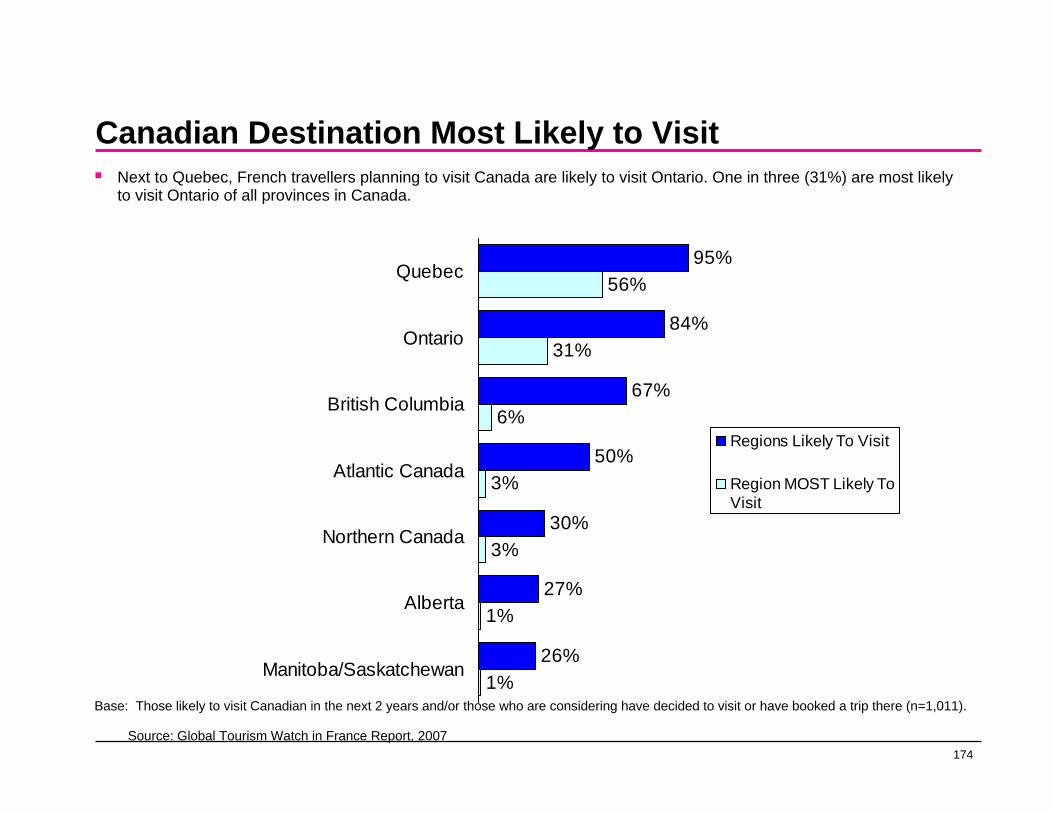
174
Canadian Destination Most Likely to Visit
95%
84%
67%
50%
30%
27%
26%
56%
31%
6%
3%
3%
1%
1%
Quebec
Ontario
British Columbia
Atlantic Canada
Northern Canada
Alberta
Manitoba/Saskatchewan
Regions Likely To Visit
Region MOST Likely ToVisit
Base: Those likely to visit Canadian in the next 2 years and/or those who are considering have decided to visit or have booked a trip there (n=1,011).
Source: Global Tourism Watch in France Report, 2007
Next to Quebec, French travellers planning to visit Canada are likely to visit Ontario. One in three (31%) are most likely to visit Ontario of all provinces in Canada.

175
Under-Performing Countries for France Long-Haul Outbound
French travellers are not visiting the U.S. to the extent that they might, which is also the case among travellers from the U.K.
789,815
117,785
47,111
20,231
275,913
175,345
9,396
67,379
2,674
23,487
1,542,838
371,780
151,176
96,721
321,936
217,878
45,196
100,615
25,473
41,520
US
Japan
Korea
Taiwan
Brazil
India
Pakistan
Australia
Bangladesh
Venezuela
Actual VisitsPredicted Visits
Source: Ministry of Tourism – Ontario Travel Opportunities, October 2008
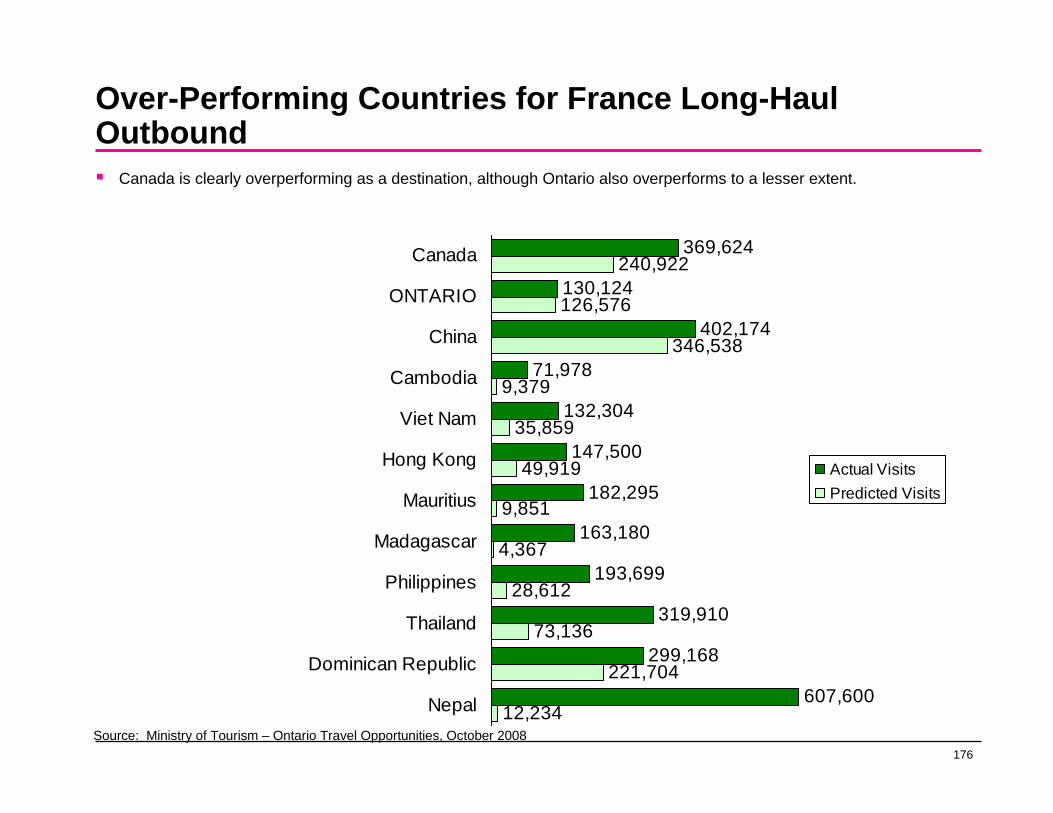
176
Over-Performing Countries for France Long-Haul Outbound
Canada is clearly overperforming as a destination, although Ontario also overperforms to a lesser extent.
369,624
130,124
402,174
71,978
132,304
147,500
182,295
163,180
193,699
319,910
299,168
607,600
240,922
126,576
346,538
9,379
35,859
49,919
9,851
4,367
28,612
73,136
221,704
12,234
Canada
ONTARIO
China
Cambodia
Viet Nam
Hong Kong
Mauritius
Madagascar
Philippines
Thailand
Dominican Republic
Nepal
Actual VisitsPredicted Visits
Source: Ministry of Tourism – Ontario Travel Opportunities, October 2008

177
France - Canadian Visitor Expenditure Profile
Average # of nights on trip 21
Average # of nights in Canada 16
Average expenditure per trip (Euros) 4,400
Exchange rate (Nov. 3, 2008) 1.51860
Average expenditure per international trip (Cdn.) $6,683.90
Average expenditure per night (Cdn.) $318.28
Average expenditure per trip in Canada (Cdn.) $5,092.48 11
Source: CTC European Consumer and Travel Trade Research, February 2008

178
Germany
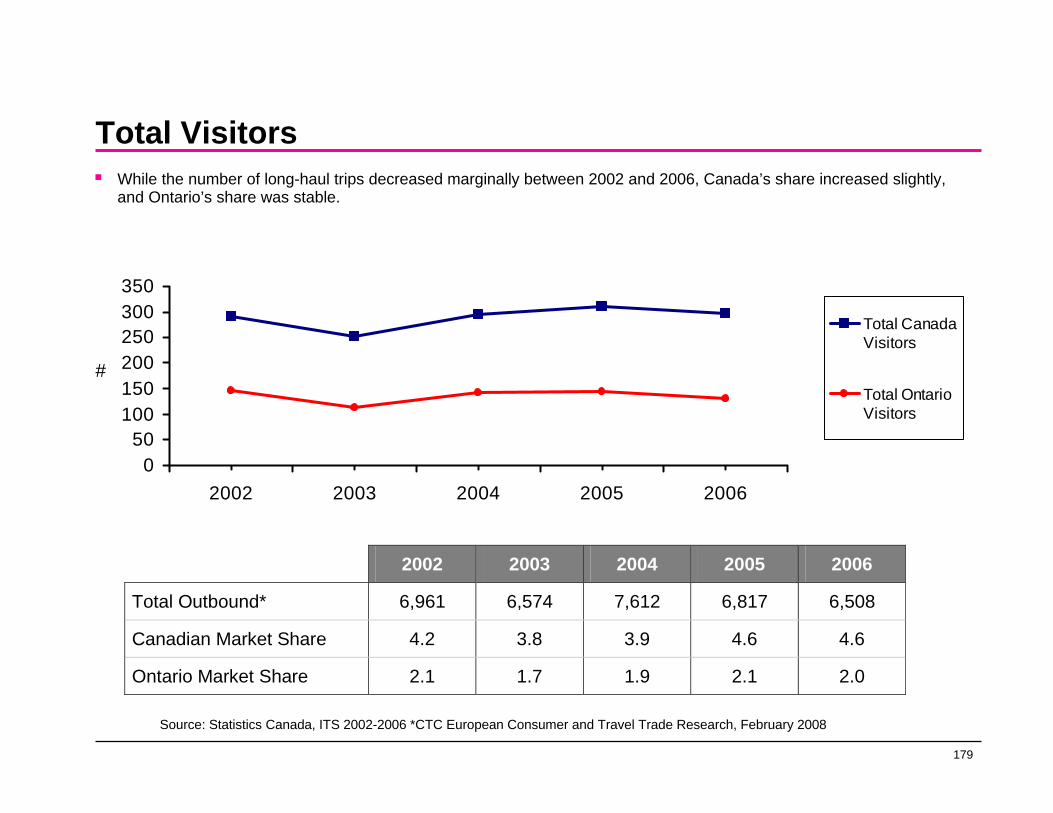
179
Total Visitors
050
100150200250300350
2002 2003 2004 2005 2006
#
Total Canada Visitors
Total OntarioVisitors
2002 2003 2004 2005 2006
Total Outbound* 6,961 6,574 7,612 6,817 6,508
Canadian Market Share 4.2 3.8 3.9 4.6 4.6
Ontario Market Share 2.1 1.7 1.9 2.1 2.0
Source: Statistics Canada, ITS 2002-2006 *CTC European Consumer and Travel Trade Research, February 2008
While the number of long-haul trips decreased marginally between 2002 and 2006, Canada’s share increased slightly, and Ontario’s share was stable.
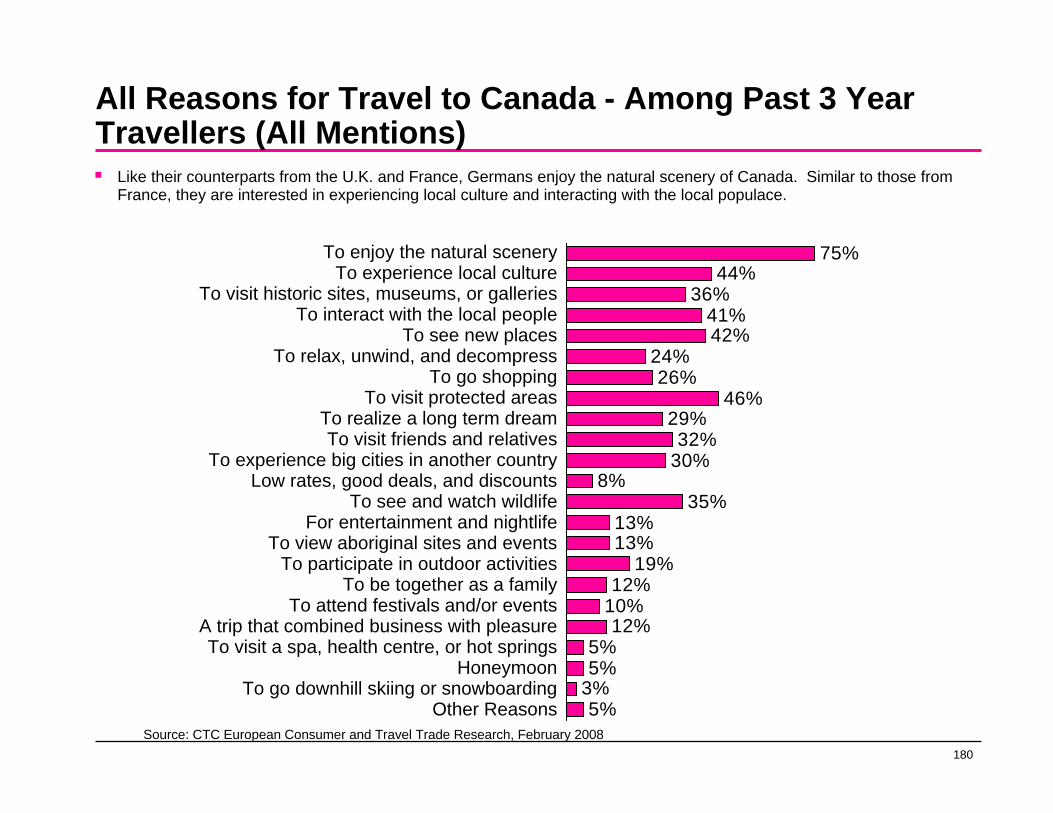
180
All Reasons for Travel to Canada - Among Past 3 Year Travellers (All Mentions)
75%44%
36%41%42%
24%26%
46%29%32%
30%8%
35%13%13%
19%12%
10%12%
5%5%
3%5%
To enjoy the natural sceneryTo experience local culture
To visit historic sites, museums, or galleriesTo interact with the local people
To see new placesTo relax, unwind, and decompress
To go shoppingTo visit protected areas
To realize a long term dreamTo visit friends and relatives
To experience big cities in another countryLow rates, good deals, and discounts
To see and watch wildlifeFor entertainment and nightlife
To view aboriginal sites and eventsTo participate in outdoor activities
To be together as a familyTo attend festivals and/or events
A trip that combined business with pleasureTo visit a spa, health centre, or hot springs
HoneymoonTo go downhill skiing or snowboarding
Other ReasonsSource: CTC European Consumer and Travel Trade Research, February 2008
Like their counterparts from the U.K. and France, Germans enjoy the natural scenery of Canada. Similar to those from France, they are interested in experiencing local culture and interacting with the local populace.

181
Long-Haul Destination PriorityGermans rank Canada 5th, overall, as a long-haul destination priority.
Rank
1. United States
2. Caribbean
3. Turkey
4. Australia
5. Canada
6. Thailand
7. New Zealand
Source: CTC European Consumer and Travel Trade Research, February 2008

182
Canada’s Priority Ranking Key Segment
Canada’s Priority Ranking
Segment:
Overall 5th
Repeat travellers (travelled to Canada in past 3 years) 1st
Friends and relatives in Canada 2nd 11
While Germans rank Canada lower, overall, than travellers from the U.K. or France, those who have actually visited Canada had a positive experience and rank Canada first.
Source: CTC European Consumer and Travel Trade Research, February 2008
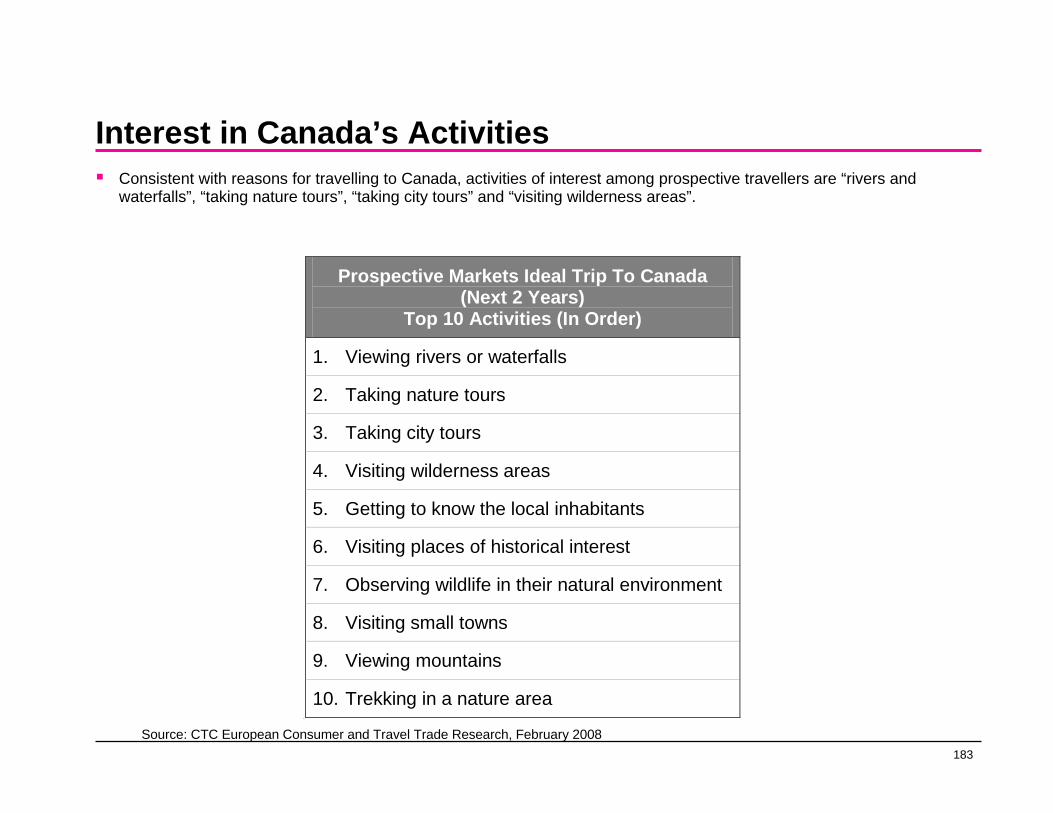
183
Interest in Canada’s ActivitiesConsistent with reasons for travelling to Canada, activities of interest among prospective travellers are “rivers and waterfalls”, “taking nature tours”, “taking city tours” and “visiting wilderness areas”.
Prospective Markets Ideal Trip To Canada (Next 2 Years)
Top 10 Activities (In Order)
1. Viewing rivers or waterfalls
2. Taking nature tours
3. Taking city tours
4. Visiting wilderness areas
5. Getting to know the local inhabitants
6. Visiting places of historical interest
7. Observing wildlife in their natural environment
8. Visiting small towns
9. Viewing mountains
10. Trekking in a nature area 11
Source: CTC European Consumer and Travel Trade Research, February 2008

184
Barriers to Visiting Canada
Top 16 Barriers To Visiting Canada (Among Those Not Likely To Visit Canada In The Next 12 Months)
1. Concerns about the cost 2. Concerns about country too vast for a one or two week holiday 3. Insufficient information or knowledge about where to go in Canada 4. Insufficient information or knowledge about what deals are available (4, 5, 6 tied) 5. Insufficient information or knowledge about types of accommodation available (4, 5, 6 tied) 6. Insufficient information or knowledge about what there is to do besides seeing nature (4, 5, 6 tied) 7. Concerns about lack of convenient flights to Canada 8. Insufficient information or knowledge about where to get information on the internet (8, 9 tied) 9. Concerns about not being able to speak the language (8, 9 tied) 10. Concerns about distance between accommodation and nature based activities (10, 11 tied) 11. Insufficient information or knowledge about cultural activities available (10, 11 tied) 12. Insufficient information or knowledge about restaurants bars and clubs (12, 13 tied) 13. Insufficient information or knowledge about nightlife and entertainment options (12, 13 tied) 14. Concerns about the weather (14, 15 tied) 15. Concerns about safety in Canadian nature (14, 15 tied) 16. Concerns about greenhouse gas emissions due to air travel
Consistent with their counterparts from the U.K. and France, Germans are concerned about costs and lack of information.
Source: CTC European Consumer and Travel Trade Research, February 2008

185
Destinations Visited in Past 3 Years
59%39%
37%34%33%33%
30%29%29%
27%27%
23%19%
16%16%15%15%15%14%14%13%12%12%11%10%10%9%9%9%8%
Western Europe (Net)Middle East (Net)
North America (Net)Asia (Net)
TurkeyUnited States
Eastern Europe (Net)Africa (Net)
AustriaSpain
ItalyFrance
UKGreece
SwitzerlandNetherlands
ThailandCheck Republican
EgyptSouth/Central
PacificTunisia
CaribbeanRussia
HungaryPoland
CanadaAustraliaPortugal
ChinaSource: CTC European Consumer and Travel Trade Research, February 2008
Germans are widely travelled and are as likely to have visited the Middle East as North America or Asia.
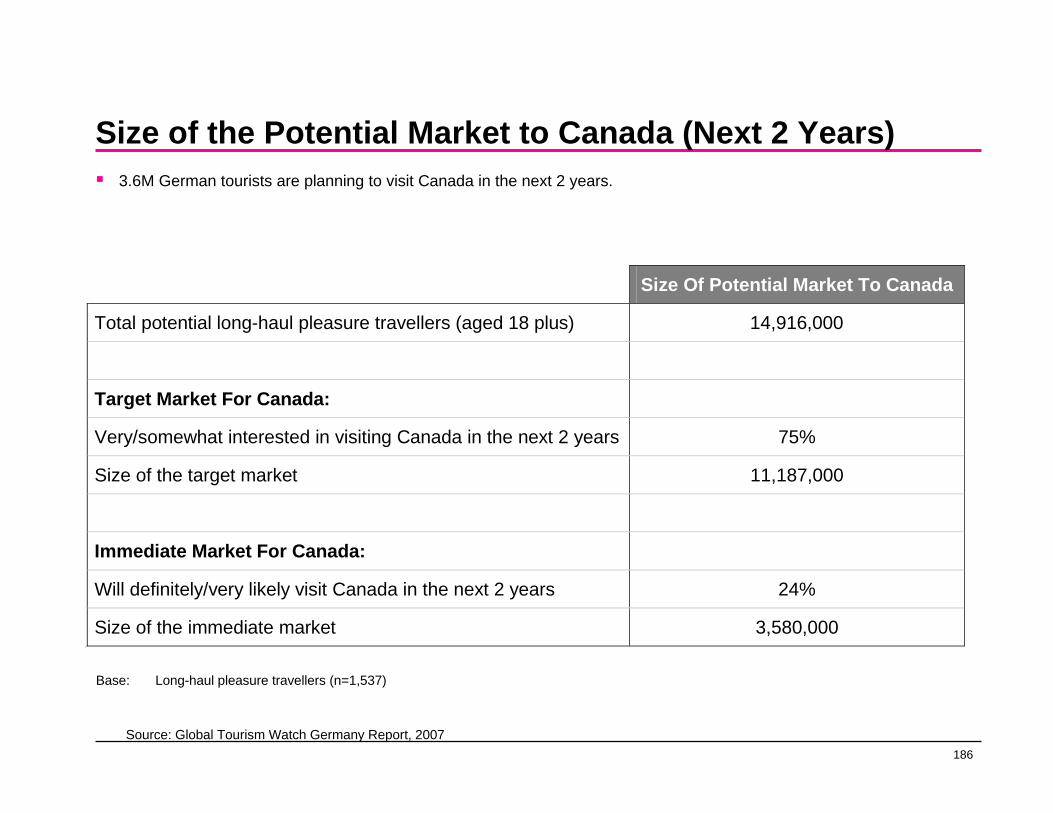
186
Size of the Potential Market to Canada (Next 2 Years)3.6M German tourists are planning to visit Canada in the next 2 years.
Base: Long-haul pleasure travellers (n=1,537)
Size Of Potential Market To Canada
Total potential long-haul pleasure travellers (aged 18 plus) 14,916,000
Target Market For Canada:
Very/somewhat interested in visiting Canada in the next 2 years 75%
Size of the target market 11,187,000
Immediate Market For Canada:
Will definitely/very likely visit Canada in the next 2 years 24%
Size of the immediate market 3,580,000 11
Source: Global Tourism Watch Germany Report, 2007
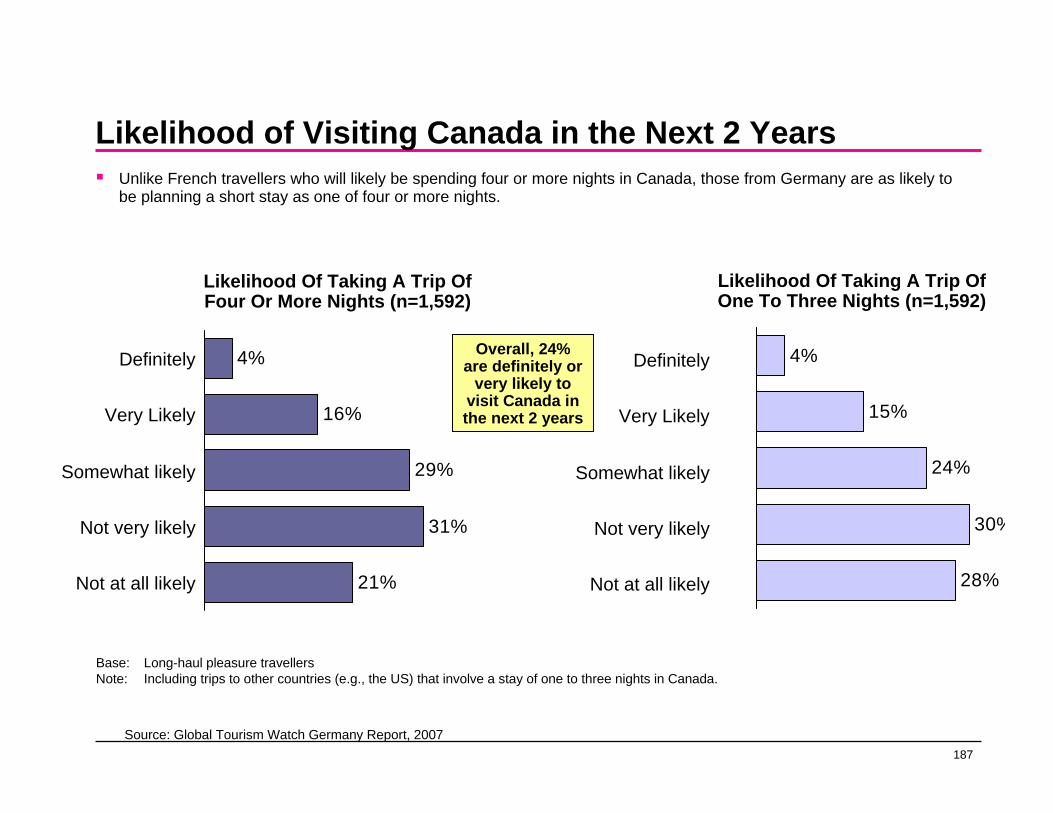
187
Likelihood of Visiting Canada in the Next 2 Years
4%
16%
29%
31%
21%
Unlike French travellers who will likely be spending four or more nights in Canada, those from Germany are as likely to be planning a short stay as one of four or more nights.
Likelihood Of Taking A Trip Of Four Or More Nights (n=1,592)
Likelihood Of Taking A Trip Of One To Three Nights (n=1,592)
Definitely
Very Likely
Somewhat likely
Not very likely
Not at all likely
4%
15%
24%
30%
28%
Definitely
Very Likely
Somewhat likely
Not very likely
Not at all likely
Overall, 24% are definitely or
very likely to visit Canada in the next 2 years
Base: Long-haul pleasure travellersNote: Including trips to other countries (e.g., the US) that involve a stay of one to three nights in Canada.
Source: Global Tourism Watch Germany Report, 2007
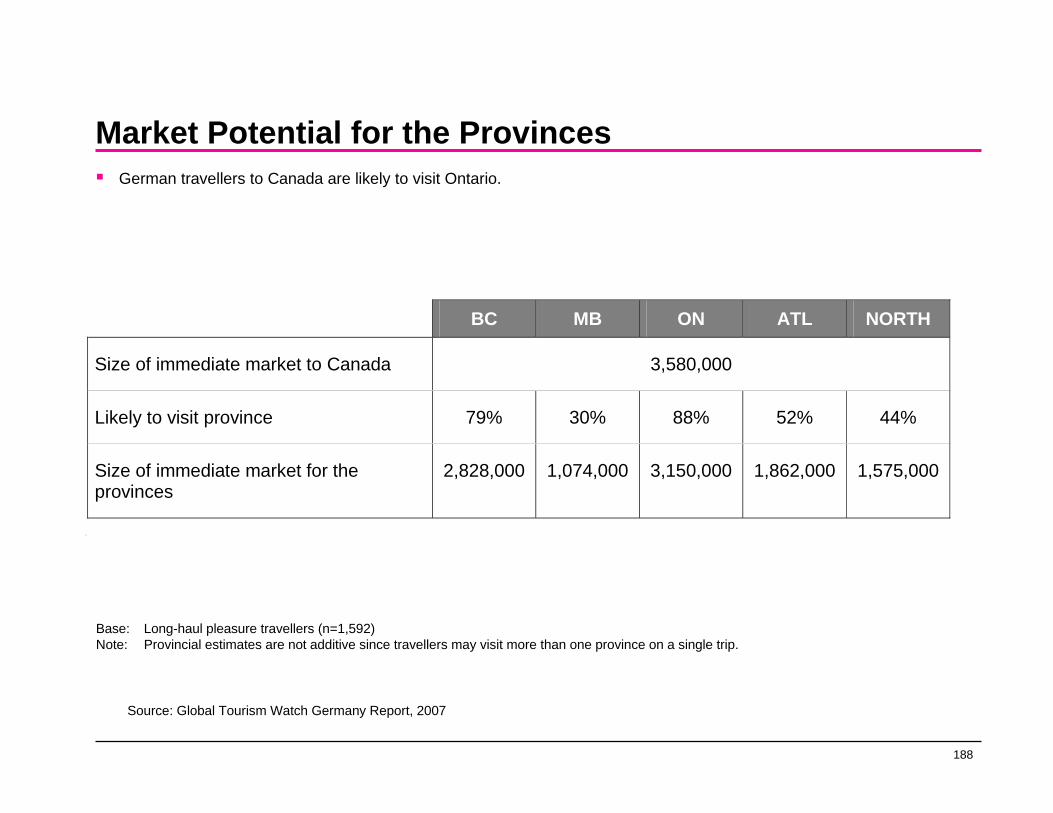
188
Market Potential for the Provinces
BC MB ON ATL NORTH
Size of immediate market to Canada 3,580,000
Likely to visit province 79% 30% 88% 52% 44%
Size of immediate market for the provinces
2,828,000 1,074,000 3,150,000 1,862,000 1,575,000
11
German travellers to Canada are likely to visit Ontario.
Base: Long-haul pleasure travellers (n=1,592)Note: Provincial estimates are not additive since travellers may visit more than one province on a single trip.
Source: Global Tourism Watch Germany Report, 2007
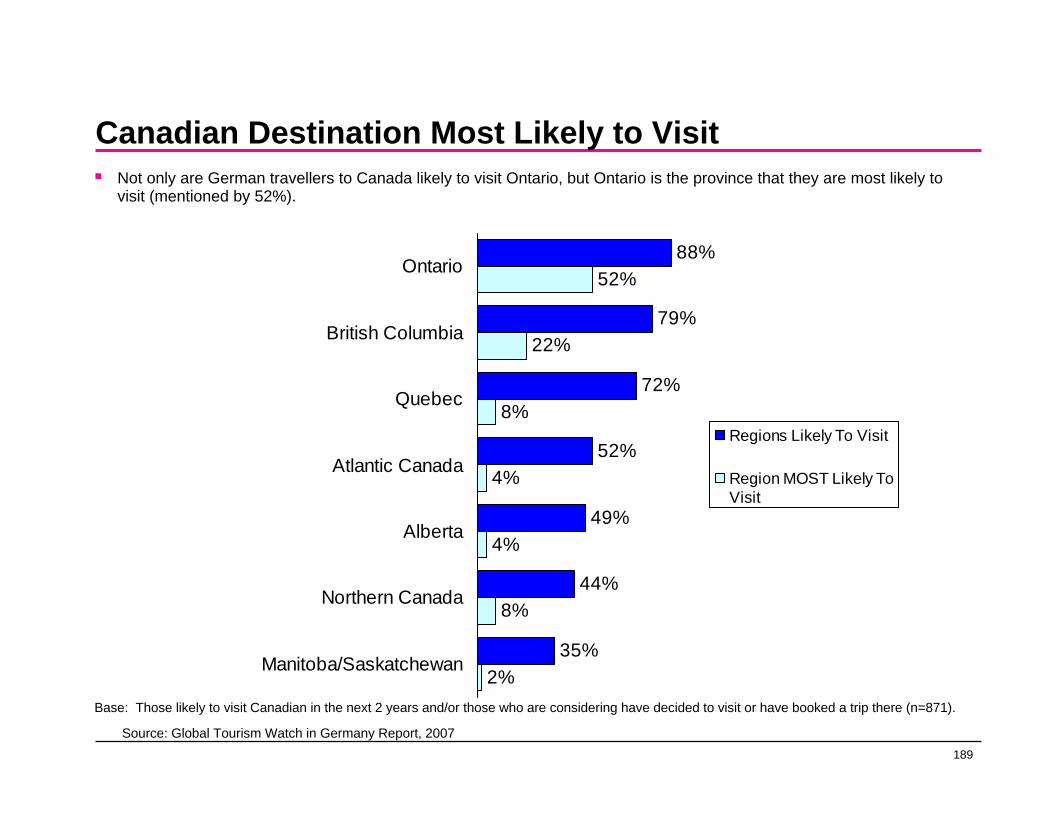
189
Canadian Destination Most Likely to Visit
88%
79%
72%
52%
49%
44%
35%
52%
22%
8%
4%
4%
8%
2%
Ontario
British Columbia
Quebec
Atlantic Canada
Alberta
Northern Canada
Manitoba/Saskatchewan
Regions Likely To Visit
Region MOST Likely ToVisit
Base: Those likely to visit Canadian in the next 2 years and/or those who are considering have decided to visit or have booked a trip there (n=871).
Source: Global Tourism Watch in Germany Report, 2007
Not only are German travellers to Canada likely to visit Ontario, but Ontario is the province that they are most likely to visit (mentioned by 52%).
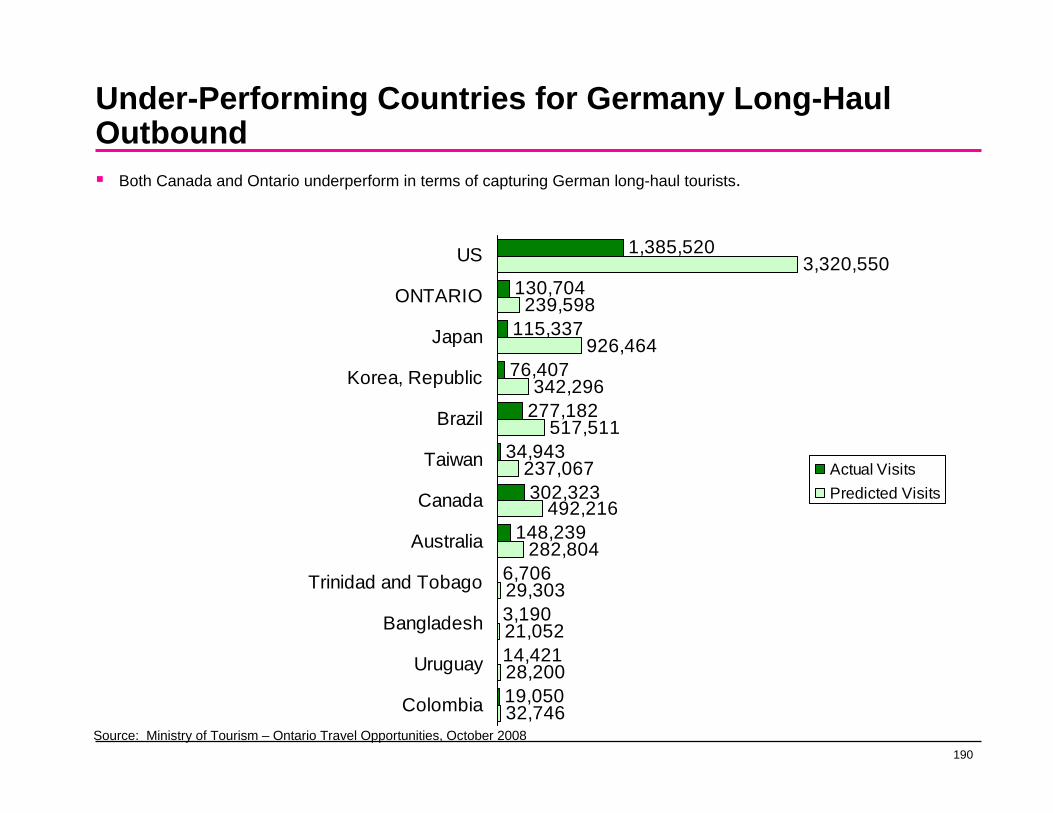
190
Under-Performing Countries for Germany Long-Haul Outbound
Both Canada and Ontario underperform in terms of capturing German long-haul tourists.
1,385,520
130,704
115,337
76,407
277,182
34,943
302,323
148,239
6,706
3,190
14,421
19,050
3,320,550
239,598
926,464
342,296
517,511
237,067
492,216
282,804
29,303
21,052
28,200
32,746
US
ONTARIO
Japan
Korea, Republic
Brazil
Taiwan
Canada
Australia
Trinidad and Tobago
Bangladesh
Uruguay
Colombia
Actual VisitsPredicted Visits
Source: Ministry of Tourism – Ontario Travel Opportunities, October 2008

191
Over-Performing Countries for Germany Long-Haul Outbound
Thailand, the Dominican Republic and South Africa greatly overperform as destinations for German long-haul travel.
76,745
162,800
47,402
57,251
68,214
70,830
500,567
258,517
223,715
507,942
46,129
130,182
12,596
18,555
8,257
2,656
429,698
140,450
64,205
99,737
Vietnam
Hong Kong
Sri Lanka
Mauritius
Namibia
Maldives
China
South Africa
Dominican Republic
Thailand
Actual VisitsPredicted Visits
Source: Ministry of Tourism – Ontario Travel Opportunities, October 2008
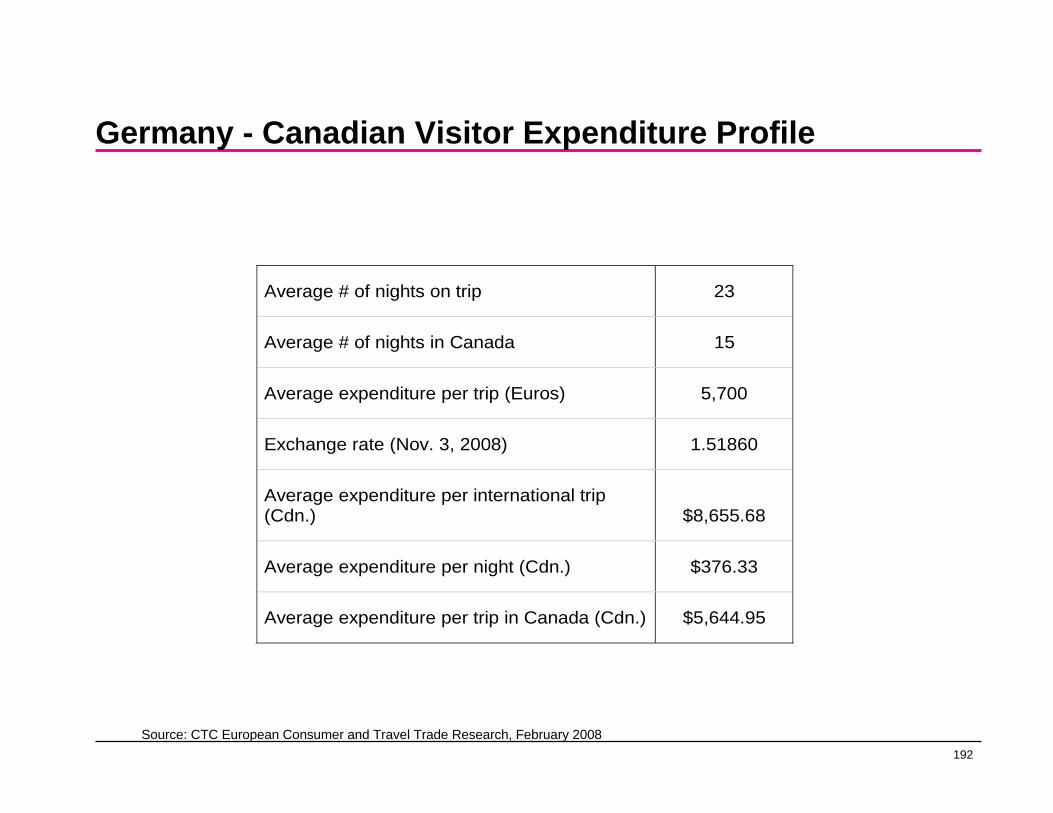
192
Germany - Canadian Visitor Expenditure Profile
Average # of nights on trip 23
Average # of nights in Canada 15
Average expenditure per trip (Euros) 5,700
Exchange rate (Nov. 3, 2008) 1.51860
Average expenditure per international trip (Cdn.) $8,655.68
Average expenditure per night (Cdn.) $376.33
Average expenditure per trip in Canada (Cdn.) $5,644.95 11
Source: CTC European Consumer and Travel Trade Research, February 2008
193
South America
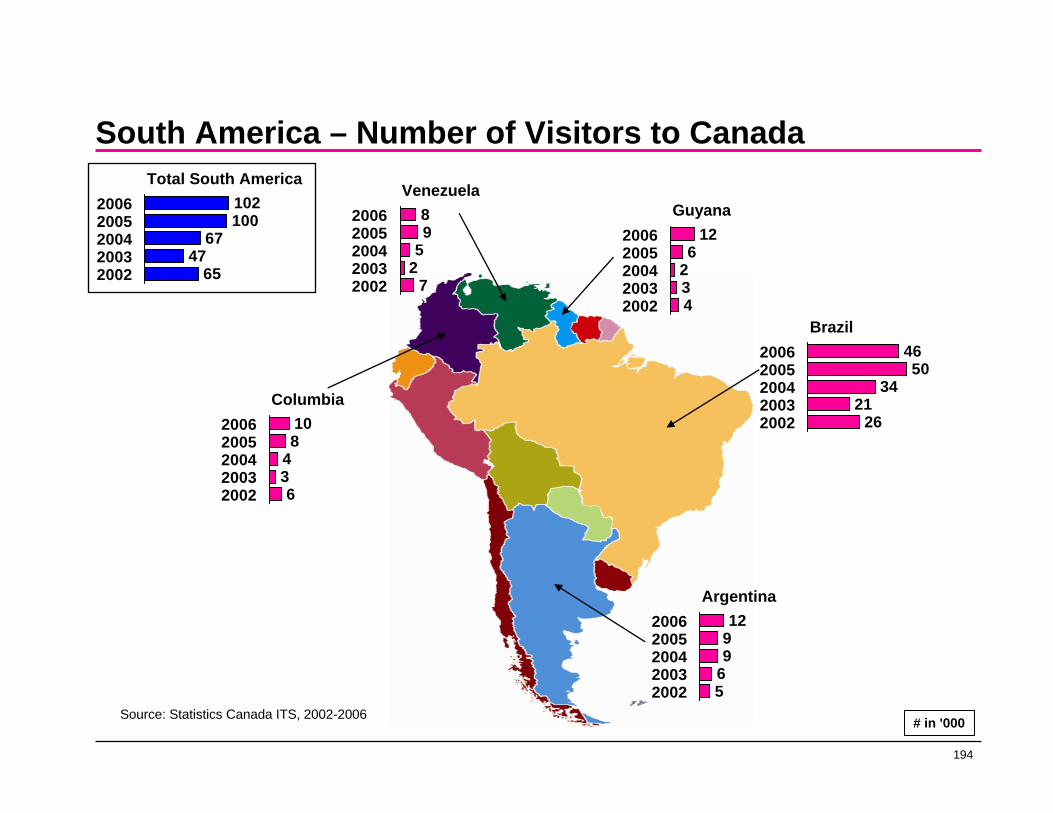
194
South America – Number of Visitors to Canada
102100
6747
65
20062005200420032002
Total South America
126
234
20062005200420032002
Guyana89
52
7
20062005200420032002
Venezuela
4650
3421
26
20062005200420032002
Brazil
1299
65
20062005200420032002
Argentina
108
436
20062005200420032002
Columbia
# in '000Source: Statistics Canada ITS, 2002-2006
195
Central America
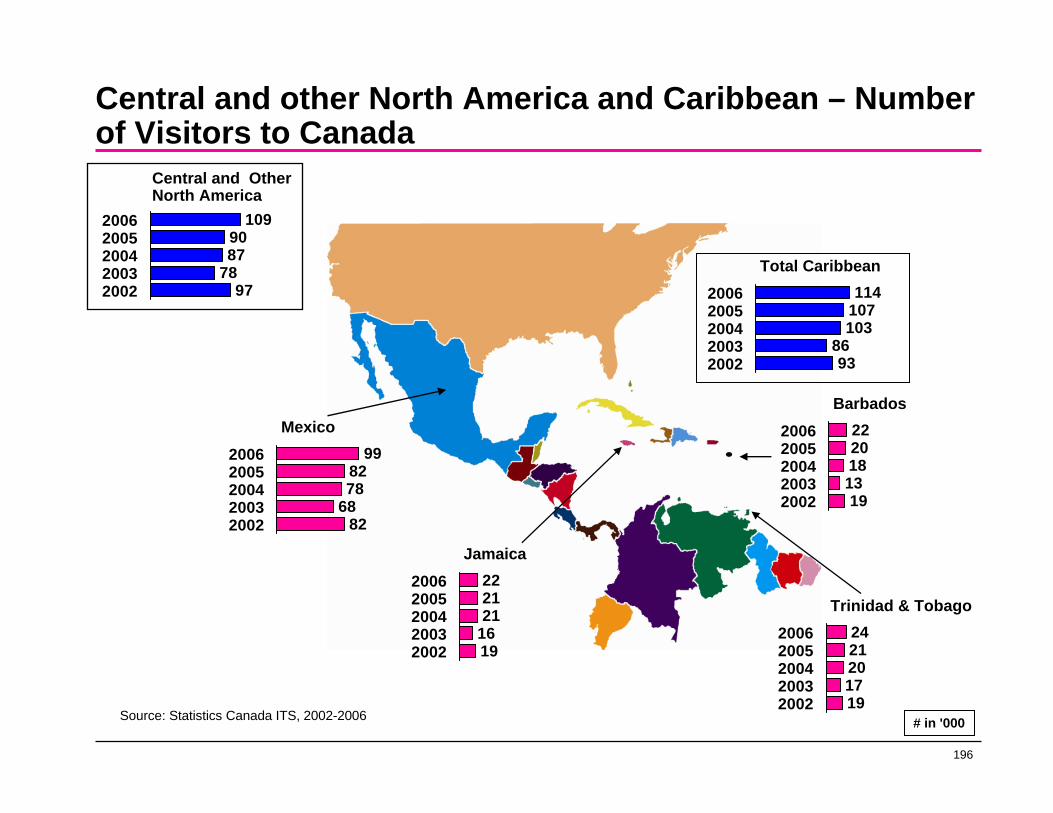
196
Central and other North America and Caribbean – Number of Visitors to Canada
1099087
7897
20062005200420032002
Central and Other North America
2220181319
20062005200420032002
Barbados
2421201719
20062005200420032002
Trinidad & Tobago
998278
6882
20062005200420032002
Mexico
222121
1619
20062005200420032002
Jamaica
114107103
8693
20062005200420032002
Total Caribbean
# in '000Source: Statistics Canada ITS, 2002-2006
197
Mexico
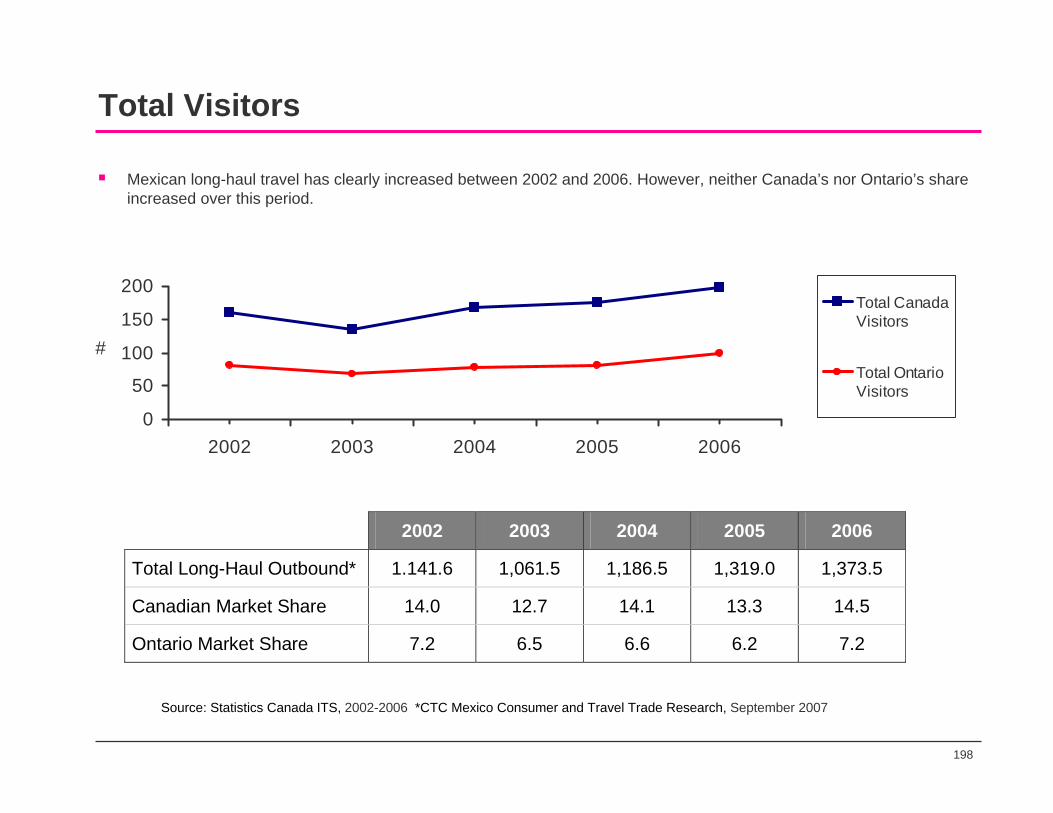
198
Total Visitors
Mexican long-haul travel has clearly increased between 2002 and 2006. However, neither Canada’s nor Ontario’s share increased over this period.
0
50
100
150
200
2002 2003 2004 2005 2006
#
Total Canada Visitors
Total OntarioVisitors
2002 2003 2004 2005 2006
Total Long-Haul Outbound* 1.141.6 1,061.5 1,186.5 1,319.0 1,373.5
Canadian Market Share 14.0 12.7 14.1 13.3 14.5
Ontario Market Share 7.2 6.5 6.6 6.2 7.2
Source: Statistics Canada ITS, 2002-2006 *CTC Mexico Consumer and Travel Trade Research, September 2007
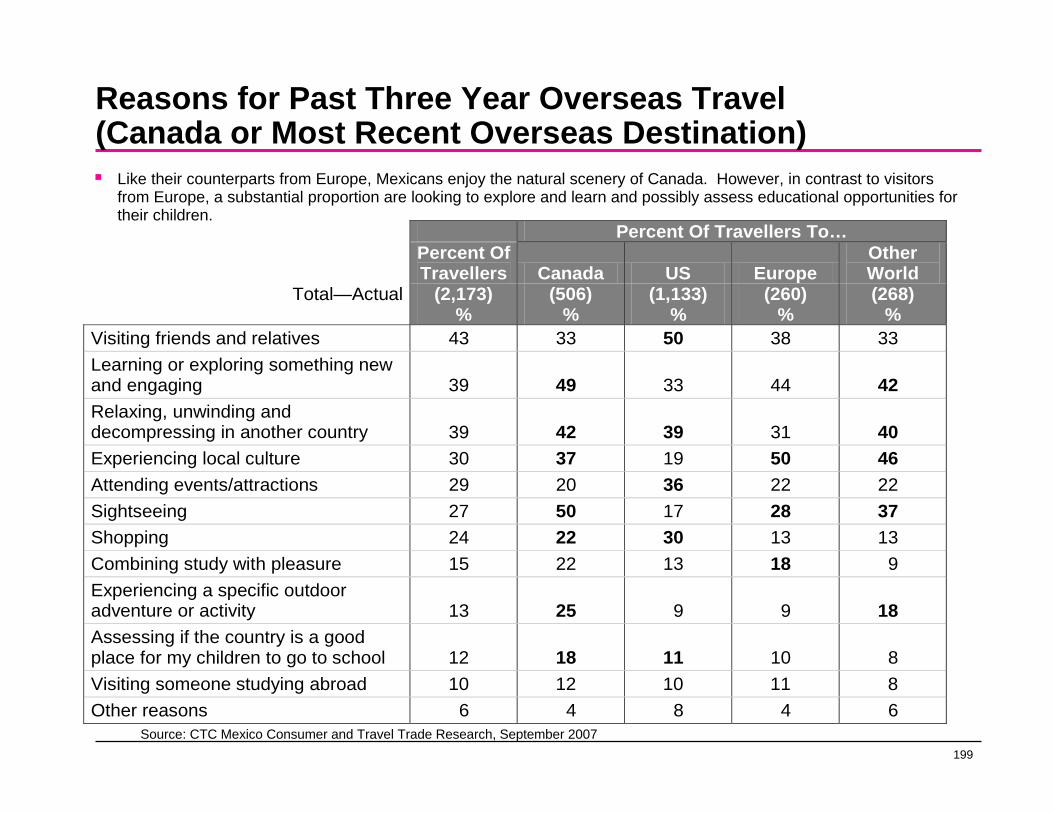
199
Reasons for Past Three Year Overseas Travel(Canada or Most Recent Overseas Destination)
Like their counterparts from Europe, Mexicans enjoy the natural scenery of Canada. However, in contrast to visitors from Europe, a substantial proportion are looking to explore and learn and possibly assess educational opportunities for their children.
Percent Of Travellers To… Percent Of
Travellers Canada US Europe Other World
Total—Actual (2,173) (506) (1,133) (260) (268) % % % % % Visiting friends and relatives 43 33 50 38 33 Learning or exploring something new and engaging 39 49 33 44 42 Relaxing, unwinding and decompressing in another country 39 42 39 31 40 Experiencing local culture 30 37 19 50 46 Attending events/attractions 29 20 36 22 22 Sightseeing 27 50 17 28 37 Shopping 24 22 30 13 13 Combining study with pleasure 15 22 13 18 9 Experiencing a specific outdoor adventure or activity 13 25 9 9 18 Assessing if the country is a good place for my children to go to school 12 18 11 10 8 Visiting someone studying abroad 10 12 10 11 8 Other reasons 6 4 8 4 6 Source: CTC Mexico Consumer and Travel Trade Research, September 2007
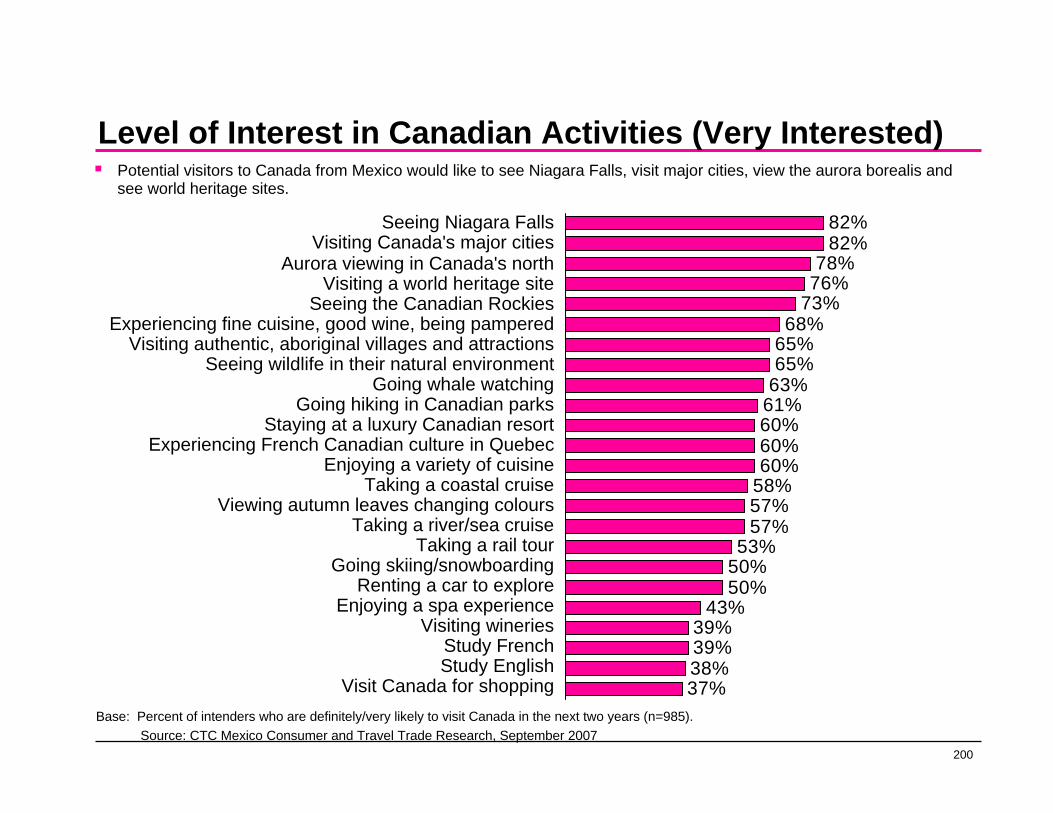
200
Level of Interest in Canadian Activities (Very Interested)
82%82%
78%76%
73%68%
65%65%
63%61%60%60%60%
58%57%57%
53%50%50%
43%39%39%38%37%
Seeing Niagara FallsVisiting Canada's major cities
Aurora viewing in Canada's northVisiting a world heritage site
Seeing the Canadian RockiesExperiencing fine cuisine, good wine, being pampered
Visiting authentic, aboriginal villages and attractionsSeeing wildlife in their natural environment
Going whale watchingGoing hiking in Canadian parks
Staying at a luxury Canadian resortExperiencing French Canadian culture in Quebec
Enjoying a variety of cuisineTaking a coastal cruise
Viewing autumn leaves changing coloursTaking a river/sea cruise
Taking a rail tourGoing skiing/snowboarding
Renting a car to exploreEnjoying a spa experience
Visiting wineriesStudy FrenchStudy English
Visit Canada for shoppingBase: Percent of intenders who are definitely/very likely to visit Canada in the next two years (n=985).
Source: CTC Mexico Consumer and Travel Trade Research, September 2007
Potential visitors to Canada from Mexico would like to see Niagara Falls, visit major cities, view the aurora borealis and see world heritage sites.

201
Barriers to Visiting Canada
Top 19 Barriers To Visiting Canada 1. Bad time for you financially 2. Other more interesting places to go 3. Bad weather in Canada 4. Cost of travel to Canada 5. Not enough vacation time 6. Better shopping opportunities elsewhere 7. Not enough knowledge of Canada (7, 8 tied) 8. Cost of travel within Canada (7, 8 tied) 9. Lack of interest in Canada 10. No interesting tours available in Canada (10, 11 tied) 11. Language difficulties in Canada (10, 11 tied) 12. Nothing special or unique in Canada 13. An unfavourable exchange rate (13, 14, 15 tied) 14. Amount of time required to get to Canada (13, 14, 15 tied) 15. Difficult to find information about Canada (13, 14, 15 tied) 16. Not a good value for money (16, 17 tied) 17. Not enough services or products in Spanish (16, 17 tied) 18. Document and/or visa requirements 19. Border crossing difficulties
Cost is clearly a major barrier to visiting Canada, and bad weather is also more concerning to Mexicans than to visitors from the U.K. and Europe.
Source: CTC Mexico Consumer and Travel Trade Research, September 2007
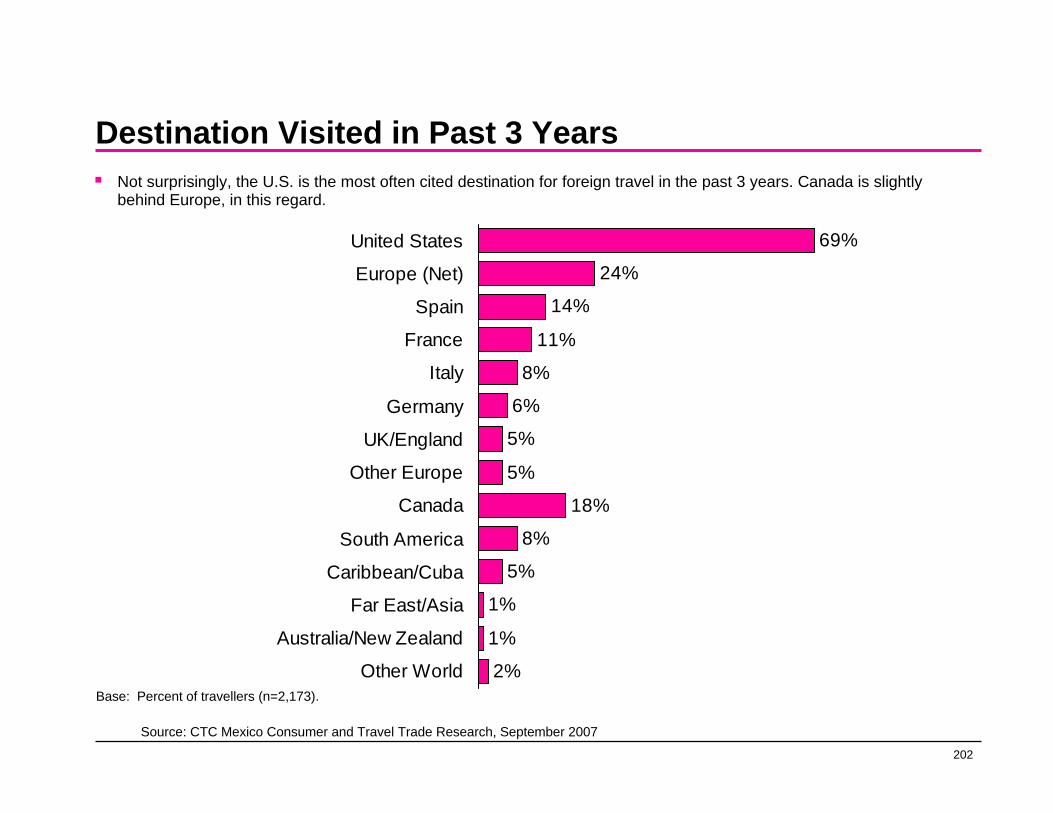
202
Destination Visited in Past 3 Years
69%
24%
14%
11%
8%
6%
5%
5%
18%
8%
5%
1%
1%
2%
United States
Europe (Net)
Spain
France
Italy
Germany
UK/England
Other Europe
Canada
South America
Caribbean/Cuba
Far East/Asia
Australia/New Zealand
Other WorldBase: Percent of travellers (n=2,173).
Source: CTC Mexico Consumer and Travel Trade Research, September 2007
Not surprisingly, the U.S. is the most often cited destination for foreign travel in the past 3 years. Canada is slightly behind Europe, in this regard.

203
Destination Definitely/Very Likely to Visit in Next 2 Years
80%77%
64%62%
58%58%
51%50%49%48%
46%35%35%
32%31%30%
21%
Europe (Net)United States
SpainCanadaFrance
ItalyCaribbean/Cuba
Other South AmericaUK/England
Other EuropeGermany
Central AmericaBrazil
HawaiiFar East/Asia
Australia/New ZealandOther World
Base: Percent of intenders (n=1,581).Source: CTC Mexico Consumer and Travel Trade Research, September 2007
While most Mexicans who travelled abroad made a visit to the U.S., Europe edges out the U.S., slightly as a destination that they would like to visit in the next 2 years. Spain tops the list of European countries. Canada, however, also performs well and is as likely to be mentioned as Spain.
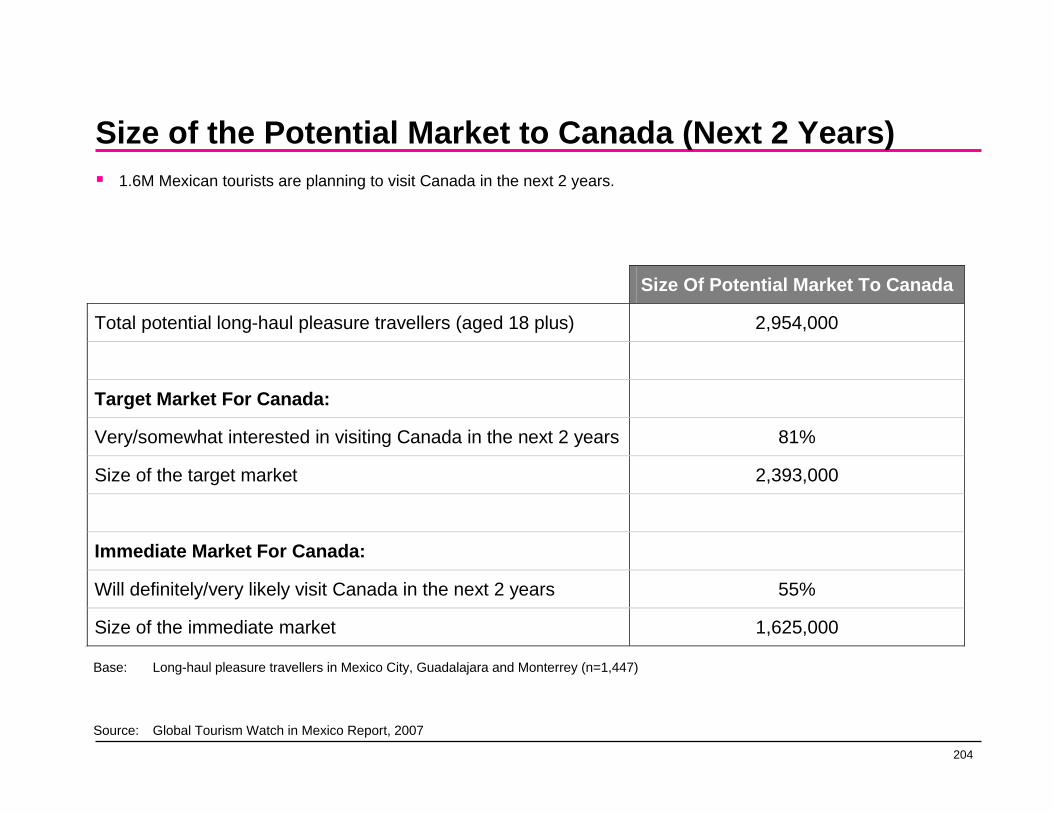
204
Size of the Potential Market to Canada (Next 2 Years)1.6M Mexican tourists are planning to visit Canada in the next 2 years.
Base: Long-haul pleasure travellers in Mexico City, Guadalajara and Monterrey (n=1,447)
Source: Global Tourism Watch in Mexico Report, 2007
Size Of Potential Market To Canada
Total potential long-haul pleasure travellers (aged 18 plus) 2,954,000
Target Market For Canada:
Very/somewhat interested in visiting Canada in the next 2 years 81%
Size of the target market 2,393,000
Immediate Market For Canada:
Will definitely/very likely visit Canada in the next 2 years 55%
Size of the immediate market 1,625,000 11
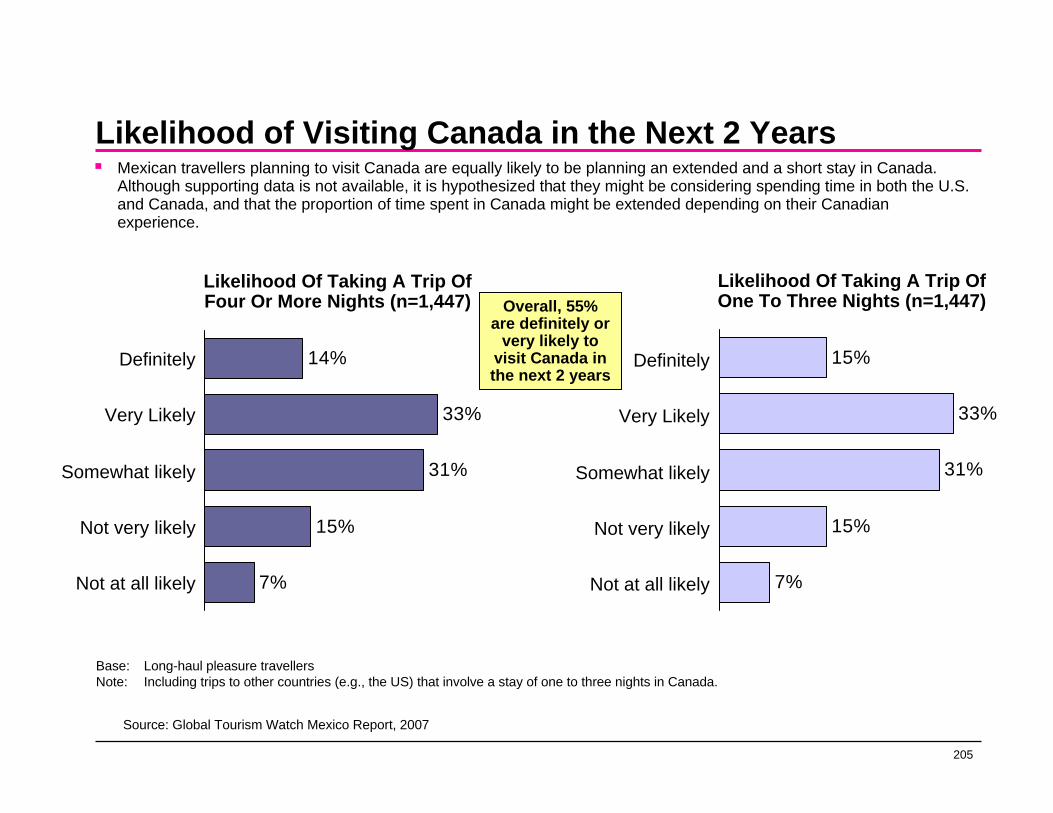
205
Likelihood of Visiting Canada in the Next 2 Years
14%
33%
31%
15%
7%
Mexican travellers planning to visit Canada are equally likely to be planning an extended and a short stay in Canada. Although supporting data is not available, it is hypothesized that they might be considering spending time in both the U.S. and Canada, and that the proportion of time spent in Canada might be extended depending on their Canadian experience.
Likelihood Of Taking A Trip Of Four Or More Nights (n=1,447)
Likelihood Of Taking A Trip Of One To Three Nights (n=1,447)
Definitely
Very Likely
Somewhat likely
Not very likely
Not at all likely
15%
33%
31%
15%
7%
Definitely
Very Likely
Somewhat likely
Not very likely
Not at all likely
Overall, 55% are definitely or
very likely to visit Canada in the next 2 years
Base: Long-haul pleasure travellersNote: Including trips to other countries (e.g., the US) that involve a stay of one to three nights in Canada.
Source: Global Tourism Watch Mexico Report, 2007
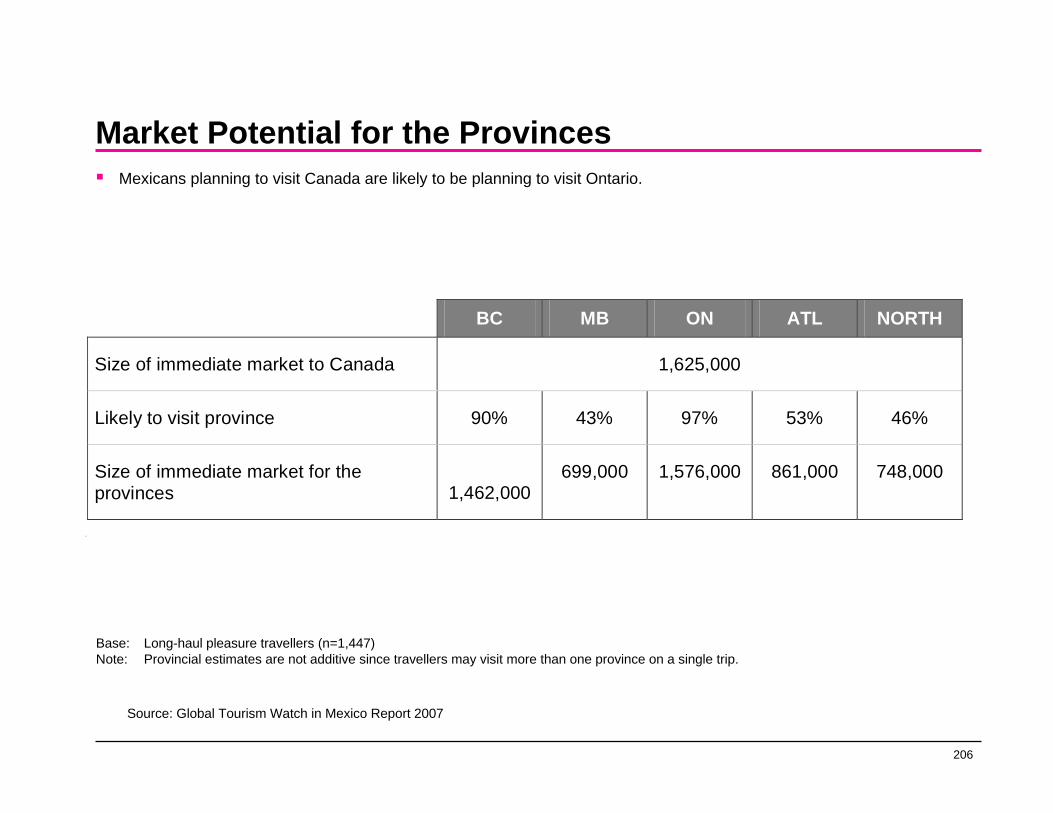
206
Market Potential for the Provinces
BC MB ON ATL NORTH
Size of immediate market to Canada 1,625,000
Likely to visit province 90% 43% 97% 53% 46%
Size of immediate market for the provinces 1,462,000
699,000 1,576,000 861,000 748,000
11
Mexicans planning to visit Canada are likely to be planning to visit Ontario.
Base: Long-haul pleasure travellers (n=1,447)Note: Provincial estimates are not additive since travellers may visit more than one province on a single trip.
Source: Global Tourism Watch in Mexico Report 2007

207
Canadian Destination Most Likely to Visit
97%
94%
90%
70%
53%
50%
46%
55%
20%
17%
6%
1%
1%
0%
Ontario
Quebec
British Columbia
Alberta
Atlantic Canada
Manitoba/Saskatchewan
Northern Canada
Regions Likely To Visit
Region MOST Likely ToVisit
Base: Those likely to visit Canadian in the next 2 years and/or those who are considering have decided to visit or have booked a trip there (n=1,197).
Source: Global Tourism Watch in Mexico Report, 2007
Not only are Mexican travellers planning to visit Ontario, but Ontario is generally the province that they are most likely to visit in Canada.

208
Mexico - Canadian Visitor Expenditure ProfileThe amount spent per night is relatively low for Mexican tourists. However, the time spent in Canada is relatively long so the total Canadian expenditure is substantial. Ontario gets the lion’s share of their tourism spending.
Average # of nights 19
Average expenditure per person per trip $1,363
Average expenditure per person per night $71 11
Source: CTC Mexico Consumer and Travel Trade Research, September 2007
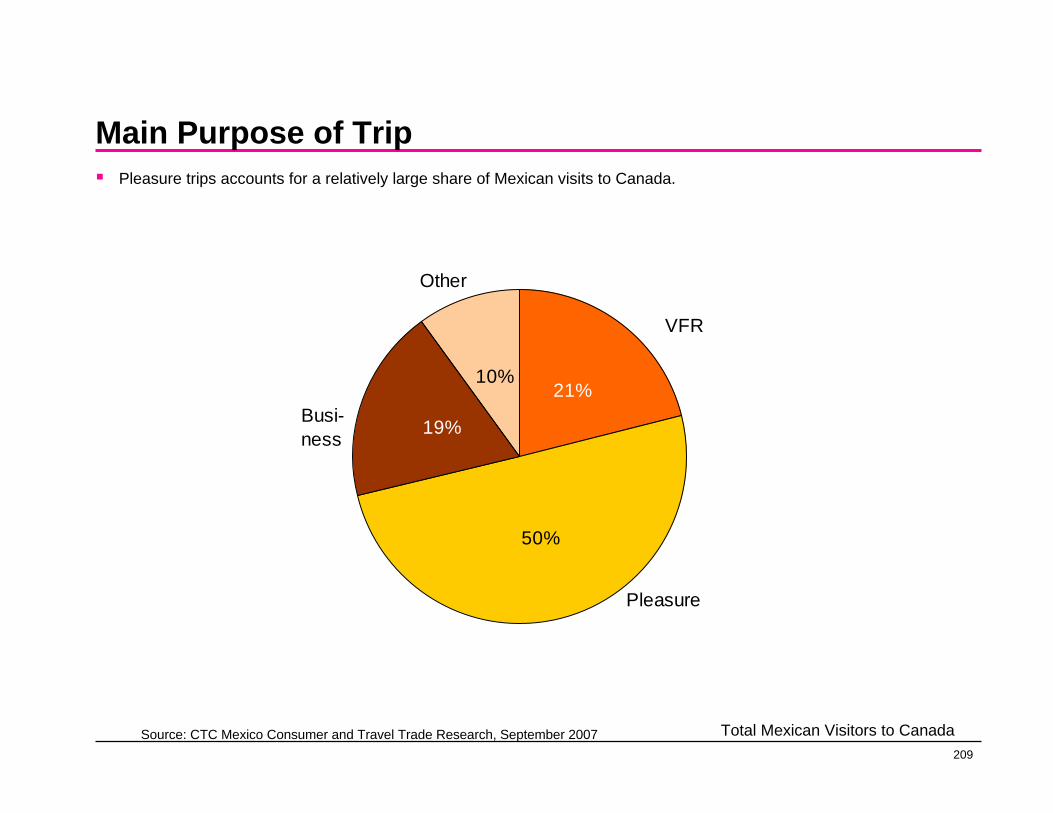
209
Main Purpose of TripPleasure trips accounts for a relatively large share of Mexican visits to Canada.
10%
19%
50%
21%
VFR
Pleasure
Other
Busi-ness
Source: CTC Mexico Consumer and Travel Trade Research, September 2007 Total Mexican Visitors to Canada

210
Asia

211
Asia – Number of Visitors to Canada86
61344256
20062005200420032002
Mainland China
182195207
86197
20062005200420032002
Japan
535152
3545
20062005200420032002
Hong Kong8780
644338
20062005200420032002
India
7076635770
20062005200420032002
Israel 2121171417
20062005200420032002
Philippines
658619586
395583
20062005200420032002
Total Asia
686570
4759
20062005200420032002
South Korea
# in '000Source: Statistics Canada ITS, 2002-2006
212
South Korea
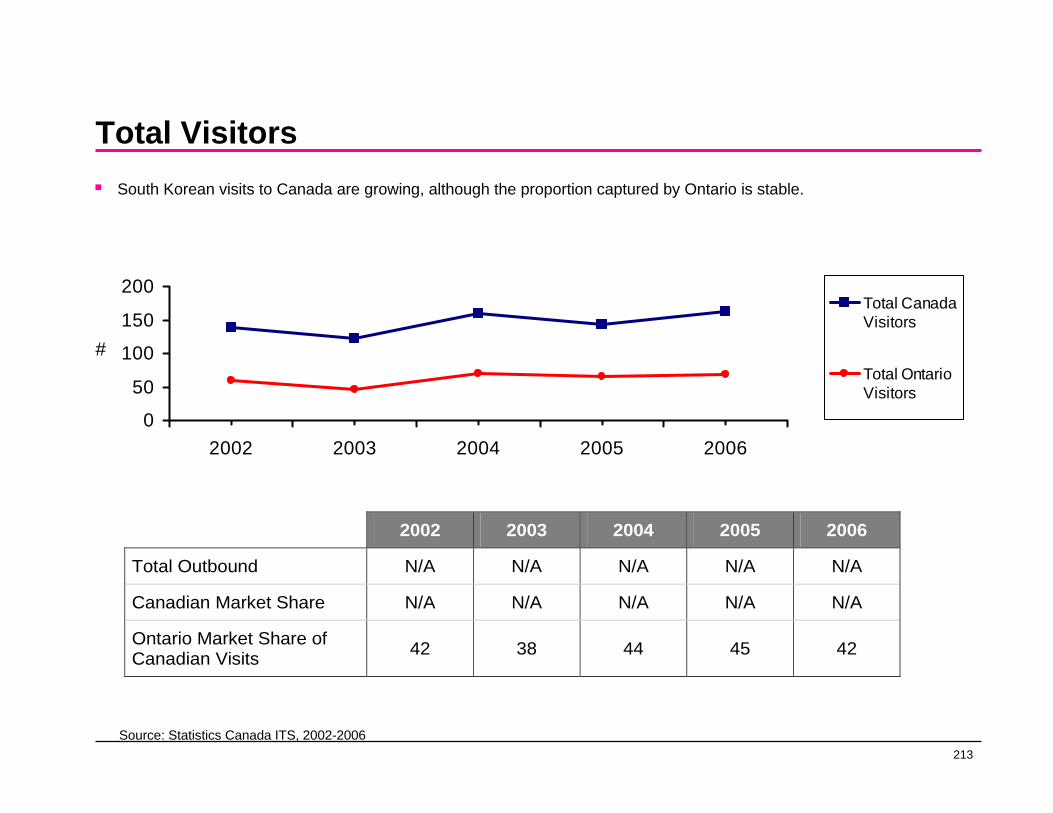
213
Total Visitors
0
50
100
150
200
2002 2003 2004 2005 2006
#
Total Canada Visitors
Total OntarioVisitors
2002 2003 2004 2005 2006
Total Outbound N/A N/A N/A N/A N/A
Canadian Market Share N/A N/A N/A N/A N/A
Ontario Market Share of Canadian Visits 42 38 44 45 42
Source: Statistics Canada ITS, 2002-2006
South Korean visits to Canada are growing, although the proportion captured by Ontario is stable.
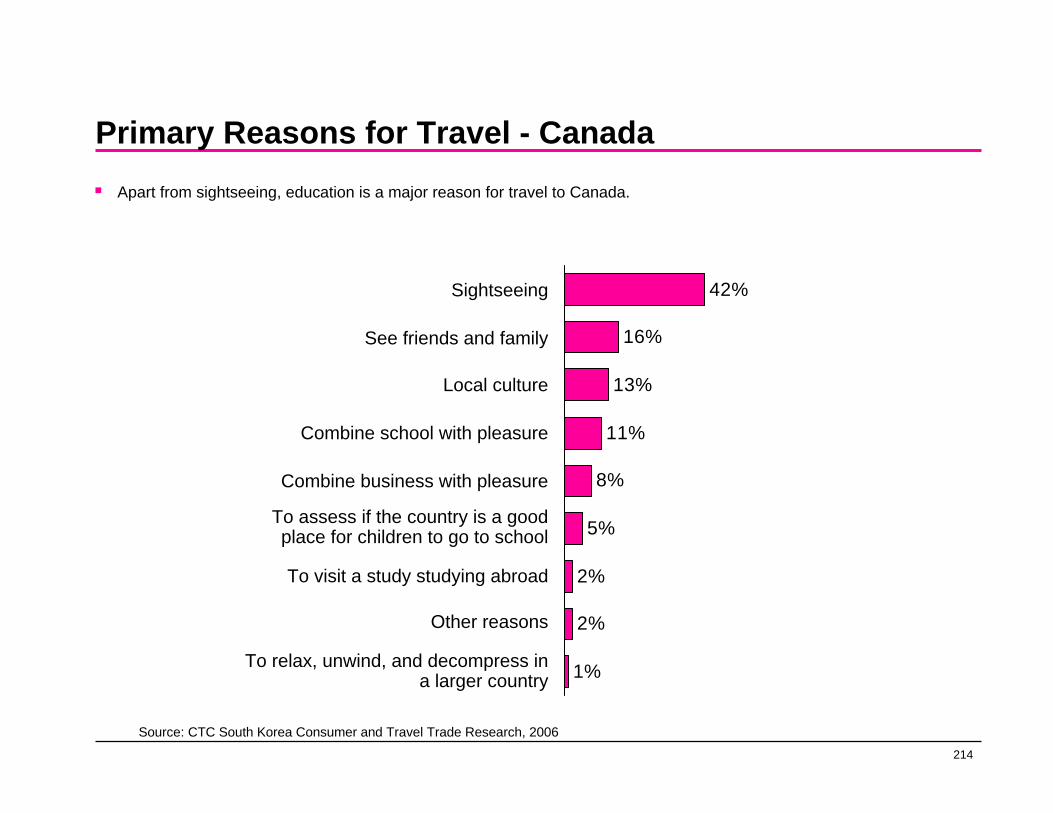
214
Primary Reasons for Travel - Canada
42%
16%
13%
11%
8%
5%
2%
2%
1%
Sightseeing
See friends and family
Local culture
Combine school with pleasure
Combine business with pleasure
To assess if the country is a good place for children to go to school
To visit a study studying abroad
Other reasons
To relax, unwind, and decompress in a larger country
Source: CTC South Korea Consumer and Travel Trade Research, 2006
Apart from sightseeing, education is a major reason for travel to Canada.
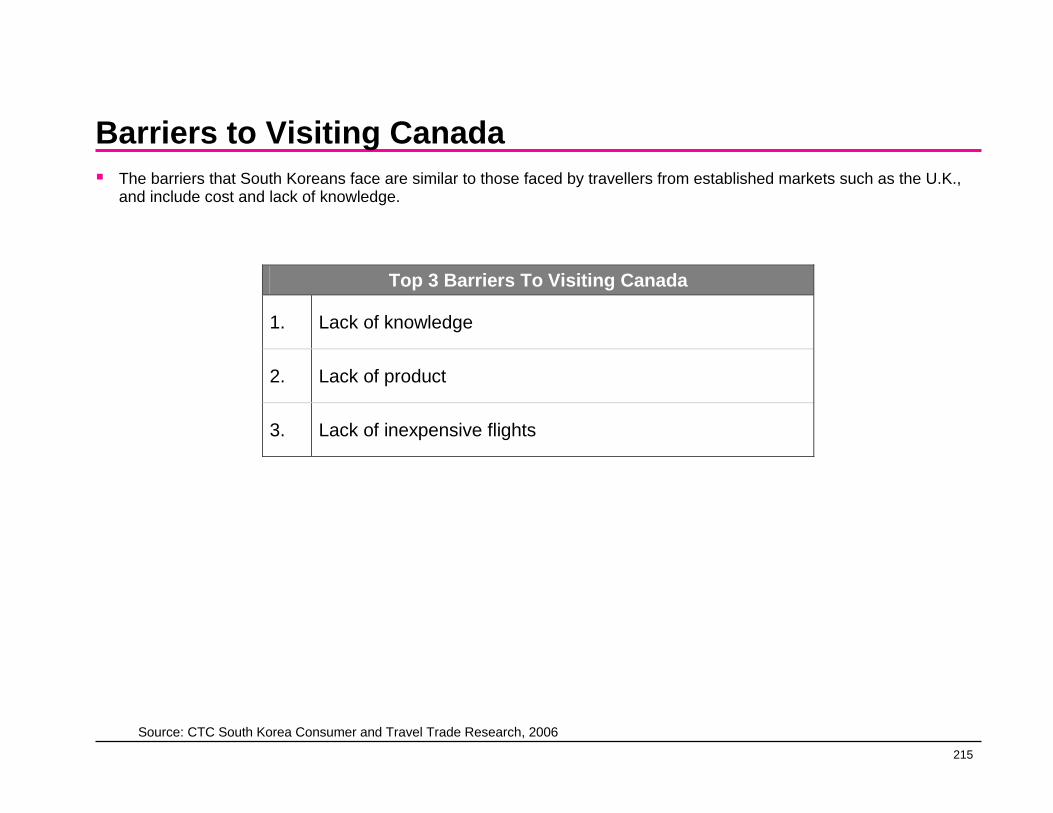
215
Barriers to Visiting Canada
Top 3 Barriers To Visiting Canada
1. Lack of knowledge
2. Lack of product
3. Lack of inexpensive flights
The barriers that South Koreans face are similar to those faced by travellers from established markets such as the U.K., and include cost and lack of knowledge.
Source: CTC South Korea Consumer and Travel Trade Research, 2006

216
South Korean Departures by Destination- 2004 vs. 2005Between 2004 and 2005, South Korean travel increased to China, the Philippines, Vietnam and Taiwan.
Korean Departures 2005 Rank Destination Country 2005 2004 Change % 1. China 2,960,642 2,334,781 +26.8 29.4 2. Japan 1,739,424 1,569,175 +10.8 17.3 3. United States 665,181 627,575 +6.0 6.5 4. Thailand 661,779 754,093 -12.2 6.6 5. Philippines 481,397 377,217 +27.6 4.8 6. Hong Kong 344,393 305,351 +12.8 3.4 7. Vietnam 268,110 203,300 +31.9 2.7 8. Singapore 210,060 189,949 +10.6 2.1 9. Australia 198,088 172,265 +15.0 2.0 10. Taiwan 172,262 134,734 +27.9 1.7 11. Germany 141,606 141,854 -0.2 1.4 12. Canada 134,975 133,836 +0.9 1.3 13. Indonesia 124,980 124,828 +0.1 1.2 14. England 116,224 111,945 +3.9 1.2 Source: KNTO
Source: CTC South Korea Consumer and Travel Trade Research, 2006

217
Latent Demand for Canada
13,278,000
3,984,000
2,064,000
516,000
173,000
The number of South Koreans who plan to visit Canada in the next 12 months is much higher than the proportion who visited Canada in 2005.
Travelled long-haul in the past 3 years or definitely/very likely to in the next 2 years
Very interested in visiting Canadain the next 2 years (31.0%)
Definitely/very likely to visit Canadain the next 12 months (15.2%)
Definitely likely to visit Canadain the next 12 months (3.38%)
Current number of visitorsto Canada (2005) (1.3%)
Source: CTC South Korea Consumer and Travel Trade Research, 2006

218
Size of the Potential Market to Canada (Next 2 Years)2.6M South Koreans plan to visit Canada in the next 2 years.
Base: Long-haul pleasure travellers (n=1,546)
Size Of Potential Market To Canada
Total potential long-haul pleasure travellers (aged 18 plus) 8,183,000
Target Market For Canada:
Very/somewhat interested in visiting Canada in the next 2 years 73%
Size of the target market 5,974,000
Immediate Market For Canada:
Will definitely/very likely visit Canada in the next 2 years 32%
Size of the immediate market 2,619,000 11
Source: Global Tourism Watch South Korea, 2007
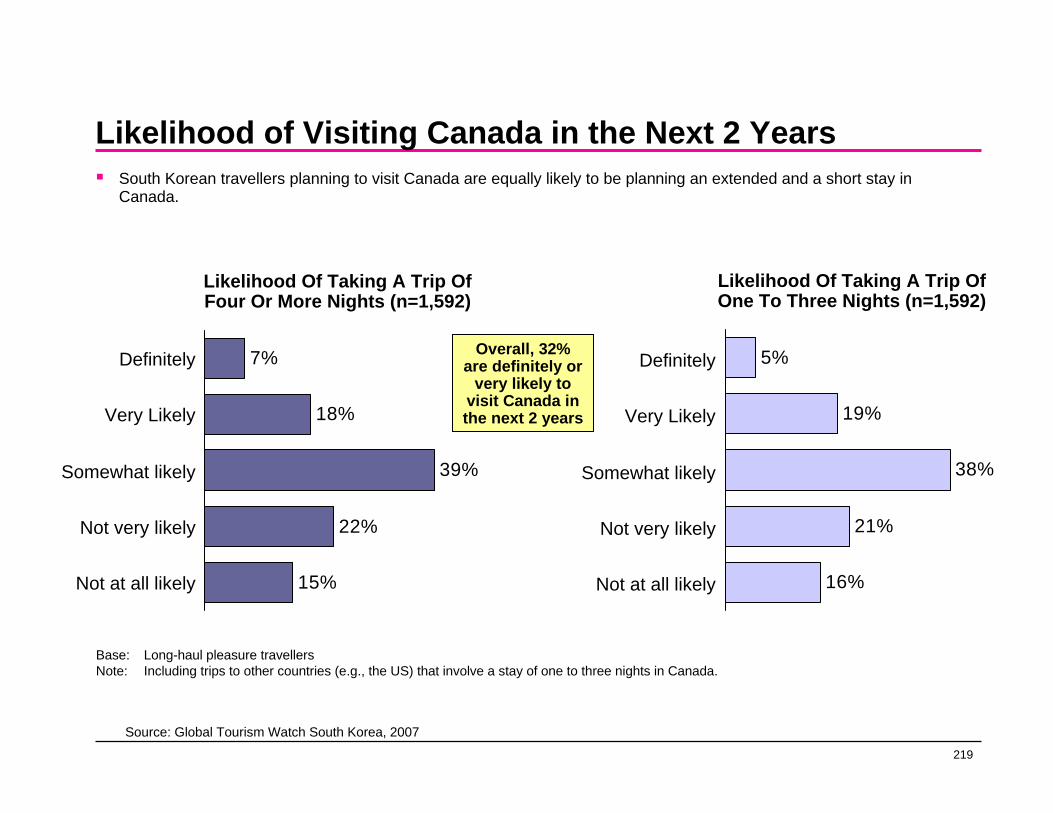
219
Likelihood of Visiting Canada in the Next 2 Years
7%
18%
39%
22%
15%
South Korean travellers planning to visit Canada are equally likely to be planning an extended and a short stay in Canada.
Likelihood Of Taking A Trip Of Four Or More Nights (n=1,592)
Likelihood Of Taking A Trip Of One To Three Nights (n=1,592)
Definitely
Very Likely
Somewhat likely
Not very likely
Not at all likely
5%
19%
38%
21%
16%
Definitely
Very Likely
Somewhat likely
Not very likely
Not at all likely
Overall, 32% are definitely or
very likely to visit Canada in the next 2 years
Base: Long-haul pleasure travellersNote: Including trips to other countries (e.g., the US) that involve a stay of one to three nights in Canada.
Source: Global Tourism Watch South Korea, 2007
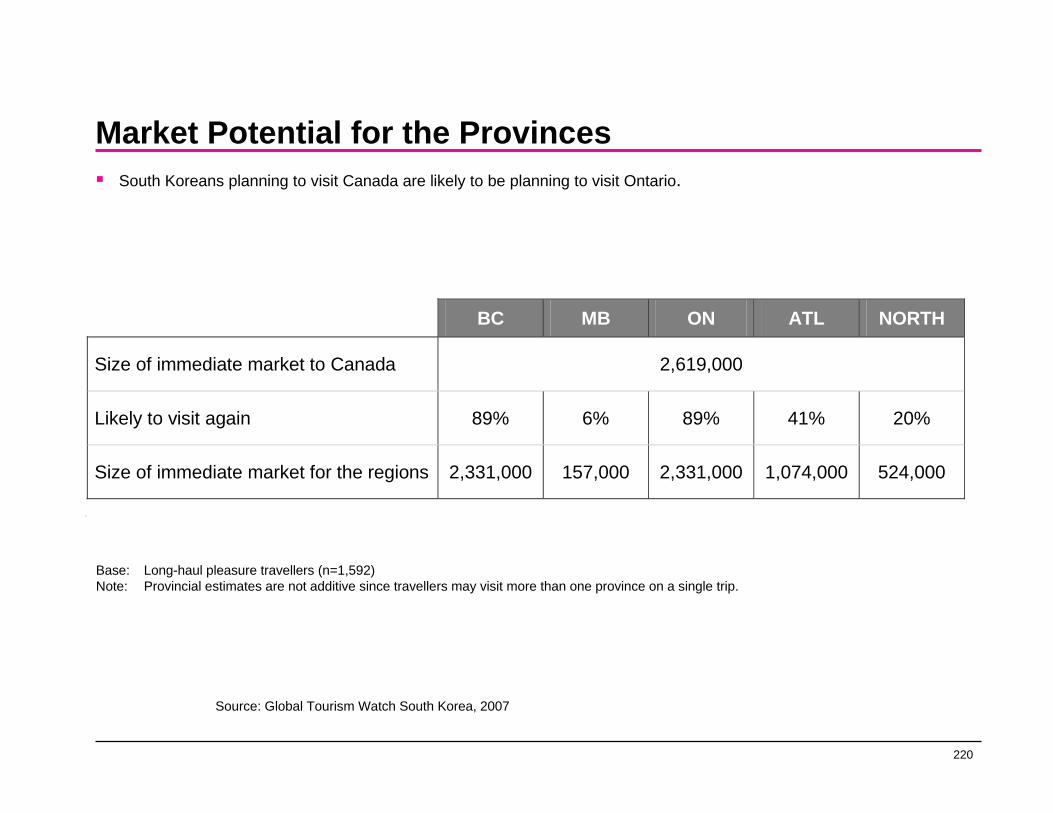
220
Market Potential for the Provinces
BC MB ON ATL NORTH
Size of immediate market to Canada 2,619,000
Likely to visit again 89% 6% 89% 41% 20%
Size of immediate market for the regions 2,331,000 157,000 2,331,000 1,074,000 524,000
11
South Koreans planning to visit Canada are likely to be planning to visit Ontario.
Base: Long-haul pleasure travellers (n=1,592)Note: Provincial estimates are not additive since travellers may visit more than one province on a single trip.
Source: Global Tourism Watch South Korea, 2007

221
Canadian Destination Most Likely to Visit
89%
89%
76%
41%
38%
20%
11%
55%
29%
9%
2%
2%
1%
1%
Ontario
British Columbia
Quebec
Atlantic Canada
Alberta
Northern Canada
Manitoba/Saskatchewan
Regions Likely To Visit
Region MOST Likely ToVisit
Base: Those likely to visit Canadian in the next 2 years and/or those who are considering have decided to visit or have booked a trip there (n=1,062).Source: Global Tourism Watch in South Korea Report, 2007
South Koreans planning to visit Canada are most likely to be planning to visit Ontario (55%).
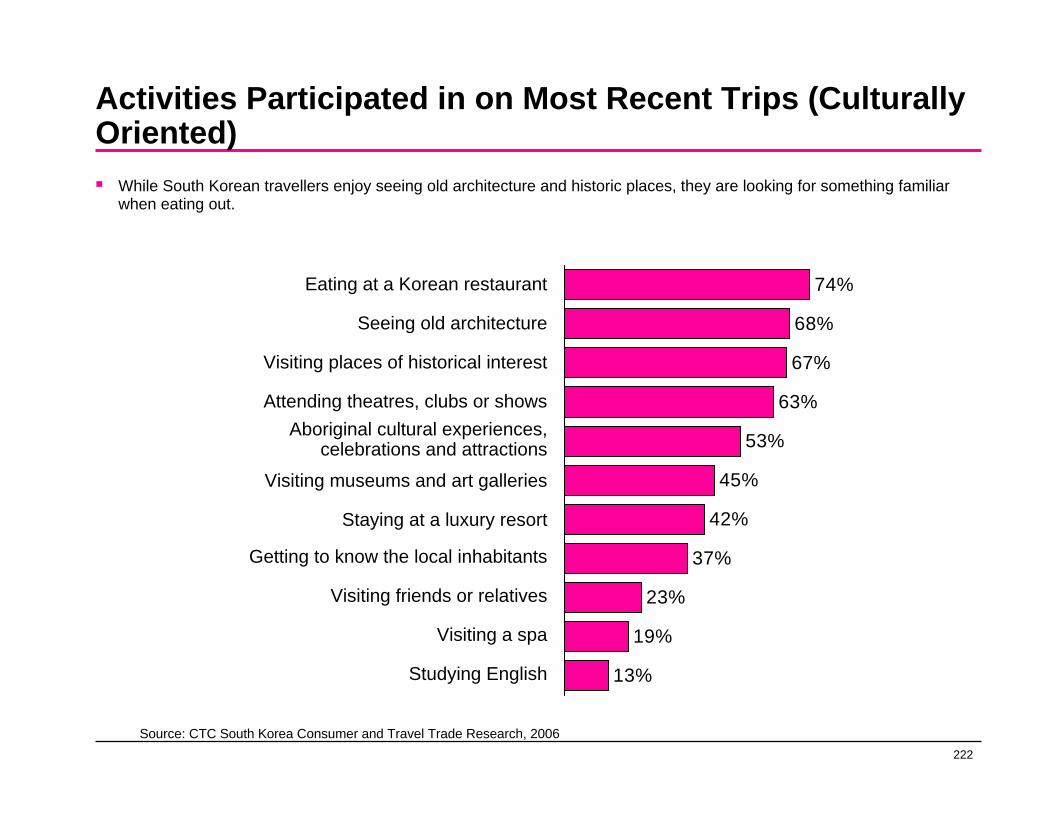
222
Activities Participated in on Most Recent Trips (Culturally Oriented)
74%
68%
67%
63%
53%
45%
42%
37%
23%
19%
13%
Eating at a Korean restaurant
Seeing old architecture
Visiting places of historical interest
Attending theatres, clubs or showsAboriginal cultural experiences,
celebrations and attractions
Visiting museums and art galleries
Staying at a luxury resort
Getting to know the local inhabitants
Visiting friends or relatives
Visiting a spa
Studying English
Source: CTC South Korea Consumer and Travel Trade Research, 2006
While South Korean travellers enjoy seeing old architecture and historic places, they are looking for something familiar when eating out.
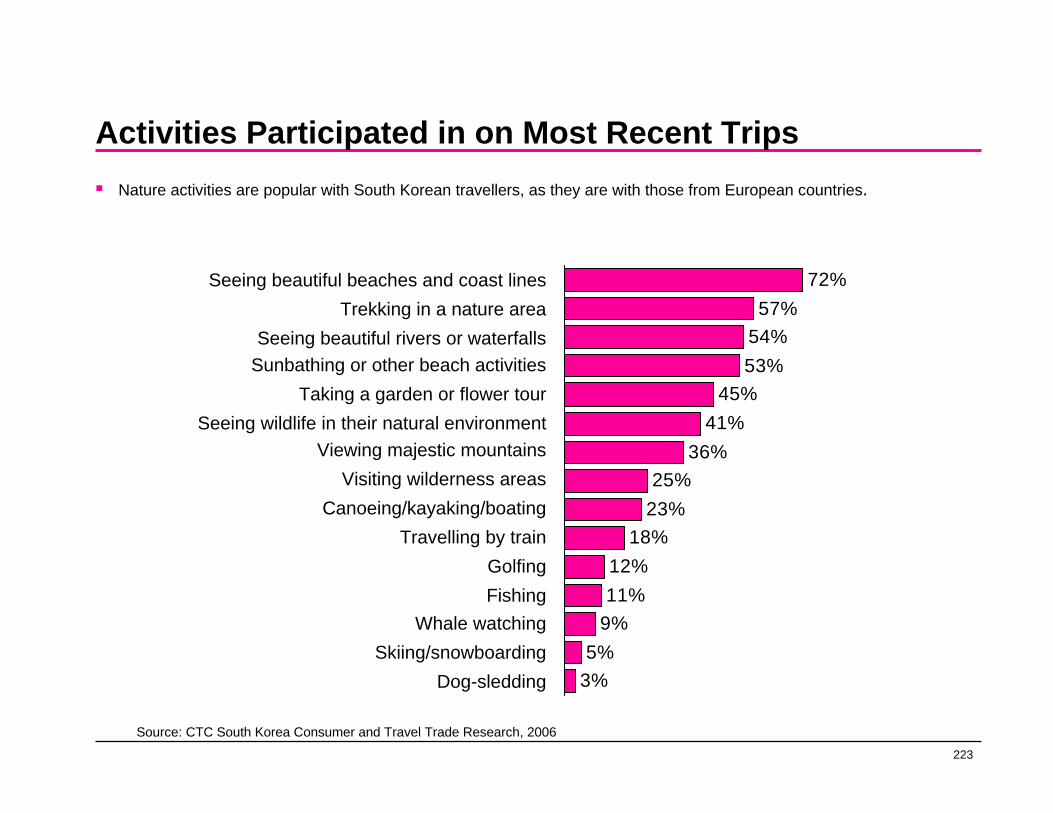
223
Activities Participated in on Most Recent Trips
72%57%
54%53%
45%41%
36%25%
23%18%
12%11%
9%5%
3%
Seeing beautiful beaches and coast linesTrekking in a nature area
Seeing beautiful rivers or waterfallsSunbathing or other beach activities
Taking a garden or flower tourSeeing wildlife in their natural environment
Viewing majestic mountainsVisiting wilderness areas
Canoeing/kayaking/boatingTravelling by train
GolfingFishing
Whale watchingSkiing/snowboarding
Dog-sledding
Source: CTC South Korea Consumer and Travel Trade Research, 2006
Nature activities are popular with South Korean travellers, as they are with those from European countries.
224
Japan
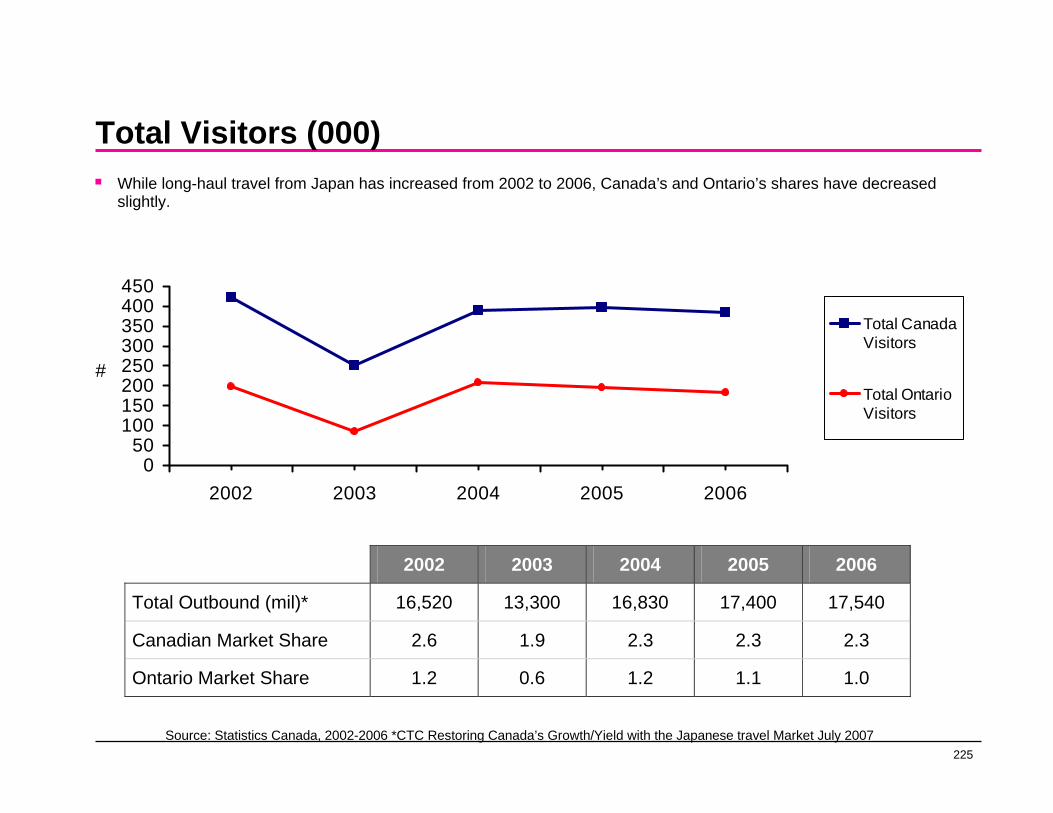
225
Total Visitors (000)
050
100150200250300350400450
2002 2003 2004 2005 2006
#
Total Canada Visitors
Total OntarioVisitors
2002 2003 2004 2005 2006
Total Outbound (mil)* 16,520 13,300 16,830 17,400 17,540
Canadian Market Share 2.6 1.9 2.3 2.3 2.3
Ontario Market Share 1.2 0.6 1.2 1.1 1.0
Source: Statistics Canada, 2002-2006 *CTC Restoring Canada’s Growth/Yield with the Japanese travel Market July 2007
While long-haul travel from Japan has increased from 2002 to 2006, Canada’s and Ontario’s shares have decreased slightly.
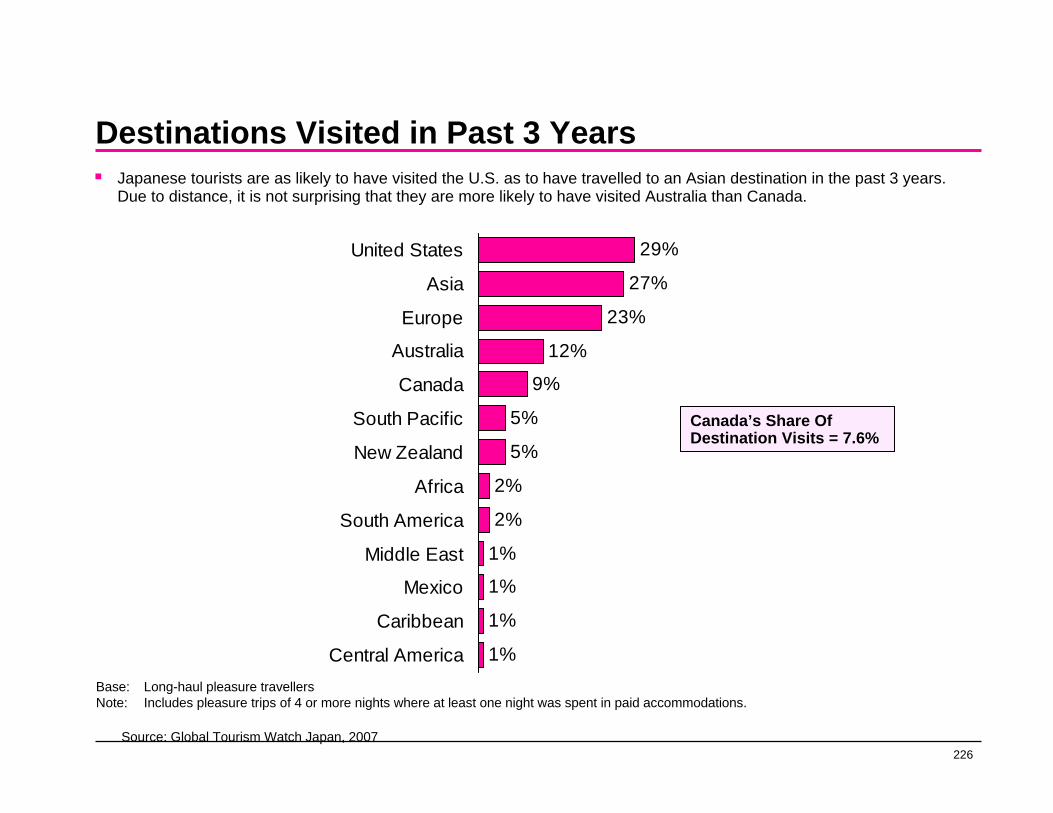
226
Destinations Visited in Past 3 Years
29%
27%
23%
12%
9%
5%
5%
2%
2%
1%
1%
1%
1%
United States
Asia
Europe
Australia
Canada
South Pacific
New Zealand
Africa
South America
Middle East
Mexico
Caribbean
Central AmericaBase: Long-haul pleasure travellersNote: Includes pleasure trips of 4 or more nights where at least one night was spent in paid accommodations.
Canada’s Share Of Destination Visits = 7.6%
Source: Global Tourism Watch Japan, 2007
Japanese tourists are as likely to have visited the U.S. as to have travelled to an Asian destination in the past 3 years. Due to distance, it is not surprising that they are more likely to have visited Australia than Canada.
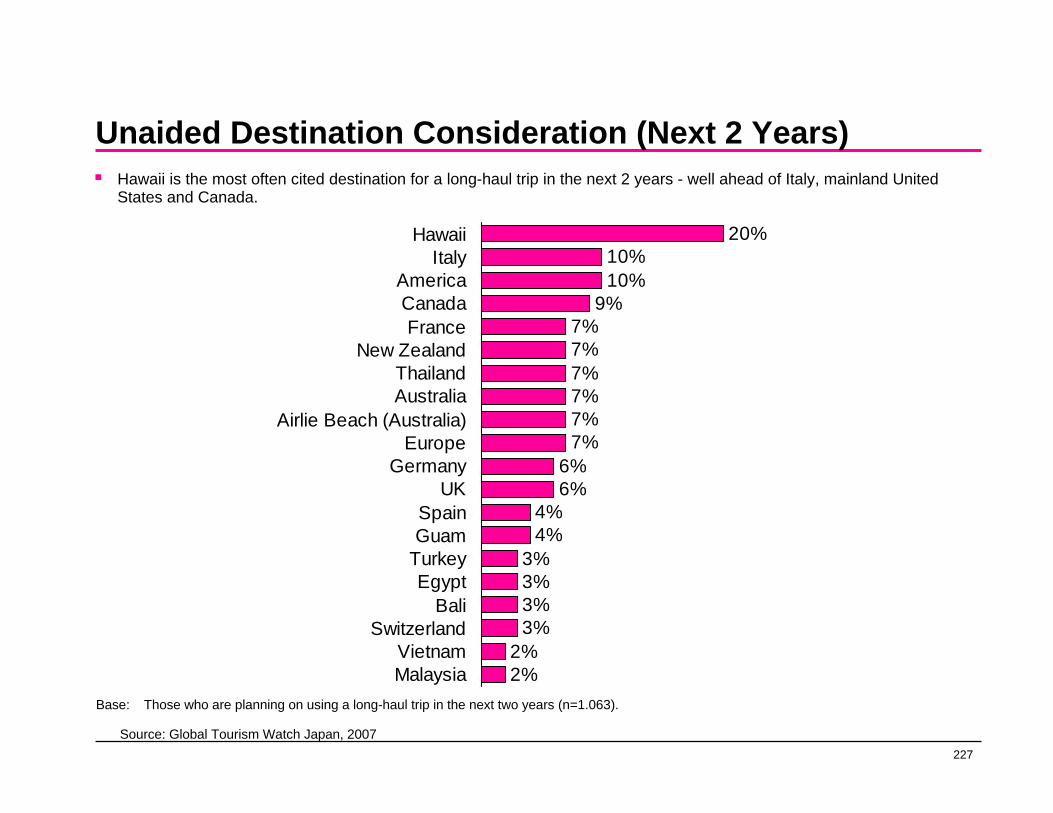
227
Unaided Destination Consideration (Next 2 Years)
20%10%10%
9%7%7%7%7%7%7%
6%6%
4%4%
3%3%3%3%
2%2%
HawaiiItaly
AmericaCanadaFrance
New ZealandThailandAustralia
Airlie Beach (Australia)Europe
GermanyUK
SpainGuam
TurkeyEgypt
BaliSwitzerland
VietnamMalaysia
Base: Those who are planning on using a long-haul trip in the next two years (n=1.063).
Source: Global Tourism Watch Japan, 2007
Hawaii is the most often cited destination for a long-haul trip in the next 2 years - well ahead of Italy, mainland United States and Canada.

228
Size of The Potential Market to Canada (Next 2 Years)3.4M Japanese tourists are planning to visit Canada in the next 2 years.
Base: Long-haul pleasure travellers (n=1,527)
Size Of Potential Market To Canada
Total potential long-haul pleasure travellers (aged 18 plus) 19,070,000
Target Market For Canada:
Very/somewhat interested in visiting Canada in the next 2 years 66%
Size of the target market 12,586,000
Immediate Market For Canada:
Will definitely/very likely visit Canada in the next 2 years 18%
Size of the immediate market 3,433,000 11
Source: Global Tourism Watch Japan, 2007

229
Likelihood of Visiting Canada in the Next 2 Years
3%
13%
33%
30%
21%
Japanese tourists are as likely to be planning an extended as a short stay in Canada.
Likelihood Of Taking A Trip Of Four Or More Nights (n=1,527)
Likelihood Of Taking A Trip Of One To Three Nights (n=1,527)
Definitely
Very Likely
Somewhat likely
Not very likely
Not at all likely
2%
12%
33%
31%
21%
Definitely
Very Likely
Somewhat likely
Not very likely
Not at all likely
Overall, 18% are definitely or
very likely to visit Canada in the next 2 years
Base: Long-haul pleasure travellersNote: Including trips to other countries (e.g., the US) that involve a stay of one to three nights in Canada.
Source: Global Tourism Watch Japan, 2007
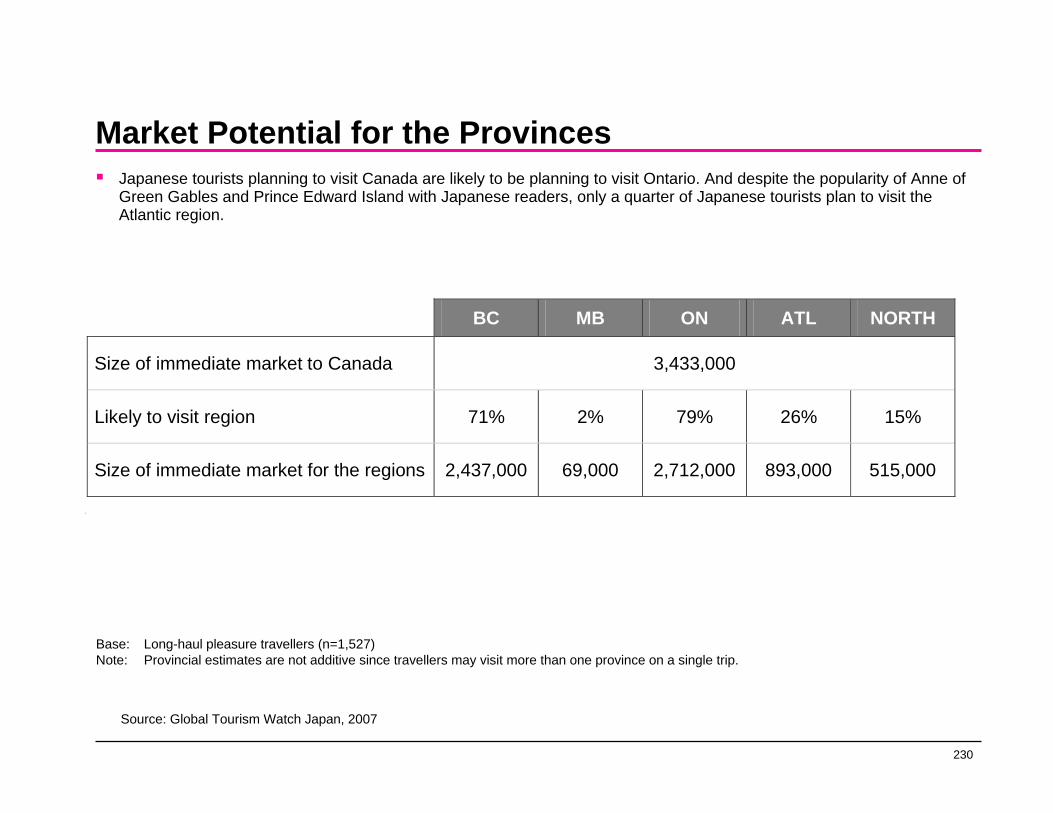
230
Market Potential for the Provinces
BC MB ON ATL NORTH
Size of immediate market to Canada 3,433,000
Likely to visit region 71% 2% 79% 26% 15%
Size of immediate market for the regions 2,437,000 69,000 2,712,000 893,000 515,000
11
Japanese tourists planning to visit Canada are likely to be planning to visit Ontario. And despite the popularity of Anne of Green Gables and Prince Edward Island with Japanese readers, only a quarter of Japanese tourists plan to visit the Atlantic region.
Base: Long-haul pleasure travellers (n=1,527)Note: Provincial estimates are not additive since travellers may visit more than one province on a single trip.
Source: Global Tourism Watch Japan, 2007
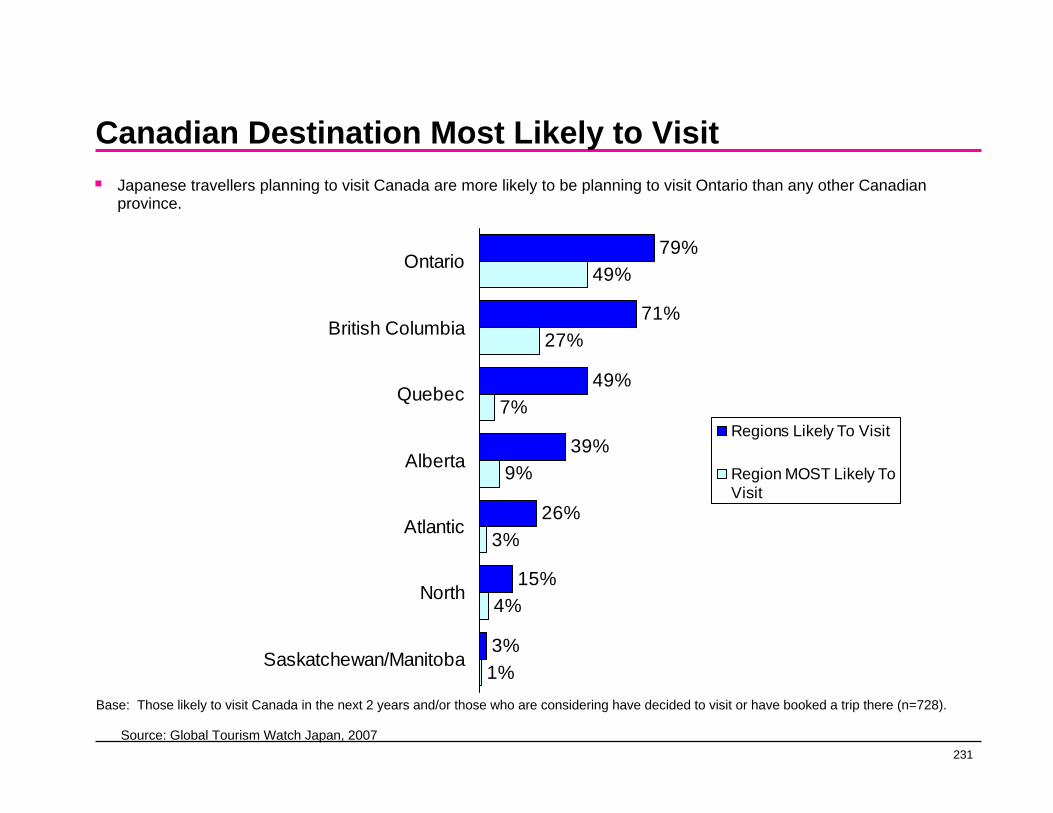
231
Canadian Destination Most Likely to Visit
79%
71%
49%
39%
26%
15%
3%
49%
27%
7%
9%
3%
4%
1%
Ontario
British Columbia
Quebec
Alberta
Atlantic
North
Saskatchewan/Manitoba
Regions Likely To Visit
Region MOST Likely ToVisit
Base: Those likely to visit Canada in the next 2 years and/or those who are considering have decided to visit or have booked a trip there (n=728).
Source: Global Tourism Watch Japan, 2007
Japanese travellers planning to visit Canada are more likely to be planning to visit Ontario than any other Canadian province.
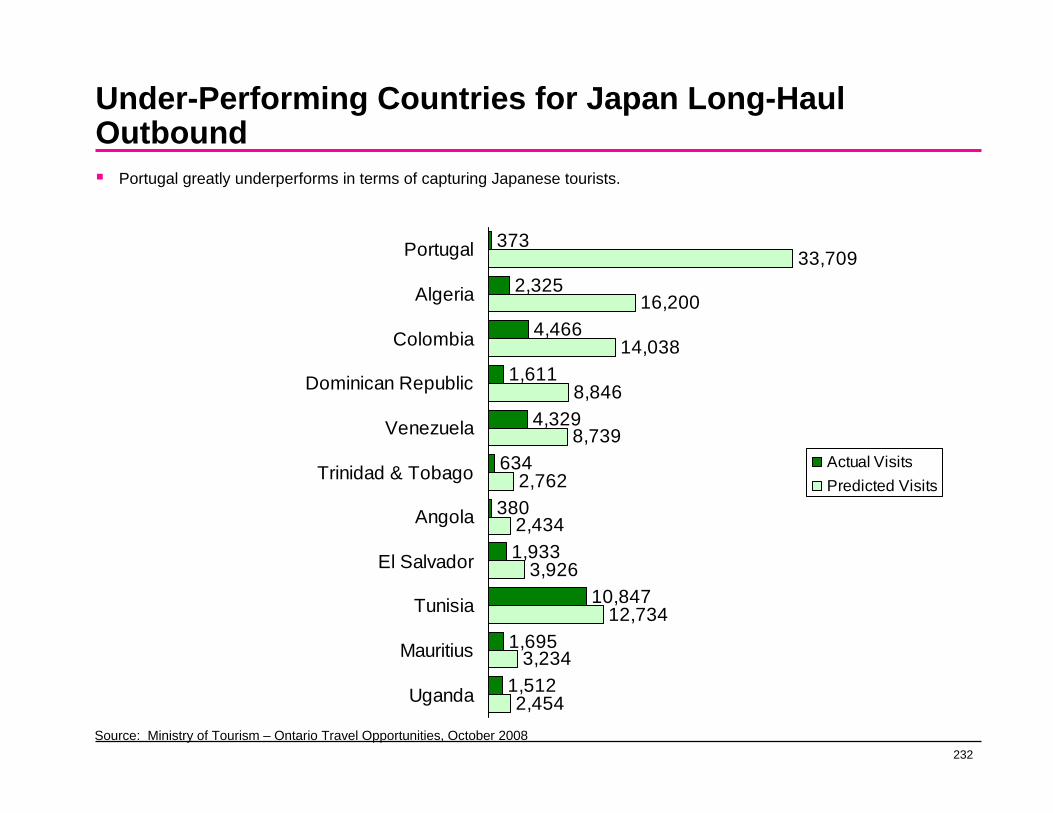
232
Under-Performing Countries for Japan Long-Haul Outbound
Portugal greatly underperforms in terms of capturing Japanese tourists.
373
2,325
4,466
1,611
4,329
634
380
1,933
10,847
1,695
1,512
33,709
16,200
14,038
8,846
8,739
2,762
2,434
3,926
12,734
3,234
2,454
Portugal
Algeria
Colombia
Dominican Republic
Venezuela
Trinidad & Tobago
Angola
El Salvador
Tunisia
Mauritius
Uganda
Actual VisitsPredicted Visits
Source: Ministry of Tourism – Ontario Travel Opportunities, October 2008
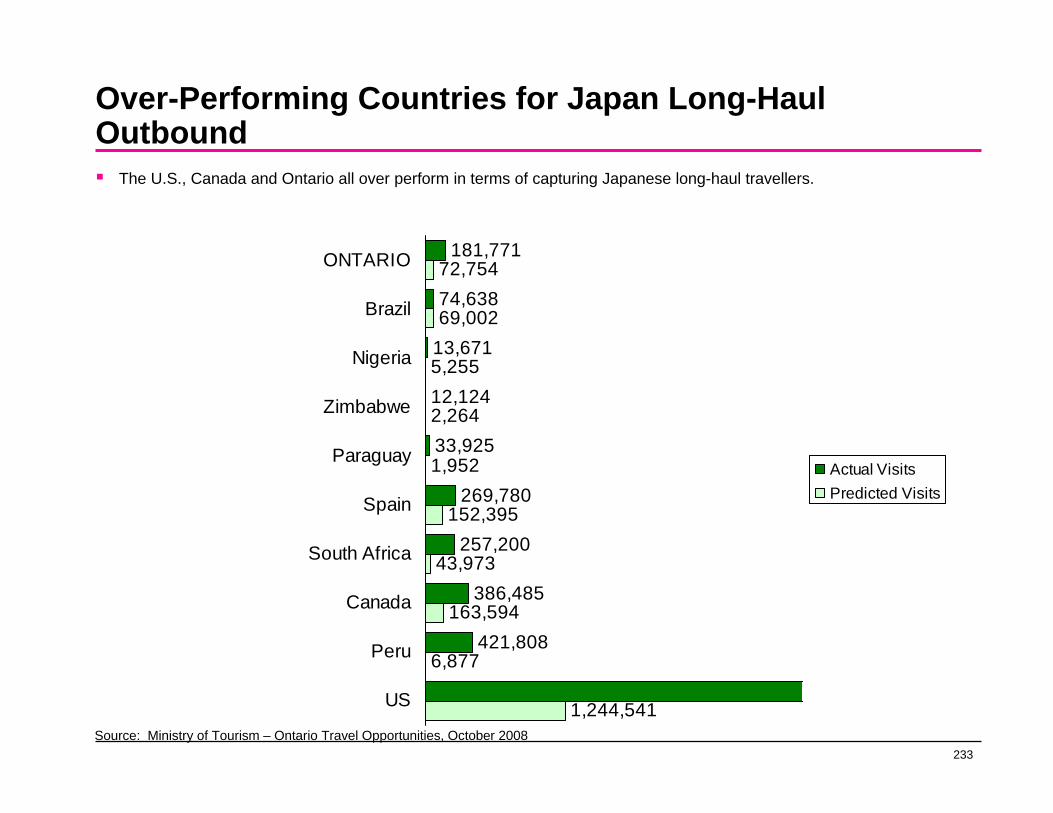
233
Over-Performing Countries for Japan Long-Haul Outbound
The U.S., Canada and Ontario all over perform in terms of capturing Japanese long-haul travellers.
181,771
74,638
13,671
12,124
33,925
269,780
257,200
386,485
421,808
72,754
69,002
5,255
2,264
1,952
152,395
43,973
163,594
6,877
1,244,541
ONTARIO
Brazil
Nigeria
Zimbabwe
Paraguay
Spain
South Africa
Canada
Peru
US
Actual VisitsPredicted Visits
Source: Ministry of Tourism – Ontario Travel Opportunities, October 2008

234
Japan - Canadian Visitor Expenditure ProfileWhile Japanese visitors spend between $6,000 and $7,000, per party, in Canada, this amount is generally spread across several provinces. Nevertheless, B.C. and Ontario each capture a substantial portion.
Average expenditure per party per trip (Yen) 534,000
Exchange Rate (Nov. 3, 2008) 80.4299
Average expenditure per party per trip (Cdn.) $6,638.21
Average # of nights 12
Average expenditure per person per night (Cdn) $548.61 11
Source: CTC Restoring Canada’s Growth/Yield with the Japanese Travel Market, July 2007
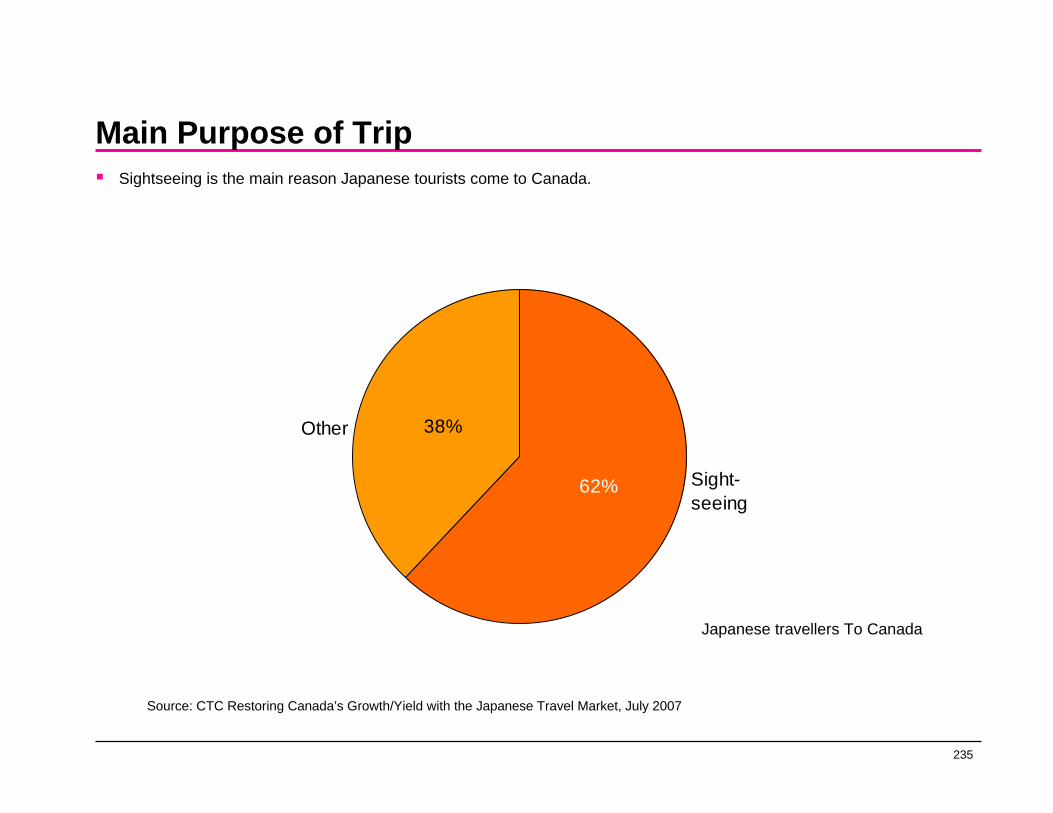
235
Main Purpose of TripSightseeing is the main reason Japanese tourists come to Canada.
38%
62% Sight-seeing
Other
Source: CTC Restoring Canada’s Growth/Yield with the Japanese Travel Market, July 2007
Japanese travellers To Canada

236
China
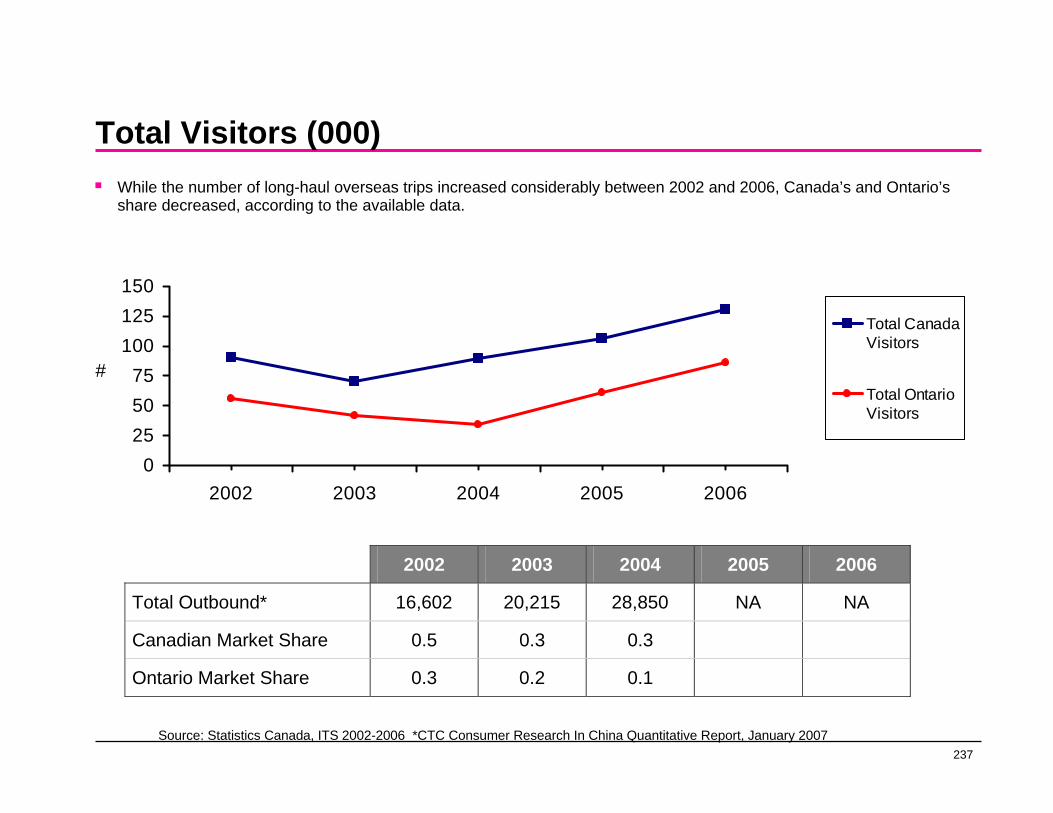
237
Total Visitors (000)
0255075
100125150
2002 2003 2004 2005 2006
#
Total CanadaVisitors
Total OntarioVisitors
2002 2003 2004 2005 2006
Total Outbound* 16,602 20,215 28,850 NA NA
Canadian Market Share 0.5 0.3 0.3
Ontario Market Share 0.3 0.2 0.1
Source: Statistics Canada, ITS 2002-2006 *CTC Consumer Research In China Quantitative Report, January 2007
While the number of long-haul overseas trips increased considerably between 2002 and 2006, Canada’s and Ontario’s share decreased, according to the available data.

238
Main Reason for TripIn contrast to travellers from France and Germany who want to mingle with the local population, Chinese travellers are more interested in enjoying the company of their travelling companions.
Ontario Canada (214) (260) % % To spend quality time with friends and family 24 26
For rest and relaxation 21 21
For learning and discovery 18 17
To have fun and be entertained 16 15
To see something new and different 12 12
To enjoy the good life and be pampered 5 5
To improve my body and spirit 3 4
Source: CTC Consumer Research In China Quantitative Report, January 2007

239
Interest in Visiting Canada by Market
19%
33%
17%
19%
7%
41%
35%
32%
47%
50%
60%
68%
49%
66%
57%
Overall, one in five Chinese long-haul travellers is very interested in visiting Canada in the next 2 years.
Next Two Years Next Five years
Total (n=1,373)
Guangzhou (n=348)
Shanghai (n=343)
Beijing (n=346)
Shenzhen (n=336)
26%
41%
21%
28%
14%
47%
30%
37%
51%
70%
73%
71%
58%
79%
84%
Total (n=1,336)
Guangzhou (n=344)
Shanghai (n=339)
Beijing (n=338)
Shenzhen (n=315)
Very Interested Somewhat Interested Total
Source: CTC Consumer Research In China Quantitative Report, January 2007
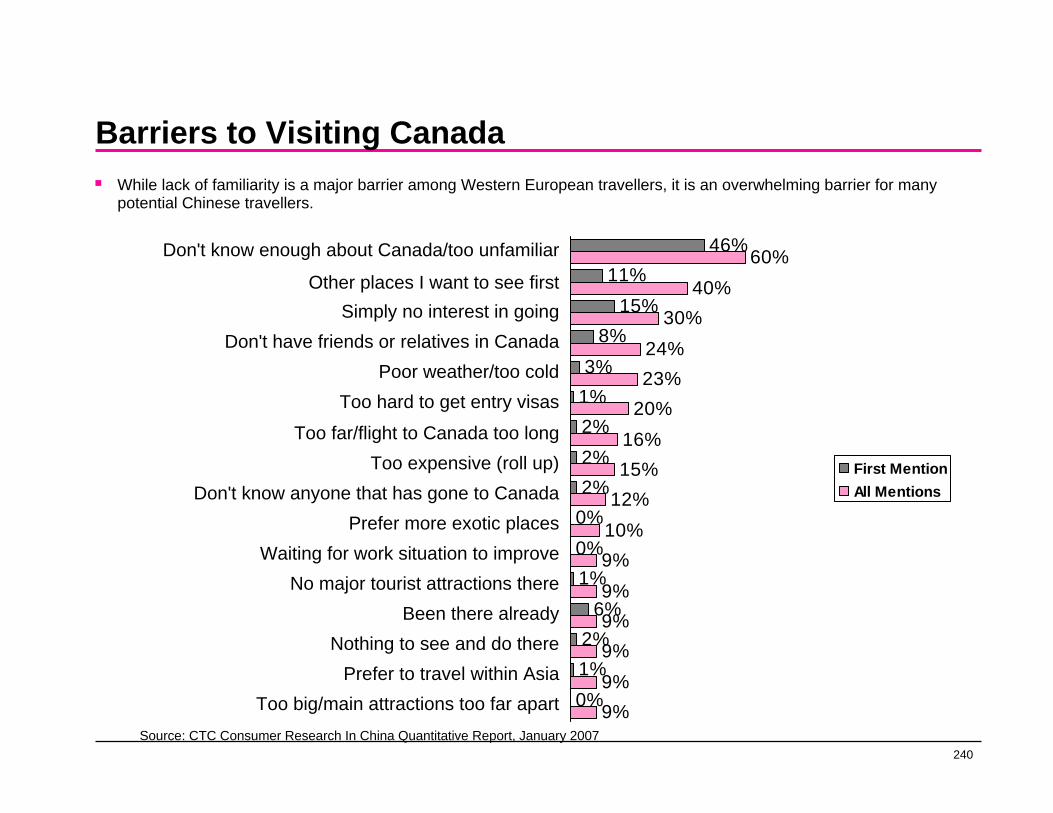
240
Barriers to Visiting Canada
46%11%
15%8%
3%1%2%2%2%
0%0%1%
6%2%1%0%
60%40%
30%24%23%
20%16%15%
12%10%9%9%9%9%9%9%
First MentionAll Mentions
Don't know enough about Canada/too unfamiliar
Other places I want to see firstSimply no interest in going
Don't have friends or relatives in CanadaPoor weather/too cold
Too hard to get entry visas
Too far/flight to Canada too longToo expensive (roll up)
Don't know anyone that has gone to CanadaPrefer more exotic places
Waiting for work situation to improveNo major tourist attractions there
Been there alreadyNothing to see and do there
Prefer to travel within AsiaToo big/main attractions too far apart
Source: CTC Consumer Research In China Quantitative Report, January 2007
While lack of familiarity is a major barrier among Western European travellers, it is an overwhelming barrier for many potential Chinese travellers.

241
Dream Destination
52%
39%
37%
66%
27%
11%
9%
10%
6%
5%
48%
44%
32%
32%
25%
23%
16%
15%
8%
8%
United States
France
Australia
Canada
Switzerland
UK
Italy
Japan
New Zealand
Germany
25%
9%
35%
12%
2%
4%
2%
2%
0%
1%
23%
16%
13%
13%
6%
6%
4%
4%
2%
2%
United States
France
Canada
Australia
UK
Switzerland
Italy
Japan
New Zealand
GermanyInterested In Visiting Canada
Total
Note: Respondents were asked to indicate their top three dream destinations. Interested in visiting Canada as defined as those who are very interested in visiting in the next 2 years (n=262). Total N-1,295).
Source: CTC Consumer Research In China Quantitative Report, January 2007
First Mentions All Mentions
Nevertheless, Canada ranks fairly high among places that Chinese travellers would like to visit, about on par with Australia.
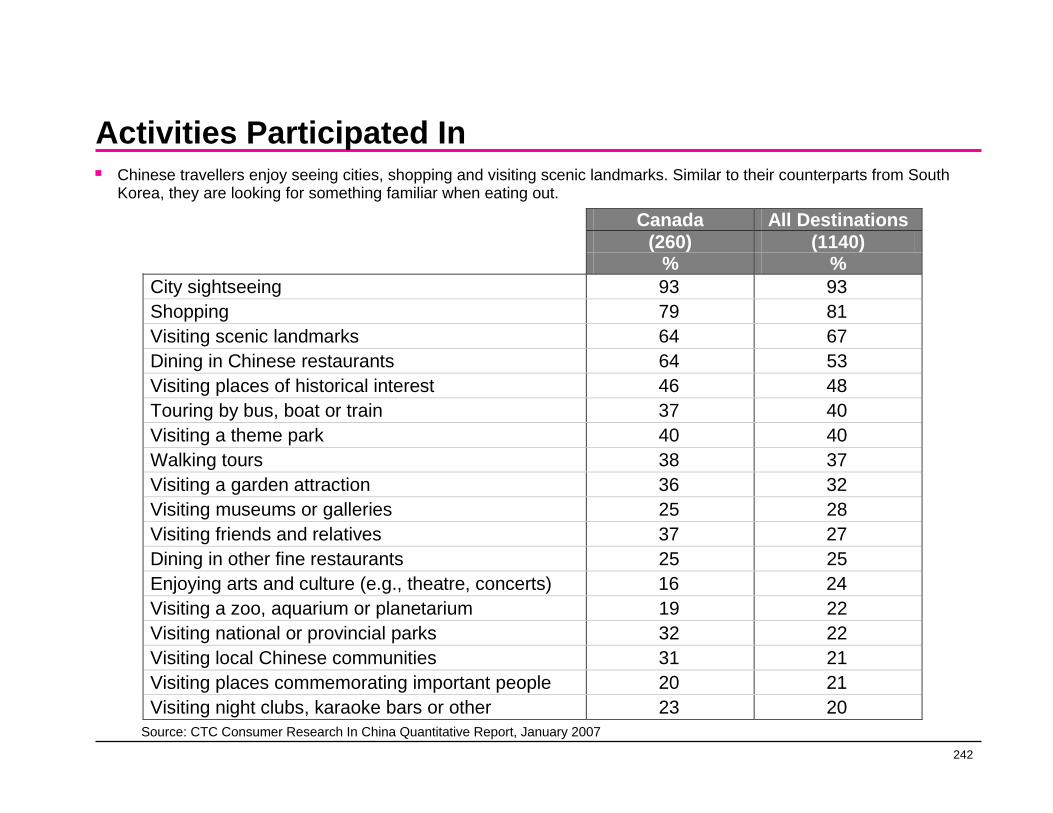
242
Activities Participated InChinese travellers enjoy seeing cities, shopping and visiting scenic landmarks. Similar to their counterparts from South Korea, they are looking for something familiar when eating out.
Canada All Destinations (260) (1140) % % City sightseeing 93 93 Shopping 79 81 Visiting scenic landmarks 64 67 Dining in Chinese restaurants 64 53 Visiting places of historical interest 46 48 Touring by bus, boat or train 37 40 Visiting a theme park 40 40 Walking tours 38 37 Visiting a garden attraction 36 32 Visiting museums or galleries 25 28 Visiting friends and relatives 37 27 Dining in other fine restaurants 25 25 Enjoying arts and culture (e.g., theatre, concerts) 16 24 Visiting a zoo, aquarium or planetarium 19 22 Visiting national or provincial parks 32 22 Visiting local Chinese communities 31 21 Visiting places commemorating important people 20 21 Visiting night clubs, karaoke bars or other 23 20 Source: CTC Consumer Research In China Quantitative Report, January 2007
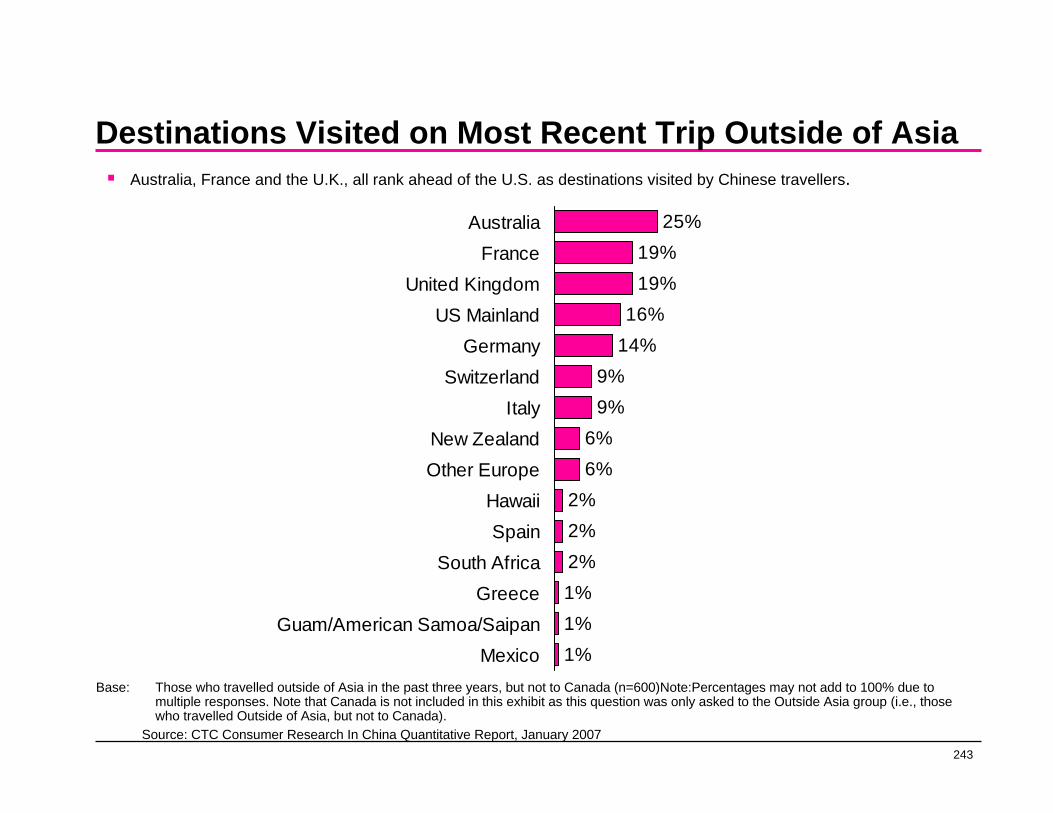
243
Destinations Visited on Most Recent Trip Outside of Asia
25%19%19%
16%14%
9%9%
6%6%
2%2%2%1%1%1%
AustraliaFrance
United KingdomUS Mainland
GermanySwitzerland
ItalyNew ZealandOther Europe
HawaiiSpain
South AfricaGreece
Guam/American Samoa/SaipanMexico
Base: Those who travelled outside of Asia in the past three years, but not to Canada (n=600)Note:Percentages may not add to 100% due to multiple responses. Note that Canada is not included in this exhibit as this question was only asked to the Outside Asia group (i.e., those who travelled Outside of Asia, but not to Canada).
Source: CTC Consumer Research In China Quantitative Report, January 2007
Australia, France and the U.K., all rank ahead of the U.S. as destinations visited by Chinese travellers.
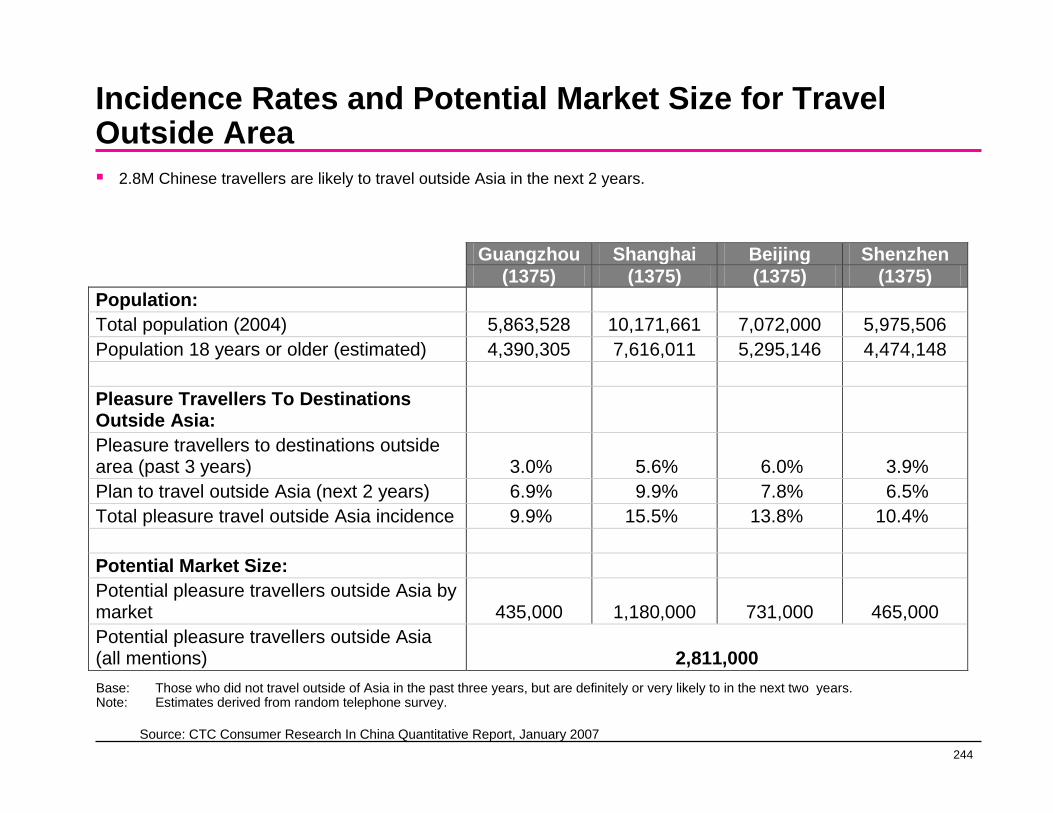
244
Incidence Rates and Potential Market Size for Travel Outside Area
2.8M Chinese travellers are likely to travel outside Asia in the next 2 years.
Guangzhou Shanghai Beijing Shenzhen (1375) (1375) (1375) (1375) Population: Total population (2004) 5,863,528 10,171,661 7,072,000 5,975,506 Population 18 years or older (estimated) 4,390,305 7,616,011 5,295,146 4,474,148 Pleasure Travellers To Destinations Outside Asia:
Pleasure travellers to destinations outside area (past 3 years) 3.0% 5.6% 6.0% 3.9% Plan to travel outside Asia (next 2 years) 6.9% 9.9% 7.8% 6.5% Total pleasure travel outside Asia incidence 9.9% 15.5% 13.8% 10.4% Potential Market Size: Potential pleasure travellers outside Asia by market 435,000 1,180,000 731,000 465,000 Potential pleasure travellers outside Asia (all mentions) 2,811,000 Base: Those who did not travel outside of Asia in the past three years, but are definitely or very likely to in the next two years.Note: Estimates derived from random telephone survey.
Source: CTC Consumer Research In China Quantitative Report, January 2007
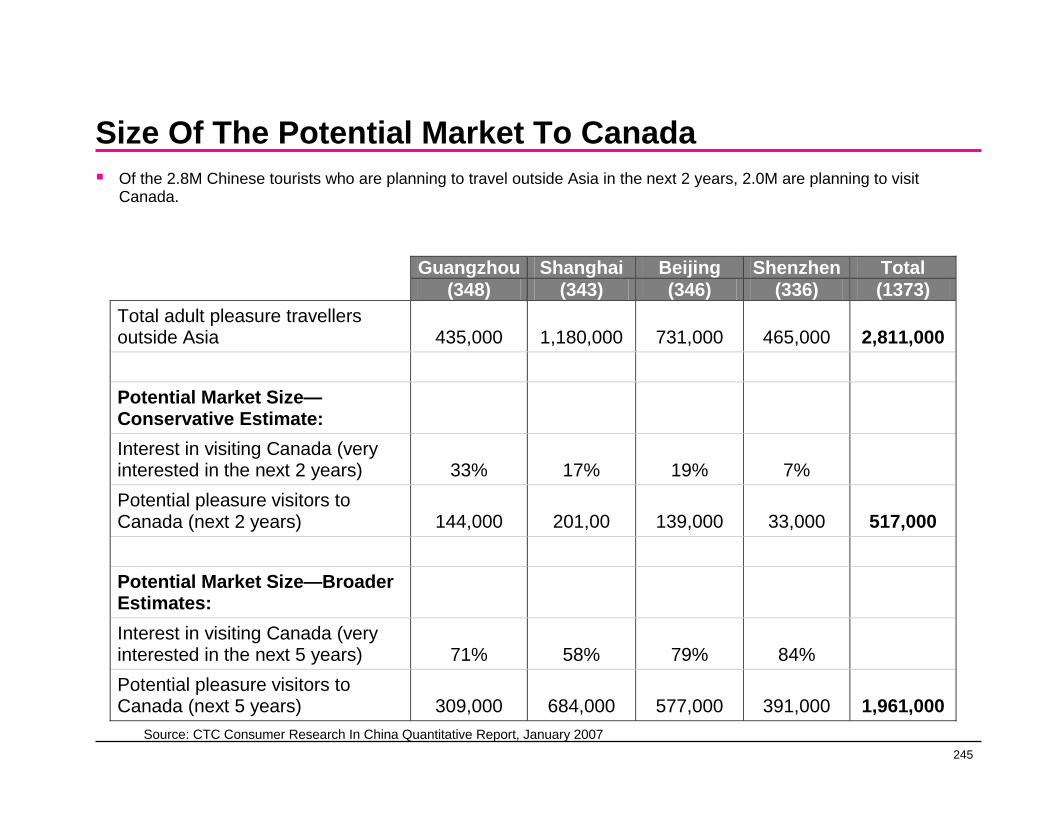
245
Size Of The Potential Market To CanadaOf the 2.8M Chinese tourists who are planning to travel outside Asia in the next 2 years, 2.0M are planning to visit Canada.
Guangzhou Shanghai Beijing Shenzhen Total (348) (343) (346) (336) (1373) Total adult pleasure travellers outside Asia 435,000 1,180,000 731,000 465,000 2,811,000 Potential Market Size—Conservative Estimate:
Interest in visiting Canada (very interested in the next 2 years) 33% 17% 19% 7% Potential pleasure visitors to Canada (next 2 years) 144,000 201,00 139,000 33,000 517,000 Potential Market Size—Broader Estimates:
Interest in visiting Canada (very interested in the next 5 years) 71% 58% 79% 84% Potential pleasure visitors to Canada (next 5 years) 309,000 684,000 577,000 391,000 1,961,000 Source: CTC Consumer Research In China Quantitative Report, January 2007
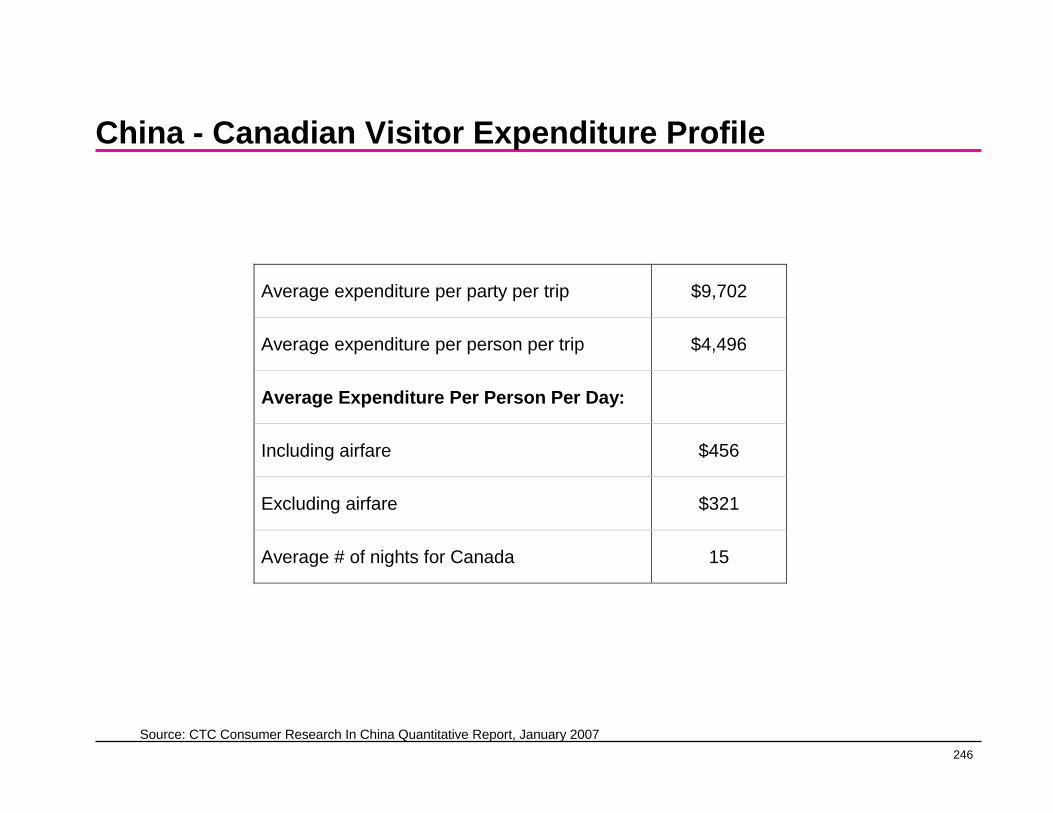
246
China - Canadian Visitor Expenditure Profile
Average expenditure per party per trip $9,702
Average expenditure per person per trip $4,496
Average Expenditure Per Person Per Day:
Including airfare $456
Excluding airfare $321
Average # of nights for Canada 15 11
Source: CTC Consumer Research In China Quantitative Report, January 2007
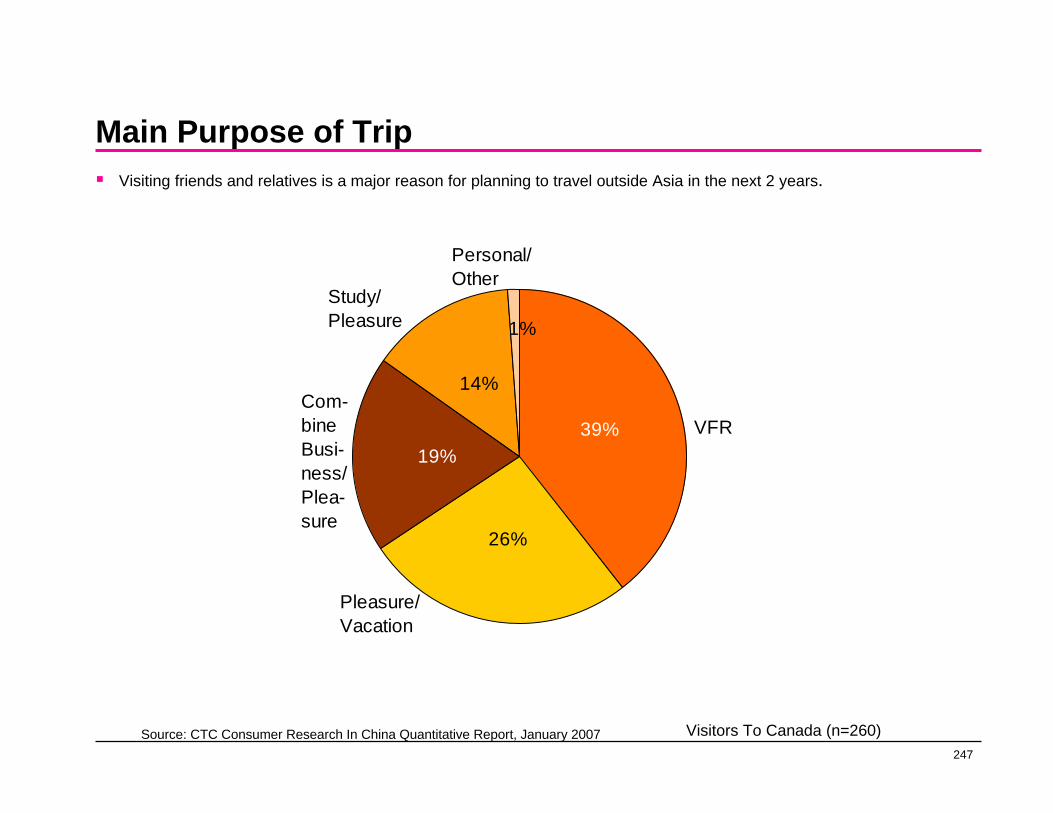
247
Main Purpose of TripVisiting friends and relatives is a major reason for planning to travel outside Asia in the next 2 years.
1%
14%
19%
26%
39% VFR
Pleasure/Vacation
Personal/Other
Com-bine Busi-ness/ Plea-sure
Study/ Pleasure
Source: CTC Consumer Research In China Quantitative Report, January 2007 Visitors To Canada (n=260)
248
India
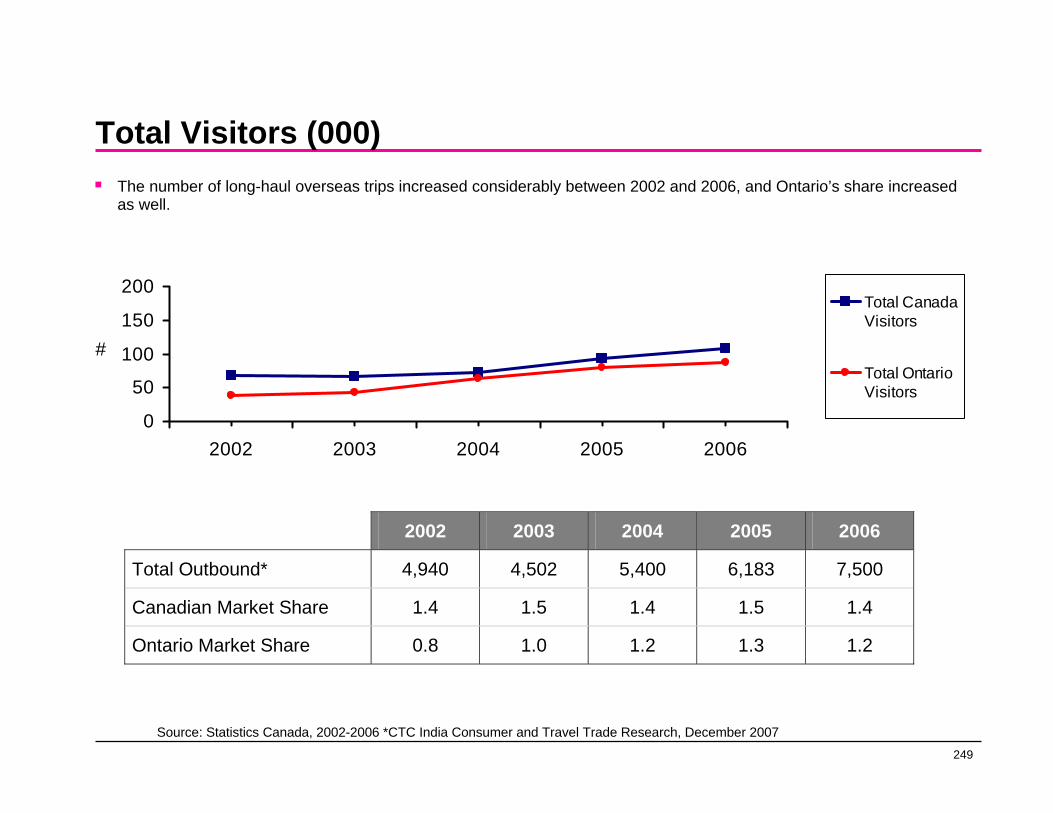
249
Total Visitors (000)
0
50
100
150
200
2002 2003 2004 2005 2006
#
Total Canada Visitors
Total OntarioVisitors
2002 2003 2004 2005 2006
Total Outbound* 4,940 4,502 5,400 6,183 7,500
Canadian Market Share 1.4 1.5 1.4 1.5 1.4
Ontario Market Share 0.8 1.0 1.2 1.3 1.2
Source: Statistics Canada, 2002-2006 *CTC India Consumer and Travel Trade Research, December 2007
The number of long-haul overseas trips increased considerably between 2002 and 2006, and Ontario’s share increased as well.
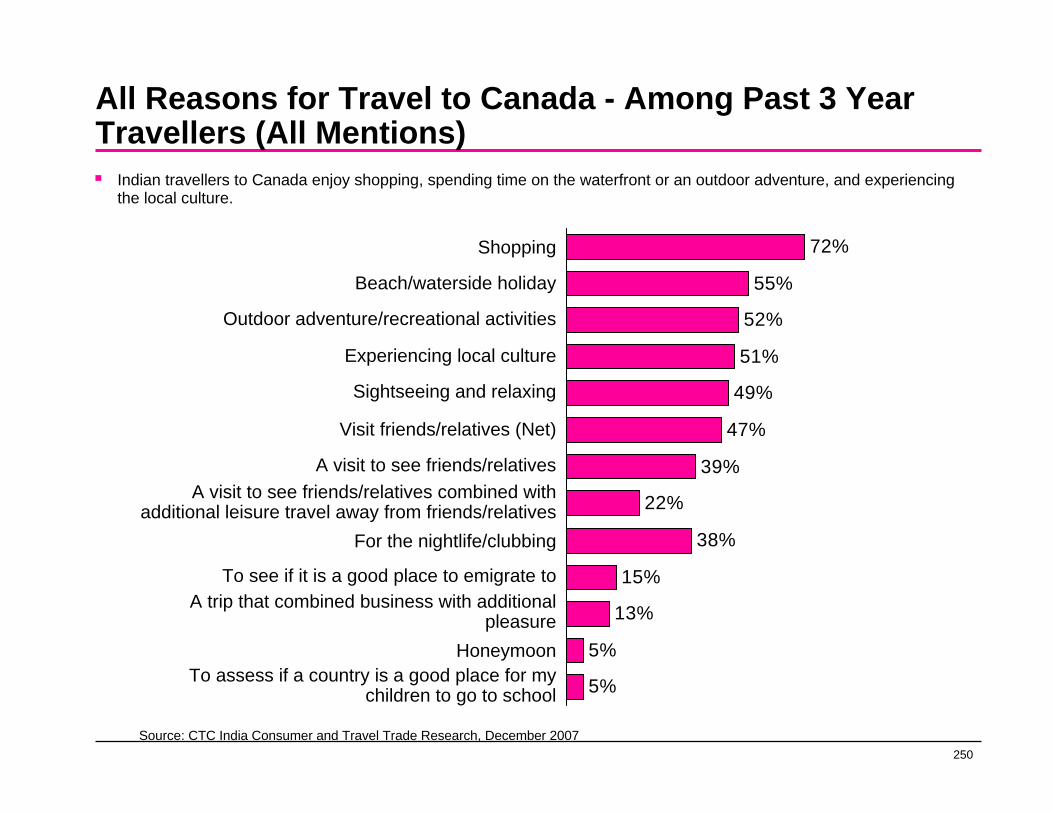
250
All Reasons for Travel to Canada - Among Past 3 Year Travellers (All Mentions)
72%
55%
52%
51%
49%
47%
39%
22%
38%
15%
13%
5%
5%
Shopping
Beach/waterside holiday
Outdoor adventure/recreational activities
Experiencing local culture
Sightseeing and relaxing
Visit friends/relatives (Net)
A visit to see friends/relativesA visit to see friends/relatives combined with
additional leisure travel away from friends/relativesFor the nightlife/clubbing
To see if it is a good place to emigrate toA trip that combined business with additional
pleasureHoneymoon
To assess if a country is a good place for my children to go to school
Source: CTC India Consumer and Travel Trade Research, December 2007
Indian travellers to Canada enjoy shopping, spending time on the waterfront or an outdoor adventure, and experiencing the local culture.
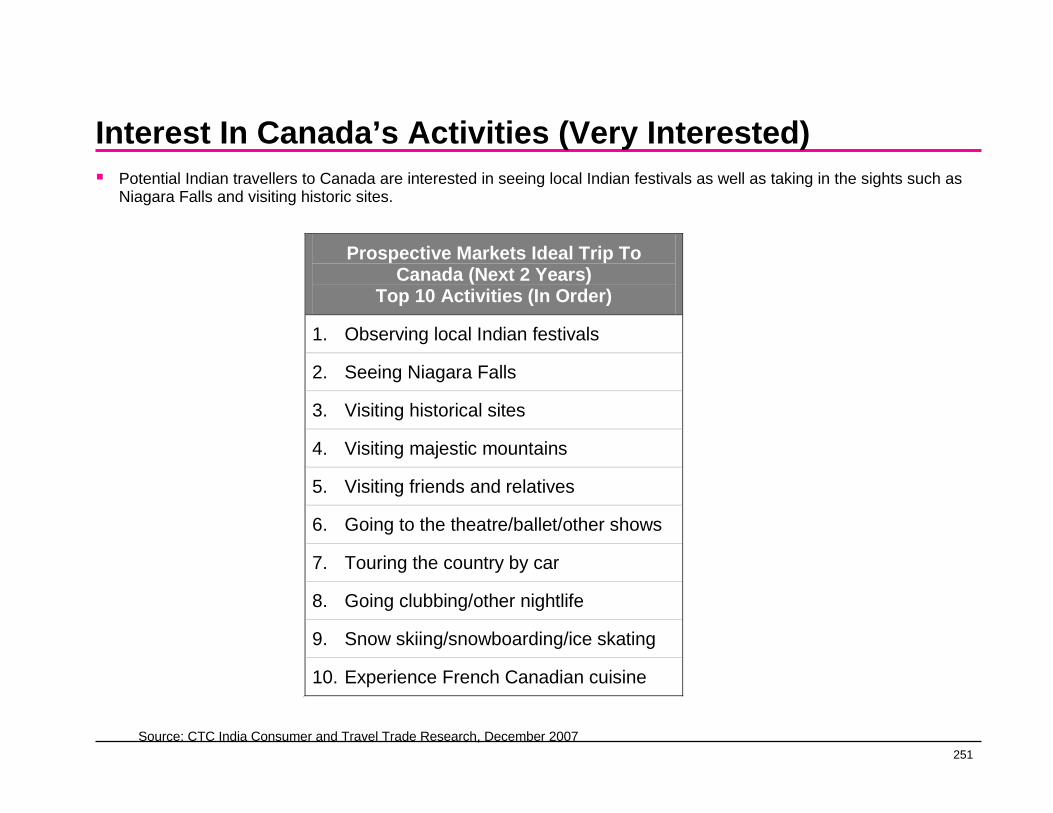
251
Interest In Canada’s Activities (Very Interested)Potential Indian travellers to Canada are interested in seeing local Indian festivals as well as taking in the sights such as Niagara Falls and visiting historic sites.
Prospective Markets Ideal Trip To Canada (Next 2 Years)
Top 10 Activities (In Order)
1. Observing local Indian festivals
2. Seeing Niagara Falls
3. Visiting historical sites
4. Visiting majestic mountains
5. Visiting friends and relatives
6. Going to the theatre/ballet/other shows
7. Touring the country by car
8. Going clubbing/other nightlife
9. Snow skiing/snowboarding/ice skating
10. Experience French Canadian cuisine 11
Source: CTC India Consumer and Travel Trade Research, December 2007
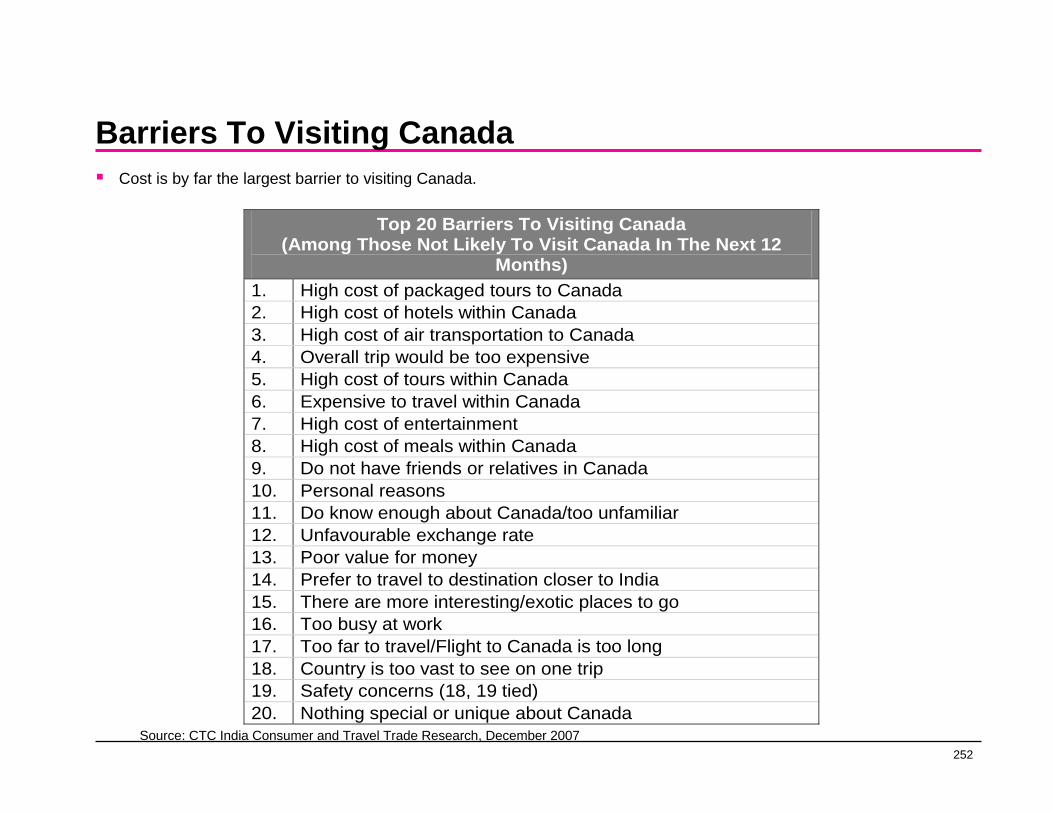
252
Barriers To Visiting CanadaCost is by far the largest barrier to visiting Canada.
Top 20 Barriers To Visiting Canada (Among Those Not Likely To Visit Canada In The Next 12
Months) 1. High cost of packaged tours to Canada 2. High cost of hotels within Canada 3. High cost of air transportation to Canada 4. Overall trip would be too expensive 5. High cost of tours within Canada 6. Expensive to travel within Canada 7. High cost of entertainment 8. High cost of meals within Canada 9. Do not have friends or relatives in Canada 10. Personal reasons 11. Do know enough about Canada/too unfamiliar 12. Unfavourable exchange rate 13. Poor value for money 14. Prefer to travel to destination closer to India 15. There are more interesting/exotic places to go 16. Too busy at work 17. Too far to travel/Flight to Canada is too long 18. Country is too vast to see on one trip 19. Safety concerns (18, 19 tied) 20. Nothing special or unique about Canada Source: CTC India Consumer and Travel Trade Research, December 2007
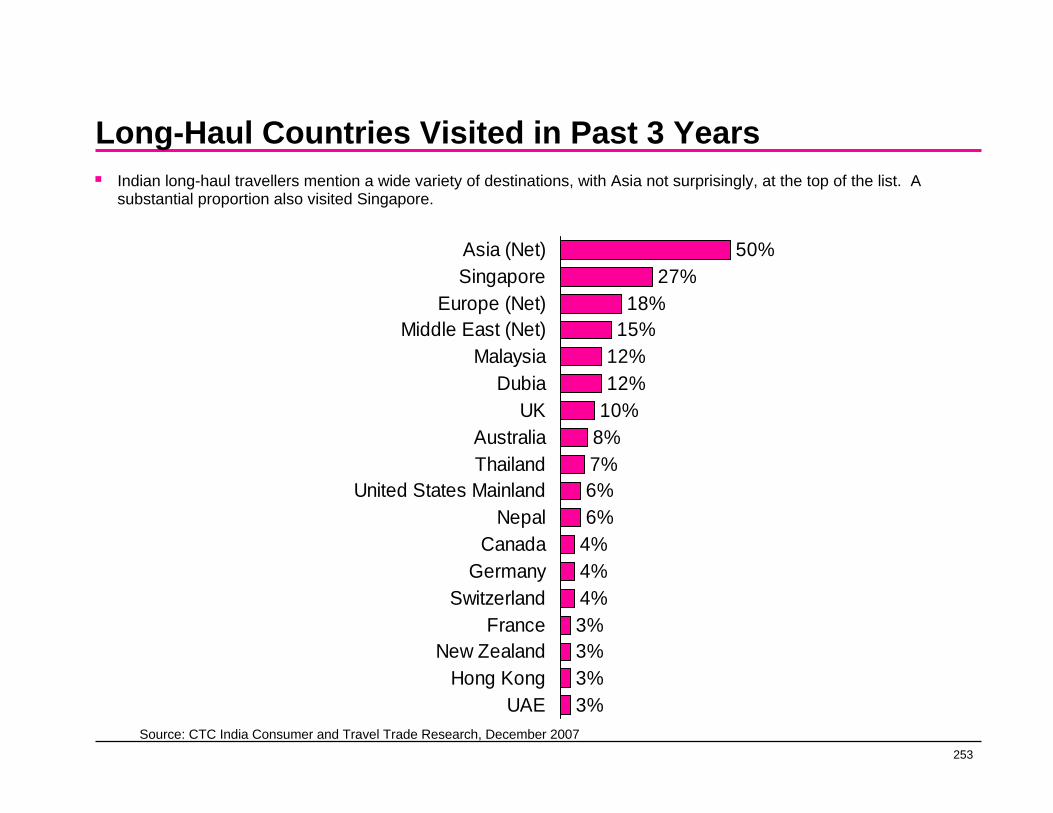
253
Long-Haul Countries Visited in Past 3 Years
50%27%
18%15%
12%12%
10%8%7%6%6%
4%4%4%3%3%3%3%
Asia (Net)Singapore
Europe (Net)Middle East (Net)
MalaysiaDubia
UKAustraliaThailand
United States MainlandNepal
CanadaGermany
SwitzerlandFrance
New ZealandHong Kong
UAESource: CTC India Consumer and Travel Trade Research, December 2007
Indian long-haul travellers mention a wide variety of destinations, with Asia not surprisingly, at the top of the list. A substantial proportion also visited Singapore.
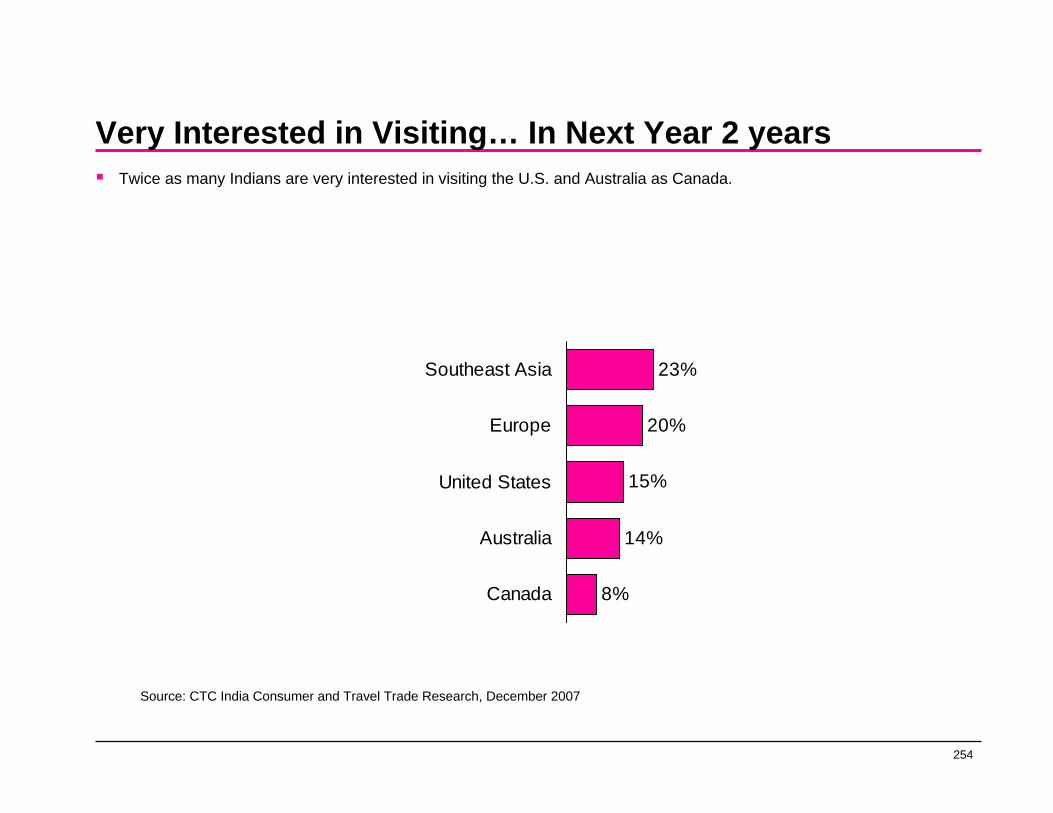
254
Very Interested in Visiting… In Next Year 2 years
23%
20%
15%
14%
8%
Southeast Asia
Europe
United States
Australia
Canada
Twice as many Indians are very interested in visiting the U.S. and Australia as Canada.
Source: CTC India Consumer and Travel Trade Research, December 2007

255
India - Canadian Visitor Expenditure Profile
Average party size (excluding lone travellers) 4.5
Average expenditure per party per trip $6,500
Average # of nights 9
Average expenditure per person per trip $1,444
Average expenditure per person per night $160.49 11
Source: CTC India Consumer and Travel Trade Research, December 2007
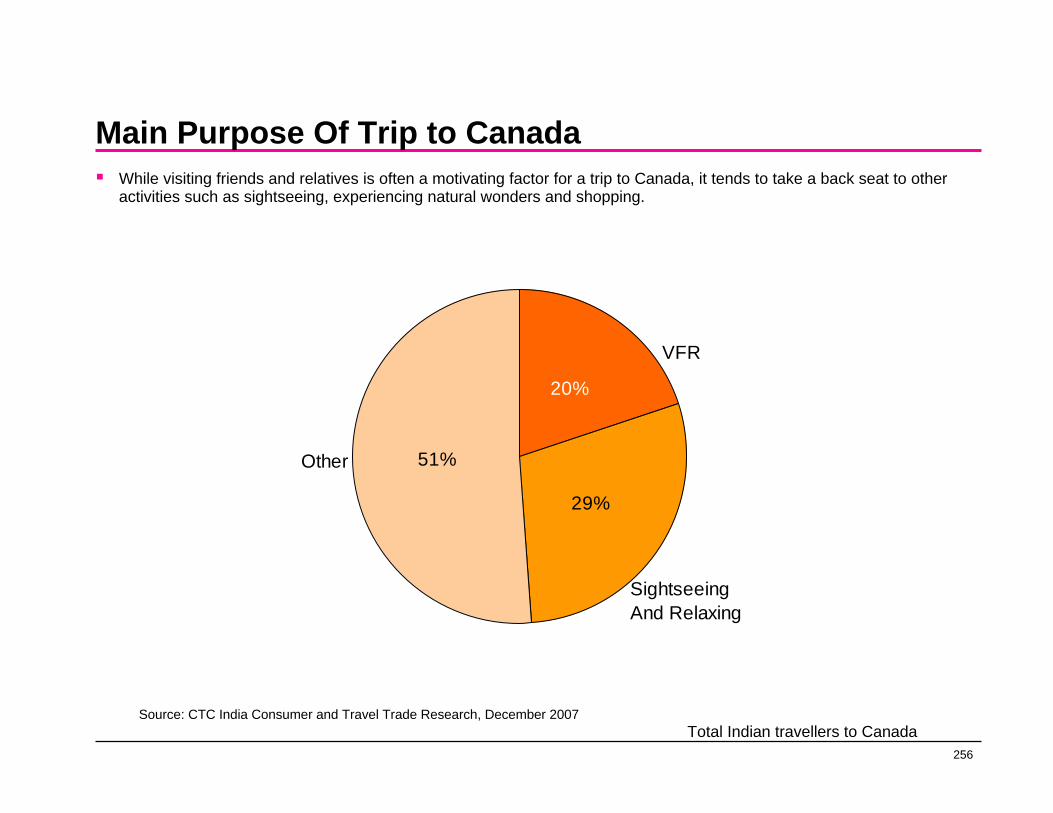
256
Main Purpose Of Trip to CanadaWhile visiting friends and relatives is often a motivating factor for a trip to Canada, it tends to take a back seat to other activities such as sightseeing, experiencing natural wonders and shopping.
51%
29%
20%
VFR
Sightseeing And Relaxing
Other
Source: CTC India Consumer and Travel Trade Research, December 2007Total Indian travellers to Canada

257
Australia

258
Total Visitors
0
50
100
150
200
2002 2003 2004 2005 2006
#
Total Canada Visitors
Total OntarioVisitors
2002 2003 2004 2005 2006
Total Outbound* 3,461 3,388 4,369 4,759 4,941
Canadian Market Share 4.3 4.0 4.0 3.8 3.6
Ontario Market Share 1.8 1.2 1.7 1.3 1.2
Source: Statistics Canada, 2002-2006 *CTC Australia Consumer and Travel Trade Research, August 2007
Outbound long-haul travel from Australia increased considerably between 2002 and 2006. However, Canada’s and Ontario’s shares both decreased.
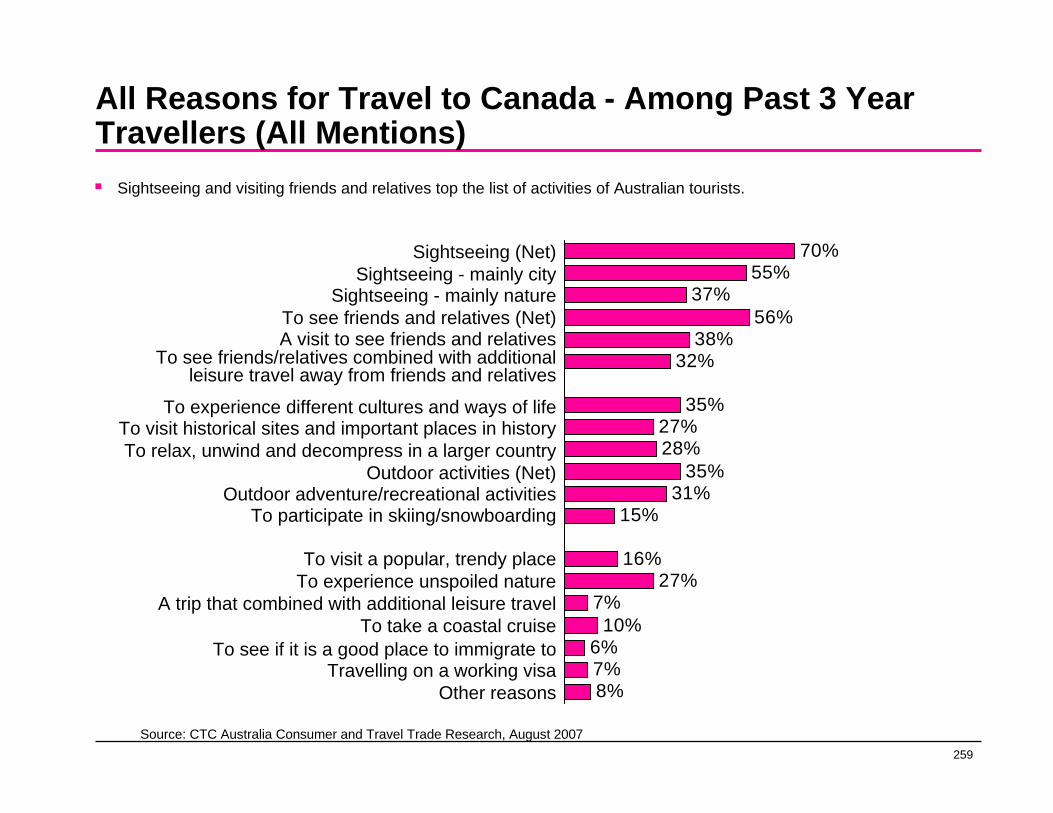
259
All Reasons for Travel to Canada - Among Past 3 Year Travellers (All Mentions)
70%55%
37%56%
38%32%
35%27%28%
35%31%
15%
16%27%
7%10%
6%7%8%
Sightseeing (Net)Sightseeing - mainly city
Sightseeing - mainly natureTo see friends and relatives (Net)A visit to see friends and relatives
To see friends/relatives combined with additional leisure travel away from friends and relatives
To experience different cultures and ways of lifeTo visit historical sites and important places in historyTo relax, unwind and decompress in a larger country
Outdoor activities (Net)Outdoor adventure/recreational activities
To participate in skiing/snowboarding
To visit a popular, trendy placeTo experience unspoiled nature
A trip that combined with additional leisure travelTo take a coastal cruise
To see if it is a good place to immigrate toTravelling on a working visa
Other reasons
Source: CTC Australia Consumer and Travel Trade Research, August 2007
Sightseeing and visiting friends and relatives top the list of activities of Australian tourists.

260
Interest in Canadian ActivitiesAustralians have a unique list of activities on their to-do list when planning a trip to Canada including seeing the Rockies, visiting historical sites, seeing unspoiled natural places and experiencing French Canadian culture/cuisine.
Prospective Markets Ideal Trip To Canada (Next 2 Years)
Top 10 Activities (In Order)
1. Seeing and experiencing the Rockies and Mountains
2. Visiting historical sites
3. Feeling the purity and freshness of untouched nature
4. Experiencing French Canadian culture/cuisine
5. Wild animals in their environment
6. See polar bears
7. Visiting museums and galleries
8. Culinary experiences (e.g., fine dining, winery tours)
9. Viewing aurora
10. Participate in an activity related to their hobbies 11
Source: CTC Australia Consumer and Travel Trade Research, August 2007
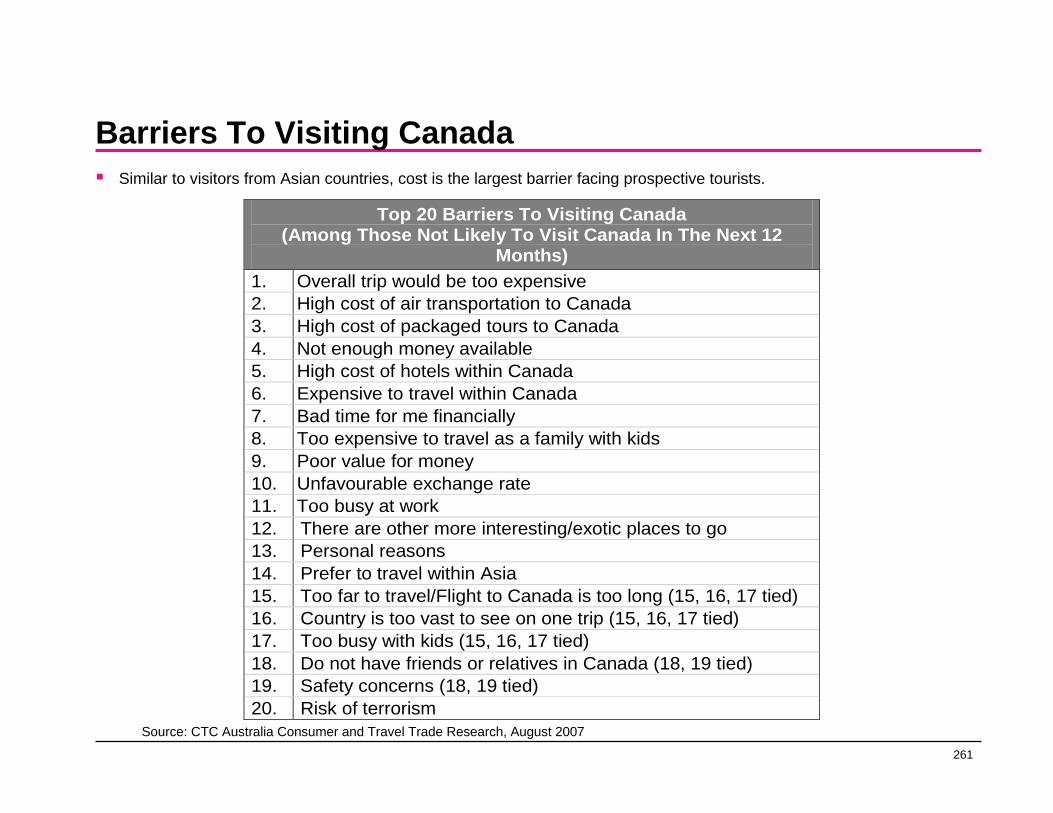
261
Barriers To Visiting CanadaSimilar to visitors from Asian countries, cost is the largest barrier facing prospective tourists.
Top 20 Barriers To Visiting Canada (Among Those Not Likely To Visit Canada In The Next 12
Months) 1. Overall trip would be too expensive 2. High cost of air transportation to Canada 3. High cost of packaged tours to Canada 4. Not enough money available 5. High cost of hotels within Canada 6. Expensive to travel within Canada 7. Bad time for me financially 8. Too expensive to travel as a family with kids 9. Poor value for money 10. Unfavourable exchange rate 11. Too busy at work 12. There are other more interesting/exotic places to go 13. Personal reasons 14. Prefer to travel within Asia 15. Too far to travel/Flight to Canada is too long (15, 16, 17 tied) 16. Country is too vast to see on one trip (15, 16, 17 tied) 17. Too busy with kids (15, 16, 17 tied) 18. Do not have friends or relatives in Canada (18, 19 tied) 19. Safety concerns (18, 19 tied) 20. Risk of terrorism Source: CTC Australia Consumer and Travel Trade Research, August 2007
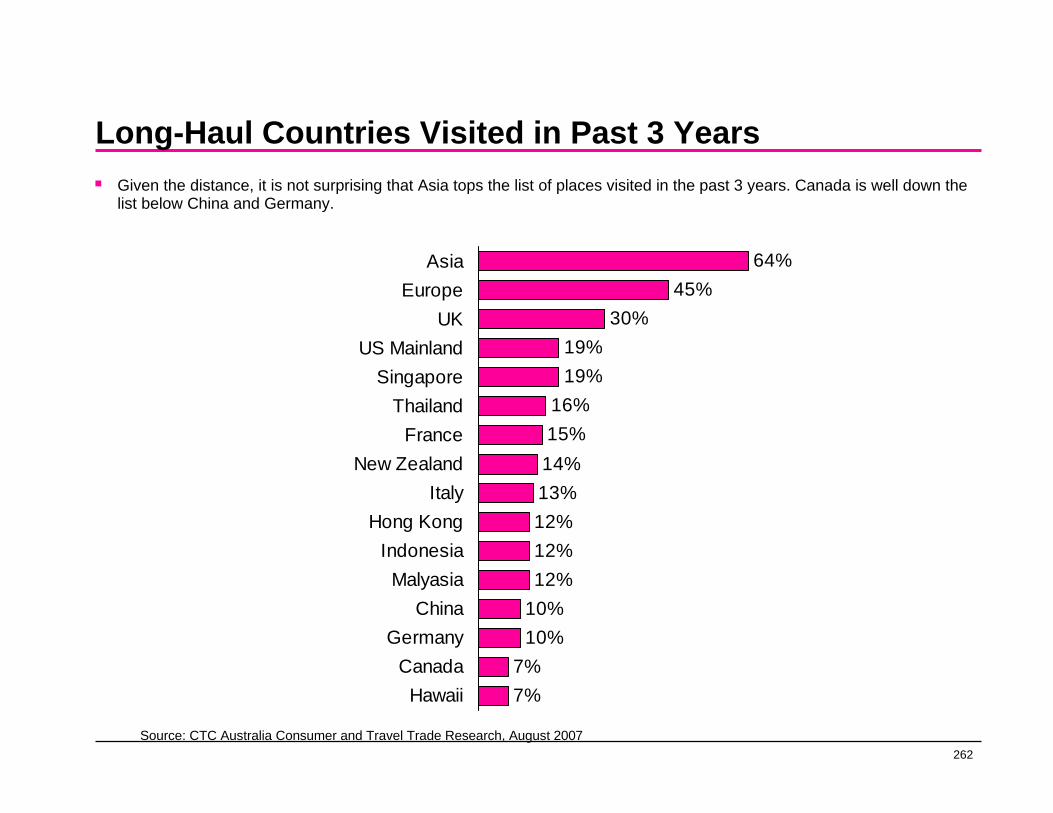
262
Long-Haul Countries Visited in Past 3 Years
64%45%
30%19%19%
16%15%14%13%12%12%12%
10%10%
7%7%
AsiaEurope
UKUS Mainland
SingaporeThailand
FranceNew Zealand
ItalyHong Kong
IndonesiaMalyasia
ChinaGermany
CanadaHawaii
Source: CTC Australia Consumer and Travel Trade Research, August 2007
Given the distance, it is not surprising that Asia tops the list of places visited in the past 3 years. Canada is well down the list below China and Germany.
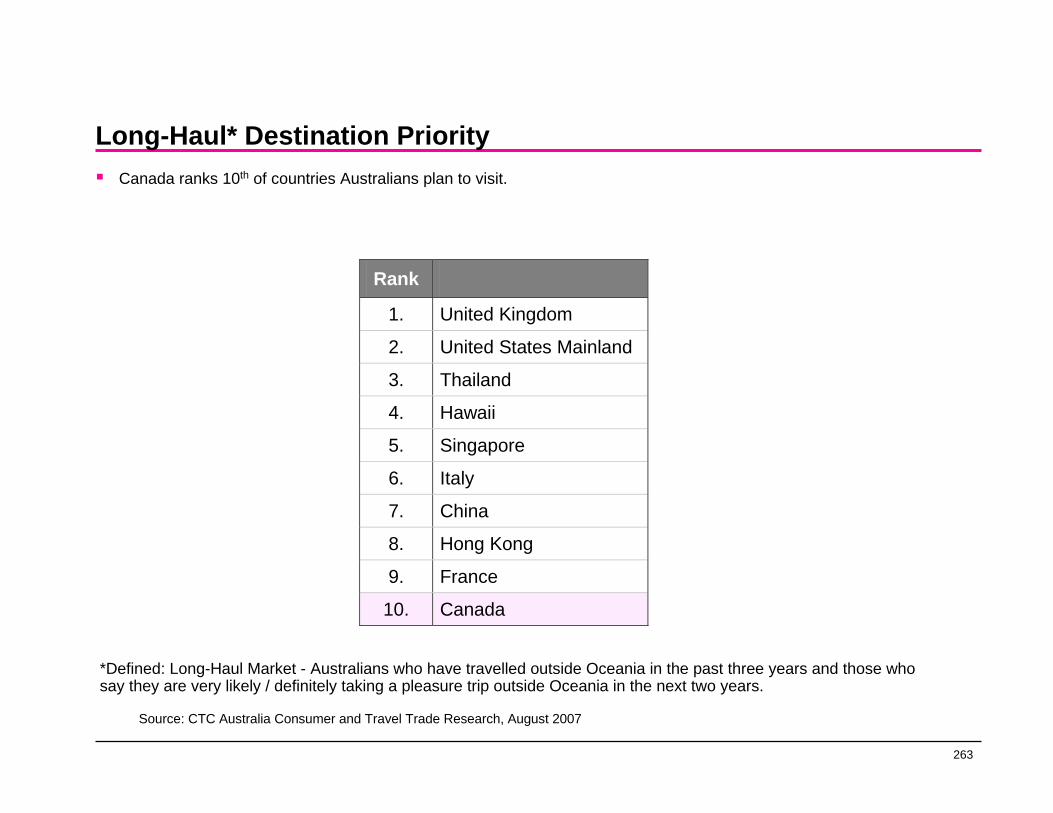
263
Long-Haul* Destination PriorityCanada ranks 10th of countries Australians plan to visit.
Rank
1. United Kingdom
2. United States Mainland
3. Thailand
4. Hawaii
5. Singapore
6. Italy
7. China
8. Hong Kong
9. France
10. Canada
Source: CTC Australia Consumer and Travel Trade Research, August 2007
*Defined: Long-Haul Market - Australians who have travelled outside Oceania in the past three years and those who say they are very likely / definitely taking a pleasure trip outside Oceania in the next two years.
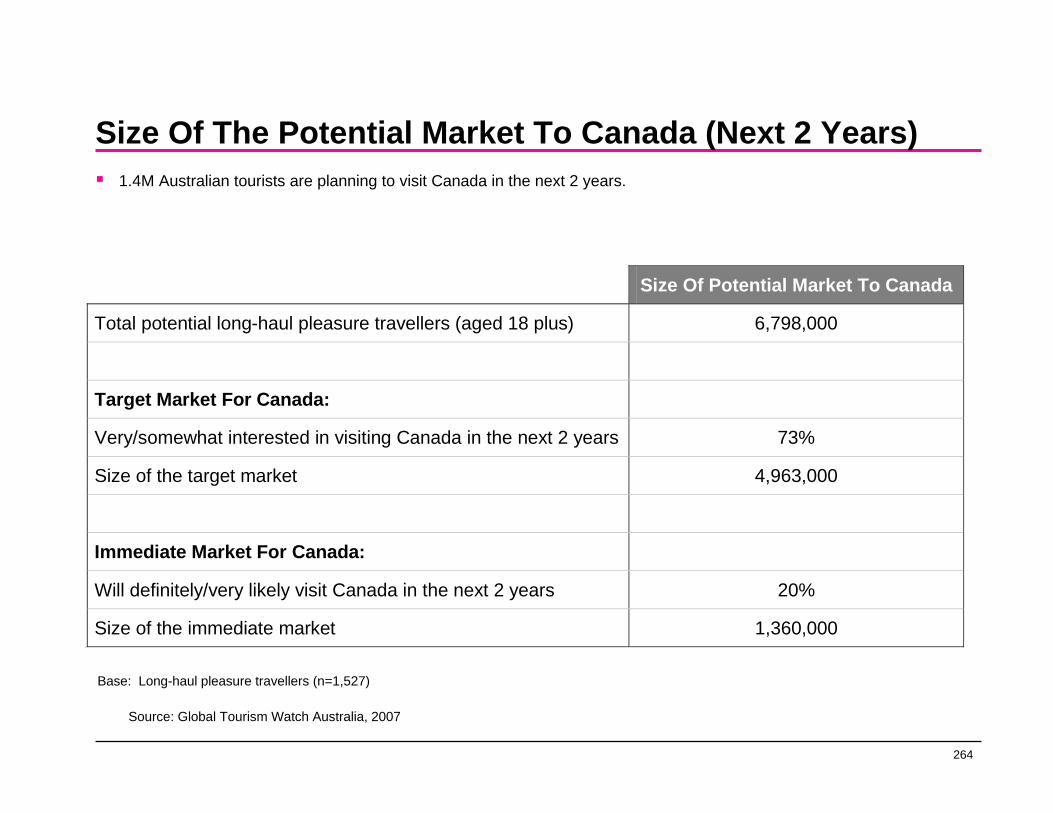
264
Size Of The Potential Market To Canada (Next 2 Years)
Size Of Potential Market To Canada
Total potential long-haul pleasure travellers (aged 18 plus) 6,798,000
Target Market For Canada:
Very/somewhat interested in visiting Canada in the next 2 years 73%
Size of the target market 4,963,000
Immediate Market For Canada:
Will definitely/very likely visit Canada in the next 2 years 20%
Size of the immediate market 1,360,000 11
1.4M Australian tourists are planning to visit Canada in the next 2 years.
Base: Long-haul pleasure travellers (n=1,527)
Source: Global Tourism Watch Australia, 2007
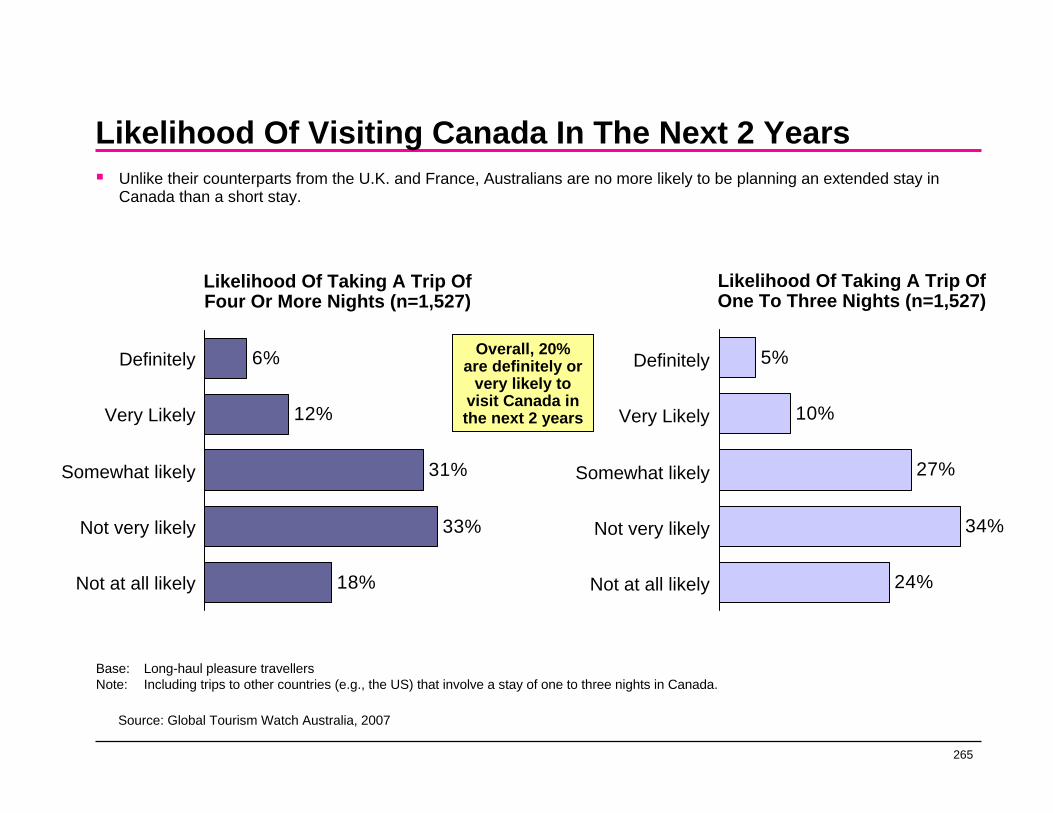
265
Likelihood Of Visiting Canada In The Next 2 Years
6%
12%
31%
33%
18%
Unlike their counterparts from the U.K. and France, Australians are no more likely to be planning an extended stay in Canada than a short stay.
Likelihood Of Taking A Trip Of Four Or More Nights (n=1,527)
Likelihood Of Taking A Trip Of One To Three Nights (n=1,527)
Definitely
Very Likely
Somewhat likely
Not very likely
Not at all likely
5%
10%
27%
34%
24%
Definitely
Very Likely
Somewhat likely
Not very likely
Not at all likely
Overall, 20% are definitely or
very likely to visit Canada in the next 2 years
Base: Long-haul pleasure travellersNote: Including trips to other countries (e.g., the US) that involve a stay of one to three nights in Canada.
Source: Global Tourism Watch Australia, 2007

266
Market Potential for the Provinces
BC MB ON ATL NORTH
Size of immediate market to Canada 1,360,000
Likely to visit region 88% 18% 90% 42% 36%
Size of immediate market for the regions 1,197,000 245,000 1,224,000 571,000 490,000
11
Australians planning to visit Canada are likely to be planning to visit Ontario.
Base: Long-haul pleasure travellers (n=1,527)Note: Provincial estimates are not additive since travellers may visit more than one province on a single trip.
Source: Global Tourism Watch Australia, 2007
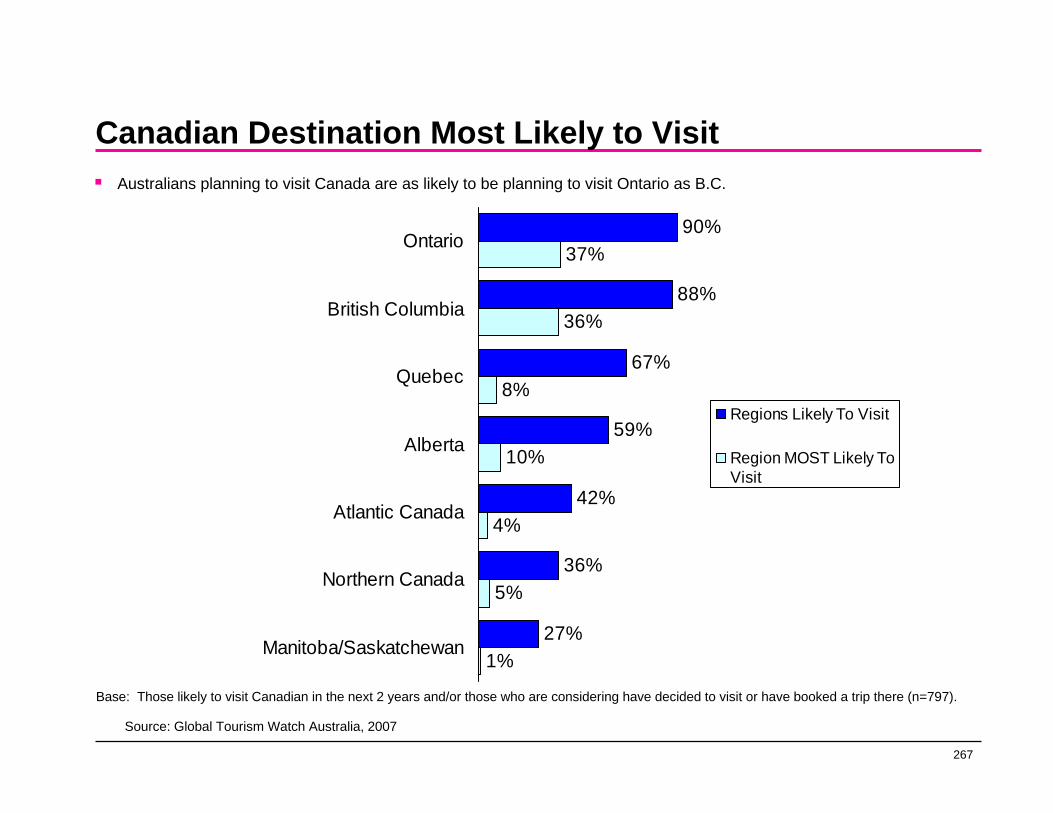
267
Canadian Destination Most Likely to Visit
90%
88%
67%
59%
42%
36%
27%
37%
36%
8%
10%
4%
5%
1%
Ontario
British Columbia
Quebec
Alberta
Atlantic Canada
Northern Canada
Manitoba/Saskatchewan
Regions Likely To Visit
Region MOST Likely ToVisit
Base: Those likely to visit Canadian in the next 2 years and/or those who are considering have decided to visit or have booked a trip there (n=797).
Source: Global Tourism Watch Australia, 2007
Australians planning to visit Canada are as likely to be planning to visit Ontario as B.C.
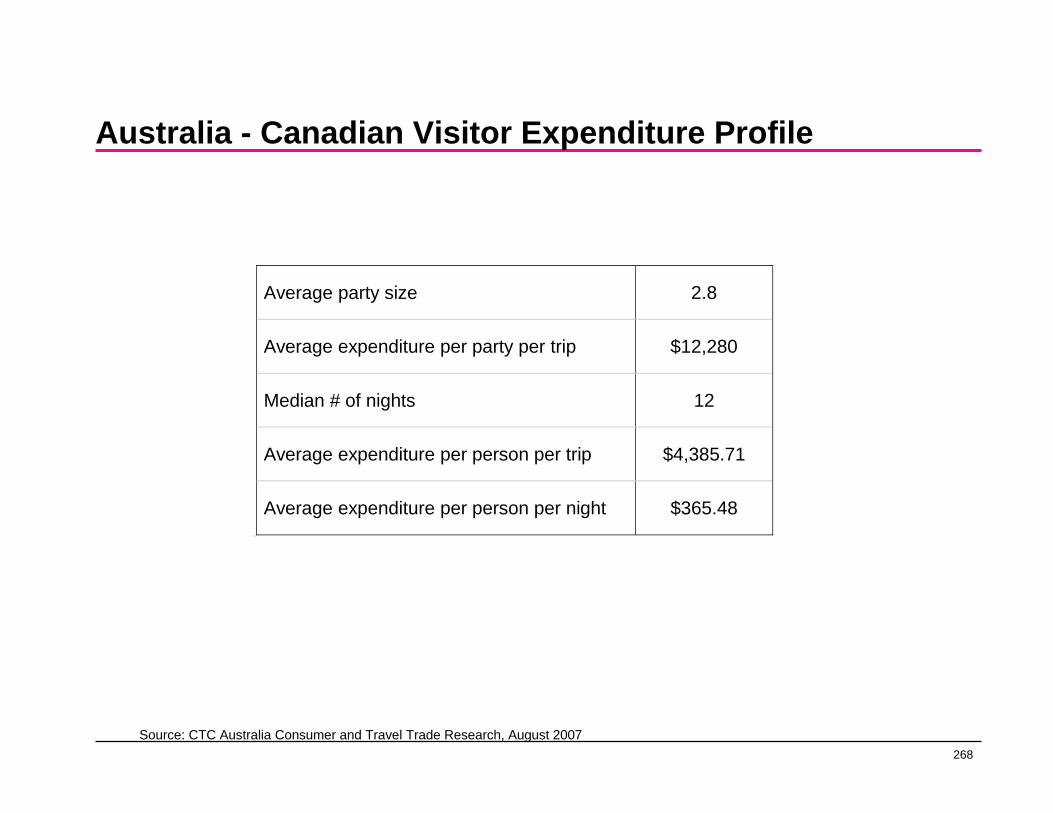
268
Australia - Canadian Visitor Expenditure Profile
Average party size 2.8
Average expenditure per party per trip $12,280
Median # of nights 12
Average expenditure per person per trip $4,385.71
Average expenditure per person per night $365.48 11
Source: CTC Australia Consumer and Travel Trade Research, August 2007

269
Main Purpose Of TripVisiting friends and relatives accounts for a substantial proportion of travel to Canada.
40%
23%
37% VFR
Sightseeing
Other
Source: CTC Australia Consumer and Travel Trade Research, August 2007 Total Australian travellers to Canada
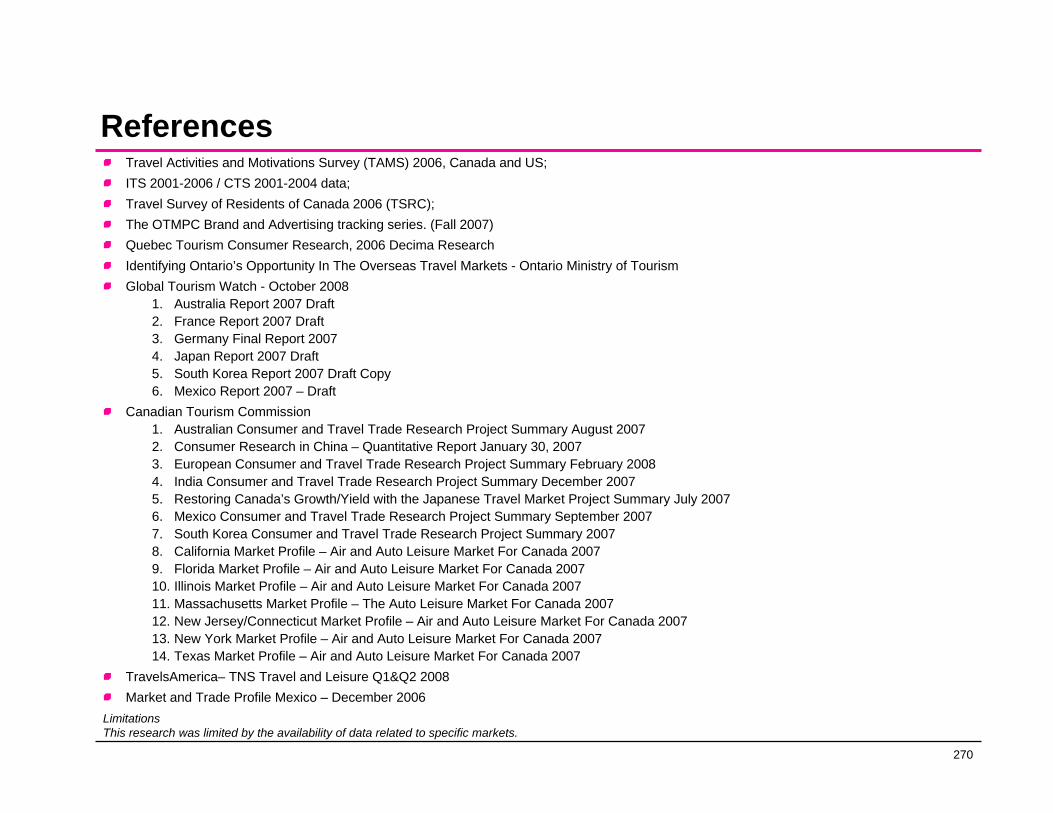
270
ReferencesTravel Activities and Motivations Survey (TAMS) 2006, Canada and US;ITS 2001-2006 / CTS 2001-2004 data;Travel Survey of Residents of Canada 2006 (TSRC);The OTMPC Brand and Advertising tracking series. (Fall 2007)Quebec Tourism Consumer Research, 2006 Decima ResearchIdentifying Ontario’s Opportunity In The Overseas Travel Markets - Ontario Ministry of TourismGlobal Tourism Watch - October 2008
1. Australia Report 2007 Draft2. France Report 2007 Draft3. Germany Final Report 20074. Japan Report 2007 Draft5. South Korea Report 2007 Draft Copy6. Mexico Report 2007 – Draft
Canadian Tourism Commission1. Australian Consumer and Travel Trade Research Project Summary August 20072. Consumer Research in China – Quantitative Report January 30, 20073. European Consumer and Travel Trade Research Project Summary February 20084. India Consumer and Travel Trade Research Project Summary December 20075. Restoring Canada’s Growth/Yield with the Japanese Travel Market Project Summary July 20076. Mexico Consumer and Travel Trade Research Project Summary September 20077. South Korea Consumer and Travel Trade Research Project Summary 20078. California Market Profile – Air and Auto Leisure Market For Canada 20079. Florida Market Profile – Air and Auto Leisure Market For Canada 200710. Illinois Market Profile – Air and Auto Leisure Market For Canada 200711. Massachusetts Market Profile – The Auto Leisure Market For Canada 200712. New Jersey/Connecticut Market Profile – Air and Auto Leisure Market For Canada 200713. New York Market Profile – Air and Auto Leisure Market For Canada 200714. Texas Market Profile – Air and Auto Leisure Market For Canada 2007
TravelsAmerica– TNS Travel and Leisure Q1&Q2 2008Market and Trade Profile Mexico – December 2006
LimitationsThis research was limited by the availability of data related to specific markets.