open data maturity in europe 2017 (pdf) - european data … · vollers (capgemini consulting) ......
TRANSCRIPT

1

2
The European Data Portal is developed by the European Commission with the support of a consortium led by Capgemini Consulting, including INTRASOFT International, Fraunhofer Fokus, con.terra, Sogeti, the Open Data Institute, Time.Lex and the University of Southampton.
For more information about this paper, please contact:
European Commission Directorate General for Communications Networks, Content and Technology Unit G.1 Data Policy and Innovation Daniele Rizzi – Policy Officer Email: [email protected] Project team Dinand Tinholt – Vice President, EU Lead, Capgemini Consulting Executive lead European Data Portal Email: [email protected] Wendy Carrara – Principal Consultant, Capgemini Consulting Project Manager European Data Portal Email: [email protected] Written and reviewed by (in alphabetical order) Wendy Carrara, Cosmina Radu and Heleen Vollers (Capgemini Consulting) Last update: November 2017
DISCLAIMER
By the European Commission, Directorate-General of Communications Networks, Content & Technology. The information and views set out in this publication are those of the author(s) and do not necessarily reflect the official opinion of the Commission. The Commission does not guarantee the accuracy of the data included in this study. Neither the Commission nor any person acting on the Commission’s behalf may be held responsible for the use, which may be made of the information contained therein. © European Union, 2017. All rights reserved. Certain parts are licensed under conditions to the EU. Reproduction is authorised provided the source is acknowledged.

3
Abstract This report is the third in a series of annual studies and explores the level of Open Data Maturity in the EU28. The report reveals that governments across Europe have not only prioritised Open Data more strongly in 2017, but are actually engaging in a race to the top. The majority of the countries demonstrate a solid understanding of the impact of Open Data in paving the way for the data economy.
The overall Open Data Maturity groups countries into different clusters: Beginners, Followers, Fast-trackers and Trendsetters. The report shows that in 2017, the number of trendsetters in the EU28 has nearly doubled to 14 countries in comparison to only 8 EU countries in 2016. European countries have been assessed both in terms of Open Data Readiness, assessing the span of their Open Data policies, and in terms of Open Data portal maturity. Where in 2015 EU countries had only competed 44.2% of their Open Data journey in reaching full Open Data maturity, this number had increased to 58.7% in 2016 and again increased to 72.5% in 2017.
The report concludes on a series of seven recommendations to guide decision makers and Open Data portal owners towards developing a sustainable vision for their Open Data transformation. A vision is needed to embed Open Data in a broader agenda for the digital transformation of the public sector as well as a solid strategy underpinning the development of the national data portal, as one of the components of the national data infrastructure.
Separate dedicated sections are devoted to the EFTA countries: Iceland, Liechtenstein, Norway and Switzerland as well as to the EU accession candidate countries: Albania, Montenegro, Serbia and Turkey; as well as potential candidates Bosnia and Herzegovina (BiH), and Kosovo.
Résumé Ce rapport est le troisième d’une série d’études annuelles et explore le niveau de maturité « Open Data » des 28 pays de l’UE. Le rapport révèle que les administrations des différents pays Européens, n’ont pas seulement mis la priorité sur l’ouverture des données mais se retrouvent leaders en la matière. La majorité des pays démontre également une bonne compréhension de l’impact positif de l’Open Data en vue de développement d’une économie de la donnée.
La maturité « Open Data» des différents pays s’établit sur quatre niveaux : débutant, suiveur, accélérateur et précurseur. Afin d’avoir une approche globale de ce degré de maturité, deux indicateurs clés sont utilisés. Ils couvrent à la fois la maturité des politiques nationales visant à promouvoir l’ouverture des données publiques ainsi que les fonctions disponibles sur les portails nationaux. En 2017, le nombre de pays dit précurseurs a presque doublé, passant de 8 pays en 2016 à 14 pays en 2017. Alors qu’en 2015, l’UE28 n’avait réalisé que 44,2% du chemin vers l’ouverture des données, ce chiffe avait augmenté à 58,7% en 2016 et atteint désormais 72,5% en 2017.
Comme lors des éditions précédentes, une série de recommandations a été formulée. Il est désormais temps pour les pays d’intégrer pleinement l’Open Data dans la transformation digitale du secteur public, de poursuivre le développement des portails nationaux, tout en bâtissant une réelle infrastructure des données publiques.
Une partie du rapport évalue également les pays de l’Association européenne de libre-échange (AELE), dénommés UE28+, ainsi que les pays candidat à l’entrée dans l’Union Européenne : Albanie, Ancienne République yougoslave de Macédoine, Monténégro, Serbie et Turquie; ainsi que les deux candidats potentiels que sont la Bosnie-Herzégovine et le Kosovo.

4
Table of Contents
Abstract ......................................................................................................................................................... 3
Résumé ......................................................................................................................................................... 3
Executive Summary ....................................................................................................................................... 5
1. Introduction ........................................................................................................................................ 10
2. Open Data Readiness .......................................................................................................................... 13
2.1. Open Data policies ...................................................................................................................... 13
2.1.1. Presence of Open Data policies ................................................................................................ 13
2.1.2. National coordination ............................................................................................................... 21
2.1.3. Licensing norms ........................................................................................................................ 25
2.2. Use of Open Data ........................................................................................................................ 28
2.3. Impact of Open Data ................................................................................................................... 32
2.3.1. Political impact .......................................................................................................................... 32
2.3.2. Social impact ............................................................................................................................. 36
2.3.3. Economic impact ....................................................................................................................... 40
2.4. Progress so far - Open Data Readiness ....................................................................................... 47
3. Portal Maturity .................................................................................................................................... 54
3.1. Usability of the portal ................................................................................................................. 54
3.2. Re-usability of data ..................................................................................................................... 57
3.3. Spread of data ............................................................................................................................. 62
3.4. Progress so far - Portal Maturity ................................................................................................. 66
4. Europe achieving high levels of Open Data Maturity ......................................................................... 69
4.1. EU28 Country clusters ................................................................................................................. 69
4.2. Key success factors for Open Data transformation .................................................................... 72
4.3. Open Data Maturity Insights ....................................................................................................... 74
4.4. Open Data Maturity beyond the EU borders .............................................................................. 82
4.4.1. The EFTA countries ................................................................................................................... 82
4.4.2. The EU accession countries ....................................................................................................... 85
5. The way forward to increase Open Data Maturity ............................................................................. 89
5.1. Barriers to overcome .................................................................................................................. 89
5.2. Sustaining data portals................................................................................................................ 93
6. Recommendations .............................................................................................................................. 96
7. Conclusion ......................................................................................................................................... 104
Annex I Links to country factsheets .......................................................................................................... 105
Annex II G8 Open Data Charter ................................................................................................................. 106
Annex III Method ...................................................................................................................................... 107
Annex IV List of Figures ............................................................................................................................. 117

5
Executive Summary
With the vision of a European data economy becoming a tangible reality by the day, the salience of Open Data is once again reinforced. With both humans and smart devices producing exuberant amounts of data that now reach the volume of petabytes, governments worldwide are seeking answers to the questions of how these – a decade ago still unimaginable – volumes of data can best be used, to benefit citizens, organisations, economies and societies as a whole. A first answer would be to open up available data and make it accessible to everybody, in particular to the developer communities across the globe. A second answer would be to alleviate the existing barriers that prevent data mobility across country borders – thus enabling a free flow of data.
More and more efforts are made at both national and European level to unleash this potential and enable a flourishing data economy in Europe. Taking away obstacles to data mobility is expected to generate an additional growth of up to 4% GDP by 2020. In this constellation, Open Data plays a significant part with a total market value estimated at 325 billion EUR by 2020, with 30.000 new jobs created for the Open Data sector and a cost saving estimation of 1.705 million EUR that national governments of the EU28+ can reach in 2020. This potential is indeed tremendous. However, in order to harness it, Europe needs to continue its concerted Open Data efforts. To reach the potential of 325 bn. EUR by 2020, it has been estimated that the percentage of EU28+ countries that can be ranked as Open Data trendsetters would need to increase from 31% in 2015 to 88% in 2020.
The present Open Data landscaping will provide evidence of the significant progress that Europe has made in the past year and will show that Europe is on the right track to achieving this goal by 2020. In 2017, the number of trendsetters in the EU28+ has more than doubled compared to the 2016 measurement (22%) and reaches 47%. For the EU28 50% can be considered a trendsetter. It seems that European countries have started racing each other to the top, with the highest distribution being now in the cluster ‘trendsetters’ – an encouraging observation that highlights the considerable progress that Europe has made in the past year. The majority of the 28 EU countries are situated in the upper right quadrant, with eight Member States qualifying as fast-trackers and 14 as trendsetters. Only 6 EU Member States register lower scores in terms of both Open Data Readiness and Portal Maturity and qualify only as ‘followers’ in 2017. Whereas the number of fast-trackers remains the same in 2017 compared to 2016 (at 25%), there is some visible progress, with a reduction of the number of followers as well as beginners. Even more encouraging, none of the EU Member States can still be considered an Open Data beginner in 2017.
The results show that governments across Europe have not only prioritised Open Data more strongly in 2017, but they are actually engaging in a race to the top. The increase in the share of Open Data trendsetters, as well as the significant progress made by individual Member States both in terms of their Open Data Readiness and Portal Maturity offer evidence to underline this argument. Furthermore, it appears that the speed of progress varies quite heavily, with some countries having made genuine frog-leaps in their maturity journey whereas others show a more moderate but nevertheless constant progress. This development is seen beyond the EU borders as well, with positive developments made by the EFTA countries as well as encouraging signs from the EU accession countries, showing that Open Data has been placed higher on the national political agendas.

6
On the Open Data Readiness dimension, countries have made significant progress with an EU average that has increased by 15 percentage points (pp) to reach 72% in 2017. Compared to the previous year, progress can be observed on all three sub-indicators. EU countries appear most mature with regards to the sub-indicator on Open Data policy, increasing by 15pp to 82% in 2017; including a visible boost across the EU28 in terms of the degree of national coordination witnessing a spectacular increase of 35pp to reach 87% in 2017. This is followed by a 16pp increase in terms of Use of Data to 67% in 2017. These results gain further significance when balanced against the first measurement of 2015, where the EU28 were experiencing a degree of Open Data Readiness maturity of only 47%.

7
Similar results were captured by the Portal Maturity dimension, where the degree of maturity now reaches 76% in 2017 - a 10pp increase compared to 2016 and a genuine frog-leap from a 32% maturity level in 2015. On this indicator, the most prominent development was made on the sub-indicator spread of data (+10pp compared to 2016), the best scoring sub-indicator across the board with a score of 90%. The re-usability of data follows in terms of progress, now reaching 77% – an increase of +15pp compared to 2016.
Portal usability remains a concern for EU28 in 2017 with a moderate score of only 68% and an increase of only 3pp compared to 2016. This appears to be a neglected area for portal owners across Europe, a less optimistic observation given the important part that this aspect plays in boosting Open Data re-use, with national portals being the main point of contact between developers and the data available across the entire country.
In terms of the impact of Open Data across Europe, the same lines of growth can be observed in 2017, with a EU28 average that has jumped to 54% in 2017 from 44% in 2016, starting at an initial score of 31% in 2015 – an increase of 10-13pp per year. When breaking down these averages, the impact on the political level is the highest with 57%, followed by the economic impact (54%) and the societal impact (49%). Compared to the previous measurement of 2016, the political and social impact have both been on a growth path with increases of 11pp and 21pp respectively – an impressive boost on the impact on the social level. The economic impact has registered only a slight increase from 51% in 2016, mainly due to the lack of current studies to assess the impact of Open Data on both macro and micro levels in the past two years.
Overall, the best performing countries in 2017 can be characterised by their drive in implementing their Open Data policies, developing additional portal features as well as understanding and documenting Open Data impact. This has led in turn to a virtuous circle boosting both availability and reuse of Public Sector Information. Building on successful national approaches, there are visible signs that regions and cities are equally eagerly picking up pace in reaping the benefits of Open Data.
The report concludes on a series of seven recommendations to guide decision makers and Open Data portal owners towards developing a more sustainable vision for their Open Data transformation:
Enhance your data portal by developing a comprehensive strategy for your Open Data Portal and embedding it into your data strategy
Sustain funding of Open Data activities by employing vetted financing models as well as by demonstrating the impact of Open Data in order to secure long term support
Document impact by gathering further proof of impact, in particular at company level, in order to rally further support

8
Interact with your users by getting to know them better, enhancing interaction and feedback mechanisms
Drive digital transformation within public administration by using Open Data and Public Sector Information
Explore privately held data by leveraging the use of privately held data of public interest to increase efficiency and value of data and data driven services and products
Offer real time data by becoming a one stop shop for data offering information about real time data and access to it
Offering access to increasing amounts of Public Sector Information, real-time data, as well as privately held data of public interest reiterates the need for:
A vision to embed Open Data in a broader agenda for the digital transformation of the public sector
A solid strategy underpinning the development of the national data portal, as one of the components of the national data infrastructure.

9

10
1. Introduction
The various applications of Open Data in a broad range of fields as well as the positive impact that such use cases have had in these areas, has made the enormous potential of Open Data beyond dispute. When used to its fullest extent, Open Data can yield benefits for citizens, society and government as well as the broader economy – at both macro and micro levels. From health, food security, environment and resource efficiency to energy, intelligent transport systems and smart cities, Open Data has underlined this potential via numerous applications, products and services developed on freely accessible data, and has therefore come to be considered “an essential resource for economic growth, job creation and societal progress”1.
Various studies have been conducted that underline the arguments concerning the strong benefits that data and in particular Open Data has for the political, economic and societal development of countries. An important contribution in this regard is being made by the European Data Portal and its series of studies to further quantify the value of Open Data. An example thereof is the study on the economic impact conducted by the European Data Portal in 20152 that estimated a value of 75.7 billion EUR in market size for Open Data in 2020, with a significant increase by approximately 37% between 2016 and 2020. In terms of the benefits that Open Data can have in achieving efficiency gains in the public sector, Open Data can help governments become transparent and at the same time increase accountability of governmental bodies by providing the evidence that public money is being well spent and policies are being implemented. Based on the forecasted EU28+ GDP for 2020, whilst taking into account the countries’ respective government expenditure averages, the cost savings per country were estimated to reach 1.7 bn. EUR in 2020 for the EU28+. In addition, the same study has also shown that the public administration is by far the sector to gain most from opening up data, being the first re-user of its own data.
In order to help governments across Europe reap these benefits, an Open Data Maturity assessment exercise has been set up at EU level. Since 2015, the European Data Portal has been monitoring the development of national Open Data policies and Open Data portals throughout Europe and has provided an assessment of the Open Data maturity level across the EU Member States as well as Liechtenstein, Norway and Switzerland – referred to as the EU28+ on an annual basis, including Iceland since 2017.
With this Open Data landscaping, both the European Commission and the Member States are provided with a powerful benchmarking and learning tool. The assessment measures the presence of an Open Data policy, the use of data and the political, social and economic impact of Open Data within European countries. By doing so, the benchmark presents the different maturity levels across Europe, and showcases best practices and barriers; it offers Member States an opportunity to compare their progress over time as well as compare themselves to similar countries. In this sense, the Open Data maturity assessment paves the way for improvements at Member State level, by providing the necessary ‘nudges’ for further progress. For Member States, the landscaping acts as a vehicle for learning and comparison. Member States recognise there is no use in ‘re-inventing the wheel’ but that evaluating, understanding and adopting where applicable a peer solution can be very efficient and effective. This is the so-called bench-learning purpose of the exercise: it enables countries to compare their development with other
1 European Commission (2017). Building a European Data economy 2 European Data portal (2016). Creating Value through Open Data
11
countries, understand their strengths and challenges, as well as weigh in various options on how to move forward.
For the scope of this report, the following working definition for Open Data was chosen, based on the principles for Open Data described in detail in the Open Definition: “Open (Government) Data refers to the information collected, produced or paid for by public bodies and can be freely used, modified, and shared by anyone for any purpose”.3 This definition is also referred to as Public Sector Information (PSI).
With regard to its relevance, the report is grounded in the strong legal framework established by the Directive 2003/98/EC4 – also known as the Directive on the Re-use of Public Sector Information or the PSI Directive. The Directive entered into force on 31 December 2003 and is part of the more comprehensive framework of legislative measures that ensure the publication and dissemination of information collected by public bodies across the EU. The Directive sets out the legal framework for a European market that is based on the access and re-use of Public Sector Information. It aims at fostering the internal market in particular by enabling the conditions for development of cross-border services, based on the re-use of Public Sector Information. At the same time it targets transparency and a fair competition within the internal market. The PSI Directive of 2003 was revised by Directive 2013/37/EU5 of 26 June 2013 and expands the scope of the previous Directive and addresses written texts, databases, audio files and film fragments, but does not cover content from the educational, scientific, and broadcasting sectors.
The Open Data Maturity methodology is based on two key indicators: Open Data Readiness and Portal Maturity. Open Data Readiness assesses to what extent countries have an Open Data policy in place, licensing norms and the extent of national coordination regarding guidelines and setting common approaches. The impact of Open Data is also a sub indicator of Open Data Readiness. Portal Maturity assesses the usability of the portal regarding the availability of functionalities, the overall re-usability of data such as machine readability and accessibility of datasets, for example, as well as the spread of data across domains.
The data collection is two-fold. Firstly it is based on a questionnaire completed by national bodies responsible for the implementation of Open Data policies and related portals. In order to accommodate the developments in this field as well as to embed the feedback received from Member States, a yearly update of the methodology is performed to ensure an accurate measurement of the level of Open Data maturity across Europe. Secondly, desk research and portal analyses are conducted by the European Data Portal team. In 2016, several questions had been added to measure the activities that had taken place in the past year, in particular with regard to increasing the uptake of data supply. In 2017, a pilot chapter was introduced, with questions related to the metadata standard DCAT-AP6. This highlights the increasing emphasis on the qualitative aspects involving the published datasets. In addition, further questions have been added to better measure the level of digitisation of the portals and of the harvesting of (meta)data of local and regional portals as opposed to manual labour. Furthermore, to decrease the disadvantaged position of small countries a ‘not applicable’ answer option has been introduced to better address the situation of smaller countries where due to a less complex governmental structure (few or no regions and a small population size) there is no need for local Open Data portals. A detailed illustration of the two indicators and the method update undertaken in 2017 are presented in Annex III.
3 Open Data Definition 4Directive 2003/98/EC of 17 November 2003 on the re-use of Public Sector Information 5 Directive 2013/37/EU of the European Parliament and of the Council of 26 June 2013 amending Directive 2003/98/EC on the re-use of Public Sector Information
6 More information on DCAT-AP on the EC JoinUp Platform

12
In addition to the present report, country factsheets depicting the specific situation of each country were drafted. Country factsheets contain further information with regard to the impact, best practices and main barriers faced for further publication of data and its re-use. The links to the EU28+ country factsheets are provided in Annex I.
The 2017 edition of the Open Data Maturity report is structured as follows:
Chapters 2 and 3 provide a detailed assessment of the state of play on Open Data Readiness and respectively Portal Maturity in the EU Member States and look at the progress the EU28 has made since the first measurement of 2015.
Chapter 4 takes a closer look at the country progress and presents the 2017 Open Data trendsetters, fast-trackers, followers and beginners across Europe. It also explores the Open Data developments beyond the European Union’s borders, by presenting the progress that both EFTA countries and the EU accession candidate countries have made in this field. Special attention is given to the key success factors for the excellent evolution that several EU28 countries have made and extracts deeper insight into the relationship between the different indicators.
Chapter 5 takes on a reflective perspective and dives deeper into the barriers that still need to be overcome in the Open Data maturity journeys across Europe and offers a reflection on the sustainability of Open Data.
Chapter 6 presents a set of recommendations for the Member States, whereas
Chapter 7 offers several concluding remarks to the current study.

13
2. Open Data Readiness
The first dimension -- Open Data Readiness -- assesses the extent to which countries have an Open Data policy in place, if their licensing norms comply with the requirements in order to be called Open Data and to what extent there is a coordination on Open Data policies between national and regional/local governmental levels (e.g. coordination in terms of providing guidelines, common approaches, etc.). In addition to measuring the presence of an Open Data policy, this indicator also examines to what extent Open Data is used, and how Open Data impacts society from a political, social and economic perspective.
This chapter examines the current state of play across the EU28 with respect to the first indicator – Open Data Readiness. Each subsection will provide country specific examples to further illustrate best practices as well as the different approaches taken by the different countries. As mentioned in the introduction, whereas the 2015 and 2016 exercises focused on the EU28+, this year the measurement will focus on the EU28. The chapter will conclude with an overview of the progress made by countries so far (compared to the 2016 and 2015 measurements).
2.1. Open Data policies The first indicator on the dimension Open Data Readiness focuses on the maturity of Open Data policies. This indicator is further divided into three sub-indicators, focusing on the presence of Open Data policies, national coordination and licensing norms.
2.1.1. Presence of Open Data policies The sub-indicator ‘Presence of Open Data policies’ focuses on the political framework supporting Open Data and to what extent national Open Data policies have been integrated. When looking at the EU28 in 2017, 27 out of 28 EU countries (96%) have a dedicated Open Data policy, representing a 7 percentage points (henceforth pp.) increase compared to 2016, when only 25 EU countries (89%) had a dedicated Open Data policy. With more countries having an Open Data policy in place, the EU28 show a stronger commitment to move forward with Open Data, for example by providing resources for the development of Open Data.

14
When observing whether the Open Data policy is more ambitious or the same as the PSI policy, 20 out of 28 EU countries (71%) mention their Open Data policy is broader and more ambitious than the PSI policy. To encourage this latter development, it had been decided in 2017 to add the answer ‘more ambitious’ to the question. This has led to a significant increase in comparison to 2016. Where the PSI policy is generally perceived as a more ‘passive’ policy as it acts more upon request, the Open Data policy is often considered as more ‘active’ by making data available, accessible and re-usable upfront. It also includes further training, engagement and awareness raising activities which are not required under the transposition of the PSI Directive.
An example in this regard is the Austrian Open Data policy which is stricter than the PSI policy, because PSI datasets can be sold with some boundaries while Open Government Data has to be free of charge at all times. Furthermore, while the PSI Directive does not prescribe the usage of concrete Open Data licences, the Open Government Data policy in Austria recommends the usage of the Creative Commons 3.0 AT licence.
In Bulgaria, the national policy on Open Data and PSI are outlined in the Access to Public Information Act and the Ordinance on Standard Terms for the Re-use of Public Sector Information. The main difference lies in the delivery mechanism. Open Data on the national Open Data Portal has to be published with information and resources being accessible free of charge and in an open, machine-readable format to allow re-use, along with relevant metadata. While according to the PSI policy it is up to the publisher (such as public sector organisations) to provide re-users with data that has the required format and language needed to be re-used.
Besides Open Data policies and/or Public Sector Information policies, policies can also specifically encourage the re-use of Open Data. Where in 2016 all EU countries except Hungary, Poland and Portugal did specifically encourage the re-use of Open Data, in 2017 all EU countries are now specifically encouraging the re-use of Open Data. This means that increasingly national governments not only merely support Open Data publication, but also actively encourage the re-use of Open Data, underlining the potential value Open Data brings to society.
15
Developing data portals
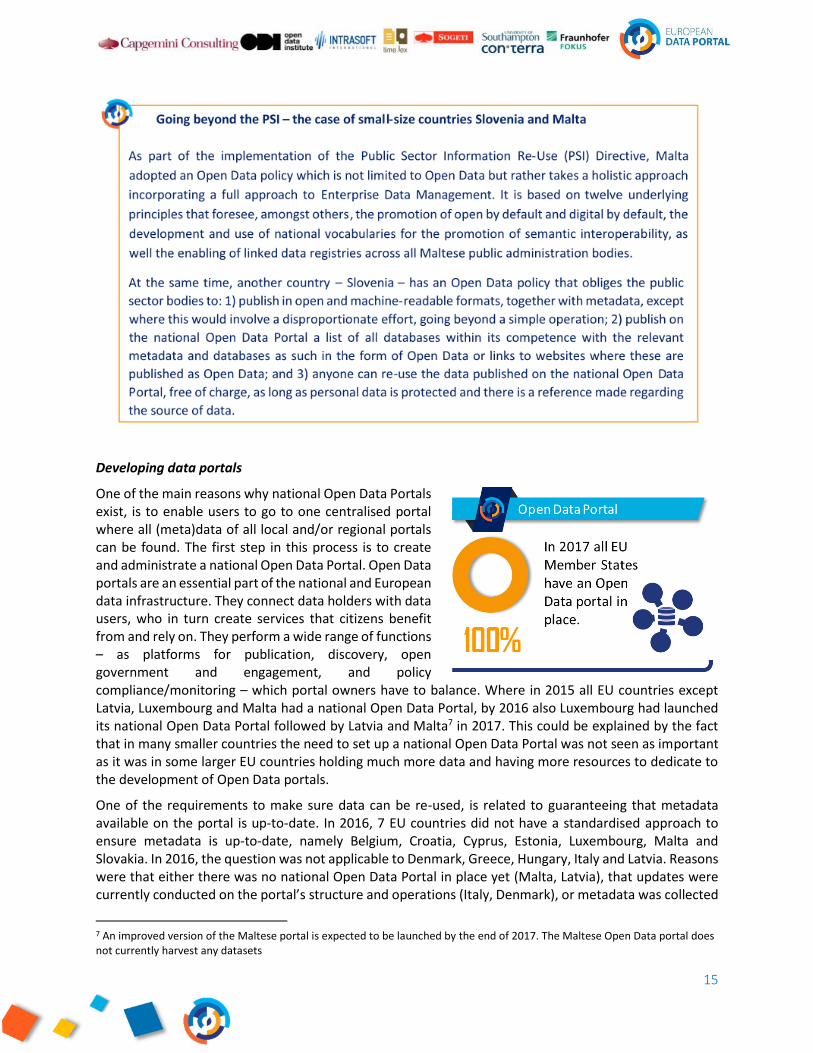
One of the main reasons why national Open Data Portals exist, is to enable users to go to one centralised portal where all (meta)data of all local and/or regional portals can be found. The first step in this process is to create and administrate a national Open Data Portal. Open Data portals are an essential part of the national and European data infrastructure. They connect data holders with data users, who in turn create services that citizens benefit from and rely on. They perform a wide range of functions – as platforms for publication, discovery, open government and engagement, and policy compliance/monitoring – which portal owners have to balance. Where in 2015 all EU countries except Latvia, Luxembourg and Malta had a national Open Data Portal, by 2016 also Luxembourg had launched its national Open Data Portal followed by Latvia and Malta7 in 2017. This could be explained by the fact that in many smaller countries the need to set up a national Open Data Portal was not seen as important as it was in some larger EU countries holding much more data and having more resources to dedicate to the development of Open Data portals.
One of the requirements to make sure data can be re-used, is related to guaranteeing that metadata available on the portal is up-to-date. In 2016, 7 EU countries did not have a standardised approach to ensure metadata is up-to-date, namely Belgium, Croatia, Cyprus, Estonia, Luxembourg, Malta and Slovakia. In 2016, the question was not applicable to Denmark, Greece, Hungary, Italy and Latvia. Reasons were that either there was no national Open Data Portal in place yet (Malta, Latvia), that updates were currently conducted on the portal’s structure and operations (Italy, Denmark), or metadata was collected
7 An improved version of the Maltese portal is expected to be launched by the end of 2017. The Maltese Open Data portal does not currently harvest any datasets

16
manually (Greece). Bulgaria collected metadata monthly while Lithuania collected metadata less frequently than once a month, in 2016. In 2017, only Denmark, Estonia, Hungary, Lithuania, Malta and Portugal do not yet have a standardised approach in place to collect metadata from other portals in the country.
In 2017, 82% of the EU countries, equal to 23 countries, do have an approach in place to ensure datasets are up-to date. In Bulgaria, it is required by law that public sector organisations indicate the date on which the information provided can still be considered up-to-date, depending on the type of data. In order to achieve this, public sector organisations have been given instructions on how to include the date or when the dataset had been updated last. In Romania, all ministries have to provide a specific update interval per data set8, with checks being done automatically checking if datasets are indeed updated accordingly. Further countries have undertaken standardised approaches to metadata collection. An example thereof is Cyprus, where public sector bodies are obliged to indicate the updating frequency (daily, weekly, monthly, annually or periodically) when publishing their datasets on the national Cypriot Open Data Portal. For 36% of the EU countries (10 countries) the frequency of this metadata collection from relevant public sector data holders is standardised, however, the frequency of metadata collection differs between daily, weekly, monthly, or less frequently depending on the type of metadata. Certain data, such as the number of inhabitants of a country, is often only updated once a year, whereas certain transport metadata can be updated daily. For another 10 countries the standardised frequency of collecting metadata is daily.
For 5 countries, a predefined approach to ensure datasets are up-to-date is not yet in place. For example Sweden does not yet have a mechanism in place to contact publishers if datasets have not been updated for a while. Also in the UK, a predefined approach is not in place. However, the UK will explore different ways to improve data reliability by reminding publishers when there are expected updates to datasets, validation of data against schema, more mandatory fields for datasets and clearer display of metadata to users. This will be part of the currently being updated national UK Open Data Portal.
Regarding reliability of metadata accuracy and the extent to which data is uploaded automatically has equally been assessed. Here we can see that many countries are still struggling with data quality. Only one country, Belgium, guarantees that 100% of its data is uploaded automatically. The process to automatically upload metadata is similar to the European Data Portal (EDP): metadata of regional portals and the federal portals are harvested by automatic harvesters, converted to DCAT-AP and published. This way the same (meta)data (whether automatically or manually uploaded) can be used for the EDP (or any other portal). For six countries, especially when they provide metadata of many datasets, data is uploaded automatically by 90-99%. For example in Italy, the Open Data strategy was set up with automatic uploading of different catalogues in mind. Only one administration, with 9 datasets, manually uploaded its datasets to the national catalogue. While in the Netherlands, with a 94% automatic upload, it is desired to automatically upload datasets from bigger collections for efficiency reasons.
8 Romanian ministries have to provide a specific update interval per data set, Column H
64%
14%
Ensure up-to-date metadata
Yes No

17
However, organisations having only a few datasets are suggested to directly maintain the data set information in the CKAN (or equivalent) maintenance screen on their portal. The other 4 countries with 90-99% automatic upload are Germany, Ireland and Sweden. In France, Luxembourg and Spain 74-89% data is automatically uploaded while Finland and the UK provide 50-74% automatically uploaded metadata on their portal. For a country like the UK with over 40,000 datasets on the national portal, this means that around 20,000 datasets were published manually by publishers. In Finland, the responsibility to manually or automatically upload (meta)data lies with the data provider. The biggest group of countries, 39% (11 EU28 countries), provide less than 25% of automatically uploaded data on their portal. Except for Poland, this group largely consists of smaller countries with fewer datasets or having fewer data publishers in their country. A further 5 countries have between 25-49% automatically uploaded data on their portal. For example in Bulgaria, a tool was created to allow for automatic open format data upload from a local server to the national portal, however, many administrators are experiencing difficulties installing and using the tool resulting in data being uploaded manually. It is expected that this group will (further) develop automation aspects related to data harvesting significantly in the near future and train its civil servants to be able to use the tools.

18
Change Management Approach
While in 2016 54% (15 countries) of the EU countries had updated their approach to Open Data, in 2017 this has increased by 25 pp. to 79% (22 countries). Due to the rapidly changing Open Data environment, it is essential to adjust the approach to open data regularly to ensure guidelines to open data are in line with latest developments. Only Belgium, Estonia, Finland, Hungary, Malta and the UK did not change their approach. Reasons could be that the already established approaches to open data are still applicable to the current situation, a new approach is currently being developed, or because countries have to prioritise resources on other issues, such as new priorities elsewhere or hosting the Presidency of the EU Council as is the case in 2017 for Malta and Estonia. Often, changing the approach to open more data is political and meant to provide a stronger mandate for ministries to push data to be opened. In Austria, the federal government has started to ask all federal ministries to further analyse closed federal datasets on their Open Government Data (OGD) potential, also called the “OGD Screening 2017”. In Lithuania, more focus is put on increasing the number of (meta)datasets and their quality. In Slovakia, the ‘Action Plan of Open Government (2017-2019)’ focusses on several aspects of open government, such as open justice, open information, open education and open science. The actions reflect new priorities of the new Slovak government, as described in detail in the ‘Strategy of accessibility and use of Open Data of public administration’9. In Germany, the open-by-default approach for raw data collected by the federal agencies passed the Parliament in May 201710.
Data-Driven Decision Making
Not only are more governments starting to acknowledge the need to open more data and are changing their approach accordingly, we also see a positive trend in Open Data being used in decision-making. In 2016, 57% (16 countries) of national Open Data Portal representatives were aware of Open Data being used in decision-making. By 2017, this number increased by 11pp. to 68% translating into 19 countries. Notably, in Latvia policies are systematically made by using various data from state institutions including Open Data. An example is insolvency data which can be used to plan policies or support operations (in both the public and private sector)11. In Hungary, the open legal database of the Hungarian Official Journal and the proposals and amendments published on the Hungarian Parliament website are also used in decision making. 9 Slovak Strategy of Open Data management 2017 10 German open-by-default approach 11 Insolvency data is used to plan policies or support operations in Latvia

19
Besides supporting PSI reuse, Hungary also plans measures and pilots to improve data flows between public bodies, although these are in the early planning stages. In Denmark, free geospatial data is used to a very high degree in the public sector decision-making, for example in municipal planning and regulation. In Slovenia, the administrative unit responsible for approving building permits uses Open Data while Open Data on public procurements has been used in order to show the statistics and e.g. monetary savings compared to the previous year. In Italy, public administrations have not only begun to implement a data-driven decision making policy, they have started to implement it, based on the use of Open Data.
Organising Events
Organising events is important for several reasons:
1. Events help raise awareness and attention to the value that Open Data can bring to society: events raise stakeholder interest by focusing on and demonstrating advantages and benefits of using Open Data.
2. Events can help convince stakeholders that re-using Open Data can enhance the value proposition for their own products and/or services.
3. Events can lead Open Data Portal users towards taking action – developing products and services based on the data but also sharing learnings and ideas.
4. Open Data policy owners and portal developers can learn from their constituents in order to prioritise datasets for release, or improve portal features for instance.
5. Events can help sustain the interest of the people with regards to the various Open Data portals that exist in a country to keep them coming back and structurally build on the data accessed via those portals, to include data into their own business models.
While in 2016 no Open Data related events were organised in Denmark and Malta, by 2017 all EU countries are organising events going from just one or a few per year (mainly in smaller countries) to many a year (mainly in larger countries since they need to reach a bigger audience). Hackathons are, just like in 2016, also the most used type of event organised during the course of 2017. Hackathons are events that aim to develop an application based on one or multiple Open Datasets on a specific domain, or related to a specific societal question, with the intention to improve that societal question.
In comparison to 2016, the majority of EU countries organised more events in 2017. 83% of the large countries (France, Germany, Italy, Spain and the UK) organised more than 8 events per year, in comparison to only 53% in 2016. Some examples12 are illustrated in the footnote. Poland went up from having organised less than 4 Open Data events in 2016 to between 4-8 Open Data events in 2017. When comparing the number of events organised by medium sized countries between 2016 and 2017, numbers remain similar, with the Czech Republic, Greece, the Netherlands, Romania and Sweden having organised more than 5 Open Data events in 201713.
12 HackEgalitéFH, Paris, March 2017, Datensummit 17, Berlin, April 2017, 4th International Open Data Conference 2016, Madrid, October 2016, Accountability Hack 2016, London, Nov. 2016, Air Hack 2017, Leeds, Feb. 2017, Transport Hack DFT, Reading, March 2016, Homeless Hack 2017, London, June 2017, Public Data Hackathon, Warsaw, Sept. 2016. 13 Data Expo - Open Data Conference for Open Data Providers and Users, Prague, March 2017, Greek Public Integrity Hackathon, Athens, April 2017, Dutch Accountability Hack, The Hague, June 2017, Open Data Day in Romania, Bucharest, March 2017, Swedish Train Hack, Sept.2017, OpenBelgium (OKFN) Conference, Brussels, March 2017, Think Open Data Lisboa, Lisbon, October 2016, Hungarian PSI re-use hackathon, Budapest, April 2016, ,

20
When considering smaller sized countries, more events have been organised in 2017 than in 2016. In 2016, 7 out of 14 so-called small countries organised more than 3 Open Data events, by 2017 also Cyprus, Denmark, Estonia and Luxembourg organised more than 4 events per year14 -- an increase of 23 pp., going from 56% in 2016 to 79% in 2017. Latvia and Lithuania continue to organise between 2-3 Open Data events per year, while Malta has gone up from not having organised any Open Data events in 2016 to having organised 2 events in 2017, such as the SEMIC 2017 Conference15 - organised by the Estonian Presidency of the European Council together with the European Commission.
Generally, most Open Data events are organised by national public administration, accounting for 57% of the countries (16 of EU28). Since the main beneficiary of Open Data so far has been the public administration, this result is in line with the expectations. Indeed, it is the national government level that is the main organiser of events such as hackathons, which are in most cases are aimed at tackling societal or government efficiency issues. In Austria, Belgium, Italy, the Netherlands, Poland and Portugal however most Open Data events are organised by local public administrations. This is often due to a
14 1ST Open Data Forum, Nicosia, June 2016, Danish Open Tourism Days, Copenhagen, May 2017, Garage 48 Open & Big Data 2016, Tartu, October 2016, GameofCode Hackathon, Luxembourg, March 2017. 15 SEMIC 2017, Malta, June 2017.
21
lack of human resources at the national level, driven by vivid community engagement at the local level. Looking at other countries, the results become even more mixed: In Germany, Hungary and Latvia it is the civil society that organises most events while in Malta Open Data events are mainly driven by universities. In the Czech Republic, such events are mainly organised by the private sector.
2.1.2. National coordination The second sub-indicator of Open Data policies looks at the extent of national coordination within a country. National coordination is important for a successful Open Data journey because the national level can introduce and streamline national guidelines, standards and common approaches to be used by other levels of government. This ensures interoperability as well as harmonisation in terms of data publishing practices, wherever the data originates from. Good national coordination makes it easier for the national level to know what is happening in the country, provide tailored support where needed and avoid potential compatibility issues of different systems, while for the regional or municipal levels no further resources have to be invested in ‘re-inventing the wheel.’
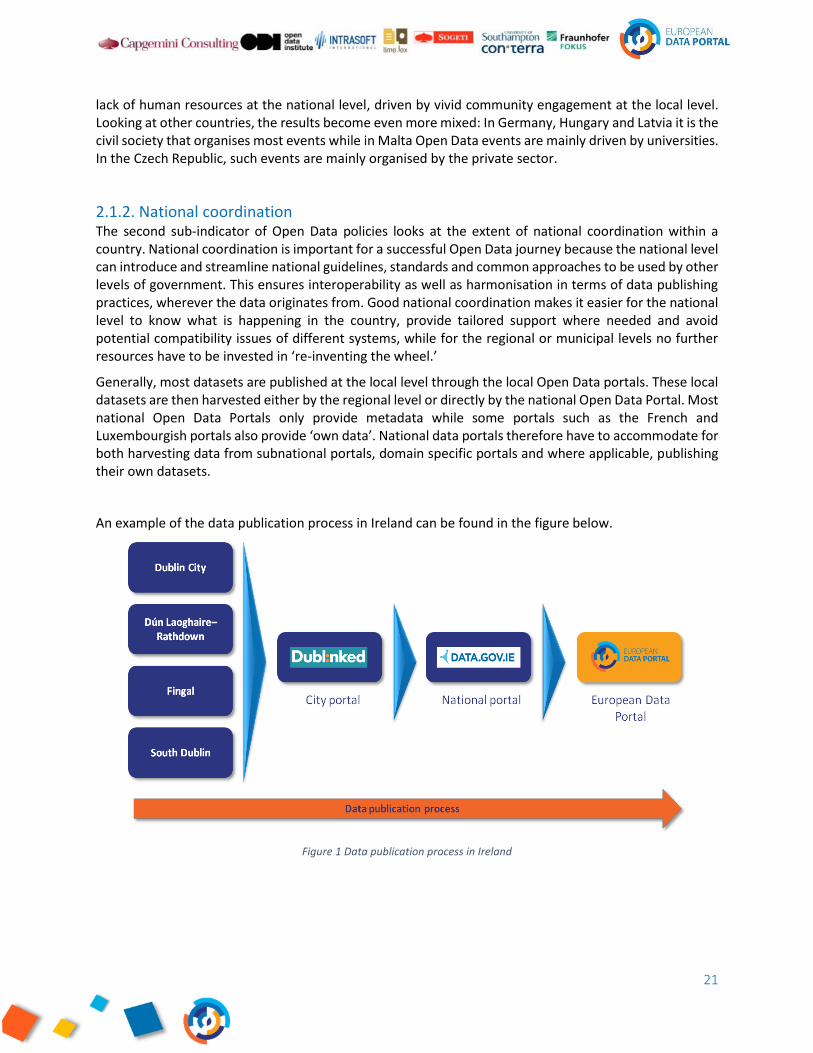
Generally, most datasets are published at the local level through the local Open Data portals. These local datasets are then harvested either by the regional level or directly by the national Open Data Portal. Most national Open Data Portals only provide metadata while some portals such as the French and Luxembourgish portals also provide ‘own data’. National data portals therefore have to accommodate for both harvesting data from subnational portals, domain specific portals and where applicable, publishing their own datasets.
An example of the data publication process in Ireland can be found in the figure below.
Figure 1 Data publication process in Ireland
22
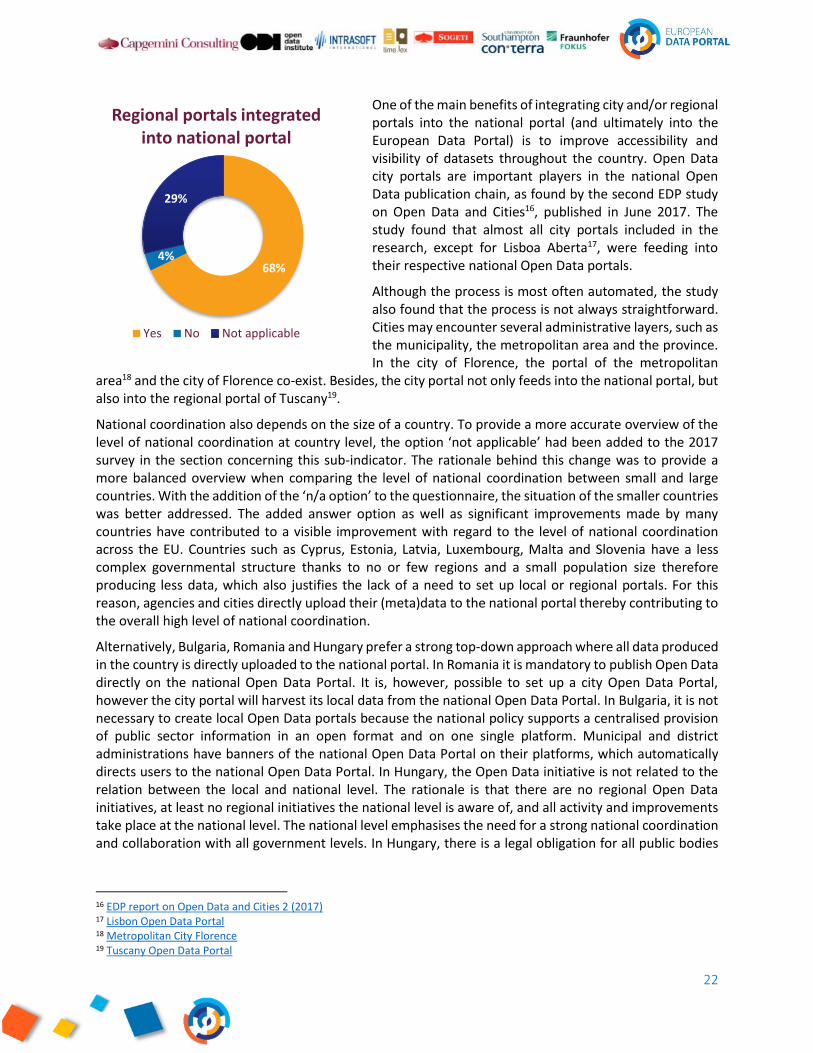
One of the main benefits of integrating city and/or regional portals into the national portal (and ultimately into the European Data Portal) is to improve accessibility and visibility of datasets throughout the country. Open Data city portals are important players in the national Open Data publication chain, as found by the second EDP study on Open Data and Cities16, published in June 2017. The study found that almost all city portals included in the research, except for Lisboa Aberta17, were feeding into their respective national Open Data portals.
Although the process is most often automated, the study also found that the process is not always straightforward. Cities may encounter several administrative layers, such as the municipality, the metropolitan area and the province. In the city of Florence, the portal of the metropolitan
area18 and the city of Florence co-exist. Besides, the city portal not only feeds into the national portal, but also into the regional portal of Tuscany19.
National coordination also depends on the size of a country. To provide a more accurate overview of the level of national coordination at country level, the option ‘not applicable’ had been added to the 2017 survey in the section concerning this sub-indicator. The rationale behind this change was to provide a more balanced overview when comparing the level of national coordination between small and large countries. With the addition of the ‘n/a option’ to the questionnaire, the situation of the smaller countries was better addressed. The added answer option as well as significant improvements made by many countries have contributed to a visible improvement with regard to the level of national coordination across the EU. Countries such as Cyprus, Estonia, Latvia, Luxembourg, Malta and Slovenia have a less complex governmental structure thanks to no or few regions and a small population size therefore producing less data, which also justifies the lack of a need to set up local or regional portals. For this reason, agencies and cities directly upload their (meta)data to the national portal thereby contributing to the overall high level of national coordination.
Alternatively, Bulgaria, Romania and Hungary prefer a strong top-down approach where all data produced in the country is directly uploaded to the national portal. In Romania it is mandatory to publish Open Data directly on the national Open Data Portal. It is, however, possible to set up a city Open Data Portal, however the city portal will harvest its local data from the national Open Data Portal. In Bulgaria, it is not necessary to create local Open Data portals because the national policy supports a centralised provision of public sector information in an open format and on one single platform. Municipal and district administrations have banners of the national Open Data Portal on their platforms, which automatically directs users to the national Open Data Portal. In Hungary, the Open Data initiative is not related to the relation between the local and national level. The rationale is that there are no regional Open Data initiatives, at least no regional initiatives the national level is aware of, and all activity and improvements take place at the national level. The national level emphasises the need for a strong national coordination and collaboration with all government levels. In Hungary, there is a legal obligation for all public bodies
16 EDP report on Open Data and Cities 2 (2017) 17 Lisbon Open Data Portal 18 Metropolitan City Florence 19 Tuscany Open Data Portal
68%4%
29%
Regional portals integrated into national portal
Yes No Not applicable

23
on what to publish on their websites and what contribution is needed from their part in the operation of the national Open Data Portal.
Going one step further, the percentage of countries that have integrated all regional portals into the national portal has increased from 4 countries in 2016: (Austria, Croatia, France and Ireland 14%) to 7 countries in 2017 (25%) with Belgium, Estonia, Finland and Lithuania joining this category and France leaving it (the French national Open Data Portal no longer harvests all local/regional portals). Since only ministerial Open Data portals are required by law to be linked to the national Open Data Portal, this requirement does not apply to local portals. Therefore, it can no longer be guaranteed that all French portals are harvested by the national Open Data Portal. The national portal does provide a map with all local Open Data portals20.
In addition to this, publishing guidelines by the national government can also help publish more Open Data and make data more visible. In 2016 Belgium, Latvia and Portugal did not yet provide any specific national guidelines on the publication of PSI. This situation changes in 2017, with both Latvia and Portugal now providing such guidelines. In Latvia, national guidelines on the technical and theoretical aspects of data publishing are provided by the Latvian Ministry of Environmental Protection and Regional Development21 whereas Portugal provides recommended guidelines specifying how to electronically release and publish Open Data. An example of the comprehensive assistance provided by the national level to public administrations active at regional and/or local levels is Slovenia (see insight box below).
Although 96% of EU28 (27 countries with the exception of Belgium) provide national guidelines on how to open PSI, not all countries coordinate all Open Data initiatives at the national level. This is mainly attributed to the large size of the country and the amount of Open Data initiatives that make coordination difficult. This is the case in Germany, Italy and Poland, as well as in Sweden (where there is a rather fragmented state of affairs in relation to Open Data). In Germany, this can be explained by the federal system in the country and the limited mandate to coordinated activities by the central level. In Italy, national coordination is improving, however, due to the large country size and Italy having strong regions, coordinating all Open Data initiatives at the
20 The collective “Open Data France” provides a map of the local open data portals 21 Latvian Ministry of Environmental Protection and Regional Development

24
national level is challenging. At the opposite end, the Netherlands represents an example of a country where all Open Data initiatives are coordinated at the national level, with a national working group focusing on and coordinating Open Data across all administration levels. With a steering committee in place, as well a political leadership at the level of the Ministry for Interior, the Netherlands is enjoying a high level of coordination at national level as well as a strong political leadership on Open Data. At the same time, local governments are provided with the necessary space to independently coordinate their own actions while operating within the national strategy.
In 2016, only 25% of EU Member States indicated that there were many Open Data regional initiatives taking place in their country, namely Austria, Finland, France, Greece, Ireland, the Netherlands and Spain. By 2017, Belgium, Bulgaria, Denmark, Italy, Slovakia and the UK now also estimate to have many regional initiatives taking place in their respective countries. This represents an increase of 21 pp. compared to 2016. The reason for this significant increase is two-fold. On the one hand, it appears that more regional initiatives have been developed in the past year. On the other hand, the national level seems to have a better view on what is happening in the country in terms of Open Data initiatives.
Especially for federal countries national coordination can be difficult. Belgium is a good example of a federal country where much progress has been made in the past year. In Belgium, several city portals exist such as Brussels, Bruges, Ostend, Antwerp, Ghent and Kortrijk (currently an initiative for tourism by the municipalities of the Belgian coast is in the making). In addition, the Flanders region has several projects, such as testing linked Open Data for local decisions while all three Belgian regions have their own portal and support for local authorities. The Walloon region is working with 20+ Walloon municipalities to help them to open data, which is also done by the Brussels region.
In Croatia22, several cities such as Zagreb, Rijeka and Virovitica have Open Data portals while several other cities such as Varaždin, Velika Gorica and Križevci are expected to launch their Open Data portals shortly. The Association of Cities in the Republic of Croatia is cooperating as well as encouraging other Croatian cities to publish data. Moreover, the Association of Croatian Counties (regional level, including 20 counties) created the application ‘Open Budget23’ with a visualisation of budget spending at the regional level. It ensures that budget data is available in a unified manner, open format and visualised per different criteria and has been promoted at several events24 which has drawn the attention of other local governments. As a result, the Association of Cities and Association of Municipalities is planning to
22 Croatian Open Data portals: Zagreb,Rijeka and Virovitica 23 Croatian application ‘Open Budget‘ 24 Promotion of Open Budget application at multiple events

25
incentivise its members to create similar applications, and allow extraction of open budget and financial data. Besides, local governments are included in the training programmes and Open Youth Academy.
The Spanish national Open Data Portal has identified 153 Open Data initiatives in 2017, which is an increase of 36 initiatives compared to 2016. In Spain, the national level coordinates with the regions on two levels. On the one hand, it provides institutional and policy coordination for Open Data, through a specific Open Data group in the Commission of eGovernment. On the other hand, it enables technical coordination, through Red.es.
2.1.3. Licensing norms The third sub-indicator contributing to the Presence of Open Data policies indicator is the use of licensing norms needed to determine the terms and conditions for the re-use of Open Data. Licences are essential when re-using Open Data to avoid potential copyright and other legal issues. This could happen when either the licence limits the use of the data or when no licence has been provided at all. Following the transposition of the original PSI Directive 2003/98/EC, many arrangements and procedures have been put in place to transpose the PSI Directive into national legislation. This has led to many different types of licences. In order to align practices across the EU and make them more transparent and predictable for potential re-users, the European Commission had been asked by many Member States to issue specific guidelines on which licence to use. Also in Europe the Creative Commons (not for profit organisation in the US) licence has become a ‘de facto’ standard for publishing PSI in Europe. Some governments that recommend a different licence have redrafted their own licence to be compatible with the CC-BY licence. Besides better compatibility, the CC licence also provides machine-readable versions of the licences that software systems and search engines can understand. This means that public sector bodies can simply download the CC licence or refer to the licence via a link. The attribution requirement allows for PSI to be re-used under the condition that the re-user acknowledges the original source of the documents and or data (i.e. public sector body) by including a suitable attribution statement, preferably with a link25.
In most countries, a certain type of licence is recommended by the national government. 93% of the EU28 (amounting to 26 countries) recommend a specific licence. In comparison to 2016, this is an increase of 3 countries. By 2017, Germany, Latvia and Croatia recommend a specific license. Only Hungary and Poland do not recommend a specific licence. The Polish national Open Data Portal provides around 45% of its datasets without any conditions as this is believed to be better for re-use than the open licence. The other 55% of datasets are available under minimum conditions such as the attribution or non-commercial purposes. Since public data available on the national Polish Open Data Portal is not covered by IP rights, data protection or any other form of
25 European Commission memo, FAQ: ‘PSI guidelines’, Brussels, 17 July 2014

26
confidentiality, if no information is provided about the re-use, the datasets can be re-used without any conditions or requests, as stipulated in the Polish act on the re-use of PSI26.
In addition, 71% of the EU28 (20 countries) indeed specifically recommend the PSI guidelines recommended use of the Creative Commons licence. In addition to Germany, Hungary and Poland, also France, Romania, Spain, Sweden and the UK do not recommend the CC licence specifically. Germany recommends the “Datenlizenz Deutschland 2.0” for publishing data. This licence was developed, compliant with the ‘Open Definition27’, because the CC licence can only be applied to items that fall under copyright protection. Since this is not the case for most government data, a specific German licence was developed. France promotes the Open Licence developed by the Etalab task force, which is believed to be more respectful of Open Data principles than the CC licence. A decree signed by the French Prime Minister28 recommends the use of the Open Database Licence as well as the Open Licence (in French “licence ouverte de réutilisation d’informations publiques”). Poland does not recommend a specific licence because as a principle data available on the portal is released without any conditions or under minimum conditions: publishers are obliged to provide information on the source, time of production and acquisition of the Public Sector Information from the obliged entity; and publishers are obliged to provide information on the fact that the re-used information has been processed. Romania recommends its own governmental licence ROU-OGL which is basically a CC derivative. The UK recommends the UK Open Government Licence which is compatible with the Creative Commons Attribution Licence 4.0 and the Open Data Commons Attribution Licence, both of which license copyright and database rights. This means that when the information is adapted and licensed under either of those licences, the conditions of the OGL have automatically been satisfied when to comply with the other licence. As in 2016, the CC 0, CC 3.0, CC 4.0, CC-BY, CC-BY 4.0 and the CC-Share Alike licence have been mentioned most often as the recommended licence by national governments.
Despite increased awareness around and application of licences, the metadata records from most national portals still show a high degree of heterogeneity regarding licences, with 28 different licences spread across 76 different sources, from 34 European countries. However, the highest share of datasets still do not indicate specific information about licences in their metadata29.
When looking at the percentage of data provided with an open licence, the situation becomes more complex. In 2017, only 48% of the EU countries (13 countries) offers all its data with an open licence with 26% (7 countries) offering 90-99% of its data with an open licence. An explanation for this could be related to more and more datasets being provided on national Open Data Portals without having a standardised approach in place yet regarding licensing. Situations occur where publishers mistakenly choose the wrong licence or ‘other licence’ when uploading their data set. Licences
26 European Commission, Implementation PSI Directive Poland 27 Open Data Definition 28 Decree signed by the French Prime Minister 29 European Data Portal statistics of August 2017.

27
should be regularly checked by the national level to make sure the licensing is compliant with the Open Data rules.
For example, in Ireland 97% of the datasets are openly licensed while the national level is working on the remaining 3%. The Irish national Open Data Portal has increased its volume meaning more corrections are needed which costs time. A similar situation can be seen in Luxembourg. When publishers such as the health ministry had been added to the national Open Data Portal, their already published datasets did not automatically correspond to the correct licence. Although 90-99% of the data provided on the Luxembourg portal is openly licensed, it will take some time to get the clearance from the remaining 1-10% of data owners.
In total, 6 countries (Belgium, Bulgaria, Cyprus, Czech Republic, Slovenia and the UK) provide 75-89% of their data with an open licence, Slovakia provides 50-74% of its data with an open licence while Hungary did not provide a percentage range. In Slovenia, the decision was made to provide data users with both openly licensed metadata and with not completely open data such as certain statistical data. It had been decided that knowing of the existence of that data is at this stage more important than strictly providing open licenced data. The Slovenian national Open Data Portal will show a separate tab to distinguish Open Data from public sector data.
Going one step further, the European Data portal statistics provide further insights into the data catalogues that have the highest volume of datasets with known licences. As illustrated by the graph below, the Open Data Portals of Poland, Romania and France lead, followed by the UK (with both the portals of London and national portal) and Germany that showcase noteworthy volumes of datasets accompanied by licensing information. The Polish national portal scores highest in this regard with a volume that almost reaches 100% for licencing all data on the national Open Data Portal as open by default. The Polish Open Data Portal is followed at approx. 15p difference by the French Open Data portal (ca. 85%).
Figure 2 Top 20 catalogues with most datasets with known licences (%) – EDP statistics (11.2017)

28
Finally, in terms of Open Data being available free of charge, 26 Member States (93%) do make their Open Data available free of charge. In Belgium and Lithuania only 90-99% of data is free of charge. Certain detailed maps in Belgium do require a fee such as certain weather datasets and the real-time web service of the company register. Also in Lithuania, this small percentage can be attributed to a charging fee for certain registers such as population, business entities, cadastre, addresses, vehicles, mortgages and etc. Looking at the EU28 average however, an increase can be observed in comparison to 2016 when 4 countries (Belgium, Denmark, Germany and Sweden) did not provide all data free of charge, and Latvia which did not yet have a portal.
2.2. Use of Open Data The second indicator needed to assess the level of Open Data Readiness focuses on the use of Open Data. Examined areas relate to the number of unique visitors going to national Open Data portal, if portals provide a specific API, what percentage of machine versus human traffic is generated by the portal, typical profile, and to what extent data is being re-used or seen as important. The EU28 average in terms of use of Open Data has increased significantly, having increased from only 36% in 2015 to 51% in 2016 to 67% in 2017, which is an increase of 31 pp. over the last two years.
Figure 3 Use of Open Data EU28 (2015-2017, %)
67%
51%
36%
0%
20%
40%
60%
80%
100%
FI ES IE LU RO NL SI SK HR CY AT FR BU HU UK BE IT PL CZ EL SE EE DK DE LV PT LT MT
Use of Data EU28 Progress 2015-2017
2017 2016 2015 EU28 2017 EU28 2016 EU28 2015

29
The main difference with 2016 is that in 2017 all countries are able to provide data on the use of Open Data thanks to all EU countries having a national Open Data Portal in place. However, large discrepancies still exist with on the one hand Malta still being in the process of launching a more elaborate portal with more portal features and on the other hand countries such as Spain, Italy, France and Ireland having an older Open Data tradition and devoting more resources to maturing their Open Data journey.
Several countries have shown impressive improvements in the data provided on the use of data. The country that has accelerated the most is Luxembourg, having gone up from 0% in 2015 due to not having a national portal, to 88% in 2016, to 90% in 2017. Luxembourg has shown that also in 2017, having most portal features in place, people know how to find the national Open Data Portal and work with it. Slovenia is second, having accelerated from 0% in 2015 due to not having a national portal to 56% in 2016 to 88% in 2017. Slovenia has a dedicated team working on Open Data and receives a lot of top level political support to open data for re-use, which becomes clear when looking at the use of data. The third country having accelerated considerably is Slovakia, having gone up from 13% in 2015 to 73% in 2016 to 87% in 2017. This could be explained by the growing awareness of Open Data in Slovakia with a relatively high number of people visiting the portal, of which around one third is foreign and most likely coming from the neighbouring countries. Although most countries show an increase in use of data, 6 countries have decreased in the past two years. The UK has experienced a drop of 11 pp. and Greece a drop of 10 pp. France, Germany, Hungary and Portugal have only witnessed a slight decrease of 1-5 pp. each. Most of these countries have been focusing on raising awareness of Open Data in general. A next step would be to promote the national Open Data Portal.
Monitoring Portal Traffic
In 2016, only Denmark, Italy, Latvia Lithuania and Malta did not measure traffic on their websites or did not yet have a national portal in place. By 2017, only Denmark, Latvia and Malta do not monitor user statistics. When looking at visitors using the portal each month as a percentage of the total country population30, it becomes clear that more people are finding their way to the national Open Data portals. Unique visitors refer to the number of distinct individuals requesting pages from the website during a given period, regardless of how often they visit. Visits refer to the number of
times a site is visited, no matter how many visitors make up those visits. When an individual goes to a website on Tuesday, then again on Wednesday, this is recorded as two visits from one visitor source31. Where in 2016, 53% of the portals scored the maximum points for having more than 0.05% of the country
30 Based on Eurostat figures, Population on 1 January 2016 (updated figures for 2017 had not been made available yet at the time of this research) 31 Definition unique visitor, Wikipedia
11%
3%
14%
4%
57%
11%
Visitors of portal vs inhabitants
<0.014% of inhabitants
>0.015% of inhabitants
>0.02% of inhabitants
>0.04% of inhabitants
>0.05% of inhabitants
Unknown

30
inhabitants visiting the portal on average per month, by 2017 this has slightly increased to 57%. These countries include Austria, Croatia, Cyprus, Estonia, Finland, France, Hungary, Ireland, Luxembourg, the Netherlands, Poland, Romania, Slovakia, Slovenia, Spain and the UK. This continuing trend could indicate that awareness raising activities are having an impact on more people being able to find the national Open Data Portal.
Monitoring user statistics is important to better understand the type of visitors and to know whether data or features provided on the portal are sufficient or should be adjusted. While in 2016 around half of the EU countries did not collect statistics on their portal visitors, by 2017 this has positively decreased to only 39%.
For half of the EU countries the typical profile is a bit of everything, while in Bulgaria and Italy mainly people from the public sector visit the portal and in Cyprus, like in 2016, mainly people from the private sector visit the portal. Also foreigners are increasingly finding their way to other portals. A reason for this could be that people are increasingly becoming interested in knowing what data is available in their neighbouring countries and how this data could potentially be used with similar data from the home country. In 2016, 7 EU countries did not know what the percentage of foreigners visiting their portal was. One country, Latvia, did not have a portal and therefore could not give a percentage. In the other 20 countries, percentages ranged from 3% in Hungary to 30% in Luxembourg.
By 2017, 24 EU countries monitor the percentage of foreigners visiting their portal. Only in Denmark, Latvia, Lithuania and Malta this is not yet being monitored. This is mainly explained by the fact that Latvia, Malta and Denmark do not monitor user statistics and that the Latvian portal was launched only recently. In Luxembourg the percentage of foreigners visiting the portal has gone up to over 60%, which could be explained by the fact that Luxembourg is a small, land-locked country with many foreigners working in
Luxembourg resulting in the portal being accessed from more different geographic locations outside Luxembourg. In Estonia and Ireland the percentage of foreigners visiting the national portal is between 45% and 59% while in Austria, Belgium, Cyprus, Slovakia and Sweden between 30-44% of visitors are foreign. This underlines the importance of data being harmonised within countries as well as between countries. With more foreigners becoming interested in the data of other countries, especially of neighbouring countries, more awareness amongst publishers to move to data quality is needed to supply the demand for data traveling beyond borders.
4%7%
50%
39%
Profile of portal visitors
Mostly privatesector
Mostly publicsector
A bit ofeverything
I don't know

31
Assessing Portal Traffic over the API
An important feature needed to pull data from a portal is the Application Programming Interface (API).
By ensuring API access to data, machine-to-machine communication is made possible. For example, datasets can be accessed automatically by other portals (e.g. pan-European Data infrastructures such as the European Data Portal). In 2017, 89% of the EU Member States provide access via a specific API (25 of 28 countries). Only Estonia, Lithuania and Malta do not provide a specific API. It is therefore interesting to monitor the ratio between machine traffic and human visitors to a portal. By 2017, 15 countries provide statistics on portal traffic generated by an API. As in 2016, in Austria most data is accessed by machines, namely in 71-85% of the visits. This could be explained by the setup of the national coordination in which regional portals upload their data directly on the portal via an API. In Romania, 41-55% of visits come from machines while in the UK 26-40% of visits is generated by machines. The other countries range in the low numbers between 0 and 10% with only Bulgaria, Finland and Italy having a ratio of 11-25% of portal visits being generated by machines. A reason for this could be people being interested in using the features offered on the national portal when using Open Data, as is the case in Italy.
Understanding the importance of Open Data reuse
This chapter on the use of data also investigated to what extent the re-use of Open Data is seen as important by governments and whether this development is further encouraged. Only by re-using data a real impact of Open Data on society can be made. By using data made available by the government, third parties are able to build applications based on this data. This can only happen when data is available and when data is of good enough quality to work with. When asked whether governments find the re-use of Open Data important, 64% of EU countries mentioned this to be very important. For 18% of the countries the re-use of Open Data is somewhat important and for another 18% (5 countries) re-use is seen as important, but does not represent a current focus. Yet in 93% of the countries re-use is supported by government. Only in Hungary and Portugal Open Data is not yet being re-used by other departments. This can be explained by a limited political drive to leverage the benefits of Open Data as well as Open Data related policy and portal developments that may be lagging behind compared to the EU average. Generally, re-use is supported by governments through awareness raising activities such as organising webinars, events and workshops. That re-use is seen as important is also illustrated by the fact that 23 countries are aware of data being re-used by its own government. An example is the
89%
11%
Access via specific API
Yes No
82%
7%
11%
Re-use own government data
Yes
No
I don't know

32
publication of geo-tagged house numbers32 as Open Data by the Italian municipality Terlizzi using data of the national geoportal of the Italian Ministry of the Environment33, associated with the place names of the Municipality of Terlizzi. Another example is the development of the Slovenian portal on public wages34 thanks to the collaboration of the Ministry of Finance and the Ministry of Public Administration. It shows the wages of public servants and the money spent for wages by the ministries and other public sector bodies. The portal has been regularly visited not only by the general public but also by the public servants.
2.3. Impact of Open Data Measuring the impact Open Data has on society is becoming more and more important. With more studies being conducted across Europe, more tangible evidence is created to show policy-makers and the public which value Open Data brings to society. By measuring the impact of Open Data on a yearly basis, it becomes possible to show trends and identify where most progress is being made across Europe. For the purpose of this measurement, studies older than 2 years were no longer taken into consideration. In this section, the size of countries was not part of the exercise. However, a positive correlation was observed between the size of the country and their ability to provide multiple examples for each of the impact dimensions assessed. Hence, most of the medium and large-sized countries provided more than the 2 required examples of use cases/applications/news articles requested as evidence in order to qualify for maximum scores on the impact sub-indicator. In addition, more countries have started to take different European and international studies such as the European Commission’s present study on measuring the state of play of Open Data in Europe, as well as the eGovernment benchmark and the OECD’s public governance reviews of 2016 into account when assessing their country performance.
Each year the Open Data impact indicator looks at the following 3 sub-indicators: political, social and economic impact.
The following sub-sections will shed further light into the progress made on each impact dimension and discuss various examples of Open Data impact in the Member States.
2.3.1. Political impact
In 2016, a total of 9 countries (32%) had conducted activities since June 2015 to monitor the political impact of Open Data (Austria, Finland, France, Greece, Ireland, Italy, Slovakia, Spain and Sweden).By 2017, an additional 4 countries (Czech Republic, Latvia, Netherlands and Poland) have conducted these activities since June 2016.
In sum, 13 EU Member States (46%) have conducted studies underlining the positive political impact of Open Data. In the Czech Republic, a research project started in April 2017 which had monitored the impact of Open Data and would define a methodology for the Czech Ministry of Interior to conduct the same impact research annually. The results of this impact study35 were published by the end of July 2017. In Latvia, the use of Open
32 Geo-tagged house numbers by the municipality Terlizzi. 33 National geoportal of the Italian Ministry of the Environment 34 Slovenian portal on public wages 35 Results of Czech study to monitor the political impact of Open Data in the Czech Republic, July 2017

33
Data through the national portal36 is monitored as well as providing the possibility to communicate use cases of Open Data to data holders37. Monitoring these developments helps support further political commitment to opening data. In the Netherlands, the National Audit organisation (Algemene Rekenkamer) published 3 trend reports about the impact of Open Data in 2015 and in 201638, both in cooperation with the national Open Data Portal team. In Poland, two cooperation platforms were established by the governmental Public Open Data Programme with the aim to monitor the implementation of the programme within the governmental administration. On the one hand, the implementation at the policy level by the ministerial task force is monitored while on the other hand the implementation at the operational level by the network of Open Data Officers is monitored. Every year, Polish Open Data Officers are obliged to file a report on this implementation process. The first report was published at the end of July 201739. In Ireland, the Public Bodies Working Group (PBWG) on Open Data was set up in 2014 and consists of representatives from 30 Irish Public Sector Bodies. The Working Group meets every quarter and guides the Open Data initiative, supports the publication of data across the public sector, and monitors usage and impact of Open Data. Its minutes and progress reports are published online40.
In terms of the impact of Open Data on government efficiency, a clear increase in 2017 in comparison to 2016 can be seen. In 2016, 7 countries estimated the impact to be high (Bulgaria, France, Greece, Ireland, Lithuania, Slovakia and the UK). In 2017, an additional 4 countries estimate the impact to be high, namely Croatia, Luxembourg, Netherlands and Slovenia. In 2016, Croatia estimated this impact to be low, Luxembourg did not know while in the latter two countries the impact was estimated to be medium. In Croatia, the obligation to publish Open Data has resulted in improved government efficiency and effectiveness by creating an incentive to provide better services, as well as greater efficiency of public spending. With regard to improving the effectiveness and efficiency of the public administration, an application had been developed to show the spending of the state budget41. This application is currently being upgraded to enable the extraction of Open Data and enable a searchable database
of all budget payments (salaries for civil servants as well as the payments in social welfare will be offered at an aggregate level).
While in 2016, 12 EU countries estimated the Open Data impact on government efficiency and effectiveness to be low or that it was not measured, in 2017 this number has decreased to only 9 countries.
36 Latvian national Open Data portal statistics 37 Latvian national Open Data portal use cases 38 Trend report Open Data 2016, National Audit Organisation, Netherlands 39 Report on the results of the implementation of the Program for the Opening of Public Data, Poland, July 2017 40 Progress Reports of the Irish Public Bodies Working Group 41 Application that shows state budget spending in Croatia
39%
29%
18%
14%
Impact efficiency
High Medium Low I don't know

34
This trend was witnessed from 2015 to 2016 meaning that countries understand more and more the political importance of Open Data. Furthermore, 8 countries: Austria, Belgium, Bulgaria, Cyprus, Denmark, Germany, Italy and Romania (29%) estimate the impact of Open Data on government efficiency and effectiveness to be medium.
In terms of efficiency, in Cyprus, the Pan Cyprian Bar Association offers free and non-profit access to Cypriot and international sources of law through the online service CyLaw42. It utilises government Open Data (Legislation and Court Decisions) which is organised in a number of searchable online databases. CyLaw is widely used by PSBs when dealing with legal issues or need to search for court decisions. In terms of effectiveness, the Cypriot online platform Diavlos43 provides real time information on road traffic and availability of parking places in Nicosia that enabled the collaboration and coordination between the Department of Public Works and the Local Authorities on road traffic management issues.
42 CyLaw, Cyprus 43 Diavlos, Cyprus
Improving government transparency in Slovenia – introducing Erar and Statist The Slovenian Commission for Prevention of Corruption has developed an application that helps improve government efficiency and effectiveness as well as transparency. The application called Erar assists the development of transparent government in the country. Through proactive transparency of data related to public spending it has a significant effect on strengthening the integrity of public servants. Statist (depicted below) is an application for transparency launched by the Slovenian public procurement and Portal Plač. It promotes the transparency of public spending (wages) and the integrity of the Slovenian institutions.
More information on the two projects are available on the official webpages under https://erar.si/ and https://ejn.gov.si/statist.

35
The fact that countries are increasingly gaining knowledge on the positive political impact of Open Data is further underlined when looking at the impact Open Data has on improving government transparency and accountability. By 2017, more than 50%, namely 15 out of 28 EU countries estimate this impact to be high, in comparison to 13 countries in 2016. In Greece, there is a growing number of new stories and blog entries that are based on evidence from the data uploaded to the Transparency Portal44. This has had a high impact on Greek government transparency and accountability because in many cases suspicious and
erroneous decisions of the public administration had been revealed and later on reversed, as described in several news articles45. Nine EU countries: Austria, Belgium, Bulgaria, Germany, Hungary, Poland, Portugal, Romania and Sweden estimate the impact to be medium as opposed to only 6 countries in 2016. Countries estimating the impact of Open Data on government transparency and accountability to be low or were not measured, has further decreased from 7 countries in 2016 to only 4 countries in 2017. However, especially for countries that have enjoyed more ‘open’ societies without Open Data helping increase a higher level of government transparency and accountability, the specific impact of Open Data can be considered low, even though the actual situation might suggest otherwise in comparison to other EU countries. This could for example be the case in countries such as Denmark.
44 Greek Transparency Portal 45 Parapolitika and AlterInfo
Open Data in Flanders – the GRB use case
The Flanders region in Belgium has a topographic map containing various data about buildings and
their facilities, watercourses, railways and road networks. It is used by various local and regional
administrations, and publishing it as Open Data makes it much more efficient to access / reuse by
these administrations and their IT-partners. The large-scale Reference file (GRB) is a digital
topographic map of Flanders. It is a common geographic base on which all users can grab their own
data. The GRB contains only geographic and distinctive information of well-defines, conventionally
accepted reference data. The objects (railways, road networks, watercourses, buildings) are detailed
and accurately measured so that they can be used in a large scale between 1/250 and 1/5000.
54%32%
11%4%
Impact transparency
High Medium Low I don't know

36
2.3.2. Social impact The social impact of Open Data on society is measured on two different levels: to what extent Open Data has a positive impact on the environmental sustainability in a country and to what extent Open Data has a positive impact on the inclusion of marginalised groups in a country. When assessing the impact of Open Data on marginalised groups in relation to Open Data, countries measure to what extent individuals or entire communities of people that were excluded from politics, social services or various rights, opportunities and resources previously, are now able to participate in society. The most significant increase in 2017 of Open Data having a positive impact on EU countries is measured in the social impact indicator. From 2016 to 2017, this sub-indicator has increased from 28% in 2016 to 49% in 2017, constituting an increase of 21pp. However, in comparison to the economic and political impact indicator, countries do find it most difficult to measure the impact Open Data on a social level. In 2016, 7 countries measured the impact of Open Data on environmental sustainability to be high. By 2017, this number has increased to 10 countries, namely Croatia, Cyprus, France, Greece, Ireland, Italy, Lithuania, Slovenia, Spain and the UK.
In Spain, the pesticide finder GeoSpatiumLab46 helps agricultural companies and individual farmers choose the most suitable pesticides for their crops avoiding potential risks to human health and environment. Open Data is partly used for this company service. In Italy, the Landslide Risk of the Basin Authority of the Campania Region47, has as a main objective to safeguard the safety of people, protect the territory, infrastructure, existing human activities, cultural and environmental assets from flood and flood disasters, while respecting the principles of "sustainable development".
46 GeoSpatiumLab, Spain 47 Landslide Risk of the Basin Authority of the Campania Region
The impact of Open data on the environment – examples from Romania In Romania, the application Forest Inspector which is part of the Integrated Information System for the population of real-time tracking of timber in Romania, can be used by the public to verify a shipment of timber or verifying a car registration number and report suspicious trucks to help preserve Romanian forests.
36%
39%
11%
14%
Impact sustainability
High Medium Low I don't know

37
In 2017, a further 12 countries estimate the social impact to be medium, namely Austria, Belgium, Bulgaria, Cyprus, Denmark, Finland, Germany, Luxembourg, Netherlands, Poland, Romania and Sweden.
In comparison to 2016, this is an increase of 6 countries. While in 2016 more than half of the countries (15), estimated the social impact of Open Data on society to be low or that it has not been measured, by 2017 this number has positively decreased to only 7 countries. Reasons for not being able to measure this impact are mainly related to countries not having specific policies in place to measure this impact or because it is simply too early to launch an evaluation.
The impact of Open Data on the inclusion of marginalised groups has also increased in comparison to 2016. While in 2016 only Spain and the UK estimated the impact to be high, by 2017 this number has more than quadrupled to 9 countries, adding Croatia, Cyprus, Finland, France, Ireland, Italy and Slovenia. In Finland, several applications were created that help improve the mobility of marginalised groups and bring overall benefits to local communities. In Ireland, the Small Business Innovation Research (SBIR) Challenge with Cork County Council, the Age Friendly Alliance and Enterprise Ireland launched a challenge call48 to explore low cost, innovative and accessible solutions that will help all of its older citizens to maintain a
good quality of life and enable them to remain and feel secure in their home. In Slovenia, a specific map49 provides locations where people with a wheelchair can access locations to vote.
Also in the field of culture applications are being developed to increase the visitor experience at museums, galleries, cities, historic locations and tourist attractions. A widely used application is Nexto50, a cultural engagement platform, where you can for example get virtual location guides around the British museum, the Ljubljana Castle, Pompeii, etc.
48 Cork Smart Gateway, Ireland 49 Wheelchair accessible voting locations, Slovenia 50 Nexto
The impact of Open data on the environment – examples from Spain and the UK The Air Madrid application aims to show in a simple and understandable way for non-technical users data on air quality in real time offered by the City of Madrid through its Open Data portal. In the UK, the wide range of environmental information made available by the Environment Agency has had an impact on environmental sustainability such as Flood Alerts. In the UK, making data on water flow and flooding has also created spin-off companies such as Shoothill. Understanding these patterns of water data helps improve management of risk at local community levels.
32%
22%7%
39%
Inclusion maginalised groups
High Medium Low I don't know

38
Furthermore, in France, the digital platform Bob Emploi51 uses Open databases such as the French business registry to help the unemployed to find specifically targeted job offers. Various services and web and mobile applications for people with disabilities have been developed that calculate itineraries and accessible areas and routes. Examples are Handimap.org52, Accessible.net53 or the mobile GPS application SharePA (depicted in the insights box below). In France many hackathons take place focusing on improving services for the handicapped and disabled people, such as events organised by the French Association for the Social and Vocational Integration of People with Disabilities54. Furthermore, a simulator based on Open Data, called Mes-Aides55, allows people with low revenue to assess the grants and subsidies they can receive from the government and social security services. In Spain, the platform Divertour56 is used by tour guides and museums to provide free treasure hunts for smartphones using geolocation, augmented reality and social interaction. This has helped tour guides and museums to attract more young people.
51 Bob Emploi, France 52 Handimap.org, France 53 Accessible.net, France 54 Association for the Social and Vocational Integration of People with Disabilities, France 55 Mes-Aides, France 56 Divertour, Spain
The impact of Open data on social inclusion - A Finnish example
BlindSquare is a Finnish accessible GPS application developed for the blind and visually
impaired. It uses Open Data of services and places and describes the environment,
announces points of interest and street intersections as you travel.

39
Improving mobility with Open Data – examples from Croatia and Cyprus The HZPP Planner developed by the Croatian Railway Services provides users with all the information they need to get to the destination with the least effort. The application provides a wide range of information to the traveller, from the information related to the trip, to information whether there are train delays, fallouts or roadworks on the respective route, to the possibility of transporting bicycles along and accessibility for persons with disabilities. In Cyprus, the “traffic 4 Cyprus” application provides users with a full package of live information about traffic in Nicosia and the inter-urban network, roadwork in progress, the availability of parking places in Nicosia city centre, route planner tools as well as the bike network in the city.

40
In 2017, 6 EU countries: Bulgaria, Germany, Greece, the Netherlands, Poland and Romania estimate the impact of Open Data on marginalised groups to be medium, one country less than in 2016. However, where in 2016 19 countries estimated the impact to be low or were not measured, by 2017 this number has positively decreased to 13 countries. This means that still nearly half of the EU countries have not yet been able to put in adequate measures to allow for Open Data to bring value to marginalised groups. With a growing awareness of the value Open Data brings to society by governments and communities, it is expected that by 2018 more EU countries will be able to measure this social impact. In several other countries applications are being developed that use Open Data on railway traffic to enable users to plan their journey more efficiently. One of those examples is the application provided by the Croatian Railway Services57 or the one developed by the Cypriot government.
2.3.3. Economic impact For most governments, the key to invest more in Open Data, to improve the quality of Open Data for greater re-use and to drive business innovation, is to know the economic impact of Open Data. Over the past years, various studies have made an attempt to measure the impact of Open Data initiatives to underline the importance of Open Data for economic growth, to drive monetary benefits and foster transparency. Especially since Open Data generally has a marginal cost of zero, further economic benefits are likely to result from more organisations re-using Open Data. But the results of the studies vary, and figures are sometimes outdated. In addition, although recent studies shed some light on how companies transform Open Data into value, such as the 2017 study on Re-using Open Data that focused on companies transforming Open Data into economic and societal value’58 conducted by the European Data Portal, a further understanding of how Open Data is used at company level is still on the wish list of many data publishing organisations. This information provides valuable input for their data publication process and the kind of data they provide, as re-users of Open Data still encounter several barriers, which is further analysed in the 2017 EDP report on Open Data and Barriers59.
Several economic benefits of the use of Open Data can be identified – both direct and indirect benefits. Direct benefits are monetised benefits that are realised in market transactions in the form of revenues and Gross Value Added (GVA), the number of jobs involved in producing a service or product, and cost savings. Indirect economic benefits are i.e. new goods and services, time savings for users of applications using Open Data, knowledge economy growth, increased efficiency in public services and growth of related markets. The EDP “Creating Value from Open Data” study60 estimated a total market size between 193 bn. and 209 bn. EUR for 2016, with an estimated projection of 265-286 bn. EUR for 2020, including inflation corrections. A cumulative total market size was estimated, ranging between EUR 1.138 to 1.229 bn. by 2020. Between 2016 and 2020, the market size for Open Data is estimated to increase by 36.9%, to a value of 75.7 bn. EUR in 2020. For the period 2016-2020, the cumulative direct market size is estimated at 325 bn. EUR. The cumulative total market size for Open Data is forecasted to be between 1,138 and 1,229 bn. EUR61.
57 Croatian Railway Services application 58 EDP (2017) Re-using Open Data: a study on companies transforming Open Data into economic and societal value 59 EDP Report (2017) Barriers in working with Open Data 60 EDP Report (2016) Creating Value through Open Data 61 Ibid, page 9.

41
From 2017 to 2020, the EU28+ Open Data market size is also expected to grow annually by more than 8% on average. As a result of this growing market size, the demand for skilled Open Data workers increases. New jobs are created through the stimulation of the economy and a higher demand for personnel with the skills to work with data. In 2017, there will be 80,000 Open Data jobs within the EU 28+ private sector. By 2020, this number will increase to just under 100,000 Open Data jobs, creating almost 20,000 new direct Open Data jobs by 2020 as compared to 2017. When looking at the impact of Open Data for the particular sectors, public administration is expected to have the highest share in the direct market size, with a value of 22,111 mio. EUR.
In addition to the numbers provided by the European Commission via the studies published by the European Data Portal, countries are eager to obtain more granular numbers as well as to validate findings they can further tailor to their economic priorities.
It appears that Member States have made some progress in this regard in comparison to 2016, with scores improving on the economic impact sub-indicator. Compared to the initial five countries that had conducted studies to assess the Open Data market value in 2015, by 2017 this number has increased to 9. Whereas in 2015, 5 EU countries have conducted such studies (France, Germany, Italy, Spain and the UK), in 2017 the list comprised also Denmark, Finland, Ireland and the Netherlands. These studies do not necessarily come from the national level, certain studies have been conducted by think tanks or civil society organisations.
In Spain, the 5th edition of the report on the infomediary sector62 has been published (see insights box below). In Denmark, for geospatial data, a socioeconomic measurement63 of the effects of open geospatial data had been conducted, which estimated the value of open geospatial data in Denmark. The study shows that Danish Open Data in 2016 have doubled in terms of efficiency and production gains since 2012 to 3.5 billion kroner in 2016. Another Danish study64, from 2016, has shown that Danish society can gain between 50 and 135 million kroner annually, in selected sectors such as the electricity sector, the district heating sector and the agricultural sector based on open meteorological data. In Finland a study published on the use and impact of Open Data in Finland65 found that firms using Open Data and big data in their
62 5th Edition of the Report on the infomediary sector (2017) Spain 63 Effects of the free geodata (2017) Denmark
64 Socio-economic consequences of releasing meteorological data (2016) Denmark 65 Use and impact of Open Data in Finland (2017) Finland

42
innovation activities were clearly more likely to produce new-to-market innovations than those firms that did not use Open Data in their innovation activities. Moreover, the study found that those firms active in the information and communications sector and using data for innovation witnessed, on average, 17 percent higher sales growth during the years 2012–2014 than those firms in the same sector that did not use data in innovation. Traffic data appeared to be the only data type contributing to the sales growth.
In the Netherlands a cost-value analysis66 had been conducted. Finally, in Ireland, several studies had been conducted focusing on:
1. The Construction of a Linked Data Platform for Ireland’s Authoritative Geospatial Linked Data67 2. Exploring the economic value of open government data68 3. Governance, Transparency and the Collaborative Design of Open Data Collaboration Platforms:
understanding barriers, options, and needs69 4. Improving data workflow systems with cloud services and use of open data for bioinformatics
research70
66 Societal cost-value analysis of Open Data (2017) Netherlands 67 The Construction for a Linked Data Platform for Ireland’s Authoritative Geospatial Linked Data (2017) Ireland 68 Exploring the economic value of open government data (2016) Ireland 69 Governance, Transparency and the Collaborative Design of Open Data Collaboration Platforms: understanding barriers, options, and needs (2016) Ireland 70 Improving data workflow systems with cloud services and use of open data for bioinformatics research (2016) Ireland
The infomediary sector of Open Data - an example from Spain In 2017, the Multisectoral Information Association published a report analysing in detail the Spanish infomediary market. A number of 636 Spanish companies had been assessed whose activity is based on the re-use of public and/or private information to develop value-added products for third parties or citizens in general in the following sub-sectors: culture, directory services, economic and financial, publishing, market research, geographic information, meteorological, or tourism.
The objective was to assess how the use of Open Data improves the efficiency and effectiveness of the government itself through better planning of available resources, collaboration between different departmental areas, scrutiny of the correct use of resources, improvements in the interoperability of data and processes, as well as the adoption of standards that facilitate the sharing and storage of data.
The study showed that the use of Open Data drives public innovation by contributing to the identification of patterns that help decision-making, to more active development and implementation of public policies, and the improvement of data quality thanks to public feedback. With regard to the total revenues (for the year 2015), the study showed that they increased to €1,705 billion which means an average turnover of 2.68 million euros per company.
According to the report, the infomediary sector employed 19,362 workers in 2015, a positive variation of 4.3% compared to the previous edition. The largest growth has been recorded in the economic and financial sector, with 219 employees more than in 2014, a similar number to the geographic information industry, with 215 more employees. At the closing of 2016 the total subscribed capital was 366 million euros, 20.7% lower than the previous year, after three consecutive years of growth.

43
In terms of studies assessing better service delivery, 11 EU countries have published studies since 2015. In addition to France, Spain, Denmark, Finland, Ireland and the Netherlands, also Bulgaria, the Czech Republic, Latvia, Lithuania, Romania and Sweden have investigated how to improve service delivery. However, only Spain, Ireland the Netherlands and Sweden have published studies in 2017. The Swedish National Archives published a pre-study71 in July 2017 providing suggestions on how the National Archives could collect and publish PSI datasets. The report illustrates the state of the art with regard to the work on the PSI at national and European level. The study serves as a guide on how to create and publish datasets according to the metadata format DCAT-AP, leading to a better coordination of the preparation and publication of datasets. Through this metadata specification, the National Archives can collect the datasets produced by ‘harvesting’ them and publishing them on the Swedish national Open Data Portal. In the Netherlands two studies have been published on data registers and data portfolio management by the Ministry of Education, Culture and Science72 and one study on how to improve the functioning of the Dutch digital government73. In Lithuania, a study had been conducted in 2015 defining the feasibility of the implementation of the Open Data initiative74.
In Ireland, The Dublin Economic Monitor75 - a joint initiative on behalf of the four Dublin local authorities, coordinated by the City Council represents a further manifestation of the enhanced role of local authorities in the area of economic development and enterprise support, in line with the local government reform programme. The Monitor, which will be published free of charge on-line every quarter, is intended to track developments in the Dublin economy. An article76 had been published about the importance of good licensing if OGD is to be used effectively, including a number of issues that would have to be addressed by designers of OGD licences. In addition, the National University of Maynooth has set up a Programmable City project77. The Programmable City project is investigating the relationship between networked digital technologies, infrastructures, urban management, governance and city life. In particular, the project addresses the issue of how cities are increasingly being translated into code and data, and how these codes and data are being used to transduce how we understand, manage, work, and live in the city and to produce ‘smart cities’. In Spain, the report on ‘The value of Open Data for the Government’78, published in August 2017, and outlines a large number of international examples and case studies of how governments (could) benefit from Open Data in various areas. The examples provide a clear picture of how public administrations today are benefiting from Open Data published and managed by themselves. 8 EU countries are not aware of studies being conducted in their country that assess better service delivery.
71 Prestudy on PSI lists (2017) Sweden 72 Data portfolio management OCW (2017) Netherlands 73 Make true (2017) Netherlands 74 Feasibility of the implementation of the Open Data initiative (2015) Lithuania 75 Dublin Economic Monitor (2017) Ireland 76 Open data licensing: More than meets the eye (2015) Ireland 77 Link to multiple publications (2017) Ireland 78 The Value of Open Data for the Government (2017) Spain

44
Figure 4 The value of Open Data for the government (2017) Spain
In 2017, 50% of the EU countries have published additional studies measuring the impact of Open Data. Studies range from dissertations about the business models in OGD79 (Austria) to publishing transport data for maximum re-use80 (Belgium). In several EU countries studies are currently being conducted, such as in Austria which expects a study on the impact of Open Data to be published in autumn 2017. In Lithuania, a tender with the request to evaluate the social and economic impact of the re-use of Open Data and which datasets should be opened, closed in September 201781. Another example is a study by the Swedish Agency for Public Management, which is following up on the government and local authorities' efforts to make information available for reuse. The first report was published in 2015, and a follow up is planned to be conducted by the end of 201782. Generally, it can be concluded that quite a few EU countries are making an effort to document the true economic impact of Open Data on their societies. However, a reason for the fact that less than half of the EU countries do conduct, or are aware of studies being conducted in their countries, could be attributed to the significant time and financial investment it takes to conduct such a study. Especially in smaller countries it is often quite difficult to conduct specific studies if the Open Data team consists of only one or two people.
79 Business models in Open Government Data (2016) Austria 80 Publishing transport data for maximum re-use (2017) Belgium 81 Open Data Platforms Enabling Effective Public Sector Information Reuse for Business and Creation of its Management Tools (2016) Lithuania 82 Follow up report on efforts made to make data available for re-use (2017) Sweden

45
When asked about the funding model national Open Data portals are using, all 28 EU countries mentioned they use the Marginal / Zero Cost Model which aims to provide data for the costs of processing the data request only or free of charge. This is an improvement in comparison to 2016, when only 25 EU countries could verify they were using this model. Italy was not aware which funding model was being used while Latvia and Malta did not yet have a portal and therefore had no funding model. Providing data at marginal or zero cost is important because it shows the good intentions of countries to open up more data free of charge to be re-used. However, in some countries this is still a work in progress since not all data provided on their portals is 100% free of charge yet or where the law, following the PSI guidelines, does allow certain data to be charged for.
Open Data for Economic Development – event by the Consortium of Municipalities of Trentino, Italy
This new opportunity for Open Government whose goal is to strengthen the relationship between local government and citizens - represents the new frontier of local-digital development that Trentino is among the first to realize in Europe. In fact, OpenAgenda can update real-time appointments created by associations, libraries and museums that are translated into the official EU languages. It is based on the strength of the Open Data, and its first experimentation with ViviAla is already a success. "In addition to promoting transparency and the participation of citizens and businesses in the life of public administration, Open Data creates favourable conditions for the economic growth of the territory," said Gabriele Ciasullo, Head of the Data and Open Data Service of the Agency for the Public Administration, Digital Italy (Agid) at the Presidency of the Council of Ministers.
Open Data applications in Cyprus
Despite its small size, several applications based on Open Data are available in Cyprus, that also show the country’s vibrant Open Data developers community as well as the public administrations’ engagement in providing the necessary Open Data.

46

47
2.4. Progress so far - Open Data Readiness The previous section has shed light on the developments and progress registered with regards to the first dimension - Open Data Readiness. It analysed the extent to which countries have an Open Data policy in place, if their licensing norms comply with the requirements in order to be called Open Data and to what extent there is a coordination of Open Data policy and activities between national and lower governmental level. In addition, it also examined to what extent Open Data is used, and how Open Data impacts society from a political, social and economic perspective.
When analysing the aggregate score of the first indicator, Open Data policies of the EU28, it becomes clear that the vast majority of EU countries have, by 2017, reached an average maturity level of 82.1%. This is an increase of 22.8pp. in comparison to 2015 and an increase of 14.9 pp. in comparison to 2016. When looking at the progress made from 2015 to 2017, 23 countries have improved their Open Data policies maturity level with Latvia being in the lead having improved its situation by 51 pp. (having moved up from 26% in 2015 to 34% in 2016 and 85% in 2017). This can largely be attributed to Latvia having launched its portal in 2017 and for having invested a lot of efforts in its Open Data journey.
The second country witnessing the strongest acceleration in terms of Open Data policies maturity is Luxembourg, having gone up by 47 pp. between 2015 and 2017 (having started with 31% in 2015 to 49% in 2016 to 96% in 2017). For Luxembourg the same reasons as for Latvia apply: a stong focus with a clear roadmap and political drive. The third country to have accelerated the most in terms of Open Data policies is Italy, having gone up by 29 pp. (having started with 74% in 2015, to having gone down to 62% in 2016 to having accelerated back up to 91% in 2017). This can be attributed to Italyhaving spent a lot of effort on revamping the national Open Data Portal and defining new policies including stong national guidelines in 2016, having fruitened into a renewed acceleration of Open Data maturity on this indicator by 2017.
Figure 5 Open Data Policy, Evolution 2015- 2017, break-down per sub-indicator (%)

48
As shown in the picture above, compared to the previous years, progress can be observed on all three sub-indicators, with a visible boost across the EU28 in terms of the degree of national coordination which registered a spectacular increase of 33pp to reach 85% in 2017. This could be partly explained by a slightly updated methodology where especially smaller countries were able to improve their scoring by providing arguments to support the lack of regional portals in their countries. This is the case for countries such as Luxembourg, Slovenia and Malta, which do not have many inhabitants, data or cities, hence making the rationale for setting up local data portals redundant. Smaller increases have been registered with regards to the sub-indicator Presence of Open Data policies (now at 79%, +8pp compared to 2016) which can be partly attributed to Hungary and Portugal, both having defined their Open Data policies by 2017. Croatia is still in the drafting phase. The smallest increase can be observed in terms of licensing norms (now at 89%, +12pp. vs 2016).
In general for the EU28, the ‘presence of Open Data policies’ as sub-indicator of the indicator ‘Open Data policies’ has increased from 61.4% in 2015 to 71.2% in 2016 to 79.1% in 2017. As in 2016, also in 2017 the Czech Republic has increased the most on this sub-indicator, having gone up from 33.3% in 2015 to 87.9% in 2016 to 96.3% in 2017 thanks to having put in place various policies to support Open Data. Although 22 EU countries have increased their scoring on this sub-indicator, 6 countries decreased ranging from a total of 12.9 pp. decrease between 2015 and 2017 by Poland to 1.7 pp. decrease between 2015 and 2017 by Portugal. This could be explained by some countries still working on defining their Open Data strategy, or having paused certain of their Open Data related activities in order to reorganise them as is the case in Denmark.
The second sub-indicator, licensing norms, has generally increased from 73.5% in 2015 to 77.1% in 2016 to 89.1% in 2017. The two countries that have gone up from 0% in 2015 to scoring the maximum of 100% in 2017 in terms of licensing are Malta and Latvia which could be explained by them not yet having a national portal in 2015 and being in the process of defining the legal framework for Open Data prior to publishing data. Both countries now have all their data free of charge, openly licensed and recommend the CC licence by 2017. Although 19 countries improved their licensing in the past 2 years, 9 countries have shown a decrease, ranging from 25.0pp. in the UK to 5.4 pp. in Hungary. The situation in the UK could be explained by the fact that a number of the non-OGL licensed data on the UK national Open Data Portal relates to INSPIRE data. Licences for this data do not allow commercial use. Several other countries have lost points for not providing all data with an open licence and/or not recommending the CC licence. One of the reasons for this decrease may be that portal owners have focused more on releasing higher volumes of data as opposed to providing a clear licensing framework.
The third sub-indicator, national coordination, has generally increased from 46.7% in 2015 to 52.3% in 2016 to 86.7% in 2017. The two countries that have gone up from 0% in 2015 to scoring the maximum of 100% in 2017 are Malta and Slovenia. Both countries are quite small and do not have many inhabitants resulting in a lack of need of local portals. All data is published on the national portal, having strong ties with publishers. Bulgaria and Latvia show an increase between 2015 and 2017 of 92.3 pp. each; again two countries regarded as having a small population size. Only 2 EU countries show a decrease on this sub-indicator, ranging from a decrease of 9.3 pp. in Portugal to a decrease of 4.4 pp. in Sweden. A reason for Portugal could be a fragmented public administration with different agencies and ministries involved in Open Data in combination with a lack of a clear mandate to force a clear direction with who is responsible for what.
Looking at the progress so far on the Open Data Readiness dimensions, countries have made significant efforts to improve, which have led to an increase of the EU average with 15pp to reach 72% in 2017 (weighted averages of the three sub-indicators depicted below). These results gain further significance

49
when balanced against the first measurement of 2015, where the EU28 were experiencing a degree of Open Data Readiness maturity of only 47%.
Figure 6 Open Data Readiness – EU28 (2015-2017, % average results)
Overall, as Figure 6 depicts, the EU28 have registered a steady increase on all three dimensions when compared to 2016 and 2015. The scores on the Open Data policy sub-indicator have steadily increased from an initial 59% in 2015, to 67% in 2016, to 82% in 2017. On the Use of Open Data sub-indicator the EU28 registered a degree of maturity of 67%, a 16pp increase compared to 2016 and a spectacular +31pp leap compared to 2015. The impact of Open Data sub-indicator has now reached 54%, and has made some noteworthy progress compared to the scores of 44% in 2016 and 31% in 2015. However the increase on this dimension does not keep up the pace with the other two sub-indicators constituting Open Data Readiness.
Going one step further with the analysis, Figure 7 below presents the EU28 country performances on the indicator Open Data Readiness in 2017. With the majority of EU28 (57%) registering scores above the EU average of 72%, the EU28 is heading at a good pace to reaching maturity on this dimension. Top 5 performers on this dimension are Ireland (97%), Spain (94%), Netherlands (93%), France (92%) and Finland (90%), followed by Slovenia (84%), Luxembourg (82%) and Italy (81%) – to name only the countries that have exceeded the 80% landmark in 2017.
Taking a closer look at the evolution that the EU28 countries have made from 2015 onwards, the image of a Europe of different speeds becomes visible (see Figure 8 below). When compared to the baseline of 2015, several countries have made a spectacular leap forward. Particularly worth highlighting are Luxembourg with an increase of 63pp vs 2015 to now reach 82%, Ireland (+55pp to now 97% and top performer on this dimension as well), Latvia (+54pp vs. 2015), Slovenia (+50pp vs 2015), Czech Republic (+43pp. vs 2015), Malta (+40pp vs 2015), Italy (+38pp vs 2015), Cyprus (+35% vs 2015), Belgium (+32% vs 2015) and the Netherlands and Romania (both +30pp vs 2015).

50
Figure 7 Open Data Readiness EU28 country ranking (2017, %)
Figure 8 Open Data Readiness – EU28 (2015-2017, %)
72%
0%
20%
40%
60%
80%
100%
IE ES NL
FR FI SI LU IT UK CY SK BG
RO EL AT
HR
EU2
8 LV CZ
BE
DE SE PL
DK LT EE HU PT
MT
Open Data Readiness EU28 2017 (%)
72%
57%
47%
0%
20%
40%
60%
80%
100%
IE ES NL FR FI SI LU IT UK CY SK BG RO EL AT HR LV CZ BE DE SE PL DK LI EE HU PT MT
Open Data Readiness EU28 Progress 2015-2017 (%)
2017 2016 2015 EU28 2017 EU28 2016 EU28 2015

51
Given the importance that Open Data positively impacts the virtuous circle of Open Data publication and subsequently re-use, the Impact of Open Data is dedicated a separate section and will be discussed in the following paragraphs. The progress will be presented as well as the reasons for the respective evolution on each of the dimensions: political, social, and economic.
Impact of Open Data
As in 2015 and in 2016, also in 2017 it becomes clear that measuring the impact of Open Data is gaining more and more relevance. In comparison to the two previous years, EU countries have been able to demonstrate a visible increase in the average level of Open Data maturity on all three impact related sub-indicators: the political, social and economic impact indicators.
In terms of the impact of Open Data across Europe, progress can be observed in 2017, with a EU28 average that has jumped to 54% in 2017 from 44% in 2016, starting at an initial score of 31% in 2015 – a constant increase of nearly 10-12pp per year.
When breaking down these averages, the results are moderate to good with the impact on the political level ranking highest with 57%, followed by the economic impact (54%) and the societal impact (49%). Compared to the previous measurement of 2016, the political and social impact have both been on a growing path with increases of 11pp and respectively 21pp – an impressive boost on the impact on the social level. The economic impact has registered only a small increase from 51% in 2016, mainly due to the limited number of studies having been published in the past 2 years to assess the impact of Open Data on both macro and micro levels.
Figure 9 Open Data impact - EU28 (2015-2017, %)

52
As presented above, the impact of Open Data in the EU28 from 2016 to 2017 increased the most on the social impact indicator, going up from 8.9% in 2015 to 27.7% in 2016 to 49.1% in 2017. This constitutes an increase of 40pp. from 2015 to 2017 and an increase of 21.4 pp. from 2016 to 2017. This could be attributed to several reasons. Firstly, now that countries have launched their portals, they are increasingly attentive to what is happening with the data, as opposed to having prioritised making the data available as part of the early stages of the Open Data journey. Secondly, the more evidence there is around the benefits Open Data brings to society, the more political support countries receive in opening up data and improving its quality. Thirdly, the community is becoming more aware of the existence of Open Data thanks to more events being organised. Fourthly, technology is improving helping the re-use community to build applications. Finally, peer learning at the European level, via the European Data Portal activities has enabled countries to better understand how to measure the impact of Open Data and what type of Open Data based applications to look for as examples. The increased estimated impact of Open Data on both environmental sustainability and on better inclusion of marginalised groups also shows the importance of Open Data in unquantifiable benefits.
While in 2016 only Spain and the UK showed full maturity on the social impact indicator, by 2017 also Croatia, Cyprus, France, Ireland, Italy and Slovenia show full maturity on this sub-indicator. Finland and Greece have scored 45 out of 60 points – three quarters of this indicators. Bulgaria, Germany, Lithuania, the Netherlands, Poland and Romania have all scored half of the points. This shows an increase in the attention paid to social impact of Open Data, adding to the list of benefits often attributed to Open Data. Austria, Belgium, Denmark, Luxembourg and Sweden have scored 15 out of 60 points – a quarter of the points – and the rest did not receive any points. On this sub-indicator, 6 countries have reached the maximum of 100% within a period of two years (from 2015 to 2017), namely Croatia, Cyprus, Ireland, Italy, Latvia and the UK. Greece and Slovenia have increased by 75 pp. This could be explained by these countries having made substantial efforts to understand what is happening in their country and grasp how Open Data impacts society. Some countries have measured a stable level of social impact, with increases of 25 to even 50 pp. Only one country, Slovakia, has gone down in the past two years, by 50 pp. This might be caused by the fact that in Slovakia only a few companies seem to be providing and using Open Data, mainly in the financial sector. Which might also be triggered by the fact that no market value studies have been conducted in Slovakia so far, hence little proof has been brought to quantify the impact of Open Data on the economic level in the country. This in turn leads – as noticed – to less impulses for businesses to use Open Data to develop products and services.
The second biggest increase in the impact Open Data has on society in the EU28 appears to be on the political level. The political impact indicator went up from 33.6% in 2015 to 45.8% in 2016 to 57.1% in 2017 (+12.2 pp). from 2015 to 2016 and 23.5 pp. from 2015 to 2017. Having reached a EU28 average level of 57.1% in 2017 means that by 2017 this sub-indicator shows the highest level of maturity. This is the first year the political sub-indicator has reached above 50%. The main reason for this steep increase compared to the previous year lies in the fact that governments are increasingly aware of the impact publishing data has had in contributing to higher levels of transparency, more accountability and a more efficient and effective government. Where in 2016 Bulgaria, France, Greece, Ireland and Slovakia were fully mature in terms of measuring high political impact, by 2017, besides France, Greece, Ireland and Slovakia, also the Netherlands and Spain score full points on the political impact indicator; followed by Italy scoring 100 out of 120 points. Following Ireland with an increase of 100% from 2015 to 2017, Croatia, Luxembourg, the Netherlands and the UK have all moved up on the political impact indicator by 75 pp. between 2015 and 2017. Again increases can be explained by the fact that further transparency offered by more systematic data publishing impacts the vision citizens have of their political masters. Although 22 countries have increased their political impact maturity in the past 2 years, 6 countries have gone down,
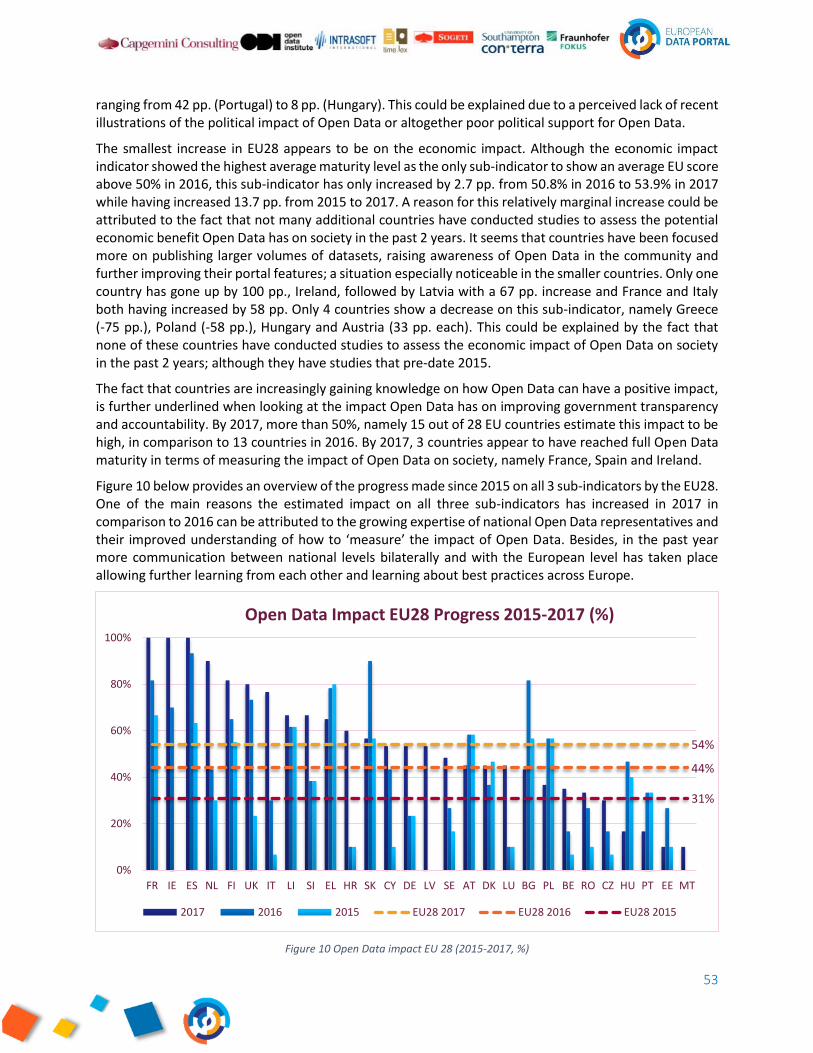
53
ranging from 42 pp. (Portugal) to 8 pp. (Hungary). This could be explained due to a perceived lack of recent illustrations of the political impact of Open Data or altogether poor political support for Open Data.
The smallest increase in EU28 appears to be on the economic impact. Although the economic impact indicator showed the highest average maturity level as the only sub-indicator to show an average EU score above 50% in 2016, this sub-indicator has only increased by 2.7 pp. from 50.8% in 2016 to 53.9% in 2017 while having increased 13.7 pp. from 2015 to 2017. A reason for this relatively marginal increase could be attributed to the fact that not many additional countries have conducted studies to assess the potential economic benefit Open Data has on society in the past 2 years. It seems that countries have been focused more on publishing larger volumes of datasets, raising awareness of Open Data in the community and further improving their portal features; a situation especially noticeable in the smaller countries. Only one country has gone up by 100 pp., Ireland, followed by Latvia with a 67 pp. increase and France and Italy both having increased by 58 pp. Only 4 countries show a decrease on this sub-indicator, namely Greece (-75 pp.), Poland (-58 pp.), Hungary and Austria (33 pp. each). This could be explained by the fact that none of these countries have conducted studies to assess the economic impact of Open Data on society in the past 2 years; although they have studies that pre-date 2015.
The fact that countries are increasingly gaining knowledge on how Open Data can have a positive impact, is further underlined when looking at the impact Open Data has on improving government transparency and accountability. By 2017, more than 50%, namely 15 out of 28 EU countries estimate this impact to be high, in comparison to 13 countries in 2016. By 2017, 3 countries appear to have reached full Open Data maturity in terms of measuring the impact of Open Data on society, namely France, Spain and Ireland.
Figure 10 below provides an overview of the progress made since 2015 on all 3 sub-indicators by the EU28. One of the main reasons the estimated impact on all three sub-indicators has increased in 2017 in comparison to 2016 can be attributed to the growing expertise of national Open Data representatives and their improved understanding of how to ‘measure’ the impact of Open Data. Besides, in the past year more communication between national levels bilaterally and with the European level has taken place allowing further learning from each other and learning about best practices across Europe.
Figure 10 Open Data impact EU 28 (2015-2017, %)
54%
44%
31%
0%
20%
40%
60%
80%
100%
FR IE ES NL FI UK IT LI SI EL HR SK CY DE LV SE AT DK LU BG PL BE RO CZ HU PT EE MT
Open Data Impact EU28 Progress 2015-2017 (%)
2017 2016 2015 EU28 2017 EU28 2016 EU28 2015

54
3. Portal Maturity
When understanding a country’s Open Data maturity level, it is important to grasp the level of maturity that its national Open Data platform depicts. Such infrastructures are key elements to ensuring a free access ‘market place’ for Open Data publishers and re-users. In an ideal scenario, the platform provides a user friendly feature for publishers to easily publish their data. For re-users, Open Data platforms at national level offer a user-friendly interface to access Open Data available in a given country. Open Data Portals are therefore the interface through which the Open Data ambition is materialised and data made available for reuse.
The second composite indicator of the landscaping looks at the maturity of national Open Data Portals across Europe and assesses the current level of sophistication that such infrastructures provide. It looks at the features that such platforms offer to both publishers and re-users.
The following section sheds light into the results registered in the EU28 on the sub-indicators that compose the dimension Portal Maturity: portal usability, re-usability of data, and spread of data.
3.1. Usability of the portal The first indicator looks at portal features and analyses the extent to which options such as the access to and download of datasets are available. This indicator also explores the possibility for users to contribute to the data catalogues available by uploading their own datasets and whether or not there is an option for users to provide feedback on existing datasets. In 2017, only one of the EU28 Member States (Malta) does not provide access to datasets on its national portal, compared to three countries in 2016. In terms of the download function for datasets, 89% of the EU28 national portals (25 countries) have such features in place, a 7pp. increase from the numbers of 2016 (where the score stagnated at 82% vs 2015).
89%
11%
Download datasets - EU28, 2017
Yes No
96%
4%
Access to datasets - EU28, 2017
Yes No

55
Feedback mechanisms are essential to ensuring that users can report missing datasets, broken links as well as provide feedback on improving the quality of existing data. They also ensure that, in particular, the supply side of Open Data remains up-to-date with the needs of the demand side (e.g. developer community, data analysts etc.). In addition, this also represents an important mechanism for quality control by users and ensures that sufficient dialogue channels are provided for re-users to interact with data publishers. Such interaction is beneficial for both sides, as Open Data publishers get to understand what data is in high-demand and are therefore able to prioritise releases according to the actual needs of re-users. On the other side, re-users would get more involved in the prioritisation of Open Data publishing and subsequently, obtain the data they need in order to develop
the envisaged products and services. In this regard as well, the EU Member States show very good results, with almost 9 in 10 portals (86%) across Europe providing such opportunities for feedback. Only Denmark, Greece, Hungary and Malta indicated in 2017 that their national portals do not provide such functions. Although the numbers depict good results across Europe, it is expected that the planned portal update in Denmark, Greece and Malta will include such features as well. In Hungary, no portal update is planned at the moment.
Going one step further, only 40% of national portals in the EU28 offer the option to contribute datasets to the portal (+2pp compared to 2016). It seems that introducing such features did not represent a priority for portal owners in 2017. This might change in 2018, given the fact that 93% of the EU28 (26 Member States) are planning to update their portal in the near future. It will therefore be interesting to observe if such updates will also include portal features that aim to increase further interaction and the idea of co-creation (in this example, by enabling users to contribute to/ with datasets). In light of the relatively modest percentage, this would be a welcomed development.
Figure 11 Portal usability EU28, 2017 (%)
68%
0%
20%
40%
60%
80%
100%
FR IE FI SK HR EE LU SI ES BG AT
DE
NL
RO
EU2
8 LV SE UK
BE
CY
CZ IT LT PL
PT
HU EL DK
MT
Portal usability EU28 2017
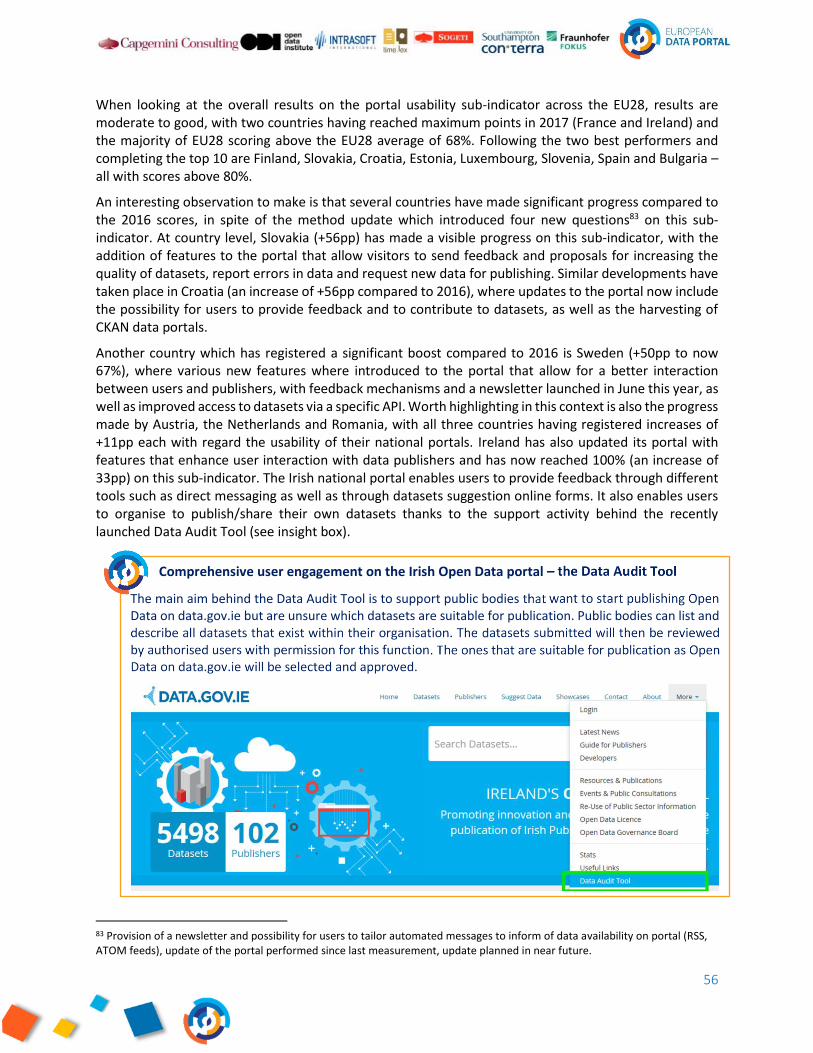
56
When looking at the overall results on the portal usability sub-indicator across the EU28, results are moderate to good, with two countries having reached maximum points in 2017 (France and Ireland) and the majority of EU28 scoring above the EU28 average of 68%. Following the two best performers and completing the top 10 are Finland, Slovakia, Croatia, Estonia, Luxembourg, Slovenia, Spain and Bulgaria – all with scores above 80%.
An interesting observation to make is that several countries have made significant progress compared to the 2016 scores, in spite of the method update which introduced four new questions83 on this sub-indicator. At country level, Slovakia (+56pp) has made a visible progress on this sub-indicator, with the addition of features to the portal that allow visitors to send feedback and proposals for increasing the quality of datasets, report errors in data and request new data for publishing. Similar developments have taken place in Croatia (an increase of +56pp compared to 2016), where updates to the portal now include the possibility for users to provide feedback and to contribute to datasets, as well as the harvesting of CKAN data portals.
Another country which has registered a significant boost compared to 2016 is Sweden (+50pp to now 67%), where various new features where introduced to the portal that allow for a better interaction between users and publishers, with feedback mechanisms and a newsletter launched in June this year, as well as improved access to datasets via a specific API. Worth highlighting in this context is also the progress made by Austria, the Netherlands and Romania, with all three countries having registered increases of +11pp each with regard the usability of their national portals. Ireland has also updated its portal with features that enhance user interaction with data publishers and has now reached 100% (an increase of 33pp) on this sub-indicator. The Irish national portal enables users to provide feedback through different tools such as direct messaging as well as through datasets suggestion online forms. It also enables users to organise to publish/share their own datasets thanks to the support activity behind the recently launched Data Audit Tool (see insight box).
83 Provision of a newsletter and possibility for users to tailor automated messages to inform of data availability on portal (RSS, ATOM feeds), update of the portal performed since last measurement, update planned in near future.

57
3.2. Re-usability of data This indicator assesses to what extent the data published can easily be re-used. It looks at the percentage of machine-readability of datasets as well as the format in which the data is made available. Machine-readability is ensured when datasets are published in formats such as .csv, .json and .xml. The re-usability of data is strongly dependent on the quality of the published data and its adjacent metadata. Quality data needs to fulfil technical requirements related to the format in which the data is published or the structure of such data.
By ensuring high- quality and consistency of (meta-)data, data publishers enable data re-users to easily process the datasets. This eases the work of developers and at the same time enables the linking of datasets towards gaining deeper and more complex insights. It facilitates machine-to-machine communication and enables developers to ‘make sense’ of the published data. From a broader perspective, high-quality Open Data is also expected to encourage re-users towards developing further services and products. In 2017, developers based in Europe still seem to be confronted with low quality of published data – a finding that was also highlighted by the European Data Portal’s Open Data Study on the sustainability of data portals84 as well as the Study on Open Data re-use85, that highlighted that data quality continues to represent a main barrier to data re-use and underlines the fact that no hard levers are in place to enforce the publishing of consistent and high-data quality.
This observation seems to be re-enforced by the statistics regarding the datasets harvested by the European Data Portal, with a moderate 66% of datasets being published in machine readable formats and still a relatively high level of data publishing that is made in formats that do not support machine readability and continue to be published in proprietary formats (e.g. .txt, .pdf, .xls).
Being able to produce such statistics is important for national agencies in charge of Open Data to tailor their support in order to tackle issues such as data publishing in formats that do not meet the criteria of the 3star deployment scheme for Open Data86. Whereas in 2015, only 21 surveyed countries of the EU28+ were able to quantify the volume of machine-readable datasets published on their national portals, in
84 European Data Portal. Recommendations for Open Data Portals (February 2017) 85 European Data Portal. Re-using Open Data (January 2017) 86 5-Star Open Data Deployment scheme proposed by Sir Tim Berners-Lee
66%
34%
Machine-readable datasets (EDP)
Yes No
XML
XLS
JSON
HTML
?
TXT
ZIP
CSV
GMZ
0% 5% 10% 15%
Most used publishing formats (EDP)
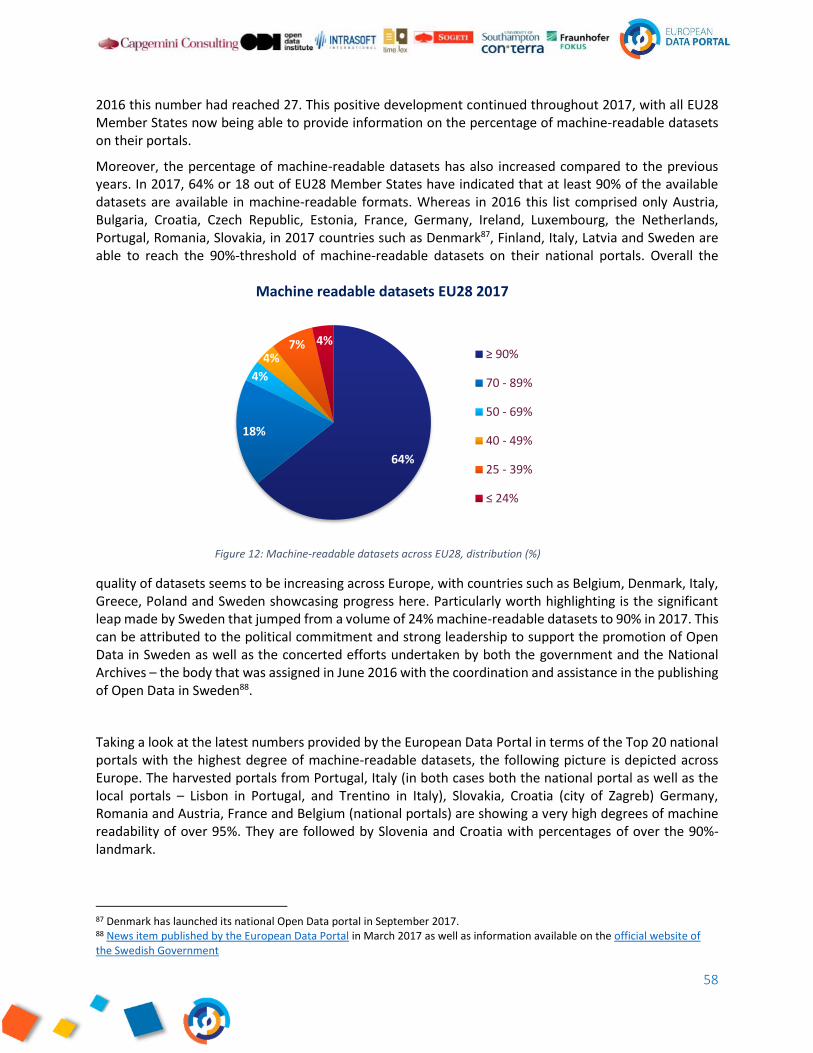
58
2016 this number had reached 27. This positive development continued throughout 2017, with all EU28 Member States now being able to provide information on the percentage of machine-readable datasets on their portals.
Moreover, the percentage of machine-readable datasets has also increased compared to the previous years. In 2017, 64% or 18 out of EU28 Member States have indicated that at least 90% of the available datasets are available in machine-readable formats. Whereas in 2016 this list comprised only Austria, Bulgaria, Croatia, Czech Republic, Estonia, France, Germany, Ireland, Luxembourg, the Netherlands, Portugal, Romania, Slovakia, in 2017 countries such as Denmark87, Finland, Italy, Latvia and Sweden are able to reach the 90%-threshold of machine-readable datasets on their national portals. Overall the
quality of datasets seems to be increasing across Europe, with countries such as Belgium, Denmark, Italy, Greece, Poland and Sweden showcasing progress here. Particularly worth highlighting is the significant leap made by Sweden that jumped from a volume of 24% machine-readable datasets to 90% in 2017. This can be attributed to the political commitment and strong leadership to support the promotion of Open Data in Sweden as well as the concerted efforts undertaken by both the government and the National Archives – the body that was assigned in June 2016 with the coordination and assistance in the publishing of Open Data in Sweden88.
Taking a look at the latest numbers provided by the European Data Portal in terms of the Top 20 national portals with the highest degree of machine-readable datasets, the following picture is depicted across Europe. The harvested portals from Portugal, Italy (in both cases both the national portal as well as the local portals – Lisbon in Portugal, and Trentino in Italy), Slovakia, Croatia (city of Zagreb) Germany, Romania and Austria, France and Belgium (national portals) are showing a very high degrees of machine readability of over 95%. They are followed by Slovenia and Croatia with percentages of over the 90%-landmark.
87 Denmark has launched its national Open Data portal in September 2017. 88 News item published by the European Data Portal in March 2017 as well as information available on the official website of the Swedish Government
64%
18%
4%
4%7% 4%
Machine readable datasets EU28 2017
≥ 90%
70 - 89%
50 - 69%
40 - 49%
25 - 39%
≤ 24%
Figure 12: Machine-readable datasets across EU28, distribution (%)
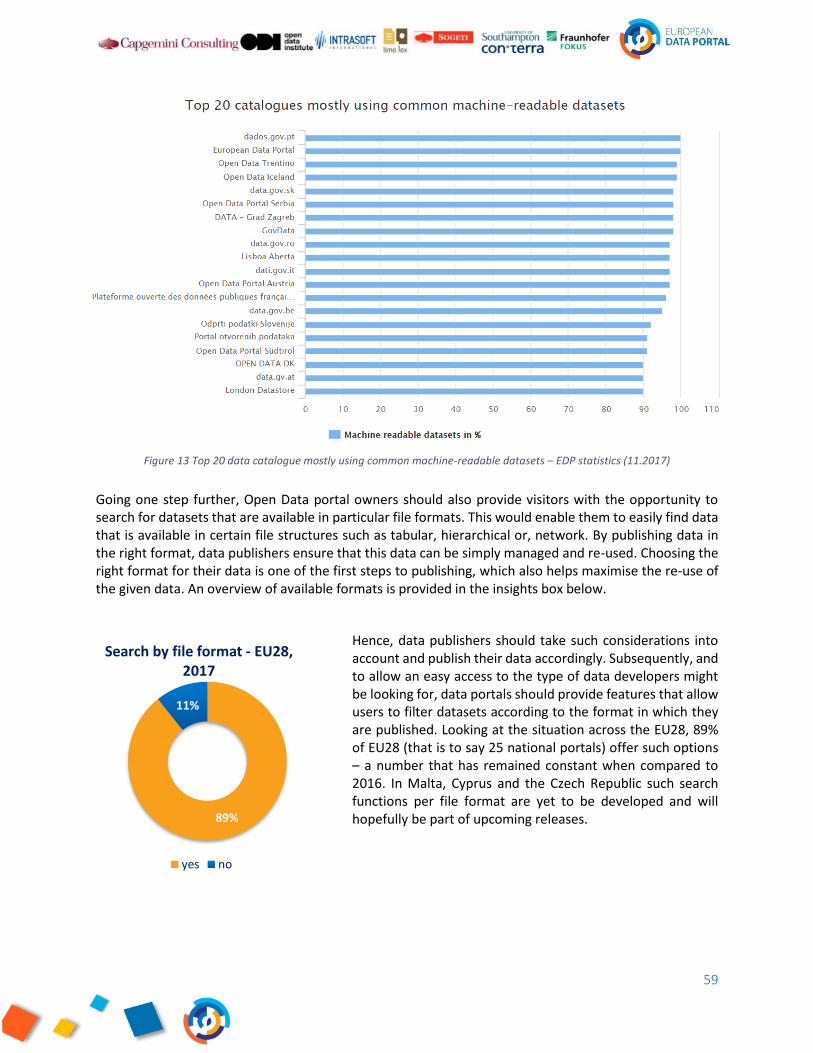
59
Figure 13 Top 20 data catalogue mostly using common machine-readable datasets – EDP statistics (11.2017)
Going one step further, Open Data portal owners should also provide visitors with the opportunity to search for datasets that are available in particular file formats. This would enable them to easily find data that is available in certain file structures such as tabular, hierarchical or, network. By publishing data in the right format, data publishers ensure that this data can be simply managed and re-used. Choosing the right format for their data is one of the first steps to publishing, which also helps maximise the re-use of the given data. An overview of available formats is provided in the insights box below.
Hence, data publishers should take such considerations into account and publish their data accordingly. Subsequently, and to allow an easy access to the type of data developers might be looking for, data portals should provide features that allow users to filter datasets according to the format in which they are published. Looking at the situation across the EU28, 89% of EU28 (that is to say 25 national portals) offer such options – a number that has remained constant when compared to 2016. In Malta, Cyprus and the Czech Republic such search functions per file format are yet to be developed and will hopefully be part of upcoming releases. 89%
11%
Search by file format - EU28, 2017
yes no

60
Looking at the progress that countries have made compared to 2016 in terms of reusability of data, the increases registered by Sweden (+50pp), the Czech Republic and Malta (each +43pp), as well as Italy, Romania and Poland (each +36pp) are particularly worth highlighting. Given the recent launch of its Open Data Portal, Latvia went from 0% to 79%. In Sweden the boost can be attributed to the increase in machine-readability of the available data, with all of the metadata on the portal being machine readable and compliant with the DCAT-AP standard. The Swedish portal has equally been updated with new portal features to now comprise a news section, the possibility for re-users to request datasets or to download the desired data in bulk. Similar conclusions can be drawn when looking at the other ‘best performers’ in this category such as the Czech Republic, Romania and Poland, that have also performed updates to now include new features that ease the access to datasets, the possibility to provide feedback and request datasets and have introduced news sections to their portals – an important element when it comes to keeping the portal visitors engaged and up to date.
Open Data formats in a nutshell
The format of an open dataset refers to the way in which the data is structured and made available for humans and machines. To maximise the re-use of data, publishers might need to use a number of file formats and structures for their data, in order to suit users’ needs.
The most common structure is the tabular one, that is to say data organised into rows and columns listing sequential values. When data is based on separate entries that are not linked to each other, then it is recommendable that data be published in tabular file formats such as .csv (comma separated value). Hierarchical data on the other hand shows the relationships between data points (e.g. family tree or municipalities in each country). If the dataset depends on the relationship between data points and follows a structure in which data points are linked in vertical ‘trees’, a hierarchical data structure in a format such as .json should be considered. At the same time, network structured data allows relationships to exist between any combination of elements in any direction. Examples thereof are the data stemming from social networks.
36%
64%
Bulk download EU28, 2017
yes no
79%
21%
Request datasets
yes no

61
The 2017 results highlight the need for further improvement of the interaction mechanisms between publishers and re-users when it comes to offering re-users the possibility to request datasets. In 2017, 22 of the EU28 provide such features on their portal. When observing the overall scores on the sub-indicator re-usability of data at country level, the following landscape appears across the EU28 (see Figure 14 below). Three Member States have reached maximum scores on this sub-indicator (Germany, Luxembourg and Romania), with Belgium, Italy, Spain and UK following close by at 93%. Next in ranking are Austria, Croatia, the Czech Republic, Finland, France, Ireland, the Netherlands, Portugal and Slovakia – all at 86%. Only 9 of EU28 have registered scores under the EU28 average in 2017 and only three of them score below the 50%-landmark.
Figure 14 Re-usability of data EU28, 2016-2017 (%)
At the European level, the European Data Portal has intensified its efforts to improve these scores and push forward the improvement of metadata quality across Europe. The Metadata Quality Dashboard89 (MQA) provides visitors with an analysis of all available datasets. Furthermore, detailed catalogue analyses have been made available with the launch of v2.0 in February 2017 for each of the 73 portals harvested by the European Data Portal. Metadata quality is assessed based on three criteria: i) accessibility of distributions, ii) machine readability and iii) compliance to the DCAT-AP90 specification. The MQA Dashboard allows further insights into aspects such as distributions (e.g. share of machine-readable formats, most used dataset formats), data compliance (e.g. top 20 DCAT-AP compliant datasets), licensing (e.g. most used licences) and a narrowing down of the results per data catalogue.
89 The Meta-Data Quality Dashboard, European Data Portal 90 More information on DCAT-AP on the EC JoinUp Platform
77%
0%
20%
40%
60%
80%
100%
DE
LU RO BE IT ES UK
AT
HR CZ FI FR IE NL
PT SK LV PL
SE
EU2
8
BG
DK EE EL CY SI LT MT
HU
Reusability of data EU28 2017

62
Figure 15 Metadata Quality Dashboard of the European Data Portal
3.3. Spread of data This indicator represents the third sub-indicator that is being measured on the Portal Maturity dimension. The indicator looks at the variety of domains covered by the datasets published on the national Open Data Portals. A data domain is a categorisation of datasets linked to a common theme. In order to adopt an internationally recognised approach of structuring datasets, the landscaping has used the 14 domains presented in the G8 Open Data Charter91 as depicted in Annex II.
The European Data Portal clusters the available datasets into 13 categories ranging from global to regional data, from sectors such as energy, transport and environment all the way to education, culture and sport or science & technology. These categories are based on the DCAT-AP.
With approximately 789.000 datasets available on the European Data Portal92, the distribution of these datasets across categories is uneven, with data domains such as Environment (23%) that have now
91 Open Data Charter 2013 92 Data retrieved on 19.10.2017

63
superseded the 2016 incumbent – the domain Justice, Legal System and Public Safety (now at 22%) in terms of amount of datasets, followed by the Regions & Cities domain (17%) which has also climbed up from rank 4 in 2016. The fourth place is shared between the data categories Science & Technology and Economy & Finance (9% each). The other eight data domains are cumulated under “Others93.”
Figure 16: Top five data categories and their share of total datasets available on the European Data Portal
Looking at the top 5 data domains the most consulted, only 16 out of 28 were able to provide such data in 2017 (57%). This represents a slight decrease from 2016, where 18 countries were able to provide this information (64%). Based on the collected data, the following domains were identified as top 5 most popular data domains across the EU28. The high priority domains, as identified by the European Commission in the Guidelines to the Revised PSI Directive94 are highlighted in orange.
93 Data retrieved on 18.09.2017. 94 European Commission (2014) Commission Notice: 'Guidelines on recommended standard licences, datasets and charging for the re-use of documents’

64
Figure 17 Top Data Domains in 2017, EU28 (absolute numbers)
Whereas in 2016 there was an overlap between the top 5 most consulted domains and the data domains prioritised by the European Commission (marked in orange in the graph above), this year the situation seems to have changed, with only one of the prioritised areas being in the top 5 of the most consulted domains – Statistics with 9 mentions of a total of 16 countries that answered this question. Across Europe there seems to be a strong interest in datasets regarding government accountability and democracy. This could be explained by the fact that 2017 was an active electoral year, with elections taking place at national, regional, and local levels in several EU Member States (e.g. Bulgaria, Hungary, France, Germany, The Netherlands, Malta, Portugal, Slovenia – to name only a few). As our data shows, there appears to be a positive correlation between the popularity of the data domain (e.g. its mentioning in top 5) and the existence of an election in 2017 in the given country. This finding comes as no surprise and highlights the fact that citizens and civil society organisations are more and more reaping the benefits of Open Data for their societies. Further in the ranks are – in this order - the data domains Finance and contracts, Education and Social welfare. The other 4 EC prioritised domains rank 6th to 9th as follows: Earth observation (6 mentions) and Companies, Geospatial and Transport & Infrastructure with 5 mentions each. This clearly underlines the fact that there is a growing interest in further data domains.
At the opposite end of the spectrum, the least consulted domains seem to be Science and Research (with 5 mentions from the total number of 7 EU Member States that were able to provide information on that question), followed by Global Development (4 mentions). The mentioning of Science and Research as well as Global Development as the least consulted datasets can also be explained by the scarcity of datasets in

65
the two categories. For example, the data domain International Issues – the equivalent of Global Development has the lowest availability of datasets on the European Data Portal, of only 807 datasets out over 785,00095. Regarding science and research data, one may argue that this data may be easier to access via scientific communities and academia as opposed to national data portals; or that there is limited Open Data available on these topics. The Open Science and Open Access movements are also evidence of the need to pay more attention to opening up of research data. This brings the question to the fore if the ‘right’ datasets are actually published, that is to say if publishers of such data open up the datasets that re-users would actually be interested in. This opens the question of interaction and engagement between the Open Data publishers and re-use sides and brings again the aspect of dialogue and interaction between the two sides to the front.
At country level – as illustrated by the figure below, 86% of the EU28 have already reached maturity on this sub-indicator, with an overall EU28 average in 2017 of 90%. Only 5 of the EU Member States are below this average, nonetheless with scores that are relatively high at 60% and above. The only exception is Malta which is at 0%, given the lack of datasets on its national portal.
Figure 18 Spread of data across domains EU28, 2017 (%)
95 Data retrieved on 01.11.2017.
90%
0%
20%
40%
60%
80%
100%
AT
BE
BG
HR CY
DK EE FI DE EL HU IE IT LT LU NL
PT
RO SI ES SE UK
EU2
8 FR LV PL
CZ
SK MT
Spread of data EU28 2017

66
3.4. Progress so far - Portal Maturity The level of maturity of Open Data Portals across Europe represents an important indicator for the Open Data developments in a given country and sheds light into the publication of data and its quality, as well as into the degree to which there are various interaction mechanisms in place to support coordination and dialogue between the data supply and actual market needs. The previous section looked at the results on each of the three sub-indicators: usability of the portal, re-usability of data and spread of data across domains and provided information on the progress made by the EU28 on each sub-indicator.
Taking one step back and looking at the EU average results per each sub-indicator, there is an overall progress across the EU28 in the timeframe 2015-2017. Given the minor method update, an overall comparison of the progress made by the EU28 between 2015 and 2017 is less relevant with respect to the sub-indicator usability of the portal. The other two dimensions spread of data and re-usability of data can be assessed in terms of EU28 progress.
Figure 19 Portal Maturity – EU28 averaged results, 2015-2017 (%)
As depicted above, the EU28 have made progress in both terms of re-usability of data (quality of datasets) and spread of data across data domains (variety of datasets). A significant jump can be observed with regard to the re-usability dimension (e.g. the extent to which portals foster Open Data re-use by ensuring download of datasets in bulk, file format searches, machine-readability of datasets, showcasing of use cases etc.). Here, the EU Member States have increased 15pp. from an initial 62% in 2016 to 77% in 2017. In terms of spread of data across data domains, the EU28 have reached 90% in 2017, an increase of 9pp. compared to 2016 (81%). When looking at the progress made on these two indicators from 2015 to 2017, the numbers become more impressive. As such, a significant increase from 25% in 2015 to 77% in 2017 can be observed on the sub-indicator re-usability of data. The same holds true for the sub-indicator spread of data across domains, which witnessed a similar boost in numbers, from an initial 41% in 2015 to 90%

67
in 2017. Despite the method update on the sub-indicator and the 4 extra questions added in 2017, the EU28 also appear to have made some progress on that dimension, increasing from 43% in 2015, to 65% in 2016 to 68% in 2017. Turning to the EU28 country performances in terms of portal maturity in 2017, the following ranking can be observed:
Figure 20 Portal Maturity in EU28, 2017 (%, averaged results)
Best in class in this regard in 2017 is Luxembourg (96%), followed by Spain, Germany, Ireland and Romania (at 93% each). Ranks 6 to 10 are taken by Finland (91%), Croatia (89%), France (88%), Austria and the Netherlands (each 86%). When looking at the 80%-landmark, Belgium, Italy, Slovakia and the United Kingdom register scores higher than this threshold. Moreover, only 2 countries have scores in 2017 that are below the 50% threshold – an improvement from a number of 6 countries in 2016.
In 2017 and in spite of the method update (consisting in the further addition of questions to the Portal Maturity, on the sub-indicator Portal Usability) several countries have nonetheless continued to grow when compared to the previous results of 2015, and in particular 2016. Worth highlighting is the significant progress made by Sweden (+39pp. vs 2016) and Romania (+21pp vs 2016), followed by Slovakia (+18pp), Poland (+16pp), the Czech Republic (+15pp), Italy (+14pp), as well as Ireland, Croatia and Greece (+13pp) and the UK – which all registered increases above 10pp compared to 2016.
Turning the attention towards the country progress of the EU28 in the period 2015-2017, the following picture can be seen across the EU96 (see Figure 21 below). Top performers when looking at the average results of the three years are Spain (80%), Germany and France (at 75%), Finland (74%), and Austria (73%), followed by the Netherlands (72%), the UK (71%), Italy (69%) and Ireland and Bulgaria (68%) – to name the top 10 performers.
96 Country ranking based on average of the three years on the dimension Portal Maturity, from highest to lowest.
76%
0%
20%
40%
60%
80%
100%
LU ES DE IE RO FI HR FR AT
NL
UK IT BE SK EE SE BL
PT
EU2
8 SI LV CZ PL
CY EL DK LT HU
MT
Portal Maturity EU28 2017
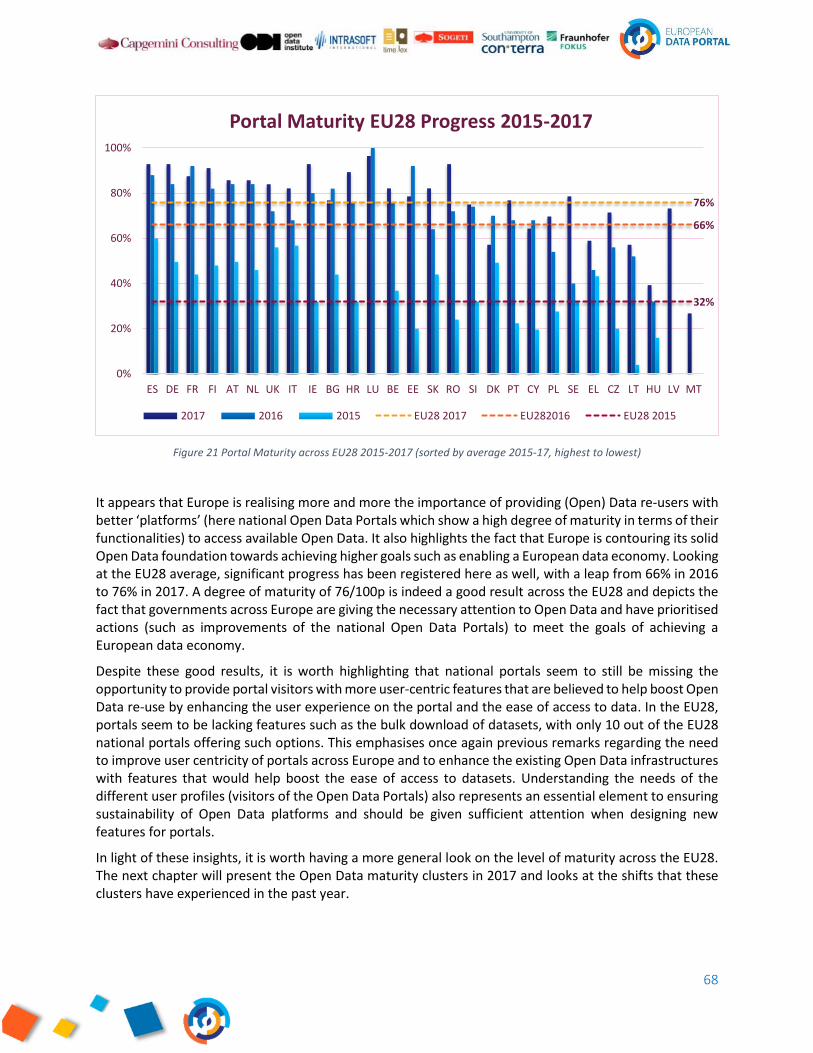
68
Figure 21 Portal Maturity across EU28 2015-2017 (sorted by average 2015-17, highest to lowest)
It appears that Europe is realising more and more the importance of providing (Open) Data re-users with better ‘platforms’ (here national Open Data Portals which show a high degree of maturity in terms of their functionalities) to access available Open Data. It also highlights the fact that Europe is contouring its solid Open Data foundation towards achieving higher goals such as enabling a European data economy. Looking at the EU28 average, significant progress has been registered here as well, with a leap from 66% in 2016 to 76% in 2017. A degree of maturity of 76/100p is indeed a good result across the EU28 and depicts the fact that governments across Europe are giving the necessary attention to Open Data and have prioritised actions (such as improvements of the national Open Data Portals) to meet the goals of achieving a European data economy.
Despite these good results, it is worth highlighting that national portals seem to still be missing the opportunity to provide portal visitors with more user-centric features that are believed to help boost Open Data re-use by enhancing the user experience on the portal and the ease of access to data. In the EU28, portals seem to be lacking features such as the bulk download of datasets, with only 10 out of the EU28 national portals offering such options. This emphasises once again previous remarks regarding the need to improve user centricity of portals across Europe and to enhance the existing Open Data infrastructures with features that would help boost the ease of access to datasets. Understanding the needs of the different user profiles (visitors of the Open Data Portals) also represents an essential element to ensuring sustainability of Open Data platforms and should be given sufficient attention when designing new features for portals.
In light of these insights, it is worth having a more general look on the level of maturity across the EU28. The next chapter will present the Open Data maturity clusters in 2017 and looks at the shifts that these clusters have experienced in the past year.
76%
66%
32%
0%
20%
40%
60%
80%
100%
ES DE FR FI AT NL UK IT IE BG HR LU BE EE SK RO SI DK PT CY PL SE EL CZ LT HU LV MT
Portal Maturity EU28 Progress 2015-2017
2017 2016 2015 EU28 2017 EU282016 EU28 2015
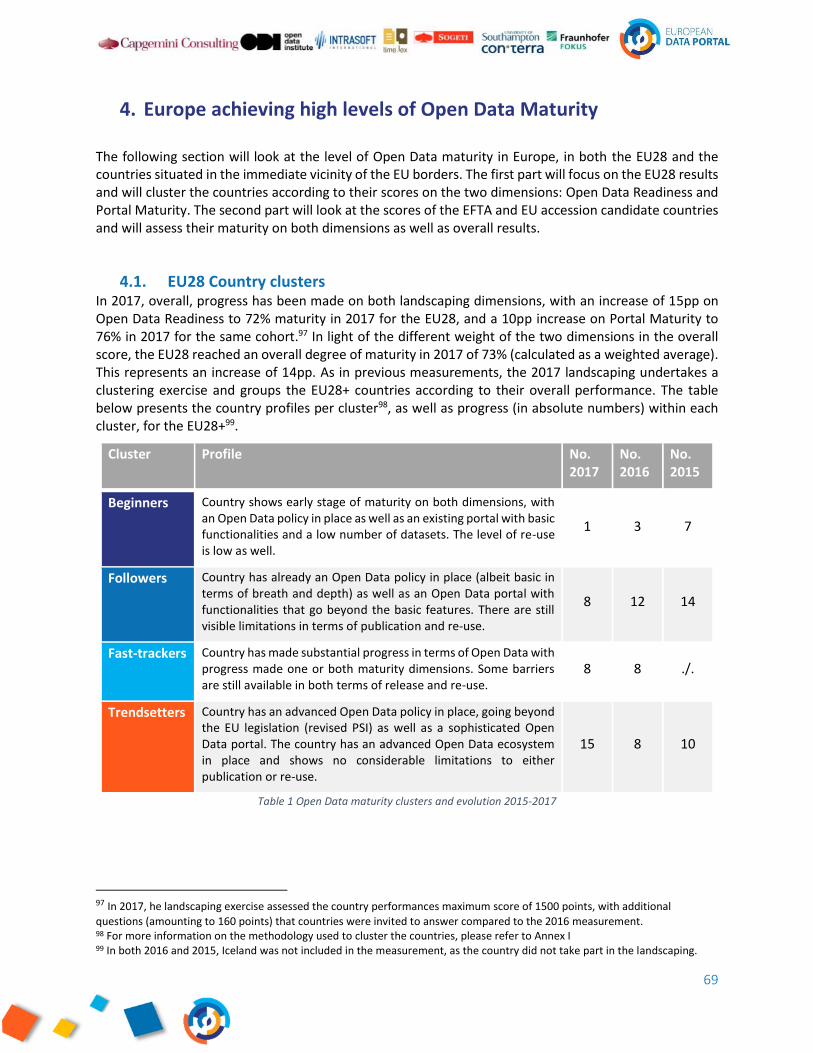
69
4. Europe achieving high levels of Open Data Maturity
The following section will look at the level of Open Data maturity in Europe, in both the EU28 and the countries situated in the immediate vicinity of the EU borders. The first part will focus on the EU28 results and will cluster the countries according to their scores on the two dimensions: Open Data Readiness and Portal Maturity. The second part will look at the scores of the EFTA and EU accession candidate countries and will assess their maturity on both dimensions as well as overall results.
4.1. EU28 Country clusters In 2017, overall, progress has been made on both landscaping dimensions, with an increase of 15pp on Open Data Readiness to 72% maturity in 2017 for the EU28, and a 10pp increase on Portal Maturity to 76% in 2017 for the same cohort.97 In light of the different weight of the two dimensions in the overall score, the EU28 reached an overall degree of maturity in 2017 of 73% (calculated as a weighted average). This represents an increase of 14pp. As in previous measurements, the 2017 landscaping undertakes a clustering exercise and groups the EU28+ countries according to their overall performance. The table below presents the country profiles per cluster98, as well as progress (in absolute numbers) within each cluster, for the EU28+99.
Cluster Profile No. 2017
No. 2016
No. 2015
Beginners Country shows early stage of maturity on both dimensions, with an Open Data policy in place as well as an existing portal with basic functionalities and a low number of datasets. The level of re-use is low as well.
1 3 7
Followers Country has already an Open Data policy in place (albeit basic in terms of breath and depth) as well as an Open Data portal with functionalities that go beyond the basic features. There are still visible limitations in terms of publication and re-use.
8 12 14
Fast-trackers Country has made substantial progress in terms of Open Data with progress made one or both maturity dimensions. Some barriers are still available in both terms of release and re-use.
8 8 ./.
Trendsetters Country has an advanced Open Data policy in place, going beyond the EU legislation (revised PSI) as well as a sophisticated Open Data portal. The country has an advanced Open Data ecosystem in place and shows no considerable limitations to either publication or re-use.
15 8 10
Table 1 Open Data maturity clusters and evolution 2015-2017
97 In 2017, he landscaping exercise assessed the country performances maximum score of 1500 points, with additional
questions (amounting to 160 points) that countries were invited to answer compared to the 2016 measurement. 98 For more information on the methodology used to cluster the countries, please refer to Annex I 99 In both 2016 and 2015, Iceland was not included in the measurement, as the country did not take part in the landscaping.

70
When comparing the overall clustering results to previous measurements, a visible boost can be noticed in terms of trendsetters, with a near doubling of the numbers from 2016 to 2017. Whereas the number of fast-trackers remained the same in 2017, there is some visible progress, with a reduction of number of followers as well as beginners. Even more encouraging, there is no EU Member State in 2017 that can be considered an Open Data beginner.
When plotted against the main indicators, the Open Data Maturity in the EU28+ looks as shown below. It seems that European countries have started racing each other to the top, with the highest distribution being now in the cluster ‘trendsetters’ – an encouraging observation that highlights the considerable progress that Europe has made in the past year.
In 2017, the majority of EU countries are situated in the upper right quadrant, with 25% of EU28 qualifying as fast-trackers and 50% of EU28 as trendsetters. A mere 21% of EU28 (6 EU Member States) seem to still be making a slower progress in terms of both their Open Data policy and portal maturity and qualified only as ‘followers’ in 2017.
Figure 22 EU28+ Open Data Maturity clusters 2017

71
In addition, several EU Member States that have made significant progress compared to previous measurements. Noteworthy is the spectacular improvement made by Latvia (+53 pp), which frog-leaped from a beginner in 2016 and rank 28, to a fast-tracker in 2017 and is placed now at rank 18 (amongst EU28). Luxembourg (+28pp) has experienced a similar development and has now jumped from a fast-tracker and rank 15 in 2016, to a trendsetter and rank 6 in 2017. Similarly, Italy (+29 pp) has gone up from a ‘follower’ and rank 19 in 2016 to rank 8 and a well-deserved spot amongst the Open Data trendsetters in 2017.
Similarly, several other Member States have made visible progress compared to 2016. Slovenia (+22pp) has gone up 5 places to rank 7 in 2017 and is now a trendsetter; Germany (+18pp) has gone up 3 spots to rank 17 and has evolved from a follower to a fast-tracker in 2017. Finland (+15pp) has improved with 3 positions, preserves its spot as trendsetter and is now ranked 5 among EU28.
Worth mentioning amongst the cluster-shifters given their considerable improvement in 2017 vs 2016 are also Belgium (+20pp) which is now part of the fast-tracker cluster, from a follower position in 2016, Croatia (+16pp) became a trendsetter in 2017, from previously a fast-tracker, Cyprus (+18pp) has jumped from a follower to a fast-tracker, the Czech Republic (+13pp) is now a fast-tracker from a follower in 2016, Malta (+20pp) classifies as a follower, from a beginner previously, Poland (+6pp) qualified from previously a follower, to a fast-tracker, Romania (+16pp) switched to a trendsetter from a fast-tracker in 2016, and Sweden (+21pp) became a fast-tracker in 2017 from a position as ‘follower’ in the previous measurement. For the countries which have shifted clusters in 2017 (vs. 2016), a general trend towards “steady” progress can be observed with almost all countries in this ‘shifter’ category having jumped to the next closest cluster. The sole exception here is Italy, which progressed from a follower in 2016 to a trendsetter in 2017 – a substantial improvement, as mentioned above as well.
Although remaining in the same cluster as in 2016, several other EU Member States should be mentioned here, given their progress in 2017. Worth highlighting here are Denmark (+17pp, follower), Lithuania (+16pp, follower) and Portugal (+7pp, follower).
With regard to this year’s top 5 Open Data countries, Ireland is best in class in Europe with an overall maturity of 96% and an increase of 16pp, followed by Spain (94%, +3pp), the Netherlands (92%, 13pp), France (91%, +5pp) and Finland (90%, +15pp) – all 5 top rankers with scores at and above the 90% landmark. Looking at the development that EU countries have made compared to 2016, an increase in maturity levels can be observed across the board. Where countries differ is in the speed of their progress. This also explains the shifts in ranking, despite the improvement that each country has made when compared to 2016. These top five performing countries can be characterised by their drive in implementing their Open Data policies, developing additional portal features as well as understanding and documenting impact; thereby creating a virtuous circle boosting both availability and reuse of Public Sector Information. Building on successful national approaches, regions and cities are equally eagerly picking up pace in reaping the benefits of Open Data.
As illustrated above, in 2017 European countries have made considerable efforts to improve their performance in the Open Data field. Given the different speeds of transformation that can be observed throughout Europe, this section has highlighted the shifts in both clusters and rankings that the EU28 have experienced. However, despite the different progress levels, Europe is most definitely on the right track to reaching Open Data maturity.
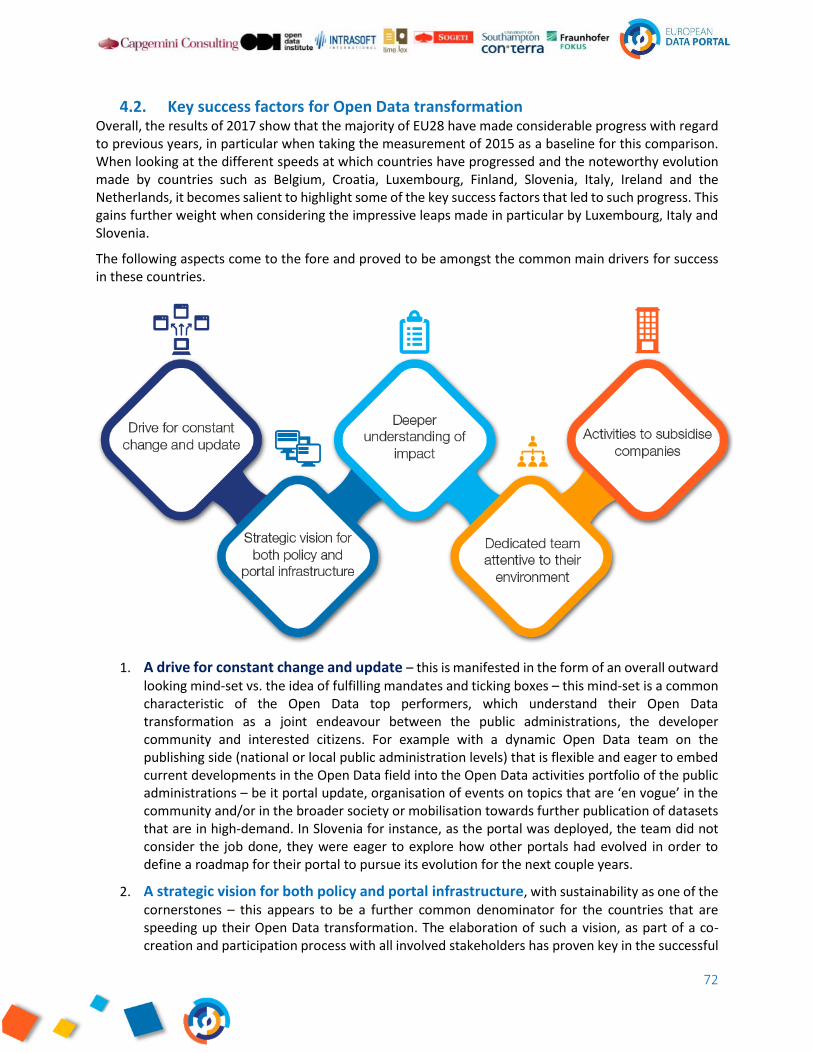
72
4.2. Key success factors for Open Data transformation Overall, the results of 2017 show that the majority of EU28 have made considerable progress with regard to previous years, in particular when taking the measurement of 2015 as a baseline for this comparison. When looking at the different speeds at which countries have progressed and the noteworthy evolution made by countries such as Belgium, Croatia, Luxembourg, Finland, Slovenia, Italy, Ireland and the Netherlands, it becomes salient to highlight some of the key success factors that led to such progress. This gains further weight when considering the impressive leaps made in particular by Luxembourg, Italy and Slovenia.
The following aspects come to the fore and proved to be amongst the common main drivers for success in these countries.
1. A drive for constant change and update – this is manifested in the form of an overall outward looking mind-set vs. the idea of fulfilling mandates and ticking boxes – this mind-set is a common characteristic of the Open Data top performers, which understand their Open Data transformation as a joint endeavour between the public administrations, the developer community and interested citizens. For example with a dynamic Open Data team on the publishing side (national or local public administration levels) that is flexible and eager to embed current developments in the Open Data field into the Open Data activities portfolio of the public administrations – be it portal update, organisation of events on topics that are ‘en vogue’ in the community and/or in the broader society or mobilisation towards further publication of datasets that are in high-demand. In Slovenia for instance, as the portal was deployed, the team did not consider the job done, they were eager to explore how other portals had evolved in order to define a roadmap for their portal to pursue its evolution for the next couple years.
2. A strategic vision for both policy and portal infrastructure, with sustainability as one of the cornerstones – this appears to be a further common denominator for the countries that are speeding up their Open Data transformation. The elaboration of such a vision, as part of a co-creation and participation process with all involved stakeholders has proven key in the successful
73
journey of many EU Member States. Italy here is a perfect illustration of drive, coordination around standards and core vocabularies providing a sustainable structure for data publishing. Webinars have equally been organised to inform data publishers and civil servants about the importance of Open Data. The Italian portal has also been updated and further awareness activities are ongoing at all levels of government. Furthermore, to sustain Open Data publishing, successful countries pride themselves in providing trainings and guidelines for local administrations. Countries that have understood this need and provide such training and guidance in particular for public servants appear to be the ones having the most successful transformation in this field.
3. A deeper understanding of impact and an overall deep understanding of the importance of Open Data – the EU champions have understood data as an important element to economic growth and innovation, as well as a key factor to a country’s further digital transformation. Key to their success, countries are able to understand the different aspects of impact and have both documented economic as well as social and environmental impacts thereby appealing to a broader community of potential users. Ireland provides an excellent illustration of how use cases have been included in the updated Open Data Strategy for Ireland. This made the strategy more tangible within the government as well as more understandable for potential users, be it civil society or the private sector.
4. A dedicated team that is pro-actively attentive to their environment outside of the office door – this element is key to fostering interaction between publishers and re-users, as well as across different ministries and agencies. Having a team of motivated Open Data ambassadors, receptive to the changes and demands of the outside world in particular of the Open Data stakeholders, has provided to be one of the differentiating success factor in the countries that are approaching Open Data maturity. These teams are not necessarily large teams and consist more often of a few individuals who are eager to move forward and engage with stakeholders. Successful countries are often seen to have specific Open Data boards that gather representatives from different ministries and or agencies on a regular basis. The board discusses Open Data publishing roadmaps, challenges and next steps as well as training needs. Engaging users can be achieved thanks to a variety of means. Countries are increasingly using different channels to engage with their users.
5. Activities to help companies with financing – another key differentiator appears to be the one related to coming up with innovative ways to ensure financing for Open Data start-ups and developers who want to develop products based on Open Data. Whereas events are more and more organised by third parties such as civil society, universities or even the private sector, public administrations continue to play a key role. An increasing amount of countries are now offering funding to companies using Open Data, or acting as an enabler for them to get in touch with a supporting economic ecosystem. This is the case for instance in Ireland and Cyprus.

74
4.3. Open Data Maturity Insights This section will look into further insights that can be gained from the data, in particular with regard to the potential relationship that exists between the landscape variables. It analyses the deeper level of correlation between the sub-indicators and provides an overview of the interplay between the different sub-indicators that compose the Open Data maturity landscaping. It will begin by presenting the correlation between the two landscaping dimensions and offer observations such as the correlations between the level of national coordination and degree of maturity of both policy and portal sides, the level of portal maturity and level of impact of Open Data at country level, as well as further insights into the user engagement and how this correlates with the degree of maturity across Europe.
To begin with, the correlation between the level of Open Data Readiness and Portal Maturity was assessed. In the EU28, there appears to be a strong positive correlation between the two dimensions, in line with the expectations. Hence, the rationale that countries in which there is a high degree of maturity on the dimension Open Data Readiness also show a high degree of maturity on the Open Data infrastructure dimension (national portal) is confirmed by the positive coefficient of 0.67.
Figure 23 Correlation Portal Maturity and Open Data Readiness – EU28, 2017 (%)
ATBE
BG
HR
CY
CZ
DK
EE
FIFR
DE
EL
HU
IE
IT
LV
LT
LU
MT
NL
PL
PT
RO
SK
SI
ES
SE
UK
EU28
0%
20%
40%
60%
80%
100%
0% 20% 40% 60% 80% 100%
Po
rtal
Mat
uri
ty
Open Data Readiness
Portal Maturity vs. Open Data Readiness EU28, 2017

75
Going one step further, the relationship between the degrees of national coordination was correlated against the degree of Open Data Maturity100. For example, one would expect countries with a high degree of national coordination to also show a high degree of Open Data maturity. The assumption here is that a strong coordination at national level will also foster a higher degree of Open Data maturity, since there will be a strong observer and coordinator guarding over the Open Data development in the country. This assumption indeed holds true, in particular in the medium and big size countries, where a correlation coefficient of 0.42 was measured. When further differentiating between the big and medium countries, the results show a mixed picture. As such, in countries such as Belgium, the Czech Republic, Greece, Hungary, the Netherlands, Portugal, Romania, Sweden (the medium size group) there is a moderate positive correlation between the degree of coordination at national level and the Open Data maturity that a country has (coefficient of 0.36). Nonetheless, in the case of the big size countries France, Germany, Italy, Poland, Spain and the UK a very strong positive correlation is observed with a coefficient of 0.92.
Figure 24 Open Data Maturity and National coordination – big and medium size EU 28 countries, 2017 (%)
Moving further to the portal maturity dimension, the relationship between the level of coordination at national level and the level of portal maturity at a given country was also assessed. The underlying
100 Given the fact that small countries have answered with “N/A” in most questions on this sub-indicator, the correlation was examined only for the medium and big countries. Following EU countries were not part of the assessment: Austria, Bulgaria, Croatia, Cyprus, Denmark, Estonia, Finland, Ireland, Latvia, Lithuania, Luxembourg, Malta, Slovakia, Slovenia
AT
BE
BG
HR CY
CZ
DK
EE
FI
FR
DE
EL
HU
IE
0%
20%
40%
60%
80%
100%
0% 20% 40% 60% 80% 100%
Op
en
Dat
a M
atu
rity
National coordination
Open Data Maturity vs. National coordination EU28 2017

76
assumption is that the higher the level of national coordination, the more mature an Open Data portal would be.
This correlation was measured – according to the same rationale – only for the medium and big size countries, given the fact that the question regarding the degree of national coordination was not applicable for the small size EU28 countries. This assumption only holds true in the case of the big country group France, Germany, Italy, Poland, Spain and the UK where a coefficient of 0.48 was registered. In countries such as Belgium, the Czech Republic, Greece, Hungary, the Netherlands, Portugal, Romania and Sweden (the medium size group) the level of maturity of the national portal does not seem to correlate with the level of coordination at national level. There even appears to be a slight negative correlation between the two variables with a coefficient of -0.27. This can be explained by the large diversity between the medium sized countries. For instance, Hungary and Romania maintain a rather top-down approach, whereas in countries such as Portugal, Open Data activities are more likely to take place at the local level and create positive spill over effects at the national level. An additional explanation lies in the fact that countries aim to encourage bottom-up collaboration by using their Portal as a show case for further soft coordination across different levels of government.
Figure 25 Portal Maturity and National coordination – selected countries EU28, 2017 (%)
HR
CZ
FR
DE
EL
HU
IT NL
PL
PT
ROES
SEUK
0
20
40
60
80
100
0 20 40 60 80 100
Po
rtal
Mat
uri
ty (
%)
National coordination (%)
National coordination vs. Portal Maturity - selected countries 2017 (%)

77
Furthermore, it is interesting to observe that there is a positive correlation (a coefficient of 0.5) between the level of maturity of national Open Data portals and the degree of Open Data impact (measured across all three dimensions: economic, political, and societal). Hence, it appears that countries in which the national portal entails numerous features that enable the user to quickly access and download data, as well as to find information on use cases and news in the field positively correlates with the scores on the Open Data impact dimension.
Figure 26 Correlation between Open Data Impact and Portal Maturity – EU28, 2017 (%)
In order to gain deeper insights into the relationship between other Open Data indicators, a composite indicator was built101 to assess the current scores across the EU28 in terms of user engagement practices. When isolating the dimension User engagement and ranking the EU28 country score here, the following picture can be seen across the EU.
101 It entails the scores on ten sub-indicators that were used as proxy to depict the degree of user engagement per country. It
looks at the user engagement mechanisms in place, both in terms of online and offline interaction possibilities (e.g. number of events organised, portal features that enable user engagement, engagement via newsletters, feedback mechanisms, request for datasets, contribution to datasets etc.).
AT
BE
BG
HR
CY
CZ
DK
EE
FI
FR
DE
EL
HU
IE
IT
LV
LT
LU
MT
NL
PL
PT
RO
SK
SI
ES
SE
UK
EU28
0%
20%
40%
60%
80%
100%
0% 20% 40% 60% 80% 100%
Op
en
Dat
a Im
pac
t
Portal Maturity
Open Data Impact vs Portal Maturity EU28 2017

78
Figure 27 User engagement scores, EU28 (2017, %)
With an average of 71%, the EU28 score well on this dimension, with the majority of Member States registering results above the average. Best in class are Finland, France, Ireland and Slovakia (100%) followed closely by Bulgaria, Croatia, Germany, Luxembourg, the Netherlands, Romania, Slovenia and Spain (at 90% each). Austria and the UK are close by with scores around the 80% landmark. At the opposite pole, countries such as Hungary and Malta (14%) appear to have not set a strong focus on ensuring sufficient mechanisms for user interaction.
A similar picture although with more positive scores is depicted in Greece and Denmark (40%) as well as Portugal (46%) where a stronger focus on user engagement is also needed. Overall, the good results on this dimension (14 of EU28 registered score 80% and above) also underline the fact that Member States increasingly understand the importance that creating an Open Data community based on interaction and dialogue has in ensuring the success of Open Data transformation of a society.
An interesting relationship comes to light when plotting the dimensions Impact of Open Data and user engagement, as presented by Figure 28 below. With a coefficient of 0.61, the correlation between the two dimensions can be described as relatively strong. This also reinforces the general assumption that a strong interaction between the demand and supply side leads to a higher re-use – which in turn curbs the impact on Open Data in a country.
71%
0%
20%
40%
60%
80%
100%
User Engagement EU28 2017

79
Figure 28 Correlation Open Data Impact and User Engagement - EU28, 2017(%)
In addition to this observation, it appears that there is no correlation between the maturity in terms of user engagement in a given country and the extent to which that country has conducted studies to assess the market value for Open Data. This contradicts the initial assumption that countries that have scored high on the sub-indicator ‘Assessment of market value for Open Data,’ would also show a high degree of user engagement.
Furthermore, it appears that countries that are driven by the ambition of achieving a reliable and robust approach to Open Data over time are more likely to also have conducted /commissioned studies to assess the market value of Open Data. This statement is undergird by the correlation found between the degree of sustainability of Open Data in a given country and the extent to which there were studies that assess the Open Data market value in the respective country. Conducting such assessment(s) of the market value for Open Data appears to have been an aspect that all large size Member States have focused on, with France, Germany, Italy, Poland, Spain and the UK presenting several examples of published studies – conducted by either governmental or non-governmental organisations.
AT
BE
BG
HR
CY
CZ
DK
EE
FI
FR
DE
EL
HU
IE
IT
LV
LT
LU
MT
NL
PL
PT
RO
SK
SI
ES
SE
UK
EU28
0%
20%
40%
60%
80%
100%
0% 20% 40% 60% 80% 100%
Op
en
Dat
a Im
pac
t
User engagement
Open Data Impact vs. User Engagement EU28 2017

80
Figure 29: Sustainability vs User Engagement EU28, 2017 (%)
Furthermore, as the recently published Impact Assessment of the ODINE programme102 shows, there is a positive correlation between the level of Open Data maturity at country level and the number of successful applicants of the ODINE programme per country. The report underscores that having a rich Open Data ecosystem provides the favourable environment for Open Data innovation to thrive. When looking at the countries where the ODINE applicants come from, one can see a predominance of applications from the UK (274), followed by a visible difference by Spain (168), Germany (133), and Italy (109) – to name the countries that are situated above the 100 applications threshold. It is worth highlighting indeed the high number of applicants from the UK, which is explained mainly by the vibrant Open Data community and high number of start-ups in the country103 and ranked 5th in Europe in terms of number of start-ups per capita104, but might also be related to the geographical vicinity and higher popularity of the ODINE programme in the UK. An overview of the EU28 ranking in terms of ODINE applications is presented by Figure 30 below.
102 IDC. Impact Assessment of the ODINE Programme. August 2017. 103 In 2016 there were 657.790 start-ups registered in UK. Information retrieved from http://startupbritain.org/startup-tracker/ 104 In this ranking, UK was preceded by Iceland, Ireland, Estonia and Finland. Based on the Funderbeam Global Funding Report Q2 2017. Available at: https://markets.funderbeam.com/reports
AT
BE
BG HR
CY CZ
DK
EE
FI FR
DE
EL
HU
IE
ITLVLT
LU
MT
NL
PL
PT
RO
SK
SIES
SE
UK
EU28
0%
20%
40%
60%
80%
100%
0% 20% 40% 60% 80% 100%
Use
r e
nga
gem
en
t
Sustainability
User Engagement vs Sustainability EU28 2017

81
Figure 30 Applicants to ODINE programme, absolute numbers 105
Analysing the data even further, our results also show a positive correlation of similar intensity (coefficient of 0.3) between the degree of number of applications per country and their scores on the user engagement dimension. This underlines the general assumption that countries that foster the interaction and engagement of the various Open Data stakeholders tend to also have a more active Open Data developers community. The statement is also reinforced by the fact that similar results in terms of relationship between sustainability and the number of applications stemming from the given country. Here as well our computations depict a positive correlation between a country’s scores on the sustainability dimension and the number of ODINE applications in the given country. These results can only further reinforce the IDC report findings that outline how essential the fostering a rich ecosystem is to curbing a country’s Open Data innovation capabilities.
Beyond the great improvement that the EU28 have made, Open Data seems to have experienced similar progress also beyond the EU borders, in particular in some of the EFTA countries. The next section will look at the maturity journeys that the EFTA countries and the EU accession candidate countries have taken, and – where data is available – it will analyse the progress made so far.
105 ODINE Website, total applications from programme beginning to present. Retrieved October 2017.

82
4.4. Open Data Maturity beyond the EU borders Similar to previous years, the Open Data landscaping exercise of 2017 also assesses the maturity levels of the EFTA countries – Iceland, Liechtenstein, Norway and Switzerland -- and analyses this maturity based on the two dimensions – Open Data Readiness and Portal Maturity.
4.4.1. The EFTA countries Open Data Readiness
When looking at the country scores on this dimension as well as the sub-indicator break-down, one can notice Norway as leader with an average of 80%, slightly over the EU28 average of 72%. Figure 31 shows the performance of the four EFTA countries on the dimension Open Data Readiness.
Figure 31 Open Data Readiness – EFTA countries (2017, %)
With particular regard to the sub-indicator Open Data policies, Norway reaches an excellent score of 93%, and showcases a significant increase of 29pp compared to 2016. These increases can mainly be attributed to the transposition of the revised PSI Directive into Norwegian legislation and more events being organised annually. In terms of the use of Open Data, Norway reaches a score of 80% and an increase of 18pp compared to 2016. The use of Open Data has increased thanks to the near doubling of unique visitors going to the national portal each month and thanks the improvement Norway made in terms of visitor tracking. Also, the use of data monitoring has increased in Switzerland thanks to more information being available on users of the portal, such as which proportion of traffic towards the portal over the API as well as targeted (communication) activities conducted to support the re-use of Open Data and promote the national Open Data Portal. In terms of Open Data impact, Norway has only registered a modest increase of 3pp, from 52% in 2016 to 55% in 2017.
Although Switzerland scores below the 2017 EU average and is only at 49%, the country has increased its performance on the Open Data Readiness indicator thanks to different Public Sector data holders such as ministries and departments being able to upload data themselves to the national portal, the increase in
80%
49%
22%
0%
72%
0%
20%
40%
60%
80%
100%
Norway Switzerland Iceland Liechtenstein
Open Data Readiness EFTA countries - 2017
Open Data Policy Use of Data Impact Open Data Readiness EU28

83
number of events held annually and the improvement made with regard to the coordination at national level. On the sub-indicator Open Data policy, Switzerland has gone up from a score of 56% in 2016 to 62% in 2017. This increase can also be explained by the broadening of the definition of the concept of ‘licence’ in the measurement, which now includes licences and terms and conditions. For this reason, the Terms & Conditions published by Switzerland have now been accepted as an Open Data licence. In terms of Use of Open Data, Switzerland has gone up from 50% in 2016 to 62% in 2017. In 2017, Iceland registers an average of 22% on the indicator Open Data Readiness, with a score of 33% with regard to its Open Data policy, 12% on the Use of data and only 10% on the impact dimension. On a positive note, additional some regional portals have been integrated into the Icelandic national portal, 100% of datasets are free of charge and the majority of datasets are openly licensed. In 2017, Liechtenstein scores 5 points thanks to its Open Data policy being the same as the PSI policy.
In terms of the Open Data impact, when comparing the EFTA countries to the EU28, only Norway has scored slightly above the EU28 average in 2017 on the impact dimension (54%), with a score of 55%. The impact of Open Data in Norway has slightly increased from 2016 to 2017 from 52% to 55%, thanks to a significant increase on both the estimated political and social impact of Open Data on Norwegian society. The economic impact indicator has significantly decreased as no studies having been conducted since 2015 to measure the economic impact in Norway. On average, Switzerland appears to experience a decline in the impact Open Data has on society, due to the lack of economic studies having been conducted since 2015 to measure the economic impact of Open Data. The social and political impact are not yet measured in Switzerland. This also explains the 10pp decrease that the country has registered in 2017, compared to the previous year, to now only reach 10%. Iceland has reached a score of 10% on the Open Data Impact dimension in the current measurement of 2017, with no previous numbers for 2016.
The below figure depicts the progress and showcases the steady improvement that Norway and Switzerland have been recording from 2015 on. In particular the leap that Norway has been making on Open Data readiness is worth appraisal, with an average increase of 19pp per year for three consecutive years. Given the fact that 2017 was the first year that Iceland was included, no comparison to previous years can be made. With regard to Liechtenstein, there is no noteworthy progress compared to previous years on this indicator.
Figure 32 Open Data Readiness – EFTA Countries, Evolution 2015-2017 (%)
72%
57%
47%
0%
20%
40%
60%
80%
100%
Norway Switzerland Iceland Liechtenstein
Open Data Readiness EFTA countries - Progress 2015-2017
2017 2016 2015 EU28 2017 EU28 2016 EU28 2015

84
Portal Maturity
Looking at portal maturity in the EFTA countries, a mixed picture emerges with results that depict both progress and fall-backs. Progress could be measured in Norway and Switzerland as the countries have been participating in the previous measurements of 2015 and 2016. Looking at the overall results in terms of portal maturity for 2017, Norway is the top performer on all sub-indicators, with an overall average of 82% and 5pp. above the EU28 average of 2017, followed by Switzerland (61%), Iceland (48%) and Liechtenstein – which unfortunately did not receive any points on this indicator in 2017 (see Figure 33).
Figure 33 Portal Maturity in EFTA countries, break-down per sub-indicator, 2017 results (%)
In terms of portal usability, both Norway and Switzerland have made significant progress when comparing the 2017 scores with the 2016 results. Norway has registered an increase of 39pp from 50% in 2016, while Switzerland depicts an increase of 23pp, compared to the 33% obtained in 2016. A stagnation can be observed in 2017 with regard to re-usability of data in Norway, while in Switzerland there is even a decrease of 14p from 64% in 2016 to 50% in 2017. In the case of Switzerland, the fall-back can be explained by the lower quality in terms of machine readability of published data. Whereas the national portal has experienced an increase in availability of datasets due to intensified harvesting, there seemed to be a decrease in quality (here machine-readability) of the published data. As a result, the percentage of machine readability of available datasets in Switzerland decreased from 90% in 2016 to between 50 and 69% in 2017. This could be explained by the fact that there has been a focus on publishing more data, even if not made available in machine-readable format. An approach often witnessed in countries who prefer making the data accessible and available even if it does not meet all the necessary 5 star criteria. Both countries score maximum points with regard to the spread of datasets across domains, showcasing hence a diverse publication of datasets by their public administrations.
When looking at the averages per year in the EFTA countries, only Norway appears to have made some progress, with an increase of 10pp. compared to 2016, whereas Switzerland registered a slight fall-back compared to its 2016 results.
In Liechtenstein no progress can be observed compared to the 2016 results. In 2017, Iceland scored moderately on all three sub-indicators and shows an overall score of 48% on the dimension Portal
82%
61%
48%
0%
0%
20%
40%
60%
80%
100%
Norway Switzerland Iceland Liechtenstein
Portal Maturity EFTA countries - 2017
Usability Re-usability of data Spread of data Portal Maturity

85
Maturity, with the best performing sub-indicator being Spread of data (70%), followed by Usability of Portal (44%) and Re-usability of data (43%).
Figure 34 Portal Maturity in the EFTA countries, progress 2015-2017 (%)
4.4.2. The EU accession countries
When talking about Open Data maturity beyond the EU borders, it is relevant to give a look at the EU accession candidate countries and potential candidates which were invited to participate in the landscaping exercise: Albania, Bosnia and Herzegovina (BiH), Former Yugoslav Republic of Macedonia (FYROM), Kosovo106, Montenegro, Serbia and Turkey. Although overall countries are in the incipient stages of their Open Data transformation, some show some good approaches to set out an Open Data framework in their country.
With regard to the first dimension – Open Data Readiness, FYROM scores the highest average in 2017 with 37%, followed by Serbia (32%) and Albania (27%). Bosnia and Herzegovina follows at a visible distance with 14% progress on this indicator. Kosovo and Turkey are situated at the other end with scores that are below 5%. Montenegro scores on average 7%. When looking at the break-down per indicator, as depicted in the graph below, FYROM, Serbia, Albania, BiH and Montenegro show the highest results on the sub-indicator Open Data policy, with the countries making efforts to set up a national Open Data policy (Albania, FYROM, Montenegro and Serbia) or having relatively strong licensing norms in place (as it is the case of Albania, FYROM and Serbia). With regard to the national coordination, results are relatively modest, with only BiH, FYROM and Serbia showcasing some examples of national coordination on Open Data. Both countries have passed legislation that allows for the free access to information, by setting out the obligation for public administrations to publish information for reuse in an open format. Serbia, for example, has embedded a chapter on Open Data and Open Government as part of its Strategy for
106 This designation is without prejudice to positions on status, and is in line with UNSC 1244 and the ICJ Opinion on the Kosovo Declaration of Independence.
76%
66%
32%
0%
20%
40%
60%
80%
100%
Norway Switzerland Iceland Liechtenstein
Portal Maturity EFTA countries - Progress 2015-2017
2017 2016 2015 EU28 2017 EU28 2016 EU28 2015

86
Development of Electronic Government. The policy states that data that is held by public institutions should be open in order to provide for commercial and non-commercial reuse, and creation of new electronic services. It also highlights the benefits that Open Data has for increased transparency for administration, as well as creating new opportunities for employment. Montenegro is also making progress in this regard and has passed legislation that enables the free access to information for citizens and obliges public administrations to publish their data. BiH is also making steps in that direction and is currently working on an Open Data policy, expected to be launched in 2018.
With regard to the use of Open Data, Serbia and FYROM score best with 35% and respectively 25% followed by BiH scoring 2%. FYROM is the only country to monitor certain user statistics such as the number of unique visitors going to the portal, the percentage of foreign visitors or the top 5 domains. While Serbia is the only country to conduct specific activities to promote the national Open Data Portal and Open Data in general. The re-use of Open Data in Serbia is supported by e.g. members of the Open Data Working Group conducting various activities promoting Open Data and supporting re-use, including events, blogs, social media content and hackathons. In BiH, FYROM and Serbia understanding re-use is seen as important by the public administration.
With respect to Open Data impact, FYROM, Albania, Serbia, Turkey and BiH have presented examples of the social, economic and political impact that Open Data has had in their national context and have managed to obtain points on this sub-indicator. In BiH for example a study was published on the use of Open Data for better service delivery in the public sector as well as a set of guidelines to Open Data. In FYROM, the capital city of Skopje as well as some other bigger cities in the countries have been using data collected from sensors to track air pollution. Whereas in the beginning that data was only accessible for public administration analysts, this data has been opened and is used now by locally-developed apps for real-time tracking of air pollution levels. This led to a society-wide discussion regarding the high levels of pollution resulting in mass protests, which subsequently triggered measures by the central government as well as local municipalities to combat this issue.
Figure 35 Open Data Readiness – EU accession candidates, break-down per sub-indicator, 2017 (%)
37%33%
27%
15%
7% 3%0%
72%
0
20
40
60
80
100
FYROM Serbia Albania BiH Montenegro Turkey Kosovo
Open Data Readiness Accession countries -2017
Open Data policy Use of Open Data Impact Open Data
Open Data Readiness EU28 Average

87
Looking at the second dimension -- Portal Maturity, the results look less optimistic, with only Serbia and FYROM showcasing progress on the sub-indicators, as depicted below. Best in class in this regard is Serbia with an overall maturity level of 73% in 2017, and a highest score of 86% on the sub-indicator re-usability of data, followed by portal usability at 78% and spread of data across domains at 30%. Serbia is offering an Open Data portal that ticks most of the boxes in terms of functionalities, by providing users with a feedback function, the possibility to upload examples of Open Data re-use cases, a news section, as well as the download and search functionalities that Open Data portals should have. With this overall score, Serbia scores only 3pp below the EU28 average.
At a significant difference, but nonetheless showing good progress on this dimension is FYROM. The country scores highest on the sub-indicators portal usability and re-usability of data (50%), followed by spread of data at 30%. With an overall progress of 46%, FYROM appears to be making some progress on this dimension as well.
Figure 36 Portal Maturity – EU accession candidates, break-down per sub-indicator, 2017 (%)
Overall, the accession countries have started acknowledging the benefits of Open Data and are working towards setting the ground work on which Open Data can thrive. Albeit to different extends, the efforts made in the past year(s), have started to show.
Looking at the overall results in terms of Open Data maturity presented by Figure 37 below, the accession countries need to continue their efforts with regard to both Open Data Readiness and Portal maturity. More is needed with regard to establishing a policy framework, setting up national coordination mechanism, as well as establishing licensing norms for the publishing data and measuring impact for Open Data in the various areas. In addition, countries such as FYROM need to intensify their efforts to improve
73%
46%
0% 0% 0% 0% 0%
76%
0
20
40
60
80
100
Serbia FYROM Albania BiH Kosovo Montenegro Turkey
Portal Maturity Accession countries - 2017
Usability of portal Re-usability of data Spread of data
Portal Maturity EU28 Average

88
the maturity of their Open Data infrastructure whereas in Albania, BiH, Kosovo, Montenegro and Turkey such Open Data platforms urgently need to be established.
As the European Data Portal’s report on Open Data in the EU neighbourhood107 published in July 2017 has also shown, the seven accession countries would need to first set up the solid infrastructure on which Open Data transformation can thrive on. In doing so, establishing a governance structure that brings together all Open Data stakeholders is imperative to ensure a comprehensive and at the same time sustainable approach. Setting up an Open Data portal that caters to the needs of its users (on both publishing and re-use sides) should be one of the first steps of the Open Data journey.
Figure 37 Open Data Maturity – EU accession countries, break-down per dimension, 2017 (%)
In light of the various Open Data developments taking place across the EU and beyond the European Union’s borders, the question regarding the way forward comes to the fore. The next section will shed light into the barriers that stand in the way on achieving Open Data maturity in Europe and how European countries can deal with the aspect of sustainability to ensure their Open data transformation stands the test of time.
107 European Data Portal. Open Data in the EU Neighbourhood (July 2017)
40% 39%
22%12%
6% 3% 0%
73%
0
20
40
60
80
100
Serbia FYRM Albania BiH Montenegro Turkey Kosovo
Open Data Maturity 2017 - Accession countries
Readiness Portal Maturity Open Data Maturity EU28 Average

89
5. The way forward to increase Open Data Maturity
5.1. Barriers to overcome As presented in Chapter 2, considerable improvement has been made on both Open Data dimensions: Open Data Readiness and Portal Maturity. Despite this progress however, some obstacles continue to stand in the way of the EU28 Open Data transformation. The following section will assess these hurdles that stem at political, technical, legal and financial level from both the publishers and re-users perspectives.
Figure 38 below illustrates the most frequently mentioned barriers by public administrations of the EU28 in 2017. It highlights once again the strong impediment that the financial and legal aspects in particular continue to play in the publication of data.
Figure 38 Barriers to publishing of Open Data, EU28
When looking at the most frequently mentioned barriers for publishers of Open Data, the financial aspects are the most often indicated obstacle to opening up data by public administrations across the EU. Twenty of the EU28 Member States list this barrier amongst the obstacles they have in the publishing of data in their country. In this regard, administrations across Europe still emphasise the lack of financial resources for Open Data. What is more, financial concerns arise also with regard to the financing of the regular maintenance of databases, considering that in all the EU28 data is provided at a zero-cost-model. The financial concerns arise also from the fact that capacity-building in terms of human resource training is still needed in many administrations where qualified Open Data personnel is still scarce. This again leads to further costs that incur for the needed trainings. Despite its indisputable relevance and weight in the Open Data publishing context, financial means should not represent an obstacle for countries to further

90
advance their Open Data transformation. A number of recommendations are formulated in chapter 6 which will provide data publishers with food for thought.
The second most mentioned barrier is the legal barrier, with 16 EU Member States placing it on their list of Open Data obstacles. Here, countries mention the uncertainty in some areas regarding releasing specific data due to confidentiality, privacy and personal data concerns as the most frequent problem. Poland for example mentioned the difficulties the administrations at the different levels still face in this regard. Ireland and France voice similar concerns regarding opening up personal data and emphasise the need for adequate mechanisms for anonymisation, pseudomysation and aggregation. Both the process of anonymisation108 and pseudomysation109 of data help overcome the potential conflict between opening up data on the one hand to enable its further re-use and on the other hand the necessity to protect the identity of the individuals to whom that data relates to. Since pseudomysation provides only a limited level of protection for the individuals, the Netherlands is for example is taking steps to pass legislation that clarifies the legal framework in which the opening of such data can be made.
In addition to this, other countries such as Belgium and Italy are still tackling the conflicts between old legislation that prevents the opening up of data and the new Open Data policy frameworks that are in place. Spain appears to have dealt with a similar situation in the past and has been working in the past year on developing an update of the national law that implements the revised PSI Directive, in an effort to update the legal framework in order to overcome legal barriers. More, issues such as licences remain an obstacle in 2017 as well. Open licences represent one of the cornerstones in enabling Open Data re-use. Sweden in this regard highlights that licensing continues to be a problem with many datasets being situated in so-called legal grey zones that need to be first clarified before first steps can be undertaken to opening up such data. In Belgium, the lack of standard licence(s) at the federal level still prevents some administrations from already publishing more data. At the same time other Member States are taking the necessary steps to introduce a freedom on information bill to foster the further publishing of data that falls under this legislative act. Examples in this regard are Cyprus and Austria.
The third most frequently mentioned barrier is the technical barrier. Common standards and the lack of adoption of national standards (where existent) remains the main aspect that European public administrations seem to be struggling with. This seems to be a concern in particular for the regional and local government levels, as is the case in France and Germany where there still seems to be a low level of adoption of national standards – or guidelines – for datasets, which then hinders the immediate further re-use of such data. The opening up of data in un-structured or non-machine readable formats also prevents its connection with data from other data bases. Hence from a ‘bigger picture perspective’, it also hinders the broader EU level vision of opening up base registries to ensure a seamless and user-friendly end to end process along the citizen and business life events. The lack of API access appears to remain a major technical concern in 2017 as well, with countries such as Poland expressing concerns that there is not sufficient data available through API and open re-useable formats. This also appears to be a problem in Bulgaria, where the different IT systems and formats in which data can be exported in do not meet the national requirements for Open Data publishing. This spills over into other barriers that deal with financial or lack of qualified human and further technical resources to convert such data into formats that qualify as at least 3-star data. In Bulgaria this issue appears to have been solved in some administrations where
108 Anonymisation allows data to be published in such a way that individuals cannot be identified based on this data or that such identification cannot be done after further data is being added to that dataset. 109 Pseudonymisation of data refers to removing all identifying characteristics of data and replacing them with a value that does not allow the subject to be identified.

91
electronic registers were introduced that export and retrieve information in a machine-readable format, however such systems still need to be nation-wide implemented for the problem to be solved.
The fourth place is occupied by both the political and ‘others’ barriers, which were mentioned by 11 of the EU28 (with 39% each). The political barrier continues to remain among the most mentioned barriers by more than a third of the EU28 – a similar share to 2016. When looking at aspects that are mostly underlined in this regard, the lack of coordination among the different government authorities and levels continues to prevail, followed by aspects that deal more with changes in government and/or of responsibilities from one ministry/agency to another. Political changes such as newly elected governments seem to have provided in other countries a boost for Open Data, with countries such as Slovakia, where Open Data was set on the priority agenda of the new government elected in 2016. France on the other hand illustrates the need for political support on behalf of the political elites as well as media, which need to place the topic higher on their agenda as well. In this respect, as France is chairing the OGP and has considerably progressed with Open Data over the past years, it reaps the benefits of such exposure and positive spill-over effects in terms of boosting regional Open Data activities. It remains to be seen how sustainable this support will be in order to pursue the envisaged Open Data journey and the broader digital transformation of the country. Germany, however, faces a situation with a federal system that appears to act as a hurdle to a stronger positioning of Open Data country-wide. It appears that the German Länder prioritise Open Data to different degrees which inhibits a real boost in the country’s transformation. However, Germany appears to be taking steps to balance this development with the passing of the new Open Data Law in May 2017 and its membership in the Open Government Partnership already at the end of 2016. With these impulses, a stronger commitment is also expected on behalf of the German Länder to also pass legislation that fosters Open Data publication at regional and local level.
Amongst the “other” aspects, Member States seem to emphasise a continuing lack of understanding and/or capable resources to assist in the publishing of data that are ready for re-use (3-star standard and above). This remains an important issue in many of the EU Member States with countries such as Bulgaria, the Czech Republic, Germany, Ireland, Malta and Portugal mentioning this aspect. Some countries have undertaken steps to counter this hurdle, by providing training and knowledge support for public bodies at all levels of administration. Worth mentioning here are the examples of the Czech Republic and Sweden, where the responsible ministry has initiated measures to foster Open Data publishing and assist the public administration with the publication of data. In Poland, each ministry appoints civil servants responsible for both the implementation of the Open Public Data Programme and to monitor the implementation of the Open Data policy in different institutions. Their role is to remain in constant contact with the Open Data policy team and recommend new datasets to be released on the national Open Data Portal. A final report is to be published each year110.
110 Open Public Data Programme, Poland (2016)

92
Switching the vantage point, several barriers have also been identified that hinder the subsequent re-use of the published datasets, as shown in Figure 39 below.
Figure 39 Barriers to Open Data re-use, EU28 2017
The most frequently mentioned barriers are the lack of awareness on the benefits of Open Data (61%), followed by the technical barriers (43%). The EU28 appear to be confronted with an insufficient understanding of the benefits of Open Data. In some countries an awareness regarding rather basic issues such as where to find such Open Data online (e.g. via the national Open Data Portal) seems to be lacking. Portugal is undertaking measures in this regard and is preparing a series of awareness campaigns as well as extra activities that would increase awareness on the multiple applications for Open Data among both the public and private sector. The second most mentioned obstacle is of a technical nature, in particular the low ratio of machine readable datasets that prevents the immediate re-use of data. This connects strongly with the point raised in the previous section that dealt with the supply side of Open Data.
Portugal has timely identified these obstacles and is now launching a set of promotional activities and other stakeholder involvement activities to raise awareness amongst the broader population as well as the public administration of the datasets that, if open, can be best leveraged towards new products and services. Spain emphasises the fact that despite the increase in awareness of the importance of Open Data and improved sensitivity to the need to open up data of public interest, in practice this has not resulted in a significant increase in availability nor quality. In this regard the Czech Republic is actively assisting public bodies and pushes them to record metadata about their Open Data in the National Open Data Catalogue, to tackle the technical hurdles that prevent re-use.
Third in ranking is the availability of data, as an ongoing challenge in releasing data more systematically from a broader number of categories. Ranking last were the financial and legal aspects which were also emphasised as obstacles to re-use. These barriers are however often linked to poor awareness of data and limited release of machine readable datasets which render the exploitation more complex.

93
Concluding, one cannot speak of a decrease in the number of barriers encountered by the publishing side. It is rather an evolution of the kind of barriers Open Data publishers faced in 2015. Barriers are evolving in terms of their complexity and nature and now shift from the basic obstacles such as political support, leadership and governance, semantic and legal aspects to elements that deal more with the sophistication and sustainability or portals and overall user engagement of the Open Data stakeholders. Overcoming these barriers is an important step towards a sustainable development of countries in the Open Data field. By understanding the root causes of these obstacles and by timely addressing them, the envisaged transformation towards data-driven economies, societies and policy-making can take place more smoothly. Such transformation should also be embedded in the broader vision of producing an end-result that lasts the challenge(s) of time. The following section will deal with the sustainability aspects in more detail and provide some insights into the state of play of sustainability of Open Data portals across Europe.
5.2. Sustaining data portals Open Data portals represent a main point of interaction and exchange between data holders and data re-users. With increasing expectations on behalf of Open Data re-users, as well as with a higher number of both open and commercial data infrastructures on the market, the question of sustainability and having an adequate strategy to address sustainability of Open Data platforms has become more important. This section will carry out an assessment of the current level of sustainability of the EU28 Open Data national portals.
The sustainability question is mainly triggered by the changing environment in which portals now operate. This environment has seen both an increase in heterogeneity of Open Data re-users which has led to higher expectations and has increased the pressure on Open Data portal infrastructures to provide more functionalities, but also to offer more high-quality datasets. This environment change is also attributed to the increase in the number of data infrastructures that operate either in the open government data field (e.g. portals at national, regional and municipal level). There are now often several other platforms that offer a market place for commercial data, or social enterprises that provide infrastructures for access to both open and paid-for data. In the virtuous circle of data use, a sustainable Open Data platform would attract both data providers and data users, which would in turn stimulate the opening of more government data and the exploration of new application areas for Open Data by developers. Further sustainability concerns are addressed in the EDP report “Recommendations for Open Data Portals: from setup to sustainability”111 and the EDP report “Future of Open Data portals”112.
Looking at the sustainability of Open Data Portals across Europe, there seems to be a gap between what European governments perceive as important to sustain Open Data and the actual implementation of the necessary steps to ensure sustainability.
When looking at the engagement of Open Data stakeholders on both the demand and supply sides, the results across Europe are mixed with 86% of national portals across the EU28 having a feedback option in place, and 39% of the EU28 portals offering an option for users to contribute to datasets. When it comes to assessing the extent to which portals showcase impact stories and use cases, the scores are promising, with 71% on EU28 portals providing a section for use cases and 82% of them having a news section in place. In terms of further engagement possibilities, significant room for improvement can be observed, with only 43% of the EU28 national portals having a newsletter in place and only half of the EU28 portals providing users with the possibility to receive a notification when new data is available.
111 European Data Portal. Recommendations for Open Data Portals: from setup to sustainability (February 2017) 112 European Data Portal. The Future of Open Data Portals (October 2017)

94
Moving forward to the audiences of Open Data Portals, it is relevant to observe the extent to which there is a clear understanding of the different visitor profiles by portal owners. Here, approximately 40% of national portal owners in the EU28 are still not able to map the sectors from which their portal visitors originate from while 50% of the EU28 have mapped their visitor profiles as a bit of everything (public and private).
Furthermore, the promotion of known standards and licences should also represent a focal point for portal owners. For data, standards are important as it means that the concepts that are relevant in the data domain, their attributes and connections to other concepts are defined and agreed within a community of practice. The DCAT-AP is an example of such a standard and represents a specification for describing public sector datasets in Europe that enables a cross-data portal search for datasets. When looking at the results across Europe113, only 18 of the EU28 countries (64%) are well aware of the DCAT-AP standard; only 15 Member States (54%) are already using the standard – either As-Is or in an adapted form, and another 5 countries plan on using the standard in the near future. In this regard, Europe seems to be heading in the right direction, albeit at a relatively slow speed, when considering the fact that the DCAT-AP has been launched in 2013 already (with a subsequent update in 2015). In what licences are concerned, only 13 out of the EU28 (46%) state that all the data available on their portal is provided under an open licence, despite the fact that 90% of national Open Data policies in place recommend a standard licence or a suite of licences (e.g. the Creative Commons licences). In the EU28, only 71% of countries promote the use of the CC licence.
In terms of accessibility and re-usability of datasets, only 64% of the EU28 state that more than 90% of the available datasets are published in machine-readable formats. However, all EU28 portals provide access via a specific API. While the latter is indeed an encouraging result, such access proves of limited use if having data available in machine-readable formats represents less than two thirds of the data available. In this context, portal administrators/owners can help improve the publication of quality of data, by providing guidelines and assistance to government agencies throughout the data publication process. This has been the case in Sweden and Spain, where the agencies in charge of Open Data have been providing such extensive support. Moreover, portal owners should see themselves as ‘interaction nodes’ between the supply and demand sides, and therefore ensure that the portal features in place enable a direct interaction between publishers and re-users.
The EU28 country ranking
Compiling all these results into an overview of country performance in EU28, the following picture (see Figure 40) emerges with respect to sustainability of national data portals in Europe114. Best in class in this regard are Spain (88%), followed by Ireland, Romania and Sweden (at 87%). Next in ranking are Italy (85%), Belgium (82%), Luxembourg, the Netherlands (80%), France (79%) and Slovakia (78%). All in all, Europe shows moderate to good results on this dimension, with an overall average of 66% and only 6 countries that do not reach the 50% threshold in 2017. With upcoming portal updates planned in 5 of the countries (Cyprus, Latvia, Lithuania, Estonia and Malta), these Member States are expected to reach (and perhaps even exceed) the 50% threshold.
113 In 2017 the questionnaire was expanded to include questions related to the adoption of DCAT-AP at national level. 114 The following sub-indicators were chosen for this assessment: user engagement (assessed on a number of 10 sub-indicators), understanding of user profile and portal features to cater to the different profile needs, promotion of known licenses and standards, quality of data (formats, machine-readability).

95
Figure 40 Sustainability of national Open Data portals - EU28, 2017
Overall, it appears that the EU28 have acknowledged the importance of sustainability in the overall Open Data transformation. Indeed more needs to be done at national level, with governments and portal owners needing to react faster and better to the increase in heterogeneity of the Open Data re-users, to their demands and expectations. Against the backdrop of the insights highlighted in the previous chapters, a series of recommendations can be made that would guide decision makers and Open Data portal owners towards developing a more sustainable vision for their Open Data transformation.
66%
0%
20%
40%
60%
80%
100%ES IE RO SE IT BE
LU NL
FR SK AT
DE
HR FI CZ
UK SI
EU2
8 PT EL BG PL
DK
HU LV CY EE LT MT
Sustainability of Open Data portals

96
6. Recommendations
“There are many other aspects of data to be looked into – for example, how we can further free up publicly funded data. (…)This is about making the best value of data and facilitating imaginative
new uses of data. It is about access to data, for more data to be available to more people.”
Vice-President Andrus Ansip in charge of the Digital Single Market115
Data holds an enormous potential in various fields, from health, food security, climate and resource efficiency to energy, intelligent transport systems and smart cities – and is considered “an essential resource for economic growth, job creation and societal progress” 116. In order to harness this potential and enjoy the benefits of Open Data across sectors, some immediate next steps are needed. Based on all the evidence gathered so far, a set of recommendations are in place to provide further guidance for the European countries in their Open Data journeys.
Figure 41 Recommendations to enhance Open Data policies and portals
115 Closing speech by Vice-President Andrus Ansip in charge of the Digital Single Market, Digital Single Market conference on the free movement of data, Tallinn, 17 July 2017 116 European Commission. Building a European Data Economy

97
Recommendation #1: Enhance your Data Portal. Develop a comprehensive sustainability strategy for your Open Data portal and embed it into your roadmap towards reaching the envisaged To-Be state.
An Open Data Portal is often representative of the result of an Open Data strategy. It offers access to the data. In many cases, it contains learning materials as well as use cases. As the data portal is at the heart of the data infrastructure, it is key to put in place a clear development strategy for the portal. The strategy will shed light on the actions required to reach the desired end-state. This also implies having a clear picture of where the country currently stands with regard to Open Data and where it wants to be 2, 5 or 10 years from now. Once the vision has been defined, the necessary set of actions can be identified. These actions should first be prioritised and aligned so that changes are made on both the front-end (e.g. co-location of tools, feedback and interaction possibilities) as well as back-end (e.g. automatic upload of new data, automatic updates to existing data, cross-referencing of data from other portals etc.). Finally, it is important for portal owners to identify the challenges that cannot be solved alone as well as the potential partners that portal owners across Europe can engage with to tackle these issues. In this regard, liaising with other EU countries or European initiatives such as the European Data Portal becomes relevant.
Within these actions, focus on enhancing the overall usability of the portal is equally important and needs the immediate attention of portal owners. Given the moderate scores registered by the EU28 on this dimension and the nearly unnoticeable improvement of 3pp compared to the 2016 measurement, this area needs to be placed high on the priority list of governments across Europe.
In terms of way forward, the report published by the European Data Portal presents ways in which Open Data Portals must evolve for sustainability and added value 117.
i. Organising for use of the datasets (rather than simply for publication)
ii. Learning from the techniques utilised by recently emerged commercial data marketplaces; Promoting use via the sharing of knowledge, co-opting methods common in the open source software community
iii. Investing in discoverability best practices, borrowing from e-commerce
iv. Publishing good quality metadata, to enhance reuse
v. Adopting standards to ensure interoperability
vi. Co-locating tools, so that a wider range of users and re-users can be engaged with
vii. Linking datasets to enhance value
viii. Being accessible by offering both options for big data, such as Application Programme Interfaces, and options for more manual processing, such as comma separated value files, thus ensuring a wide range of user needs are met
ix. Co-locating documentation, so that users do not need to be domain experts in order to understand the data
x. Being measurable, as a way to assess how well they are meeting users’ needs.
117 European Data Portal. The Future of Open Data Portals (October 2017)

98
Recommendation #2: Sustain funding. Address the question of funding by employing alternative financing models as well as by demonstrating the impact of Open Data to secure long term support.
Closely related to the sustainability aspect, portals need to better address the question of funding. Given the fact that Open Data per definition is made available free of charge, how can revenue still be generated, that could in turn cover the costs that incur with the publishing of such data? This is one of the many questions that public administrations are asking themselves as they publish data. Governments at national, regional and municipal levels have invested significant amounts of resources in the set-up of Open Data platforms. Whereas one can argue that this data has already been paid for by taxpayers, the economic benefits of opening data go beyond the mere return on investment for the public administration that opened the data. The benefits positively impact the economy and create jobs, thereby contributing in taxes and various social contributions that compose the state budget. However, in times of budgetary constraints for many European public administrations – with the financial aspects still remaining the main obstacle for data publishing – coming up with new sources for financing the further publishing and maintenance of Open Data infrastructures remains a burning question. Identifying sustainable funding over time should become a main priority.
In general, there are several funding schemes for cost distribution amongst the different government levels, as well as schemes for cost distribution between public and private organisations. Other options can be weighed in such as applying for funding and grants, or advocating towards attracting sponsorships or financing via crowdfunding platforms. Whereas the latter may only be applicable to smaller local portals, national portals can benefit from mixed funding coming from different ministries and or agencies. The funding for the implementation of the Open Data strategy can therefore be discussed more openly and follow a multi-annual scheme to support medium to long term developments. In our report on Recommendations for Open Data Portals: From setup to sustainability118, four recommendations have been formulated regarding the funding of portals:
Be open about your funding strategy so that people publishing and accessing data from the portal can identify future needs, use cases and potential funding shortfalls
Ensure your priorities (training, support for publishers, user engagement) and align with those of your funding source(s) to maximise scope for portal improvements and reduce the impact of funding cuts
Ensure that your own role as portal owner includes responsibility for setting funding strategies and budgets
Perform, commission or identify research into the impact of your portal’s current or potential activities, to develop and support a business case for future funding
Documenting impact is the strongest (economic) argument that can be made towards rallying support and funding for the development of Open Data initiatives and supporting actions. These range from growth of companies to the creation of innovative services and products, to increased general tax revenues, operational efficiencies and improved public sector services, as well as benefits for society as a whole. Impact will justify and attract long term support for continued and sustained data publishing.
118 European Data Portal. Recommendations for Open Data Portals: from setup to sustainability (February 2017)

99
Recommendation #3: Document Impact. Rally further support around Open Data by gathering proof of impact, in particular on the impact of Open Data at company level
Opening up Public Sector Information is done for a reason. Often enough country representatives mention benefits around transparency and accountability. However, many countries have shifted away from this aspect and consider it a democratic given and seek economic benefits. Open Data is expected to support innovation and growth. Countries with the highest level of Open Data maturity are able to extensively document political, social and economic impact.
Now that Open Data Portals have been launched and that policies have been defined, governments should take the necessary measures to ensure that studies measuring the impact of Open Data are conducted more systematically. Impact can be documented at a macroeconomic level by means of studies and forecasts. It can also be documented by showcasing use cases and assessing how Open Data is used at company level. Whereas conducting a macro-economic study can be seen as burdensome, countries can leverage business incubators, competitiveness clusters as well as data collected by the Open Data activists as a means to document the financial benefits of Open Data. Particular attention should be paid to efforts to bring different parties on board on such endeavours: in particular research institutions, universities and civil society organisations.
Finally, countries should be more open in taking into account impact assessments and evaluations made by other stakeholders such as for instance the non-profit or the private sector. Collecting evidence from different levels of government and different sectors can equally be an efficient bottom-up approach to understanding and documenting the impact of Open Data. Along these lines, soft top-down as well as bottom-up exchanges between levels of governments can foster communication around best practices, sharing examples of reuse as well as pain points that may be shared and addressed collectively. Gathering facts and figures more systematically by pooling efforts will therefore provide the necessary evidence to pursue the efforts undertaken thus far to open up Public Sector Information.
Recommendation #4: Interact with your users. Get to know your audience and your users by taking advantage of metrics and enhancing interaction and feedback mechanisms
“The real value of data will only come out if it can be used to the full. That will lead to more development of the data economy, bringing more growth and jobs.” 119 A very first step is to make the data available and to support a continuous provision of data. Opening up data is not only about making the data available. Impact can only be achieved via engagement and collaboration with users which will lead to more significant uptake of the data reuse. The latter become the best advocates for the benefits of Open Data and thereby help sustain impact over time.
119 Closing speech by Vice-President Andrus Ansip in charge of the Digital Single Market, Digital Single Market conference on the free movement of data, Tallinn, 17 July 2017

100
The results of the 2017 Open Data Maturity Assessment have shown that there is still a need for further interaction and dialogue between the Open Data supply and demand side. Public administrations across Europe need to strengthen their efforts in this regard and provide the platform and channels on which such interactions can take place – be it offline in the form of conferences and events (hackathons, datathons, etc.) or online by enabling feedback and other contribution mechanisms (e.g. upload possibility) for data re-users. Only by doing so can a demand-driven publishing of Open Data be ensured across Europe. European administrations and implicitly the portal administrators would need to develop further ways of engaging with users and – by means of intensified interactions – get to understand their use of the portal functions even better. In this context, the idea of analysing user behaviour comes to mind. Here looking outside to the private sector practices might provide some inspiration in terms of practices that help understand user needs and their evolution, and ensuring the portal delivers for them. A series of steps could be taken here. Open Data Portals could:
Employ similar types of quantitative methods to log and analyse ‘customer’ behaviour as utilised in the e-commerce sector
Offer previews of the data for easier understanding and provide recommendations for related datasets as well as more comprehensive descriptions of datasets (going beyond a collection of structured metadata)
Provide a review and comment section
Use methods to enhance user experience, including focus groups, usability tests, A/B testing, participatory design workshops
All these are vetted methods that are used by many organisations today that enable a user-centric approach and can without a doubt prove useful for Open Data Portals as well. Furthermore, sustainability is closely related to the idea of inclusion, since ensuring a platform’s relevance over time is also related to its ability to attract a broad audience of visitors. In addition, in an ideal case it would also imply transforming these visitors into Open Data users. Therefore, Open Data Portal owners would need to address not only advocates of Open Data and civil servants, but rather the broader Open Data users – be them journalists, data analysts, civil society organisations or interested citizens. Portals should be understood as the main interaction point between publishers and users and should set a strong focus on improving the user data experience in order to ensure inclusivity, reach and enable interaction.
Recommendation #5: Drive Digital Transformation. Use Open Data and PSI as a means to drive digital transformation within the public administration
In promoting Open Data and understanding their target audience, public administrations often tend to forget they are the first consumer of the data they collect. Data is used for policy making, for designing new public services, for statistical purposes etc. However, since the launch of the European Data Portal support activities in 2015, there has also been some ‘data protectionism’ stemming from a number of public sector organisations. Silo approaches to data are not a novel topic and the setup of eGovernment services over the past fifteen years has already witnessed similar roadblocks when it comes to integrating services – or data – across multiple different organisations.
Open Data can trigger much broader digital transformation across public administrations and drive efficiency in service delivery as well as cost savings for government services. Whereas data portals are one

101
part of the data infrastructure, the core data infrastructure connects all public services collecting and using data. Data sharing across public administrations requires access to data, semantic as well as technical alignment. This calls for a more integrated approach to data management across public administration in order to unleash data’s potential and help drive the needed digital transformation from within the public sector. eGovernment solutions can bring enormous benefits to citizens, businesses and public administrations alike, and enable better mobility and stronger cooperation across Europe120. Combining both Open Data and eGovernment can provide a seamless and inclusive digital government for businesses and citizens alike.
In terms of the way forward, the Tallinn Declaration on eGovernment reiterates the fact that “eGovernment is significant for the development of the data economy and the Digital Single Market, especially for ensuring the secure and free movement of data as an enabler for digital innovation in Europe and for reducing the costs of and barriers to a seamless functioning of the Single Market.” 121 In other words, eGovernment and (open) data need to go hand in hand to transform the public sector and enable it to benefit from the data revolution.
In practice, the once-only principle relies in many countries on the use of authentic sources of information, i.e. base registries used by governments which are considered to contain authoritative (legally reliable) information, which may be automatically validated or fetched by certain users. These registries enable the re-use of data for efficient service delivery processes. ‘Authentic’ means that there can only be one source register for any given piece of information within a country, as this is the only manner in which the authoritative character of that information can be determined. This principle increases the efficiency of the government as it is no longer necessary for individual public agencies to maintain their own register.
Such registries exist in each country, and may include registers on citizens, on businesses, on cars, on buildings and addresses, on income tax, on allowances and pensions. Best practices show that establishing a network system of these authentic sources that is mandatory for public agencies to use and to report back to (in case of corrections/errors) reduces burdens for users while being cost-efficient. This enables citizens to register their data once, and allows public agencies to re-use that data whenever necessary in a service delivery process.122
Additional benefits123 are related to:
1. Citizens gaining better control over their information since it is only provided once to public administrations
2. Helping public administrations to work faster, more transparent and more efficient thereby having a positive economic impact by saving costs
3. Reducing fraud by the use of consistent authoritative information
4. Being more trustworthy because decisions are more reliable
5. By using full, complete and consistent information, decisions can be more evidence-based.
In addition, national coordination can play a key role, either by providing a formal framework or by offering guidelines and support; thereby ensuring level field understanding of the benefits of moving forward, as well as recommend tools, techniques and standards.
120 Commission Communication the Mid-Term Review on the implementation of the Digital Single Market Strategy A Connected Digital Single Market for All, page 3, Brussels, COM(2017) 228 final, 10 May 2017 121 Tallinn Declaration on eGovernment, 6 October 2017 122 European Commission (2016). eGovernment Benchmark 2016 Insight Report (2016)
123 DSM EU wide digital once only principle citizens and businesses policy options and their impacts (February 2017)

102
Recommendation #6: Explore privately held data. Leverage the use of privately held data of public interest to increase efficiency and value of policy making
Open Data policy is often focused principally on data which is created, owned or controlled by the public sector; indeed the PSI Directive focuses on Public Sector Information exclusively. In practice however, there are many kinds of information that are held by private sector companies that would be extremely valuable in pursuing public interest goals if they would be available as Open Data. By way of example, information in relation to pharmaceutical research, or in relation to the safety testing of certain products or services, or vehicle-generated data to monitor the conditions of the roads, would be highly useful to permit verification of the outcomes in subject areas that directly and significantly affect public safety, and which could also drive further innovation in the data economy. This would entail allowing the public sector bodies to gain access to data held by private entities when such data is necessary to accomplish public goals and for public interest reasons (e.g. computing statistical indicators, operation of multimodal transport services, access to vehicle-generated data necessary for traffic) or to put in place and carry out emergency response actions (e.g. associated with imminent risk to public health or security).
The European Commission has also acknowledged and referenced this point explicitly. The Mid Term Review on the implementation of the Digital Single Market Strategy,124 the Communication on the EU Data Economy and its accompanying Staff Working Document125 refer to the intent to extend the scope of the PSI Directive in order to include publicly-funded data (e.g. through procurement, concessions and grants), and to commercial data deemed to be of public interest.
The concept of “public data” or “Open Data” could, in such a perspective, be expanded to include data held by the private sector, either because they are paid for by government or because of the societal value that could be created. Several types of data could fall within these categories. A first category is data gathering activity carried out by private companies in the context of activities funded by government, through procurement, concessions and grant funding. It is frequently claimed that these data (which are often of strategic public value as in the case of transport and energy) should be treated as government data and subject to the requirements of the PSI Directive. Furthermore, even in managing purely private services, companies hold huge amounts of data that can be instrumental in addressing complex societal challenges; as is the case for instance for telecom data and telecom localisation data in particular. Some Member States (e.g. France and Finland) have already launched legislative initiatives to widen the scope of Public Sector Information to include contracts and concessions. In light of developing a data driven economy and public sector, leveraging APIs and API-based services, such alignments and re-use of Open Data, let alone Public Sector Information will be critical in the next two to five years.
124 Commission Communication the Mid-Term Review on the implementation of the Digital Single Market Strategy A Connected Digital Single Market for All, Brussels, COM(2017) 228 final, 10 May 2017 125 European Commission (2017). Staff Working Document on the free flow of data and emerging issues of the European data economy Accompanying the document Communication Building a European data economy COM(2017) 9 final, Brussels, 10.1.2017 SWD(2017) 2 final.

103
Recommendation #7: Offer real time data. Become a one-stop-shop for data by offering information about and access to real time data
Mainstreaming the use of the Internet of Things and sensors is driving the demand for real time data. Real time Open Data refers to the use of, or the capacity to use, data and related resources as soon as the data enters the system. Real time refers to a level of computer responsiveness that a user senses as immediate or nearly immediate.126 Most Open Data Portals provide data that is usually updated not more than once a day by accessing the data via an API. When data updates occur more frequently, more efficient approaches to accessing data can be used. Some cities have started using data generated by urban sensor networks combined with publicly available data from cities on crime, land use, service requests, etc. to drive better decision making. Especially in the transport sector applications based on real time Open Data such as public transportation times are increasingly being used. As cities, regions and countries start to produce more and more data, the demand for ways to consume data in more efficient, real time and citizen friendly ways will increase.
Even if the data is hosted on another platform and the stream of data is governed by another organisation, information about where to find this data can be particularly relevant for users. This can be done thanks to the addition of metadata and links to access the data over an API.
Offering access to increasing amounts of Public Sector Information, real-time data, as well as privately held data of public interest reiterates the need for:
A vision to embed Open Data in a broader agenda for the digital transformation of the public sector
A solid strategy underpinning the development of the national data portal, as one of the components of the national data infrastructure.
126 Real-time analytics

104
7. Conclusion
This report has presented an overview of the Open Data maturity levels across the EU28 and beyond the EU borders and highlighted Europe’s achievements over the course of the past years. The results have shed light on the developments made by the EU Member States in terms of their Open Data Readiness and elaborated on the observed impact of Open Data within each country. The degree of sophistication of national Open Data Portals across Europe has equally been assessed in detail. As evidenced, visible improvement was made on both dimensions, with European countries developing strong Open Data policies and coordination as well as setting up Open Data Portals that cater more and more to the heterogeneous demands and expectations of Open Data stakeholders.
The Open Data Maturity Landscaping of 2017 has shown that the majority of EU Member States are now in the top maturity quadrant of the model developed in 2015. Europe is thereby strengthening its Open Data foundation and is creating the solid ground on which broader visions such as the European data economy can be built on. The report emphasises the significant progress that Europe has made in the past two years and underlines the different speeds at which Open Data transformation across Europe takes place.
Despite demonstrating solid progress, the findings equally underline areas in which there is still room for improvement as well as the challenges that stand in the way of achieving the envisaged Open Data transformation in the EU. As Member States progress on their journey to open data, they encounter new roadblocks that test the robustness of their approach on the one hand, and challenge their appetite for a free flow of (public) data on the other hand.
Seven recommendations have been formulated. These recommendations highlight elements that would still need to be prioritised in order to achieve a high degree of sustainability for the development of a future-proof Open Data infrastructure as well as a sustainable Open Data transformation. This represents a fundamental prerequisite in realising the benefits promised by opening up (public) data and contributing to the broader vision of a European data economy.

105
Annex I Links to country factsheets
1. Austria
2. Belgium
3. Bulgaria
4. Croatia
5. Cyprus
6. Czech Republic
7. Denmark
8. Estonia
9. Finland
10. France
11. Germany
12. Greece
13. Hungary
14. Iceland
15. Ireland
16. Italy
17. Latvia
18. Liechtenstein
19. Lithuania
20. Luxembourg
21. Malta
22. Netherlands
23. Norway
24. Poland
25. Portugal
26. Romania
27. Slovakia
28. Slovenia
29. Spain
30. Sweden
31. Switzerland
32. United Kingdom

106
Annex II G8 Open Data Charter To adopt an internationally recognised approach in structuring datasets, the consortium uses the domains
listed in the G8 Open Data Charter.127
Data Category* (alphabetical
order)
Example datasets
Companies Company/business register
Crime and Justice Crime statistics, safety
Earth observation Meteorological/weather, agriculture, forestry, fishing, and hunting
Education List of schools; performance of schools, digital skills
Energy and Environment Pollution levels, energy consumption
Finance and contracts Transaction spend, contracts let, call for tender, future tenders, local
budget, national budget (planned and spent)
Geospatial Topography, postcodes, national maps, local maps
Global Development Aid, food security, extractives, land
Government Accountability
and Democracy
Government contact points, election results, legislation and statutes,
salaries (pay scales), hospitality/gifts
Health Prescription data, performance data
Science and Research Genome data, research and educational activity, experiment results
Statistics National Statistics, Census, infrastructure, wealth, skills
Social mobility and welfare Housing, health insurance and unemployment benefits
Transport and Infrastructure Public transport timetables, access points broadband penetration
127 Open Data Charter, 2013

107
Annex III Method
The assessment of the level of Open Data Maturity for each European country is divided into two key
indicators: Open Data Readiness and Portal Maturity.
The first key indicator – Open Data Readiness – assesses to what extent countries have an Open Data
policy in place, licensing norms and the extent of national coordination regarding guidelines and setting
common approaches. In addition, the transposition of the revised PSI Directive is taken into account.
Besides the presence of an Open Data policy, the use made of the Open Data available and the estimated
political, social and economic impact of Open Data are assessed. The combination of these three sub-
indicators provides a good overview of how ready a country is in terms of its Open Data policy, thus called
Open Data Readiness.
The second key indicator – Portal Maturity – assesses the usability of the portal regarding the availability
of functionalities, the overall re-usability of data such as machine readability and accessibility of datasets,
for example, as well as the spread of data across domains.
These two key indicators as well as their respective sub-indicators are shown in the three tables below.
Open Data Maturity Assessment
Open Data Readiness Portal maturity
1. Presence
of Open
Data Policy
2.
Licensing
Norms
3. Extent of
coordination at
national level
4. Use
of Data
5. Impact
of Open
Data
6. Usability
of the
portal
7. Re-
usability of
data
8. Spread of
data across
domains
Table 2 Open Data Maturity Indicators
To ensure consistency and comparability over time, the method developed in 2015 and updated in 2016 was re-used with slight enhancements in order to conduct the 2017 measurement. To offer a more comprehensive understanding of the different indicators, leading research questions were addressed. The questions are summarised in the tables below and cover each of the sub-indicators of the Open Data Maturity Assessment Model.
Open Data Readiness
Indicator 1. Presence of specific Open Data policy
1.1
Open Data policy and policies supporting re-use are in place. Open Data policy is the
same as the PSI policy. A national strategy on Open Data does exist.
1.2 National, but also regional/local portals are present. The data holders are able to upload
the data themselves, the frequency of collection is provided, there is a pre-defined
approach to ensure data is up-to-date and data is uploaded automatically.

108
1.3 Priority domains are identified. The public administration is using data themselves for
decision-making, but promoting the use by others as well by organizing events or
promoting events organised by others.
Indicator 2. Licensing norms
2.1 Data is available free of charge.
2.2 Data is open licensed.
2.3 A national data policy provides for a standard license (or suite of licenses) that public
sector bodies are encouraged to avail themselves of when allowing PSI re-use. The use
of the Creative Commons licence for publishing Open Data is recommended.
Indicator 3. Extent of coordination at national level
3.1 National guidelines on the publications of PSI are in place.
3.2 Numerous regions and/or cities run their own Open Data initiatives, like portals or
specific policies, and are integrated on the national portal. NGO’s and private companies
are allowed to share their datasets on the portal. All data initiatives are coordinated at
the national level.
Indicator 4. Use of the data
4.1 Overview of portal traffic statistics: number of unique visitors, visitor profile, percentage
of machine traffic, percentage foreign, API access., top 10 users, data re-used published
by own government
Indicator 5. Impact
5.1 Political Impact
5.1.1 High impact on government efficiency and effectiveness.
5.1.2 High impact on transparency and accountability in the country.
5.2 Social impact
5.2.1 High impact on environmental sustainability in the country.
5.2.2 High impact on increasing the inclusion of marginalised groups in policy making and
accessing government services.
5.3 Economic impact
5.3.1 Multiple macro-economic studies assessing the market value of Open Data are done as
well as studies regarding better service delivery or looking at related subjects.

109
5.3.2 The funding model is known.
Portal Maturity
Indicator 6. Usability of the portal
6.1 Feedback mechanisms are available on the portal to comment on data set quality and
get a discussion going.
6.2 A newsletter is available.
6.3 Users can access datasets, search, download and contribute themselves.
6.4 A distinction is made between human and API access, indicating that an API is available.
6.5 The national Open Data portal has been updated since mid-2016 and/or will be updated
in the next 12 months.
Indicator 7. Re-usability of the data
7.1 The proportion of data that is machine-readable is known (Open Data Monitor).
7.2 All data is available in one – bulk – download
7.3 File formats are searchable and it is known which file format is available the most.
Indicator 8. Spread of data across domains
8.1. Datasets are numerous and up-to-date
8.2 Multiple organisations provide a lot of datasets
8.3 Datasets are searchable by domain with many different domains present
Additional information was included in the landscaping questionnaire addressed to the PSI Expert Group. This information was used to complement the information for the country factsheets. This information is not scored. The material collected has supported findings in assessing the political, social and economic impact as well as best practices and barriers.
Indicator A. Best practices and examples
A.1 Best practices and examples
Indicator B. Barriers
B.1 What are the barriers to the further publication and use of Open Data in this country?
110
Indicator C. Use of the Portal
C.1 Top five most and least consulted domains
C.2 Top ten most consulted datasets
C.3 Top ten stakeholders accessing the portal
Indicator Pilot indicators
D.1 Countries are aware of the DCAT-AP for metadata standards and are already using or
plan to use the DCAT-AP on their national portal
D.2 The possibility is offered for users to tailor automated messages they could receive on
the availability of new data
D.3 The main benefits and barriers in using the DCAT-AP
In order to provide a detailed landscaping overview, different steps were taken:
• Reassessing the list of main indicators and their sub-indicators with their respective scoring. Important was the identification of how measuring certain indicators and listing essential sources of required information.
• Evaluating and updating the questionnaire survey to collect additional information from each European country. The questionnaire created for the first assessment in 2015 had been slightly updated in 2016. Again in 2017 the already existing questionnaire had been slightly updated. A better balance between small and large countries and the activities they are able to conduct has been further fine-tuned in the 2017 exercise. For example, if countries that are too small or have too few inhabitants in certain areas to require local/regional portals could prove the questions asked in the national coordination section did not apply to them, that section would not affect their overall scoring. In the licensing section countries had been asked to specify the percentage of their datasets being open licensed and free of charge. Since data quality and metadata standards are becoming more important, a pilot indicator chapter had been added to explore to what extent countries are aware of the DCAT-AP. The updated questionnaire was finalised together with the individual country representatives from the PSI expert group,128 chaired by the European Commission. The countries involved in the study are the EU28 and Switzerland, Norway, Liechtenstein and Iceland. The 2017 exercise is the first exercise to also include Iceland. A set of 88 questions was divided into five main categories: Presence of an Open Data policy, Use of Open Data, Impact of Open Data, Portal Features and the DCAT-AP. Of those 88 questions, 69 are multiple-choice or open quantifiable questions that are scored.
• Completing existing monitoring with desk research. Additional research has been conducted on the different national portals to validate the availability of data as well as usability of certain portals. Various monitoring activities and studies assessing the benefits of Open Data have equally
128 Public Sector Information expert group homepage, 2013
111
been taken into consideration. Three acclaimed annual global benchmarks for publication of open government data that have been taken into consideration are: the Open Data Barometer, produced by the World Wide Web Foundation; the Global Open Data Index, produced by the Open Knowledge Network and the Government at a Glance, produced by the Organisation for Economic Co-operation and Development.
• Drafting country factsheets and collecting input from the countries based on the results. Based on the questionnaire and further research on the different national portals country factsheets had been drafted for each country and was sent to the respective country representative(s).
• Validating the results together with the country representatives. The purpose of this validation was to further increase the accuracy of the research, extend the shelf value of the findings and publish all detailed results. Each country therefore had the opportunity to comment and complement both its factsheet and detailed scoring. This step was introduced in the 2016 landscaping and again used in the 2017 landscaping.
• Clustering of results and drafting the report. Based on the factsheets, a comparison was made between all participating countries. As this is the third and final report, a comparison between 2015, 2016 and 2017 has been included in the 2017 landscaping report.
• Publishing the full landscaping results. In 2017, all country scores129 and factsheets130 have been
published on the European Data Portal.
129 European Data Portal, landscaping score, 2017 130 European Data Portal, landscaping factsheets, 2017

112
Figure 1 - Screenshot of the European Data Portal landscaping dashboard131
Methodology
The first step to assess the level of Open Data Maturity in the EU28+, is to analyse the scores obtained
within the Open Data Readiness indicator. This indicator looks at the presence of an Open Data policy, the
use of Open Data, and the impact of Open Data. The table below provides an overview of the Open Data
Readiness indicators and the maximum scores that can be obtained per indicator. The maximum amount
of points that can be obtained for each indicator depends on both the importance of the subject and the
number of questions included. The entire scoring method with all sub-indicators is shown in Annex III –
Detailed Scoring.
131 European Data Portal, landscaping dashboard, 2017

113
# Open Data Readiness Indicator Number of
questions
Maximum
Score
1 Presence of Open Data Policies 28 620
1.1 (Open) Data Policy 17 400
1.2 Licensing Norms for PSI re-use 4 80
1.3 Extent of coordination at national level 7 140
2 Use of Open Data 12 300
3 Impact of Open Data 9 300
3.1 Political impact 3 120
3.2 Social impact 2 60
3.3 Economic impact 4 120
Total 49 1220
Table 3 - Scoring of indicators Open Data Readiness 2017
In total, countries were able to score a maximum of 1500 points. The most important part in terms of
scoring includes the political situation. The Open Data policy, use and impact add up to a maximum of
1220 points. The portal features account for a maximum of 280 points. The political part weighs more
compared to the technical implementation of the portal, as governmental support is a very important
precondition for a successful Open Data implementation. A result of the decision to score the national
portal is that countries without a national portal are not able to score more than 80% of the maximum
number of points.
Political situation
The level of success of Open Data in a country starts with the presence of an Open Data policy. As this is
the cornerstone of the Open Data Readiness indicator, countries can be allocated a maximum score of
approximately half of the total maximum score for this indicator. The maximum of 1220 points was
distributed with 620 points for the presence of an Open Data policy and 600 points for the use and
measuring the impact of Open Data. Going in more detail on the scoring of the presence of an Open Data
policy, 400 points were assigned to the Open Data policy itself, 140 points to national coordination and
80 points to the licensing norms.
Presence of an Open Data policy
Assessing the Open Data Policy was done via a series of 28 questions with a maximum score between 10
and 50 depending on the importance of the questions. For example, countries were able to score 50 points
when their data collection frequency is daily or when their data is uploaded automatically. Re-users of
Open Data are highly depending on up to date or even real-time data, which makes the frequency of data
collection an important condition for re-users to use the data. Another important question with a

114
maximum score of 50 points is the number of events held annually. Events are among the best ways to
raise awareness around the existence of Open Data. Large countries that hold more than eight events
annually, average countries that hold more than 5 events annually and small countries that hold more
than 3 events annually score 50 points.
Compared to 2016, three additional questions had been added that could be scored with a maximum of
70 points. These questions enable a deeper understanding of the promotion made of the re-use of Open
Data. Additional questions relate to what extent data is uploaded automatically, if priority domains are
the same as the ones identified previously and who organises most events. A question about the
transposition of the PSI Directive had been removed. The total score for this section is 400 points.
Compared to 2016, the licensing norms section consists of one extra question with a maximum score of
10 points. This extra question relates to whether a country recommends the use of the Creative Commons
licence for publishing Open Data. Data that is available free of charge stimulates re-use the most and is
scored with 30 points. Offering datasets free of charge and with an open license are important to be able
to use the data as Open Data with a maximum score of 30 and 25 points respectively. In comparison to
2016, for these questions countries were asked to provide a percentage of datasets that are free of charge
and/or openly licensed. The availability of a national policy providing a standard license is scored a bit
lower, as it does not prevent the publications or re-use of data. The total score for this section is 80 points.
In 2017 one question had been added to the section on the extent of coordination at the national level.
This question relates to whether all data initiatives are coordinated at the national level. A maximum of
10 points can be scored for this question resulting in a total score for this section of 140 points. Other
questions relate to how many regional events are organised, how many local initiatives are present in a
country, if all regional portals are integrated in the national portal and if there is the possibility for NGO’s
and private companies to share their data on the national Open Data portal. If countries that are too small
or have too few inhabitants in certain areas to require local/regional portals could prove the questions
asked in the national coordination section did not apply to them, that section would not affect their overall
scoring.
Use of Open Data
Once the national coordination and licensing norms are in place, the second step in achieving Open Data
Readiness is to measure the Use of Open Data, meaning to what extent data can easily be found at one
central place and thereby efficiently re-used. Looking at portal statistics, the number of visitors gives a
good indication of how successful a country is in its communication to stakeholders such as citizens and
businesses. Three questions were added to the use of Open Data section. A country scores 80 points when
the number of visitors on their portal per month is above 0.05% of the number of inhabitants the country
has. This question is linked to the maturity of the national Open Data portal, but is more focused on the
re-use of Open Data than the portal itself. An API stimulates re-use by developers and adds another 40
points to the total score. The three added questions relate to whether national Open Data portals have
re-used data published by their own government, if understanding the re-use of Open Data is something
that matters and if countries are plan to conduct activities to measure the re-use of Open Data in the

115
upcoming year. These three added questions could be scored with 35 points in total. In addition, the
question on if a country conducts the specific re-use of Open Data was rewarded with 10 extra points. The
question on the proportion of traffic towards the portal generated by machines was decreased by 5 points
to a total of 20. Other questions asked about changes in re-use since 2016, the launch of monitoring
activities and support of re-use and further communication activities promoting Open Data and could be
scored with an additional 60 points. In total, countries could obtain 300 points for this section.
Impact of Open Data
Impact of Open Data is divided between political, social and economic impact. The questions address
whether these impacts have been measured as well as how they are perceived. The weight of political
and economic impact is twice the weight of social impact, as the social impact is difficult to measure and
in general more perceived as an indirect benefit of Open Data. However, all questions of the different
impact types have a similar weight.
Besides Open Data Readiness, also Portal Maturity was measured as part of the overall Open Data
maturity assessment. This part comprised three additional sub-indicators with a maximum score of 280
points, as shown in the table below. For those countries that do not (yet) have a national Open Data
portal, no maturity could be assessed resulting in 0 points.
# Portal Maturity Indicator Number of
questions
Maximum
Score
4 Usability of the portal 8 90
5 Re-usability of the portal 6 140
6 Spread of data across domains 3 50
Total 17 280
Table 4 - Scoring of indicators Portal Maturity 2017
The first sub-indicator is the usability of the portal and provides an important indication of how user-
friendly a national portal is. Countries could score higher depending on how advanced the features on
their respective portal are, such as the availability of a feedback mechanism on datasets and the possibility
to contribute to datasets. The second sub-indicator assesses the re-usability of the portal by focusing on
availability of machine-readable formats, the possibility to search on file formats and the possibility to
request datasets. Although both the usability and re-usability of the portal determine the user-friendliness
of the portal and stimulate re-use, the re-usability is more important for re-users as it determines whether
they will return to the portal to easily find the data they need. For this reason, countries could score 140
and 90 points respectively. The third and last sub-indicator assesses to what extent data is spread across
different data domains. A mature portal should therefore have multiple datasets spread over multiple
domains coming from multiple public bodies. However, although portal maturity is important to assess,
fewer points are obtained for this part of the assessment in comparison to the Open Data Readiness, as it

116
is considered less important for the user friendliness of a portal. Hence, the maximum score was 50 points
for the spread of data across domains.
The most important question in this part of the scoring is the proportion of datasets that is available in
machine-readable format with a maximum of 60 points when 90% of the datasets or more is machine-
readable. Developers of web or mobile applications need datasets that they can automatically process as
input for their product or service. All other questions are weighted equally. Three additional questions
focus on whether a portal provides a newsletter, if the national Open Data Portal has been updated since
mid-2016 and/or whether a country plans to update their national Open Data portal in the next 12 months
with a total of 30 points. The total amount of points that could be received for this section was therefore
280. As can be seen in the above, the scoring method does not discriminate smaller from larger countries
as quantity is not measured, rather availability of features.
Pilot indicator
In 2017, one section was added and focuses on the DCAT Application Profile. This was a voluntary section
where no points could be obtained. The data collected was used in the Insight Report to provide further
illustrations on the use of the DCAT Application Profile. The six questions in this section relate to
awareness of the DCAT-AP for metadata standards, if they are or are planning to use the DCAT-AP for the
metadata on their national portal, if they offer the possibility for users to tailor automated messages they
could receive on the availability of new data, and what the main benefits and barriers are in implementing
the DCAT-AP.
Clustering
The following rationale was used to cluster countries into a specific group:
• Beginner: when a country scores at least between 0-19% on both key indicators
• Follower: when a country scores at least between 20-59% on both key indicators
• Fast-tracker: when a country scores at least between 60-74% on both key indicators
• Trendsetter: when a country scores at least between 75-100% on both key indicators
For the purpose of the present measurement, the EU28+ countries were also clustered according to their
population size, in line with the Eurostat classification:
• Small size countries: Austria, Bulgaria, Croatia, Cyprus, Denmark, Estonia, Finland, Iceland,
Ireland, Latvia, Liechtenstein, Lithuania, Luxembourg, Malta, Norway, Slovakia, Slovenia,
Switzerland
• Medium size countries: Belgium, Czech Republic, Greece, Hungary, Netherlands, Portugal,
Romania, Sweden
• Large size countries: France, Germany, Italy, Poland, Spain, UK.

117
Annex IV List of Figures Figure 1 Data publication process in Ireland .............................................................................................. 21 Figure 2 Top 20 catalogues with most datasets with known licences (%) – EDP statistics (11.2017) ........ 27 Figure 3 Use of Open Data EU28 (2015-2017, %) ....................................................................................... 28 Figure 4 The value of Open Data for the government (2017) Spain ........................................................... 44 Figure 5 Open Data Policy, Evolution 2015- 2017, break-down per sub-indicator (%) .............................. 47 Figure 6 Open Data Readiness – EU28 (2015-2017, % average results) ..................................................... 49 Figure 7 Open Data Readiness EU28 country ranking (2017, %) ................................................................ 50 Figure 8 Open Data Readiness – EU28 (2015-2017, %) .............................................................................. 50 Figure 9 Open Data impact - EU28 (2015-2017, %) .................................................................................... 51 Figure 10 Open Data impact EU 28 (2015-2017, %) ................................................................................... 53 Figure 11 Portal usability EU28, 2017 (%) ................................................................................................... 55 Figure 12: Machine-readable datasets across EU28, distribution (%) ........................................................ 58 Figure 13 Top 20 data catalogue mostly using common machine-readable datasets – EDP statistics (11.2017) ..................................................................................................................................................... 59 Figure 14 Re-usability of data EU28, 2016-2017 (%) .................................................................................. 61 Figure 15 Metadata Quality Dashboard of the European Data Portal ....................................................... 62 Figure 16: Top five data categories and their share of total datasets available on the European Data Portal ........................................................................................................................................................... 63 Figure 17 Top Data Domains in 2017, EU28 (absolute numbers) ............................................................... 64 Figure 18 Spread of data across domains EU28, 2017 (%) ......................................................................... 65 Figure 19 Portal Maturity – EU28 averaged results, 2015-2017 (%) .......................................................... 66 Figure 20 Portal Maturity in EU28, 2017 (%, averaged results) .................................................................. 67 Figure 21 Portal Maturity across EU28 2015-2017 (sorted by average 2015-17, highest to lowest) ......... 68 Figure 22 EU28+ Open Data Maturity clusters 2017 .................................................................................. 70 Figure 23 Correlation Portal Maturity and Open Data Readiness – EU28, 2017 (%) .................................. 74 Figure 24 Open Data Maturity and National coordination – big and medium size EU 28 countries, 2017 (%) ............................................................................................................................................................... 75 Figure 25 Portal Maturity and National coordination – selected countries EU28, 2017 (%) ..................... 76 Figure 26 Correlation between Open Data Impact and Portal Maturity – EU28, 2017 (%) ....................... 77 Figure 27 User engagement scores, EU28 (2017, %) .................................................................................. 78 Figure 28 Correlation Open Data Impact and User Engagement - EU28, 2017(%)..................................... 79 Figure 29: Sustainability vs User Engagement EU28, 2017 (%) .................................................................. 80 Figure 30 Applicants to ODINE programme, absolute numbers ................................................................ 81 Figure 31 Open Data Readiness – EFTA countries (2017, %) ...................................................................... 82 Figure 32 Open Data Readiness – EFTA Countries, Evolution 2015-2017 (%) ............................................ 83 Figure 33 Portal Maturity in EFTA countries, break-down per sub-indicator, 2017 results (%) ................. 84 Figure 34 Portal Maturity in the EFTA countries, progress 2015-2017 (%) ................................................ 85 Figure 35 Open Data Readiness – EU accession candidates, break-down per sub-indicator, 2017 (%) ..... 86 Figure 36 Portal Maturity – EU accession candidates, break-down per sub-indicator, 2017 (%) .............. 87 Figure 37 Open Data Maturity – EU accession countries, break-down per dimension, 2017 (%) .............. 88 Figure 38 Barriers to publishing of Open Data, EU28 ................................................................................. 89 Figure 39 Barriers to Open Data re-use, EU28 2017 ................................................................................... 92 Figure 40 Sustainability of national Open Data portals - EU28, 2017......................................................... 95 Figure 41 Recommendations to enhance Open Data policies and portals ................................................. 96