open joint stock company bank respublika joint stock company bank respublika notes to the...
TRANSCRIPT

OPEN JOINT STOCK COMPANY BANK RESPUBLIKA Consolidated Financial Statements For the Year Ended December 31, 2016

OPEN JOINT STOCK COMPANY BANK RESPUBLIKA TABLE OF CONTENTS
Page INDEPENDENT AUDITORS’ REPORT 3 CONSOLIDATED FINANCIAL STATEMENTS FOR THE YEAR ENDED DECEMBER 31, 2016:
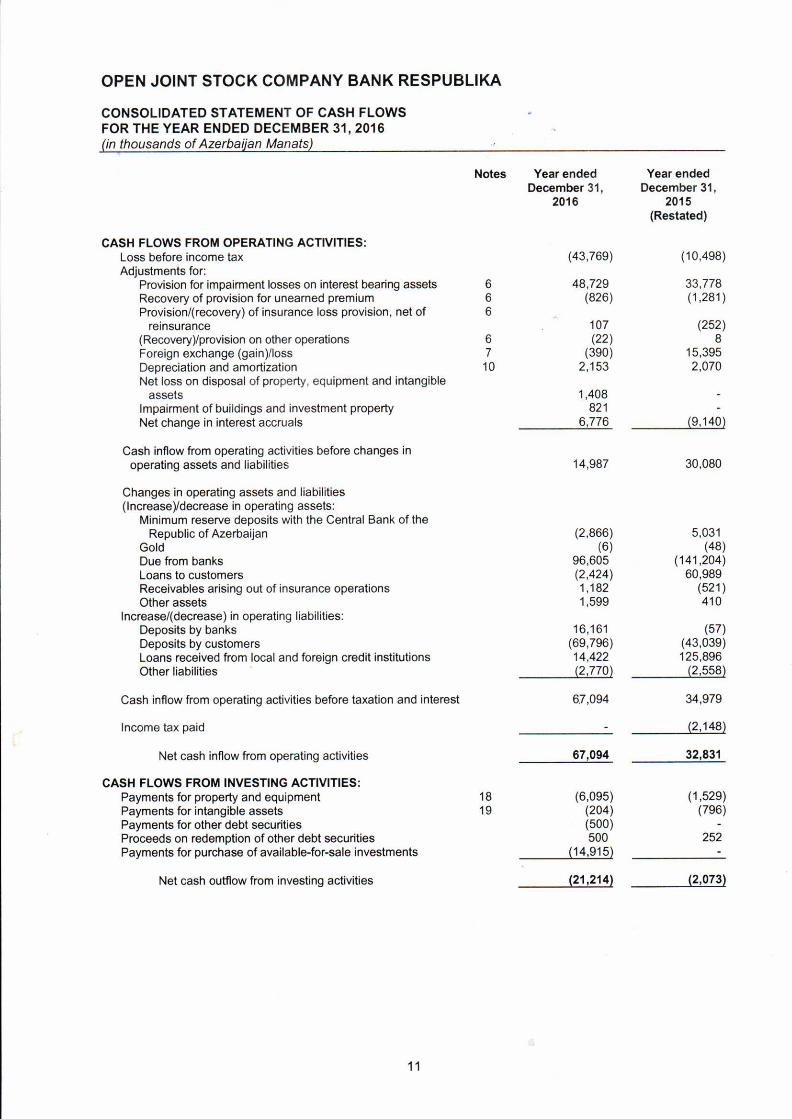
Consolidated statement of profit or loss 6 Consolidated statement of comprehensive income 7 Consolidated statement of financial position 8 Consolidated statement of changes in equity 9-10 Consolidated statement of cash flows 11-12 Notes to the consolidated financial statements:
1. Organization 13 2. Significant accounting policies 14 3. Application of new and revised International Financial Reporting Standards (IFRSs) 28 4. Correction of errors 31 5. Net interest income 32 6. Allowance for impairment losses and other provisions 32 7. Net gain on foreign exchange operations 33 8. Fee and commission income and expense 34 9. Analysis of premium and claims 34 10. Operating expenses 35 11. Income taxes 35 12. (Loss)/Earnings per share 37 13. Cash and balances with the central bank of the republic of azerbaijan 37 14. Due from banks 38 15. Loans to customers 38 16. Other debt securities 42 17. Available-for-sale investments 42 18. Property and equipment 43 19. Intangible assets 44 20. Other assets 45 21. Deposits by banks 45 22. Deposits by customers 45 23. Loans received from local and foreign credit institutions 46 24. Other liabilities 47 25. Subordinated debt 48 26. Share capital 48 27. Commitments and contingencies 48 28. Transactions with related parties 50 29. Fair value of financial instruments 52 30. Capital risk management 54 31. Risk management policies 56 32. Subsequent events 70


13
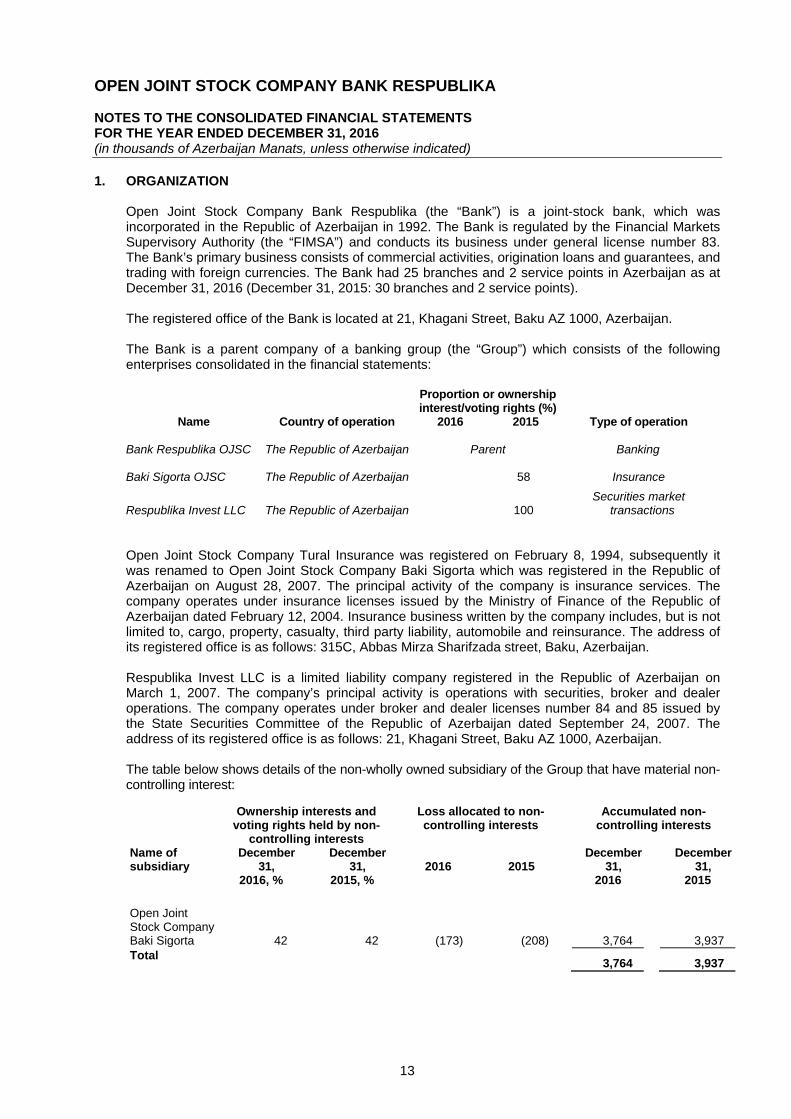
OPEN JOINT STOCK COMPANY BANK RESPUBLIKA NOTES TO THE CONSOLIDATED FINANCIAL STATEMENTS FOR THE YEAR ENDED DECEMBER 31, 2016 (in thousands of Azerbaijan Manats, unless otherwise indicated) 1. ORGANIZATION
Open Joint Stock Company Bank Respublika (the “Bank”) is a joint-stock bank, which was incorporated in the Republic of Azerbaijan in 1992. The Bank is regulated by the Financial Markets Supervisory Authority (the “FIMSA”) and conducts its business under general license number 83. The Bank’s primary business consists of commercial activities, origination loans and guarantees, and trading with foreign currencies. The Bank had 25 branches and 2 service points in Azerbaijan as at December 31, 2016 (December 31, 2015: 30 branches and 2 service points). The registered office of the Bank is located at 21, Khagani Street, Baku AZ 1000, Azerbaijan. The Bank is a parent company of a banking group (the “Group”) which consists of the following enterprises consolidated in the financial statements:
Proportion or ownership interest/voting rights (%)
Name Country of operation 2016 2015 Type of operation Bank Respublika OJSC The Republic of Azerbaijan Parent Banking Baki Sigorta OJSC The Republic of Azerbaijan 58 Insurance
Respublika Invest LLC The Republic of Azerbaijan 100 Securities market
transactions Open Joint Stock Company Tural Insurance was registered on February 8, 1994, subsequently it was renamed to Open Joint Stock Company Baki Sigorta which was registered in the Republic of Azerbaijan on August 28, 2007. The principal activity of the company is insurance services. The company operates under insurance licenses issued by the Ministry of Finance of the Republic of Azerbaijan dated February 12, 2004. Insurance business written by the company includes, but is not limited to, cargo, property, casualty, third party liability, automobile and reinsurance. The address of its registered office is as follows: 315C, Abbas Mirza Sharifzada street, Baku, Azerbaijan. Respublika Invest LLC is a limited liability company registered in the Republic of Azerbaijan on March 1, 2007. The company’s principal activity is operations with securities, broker and dealer operations. The company operates under broker and dealer licenses number 84 and 85 issued by the State Securities Committee of the Republic of Azerbaijan dated September 24, 2007. The address of its registered office is as follows: 21, Khagani Street, Baku AZ 1000, Azerbaijan. The table below shows details of the non-wholly owned subsidiary of the Group that have material non-controlling interest: Ownership interests and
voting rights held by non-controlling interests
Loss allocated to non-controlling interests
Accumulated non-controlling interests
Name of subsidiary
December 31,
2016, %
December 31,
2015, %
2016
2015
December 31,
2016
December 31,
2015
Open Joint Stock Company Baki Sigorta 42 42 (173) (208) 3,764 3,937 Total 3,764 3,937
14
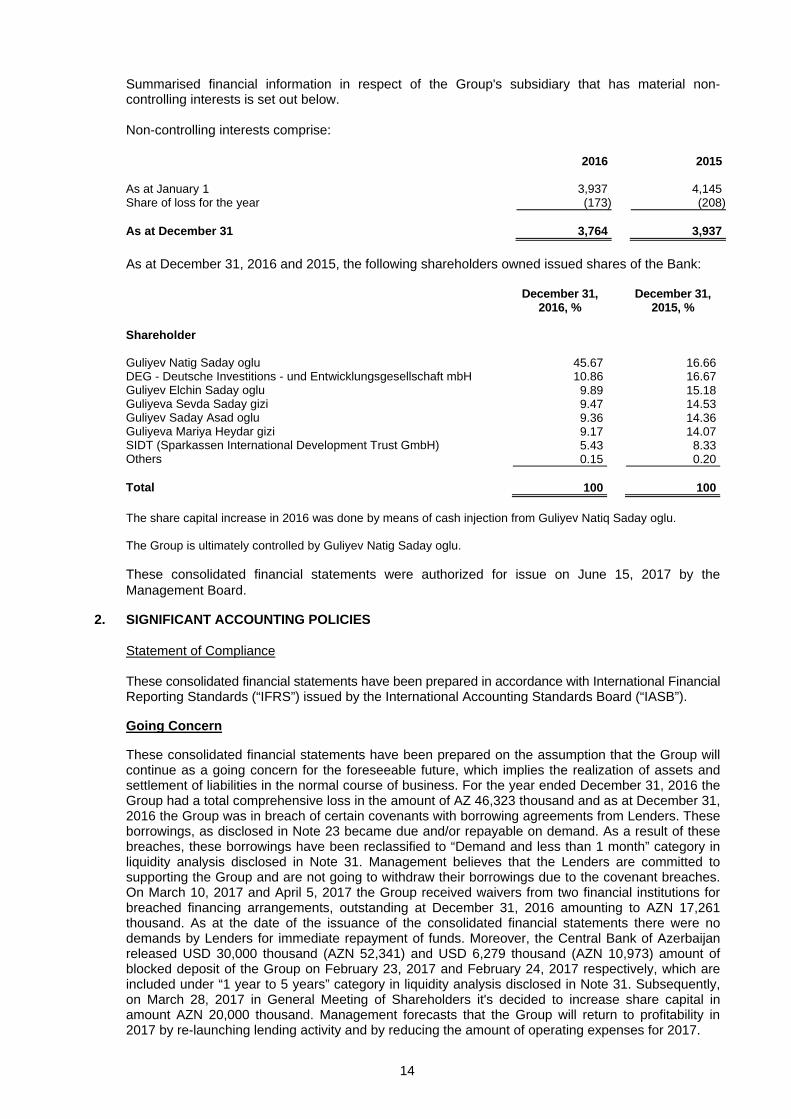
Summarised financial information in respect of the Group's subsidiary that has material non-controlling interests is set out below. Non-controlling interests comprise: 2016 2015 As at January 1 3,937 4,145Share of loss for the year (173) (208) As at December 31 3,764 3,937 As at December 31, 2016 and 2015, the following shareholders owned issued shares of the Bank:
December 31,
2016, % December 31,
2015, % Shareholder Guliyev Natig Saday oglu 45.67 16.66DEG - Deutsche Investitions - und Entwicklungsgesellschaft mbH 10.86 16.67Guliyev Elchin Saday oglu 9.89 15.18Guliyeva Sevda Saday gizi 9.47 14.53Guliyev Saday Asad oglu 9.36 14.36Guliyeva Mariya Heydar gizi 9.17 14.07SIDT (Sparkassen International Development Trust GmbH) 5.43 8.33Others 0.15 0.20 Total 100 100 The share capital increase in 2016 was done by means of cash injection from Guliyev Natiq Saday oglu. The Group is ultimately controlled by Guliyev Natig Saday oglu. These consolidated financial statements were authorized for issue on June 15, 2017 by the Management Board.
2. SIGNIFICANT ACCOUNTING POLICIES Statement of Compliance These consolidated financial statements have been prepared in accordance with International Financial Reporting Standards (“IFRS”) issued by the International Accounting Standards Board (“IASB”). Going Concern These consolidated financial statements have been prepared on the assumption that the Group will continue as a going concern for the foreseeable future, which implies the realization of assets and settlement of liabilities in the normal course of business. For the year ended December 31, 2016 the Group had a total comprehensive loss in the amount of AZ 46,323 thousand and as at December 31, 2016 the Group was in breach of certain covenants with borrowing agreements from Lenders. These borrowings, as disclosed in Note 23 became due and/or repayable on demand. As a result of these breaches, these borrowings have been reclassified to “Demand and less than 1 month” category in liquidity analysis disclosed in Note 31. Management believes that the Lenders are committed to supporting the Group and are not going to withdraw their borrowings due to the covenant breaches. On March 10, 2017 and April 5, 2017 the Group received waivers from two financial institutions for breached financing arrangements, outstanding at December 31, 2016 amounting to AZN 17,261 thousand. As at the date of the issuance of the consolidated financial statements there were no demands by Lenders for immediate repayment of funds. Moreover, the Central Bank of Azerbaijan released USD 30,000 thousand (AZN 52,341) and USD 6,279 thousand (AZN 10,973) amount of blocked deposit of the Group on February 23, 2017 and February 24, 2017 respectively, which are included under “1 year to 5 years” category in liquidity analysis disclosed in Note 31. Subsequently, on March 28, 2017 in General Meeting of Shareholders it's decided to increase share capital in amount AZN 20,000 thousand. Management forecasts that the Group will return to profitability in 2017 by re-launching lending activity and by reducing the amount of operating expenses for 2017.

15
Management has considered these factors in evaluating the Group’s ability to continue as a going concern and believes the Group will be able to meet all of its financial obligations and there is no material uncertainty regarding ability of the Group to continue as a going concern. Basis of presentation criteria These consolidated financial statements are presented in thousands of Azerbaijan Manats (“AZN”), unless otherwise indicated. These consolidated financial statements have been prepared on the historical cost basis except for buildings and certain financial instruments that are measured at revalued amounts or fair values, as explained in the accounting policies below. Historical cost is generally based on the fair value of the consideration given in exchange for assets. Fair value is the price that would be received to sell an asset or paid to transfer a liability in an orderly transaction between market participants at the measurement date, regardless of whether that price is directly observable or estimated using another valuation technique. In estimating the fair value of an asset or a liability, the Group takes into account the characteristics of the asset or liability if market participants would take those characteristics into account when pricing the asset or liability at the measurement date. Fair value for measurement and/or disclosure purposes in these consolidated financial statements is determined on such a basis, except for leasing transactions that are within the scope of IAS 17, and measurements that have some similarities to fair value but are not fair value, such as net realisable value in IAS 2 or value in use in IAS 36. In addition, for financial reporting purposes, fair value measurements are categorised into Level 1, 2 or 3 based on the degree to which the inputs to the fair value measurements are observable and the significance of the inputs to the fair value measurement in its entirety, which are described as follows: • Level 1 inputs are quoted prices (unadjusted) in active markets for identical assets or liabilities
that the entity can access at the measurement date; • Level 2 inputs are inputs, other than quoted prices included within Level 1, that are observable
for the asset or liability, either directly or indirectly; and • Level 3 inputs are unobservable inputs for the asset or liability. These consolidated financial statements have been prepared from the statutory accounting records and have been adjusted to conform to IFRS. The Group presents its consolidated statement of financial position broadly in order of liquidity. An analysis regarding recovery or settlement within 12 months after the reporting date (current) and more than 12 months after the reporting date (non-current) is presented in Note 31. Functional currency Items included in the financial statements of each of the Group’s entities are measured using the currency of the primary of the economic environment in which the entity operates (“the functional currency”). The functional currency of the Bank and its subsidiaries is the Azerbaijani Manat ("AZN"). The presentational currency of the consolidated financial statements of the Group is the AZN. All values are rounded to the nearest thousand Manats, except when otherwise indicated. Offsetting Financial assets and financial liabilities are offset and the net amount reported in the consolidated statement of financial position only when there is a legally enforceable right to offset the recognised amounts and there is an intention to settle on a net basis, or to realise the assets and settle the liability simultaneously. Income and expense is not offset in the consolidated statement of profit or loss unless required or permitted by any accounting standard or interpretation, and as specifically disclosed in the accounting policies of the Group. The principal accounting policies are set out below.

16
Basis of consolidation These consolidated financial statements incorporate the financial statements of the Bank its subsidiaries. Control is achieved when the Bank: • has power over the investee; • is exposed, or has rights, to variable returns from its involvement with the investee; and • has the ability to use its power to affect its returns. The Bank reassesses whether or not it controls an investee if facts and circumstances indicate that there are changes to one or more of the three elements of control listed above.
When the Bank has less than a majority of the voting rights of an investee, it has power over the investee when the voting rights are sufficient to give it the practical ability to direct the relevant activities of the investee unilaterally. The Bank considers all relevant facts and circumstances in assessing whether or not the Bank’s voting rights in an investee are sufficient to give it power, including: • the size of the Bank’s holding of voting rights relative to the size and dispersion of holdings of
the other vote holders; • potential voting rights held by the Bank, other vote holders or other parties; • rights arising from other contractual arrangements; and • any additional facts and circumstances that indicate that the Bank has, or does not have, the
current ability to direct the relevant activities at the time that decisions need to be made, including voting patterns at previous shareholders' meetings.
Consolidation of a subsidiary begins when the Bank obtains control over the subsidiary and ceases when the Bank loses control of the subsidiary. Specifically, income and expenses of a subsidiary acquired or disposed of during the year are included in the consolidated statements of profit or loss and other comprehensive income from the date the Bank gains control until the date when the Bank ceases to control the subsidiary. Profit or loss and each component of other comprehensive income are attributed to the owners of the Bank and to the non-controlling interests. Total comprehensive income of subsidiaries is attributed to the owners of the Bank and to the non-controlling interests even if this results in the non-controlling interests having a deficit balance. When necessary, adjustments are made to the financial statements of subsidiaries to bring their accounting policies into line with those used by other members of the Group. All intra-group transactions and balances are eliminated in full on consolidation. Goodwill Goodwill arising on an acquisition of a business is carried at cost as established at the date of acquisition of the business (see above) less accumulated impairment losses, if any. For the purposes of impairment testing, goodwill is allocated to each of the Group's cash-generating units (or groups of cash-generating units) that is expected to benefit from the synergies of the combination. A cash-generating unit to which goodwill has been allocated is tested for impairment annually, or more frequently when there is indication that the unit may be impaired. If the recoverable amount of the cash-generating unit is less than its carrying amount, the impairment loss is allocated first to reduce the carrying amount of any goodwill allocated to the unit and then to the other assets of the unit pro rata based on the carrying amount of each asset in the unit. Any impairment loss for goodwill is recognised directly in consolidated statement of profit or loss. An impairment loss recognised for goodwill is not reversed in subsequent periods. On disposal of the relevant cash-generating unit, the attributable amount of goodwill is included in the determination of the profit or loss on disposal.

17
Non-controlling interests Non-controlling interests represent the portion of profit or loss and net assets of subsidiaries not owned, directly or indirectly, by the Bank. Non-controlling interests are presented separately in the consolidated statements of profit or loss and comprehensive income and within equity in the consolidated statement of financial position, separately from parent shareholders’ equity. Changes in the Group's ownership interests in existing subsidiaries Changes in the Group's ownership interests in subsidiaries that do not result in the Group losing control over the subsidiaries are accounted for as equity transactions. The carrying amounts of the Group's interests and the non-controlling interests are adjusted to reflect the changes in their relative interests in the subsidiaries. Any difference between the amount by which the non-controlling interests are adjusted and the fair value of the consideration paid or received is recognised directly in equity and attributed to owners of the Bank. When the Group loses control of a subsidiary, a gain or loss is recognized in profit or loss and is calculated as the difference between (i) the aggregate of the fair value of the consideration received and the fair value of any retained interest and (ii) the previous carrying amount of the assets (including goodwill), and liabilities of the subsidiary and any non-controlling interests. All amounts previously recognised in other comprehensive income in relation to that subsidiary are accounted for as if the Group had directly disposed of the related assets or liabilities of the subsidiary (i.e. reclassified to profit or loss or transferred to another category of equity as specified/permitted by applicable IFRSs). The fair value of any investment retained in the former subsidiary at the date when control is lost is regarded as the fair value on initial recognition for subsequent accounting under International Accounting Standard (“IAS”) 39, when applicable, the cost on initial recognition of an investment in an associate or a joint venture. Recognition of interest income Interest income from a financial asset is recognized when it is probable that the economic benefits will flow to the Group and the amount of income can be measured reliably. Interest income and expense are recognized on an accrual basis using the effective interest method. The effective interest method is a method of calculating the amortized cost of a financial asset or a financial liability or group of financial assets or financial liabilities and of allocating the interest income or interest expense over the relevant period. The effective interest rate is the rate that exactly discounts estimated future cash receipts (including all fees on points paid or received that form an integral part of the effective interest rate, transaction costs and other premiums or discounts) through the expected life of the debt instrument, or (where appropriate) a shorter period, to the net carrying amount on initial recognition. Once a financial asset or a group of similar financial assets has been written down (partly written down) as a result of an impairment loss, interest income is thereafter recognized using the rate of interest used to discount the future cash flows for the purpose of measuring the impairment loss. Interest earned on assets at fair value is classified within interest income. Recognition of revenue – other Recognition of fee and commission income Loan origination fees are deferred, together with the related direct costs, and recognized as an adjustment to the effective interest rate of the loan. Where it is probable that a loan commitment will lead to a specific lending arrangement, the loan commitment fees are deferred, together with the related direct costs, and recognized as an adjustment to the effective interest rate of the resulting loan. Where it is unlikely that a loan commitment will lead to a specific lending arrangement, the loan commitment fees are recognized in profit or loss over the remaining period of the loan commitment. Where a loan commitment expires without resulting in a loan, the loan commitment fee is recognized in profit or loss on expiry. Loan servicing fees are recognized as revenue as the services are provided. All other commissions are recognized when services are provided.

18
Financial instruments The Group recognizes financial assets and liabilities in its consolidated statement of financial position when it becomes a party to the contractual obligations of the instrument. Regular way purchases and sales of financial assets and liabilities are recognized using settlement date accounting. Regular way purchases or sales are purchases or sales of financial assets that require delivery of assets within the time frame established by regulation or convention in the marketplace. Financial assets and financial liabilities are initially measured at fair value. Transaction costs that are directly attributable to the acquisition or issue of financial assets and financial liabilities (other than financial assets and financial liabilities at fair value through profit or loss) are added to or deducted from the fair value of the financial assets or financial liabilities, as appropriate, on initial recognition. Transaction costs directly attributable to the acquisition of financial assets or financial liabilities at fair value through profit or loss are recognized immediately in profit or loss. Financial assets Financial assets are classified into the following specified categories: financial assets ‘at fair value through profit or loss’ (“FVTPL”), ‘held to maturity’ (“HTM”) investments, ‘available-for-sale’ (“AFS”) financial assets and ‘loans and receivables’. The classification depends on the nature and purpose of the financial assets and is determined at the time of initial recognition. Available-for-sale financial assets Available-for-sale financial assets are non-derivatives that are either designated as available-for-sale or are not classified as (a) loans and receivables, (b) held-to-maturity investments or (c) financial assets at fair value through profit or loss.
Listed shares and listed redeemable notes held by the Group that are traded in an active market are classified as AFS and are stated at fair value. The Group also has investments in unlisted shares that are not traded in an active market but that are also classified as AFS financial assets and stated at fair value (because the Group management considers that fair value can be reliably measured). Fair value is determined in the manner described (see Note 29). Gains and losses arising from changes in fair value are recognised in other comprehensive income and accumulated in the investments revaluation reserve, with the exception of other-than-temporary impairment losses, interest calculated using the effective interest method, dividend income and foreign exchange gains and losses on monetary assets, which are recognised in profit or loss. Where the investment is disposed of or is determined to be impaired, the cumulative gain or loss previously accumulated in the investments revaluation reserve is reclassified to profit or loss. AFS equity investments that do not have a quoted market price in an active market and whose fair value cannot be reliably measured are measured at cost less any identified impairment losses at the end of each reporting period. Loans and receivables Trade receivables, loans, and other receivables that have fixed or determinable payments that are not quoted in an active market are classified as ‘loans and receivables’. Loans and receivables are measured at amortised cost using the effective interest method, less any impairment. Interest income is recognised by applying the effective interest rate, except for short-term receivables when the recognition of interest would be immaterial. Other debt securities This classification includes unquoted non-derivative financial assets with fixed or determinable payments and fixed maturities. Management determines the classification of other debt securities at their initial recognition. Other debt securities are carried at amortised cost and are classified as loans and receivables category under IAS 39.
19
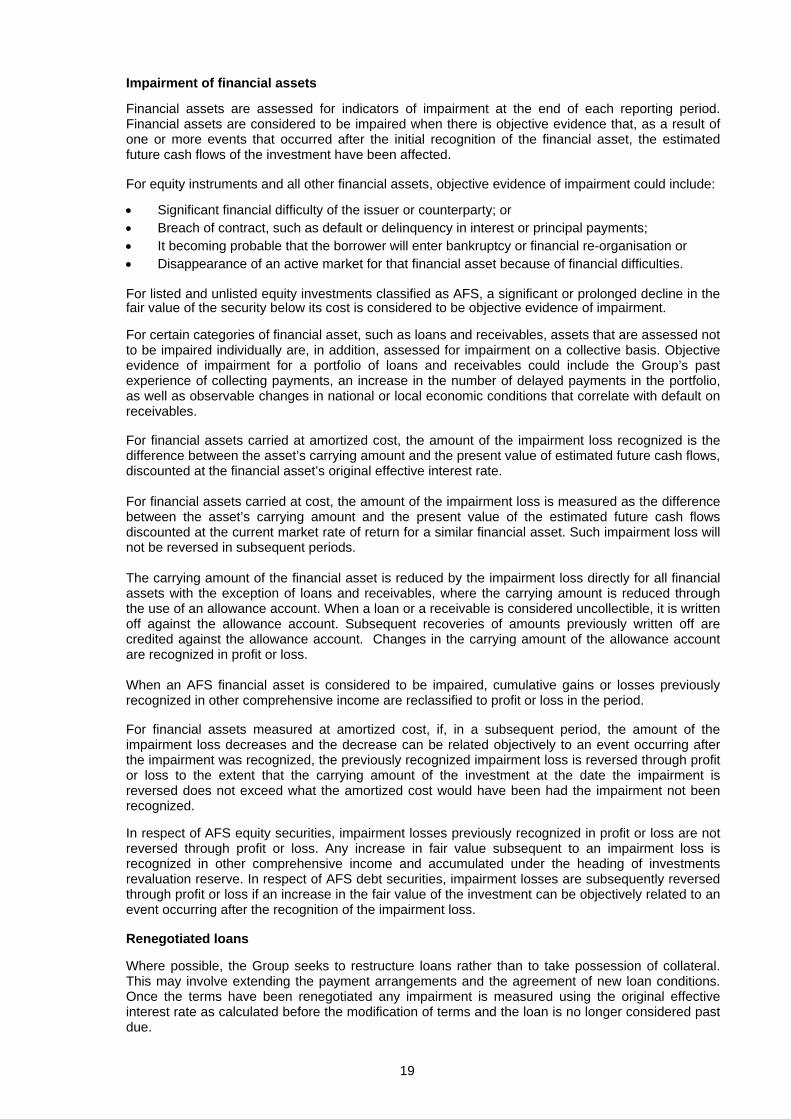
Impairment of financial assets Financial assets are assessed for indicators of impairment at the end of each reporting period. Financial assets are considered to be impaired when there is objective evidence that, as a result of one or more events that occurred after the initial recognition of the financial asset, the estimated future cash flows of the investment have been affected. For equity instruments and all other financial assets, objective evidence of impairment could include: • Significant financial difficulty of the issuer or counterparty; or • Breach of contract, such as default or delinquency in interest or principal payments; • It becoming probable that the borrower will enter bankruptcy or financial re-organisation or • Disappearance of an active market for that financial asset because of financial difficulties. For listed and unlisted equity investments classified as AFS, a significant or prolonged decline in the fair value of the security below its cost is considered to be objective evidence of impairment. For certain categories of financial asset, such as loans and receivables, assets that are assessed not to be impaired individually are, in addition, assessed for impairment on a collective basis. Objective evidence of impairment for a portfolio of loans and receivables could include the Group’s past experience of collecting payments, an increase in the number of delayed payments in the portfolio, as well as observable changes in national or local economic conditions that correlate with default on receivables. For financial assets carried at amortized cost, the amount of the impairment loss recognized is the difference between the asset’s carrying amount and the present value of estimated future cash flows, discounted at the financial asset’s original effective interest rate. For financial assets carried at cost, the amount of the impairment loss is measured as the difference between the asset’s carrying amount and the present value of the estimated future cash flows discounted at the current market rate of return for a similar financial asset. Such impairment loss will not be reversed in subsequent periods. The carrying amount of the financial asset is reduced by the impairment loss directly for all financial assets with the exception of loans and receivables, where the carrying amount is reduced through the use of an allowance account. When a loan or a receivable is considered uncollectible, it is written off against the allowance account. Subsequent recoveries of amounts previously written off are credited against the allowance account. Changes in the carrying amount of the allowance account are recognized in profit or loss. When an AFS financial asset is considered to be impaired, cumulative gains or losses previously recognized in other comprehensive income are reclassified to profit or loss in the period. For financial assets measured at amortized cost, if, in a subsequent period, the amount of the impairment loss decreases and the decrease can be related objectively to an event occurring after the impairment was recognized, the previously recognized impairment loss is reversed through profit or loss to the extent that the carrying amount of the investment at the date the impairment is reversed does not exceed what the amortized cost would have been had the impairment not been recognized. In respect of AFS equity securities, impairment losses previously recognized in profit or loss are not reversed through profit or loss. Any increase in fair value subsequent to an impairment loss is recognized in other comprehensive income and accumulated under the heading of investments revaluation reserve. In respect of AFS debt securities, impairment losses are subsequently reversed through profit or loss if an increase in the fair value of the investment can be objectively related to an event occurring after the recognition of the impairment loss. Renegotiated loans Where possible, the Group seeks to restructure loans rather than to take possession of collateral. This may involve extending the payment arrangements and the agreement of new loan conditions. Once the terms have been renegotiated any impairment is measured using the original effective interest rate as calculated before the modification of terms and the loan is no longer considered past due.

20
Management continually reviews renegotiated loans to ensure that all criteria are met and that future payments are likely to occur. The loans continue to be subject to an individual or collective impairment assessment, calculated using the loan’s original effective interest rate. Write off of loans and advances Loans and advances are written off against the allowance for impairment losses when deemed uncollectible. Loans and advances are written off after management has exercised all possibilities available to collect amounts due to the Group and after the Group has sold all available collateral. Subsequent recoveries of amounts previously written off are reflected as an offset to the charge for impairment of financial assets in the consolidated statement of comprehensive income in the period of recovery. In accordance with the statutory legislation, loans may only be written off with the approval of the Supervisory Board and, in certain cases, with the respective decision of the Court. Derecognition of financial assets The Group derecognizes a financial asset only when the contractual rights to the cash flows from the asset expire, or when it transfers the financial asset and substantially all the risks and rewards of ownership of the asset to another party. If the Group neither transfers nor retains substantially all the risks and rewards of ownership and continues to control the transferred asset, the Group recognizes its retained interest in the asset and an associated liability for amounts it may have to pay. If the Group retains substantially all the risks and rewards of ownership of a transferred financial asset, the Group continues to recognise the financial asset and also recognises a collateralised borrowing for the proceeds received. On derecognition of a financial asset in its entirety, the difference between the asset’s carrying amount and the sum of the consideration received and receivable and the cumulative gain of loss that had been recognized in other comprehensive income and accumulated in equity is recognized in profit or loss. On derecognition of a financial asset other than in its entirety (e.g. when the Group retains an option to repurchase part of a transferred asset), the Group allocates the previous carrying amount of the financial asset between the part it continues to recognize under continuing involvement, and the part it no longer recognises on the basis of the relative fair values of those parts on the date of the transfer. The difference between the carrying amount allocated to the part that is no longer recognised and the sum of the consideration received for the part no longer recognised and any cumulative gain or loss allocated to it that had been recognised in other comprehensive income is recognized in profit or loss. A cumulative gain or loss that had been recognised in other comprehensive income is allocated between the part that continues to be recognised and the part that is no longer recognised on the basis of the relative fair values of those parts. Financial liabilities and equity instruments issued Classification as debt or equity Debt and equity instruments are classified as either financial liabilities or as equity in accordance with the substance of the contractual arrangements and the definitions of a financial liability and an equity instrument. Equity instrument An equity instrument is any contract that evidences a residual interest in the assets of an entity after deducting all of its liabilities. Equity instruments issued by the Group are recognized at the proceeds received, net of direct issue costs. Repurchase of the Group’s own equity instruments is recognized and deducted directly in equity. No gain or loss is recognized in profit or loss on the purchase, sale, issue or cancellation of the Group’s own equity instruments. Other financial liabilities Other financial liabilities, including depository instruments with the Central Bank of the Republic of Azerbaijan, deposits by banks and customers, loans received from government agencies and foreign

21
credit institutions, subordinated debt and other liabilities, are initially measured at fair value, net of transaction costs. Other financial liabilities are subsequently measured at amortised cost using the effective interest method, with interest expense recognised on an effective yield basis. The effective interest method is a method of calculating the amortised cost of a financial liability and of allocating interest expense over the relevant period. The effective interest rate is the rate that exactly discounts estimated future cash payments (including all fees and points paid or received that form an integral part of the effective interest rate, transaction costs and other premiums or discounts) through the expected life of the financial liability, or (where appropriate) a shorter period, to the net carrying amount on initial recognition. Derecognition of financial liabilities The Group derecognises financial liabilities when, and only when, the Group’s obligations are discharged, cancelled or they expire. Where an existing financial liability is replaced by another from the same lender on substantially different terms, or the terms of an existing liability are substantially modified, such an exchange or modification is treated as a derecognition of the original liability and the recognition of a new liability. The difference between the carrying amount of the financial liability derecognized and the consideration paid and payable is recognized in profit or loss. Financial guarantee contracts A financial guarantee contract is a contract that requires the issuer to make specified payments to reimburse the holder for a loss it incurs because a specified debtor fails to make payments when due in accordance with the terms of a debt instrument.
Financial guarantee contracts issued by the Group are initially measured at their fair values and, if not designated as at FVTPL, are subsequently measured at the higher of: • The amount of the obligation under the contract, as determined in accordance with IAS 37
Provisions, Contingent Liabilities and Contingent Assets ; and • The amount initially recognized less, where appropriate, cumulative amortization recognized in
accordance with the revenue recognition policies. Derivative financial instruments
Forwards and futures. Forward and futures contracts are contractual agreements to buy or sell a specified financial instrument at a specific price and date in the future. Forwards are customised contracts transacted in the over-the-counter market. Futures contracts are transacted in standardised amounts on regulated exchanges and are subject to daily cash margin requirements. The main differences in the risk associated with forward and futures contracts are credit risk and liquidity risk. The Group has credit exposure to the counterparties of forward contracts. The credit risk related to future contracts is considered minimal because the cash margin requirements of the exchange help ensure that these contracts are always honoured. Forward contracts are settled gross and are, therefore, considered to bear a higher liquidity risk than the futures contracts which are settled on a net basis. Both types of contracts result in market risk exposure. Options. Option contracts are contractual agreements that grants the buyer of the option right to buy or sell a specified financial instrument at an agreed upon price at a later date in the future. Options are transacted either in exchange or in over-the-counter market. Leases Leases are classified as finance leases whenever the terms of the lease transfer substantially all the risks and rewards of ownership to the lessee. All other leases are classified as operating leases. The Group as lessee Operating lease payments are recognised as an expense on a straight-line basis over the lease term, except where another systematic basis is more representative of the time pattern in which economic benefits from the leased asset are consumed. Contingent rentals arising under operating leases are recognised as an expense in the period in which they are incurred.

22
In the event that lease incentives are received to enter into operating leases, such incentives are recognised as a liability. The aggregate benefit of incentives is recognised as a reduction of rental expense on a straight-line basis, except where another systematic basis is more representative of the time pattern in which economic benefits from the leased asset are consumed. Cash and cash equivalents Cash and cash equivalents consist of cash on hand, unrestricted balances on correspondent and term deposits with the Central Bank of the Republic of Azerbaijan with original maturity of less or equal to 90 days and amounts due from credit institutions with original maturity of less or equal to 90 days and are free from contractual encumbrances. Minimum reserve deposits with the Central Bank of the Republic of Azerbaijan Minimum reserve deposits with the Central Bank of the Republic of Azerbaijan represent the amount of obligatory reserves deposited with the Central Bank of the Republic of Azerbaijan in accordance with requirements established by the Financial Markets Supervisory Authority, which subject to restrictions on their availability. In view of the above the amount of the minimum reserve deposit required by the Financial Markets Supervisory Authority is not included as a cash equivalent in consolidated statement of cash flows. Property and equipment Buildings are stated in the consolidated statement of financial position at their revalued amounts, being the fair value at the date of revaluation, less any subsequent accumulated depreciation and subsequent accumulated impairment losses. Revaluations are performed with sufficient regularity such that the carrying amounts do not differ materially from those that would be determined using fair values at the end of each reporting period. Any revaluation increase arising on the revaluation of buildings is recognised in other comprehensive income and accumulated in equity, except to the extent that it reverses a revaluation decrease for the same asset previously recognised in profit or loss, in which case the increase is credited to profit or loss to the extent of the decrease previously expensed. A decrease in the carrying amount arising on the revaluation of buildings is recognised in profit or loss to the extent that it exceeds the balance, if any, held in the properties revaluation reserve relating to a previous revaluation of that asset.
Depreciation on revalued buildings is recognised in profit or loss. On the subsequent sale or retirement of a revalued property, the attributable revaluation surplus remaining in the properties revaluation reserve is transferred directly to retained earnings. Freehold land is stated at cost and is not depreciated. Fixtures and equipment are stated at cost less accumulated depreciation and accumulated impairment losses. Depreciation is recognised so as to write off the cost or valuation of assets (other than freehold land and properties under construction) less their residual values over their useful lives, using the straight-line method. The estimated useful lives, residual values and depreciation method are reviewed at the end of each reporting period. The estimated useful lives as follows:
Residual value, % of historical
cost
Rates used in year ended
December 31, 2016
Rates used in year ended
December 31, 2015
Buildings 20% 1% 1% Furniture and equipment - 10% 10% Computers - 15% 15% Vehicles 10% 7% 7% Other equipment - 10% 10% Leasehold improvements - 10% 10%

23
An item of property and equipment is derecognised upon disposal or when no future economic benefits are expected to arise from the continued use of the asset. Any gain or loss arising on the disposal or retirement of an item of property and equipment is determined as the difference between the sales proceeds and the carrying amount of the asset and is recognised in profit or loss. Intangible assets
Intangible assets acquired separately
Intangible assets with finite useful lives that are acquired separately are carried at cost less accumulated amortisation and accumulated impairment losses. Amortisation is recognised on a straight-line basis over their estimated useful lives of 10 years. The estimated useful life and amortisation method are reviewed at the end of each reporting period, with the effect of any changes in estimate being accounted for on a prospective basis.
Derecognition of intangible assets
An intangible asset is derecognised on disposal, or when no future economic benefits are expected from use or disposal. Gains or losses arising from derecognition of an intangible asset, measured as the difference between the net disposal proceeds and the carrying amount of the asset, and are recognised in profit or loss when the asset is derecognised. Impairment of tangible and intangible assets other than goodwill
At the end of each reporting period, the Group reviews the carrying amounts of its tangible and intangible assets to determine whether there is any indication that those assets have suffered an impairment loss. If any such indication exists, the recoverable amount of the asset is estimated in order to determine the extent of the impairment loss (if any). Where it is not possible to estimate the recoverable amount of an individual asset, the Group estimates the recoverable amount of the cash-generating unit to which the asset belongs. Where a reasonable and consistent basis of allocation can be identified, corporate assets are also allocated to individual cash-generating units, or otherwise they are allocated to the smallest group of cash-generating units for which a reasonable and consistent allocation basis can be identified. Recoverable amount is the higher of fair value less costs to sell and value in use. In assessing value in use, the estimated future cash flows are discounted to their present value using a pre-tax discount rate that reflects current market assessments of the time value of money and the risks specific to the asset for which the estimates of future cash flows have not been adjusted. If the recoverable amount of an asset (or cash-generating unit) is estimated to be less than its carrying amount, the carrying amount of the asset (or cash-generating unit) is reduced to its recoverable amount. An impairment loss is recognised immediately in profit or loss, unless the relevant asset is carried at a revalued amount, in which case the impairment loss is treated as a revaluation decrease. When an impairment loss subsequently reverses, the carrying amount of the asset (or a cash-generating unit) is increased to the revised estimate of its recoverable amount, but so that the increased carrying amount does not exceed the carrying amount that would have been determined had no impairment loss been recognised for the asset (or cash-generating unit) in prior years. A reversal of an impairment loss is recognised immediately in profit or loss, unless the relevant asset is carried at a revalued amount, in which case the reversal of the impairment loss is treated as a revaluation increase. Investment property Investment properties are properties held to earn rentals and/or for capital appreciation (including property under construction for such purposes). Investment properties are measured using cost model. The Group measures all of its investment properties in accordance with IAS 40’s requirements. An investment property is derecognised upon disposal or when the investment property is permanently withdrawn from use and no future economic benefits are expected from the disposal. Any gain or loss arising on derecognition of the property (calculated as the difference between the net disposal proceeds and the carrying amount of the asset) is included in profit or loss in the period in which the property is derecognized.

24
Gold Assets and liabilities denominated in gold are translated at the current rate computed based on the second fixing of the London Metal Exchange rates, using the AZN/USD exchange rate effective at the date. Changes in the bid prices are recorded in net gain/(loss) on operations with gold operations. Insurance operations Non-life insurance operations • Gross premiums written - Upon inception of a contract, premium are recorded as written and
are earned primarily on a pro-rata basis over the term of the related policy coverage. • Provision for unearned premium - Provision for unearned premium represent the proportion of
premium written in the period that relate to unexpired terms of policies in force as at the reporting date, calculated on a time apportionment basis.
• Claims paid - Claims paid including claims handling expenses are charged to the statement of comprehensive income as incurred
Loss provision Loss provision represents the accumulation of estimates for ultimate losses and includes outstanding claims provision (“OCP”) and provision for losses incurred but not yet reported (“IBNR”). Estimates of claims handling expenses are included in both OCP and IBNR. OCP is provided in respect of claims reported, but not settled as at reporting date. The estimation is made on the basis of information received by the Group during investigation of insurance cases after the reporting date less regresses. IBNR is actuarially determined by the Group by line of business, and includes assumptions based on prior years’ claims and claims handling experience. The methods of determining such estimates and establishing the resulting provisions are continually reviewed and updated. Resulting adjustments are reflected in the statement of profit or loss as they arise. The loss reserves are estimated on an undiscounted basis due to the relatively quick pattern of claims notification and payment. Reinsurance The Group assumes and cedes reinsurance in the normal course of business. However, ceded reinsurance contracts do not relieve the Group from its obligations to policyholders. Reinsurance assets include balances due from reinsurance companies for paid claims, including claims handling expenses, and premium ceded to the Group. Amounts recoverable from reinsurers are estimated in a manner consistent with the claim liability associated with the reinsured policy. Reinsurance payables are obligations of the Group for the transfer of reinsurance premium to reinsurers and of the Group’s share in claims in respect of insurance cases reinsured by the Group A deposit asset or liability is recognized based on the consideration paid or received less any explicitly identified premium or fees to be retained by the reinsured. Taxation Income tax expense represents the sum of the tax currently payable and deferred tax.
Current tax The tax currently payable is based on taxable profit for the year, and any adjustment to tax payable in respect of previous years. Taxable profit differs from profit as reported in the consolidated statement of profit or loss because of items of income or expense that are taxable or deductible in other years and items that are never taxable or deductible. The Group's liability for current tax is calculated using tax rates that have been enacted or substantively enacted by the end of the reporting period. Deferred tax Deferred tax is recognised on temporary differences between the carrying amounts of assets and liabilities in the consolidated financial statements and the corresponding tax bases used in the

25
computation of taxable profit. Deferred tax is recognized on tax losses, which can be utilizes during five years. Deferred tax liabilities are generally recognised for all taxable temporary differences. Deferred tax assets are generally recognised for all deductible temporary differences to the extent that it is probable that taxable profits will be available against which those deductible temporary differences can be utilised. Such deferred tax assets and liabilities are not recognised if the temporary difference arises from goodwill or from the initial recognition (other than in a business combination) of other assets and liabilities in a transaction that affects neither the taxable profit nor the accounting profit. Deferred tax liabilities are recognised for taxable temporary differences associated with investments in subsidiaries and associates, and interests in joint ventures, except where the Group is able to control the reversal of the temporary difference and it is probable that the temporary difference will not reverse in the foreseeable future. Deferred tax assets arising from deductible temporary differences associated with such investments and interests are only recognised to the extent that it is probable that there will be sufficient taxable profits against which to utilise the benefits of the temporary differences and they are expected to reverse in the foreseeable future. The carrying amount of deferred tax assets is reviewed at the end of each reporting period and reduced to the extent that it is no longer probable that sufficient taxable profits will be available to allow all or part of the asset to be recovered. Deferred tax assets and liabilities are measured at the tax rates that are expected to apply in the period in which the liability is settled or the asset realised, based on tax rates (and tax laws) that have been enacted or substantively enacted by the end of the reporting period. The measurement of deferred tax liabilities and assets reflects the tax consequences that would follow from the manner in which the Group expects, at the end of the reporting period, to recover or settle the carrying amount of its assets and liabilities. Current and deferred tax for the year Current and deferred tax are recognised in profit or loss, except when they relate to items that are recognised in other comprehensive income or directly in equity, in which case, the current and deferred tax are also recognised in other comprehensive income or directly in equity respectively. Operating taxes Azerbaijan also has various other taxes, which are assessed on the Group’s activities. These taxes are included as a component of operating expenses in the consolidated statement of profit or loss and other comprehensive income.
Provisions Provisions are recognised when the Group has a present obligation (legal or constructive) as a result of a past event, it is probable that the Group will be required to settle the obligation, and a reliable estimate can be made of the amount of the obligation. The amount recognised as a provision is the best estimate of the consideration required to settle the present obligation at the end of the reporting period, taking into account the risks and uncertainties surrounding the obligation. When a provision is measured using the cash flows estimated to settle the present obligation, its carrying amount is the present value of those cash flows (where the effect of the time value of money is material). When some or all of the economic benefits required to settle a provision are expected to be recovered from a third party, a receivable is recognised as an asset if it is virtually certain that reimbursement will be received and the amount of the receivable can be measured reliably. Contingencies Contingent liabilities are not recognized in the consolidated statement of financial position but are disclosed unless the possibility of any outflow in settlement is remote. A contingent asset is not recognized in the consolidated statement of financial position but disclosed when an inflow of economic benefits is probable. Foreign currencies

26
In preparing the financial statements of each individual group entity, transactions in currencies other than the entity's functional currency (foreign currencies) are recognised at the rates of exchange prevailing at the dates of the transactions. At the end of each reporting period, monetary items denominated in foreign currencies are retranslated at the rates prevailing at that date. Non-monetary items carried at fair value that are denominated in foreign currencies are retranslated at the rates prevailing at the date when the fair value was determined. Non-monetary items that are measured in terms of historical cost in a foreign currency are not retranslated. Exchange differences on monetary items are recognised in profit or loss. The exchange rates used by the Group in the preparation of the consolidated financial statements as at year-end are as follows: December 31,
2016 December
31, 2015 AZN/1 USD 1.7707 1.5594AZN/1 EUR 1.8644 1.7046AZN/Gold bullion (1 ounce) 2029.0451 1668.7139 Collateral The Group obtains collateral in respect of customer liabilities where this is considered appropriate. The collateral normally takes the form of a lien over the customer’s assets and gives the Group a claim on these assets for both existing and future customer liabilities. Repossessed collaterals In certain circumstances, assets are repossessed following the foreclosure on loans that are in default. Repossessed collaterals are measured at the lower of carrying amount and fair value less costs to sell. Equity reserves The reserve recorded in equity on the Group’s consolidated statement of financial position includes revaluation reserves which comprise change in fair value of buildings and available-for-sale financial assets. Critical accounting judgments and key sources of estimation uncertainty In the application of the Group’s accounting policies the directors are required to make judgments, estimates and assumptions about the carrying amounts of assets and liabilities that are not readily apparent from other sources. The estimates and associated assumptions are based on historical experience and other factors that are considered to be relevant. Actual results may differ from these estimates. The estimates and underlying assumptions are reviewed on an ongoing basis. Revisions to accounting estimates are recognised in the period in which the estimate is revised if the revision affects only that period, or in the period of the revision and future periods if the revision affects both current and future periods. Key sources of estimation uncertainty
The following are the key assumptions concerning the future, and other key sources of estimation uncertainty at the end of the reporting period, that have a significant risk of causing a material adjustment to the carrying amounts of assets and liabilities within the next financial year. Impairment of loans and receivables
The Group regularly reviews its loans and receivables to assess for impairment. The Group’s loan impairment provisions are established to recognize incurred impairment losses in its portfolio of loans and receivables. The Group considers accounting estimates related to allowance for impairment of loans and receivables a key source of estimation uncertainty because (i) they are highly susceptible to change from period to period as the assumptions about future default rates and valuation of potential losses relating to impaired loans and receivables are based on recent performance experience, and (ii) any significant difference between the Group’s estimated losses

27
and actual losses would require the Group to record provisions which could have a material impact on its consolidated financial statements in future periods. The Group uses management’s judgment to estimate the amount of any impairment loss in cases where a borrower has financial difficulties and there are few available sources of historical data relating to similar borrowers. Similarly, the Group estimates changes in future cash flows based on past performance, past customer behavior, observable data indicating an adverse change in the payment status of borrowers in a group, and national or local economic conditions that correlate with defaults on assets in the group. Management uses estimates based on historical loss experience for assets with credit risk characteristics and objective evidence of impairment similar to those in the group of loans. The Group uses management’s judgment to adjust observable data for a group of loans to reflect current circumstances not reflected in historical data. The allowances for impairment of financial assets in the consolidated financial statements have been determined on the basis of existing economic and political conditions. The Group is not in a position to predict what changes in conditions will take place in the Republic of Azerbaijan and what effect such changes might have on the adequacy of the allowances for impairment of financial assets in future periods.
As at December 31, 2016 and 2015 the gross loans to customers totaled AZN 285,709 thousand and AZN 336,537 thousand, respectively, and allowance for impairment losses amounted to AZN 25,285 thousand and AZN 27,337 thousand, respectively. Valuation of financial instruments
As described in Note 29, the Group uses valuation techniques that include inputs that are not based on observable market date to estimate the fair value of certain types of financial instruments. Note 29 provides detailed information about the key assumptions used in the determination of the fair value of financial instruments, as well as the detailed sensitivity analysis for these assumptions. The Management believes that the chosen valuation techniques and assumptions used are appropriate in determining the fair value of financial instruments. Useful lives of property and equipment As described above, the Group reviews the estimated useful lives of property and equipment at the end of each annual reporting period. Property carried at revalued amounts Certain property (buildings) is measured at revalued amounts. The date of the latest appraisal was December 1, 2012. The carrying value of revalued property amounted to AZN 14,795 thousand and AZN 16,847 thousand as at December 31, 2016 and 2015, respectively. Recoverability of deferred tax assets The Management of the Group reviews deferred tax assets at the end of each reporting period and reduces it to the extent that it is no longer probable that sufficient taxable profits will be available to allow all or part of the asset to be recovered. The carrying value of deferred tax assets amounted to nil and AZN 549 thousand as at December 31, 2016 and 2015, respectively. Tax legislation Azerbaijani tax, currency and customs legislation is subject to varying interpretations. Refer to Note 27.
Initial recognition of related party transactions In the normal course of business the Group enters into transactions with its related parties. IAS 39 requires initial recognition of financial instruments based on their fair values. Judgment is applied in determining if transactions are priced at market or non-market interest rates, where there is no active market for such transactions. The basis for judgment is pricing for similar types of transactions with unrelated parties and effective interest rate analysis. The management concluded that interest rates for transactions with related parties do not significantly differ from those applied to transactions with third parties. The information on related party balances is disclosed in Note 28.

28
Liquidity mismatch As set out in the contractual maturity table in Note 31, as at December 31, 2016 the Group had a negative cumulative liquidity gap of AZN 63,209 thousand in the period up to twelve months (2015: AZN 98,172 thousand). Management believes that although current accounts balance of AZN 359,419 thousand as at December 31, 2016 is included under on demand category in maturity table, apparently not all of these amounts will be withdrawn in period of one month. Past experience demonstrates that current account balances have not decreased below AZN 81,000 thousand for the period of last five years. Subsequent to December 31, 2016, the Bank prolonged term deposits originally maturing during period from January to May 2017 for the total amount of AZN 38,000 thousand for a contractual maturity of one year and more.
Shareholders have been providing a continuous support to the Bank in the periods of problems with liquidity. As a result of management’s assessment and the actions being undertaken, the management believes that the Group will be able to cover its liquidity needs over the next twelve months. Term borrowings Management has considered whether gains or losses should arise on initial recognition of loans from governmental and international financial institutions and related lending. The Group obtains long term financing from government and international financial institutions at interest rates at which such institutions ordinarily lend in emerging markets and which may be lower than rates at which the Group could source the funds from local lenders. As the transactions are with unrelated parties, management’s judgement is that these funds and the related lending are at the market interest rates and no initial recognition gains or losses should arise. In making this judgment management also considered that these instruments are a separate market segment.
3. APPLICATION OF NEW AND REVISED INTERNATIONAL FINANCIAL REPORTING STANDARDS (IFRSs)
A number of new standards, amendments to standards and interpretations are not yet effective as at 31 December 2016, and are not applied in preparing these consolidated financial statements. Of these pronouncements, potentially the following will have an impact on the financial position and performance.
The Bank plans to adopt these pronouncements when they become effective: • IFRS 9 Financial Instruments, published in July 2014, replaces the existing guidance in IAS 39
Financial Instruments: Recognition and Measurement. IFRS 9 includes revised guidance on the classification and measurement of financial instruments, including a new expected credit loss model for calculating impairment on financial assets, and the new general hedge accounting requirements. It also carries forward the guidance on recognition and derecognition of financial instruments from IAS 39. IFRS 9 is effective for annual reporting periods beginning on or after 1 January 2018 and will be applied retrospectively with some exemptions. Early adoption of the standard is permitted. The Bank does not intend to adopt this standard early. The Bank has not yet analysed the likely impact of this new standard on its financial position or performance.
Classification - Financial assets IFRS 9 contains a new classification and measurement approach for financial assets that reflects the business model in which assets are managed and their cash flow characteristics. IFRS 9 contains three principal classification categories for financial assets: measured at amortised cost, fair value through other comprehensive income (FVOCI) and fair value through profit or loss (FVTPL). The standard eliminates the existing IAS 39 categories of fair value through profit or loss (FVTPL), held to maturity, loans and receivables and available for sale. Based on its preliminary assessment, the Bank does not believe that the new classification requirements, if applied at 31 December 2016, would have had a material impact on its accounting for trade receivables, investments in debt securities and investments in equity securities that are managed on a fair value basis and held for long-term strategic purposes.

29
Under IFRS 9, derivatives embedded in contracts where the host is a financial asset in the scope of the standard are never bifurcated. Instead, the hybrid financial instrument as a whole is assessed for classification. Based on its preliminary assessment, the Bank believes that the analysis of cash flow characteristics of loans to customers will result in that a part of loans to customers will be classified as financial assets measured at fair value through profit or loss. Impairment - Financial assets and contract assets IFRS 9 replaces the "incurred loss" model in IAS 39 with a forward-looking "expected credit loss" (ECL) model. This will require considerable judgement as to how changes in economic factors affect ECLs, which will be determined on a probability-weighted basis. The new impairment model will apply to financial assets measured at amortised cost or FVOCI, except for investments in equity instruments, and to contract assets, guarantees and credit lines. Under IFRS 9, loss allowances will be measured on either of the following bases:
• 12-month ECLs. These are ECLs that result from possible default events within the 12 months after the reporting date; and
• Lifetime ECLs. These are ECLs that result from all possible default events over the expected life of a financial instrument
Lifetime ECL measurement applies if the credit risk of a financial asset at the reporting date has increased significantly since initial recognition and 12-month ECL measurement applies if it has not. An entity may determine that a financial asset’s credit risk has not increased significantly if the asset has low credit risk at the reporting date. However, lifetime ECL measurement always applies for trade receivables and contract assets without a significant financing component; an entity may choose to apply this policy also for trade receivables and contract assets with a significant financing component. The Bank believes that impairment losses are likely to increase and become more volatile for assets and off balance sheet commitments in the scope of the IFRS 9 impairment model. The Bank has not yet finalised the impairment methodologies that it will apply under IFRS 9. Classification - Financial liabilities IFRS 9 largely retains the existing requirements in IAS 39 for the classification of financial liabilities. However, under IAS 39 all fair value changes of liabilities designated as at FVTPL are recognised in profit or loss, whereas under IFRS 9 these fair value changes are generally presented as follows:
• The amount of change in the fair value that is attributable to changes in the credit risk of the liability is presented in OCI; and
• The remaining amount of change in the fair value is presented in profit or loss. The Group’s preliminary assessment did not indicate any material impact if IFRS 9’s requirements regarding the classification of financial liabilities were applied at December 31, 2016. Disclosures IFRS 9 will require extensive new disclosures, in particular about credit risk, expected credit losses and hedge accounting. The Bank’s preliminary assessment included an analysis to identify data gaps against current processes and the Bank plans to implement the system and controls changes that it believes will be necessary to capture the required data. Transition Changes in accounting policies resulting from the adoption of IFRS 9 will generally be applied retrospectively, except as described below:
• The Bank plans to take advantage of the exemption allowing it not to restate comparative information for prior periods with respect to classification and measurement (including impairment) changes. Differences in the carrying amounts of financial assets and financial liabilities resulting from the adoption of IFRS 9 generally will be recognised in retained earnings and reserves as at 1 January 2018.

30
The following assessments have to be made on the basis of the facts and circumstances that exist at the date of initial application:
• The determination of the business model within which a financial asset is held. • The designation and revocation of previous designations of certain financial assets and
financial liabilities as measured at FVTPL. • The designation of certain investments in equity instruments not held for trading as at
FVOCI.
• IFRS 16 Leases replaces the existing lease accounting guidance in IAS 17 Leases, IFRIC 4 Determining whether an Arrangement contains a lease, SIC-15 Operating Leases – Incentives and SIC-27 Evaluating the Substance of Transactions Involving the Legal Form of a Lease. It eliminates the current dual accounting model for lessees, which distinguishes between on-balance sheet finance leases and off-balance sheet operating leases. Instead, there is a single, on-balance sheet accounting model that is similar to current finance lease accounting. Lessor accounting remains similar to current practice – i.e. lessors continue to classify leases as finance and operating leases. IFRS 16 is effective for annual reporting periods beginning on or after 1 January 2019, early adoption is permitted if IFRS 15 Revenue from Contracts with Customers is also adopted. The Bank does not intend to adopt this standard early. The Bank has not yet analysed the likely impact of this new standard on its financial position or performance.
• IFRS 15 Revenue from Contracts with Customers establishes a comprehensive framework for determining whether, how much and when revenue is recognised. It replaces existing revenue recognition guidance, including IAS 18 Revenue, IAS 11 Construction Contracts and IFRIC 13 Customer Loyalty Programmes. The core principle of the new standard is that an entity recognises revenue to depict the transfer of promised goods or services to customers in an amount that reflects the consideration to which the entity expects to be entitled in exchange for those goods or services. The new standard results in enhanced disclosures about revenue, provides guidance for transactions that were not previously addressed comprehensively and improves guidance for multiple-element arrangements. IFRS 15 is effective for annual reporting periods beginning on or after 1 January 2018, with early adoption permitted. The Bank has not yet analysed the likely impact of this new standard on its financial position or performance.
31
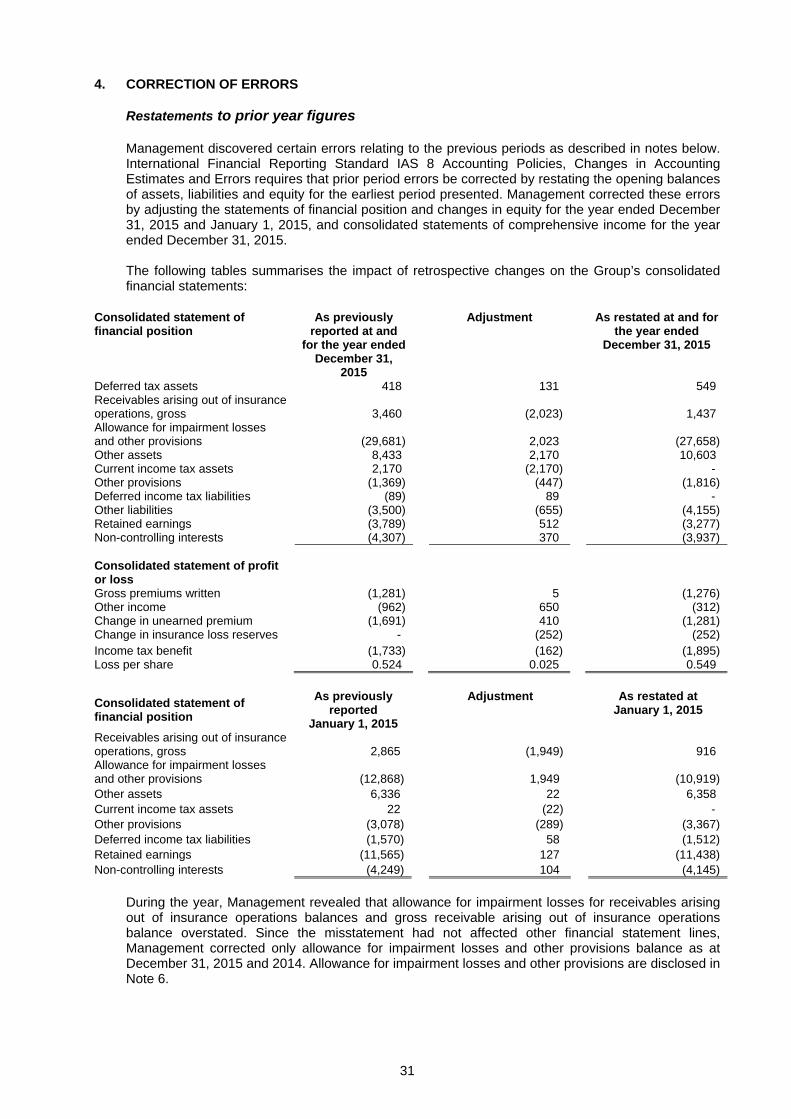
4. CORRECTION OF ERRORS Restatements to prior year figures Management discovered certain errors relating to the previous periods as described in notes below. International Financial Reporting Standard IAS 8 Accounting Policies, Changes in Accounting Estimates and Errors requires that prior period errors be corrected by restating the opening balances of assets, liabilities and equity for the earliest period presented. Management corrected these errors by adjusting the statements of financial position and changes in equity for the year ended December 31, 2015 and January 1, 2015, and consolidated statements of comprehensive income for the year ended December 31, 2015. The following tables summarises the impact of retrospective changes on the Group’s consolidated financial statements:
Consolidated statement of financial position
As previously reported at and
for the year ended December 31,
2015
Adjustment As restated at and for the year ended
December 31, 2015
Deferred tax assets 418 131 549 Receivables arising out of insurance operations, gross 3,460 (2,023) 1,437 Allowance for impairment losses and other provisions (29,681) 2,023 (27,658) Other assets 8,433 2,170 10,603 Current income tax assets 2,170 (2,170) - Other provisions (1,369) (447) (1,816) Deferred income tax liabilities (89) 89 - Other liabilities (3,500) (655) (4,155) Retained earnings (3,789) 512 (3,277) Non-controlling interests (4,307) 370 (3,937) Consolidated statement of profit or loss Gross premiums written (1,281) 5 (1,276) Other income (962) 650 (312) Change in unearned premium (1,691) 410 (1,281) Change in insurance loss reserves - (252) (252) Income tax benefit (1,733) (162) (1,895) Loss per share 0.524 0.025 0.549 Consolidated statement of financial position
As previously reported
January 1, 2015
Adjustment As restated at January 1, 2015
Receivables arising out of insurance operations, gross 2,865 (1,949) 916 Allowance for impairment losses and other provisions (12,868) 1,949 (10,919) Other assets 6,336 22 6,358 Current income tax assets 22 (22) - Other provisions (3,078) (289) (3,367) Deferred income tax liabilities (1,570) 58 (1,512) Retained earnings (11,565) 127 (11,438) Non-controlling interests (4,249) 104 (4,145)
During the year, Management revealed that allowance for impairment losses for receivables arising out of insurance operations balances and gross receivable arising out of insurance operations balance overstated. Since the misstatement had not affected other financial statement lines, Management corrected only allowance for impairment losses and other provisions balance as at December 31, 2015 and 2014. Allowance for impairment losses and other provisions are disclosed in Note 6.

32
5. NET INTEREST INCOME Year ended
December 31, 2016
Year ended December 31,
2015 Interest income comprises: Financial assets recorded at amortized cost:
- unimpaired financial assets 29,375 55,039- impaired financial assets 3,839 5,802
Financial assets at fair value 168 86 Total interest income 33,382 60,927 Financial assets recorded at amortized cost comprises:
Loans to customers 32,396 59,820Due from banks 560 598Other debt securities 258 423
Total interest income on financial assets recorded at amortized cost 33,214 60,841 Financial assets at fair value comprises:
Available-for-sale investments 168 86 Total interest income on financial assets at fair value 168 86 Interest expense comprises: Interest on financial liabilities recorded at amortized cost (26,337) (22,615) Total interest expense (26,337) (22,615) Interest expense on financial liabilities recorded at amortized cost
comprise: Deposits by customers (12,973) (14,586)Loans received from government agencies and foreign credit
institutions (8,172) (5,135)Subordinated debt (4,373) (2,772)Deposits by banks (819) (122)
Total interest expense on financial liabilities recorded at amortized cost (26,337) (22,615) Net interest income before provision for impairment losses on
interest bearing financial assets 7,045 38,312 6. ALLOWANCE FOR IMPAIRMENT LOSSES AND OTHER PROVISIONS
The movements in allowance for impairment losses on interest bearing assets were as follows:
Due from banks Loans and receivables from
customers
Total
January 1, 2015 (restated) 114 10,805 10,919 Additional provisions recognized 207 33,571 33,778Write-off of assets - (18,085) (18,085)Recoveries of assets previously written off - 1,046 1,046 December 31, 2015 (restated) 321 27,337 27,658 Additional provisions recognized 203 48,526 48,729Write-off of assets - (56,423) (56,423)Recoveries of assets previously written off - 5,845 5,845 December 31, 2016 524 25,285 25,809
33
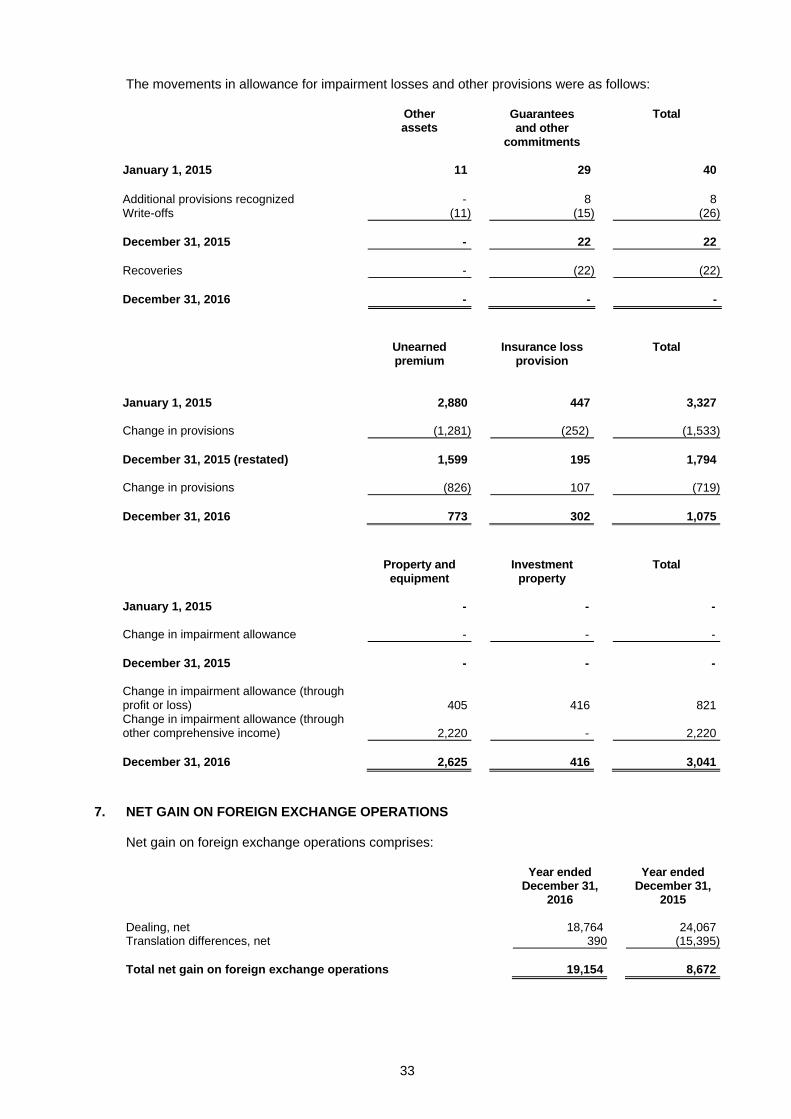
The movements in allowance for impairment losses and other provisions were as follows:
Otherassets
Guarantees and other
commitments
Total
January 1, 2015 11 29 40
Additional provisions recognized - 8 8Write-offs (11) (15) (26)
December 31, 2015 - 22 22 Recoveries - (22) (22) December 31, 2016 - - -
Unearned premium
Insurance loss provision
Total
January 1, 2015 2,880 447 3,327 Change in provisions (1,281) (252) (1,533) December 31, 2015 (restated) 1,599 195 1,794 Change in provisions (826) 107 (719) December 31, 2016 773 302 1,075
Property and equipment
Investment property
Total
January 1, 2015 - - - Change in impairment allowance - - - December 31, 2015 - - - Change in impairment allowance (through profit or loss) 405 416 821Change in impairment allowance (through other comprehensive income) 2,220 - 2,220 December 31, 2016 2,625 416 3,041
7. NET GAIN ON FOREIGN EXCHANGE OPERATIONS Net gain on foreign exchange operations comprises: Year ended
December 31, 2016
Year endedDecember 31,
2015 Dealing, net 18,764 24,067Translation differences, net 390 (15,395) Total net gain on foreign exchange operations 19,154 8,672

34
8. FEE AND COMMISSION INCOME AND EXPENSE Fee and commission income and expense comprise: Year ended
December 31, 2016
Year endedDecember 31,
2015 Fee and commission income: Plastic cards services 6,222 4,866Settlements 2,005 1,695Cash operations 1,312 1,287Foreign exchange operations 121 829Guarantee letters 224 10Other operations 275 261 Total fee and commission income 10,159 8,948
Year ended December 31,
2016
Year endedDecember 31,
2015 Fee and commission expense: Plastic cards services (3,599) (2,700)Settlements (441) (614)Cash operations (333) (564)Reinsurance (128) (378)Guarantees (66) (47)Other operations (399) (482) Total fee and commission expense (4,966) (4,785)
9. ANALYSIS OF PREMIUM AND CLAIMS The analysis of premium and claims for year ended December 31, 2016 is as follows:
Vehicle Property
Other Total
Gross premiums written 975 75 164 1,214 Premium ceded on reinsurance (71) (34) (140) (245) Net premium written 904 41 24 969 Change in provision for unearned premium, net of reinsurance 770 35 21 826 Net premium earned 1,674 76 45 1,795 Gross claims paid (666) (2) (7) (675)Gross claims ceded 68 - - 68 Net claims paid (598) (2) (7) (607) Change in loss provision, net of reinsurance (100) (5) (2) (107) Net claims incurred (698) (7) (9) (714)

35
The analysis of premium and claims for year ended December 31, 2015 is as follows:
Vehicle Property
Other Total
Gross premiums written (restated) 980 124 172 1,276Premium ceded on reinsurance (158) (63) (176) (397) Net premium written (restated) 822 61 (4) 879 Change in provision for unearned premium, net of reinsurance (restated) 1,198 89 (6) 1,281 Net premium earned (restated) 2,020 150 (10) 2,160 Gross claims paid (1,858) (9) (82) (1,949)Gross claims ceded 85 - 12 97 Net claims paid (1,773) (9) (70) (1,852) Change in loss provision, net of reinsurance (restated) 241 1 10 252 Net claims incurred (restated) (1,532) (8) (60) (1,600)
10. OPERATING EXPENSES Operating expenses comprise: Year ended
December 31, 2016
Year endedDecember 31,
2015 Staff costs 13,995 16,588Software costs 2,134 687Depreciation 1,539 1,417Professional services fees 1,458 973Operating lease 1,341 1,508Taxes other than income tax 982 510Fees paid to Deposit Insurance Fund 848 479Communication expense 740 862Amortization 614 653Security costs 584 876Repairs and maintenance 445 504Advertising and marketing 424 1,102Transportation and travel 423 567Office expenses 283 356Utilities 152 175Insurance 78 434Entertainment 33 162Membership fees 27 21Printing 24 27Sponsorship and charity - 243Other operating expenses 954 587 Total operating expenses 27,078 28,731
11. INCOME TAXES
The Group measures and records its current income tax payable and its tax bases in its assets and liabilities in accordance with the tax regulations of the Republic of Azerbaijan where the Group and its subsidiaries operate, which may differ from IFRS. The Group is subject to certain permanent tax differences due to the non-tax deductibility of certain expenses and certain income being treated as non-taxable for tax purposes.

36
Deferred taxes reflect the net tax effects of temporary differences between the carrying amounts of assets and liabilities and tax losses carried forward for financial reporting purposes and the amounts used for tax purposes. Temporary differences as at December 31, 2016 and 2015 relate mostly to different methods/timing of income and expense recognition and tax losses carried foward as well as to temporary differences generated by tax – book bases’ differences for certain assets. The tax rate used for the reconciliations below is the corporate tax rate of 20% (2015: 20%) payable by corporate entities in the Republic of Azerbaijan on taxable profits (as defined) under tax law of the jurisdiction. Temporary differences as at December 31, 2016 and 2015 comprise: December 31,
2016 December 31,
2015 (restated)
January 1, 2015
(restated) Deferred tax assets/(liabilities) in relation to: Loans to customers 2,628 914 528Due from banks 87 62 (47)Investment property 82 - - Receivables arising out of insurance operations 15 - - Other liabilities - 183 73Tax loss carry forwards 7,233 685 - Other assets (18) (34) 107Available-for-sale investments (43) - - Other provisions (50) 34 120Property and equipment and intangible assets (672) (1,295) (2,127)Unrecognized deferred tax assets (9,262) - - Net deferred tax assets/(liabilities) - 549 (1,346) The effective tax rate reconciliation is as follows for the years ended December 31, 2016 and 2015: Year ended
December 31, 2016
Year endedDecember 31,
2015 (restated)
(Loss)/profit before income tax (43,769) (10,498) Tax at the statutory tax rate (2016: 20%) (8,754) (2,100)Tax effect of permanent differences 41 205Unrecognized deferred tax assets 9,262 - Income tax expense/(benefit) 549 (1,895) Current income tax expense - -Deferred tax (benefit)/expense recognized in the current year 549 (1,895) Income tax expense/(benefit) 549 (1,895)
Deferred income tax (assets)/liabilities 2016 2015
(restated) 2014
(restated) As at January 1 – deferred tax liabilities (549) 1,346 1,261 Change in deferred income tax balances recognized
in consolidated profit or loss 549 (1,895)
85 As at December 31 – net deferred tax
(assets)/liabilities - (549)
1,346

37
Temporary differences between the carrying amounts of assets and liabilities for financial reporting purposes and the amounts used for taxation purposes and tax loss carry forward give rise to net deferred tax assets as at 31 December 2016 and 2015. These deferred tax assets are not recognized in these consolidated financial statements for December 31, 2016. Future tax benefits will only be realized if profits will be available against which unused tax losses can be utilized and there are no changes to the law and regulations that adversely affect the Group’s ability to claim deductions in future periods. These future tax benefits are not recognized due to uncertainties concerning their realization. The deductible temporary differences do not expire under current tax legislation. The tax loss carry-forwards expire in 2021.
12. (LOSS)/EARNINGS PER SHARE The (loss)/earnings and weighted average number of ordinary shares used in calculation of basic and diluted (loss)/earnings per share are as follows: Year ended
December 31, 2016
Year endedDecember 31,
2015 (restated)
(Loss)/profit for the year attributable to owners of the Bank (44,145) (8,395) Weighted average number of ordinary shares for the purpose of basic and diluted loss per share 17,331,016 15,290,198 (Loss)/earnings per share – basic and diluted (AZN) (2.547) (0.549)
13. CASH AND BALANCES WITH THE CENTRAL BANK OF THE REPUBLIC OF AZERBAIJAN December 31,
2016 December 31,
2015 Cash on hand 30,168 54,921Balances with the Central Bank of the Republic of Azerbaijan 320,863 222,713 Total cash and balances with the Central Bank of the Republic of
Azerbaijan 351,031 277,634 The obligatory minimum reserve deposits with the Central Bank of the Republic of Azerbaijan (the “CBAR”) included in the balances with the CBAR are restricted balances of AZN 4,923 thousand and AZN 2,057 thousand, respectively, as at December 31, 2016 and 2015. Cash and cash equivalents for the purposes of the consolidated statement of cash flows comprise the following: December 31,
2016 December 31,
2015 Cash and balances with the Central Bank of the Republic of Azerbaijan 351,031 277,634Due from banks with original maturity within 90 days 8,055 10,097 359,086 287,731Less: minimum reserve deposits with the Central Bank of the Republic of
Azerbaijan (4,923) (2,057)Less: commemorative coins (37) (1) Total cash and cash equivalents 354,126 285,673

38
14. DUE FROM BANKS Due from banks comprise: December 31,
2016 December 31,
2015 Blocked deposit placed in the CBAR 180,942 232,818Loans and time deposits 30,867 10,675Correspondent accounts 8,495 10,011 220,304 253,504Less: allowance for impairment losses (524) (321) Total due from banks 219,780 253,183 As at December 31, 2016 and 2015 AZN 180,942 thousand and AZN 232,818 thousand are amounts of deposits placed in the CBAR blocked against the Group’s loans from same party. See Note 23. Movements in the allowance for impairment losses on balances due from banks for the years ended December 31, 2016 and 2015 are disclosed in Note 6. As at December 31, 2016 and 2015 included in balances due from banks are guarantee deposits placed by the Bank for its plastic cards operations totaling AZN 5,107 thousand and AZN 4,497 thousand, respectively.
15. LOANS TO CUSTOMERS Loans to customers comprise: December 31,
2016 December 31,
2015 Loans to customers 285,709 336,537 Less: allowance for impairment losses (25,285) (27,337) Total loans to customers 260,424 309,200 Movements in the allowance for impairment losses for the years ended December 31, 2016 and 2015 are disclosed in Note 6. The table below summarizes carrying value of loans to customers analyzed by type of collateral, rather than the fair value of collateral itself: December 31,
2016 December 31,
2015
Loans collateralized by pledge of real estate, equipment and inventories 141,378 168,214Loans collateralized by guarantees of legal entities 27,665 971 Loans collateralized by deposits 16,653 5,092 Loans collateralized by guarantees of individuals 9,373 58,195 Loans collateralized by vehicles 7,295 26,552 Loans collateralized by pledge of corporate shares 6,999 6,241 Loans collateralized by gold 4,356 6,158Loans collateralized by other 1,555 23,659 Unsecured loans 70,435 41,455
285,709 336,537Less: allowance for impairment losses (25,285) (27,337)
Total loans to customers 260,424 309,200

39
The table below summarizes carrying value of loans to customers analyzed by industry sector: December 31,
2016 December 31,
2015 Analysis by sector: Individuals 117,226 162,567Trade 90,036 113,830 Agriculture 45,104 32,801 Manufacturing 22,190 11,593 Construction 7,691 13,708 Transport and communication 3,462 2,038
285,709 336,537Less: allowance for impairment losses (25,285) (27,337)
Total loans to customers 260,424 309,200 During the years ended December 31, 2016 and 2015 the Group received non-financial assets by taking possession of collateral held as security. As at December 31, 2016 and 2015 such assets in the amount of AZN 976 thousand and AZN 607 thousand, respectively, are included in other assets. Loans to individuals comprise the following products: December 31,
2016 December 31,
2015
Consumer loans 52,908 58,630Mortgage loans 42,708 52,192Car loans 8,727 26,447Plastic cards 8,778 19,597Pawn loans 4,105 5,701
117,226 162,567Less allowance for impairment losses (11,421) (8,830)
Total loans to individuals 105,805 153,737 As at December 31, 2016 the Group granted loans to 16 customers totaling AZN 97,472 thousand, which individually exceeded 10% of the Group’s equity (December 31, 2015: the Group granted loans to 4 customers totaling AZN 21,195 thousand which individually exceeding 10% of Group’s equity). As at December 31, 2016 and 2015 all the loans (100% of total loans to customers) were granted to individuals and companies operating in the Republic of Azerbaijan.

40
Analysis by credit quality of loans outstanding as at December 31, 2016 is as follows:
CorporateLoans
Loans to individuals -
Car Loans
Loans to individuals -
Mortgage loans
Loans to individuals - Consumer
loans
Loans to individuals - Plastic cards
Loans to individuals - Pawn loans
December 31, 2016 Total
Collectively assessedNot past due 19,186 6,268 34,501 15,050 6,669 3,964 85,638 Overdue: - less than 30 days 3,945 1,108 3,082 3,476 208 108 11,927 - 31 to 90 days 1,222 384 1,144 845 155 13 3,763 - 91 to 180 days 1,278 287 989 518 95 7 3,174 - 181 to 360 days 6,419 542 1,003 3,550 475 11 12,000 - over 360 days 5,718 138 920 1,923 928 2 9,629
Total gross collectively assessed loans 37,768 8,727 41,639 25,362 8,530 4,105 126,131
Less: allowance for impairment losses (12,247) (943) (2,829) (5,727) (1,338) (75) (23,159)
Total net collectively assessed loans 25,521 7,784 38,810 19,635 7,192 4,030 102,972
Individually assessed Not past due 129,204 - 1,069 25,856 122 - 156,251 Overdue: - less than 30 days 827 - - 1,675 102 - 2,604 - 31 to 90 days - - - - 24 - 24 - 181 to 360 days 684 - - 15 - - 699
Total gross individually assessed loans 130,715 - 1,069 27,546 248 - 159,578
Less: allowance for impairment losses (1,617) - (3) (490) (16) - (2,126)
Total net individually assessed loans 129,098 - 1,066 27,056 232 - 157,452
Total loans to customers 154,619 7,784 39,876 46,691 7,424 4,030 260,424
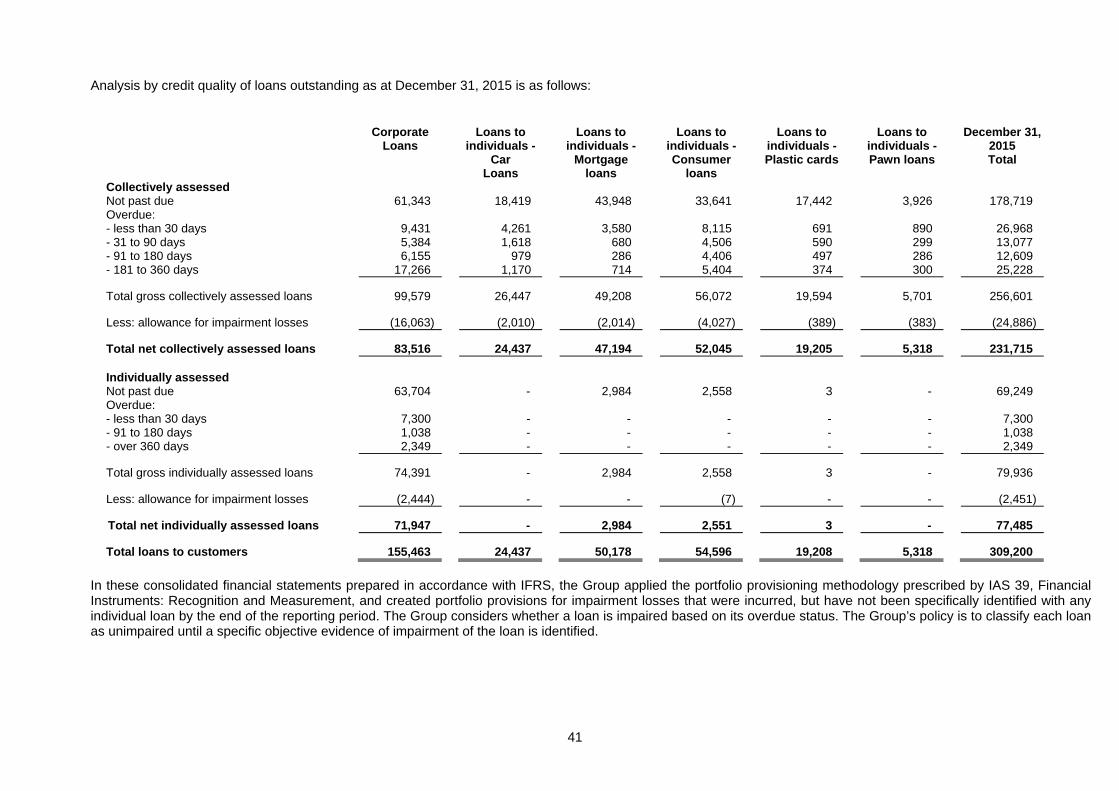
41
Analysis by credit quality of loans outstanding as at December 31, 2015 is as follows:
CorporateLoans
Loans to individuals -
Car Loans
Loans to individuals -
Mortgage loans
Loans to individuals - Consumer
loans
Loans to individuals - Plastic cards
Loans to individuals - Pawn loans
December 31, 2015 Total
Collectively assessedNot past due 61,343 18,419 43,948 33,641 17,442 3,926 178,719 Overdue: - less than 30 days 9,431 4,261 3,580 8,115 691 890 26,968 - 31 to 90 days 5,384 1,618 680 4,506 590 299 13,077 - 91 to 180 days 6,155 979 286 4,406 497 286 12,609 - 181 to 360 days 17,266 1,170 714 5,404 374 300 25,228
Total gross collectively assessed loans 99,579 26,447 49,208 56,072 19,594 5,701 256,601
Less: allowance for impairment losses (16,063) (2,010) (2,014) (4,027) (389) (383) (24,886)
Total net collectively assessed loans 83,516 24,437 47,194 52,045 19,205 5,318 231,715
Individually assessed Not past due 63,704 - 2,984 2,558 3 - 69,249 Overdue: - less than 30 days 7,300 - - - - - 7,300 - 91 to 180 days 1,038 - - - - - 1,038 - over 360 days 2,349 - - - - - 2,349
Total gross individually assessed loans 74,391 - 2,984 2,558 3 - 79,936
Less: allowance for impairment losses (2,444) - - (7) - - (2,451)
Total net individually assessed loans 71,947 - 2,984 2,551 3 - 77,485
Total loans to customers 155,463 24,437 50,178 54,596 19,208 5,318 309,200 In these consolidated financial statements prepared in accordance with IFRS, the Group applied the portfolio provisioning methodology prescribed by IAS 39, Financial Instruments: Recognition and Measurement, and created portfolio provisions for impairment losses that were incurred, but have not been specifically identified with any individual loan by the end of the reporting period. The Group considers whether a loan is impaired based on its overdue status. The Group’s policy is to classify each loan as unimpaired until a specific objective evidence of impairment of the loan is identified.

42
Changes in these estimates could effect the loan impairment provision. For example, to the extent that the net present value of the estimated cash flows differs by one percent, the impairment allowance on loans to customers as at December 31, 2016 would be AZN 2,604 thousand lower/higher (December 31, 2015: AZN 3,092 thousand lower/higher). The table below summarizes an analysis of loans to customers by type of impairment:
December 31, 2016 December 31, 2015 Carrying
value before
allowance
Allowance for
impairment losses
Carrying value
Carrying value before
allowance
Allowance for
impairment losses
Carrying value
Loans to customers individually determined to be impaired 699 (322) 377 3,387 (1,773) 1,614
Loans to customers collectively determined to be impaired 24,803 (19,972) 4,831 37,837 (19,391) 18,446
Unimpaired loans 260,207 (4,991) 255,216 295,313 (6,173) 289,140
Total 285,709 (25,285) 260,424 336,537 (27,337) 309,200
As at December 31, 2016 and 2015 loans to customers included loans totaling AZN 57,533 thousand and AZN 79,307 thousand, respectively, whose terms were renegotiated. Otherwise, these loans would be past due or impaired. Considering economic situation, the Group undertook renegotiation program to maintain good quality of loans to customers. The majority of renegotiated loans was not overdue or impaired as at the date of renegotiation.
16. OTHER DEBT SECURITIES As at December 31, 2016 the Group held term debt securities of three local companies totaling AZN 1,167 thousand with the nominal interest rate of 8%-14% p.a. (December 31, 2015: three local companies totaling AZN 1,310 thousand with the nominal interest rate of 8%-14% p.a.).
17. AVAILABLE-FOR-SALE INVESTMENTS Available-for-sale investments comprise: December 31,
2016 December 31,
2015 Debt securities 16,930 -Equity securities 611 611 Total available-for-sale investments 17,541 611 Equity securities Ownership,% December 31,
2016 Ownership,% December 31,
2015 Milli Kart LLC 10.00% 500 10.00% 500Baku Stock Exchange LLC 6.00% 88 6.00% 88SWIFT - 23 - 23
Total available-for-sale investments 611 611 Available-for-sale investments stated at cost comprise unquoted equity securities. There is no market for these investments and there have not been any recent transactions that provide evidence of the current fair value. In addition, discounted cash flow techniques yield a wide range of fair values due to the uncertainty regarding future cash flows in this industry. However, management believes it unlikely that the fair value at the year end would differ significantly from the carrying amount.

43
18. PROPERTY AND EQUIPMENT Property and equipment comprise:
Land Buildings Furniture and
Equipment Computers Vehicles Leasehold
improve-ments
Other equip-ment
Construc-tion in
progress
Total
At initial/revalued cost January 1, 2015 5,638 17,826 6,755 5,552 3,163 1,117 778 11 40,840
Additions - 98 285 460 394 3 22 - 1,262 Disposals - (362) (94) (18) (220) (45) (2) - (741)
December 31, 2015 5,638 17,562 6,946 5,994 3,337 1,075 798 11 41,361 Additions - 1,001 225 991 45 1 82 - 2,345 Disposals - - (164) (138) (24) (165) (10) - (501) Transfer - (221) 172 - - - 49 - - Impairment losses - (3,344) - - - - - - (3,344) December 31, 2016 5,638 14,998 7,179 6,847 3,358 911 919 11 39,861 Accumulated depreciation - (580) (4,233) (3,775) (1,518) (870) (527) - (11,503) January 1, 2015
Depreciation charge - (144) (479) (488) (210) (43) (53) - (1,417) Eliminated on disposal - 9 52 13 102 45 2 - 223
December 31, 2015 - (715) (4,660) (4,250) (1,626) (868) (578) - (12,697)
Depreciation charge - (211) (453) (633) (196) (31) (15) - (1,539) Eliminated on disposal - - 163 138 18 119 7 - 445 Transfer - 4 (2) - - - (2) - - Impairment losses - 719 - - - - - - 719
December 31, 2016 - (203) (4,952) (4,745) (1,804) (780) (588) - (13,072)
Net book value As at December 31, 2016 5,638 14,795 2,227 2,102 1,554 131 331 11 26,789
As at December 31, 2015 5,638 16,847 2,286 1,744 1,711 207 220 11 28,664

44
As at December 31, 2016 and 2015 included in property and equipment were fully depreciated assets of AZN 6,511 thousand and AZN 5,856 thousand, respectively. Buildings owned by the Group are carried at revalued amounts based on the independent appraiser’s report. As at December 31, 2016 and 2015 the carrying value of these buildings totaled AZN 14,795 thousand and AZN 16,847 thousand, respectively. If the buildings were accounted at historical cost less accumulated depreciation and impairment losses, its carrying value would be AZN 8,760 thousand as at December 31, 2016 (December 31, 2015: AZN 8,933 thousand). The basis used for the appraisal is the market approach. The market approach is based on an analysis of the results of comparable sales of similar buildings.
Details of the Group's buildings and information about the fair value hierarchy as at December 31, 2016 and 2015 are as follows:
December 31, 2016 December 31, 2015 Level 2 Fair value Level 2 Fair value Buildings 14,795 14,795 16,847 16,847 Total 14,795 14,795 16,847 16,847
19. INTANGIBLE ASSETS
Intangible assets comprise: 2016 2015
At cost January 1 7,430 6,659Additions 204 796Disposals (2,154) (25)Transfer from other assets 182 - December 31 5,662 7,430 Accumulated amortization January 1 (4,457) (3,829)Charge for the year (614) (653)Eliminated on disposals 802 25 December 31 (4,269) (4,457) Net book value December 31 1,393 2,973 Intangible assets include software and licenses.

45
20. OTHER ASSETS
Other assets comprise:
December 31, 2016
December 31, 2015
(reclassified)
January 1, 2015
(reclassified) Other financial assets: Receivables on plastic card operations from other
banks 1,109 1,951
1,242Settlements on money transfers 612 945 312Other 36 6 16 1,757 2,902 1,570Other non-financial assets: Prepayments for property and equipment 6,092 2,342 2,075Deferred expenses 2,494 1,004 936Collateral repossessed 976 607 19Prepaid taxes 1,743 3,478 1,112Receivable from employees 323 - 87Deferred acquisition cost 112 122 307Other 497 148 263
12,237 7,701 4,799 Less: allowance for impairment losses - - (11)
Total other assets 13,994 10,603 6,358 Movements in the allowance for impairment losses on other assets for the years ended December 31, 2016 and 2015 are disclosed in Note 6.
21. DEPOSITS BY BANKS
Deposits by banks comprise:
December 31,
2016 December 31,
2015
Loans and deposits from banks and other credit institutions 19,396 2,310Correspondent accounts of banks and other credit institutions 294 300
Total deposits by banks 19,690 2,610
As at December 31, 2016 and 2015 deposits by banks totaling AZN 19,377 thousand and nil (98% and nil of total deposits by banks), respectively, were due to 1 and nil Bank respectively, which represents a significant concentration.
22. DEPOSITS BY CUSTOMERS Deposits by customers comprise: December 31,
2016 December 31,
2015 Repayable on demand 359,419 296,589Time deposits 195,388 266,276 Total deposits by customers 554,807 562,865
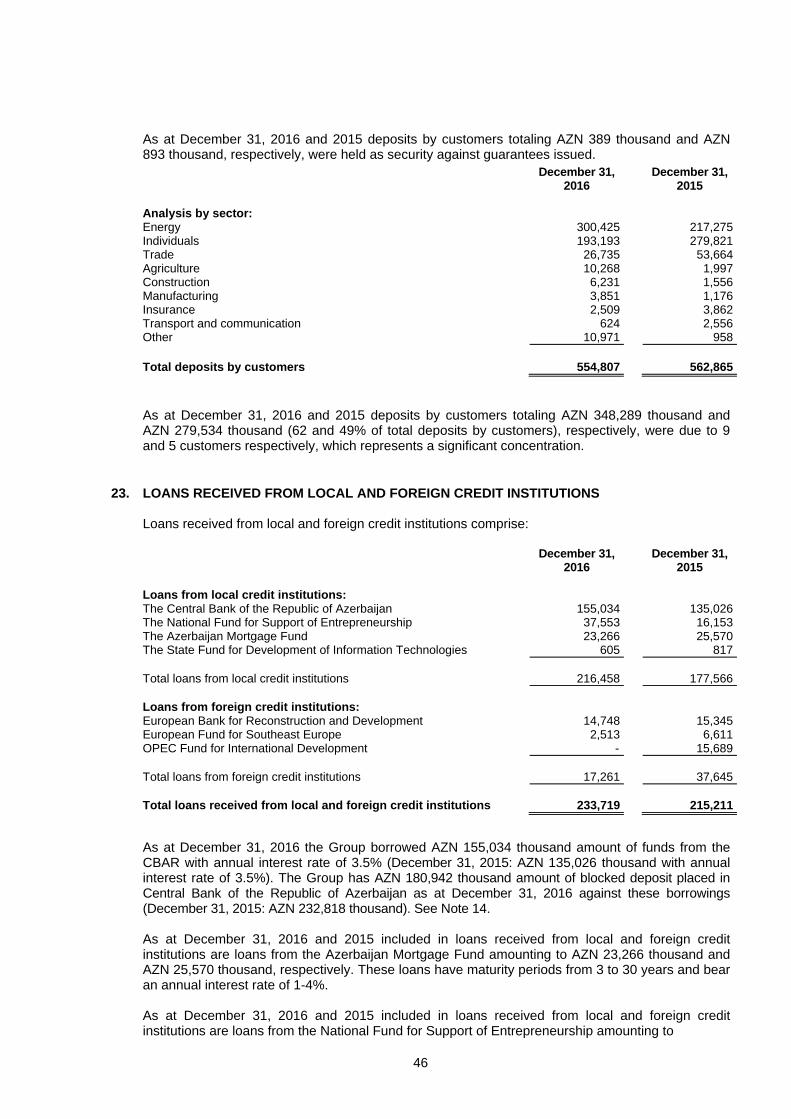
46
As at December 31, 2016 and 2015 deposits by customers totaling AZN 389 thousand and AZN 893 thousand, respectively, were held as security against guarantees issued.
December 31, 2016
December 31, 2015
Analysis by sector: Energy 300,425 217,275 Individuals 193,193 279,821 Trade 26,735 53,664 Agriculture 10,268 1,997 Construction 6,231 1,556 Manufacturing 3,851 1,176 Insurance 2,509 3,862 Transport and communication 624 2,556 Other 10,971 958 Total deposits by customers 554,807 562,865 As at December 31, 2016 and 2015 deposits by customers totaling AZN 348,289 thousand and AZN 279,534 thousand (62 and 49% of total deposits by customers), respectively, were due to 9 and 5 customers respectively, which represents a significant concentration.
23. LOANS RECEIVED FROM LOCAL AND FOREIGN CREDIT INSTITUTIONS Loans received from local and foreign credit institutions comprise: December 31,
2016 December 31,
2015 Loans from local credit institutions: The Central Bank of the Republic of Azerbaijan 155,034 135,026The National Fund for Support of Entrepreneurship 37,553 16,153The Azerbaijan Mortgage Fund 23,266 25,570The State Fund for Development of Information Technologies 605 817 Total loans from local credit institutions 216,458 177,566 Loans from foreign credit institutions: European Bank for Reconstruction and Development 14,748 15,345European Fund for Southeast Europe 2,513 6,611OPEC Fund for International Development - 15,689 Total loans from foreign credit institutions 17,261 37,645 Total loans received from local and foreign credit institutions 233,719 215,211 As at December 31, 2016 the Group borrowed AZN 155,034 thousand amount of funds from the CBAR with annual interest rate of 3.5% (December 31, 2015: AZN 135,026 thousand with annual interest rate of 3.5%). The Group has AZN 180,942 thousand amount of blocked deposit placed in Central Bank of the Republic of Azerbaijan as at December 31, 2016 against these borrowings (December 31, 2015: AZN 232,818 thousand). See Note 14. As at December 31, 2016 and 2015 included in loans received from local and foreign credit institutions are loans from the Azerbaijan Mortgage Fund amounting to AZN 23,266 thousand and AZN 25,570 thousand, respectively. These loans have maturity periods from 3 to 30 years and bear an annual interest rate of 1-4%. As at December 31, 2016 and 2015 included in loans received from local and foreign credit institutions are loans from the National Fund for Support of Entrepreneurship amounting to

47
AZN 37,553 thousand and AZN 16,153 thousand, respectively. These loans have maturity periods up to 10 years and bear an annual interest rate of 1%. On September 20, 2014 the bank signed credit agreement with the State Fund for Development of Information Technologies under the Ministry of Communication and Information Technologies. At December 31, 2016 and 2015 the outstanding balance was AZN 605 thousand and AZN 817 thousand, respectively. The loans are repayable within 5 years from issue date and bear an annual interest rate of 1%.
As at December 31, 2016 and 2015 included in loans received from local and foreign credit institutions are USD denominated loans from the third party foreign credit institutions amounting to AZN 17,261 thousand and AZN 37,645 thousand, respectively. These loans have maturity periods from 2 months to 7 years and bear an annual interest rate of 5.78%-6.13% (December 31, 2015: maturity periods from 3 months to 7 years and bear an annual interest rate of 4.00-5.43%)
As at December 31, 2016 and 2015, loans received from local and foreign credit institutions did not include loans from related party foreign credit institutions.
The Group is obligated to comply with financial covenants in relation to loans received from foreign credit institutions. These covenants include debt to equity ratios and various other financial performance ratios. The Group’s compliance with these financial covenants is disclosed in Note 27.
24. OTHER LIABILITIES Other liabilities comprise: December 31,
2016 December 31,
2015 (restated)
January 1, 2015
(restated) Other financial liabilities: Items in course of settlement 1,208 471 476Payables to shareholders 688 688 688Payables arising out of insurance operations 278 1,186 263Settlements on money transfers and plastic card operations 72 662 386Payables arising out of reinsurance operations 22 101 71Payable to the Deposit Insurance Fund - 323 178Professional fees payable - 74 47Payables on plastic card operations from other banks - 44 55Other 291 283 33 2,559 3,832 2,197Other non-financial liabilities: Taxes other than income tax 68 7 445Deferred income 19 - -Payable to the employees on unused vacations - 262 363Other 67 54 80 Total other liabilities 2,713 4,155 3,085

48
25. SUBORDINATED DEBT
Subordinated debt comprises: Currency Placement
period Nominal interest
rate
December 31, 2016
December 31, 2015
Subordinated debt from foreign credit
institutions - third parties USD 10 years 8.5% 29,280 25,730
Subordinated debt from related parties USD 10 years 10.4% 26,576 23,350 Total subordinated debt 55,856 49,080 In the event of bankruptcy or liquidation of the Group, repayment of this debt is subordinate to the repayments of the Group’s liabilities to all other creditors.
26. SHARE CAPITAL As at December 31, 2016 and 2015 authorized share capital consisted of ordinary shares, with par value of AZN 2.45 each. The holders of ordinary shares are entitled to receive dividends as declared from time to time and are entitled to one vote per share at annual and general meetings of the Bank. On July 15, 2016 a decision was made at the General Meeting of Shareholders to issue 8,163,280 additional shares with nominal value of 2.45 per share in the amount of AZN 20,000 thousand. The share capital increase was done on October 3, 2016.
The Group did not declare dividends on ordinary shares during year ended December 31, 2016 (2015: the Group did not declare and paid dividends on ordinary shares).
27. COMMITMENTS AND CONTINGENCIES
In the normal course of business, the Group is a party to financial instruments with off-balance sheet risk in order to meet the needs of its customers. These instruments, involving varying degrees of credit risk, are not reflected in the consolidated statement of financial position.
The Group’s uses the same credit control and management policies in undertaking off-balance sheet commitments as it does for on-balance operations.
Provision for losses on guarantees and other commitments totaled nil and AZN 22 thousand as at December 31, 2016 and 2015, respectively. As at December 31, 2016 and 2015 contingent liabilities comprise: December 31,
2016 December 31,
2015 Contingent liabilities and credit commitments Commitments on loans and unused credit lines 8,472 18,526Guarantees issued and similar commitments 5,226 2,460
Total contingent liabilities and credit commitments 13,698 20,986
Legal proceedings – In the ordinary course of business, the Group is subject to legal actions and complaints. Management believes that the ultimate liability, if any, arising from such actions or complaints will not have a material adverse effect on the financial condition or the results of future operations.
Taxation – The taxation system in Azerbaijan is relatively new and is characterized by frequent changes in legislation, official pronouncements and court decisions, which are often unclear, contradictory and subject to varying interpretation by different tax authorities. Taxes are subject to review and investigation by various levels of authorities, which have the authority to impose severe fines and interest charges. A tax year generally remains open for review by the tax authorities for

49
three subsequent calendar years; however, under certain circumstances a tax year may remain open longer. These circumstances may create tax risks in the Republic of Azerbaijan that are substantially more significant than in other countries. Management believes that it has provided adequately for tax liabilities based on its interpretations of applicable Azerbaijani tax legislation, official pronouncements and court decisions. However, the interpretations of the relevant authorities could differ and the effect on the financial position, if the authorities were successful in enforcing their interpretations, could be significant. Operating environment – Operational risk is the risk of direct or indirect loss arising from a wide variety of causes associated with the Group’s processes, personnel, technology and infrastructure, and from external factors other than credit, market and liquidity risks, such as those arising from legal and regulatory requirements and generally accepted standards of corporate behavior. Operational risks arise from all of the Group’s operations. The Group’s objective is to manage operational risk so as to balance the avoidance of financial losses and damage to the Group’s reputation with overall cost effectiveness and innovation. In all cases, the Group policy requires compliance with all applicable legal and regulatory requirements. The Group manages operational risk by establishing internal controls that management determines to be necessary in each area of its operations. Business environment - The Group’s operations are primarily located in Azerbaijan. Consequently, the Group is exposed to the economic and financial markets of Azerbaijan, which display characteristics of an emerging market. The legal, tax and regulatory frameworks continue development, but are subject to varying interpretations and frequent changes which, together with other legal and fiscal impediments contribute to the challenges faced by entities operating in Azerbaijan. In addition, the recent significant depreciation of the Azerbaijani Manat, and the reduction in the global price of oil, have increased the level of uncertainty in the business environment. The financial statements reflect management’s assessment of the impact of the Azerbaijani business environment on the operations and the financial position of the Group. The future business environment may differ from management’s assessment. Compliance with covenants – The Group has agreed to comply with certain financial and business covenants in various financing and similar agreements. As at December 31, 2016 the Group was in breach of certain covenants with two financing arrangements with outstanding balances amounting to AZN 17,260 thousand, all of which were included under on demand category in liquidity analysis disclosed in Note 31. On March 10, 2017 and April 05, 2017 the Group received waivers from those financial institutions for breached financing arrangements. Moreover, those amounts included under on demand category in liquidity analysis disclosed in Note 31 due to potential enforcement of cross-default clause.

50
28. TRANSACTIONS WITH RELATED PARTIES Transactions between the Bank and its subsidiaries, which are related parties of the Bank, have been eliminated on consolidation and are not disclosed in this note. Details of balances and transactions between the Group and other related parties are disclosed below:
December 31, 2016 December 31, 2015 Notes Related
party balances
Total category as
per the financial
statements caption
Related party balances
Total category as
per the financial
statements caption
Loans to customers 15 285,709 336,537
- shareholders and entities in which a substantial interest is owned by shareholders of the Group 26,624 9,045
- key management personnel of the Group 2,449 1,393
(25,285)
Allowance for impairment losses 15 (27,337)- shareholders and entities in which a
substantial interest is owned by shareholders of the Group (269) (13)
- key management personnel of the Group
(28) (265)
Deposits by banks 21 19,690 2,610
- shareholders and entities in which a substantial interest is owned by shareholders of the Group
10
346
Deposits by customers 22 554,807 562,865 - shareholders and entities in which a
substantial interest is owned by shareholders of the Group 23,020 3,610
- key management personnel of the Group 1,351 2,442
Other liabilities 24 2,713 4,155
- shareholders and entities in which a substantial interest is owned by shareholders of the Bank - 688
Subordinated debt 25 55,856 49,080
- shareholders and entities in which a substantial interest is owned by shareholders of the Group 26,576 23,350
Commitments on loans and unused credit lines 27 8,472 18,526
- shareholders and entities in which a substantial interest is owned by shareholders of the Group 247 585
- key management personnel of the Group 290 281

51
The remuneration of directors and other members of key management was as follows: Year ended
December 31, 2016 Year ended
December 31, 2015 Related party
transactions Total category
as per the financial
statements caption
Related party transactions
Total category as per the financial
statements caption
Key management personnel
compensation (Note 10): - short-term employee benefits 648 13,995 1,939 16,588
Total 648 13,995 1,939 16,588 Included in the consolidated statement of profit or loss for the years ended December 31, 2016 and 2015 are the following amounts which were recognized in transactions with related parties: Year ended
December 31, 2016 Year ended
December 31, 2015 Notes Related
party transactions
Total category as
per the financial
statements caption
Related party transactions
Total category as
per the financial
statements caption
Interest income 5 33,382 60,927
- shareholders and entities in which a substantial interest is owned by shareholders of the Group 739 555
- key management personnel of the Group 39 176
Interest expense 5 (26,337) (22,615)
- shareholders and entities in which a substantial interest is owned by shareholders of the Group (296) (1,336)
- key management personnel of the Group (158) (118)
Provision for impairment losses on interest
bearing assets 6 (48,729) (33,778) - shareholders and entities in which a
substantial interest is owned by shareholders of the Group (256) 97
- key management personnel of the Group 237 (259)
Fee and commission income 8 10,159 8,948
- shareholders and entities in which a substantial interest is owned by shareholders of the Group 106 212
- key management personnel of the Group 20 86
Operating expenses 10 (27,078) (28,731)
- shareholders and entities in which a substantial interest is owned by shareholders of the Group (163) -
- key management personnel of the Group (648) (1,939)

52
29. FAIR VALUE OF FINANCIAL INSTRUMENTS IFRS defines fair value as the price that would be received to sell an asset or paid to transfer a liability in an orderly transaction between market participants at the measurement date. Fair value of the Group’s financial assets and financial liabilities measured at fair value on a recurring basis Some of the Group's financial assets are measured at fair value as at December 31, 2016 (2015: nil). The following table gives information about how the fair values of these financial assets are determined (in particular, the valuation technique(s) and inputs used). December 31, 2016 December 31, 2015 Carrying value
Fair value(Level 1)
Carrying value
Fair value(Level 1)
Available-for-sale investments 16,930 16,930 - -
As at December 31, 2016 and 2015 available-for-sale financial assets include equity investments of AZN 611 thousand and AZN 611 thousand, respectively, which are carried at cost. There were no transfers between Level 1 and 2 in the period. Fair value of financial assets and financial liabilities that are not measured at fair value on a recurring basis (but fair value disclosures are required) Except as detailed in the following tables, the directors consider that the carrying amounts of financial assets and financial liabilities recognised in the consolidated financial statements approximate their fair values, as they have a short term maturity.
Level 2 Level 3 Total
fair values
Total carrying amount
as at December 31,
2016 ASSETS Due from banks 219,337 - 219,337 219,780 Loans to customers - 252,782 252,782 260,424 Other debt securities 1,142 - 1,142 1,167 LIABILITIES Deposits by banks 19,690 - 19,690 19,690 Deposits by customers 555,785 - 555,785 554,807 Loans received from local and foreign credit institutions 221,972 - 221,972 233,719 Subordinated debt 67,857 - 67,857 55,856

53
Level 2 Level 3 Total
fair values
Total carrying amount
as at December 31,
2015 ASSETS Due from banks 254,492 - 254,492 253,183 Loans to customers - 304,507 304,507 309,200 Other debt securities 1,161 - 1,161 1,310 LIABILITIES Deposits by banks 2,610 - 2,610 2,610 Deposits by customers 564,701 - 564,701 562,865 Loans received from local and foreign credit institutions 206,687 - 206,687 215,211 Subordinated debt 48,649 - 48,649 49,080
The estimates of fair value are intended to approximate the price that would be received to sell an asset or paid to transfer a liability in an orderly transaction between market participants at the measurement date. However given the uncertainties and the use of subjective judgment, the fair value should not be interpreted as being realisable in an immediate sale of the assets or transfer of liabilities. Fair values of financial assets and financial liabilities that are traded in active markets are based on quoted market prices or dealer price quotations. For all other financial instruments the Group determines fair values using other valuation techniques. The objective of valuation techniques is to arrive at a fair value determination that reflects the price that would be received to sell the asset or paid to transfer the liability in an orderly transaction between market participants at the measurement date. Valuation techniques include net present value and discounted cash flow models, comparison to similar instruments for which market observable prices exist. Assumptions and inputs used in valuation techniques include risk-free and benchmark interest rates, credit spreads and other premia used in estimating discount rates, bond and equity prices, foreign currency exchange rates, equity and equity index prices and expected price volatilities and correlations. The objective of valuation techniques is to arrive at a fair value determination that reflects the price of the financial instrument at the reporting date that would have been determined by market participants acting at arm’s length.
Fair value hierarchy
The Group measures fair values using the following fair value hierarchy that reflects the significance of the inputs used in making the measurements: • Level 1: quoted market price (unadjusted) in an active market for an identical instrument
• Level 2: inputs other than quotes prices included within Level 1 that are observable either directly (i.e, as prices) or indirectly (i.e, derived from prices). This category includes instruments valued using: quoted market prices in active markets for similar instruments; quoted prices for similar instruments in markets that are considered less than active; or other valuation techniques where all significant inputs are directly or indirectly observable from market data.
• Level 3: inputs that are unobservable. This category includes all instruments where the valuation technique includes inputs not based on observable data and the unobservable inputs have a significant effect on the instrument’s valuation. This category includes instruments that are valued based on quoted prices for similar instruments where significant unobservable adjustments or assumptions are required to reflect differences between the instruments.
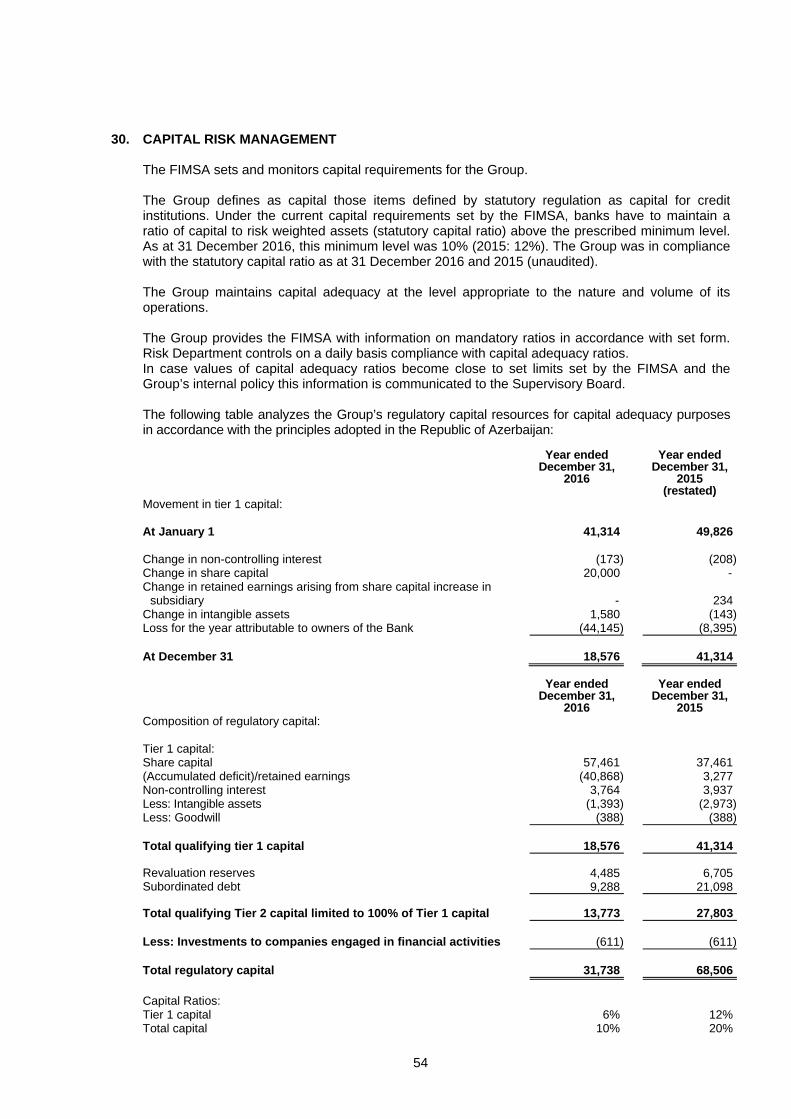
54
30. CAPITAL RISK MANAGEMENT The FIMSA sets and monitors capital requirements for the Group. The Group defines as capital those items defined by statutory regulation as capital for credit institutions. Under the current capital requirements set by the FIMSA, banks have to maintain a ratio of capital to risk weighted assets (statutory capital ratio) above the prescribed minimum level. As at 31 December 2016, this minimum level was 10% (2015: 12%). The Group was in compliance with the statutory capital ratio as at 31 December 2016 and 2015 (unaudited). The Group maintains capital adequacy at the level appropriate to the nature and volume of its operations. The Group provides the FIMSA with information on mandatory ratios in accordance with set form. Risk Department controls on a daily basis compliance with capital adequacy ratios. In case values of capital adequacy ratios become close to set limits set by the FIMSA and the Group’s internal policy this information is communicated to the Supervisory Board. The following table analyzes the Group’s regulatory capital resources for capital adequacy purposes in accordance with the principles adopted in the Republic of Azerbaijan: Year ended
December 31, 2016
Year ended December 31,
2015 (restated)
Movement in tier 1 capital: At January 1 41,314 49,826 Change in non-controlling interest (173) (208)Change in share capital 20,000 - Change in retained earnings arising from share capital increase in
subsidiary - 234Change in intangible assets 1,580 (143)Loss for the year attributable to owners of the Bank (44,145) (8,395) At December 31 18,576 41,314 Year ended
December 31, 2016
Year ended December 31,
2015Composition of regulatory capital: Tier 1 capital: Share capital 57,461 37,461(Accumulated deficit)/retained earnings (40,868) 3,277Non-controlling interest 3,764 3,937Less: Intangible assets (1,393) (2,973)Less: Goodwill (388) (388) Total qualifying tier 1 capital 18,576 41,314 Revaluation reserves 4,485 6,705Subordinated debt 9,288 21,098 Total qualifying Tier 2 capital limited to 100% of Tier 1 capital 13,773 27,803 Less: Investments to companies engaged in financial activities (611) (611) Total regulatory capital 31,738 68,506 Capital Ratios: Tier 1 capital 6% 12%Total capital 10% 20%

55
Quantitative measures established by regulation as at December 31, 2016 to ensure capital adequacy require the Group to maintain minimum amounts and ratios of total 10% and tier 1 capital to risk weighted assets 5% (December 31, 2015: total capital to risk weighted assets 10% and tier 1 to risk weighted assets of 5%). As at December 31, 2016 and 2015, the Group included in the computation of Total capital for Capital adequacy purposes the subordinated debt received, limited to 50% of Tier 1 capital. In the event of bankruptcy or liquidation of the Group, repayment of this debt is subordinate to the repayments of the Group’s liabilities to all other creditors. Reconciliation of total statutory capital to IFRS equity The following unaudited supplementary information is intended to provide additional information to users of the consolidated financial statements of the Group for the year ended 31 December 2016 and is not required under International Financial Reporting Standards (IFRS). The table below provides an overview of the differences in composition of the net assets as at December 31, 2016 presented in the Group`s consolidated financial statements prepared under IFRS and total statutory capital determined under the rules and regulations of the FIMSA.
December 31, 2016
(unaudited)
December 31, 2015
(unaudited)
Total statutory,after deductions 51,677
61,031Reconcilation of total statutory and IFRS equity: - accumulated deficit (3,142) (2,827) - Current year net loss (9,298) (186) - loan loss allowance 8,795 1,786 - interest income (11,105) (2,025) - other income (5,882) (1,057) - fee and commission income - (1,248)
- income tax expense/benefit (412) 1,988 - others (694) 370
- differences arising from deductions 1,662 9,130 - intangible assets 1,137 2,846 - investments 525 6,284 - general allowances (2,999) (3,689) - other capital (17,564) (22,372) - revaluation reserves 4,700 6,705 - others (3,284) - - retained earnings of subsidiaries (459) (349) - non-controlling interest 3,764 3,937Total IFRS equity 25,057 51,380 Tier 1 capital 11% 12%Total capital 17% 17%

56
31. RISK MANAGEMENT POLICIES Management of risk is fundamental to the Group’s banking business and is an essential element of the Group’s operations. The main risks inherent to the Group’s operations are those related to: • Credit exposures; • Liquidity risk; • Market risk. The Group recognizes that it is essential to have efficient and effective risk management processes in place. To enable this, the Group has established a risk management framework, whose main purpose is to protect the Group from risk and allow it to achieve its performance objectives. Through the risk management framework, the Group manages the following risks: Credit risk The Group is exposed to credit risk which is the risk that one party to a financial instrument will fail to discharge an obligation and cause the other party to incur a financial loss. Risk management and monitoring is performed within set limits of authority. These processes are performed by the Credit Committees and the Group’s Management Board. Before any application is made by the Credit Committee, all recommendations on credit processes (borrower’s limits approved, or amendments made to loan agreements, etc.) are reviewed and approved by the branch risk-manager or the Risk Management Department. Daily risk management is performed by the Head of Credit Departments and Branch Credit Divisions. The Group structures the level of credit risk it undertakes by placing limits on the amount of risk accepted in relation to one borrower, or groups of borrowers, and to industry segments. Limits on the level of credit risk by a borrower and a product (by industry sector) are approved quarterly by the Management Board. The exposure to any one borrower including banks and brokers is further restricted by sub-limits covering on and off-balance sheet exposures which are set by the Credit Committee. Actual exposures against limits are monitored daily. Where appropriate, and in the case of most loans, the Group obtains collateral and corporate and personal guarantees. Certain portion of loans is personal lending, where no such facilities can be obtained. Such risks are monitored on a continuous basis and subject to annual or more frequent reviews. Commitments to extend credit represent unused portions of credit in the form of loans, guarantees or letters of credit. The credit risk on off-balance sheet financial instruments is defined as a probability of losses due to the inability of counterparty to comply with the contractual terms and conditions. With respect to credit risk on commitments to extend credit, the Group is potentially exposed to a loss in an amount equal to the total unused commitments. However, the likely amount of the loss is less than the total unused commitments since most commitments to extend credit are contingent upon customers maintaining specific credit standards. The Group applies the same credit policy to the contingent liabilities as it does to the statement of financial position financial instruments, i.e. the one based on the procedures for approving the granting of loans, using limits to mitigate the risk, and current monitoring. The Group monitors the term to maturity of off balance sheet contingencies because longer term commitments generally have a greater degree of credit risk than short-term commitments. Maximum exposure of credit risk The Groups maximum exposure to credit risk varies significantly and is dependent on both individual risks and general market economy risks.

57
The following table presents the maximum exposure to credit risk of balance sheet and off balance sheet financial assets. For financial assets in the consolidated statement of financial position, the maximum exposure is equal to the carrying amount of those assets prior to any offset. The Group’s maximum exposure to credit risk under contingent liabilities and commitments to extend credit, in the event of non-performance by the other party where all counterclaims, collateral or security prove valueless, is represented by the contractual amounts of those instruments.
Maximum exposure
December 31, 2016 Balances with the CBAR 320,863Due from banks 219,780Loans to customers 260,424Other debt securities 1,167Available-for-sale investments 17,541Receivables arising out of insurance operations 255Other financial assets 1,757Commitments on loans and unused credit lines 8,472Guarantees issued and similar commitments 5,226 December 31, 2015 Balances with the CBAR 222,713Due from banks 253,183Loans to customers 309,200Other debt securities 1,310Available-for-sale investments 611Receivables arising out of insurance operations 1,437Other financial assets 2,902Commitments on loans and unused credit lines 18,526Guarantees issued and similar commitments 2,460 Off – balance sheet risk The Group applies fundamentally the same risk management policies for off-balance sheet risks as it does for its on-balance sheet risks. In the case of commitments to lend, customers and counterparties will be subject to the same credit management policies as for loans and advances. Collateral may be sought depending on the strength of the counterparty and the nature of the transaction.

58
Geographical concentration The Risk Management Committee exercises control over the risk in the legislation and regulatory arena and assesses its influence on the Group’s activity. This approach allows the Group to minimize potential losses from the investment climate fluctuations in the Republic of Azerbaijan. The geographical concentration of assets and liabilities is set out below:
The Republic of Azerbaijan
OECD countries Other non-OECD countries
December 31,2016 Total
NON-DERIVATIVE FINANCIAL
ASSETS Cash and balances with the Central
Bank of the Republic of Azerbaijan 351,031 - - 351,031Due from banks 206,883 12,299 598 219,780Loans to customers 260,424 - - 260,424Other debt securities 1,167 - - 1,167Available-for-sale investments 17,541 - - 17,541Receivables arising out of insurance
operations 255 - - 255Other financial assets 1,050 697 10 1,757 Total non-derivative financial assets 838,351 12,996 608 851,955 NON-DERIVATIVE FINANCIAL
LIABILITIES Deposits by banks 19,689 1 - 19,690Deposits by customers 550,523 940 3,344 554,807Loans received from local and foreign
credit institutions 216,458 17,261 - 233,719Other provisions 302 - - 302Other financial liabilities 2,524 35 - 2,559Subordinated debt - 55,856 - 55,856 Total non-derivative financial
liabilities 789,496 74,093 3,344 866,933 NET POSITION ON NON-DERIVATIVE
FINANCIAL INSTRUMENTS 48,855 (61,097) (2,736)
The Republic of Azerbaijan
OECD countries Other non-OECD countries
December 31,2015 Total
NON-DERIVATIVE FINANCIAL ASSETS Cash and balances with the Central Bank of
the Republic of Azerbaijan 277,634 - - 277,634Due from banks 238,818 14,133 232 253,183Loans to customers 309,200 - - 309,200Available-for-sale investments 611 - - 611Other debt securities 1,287 23 - 1,310Receivables arising out of insurance
operations 1,437 - - 1,437Other financial assets 2,019 716 167 2,902 Total non-derivative financial assets 831,006 14,872 399 846,277 NON-DERIVATIVE FINANCIAL
LIABILITIES Deposits by banks 2,610 - - 2,610Deposits by customers 558,349 1,595 2,921 562,865Loans received from local and foreign credit
institutions 177,566 37,645 - 215,211Other provisions 217 - - 217Other financial liabilities 3,248 524 60 3,832

59
Subordinated debt - 49,080 - 49,080 Total non-derivative financial liabilities 741,990 88,844 2,981 833,815 NET POSITION ON NON-DERIVATIVE
FINANCIAL INSTRUMENTS 89,016 (73,972) (2,582)
Collateral
The amount and type of collateral required depends on an assessment of the credit risk of the counterparty. Guidelines are implemented regarding the acceptability of types of collateral and valuation parameters.
The main types of collateral obtained are as follows: • For commercial lending, charges over real estate properties, inventory • For retail lending, mortgages over residential properties. At December 31, 2016 and 2015, the fair value of collateral that the Bank holds related to loans individually determined to be impaired amounts to AZN 500 thousand and AZN 11,012 thousand, respectively. The collateral consists of real estate and equipment. At December 31, 2016 the Group has in possession a property with a carrying value of AZN 976 thousand (December 31, 2015: AZN 607 thousand), which the Group is in the process of selling. Management monitors the market value of collateral, requests additional collateral in accordance with the underlying agreement, and monitors the market value of collateral obtained during its review of the adequacy of the allowance for impairment losses.

60
Credit quality by class of financial asset The following table details credit ratings of other financial assets held by the Group that are neither past due nor impaired: December 31, 2016 AA A BBB <BBB Not
Rated Total
Balances with the Central Bank of the Republic of Azerbaijan (excluding cash on hand) - - - 320,863 - 320,863
Due from banks - 5,109 1,945 208,783 3,943 219,780Loans to customers - - - - 241,889 241,889Other debt securities - - - - 1,167 1,167Available-for-sale investments - - - 17,541 - 17,541Receivables arising out of insurance
operations - - - - 255 255Other financial assets - - 341 57 1,359 1,757 December 31, 2015 AA A BBB <BBB Not
rated Total
Balances with the Central Bank of the Republic of Azerbaijan (excluding cash on hand) - - - 222,713 - 222,713Due from banks - 13,830 115 233,179 6,059 253,183Loans to customers - - - - 236,444 236,444Other debt securities - - - - 1,310 1,310Receivables arising out of insurance
operations - - - - 1,437 1,437Other financial assets - 347 369 117 2,069 2,902 Financial assets other than loans to customers are graded according to the current credit rating they have been issued by an internationally regarded agency such as Fitch, Standard & Poor’s and Moody’s. The highest possible rating is AAA. Investment grade financial assets have ratings from AAA to BBB. Financial assets which have ratings lower than BBB are classed as speculative grade. In these consolidated financial statements ratings of financial assets and financial liabilities converted to Fitch ratings. As at December 31, 2016 and 2015 the total balances with the Central Bank of the Republic of Azerbaijan amounted to AZN 501,805 thousand and AZN 455,531 thousand, respectively. The most recently published international rating (Moody’s ratings) for the Republic of Azerbaijan is Ba1 (2015: Ba1). Liquidity risk Liquidity risk refers to the availability of sufficient funds to meet deposit withdrawals and other financial commitments associated with financial instruments as they actually fall due. The ALMC controls these types of risks by means of maturity analysis, determining the Group’s strategy for the next financial period. Current liquidity is managed by the Treasury Department, which deals in the money markets for current liquidity support and cash flow optimization. In order to manage liquidity risk, the Group performs daily monitoring of future expected cash flows on clients’ and banking operations, which is a part of assets/liabilities management process. The Management Board sets limits on the minimum proportion of maturing funds available to meet deposit withdrawals and on the minimum level on interbank and other borrowing facilities that should be in place to cover withdrawals at unexpected levels of demand.

61
An analysis of the liquidity and interest rate risk is presented in the following table. The presentation below is based upon the information provided internally to key management personnel of the Group.
Weighted average effective
interest rate
Up to 1 month
1 month to 3 months
3 months to 1 year
1 year to 5 years
Over 5 years
Maturity undefined
December 31, 2016
Total
NON-DERIVATIVE FINANCIAL ASSETS Fixed interest rate instruments Due from banks* 0.66% 176 21,163 26,018 163,402 - - 210,759Loans to customers 10.71% 15,731 21,458 72,380 81,928 68,927 - 260,424Other debt securities 67 - - 1,100 - - 1,167Available-for-sale investments 5.00% 16,930 - - - - - 16,930
Total fixed interest bearing financial assets 32,904 42,621 98,398 246,430 68,927 - 489,280
Non-interest bearing financial assets Cash and balances with the Central Bank
of the Republic of Azerbaijan 351,031 - - - - - 351,031Due from banks 9,021 - - - - - 9,021Available-for-sale investments - - - - - 611 611Receivables arising out of insurance
operations 255 - - - - - 255Other financial assets 1,757 - - - - - 1,757
Total non-interest bearing financial assets 362,064 - - - - 611 362,675
Total non-derivative financial assets 394,968 42,621 98,398 246,430 68,927 611 851,955 NON-DERIVATIVE FINANCIAL
LIABILITIES Fixed interest rate instruments Deposits by banks 12.49% 978 18,400 18 - - - 19,396Deposits by customers 4.34% 12,698 31,254 135,331 16,096 9 - 195,388Loans received from local and foreign
credit institutions 3.11% 33 - 20,000 173,159 23,266 - 216,458
Total fixed interest bearing financial liabilities 13,709 49,654 155,349 189,255 23,275 - 431,242
Variable interest rate instruments Loans received from local and foreign
credit institutions 0.43% 17,261 - - - - - 17,261Subordinated debt 9.44% 649 - - - 55,207 - 55,856
Total variable interest bearing financial liabilities 17,910 - - - 55,207 - 73,117
Non-interest bearing financial liabilities Deposits by banks 294 - - - - - 294Deposits by customers 359,419 - - - - - 359,419Other provisions 302 - - - - - 302Other financial liabilities 2,559 - - - - - 2,559
Total non-interest bearing financial liabilities 362,574 - - - - - 362,574
Total non-derivative financial liabilities 394,193 49,654 155,349 189,255 78,482 - 866,933 Interest sensitivity gap 1,285 (7,033) (56,951) 57,175 (9,555) Cumulative interest sensitivity gap 1,285 (5,748) (62,699) (5,524) (15,079) Liquidity gap 775 (7,033) (56,951) 57,175 (9,555) Cumulative liquidity gap 775 (6,258) (63,209) (6,034) (15,589)

62
* AZN 163,402 thousand blocked deposit placed in the Central Bank of Azerbaijan is included under “1 year to 5 years”
category as at December 31, 2016, which are collateralized against the Group’s loans in the amount of AZN 155,034 thousand as disclosed in Note 23. The Central Bank of Azerbaijan released USD 36,279 thousand
(AZN 63,314 thousand) amount of blocked deposit on February 2017.

Weighted
average effective
interest rate
Up to 1 month
1 month to 3 months
3 months to 1 year
1 year to 5 years
Over 5 years
Maturity undefined
December 31, 2015
Total
NON-DERIVATIVE FINANCIAL ASSETS Fixed interest rate instruments Due from banks 4.16% 86 - 406 9,862 - - 10,354 Loans to customers 16.34% 17,796 29,143 128,425 111,553 14,396 7,887 309,200 Other debt securities 10.33% - - - 1,310 - - 1,310
Total fixed interest bearing financial assets 17,882 29,143 128,831 122,725 14,396 7,887 320,864
Non-interest bearing financial assets Cash and balances with the Central Bank
of the Republic of Azerbaijan 277,634 - - - - - 277,634 Due from banks 10,011 - - 232,818 - - 242,829 Available-for-sale investments - - - - - 611 611 Receivables arising out of insurance
operations - 1,437 - - - - 1,437 Other financial assets 2,902 - - - - - 2,902
Total non-interest bearing financial assets 290,547 1,437 - 232,818 - 611 525,413
Total non-derivative financial assets 308,429 30,580 128,831 355,543 14,396 8,498 846,277 NON-DERIVATIVE FINANCIAL
LIABILITIES Fixed interest rate instruments Deposits by customers 7.31% 7,472 45,829 122,011 90,958 6 - 266,276 Loans received from local and foreign
credit institutions 3.24% - 680 47 151,970 24,869 - 177,566
Total fixed interest bearing financial liabilities 7,472 46,509 122,058 242,928 24,875 - 443,842
Variable interest rate instruments Loans received from local and foreign
credit institutions 4.74% 22,074 - 15,571 - - - 37,645 Subordinated debt 7.83% 49,080 - - - - - 49,080
Total variable interest bearing financial liabilities 71,154 - 15,571 - - - 86,725
Non-interest bearing financial liabilities Deposits by banks 2,610 - - - - - 2,610 Deposits by customers 296,589 - - - - - 296,589 Other provisions 217 - - - - - 217 Other financial liabilities 3,435 - 397 - - - 3,832
Total non-interest bearing financial liabilities 302,851 - 397 - - - 303,248
Total non-derivative financial liabilities 381,477 46,509 138,026 242,928 24,875 - 833,815 Interest sensitivity gap (60,744) (17,366) (8,798) (120,203) (10,479) Cumulative interest sensitivity gap (60,744) (78,110) (86,908) (207,111) (217,590) Liquidity gap (73,048) (15,929) (9,195) 112,615 (10,479) Cumulative liquidity gap (73,048) (88,977) (98,172) 14,443 3,964

64
In accordance with Azerbaijani legislation, individuals and legal entities can withdraw their term deposits at any time, forfeiting in most of the cases the accrued interest. These deposits are classified in accordance with their stated maturity dates. The Management of the Group does not expect that individuals and legal entities withdraw their term deposits before their stated maturity dates. As at December 31, 2016, the Group’s current assets was AZN 535,987 thousand and non-current assets AZN 356,930 thousand (December 31, 2015: current assets AZN 467,840 thousand, non-current assets AZN 367,897 thousand). As at December 31, 2016, the Group’s current liabilities was AZN 599,196 thousand and non-current liabilities AZN 268,664 thousand (December 31, 2015: current liabilities AZN 566,012 thousand, non-current assets AZN 269,725 thousand). The amounts included above for variable interest rate instruments for both non-derivative financial assets and liabilities is subject to change if changes in variable interest rates differ to those estimates of interest rates determined at the end of the reporting period. Management believes that in spite of a substantial portion of customer accounts being on demand, diversification of these deposits by number and type of depositors, and the past experience of the Group would indicate that these customer accounts provide a long-term and stable source of funding for the Group. Customer accounts are classified in the above analysis based on contractual maturities. However, in accordance with the Civil Code of the Republic of Azerbaijan, individuals have a right to withdraw their deposits prior to maturity if they forfeit their right to a certain portion of accrued interest. Management believes that although current accounts balance of AZN 359,419 thousand as of December 31, 2016 is included under on demand category in maturity table, apparently not all of these amounts will be withdrawn in period of one month. Past experience demonstrates that current account balances have not decreased below AZN 81,000 thousand for the period of last four years.

65
The following tables detail the Group’s remaining contractual maturity for its non-derivative financial liabilities with agreed repayment periods. The tables have been drawn up based on the undiscounted cash flows of financial liabilities based on the earliest date on which the Group can be required to pay. The tables include both interest and principal cash flows. To the extent that interest flows are floating rate, the undiscounted amount is derived from interest rate curves at the end of the reporting period. The contractual maturity is based on the earliest date on which the Group may be required to pay.
Weighted average effective interest
rate
Up to 1 month
1 month to 3
months
3 months to 1 year
1 year to 5 years
Over 5 years
December 31, 2016 Total
Fixed interest rate instruments Deposits by banks 12.49% 1,170 18,413 18 - - 19,601Deposits by customers 4.34% 13,387 32,500 138,157 16,397 11 200,452Loans received from local and foreign
credit institutions 3.11% 639 1,210 24,587 180,063 39,934 246,433
Total fixed interest bearing financial liabilities
15,196 52,123 162,762 196,460 39,945 466,486
Variable interest rate instruments Loans received from local and foreign
credit institutions 0.43% 190 2,641 4,515 11,490 331 19,167Subordinated debt 9.44% 1,086 872 3,924 20,928 68,097 94,907
Total variable interest bearing
financial liabilities
1,276 3,513 8,439 32,418 68,428 114,074
Non-interest bearing instruments Deposits by banks 294 - - - - 294Deposits by customers 359,419 - - - - 359,419Other provisions 302 - - - - 302Other financial liabilities 2,559 - - - - 2,559Liabilities on financial guarantees 5,226 - - - - 5,226Commitments on loans and unused
credit lines
8,472 - - - - 8,472
Total non-interest bearing financial liabilities and commitments
376,272 - - - - 376,272
Total financial liabilities and
commitments
392,744 55,636 171,201 228,878 108,373 956,832

66
Weighted average effective interest
rate
Up to 1 month
1 month to 3
months
3 months to 1 year
1 year to 5 years
Over 5 years
December 31, 2015 Total
Fixed interest rate instruments Deposits by customers 7.31% 8,734 54,158 129,282 100,321 8 292,503 Loans received from local and foreign
credit institutions 3.24% 85 1,963 3,706 162,413 45,139 213,306
Total fixed interest bearing financial liabilities 8,819 56,121 132,988 262,734 45,147 505,809
Variable interest rate instruments Loans received from local and foreign
credit institutions 4.74% 23,475 - 16,305 - - 39,780 Subordinated debt 7.83% 49,080 - - - - 49,080
Total variable interest bearing
financial liabilities 72,555 - 16,305 - - 88,860
Non-interest bearing instruments Deposits by banks 2,610 - - - - 2,610
Deposits by customers
296,589 - - - - 296,589 Other provisions 217 - - - - 217Other financial liabilities 3,435 - 397 - - 3,832Liabilities on financial guarantees 2,460 - - - - 2,460 Commitments on loans and unused
credit lines 18,526 - - - - 18,526
Total non-interest bearing financial liabilities and commitments 323,837 - 397 - - 324,234
Total financial liabilities and
commitments 405,211 56,121 149,690 262,734 45,147 918,903 In accordance with Azerbaijani legislation, individuals and legal entities can withdraw their term deposits at any time, forfeiting in most of the cases the accrued interest. These deposits are classified in accordance with their stated maturity dates. The Management of the Group does not expect that individuals and legal entities withdraw their term deposits before their stated maturity dates. The amounts included above for financial guarantee contracts are the maximum amounts the Group could be forced to settle under the arrangement for the full guaranteed amount if that amount is claimed by the counterparty to the guarantee. Based on expectations at the end of the reporting period, the Group considers that it is more likely than not that no amount will be payable under the arrangement. However, this estimate is subject to change depending on the probability of the counterparty claiming under the guarantee which is a function of the likelihood that the financial receivables held by the counterparty which are guaranteed suffer credit losses. The maximum amount the Group could be forced to settle under the financial guarantee contracts if the fully guaranteed amount is claimed by the counterparty to the guarantee as at December 31, 2016 and 2015 is AZN 5,226 thousand and AZN 2,460 thousand, respectively. Financing facilities Market risk Market risk is that the risk that the Group’s earnings or capital or its ability to meet business objectives will be adversely affected by changes in the level or volatility of market rates or prices. Market risk covers interest rate risk, currency risk, credit spreads, commodity prices and equity prices that the Group is exposed to. There have been no changes as to the way

67
the Group measures risk or to the risk it is exposed or the manner in which these risks are managed and measured. The Group is exposed to interest rate risks as entities in the Group borrow funds at both fixed and floating rates. The risk is managed by the Group maintaining an appropriate mix between fixed and floating rate borrowings. The ALMC also manages interest rate and market risks by matching the Group’s interest rate position, which provides the Group with a positive interest margin. The Treasury Department conducts monitoring of the Group’s current financial performance, estimates the Group’s sensitivity to changes in interest rates and its influence on the Group’s profitability. The majority of the Group’s loan contracts and other financial assets and liabilities that bear interest are either fixed and contain clauses enabling the interest rate to be changed at the option of the lender. The Group monitors its interest rate margin and consequently does not consider itself exposed to significant interest rate risk or consequential cash flow risk. Interest rate sensitivity The Group manages fair value interest rate risk through periodic estimation of potential losses that could arise from adverse changes in market conditions. The Treasury Department conducts monitoring of the Group’s current financial performance, estimates the Group’s sensitivity to changes in fair value interest rates and its influence on the Group’s profitability. The sensitivity analyses below have been determined based on the exposure to interest rates for both derivatives and non-derivative instruments at the end of the reporting period. For floating rate liabilities, the analysis is prepared assuming the amount of the liability outstanding at the end of the reporting period was outstanding for the whole year. A 100 basis point increase or decrease is used when reporting interest rate risk internally to key management personnel and represents management’s assessment of the reasonably possible change in interest rates. If interest rates had been 100 basis points higher/lower and all other variables were held constant, the Group’s profit for the year ended December 31, 2016 and equity would decrease/increase by AZN 620 thousand (2015: profit and equity increase/decrease by AZN 681 thousand). This is mainly attributable to the Group’s exposure to interest rates on its variable rate borrowings. Currency risk Currency risk is defined as the risk that the value of a financial instrument will fluctuate due to changes in foreign exchange rates. The Group is exposed to the effects of fluctuations in the prevailing foreign currency exchange rates on its financial position and cash flows. The ALMC controls currency risk by management of the open currency position on the estimated basis of AZN devaluation and other macroeconomic indicators, which gives the Group an opportunity to minimize losses from significant currency rates fluctuations toward its national currency. The Treasury Department performs daily monitoring of the Group’s open currency position with the aim to match the requirements of the Central Bank of the Republic of Azerbaijan.

68
The Group’s exposure to foreign currency exchange rate risk is presented in the table below:
AZN USD USD 1 =
AZN 1.7707
EUR EUR 1 =
AZN 1.8644
Other currency
December 31, 2016 Total
NON-DERIVATIVE FINANCIAL ASSETS Cash and balances with the Central Bank of
the Republic of Azerbaijan 43,183 295,318 11,846 684 351,031Due from banks 1,056 212,013 145 6,566 219,780Loans to customers 224,676 35,633 115 - 260,424Other debt securities 1,167 - - - 1,167Available-for-sale investments 588 16,953 - - 17,541Receivables arising out of insurance
operations 255 - - - 255Other financial assets 852 853 17 35 1,757
Total non-derivative financial assets 271,777 560,770 12,123 7,285 851,955 NON-DERIVATIVE FINANCIAL
LIABILITIES Deposits by banks 19,505 180 4 1 19,690Deposits by customers 54,037 487,403 11,936 1,431 554,807Loans received from local and foreign credit
institutions 216,459 17,260 - - 233,719Other provisions 302 - - - 302Other financial liabilities 1,347 1,003 144 65 2,559Subordinated debt - 55,856 - - 55,856
Total non-derivative financial liabilities 291,650 561,702 12,084 1,497 866,933
OPEN BALANCE SHEET POSITION (19,873) (932) 39 5,788 Derivative financial instruments Gross settled: - foreign exchange forward contracts (4,461) 4,736 - -
OPEN POSITION (24,334) 3,804 39 5,788

69
AZN USD USD 1 =
AZN 1.5594
EUR EUR 1 =
AZN 1.7046
Other currency December 31, 2015 Total
NON-DERIVATIVE FINANCIAL ASSETS
Cash and balances with the Central Bank of the Republic of Azerbaijan 25,432 236,950 14,593 659 277,634
Due from banks 5,823 241,282 835 5,243 253,183Loans to customers 203,911 104,718 571 - 309,200Other debt securities 1,310 - - - 1,310Available-for-sale investments 588 23 - - 611Receivables arising out of insurance
operations 1,437 - - - 1,437Other financial assets 1,701 1,153 23 25 2,902
Total non-derivative financial assets 240,202 584,126 16,022 5,927 846,277 NON-DERIVATIVE FINANCIAL
LIABILITIES Deposits by banks 385 2,170 53 2 2,610Deposits by customers 30,166 511,914 15,966 4,819 562,865Loans received from local and foreign
credit institutions 177,566 37,645 - - 215,211Other provisions 217 - - - 217Other financial liabilities 2,458 1,181 181 12 3,832Subordinated debt - 49,080 - - 49,080
Total non-derivative financial liabilities 210,792 601,990 16,200 4,833 833,815
OPEN BALANCE SHEET POSITION 29,410 (17,864) (178) 1,094 Derivative financial instruments Net settled: - foreign exchange forward contracts - 694 - (694)
OPEN POSITION 29,410 (17,170) (178) 400 Currency risk sensitivity The following table details the Group’s sensitivity to a (2016: 50%) increase and decrease in the AZN against the relevant foreign currencies. (2015: 50%) is the sensitivity rate used when reporting foreign currency risk internally to key management personnel and represents management’s assessment of the reasonably possible change in foreign exchange rates. The sensitivity analysis includes only outstanding foreign currency denominated monetary items and adjusts their translation at the period end for a 50% (2015: 50%) change in foreign currency rates. A positive number below indicates an increase in profit and other equity where the AZN strengthens (2015: 50%) against the relevant currency. For a (2015: 50%) weakening of the AZN against the relevant currency, there would be a comparable impact on the profit and other equity, and the balances below would be negative.
USD impact EUR impact 2016 2015 2016 2015
Profit or loss and equity, net of tax 1,522 (6,868) (i) 16 (71)
(i) This is mainly attributable to the exposure outstanding on USD and EUR receivables and payables in the Group at the end of the reporting period.
Limitations of sensitivity analysis The above tables demonstrate the effect of a change in a key assumption while other assumptions remain unchanged. In reality, there is a correlation between the assumptions and other factors. It should also be noted that these sensitivities are non-linear, and larger or smaller impacts should not be interpolated or extrapolated from these results.

70
The sensitivity analyses do not take into consideration that the Group’s assets and liabilities are actively managed. Additionally, the financial position of the Group may vary at the time that any actual market movement occurs. For example, the Group’s financial risk management strategy aims to manage the exposure to market fluctuations. As investment markets move past various trigger levels, management actions could include selling investments, changing investment portfolio allocation and taking other protective action. Consequently, the actual impact of a change in the assumptions may not have any impact on the liabilities, whereas assets are held at market value in the statement of financial position. In these circumstances, the different measurement bases for liabilities and assets may lead to volatility in shareholder equity. Other limitations in the above sensitivity analyses include the use of hypothetical market movements to demonstrate potential risk that only represent the Group’s view of possible near-term market changes that cannot be predicted with any certainty; and the assumption that all interest rates move in an identical fashion. Operational risk Operational risk is the risk of loss arising from systems failure, human error, fraud or external events. When controls fail to perform, operational risks can cause damage to reputation, have legal or regulatory implications, or lead to financial loss. The Group cannot expect to eliminate all operational risks, but it endeavors to manage these risks through a control framework and by monitoring and responding to potential risks. Controls include effective segregation of duties, access, authorization and reconciliation procedures, staff education and assessment processes.
32. SUBSEQUENT EVENTS Subsequently, the Group paid subordinated debts in amount USD 11,500 thousand and USD 156 thousand on January 31, 2017 and February 2, 2017 respectively. On March 28, 2017 in General Meeting of Shareholders it's decided to increase share capital in amount AZN 20,000 thousand.