open journal of energy efficiency, 2020, 9, 94-110 https
TRANSCRIPT
Open Journal of Energy Efficiency, 2020, 9, 94-110 https://www.scirp.org/journal/ojee
ISSN Online: 2169-2645 ISSN Print: 2169-2637
DOI: 10.4236/ojee.2020.92007 Apr. 29, 2020 94 Open Journal of Energy Efficiency
Eliminating Fastener Thermal Bridging in Low Slope Roofs: Energy Efficiency Savings versus Installation Costs
Thomas J. Taylor
Building and Roofing Science, GAF, Parsippany, USA
Abstract Low-slope roofing assemblies include a wide range of insulation and single ply membrane attachment methods. Previous studies have shown that me-chanical attachment using metal fasteners leads to significant thermal bridg-ing and consequent loss of insulation value and reduction of long term ther-mal efficiency. This study calculates the costs associated with mechanical at-tachment in terms of lost insulation value, increased long-term energy costs, and the material and labor costs associated with installation of these common systems. Energy efficiency reductions using metal fasteners were modeled for eight US cities in a range of climate zones. From the data, it was possible to calculate target costs (labor plus materials) that would make adhered systems cost effective. There are many options available to adhere single ply roof sys-tem components, such as solvent-based adhesives and low-rise urethane foams, together with different application approaches such as broom, spray, and ribbon methods. The cost targets derived in this study can help optimize the use of such materials and application methods such that the thermal bridging due to fasteners could be substantially reduced or eliminated.
Keywords Energy Efficiency, Thermal Bridging, Roof Assemblies
1. Introduction
Commercial buildings include a variety of building types such as offices, hospit-als, schools, police stations, places of worship, warehouses, hotels, and shopping malls. Different commercial building activities have unique energy needs, but as a whole, space heating accounted for about 25% of the total energy use in com-
How to cite this paper: Taylor, T.J. (2020) Eliminating Fastener Thermal Bridging in Low Slope Roofs: Energy Efficiency Savings versus Installation Costs. Open Journal of Energy Efficiency, 9, 94-110. https://doi.org/10.4236/ojee.2020.92007 Received: March 3, 2020 Accepted: April 26, 2020 Published: April 29, 2020 Copyright © 2020 by author(s) and Scientific Research Publishing Inc. This work is licensed under the Creative Commons Attribution International License (CC BY 4.0). http://creativecommons.org/licenses/by/4.0/
Open Access
T. J. Taylor
DOI: 10.4236/ojee.2020.92007 95 Open Journal of Energy Efficiency
mercial buildings in the US during 2012, the latest year for which such data is available [1]. Improving energy conservation in buildings has long been recog-nized as an important approach to reduce energy consumption and greenhouse gas emissions. Many governments and utilities have mandates to encourage energy conservation in buildings, and city and state jurisdictions have increa-singly adopted more stringent building energy efficiency standards. Building envelope thermal performance is a critical consideration for reducing space heating loads and will play an increasingly important role as authorities strive for lower energy consumption in buildings [2].
It is evident that thermal performance of the building envelope can be signifi-cantly affected by thermal bridging [3]. Thermal bridges are localized areas of high heat flow through walls, roofs, and other insulated building envelope com-ponents. Thermal bridging is caused by conductive elements that penetrate and/or bypass thermal insulation, and/or misaligned planes of thermal insula-tion. These paths allow heat flow to bypass the insulating layer, and reduce the effectiveness of the insulation.
Low-slope roofs in the US typically comprise a waterproof membrane in-stalled on top of layers of polyisocyanurate foam insulation, with this assembly being attached to a fluted steel deck. These “insulated metal deck” roofing as-semblies can be mechanically-attached through the use of steel screws and plates using custom-sized washers, or attached through using various adhesives. Com-binations of these approaches are also used, whereby some layers are adhesive-ly-attached and others mechanically-attached. Selecting which attachment me-thod to use depends on factors such as required wind uplift resistance, construc-tion costs, aesthetics, and system warranty.
As will be discussed, mechanical attachment of low-slope roofing components can lead to significant thermal bridging. This study builds on prior work to closely examine the long-term economic costs of thermal bridging in low slope roof assemblies, resulting from reduced energy efficiency and lost thermal insu-lation value. The US has different climate zones where some buildings are dom-inated by heating costs and in others by cooling costs. Electric heat can also be used in certain parts of the US where electric demand charges are common [4]. These two factors can significantly increase the cost of reduced energy efficiency. Reductions in thermal performance due to bridging can also have a compound effect on building energy efficiency by influencing specification of heating, ven-tilation, and air conditioning (HVAC) systems.
This study examines the true cost of mechanically attached thermoplastic sin-gle-ply roof membranes by including the effects of thermal bridging. It seeks to quantify economic targets where adhesively-attached systems could be used without increased costs; analyzing the total cost of thermal bridging in terms of lost insulation value, cost of fasteners, installation labor, and the reduction of long term energy efficiency. Today, comparisons between mechanically-attached and adhesively-attached approaches are made in terms of initial material and labor costs. This analysis may allow decisions to be made in terms of the overall
T. J. Taylor
DOI: 10.4236/ojee.2020.92007 96 Open Journal of Energy Efficiency
cost, including lost insulation value and reduced long term energy efficiency. This study considers differences between the design and effective insulation
values (RSI, m2 K/W or R-value, ˚F ft2hr/Btu) of a common low-slope roofing assembly. Such roofs are considered to have a slope of less than 2:12 (9.46 de-grees). The aim was to evaluate differences caused by attachment methods commonly used in the roofing industry. As noted previously [5] [6], design RSI refers to the RSI intended by the architect or other design professional. The ef-fective RSI refers to the insulation value that is actually achieved after practical matters, such as installation methods, are taken into account.
This study, the effect of mechanically fastening a roof assembly with screws and plates on the difference between the design RSI intended by the design pro-fessional, and the effective RSI after actual construction. It is important to note that in this study, RSI refers either to the thermal resistance of the material or entire assembly, depending on context. A prior study by Taylor, Willits, Hart-wig, and Kirby did not account for labor costs associated with various roof as-sembly practices [5] [6]. That first study showed that some adhered systems had the potential to significantly reduce thermal bridging in an economic way. This present study provides a closer examination of installation costs and guidance as to targets that could cost effectively make specific systems more energy efficient.
2. Background 2.1. Low-Slope Roofing Assemblies
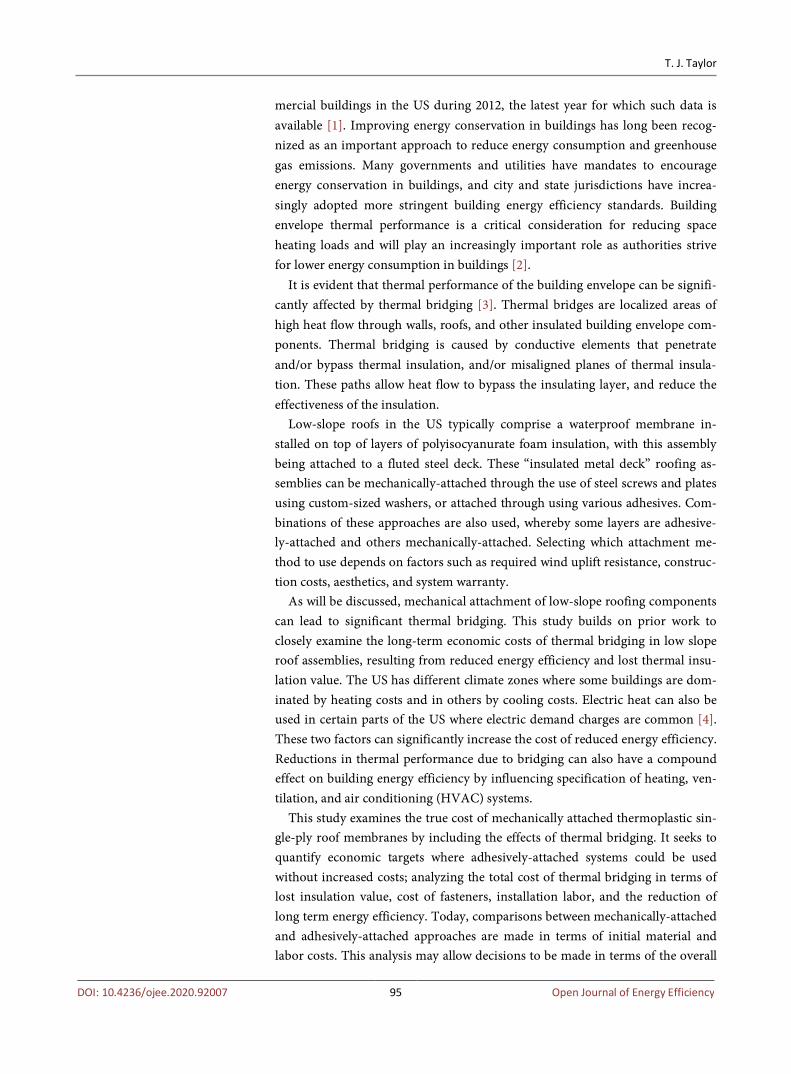
This study analyzed roofing assemblies consisting of a fluted steel deck, two lay-ers of polyisocyanurate foam insulation (commonly referred to as polyiso or PIR), and a thermoplastic single-ply membrane. Examples of the membrane in-clude flexible polyvinyl chloride (PVC) and thermoplastic polyolefin (TPO). Figure 1 shows a schematic to illustrate the general concept.
In mechanically-attached thermoplastic systems, the polyiso insulation is at-tached with screws and plates applied through the insulation boards. The mem-brane is then rolled out over the insulation and also fastened with screws and plates along the edge. The next roll overlaps the fasteners and the seam is fused using hot air. For adhered systems, the membrane is not fastened with screws
Figure 1. Schematic of a single ply, insulated steel deck roofing assembly. Note, in the US, foam insulation is normally applied as two layers of boards with staggered and offset joints.
T. J. Taylor
DOI: 10.4236/ojee.2020.92007 97 Open Journal of Energy Efficiency
but is attached to the insulation board beneath it using an adhesive. The insula-tion boards can also be adhered or fastened with screws and plates. The bottom insulation boards are typically always mechanically-fastened.
For adhered systems, there are a plethora of options including solvent- and water-based adhesives that are applied using rollers or brooms, or spray-applied depending on their properties. Low-rise urethane foams can also be used and applied as coarse sprays or in a ribbon format. Adhesives have varying coverage rates, depending on type and manufacturer. Also, there are variables such as solvent flash-off times and application temperature that make general material cost and labor estimates difficult to assess.
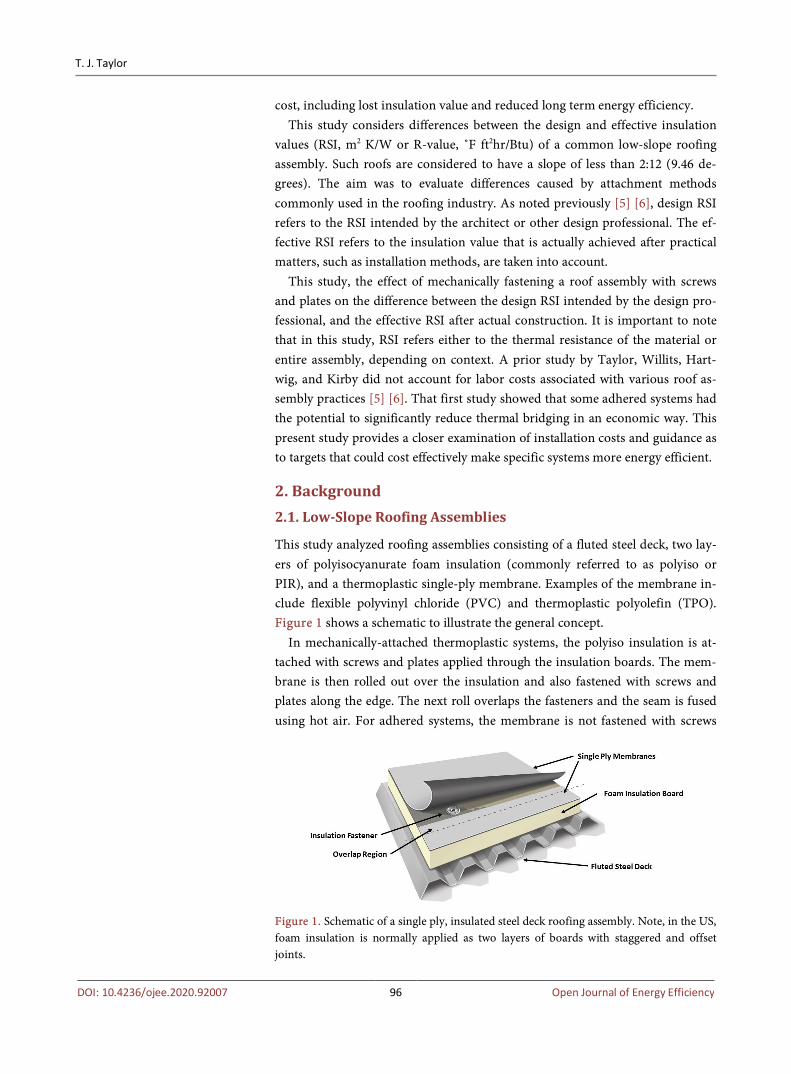
US building codes state such roofs consist of three zones (corner, field, and perimeter) for determining necessary fastener patterns to achieve required wind uplift resistance. These zones are shown schematically in Figure 2.
When mechanically-fastened, polyiso insulation is normally attached with a uniform fastener density regardless of roof zone, except in the case of inductive-ly-welded plates. Such plates are coated with a thermoplastic resin that fuses to the membrane after installation via inductive heating. With inductive plates, screw and plate densities vary according to corner, perimeter, and field of the roof.
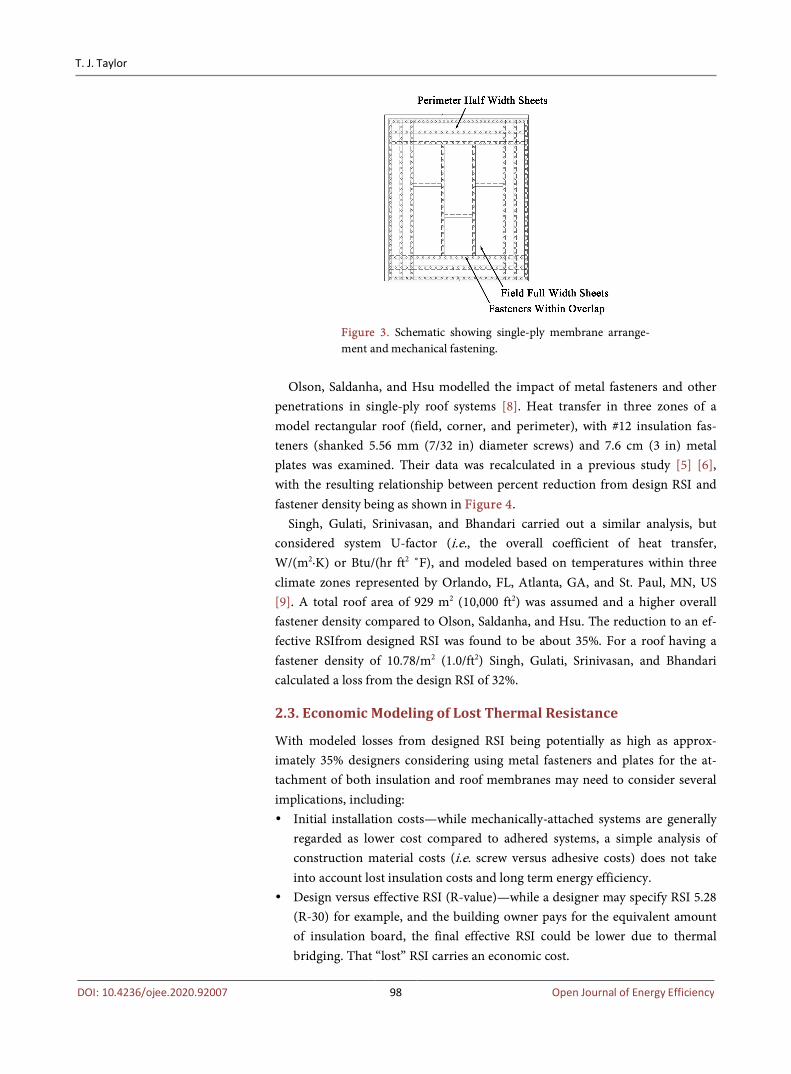
Mechanically-attached single-ply membranes have different fastener densities depending on the roof zone. These are achieved by using half width sheets along the roof perimeter, as indicated in Figure 3.
Fastener densities used in this study will be described later, but generally range between approximately 4.3/m2 (0.4/ft2) for totally mechanically-attached systems to as low as 2.8/m2 (0.26/ft2) for systems using adhesive for the mem-brane and top layer of insulation.
2.2. Thermal Bridging Due to Roofing Fasteners
An analysis by Burch, Shoback, and Cavanaugh found that metal fasteners re-duced overall thermal resistance of insulated metal deck assemblies by 3% - 8% depending on insulation thickness [7]. They used a finite difference model to analyze overall thermal resistance for assemblies using 50 fasteners per5.38/m2 (100 ft2).
Figure 2. A rectangular roof showing the three zones for which various fastener densities are specified for achieving the requisite wind uplift performance—field, perimeter, and corner.
T. J. Taylor
DOI: 10.4236/ojee.2020.92007 98 Open Journal of Energy Efficiency
Figure 3. Schematic showing single-ply membrane arrange-ment and mechanical fastening.
Olson, Saldanha, and Hsu modelled the impact of metal fasteners and other
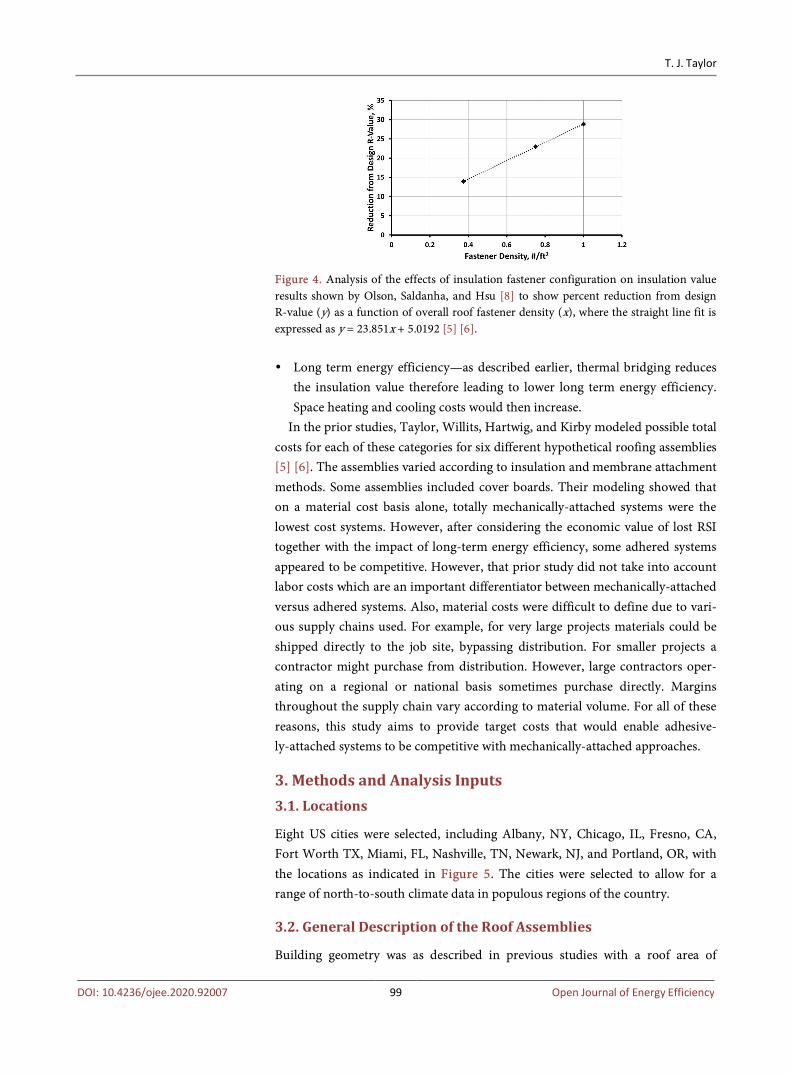
penetrations in single-ply roof systems [8]. Heat transfer in three zones of a model rectangular roof (field, corner, and perimeter), with #12 insulation fas-teners (shanked 5.56 mm (7/32 in) diameter screws) and 7.6 cm (3 in) metal plates was examined. Their data was recalculated in a previous study [5] [6], with the resulting relationship between percent reduction from design RSI and fastener density being as shown in Figure 4.
Singh, Gulati, Srinivasan, and Bhandari carried out a similar analysis, but considered system U-factor (i.e., the overall coefficient of heat transfer, W/(m2∙K) or Btu/(hr ft2 ˚F), and modeled based on temperatures within three climate zones represented by Orlando, FL, Atlanta, GA, and St. Paul, MN, US [9]. A total roof area of 929 m2 (10,000 ft2) was assumed and a higher overall fastener density compared to Olson, Saldanha, and Hsu. The reduction to an ef-fective RSIfrom designed RSI was found to be about 35%. For a roof having a fastener density of 10.78/m2 (1.0/ft2) Singh, Gulati, Srinivasan, and Bhandari calculated a loss from the design RSI of 32%.
2.3. Economic Modeling of Lost Thermal Resistance
With modeled losses from designed RSI being potentially as high as approx-imately 35% designers considering using metal fasteners and plates for the at-tachment of both insulation and roof membranes may need to consider several implications, including: Initial installation costs—while mechanically-attached systems are generally
regarded as lower cost compared to adhered systems, a simple analysis of construction material costs (i.e. screw versus adhesive costs) does not take into account lost insulation costs and long term energy efficiency.
Design versus effective RSI (R-value)—while a designer may specify RSI 5.28 (R-30) for example, and the building owner pays for the equivalent amount of insulation board, the final effective RSI could be lower due to thermal bridging. That “lost” RSI carries an economic cost.
T. J. Taylor
DOI: 10.4236/ojee.2020.92007 99 Open Journal of Energy Efficiency
Figure 4. Analysis of the effects of insulation fastener configuration on insulation value results shown by Olson, Saldanha, and Hsu [8] to show percent reduction from design R-value (y) as a function of overall roof fastener density (x), where the straight line fit is expressed as y = 23.851x + 5.0192 [5] [6]. Long term energy efficiency—as described earlier, thermal bridging reduces
the insulation value therefore leading to lower long term energy efficiency. Space heating and cooling costs would then increase.
In the prior studies, Taylor, Willits, Hartwig, and Kirby modeled possible total costs for each of these categories for six different hypothetical roofing assemblies [5] [6]. The assemblies varied according to insulation and membrane attachment methods. Some assemblies included cover boards. Their modeling showed that on a material cost basis alone, totally mechanically-attached systems were the lowest cost systems. However, after considering the economic value of lost RSI together with the impact of long-term energy efficiency, some adhered systems appeared to be competitive. However, that prior study did not take into account labor costs which are an important differentiator between mechanically-attached versus adhered systems. Also, material costs were difficult to define due to vari-ous supply chains used. For example, for very large projects materials could be shipped directly to the job site, bypassing distribution. For smaller projects a contractor might purchase from distribution. However, large contractors oper-ating on a regional or national basis sometimes purchase directly. Margins throughout the supply chain vary according to material volume. For all of these reasons, this study aims to provide target costs that would enable adhesive-ly-attached systems to be competitive with mechanically-attached approaches.
3. Methods and Analysis Inputs 3.1. Locations
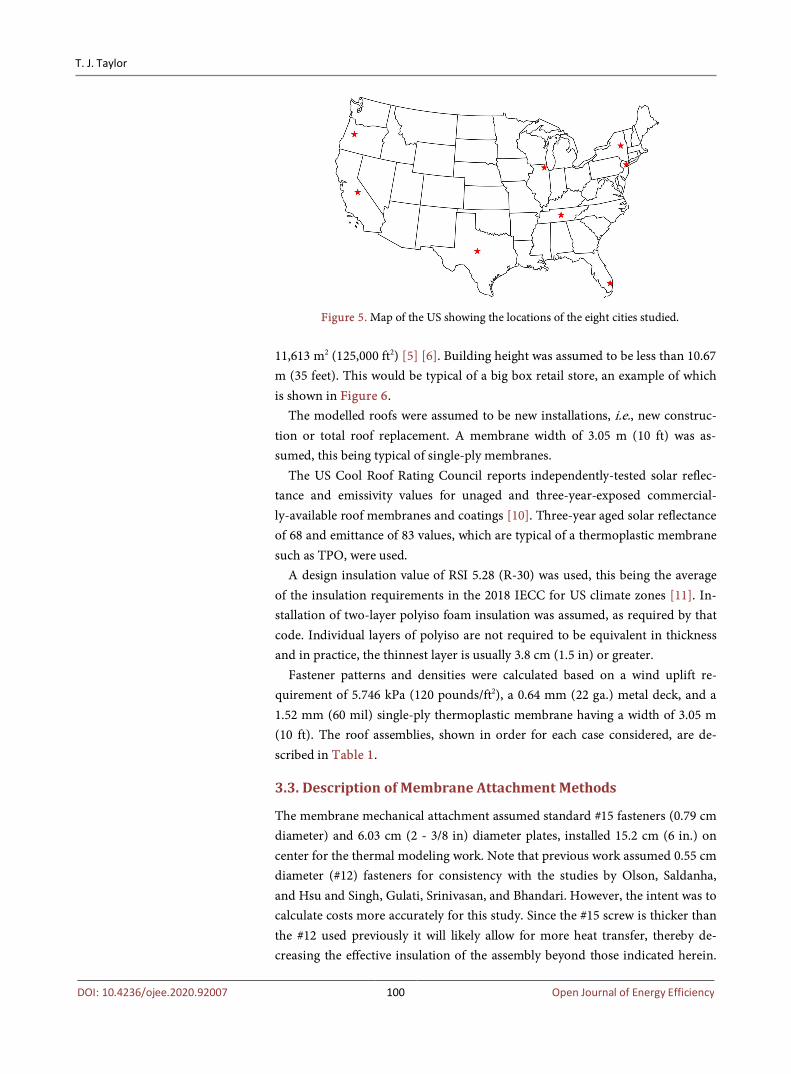
Eight US cities were selected, including Albany, NY, Chicago, IL, Fresno, CA, Fort Worth TX, Miami, FL, Nashville, TN, Newark, NJ, and Portland, OR, with the locations as indicated in Figure 5. The cities were selected to allow for a range of north-to-south climate data in populous regions of the country.
3.2. General Description of the Roof Assemblies
Building geometry was as described in previous studies with a roof area of
T. J. Taylor
DOI: 10.4236/ojee.2020.92007 100 Open Journal of Energy Efficiency
Figure 5. Map of the US showing the locations of the eight cities studied.
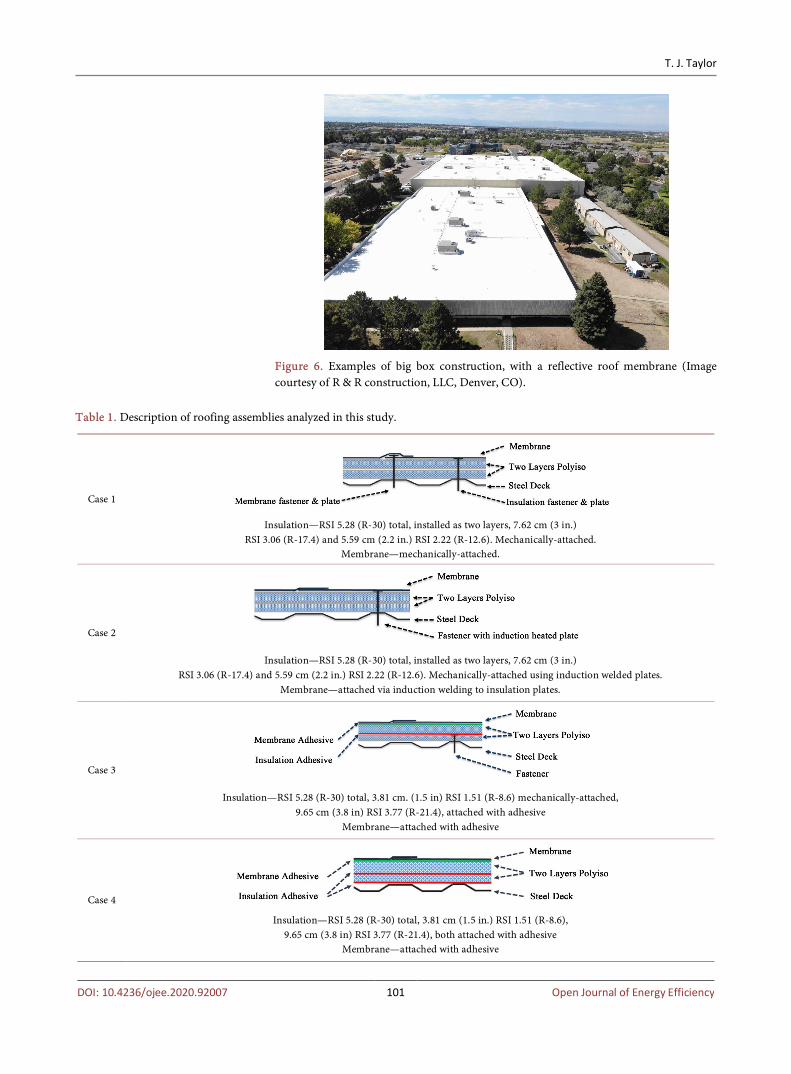
11,613 m2 (125,000 ft2) [5] [6]. Building height was assumed to be less than 10.67 m (35 feet). This would be typical of a big box retail store, an example of which is shown in Figure 6.
The modelled roofs were assumed to be new installations, i.e., new construc-tion or total roof replacement. A membrane width of 3.05 m (10 ft) was as-sumed, this being typical of single-ply membranes.
The US Cool Roof Rating Council reports independently-tested solar reflec-tance and emissivity values for unaged and three-year-exposed commercial-ly-available roof membranes and coatings [10]. Three-year aged solar reflectance of 68 and emittance of 83 values, which are typical of a thermoplastic membrane such as TPO, were used.
A design insulation value of RSI 5.28 (R-30) was used, this being the average of the insulation requirements in the 2018 IECC for US climate zones [11]. In-stallation of two-layer polyiso foam insulation was assumed, as required by that code. Individual layers of polyiso are not required to be equivalent in thickness and in practice, the thinnest layer is usually 3.8 cm (1.5 in) or greater.
Fastener patterns and densities were calculated based on a wind uplift re-quirement of 5.746 kPa (120 pounds/ft2), a 0.64 mm (22 ga.) metal deck, and a 1.52 mm (60 mil) single-ply thermoplastic membrane having a width of 3.05 m (10 ft). The roof assemblies, shown in order for each case considered, are de-scribed in Table 1.
3.3. Description of Membrane Attachment Methods
The membrane mechanical attachment assumed standard #15 fasteners (0.79 cm diameter) and 6.03 cm (2 - 3/8 in) diameter plates, installed 15.2 cm (6 in.) on center for the thermal modeling work. Note that previous work assumed 0.55 cm diameter (#12) fasteners for consistency with the studies by Olson, Saldanha, and Hsu and Singh, Gulati, Srinivasan, and Bhandari. However, the intent was to calculate costs more accurately for this study. Since the #15 screw is thicker than the #12 used previously it will likely allow for more heat transfer, thereby de-creasing the effective insulation of the assembly beyond those indicated herein.
T. J. Taylor
DOI: 10.4236/ojee.2020.92007 101 Open Journal of Energy Efficiency
Figure 6. Examples of big box construction, with a reflective roof membrane (Image courtesy of R & R construction, LLC, Denver, CO).
Table 1. Description of roofing assemblies analyzed in this study.
Case 1
Insulation—RSI 5.28 (R-30) total, installed as two layers, 7.62 cm (3 in.) RSI 3.06 (R-17.4) and 5.59 cm (2.2 in.) RSI 2.22 (R-12.6). Mechanically-attached.
Membrane—mechanically-attached.
Case 2
Insulation—RSI 5.28 (R-30) total, installed as two layers, 7.62 cm (3 in.) RSI 3.06 (R-17.4) and 5.59 cm (2.2 in.) RSI 2.22 (R-12.6). Mechanically-attached using induction welded plates.
Membrane—attached via induction welding to insulation plates.
Case 3
Insulation—RSI 5.28 (R-30) total, 3.81 cm. (1.5 in) RSI 1.51 (R-8.6) mechanically-attached, 9.65 cm (3.8 in) RSI 3.77 (R-21.4), attached with adhesive
Membrane—attached with adhesive
Case 4
Insulation—RSI 5.28 (R-30) total, 3.81 cm (1.5 in.) RSI 1.51 (R-8.6), 9.65 cm (3.8 in) RSI 3.77 (R-21.4), both attached with adhesive
Membrane—attached with adhesive

T. J. Taylor
DOI: 10.4236/ojee.2020.92007 102 Open Journal of Energy Efficiency
Therefore, the lost R-values (RSI) calculated in this study are likely to be con-servative and actual losses could be higher. For insulation attachment, the fas-teners were assumed to be the standard #12 fasteners with 7.62 cm (3 in.) di-ameter plates.
The membrane attachment method for each case is summarized in Table 2. For Case 1, to meet the wind uplift requirements described earlier, the field
had a total of 21,372 fasteners and the perimeter and corners had a total of 8652 fasteners. Thus the overall fastener density, for both membrane and insulation, was 4.26/m2 (0.396/ft2).
For Case 2, inductively-heated plates were used, where screws provide both insulation and membrane attachment. For this case, to meet the wind uplift re-quirements described earlier, the field had a total of 27,743 fasteners and the pe-rimeter and corners had a total of 6634 fasteners. Thus, the overall fastener den-sity was 2.96/m2 (0.275/ft2) for both the membrane and insulation fasteners. Figure 7 shows an example of such an installation.
For Case 3, the membrane and top layer of insulation were adhered. The bot-tom layer of insulation was attached using 27,743 fasteners in the field and the perimeter and corners had a total of 5308 fasteners. Thus, the overall fastener density was 2.84/m2 (0.264/ft2) Case 3 represents a situation where the fasteners that cause thermal bridging are themselves insulated by the top layer of insula-tion, thus limiting the thermal losses.
Figure 7. Attachment of a thermoplastic single ply membrane using inductively heated plates. The installer is holding the heating machine, while placing weighted magnets onto the membrane above plates that have been heated. The magnets apply pressure between the plates and the membrane to promote fusing of the two. Table 2. Summary of membrane attachment methods.
Assembly Attachment Type Description
Case 1 Mechanical Screws and plates along membrane seam
Case 2 Induction Welding Coated insulation plates, inductively heated at installation
Case 3 Adhered I Membrane and top insulation layer adhered. Screws and plates for bottom insulation layer
Case 4 Adhered II Membrane and both insulation layers adhered

T. J. Taylor
DOI: 10.4236/ojee.2020.92007 103 Open Journal of Energy Efficiency
Case 4 represents the design intent, whereby the specified insulation value is not compromised by thermal bridging. Note that adhering insulation directly to a steel deck is not normally considered code compliant with respect to wind up-lift resistance, but is included here for comparison purposes to represent an ideal.
The insulation fastener densities (i.e. use rates), per 122 × 244 cm (4 × 8 ft) polyiso board, are summarized in Table 3.
3.4. Total Fastener Densities
The overall roof fastener densities were calculated to be as shown in Table 4.
3.5. Labor Costs
Mechanically-attached systems account for approximately 75% of thermoplastic single-ply roof installations [12]. Their associated labor costs are easier to esti-mate compared to adhered systems. With adhesive application, there are many variables such as solvent flash-off time, coverage rate, type of adhesive, and ap-plication temperature that affect application times and therefore labor costs. By timing the installation of mechanically-attached system, it was possible to esti-mate costs.
During installation of large single-ply roof roofs, there is a significant overlap between different phases. For example, once sufficient insulation has been in-stalled, membrane installation begins while insulation installation continues. For this study, the costs associated with details such as parapet walls and penetration flashings were ignored since they can be expected to be the same or very similar, regardless of how the rest of the roof is installed. Table 3. Insulation fastener usage, per 122 × 244 cm (4 × 8 ft) polyiso board.
Assembly Roof Zone, Fastener per Polyiso Board
Field Perimeter Corner
Case 1 5 5 5
Case 2 8 15 20
Case 3 8 12 16
Case 4 0 0 0
Table 4. Overall fastener densities, including both insulation and membrane fasteners, calculated as number per unit of roof area.
Assembly Fastener Density per ft2 Fastener Density per m2
Case 1 0.3964 4.2673
Case 2 0.2750 2.9602
Case 3* 0.2644 2.8463
Case 4 0 0
*Fasteners only used for bottom layer of insulation.

T. J. Taylor
DOI: 10.4236/ojee.2020.92007 104 Open Journal of Energy Efficiency
By timing a range of big box roof installations, this study estimated that a crew of six would complete an 11,613 m2 (125,000 ft2) project in about 10 days. As-suming a fully burdened labor cost of 40.00 USD/hr, this equates to a labor cost of 19,200 USD. It is recognized that labor rates will vary according to location, skill levels, and experience. Also, some contractors use smaller but more expe-rienced crews while others use larger but possibly less experienced crews. Simi-larly, an installation of the same size using inductively-heated fastener plates would be completed in 12.5 days and therefore have a labor cost of 24,000 USD. This analysis is not intended to provide labor cost targets but to enable compar-isons to be made between different attachment methods. Costs such as supervi-sion, material delivery, and staging of materials on the job site have been as-sumed to be fixed regardless of application approach and have therefore been omitted from this study.
3.6. Building Heating and Cooling Energy-Use Modeling
Energy costs were modeled for the eight US cities using the CoolCalcPeak calcu-lator, published by DOE/ORNL [13]. Details of validation and inputs required have been described previously [5] [6].
CoolCalcPeak makes no assumption as to building geometry. It only calcu-lates energy loads on a building due to reflectance, emissivity, and insulation values, as well as local climate factors (discussed previously, together with the model limitations [5] [6]).
3.7. Utility Cost Data
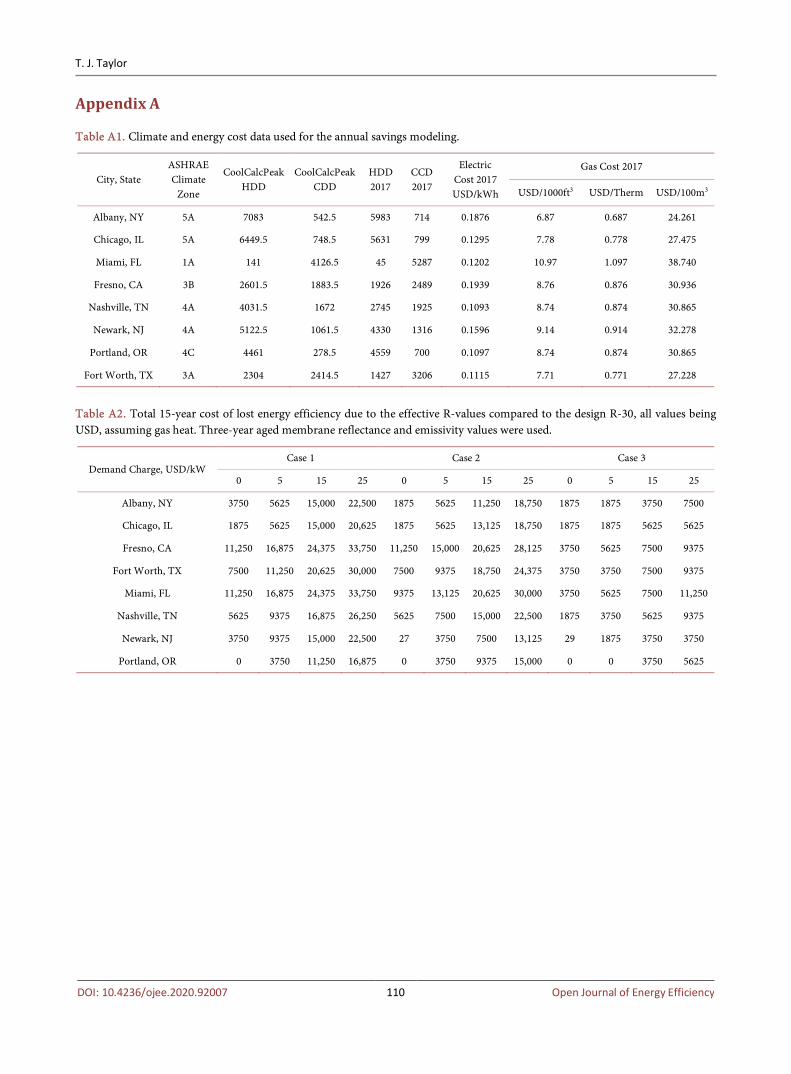
Yearly average electric and gas costs for commercial customers from online da-tabases for the latest year such data was available, 2017, were used [14] and [15] respectively. All energy costs are shown in Table A1.
As shown in a survey of utilities carried out by the National Renewable Energy Laboratory (NREL), electric demand charge rates vary considerably across utili-ties, locations, building sizes, and building types [16]. Demand charges often represent from 30% - 70% of a commercial electric bill because of air condition-ing use. Energy costs were analyzed for demand charges of 0 USD, 5 USD, 15 USD, and 25 USD per kW and were assumed to apply year round.
The energy savings due to differences between design and effective R-values were calculated as described previously [5] [6]. A building air conditioning coef-ficient of performance of 2.5 and a gas heating efficiency of 0.8 were used. These are representative of newer equipment.
4. Results
These costs associated with a specified roof design based on RSI 5.28 (R-30) and the resulting effective RSI due to attachment methodology were evaluated. Such costs include the lost economic value of purchased RSI that was not achieved due to thermal bridging.
T. J. Taylor
DOI: 10.4236/ojee.2020.92007 105 Open Journal of Energy Efficiency
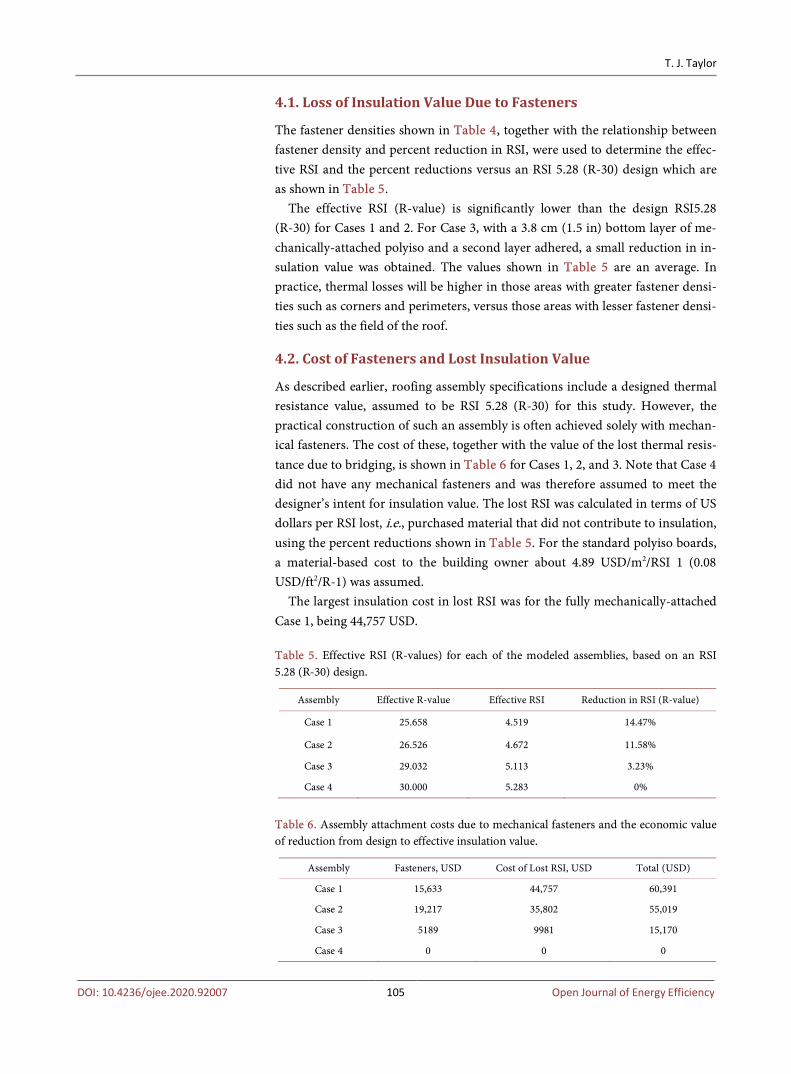
4.1. Loss of Insulation Value Due to Fasteners
The fastener densities shown in Table 4, together with the relationship between fastener density and percent reduction in RSI, were used to determine the effec-tive RSI and the percent reductions versus an RSI 5.28 (R-30) design which are as shown in Table 5.
The effective RSI (R-value) is significantly lower than the design RSI5.28 (R-30) for Cases 1 and 2. For Case 3, with a 3.8 cm (1.5 in) bottom layer of me-chanically-attached polyiso and a second layer adhered, a small reduction in in-sulation value was obtained. The values shown in Table 5 are an average. In practice, thermal losses will be higher in those areas with greater fastener densi-ties such as corners and perimeters, versus those areas with lesser fastener densi-ties such as the field of the roof.
4.2. Cost of Fasteners and Lost Insulation Value
As described earlier, roofing assembly specifications include a designed thermal resistance value, assumed to be RSI 5.28 (R-30) for this study. However, the practical construction of such an assembly is often achieved solely with mechan-ical fasteners. The cost of these, together with the value of the lost thermal resis-tance due to bridging, is shown in Table 6 for Cases 1, 2, and 3. Note that Case 4 did not have any mechanical fasteners and was therefore assumed to meet the designer’s intent for insulation value. The lost RSI was calculated in terms of US dollars per RSI lost, i.e., purchased material that did not contribute to insulation, using the percent reductions shown in Table 5. For the standard polyiso boards, a material-based cost to the building owner about 4.89 USD/m2/RSI 1 (0.08 USD/ft2/R-1) was assumed.
The largest insulation cost in lost RSI was for the fully mechanically-attached Case 1, being 44,757 USD. Table 5. Effective RSI (R-values) for each of the modeled assemblies, based on an RSI 5.28 (R-30) design.
Assembly Effective R-value Effective RSI Reduction in RSI (R-value)
Case 1 25.658 4.519 14.47%
Case 2 26.526 4.672 11.58%
Case 3 29.032 5.113 3.23%
Case 4 30.000 5.283 0%
Table 6. Assembly attachment costs due to mechanical fasteners and the economic value of reduction from design to effective insulation value.
Assembly Fasteners, USD Cost of Lost RSI, USD Total (USD)
Case 1 15,633 44,757 60,391
Case 2 19,217 35,802 55,019
Case 3 5189 9981 15,170
Case 4 0 0 0

T. J. Taylor
DOI: 10.4236/ojee.2020.92007 106 Open Journal of Energy Efficiency
4.3. Lost Energy Efficiency Due to Fasteners
The effective R-values from Table 6 were used to calculate the cost of a build-ing’s reduced energy efficiency relative to the design RSI 5.28 (R-30) over a 15-year time frame. This was chosen due to the published polyiso foam RSI (R-value) representing the time weighted 15-year long-term thermal resistance [17] [18]. The results are summarized in Table A2 and show that the opportu-nity to provide savings by reducing thermal bridging occurs when demand charges are highest.
4.4. Target Installation Costs for Case 3—Opportunity for Reducing Thermal Bridging
By adding the mechanical fastener and labor costs to those of the lost insulation value and degraded energy efficiency, it is possible to calculate target installation costs for low or zero thermal bridging systems. Case 3 represents an installation that relies on mechanical attachment of the bottom insulation layer but all sub-sequent layers would be adhesively-attached. The labor and material costs of such an application are shown in Table 7.
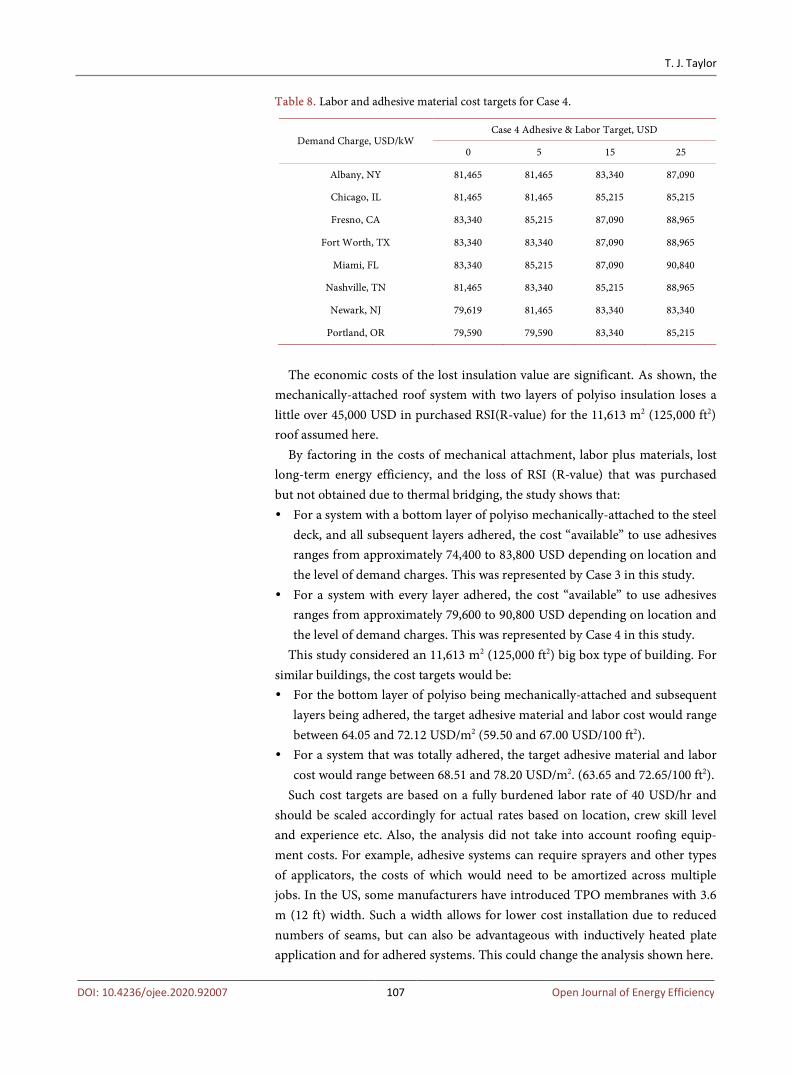
4.5. Target Installation Costs for Case 4—Opportunity for Eliminating Thermal Bridging
Case 4 represents a scenario that achieves the insulation value intended by the specifier, i.e. installation such that thermal bridging doesn’t occur. This would entail the use of adhesive attachment for each layer, including the bottom layer of insulation to the roof deck. The target labor and material costs of such an ap-plication are shown in Table 8.
5. Discussion
The thermal insulation losses caused by metal fasteners are very significant, ranging between a high of about 14.5% for the traditional system to about 11.5% for the inductively-heated plates type. Table 7. Labor and adhesive material cost targets for Case 3.
Demand Charge, USD/kW Case 3 Adhesive & Labor Target, USD
0 5 15 25
Albany, NY 76,276 76,276 78,151 81,901
Chicago, IL 76,276 76,276 80,026 80,026
Fresno, CA 78,151 80,026 81,901 83,776
Fort Worth, TX 78,151 78,151 81,901 83,776
Miami, FL 78,151 80,026 81,901 85,651
Nashville, TN 76,276 78,151 80,026 83,776
Newark, NJ 74,430 76,276 78,151 78,151
Portland, OR 74,401 74,401 78,151 80,026
T. J. Taylor
DOI: 10.4236/ojee.2020.92007 107 Open Journal of Energy Efficiency
Table 8. Labor and adhesive material cost targets for Case 4.
Demand Charge, USD/kW Case 4 Adhesive & Labor Target, USD
0 5 15 25
Albany, NY 81,465 81,465 83,340 87,090
Chicago, IL 81,465 81,465 85,215 85,215
Fresno, CA 83,340 85,215 87,090 88,965
Fort Worth, TX 83,340 83,340 87,090 88,965
Miami, FL 83,340 85,215 87,090 90,840
Nashville, TN 81,465 83,340 85,215 88,965
Newark, NJ 79,619 81,465 83,340 83,340
Portland, OR 79,590 79,590 83,340 85,215
The economic costs of the lost insulation value are significant. As shown, the
mechanically-attached roof system with two layers of polyiso insulation loses a little over 45,000 USD in purchased RSI(R-value) for the 11,613 m2 (125,000 ft2) roof assumed here.
By factoring in the costs of mechanical attachment, labor plus materials, lost long-term energy efficiency, and the loss of RSI (R-value) that was purchased but not obtained due to thermal bridging, the study shows that: For a system with a bottom layer of polyiso mechanically-attached to the steel
deck, and all subsequent layers adhered, the cost “available” to use adhesives ranges from approximately 74,400 to 83,800 USD depending on location and the level of demand charges. This was represented by Case 3 in this study.
For a system with every layer adhered, the cost “available” to use adhesives ranges from approximately 79,600 to 90,800 USD depending on location and the level of demand charges. This was represented by Case 4 in this study.
This study considered an 11,613 m2 (125,000 ft2) big box type of building. For similar buildings, the cost targets would be: For the bottom layer of polyiso being mechanically-attached and subsequent
layers being adhered, the target adhesive material and labor cost would range between 64.05 and 72.12 USD/m2 (59.50 and 67.00 USD/100 ft2).
For a system that was totally adhered, the target adhesive material and labor cost would range between 68.51 and 78.20 USD/m2. (63.65 and 72.65/100 ft2).
Such cost targets are based on a fully burdened labor rate of 40 USD/hr and should be scaled accordingly for actual rates based on location, crew skill level and experience etc. Also, the analysis did not take into account roofing equip-ment costs. For example, adhesive systems can require sprayers and other types of applicators, the costs of which would need to be amortized across multiple jobs. In the US, some manufacturers have introduced TPO membranes with 3.6 m (12 ft) width. Such a width allows for lower cost installation due to reduced numbers of seams, but can also be advantageous with inductively heated plate application and for adhered systems. This could change the analysis shown here.
T. J. Taylor
DOI: 10.4236/ojee.2020.92007 108 Open Journal of Energy Efficiency
This study evaluated the thermal bridging drawbacks of mechanical attach-ment by factoring in all of the impacts of lost insulation value and provided cost targets for adhered systems. However, there are other benefits to adhered sys-tems, including the following: Adhered systems do not flutter or billow during high wind events, thereby
eliminating the drawing up of interior conditioned air up into the roof as-sembly (e.g., infiltration). This latter phenomenon would naturally further reduce energy efficiency (see Pallin, Kehrer, and Desjarlais [19] and Molleti et al. [20] for examples).
Adhered systems have higher wind uplift strengths, so this may provide op-tions in some areas of the country and projects requiring increased uplift de-sign requirements.
Elimination of localized cold spots in the steel deck, caused by metal fasten-ers. These cold spots could cause condensation issues depending on climate and building usage.
6. Conclusion
This study was a modeling exercise to evaluate the cost targets necessary to re-duce or minimize the cost of thermal bridging caused by metal fasteners in low-slope single-ply roofing assemblies. As was shown, thermal bridging of roof assemblies incurs costs associated with lost insulation value and reduced long term energy efficiency. By modeling these costs together with the labor costs in-curred during roof installation it was possible to estimate the break-even point. In other words, the costs associated with adhering roof materials instead of me-chanically fastening them. This data could be used to refine product develop-ment in the roofing market for adhesives with cost and labor.
Conflicts of Interest
The author declares no conflicts of interest regarding the publication of this pa-per.
References [1] US Energy Information Administration.
https://www.eia.gov/energyexplained/use-of-energy/commercial-buildings.php
[2] IEA (2013) Transition to Sustainable Buildings: Strategies and Opportunities to 2050. OECD, IEA, Paris, France.
[3] Building Envelope Thermal Bridging Guide (2016) BC Hydro Power Smart, Version 1.1. https://www.bchydro.com/content/dam/BCHydro/customer-portal/documents/power-smart/builders-developers/building-envelope-thermal-bridging-guide-1.1.pdf
[4] Taylor, T.J. (2019) Reflective Roofing Use on Commercial Buildings in the United States: An Energy Type and Cost Analysis. Buildings, 9, 212. https://doi.org/10.3390/buildings9100212
[5] Taylor, T.J., Willits, J., Hartwig, C.A. and Kirby, J.R. (2018) Optimizing Low-Slope
T. J. Taylor
DOI: 10.4236/ojee.2020.92007 109 Open Journal of Energy Efficiency
Roofing Assemblies for Insulation Value. Buildings, 8, 64. https://doi.org/10.3390/buildings8050064
[6] Taylor, T.J., Willits, J., Hartwig, C.A. and Kirby, J.R. (2018) Insulation Value Opti-mization for Low-Slope Roofs. Building Envelope Technology Symposium.
[7] Burch, D.M., Shoback, P.J. and Cavanaugh, K. (1987) A Heat Transfer Analysis of Metal Fasteners in Low-Slope Roofs. In: Roofing Research and Standards Develop-ment, ASTM International, West Conshohocken, PA, 10-22. https://doi.org/10.1520/STP25721S
[8] Olson, E.K., Saldanha, C.M. and Hsu, J.W. (2015) Thermal Performance Evaluation of Roofing Details to Improve Thermal Efficiency and Condensation Resistance. In: Molleti, S. and Rossiter, W.J., Eds., Roofing Research and Standards Development, Volume 8, ASTM International, West Conshohocken, PA, 10-22. https://doi.org/10.1520/STP159020150021
[9] Singh, M., Gulati, R., Srinivasan, R.S. and Bhandari, M. (2016) Three-Dimensional Heat Transfer Analysis of Metal Fasteners in Roofing Assemblies. Buildings, 6, 49. https://doi.org/10.3390/buildings6040049
[10] Cool Roof Rating Council. http://coolroofs.org/products/results
[11] 2018 International Energy Conservation Code, International Code Council. https://codes.iccsafe.org/content/iecc2018/toc
[12] GAF Internal Sales Data for 2018.
[13] ORNL Cool Roof Calculator with Peak Demand. http://web.ornl.gov/sci/buildings/tools/cool-roof/peak/
[14] Eisenbach Consulting. https://www.electricchoice.com/electricity-prices-by-state/
[15] US Energy Information Administration, https://www.eia.gov/dnav/ng/ng_pri_sum_dcu_nus_a.htm
[16] NREL https://www.nrel.gov/docs/fy17osti/68963.pdf
[17] Polyiso Manufacturers Association. http://www.polyiso.org/?page=LTTRQM
[18] Cusick, M., Wang, L. and Griffin, C. (2014) New LTTR Values and What They Mean for Roofing Industry Professionals. Roofing Contractor, Troy, MI.
[19] Pallin, P., Kehrer, M. and Desjarlais, A. (2014) The Energy Penalty Associated With the Use of Mechanically Attached Roofing Systems. Proceedings of the Symposium on Building Envelope Technology, Tampa, FL, 20-21 October 2014.
[20] Molleti, S., Baskaran, B., Kalinger, P., Graham, M., Cote, J.F., Malpezzi, J. and Schwetz, J. (2015) Evaluation of Air Leakage Properties of Seam-Fastened Mechan-ically Attached Single-Ply and Polymer-Modified Bitumen Roof Membrane Assem-blies. In: Molleti, S. and Rossiter, W.J., Eds., Roofing Research and Standards De-velopment, Volume 8, ASTM International, West Conshohocken, PA, 30-43. https://doi.org/10.1520/STP159020150025
T. J. Taylor
DOI: 10.4236/ojee.2020.92007 110 Open Journal of Energy Efficiency
Appendix A
Table A1. Climate and energy cost data used for the annual savings modeling.
City, State ASHRAE Climate
Zone
CoolCalcPeak HDD
CoolCalcPeak CDD
HDD 2017
CCD 2017
Electric Cost 2017 USD/kWh
Gas Cost 2017
USD/1000ft3 USD/Therm USD/100m3
Albany, NY 5A 7083 542.5 5983 714 0.1876 6.87 0.687 24.261
Chicago, IL 5A 6449.5 748.5 5631 799 0.1295 7.78 0.778 27.475
Miami, FL 1A 141 4126.5 45 5287 0.1202 10.97 1.097 38.740
Fresno, CA 3B 2601.5 1883.5 1926 2489 0.1939 8.76 0.876 30.936
Nashville, TN 4A 4031.5 1672 2745 1925 0.1093 8.74 0.874 30.865
Newark, NJ 4A 5122.5 1061.5 4330 1316 0.1596 9.14 0.914 32.278
Portland, OR 4C 4461 278.5 4559 700 0.1097 8.74 0.874 30.865
Fort Worth, TX 3A 2304 2414.5 1427 3206 0.1115 7.71 0.771 27.228
Table A2. Total 15-year cost of lost energy efficiency due to the effective R-values compared to the design R-30, all values being USD, assuming gas heat. Three-year aged membrane reflectance and emissivity values were used.
Demand Charge, USD/kW Case 1 Case 2 Case 3
0 5 15 25 0 5 15 25 0 5 15 25
Albany, NY 3750 5625 15,000 22,500 1875 5625 11,250 18,750 1875 1875 3750 7500
Chicago, IL 1875 5625 15,000 20,625 1875 5625 13,125 18,750 1875 1875 5625 5625
Fresno, CA 11,250 16,875 24,375 33,750 11,250 15,000 20,625 28,125 3750 5625 7500 9375
Fort Worth, TX 7500 11,250 20,625 30,000 7500 9375 18,750 24,375 3750 3750 7500 9375
Miami, FL 11,250 16,875 24,375 33,750 9375 13,125 20,625 30,000 3750 5625 7500 11,250
Nashville, TN 5625 9375 16,875 26,250 5625 7500 15,000 22,500 1875 3750 5625 9375
Newark, NJ 3750 9375 15,000 22,500 27 3750 7500 13,125 29 1875 3750 3750
Portland, OR 0 3750 11,250 16,875 0 3750 9375 15,000 0 0 3750 5625