operational plan document for 2014-16 peterborough and ... · table 11 - capital plan ... acute...
TRANSCRIPT

1 | P a g e
Operational Plan Document for 2014-16
Peterborough and Stamford Hospitals NHS Foundation Trust

2 | P a g e
Contents Table of figures ........................................................................................................................................... 3
Table of tables ............................................................................................................................................ 3
Operational Plan for y/e 31 March 2015 and 2016 ...................................................................................... 4
Executive Summary .................................................................................................................................... 5
Operational Plan ......................................................................................................................................... 7
1 The short term challenge .................................................................................................................. 7
1.1 Demographic profile .................................................................................................................. 8
1.2 Population ............................................................................................................................... 10
1.3 Local health economy ............................................................................................................. 11
1.4 Better CareFund (BCF) ........................................................................................................... 11
1.5 The planning process .............................................................................................................. 11
1.6 Project Orange ........................................................................................................................ 12
2 Trust objectives 2014/15 to 2015/16............................................................................................... 13
2.1 Be in the top quartile safest district general hospitals in England ............................................ 13
2.2 Be in the top 20% of Trusts for patient care and experience ................................................... 15
2.3 Be an effective Trust and meet performance standards .......................................................... 15
2.4 Productive motivated workforce .............................................................................................. 16
2.5 Ensure that the Trust is well run and well led .......................................................................... 18
2.6 Deliver our financial targets ..................................................................................................... 19
2.7 Achieve all round ‘sustainability’ for PCH and Stamford Hospital ............................................ 23
3 Quality plans .................................................................................................................................. 25
3.1 Quality goals ........................................................................................................................... 25
3.2 Quality priorities ...................................................................................................................... 25
3.3 Exisiting quality concerns ........................................................................................................ 25
3.4 Board quality assurance .......................................................................................................... 25
3.5 Quality and the workforce ........................................................................................................ 26
3.6 Risks to achieving our quality plans ........................................................................................ 26
4 Operational requirements and capacity .......................................................................................... 27
4.1 Capacity constraints ................................................................................................................ 28
4.2 Assessment of capacity requirements ..................................................................................... 28
4.3 Key capacity and demand risks ............................................................................................... 29
5 Appendices: commercial or other confidential matters ...................... Error! Bookmark not defined.
3 | P a g e
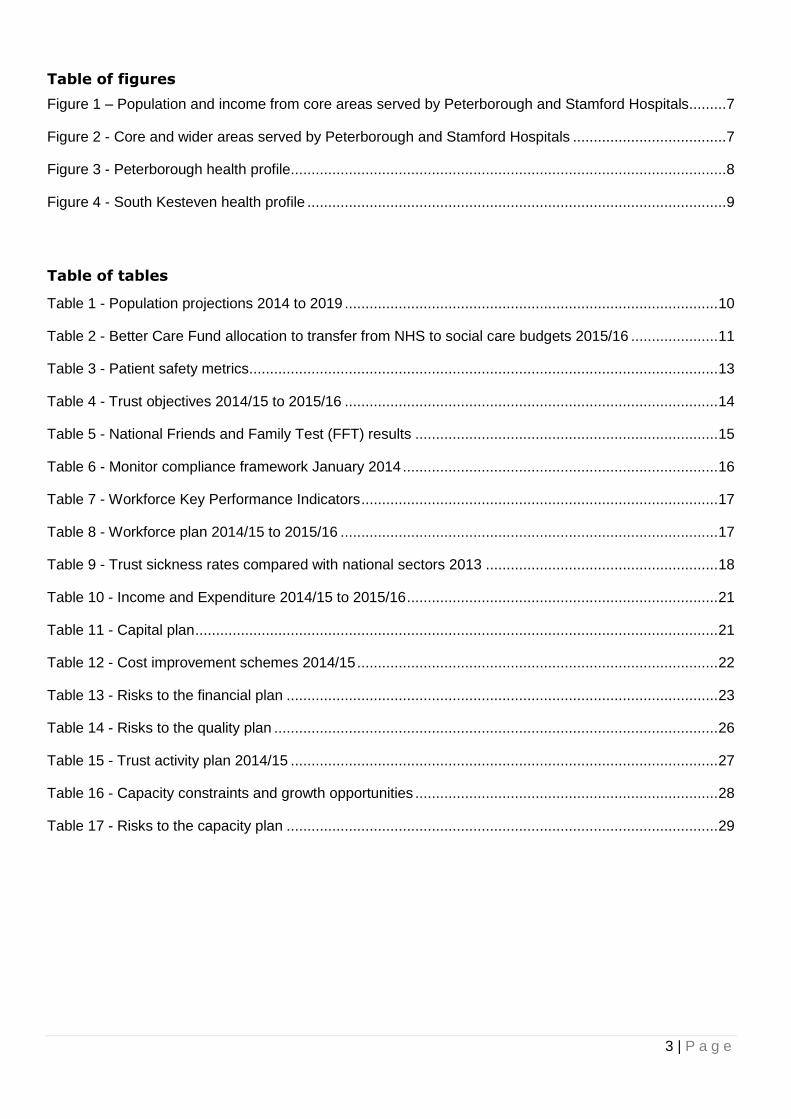
Table of figures
Figure 1 – Population and income from core areas served by Peterborough and Stamford Hospitals......... 7
Figure 2 - Core and wider areas served by Peterborough and Stamford Hospitals ..................................... 7
Figure 3 - Peterborough health profile ......................................................................................................... 8
Figure 4 - South Kesteven health profile ..................................................................................................... 9
Table of tables
Table 1 - Population projections 2014 to 2019 .......................................................................................... 10
Table 2 - Better Care Fund allocation to transfer from NHS to social care budgets 2015/16 ..................... 11
Table 3 - Patient safety metrics ................................................................................................................. 13
Table 4 - Trust objectives 2014/15 to 2015/16 .......................................................................................... 14
Table 5 - National Friends and Family Test (FFT) results ......................................................................... 15
Table 6 - Monitor compliance framework January 2014 ............................................................................ 16
Table 7 - Workforce Key Performance Indicators ...................................................................................... 17
Table 8 - Workforce plan 2014/15 to 2015/16 ........................................................................................... 17
Table 9 - Trust sickness rates compared with national sectors 2013 ........................................................ 18
Table 10 - Income and Expenditure 2014/15 to 2015/16 ........................................................................... 21
Table 11 - Capital plan .............................................................................................................................. 21
Table 12 - Cost improvement schemes 2014/15 ....................................................................................... 22
Table 13 - Risks to the financial plan ........................................................................................................ 23
Table 14 - Risks to the quality plan ........................................................................................................... 26
Table 15 - Trust activity plan 2014/15 ....................................................................................................... 27
Table 16 - Capacity constraints and growth opportunities ......................................................................... 28
Table 17 - Risks to the capacity plan ........................................................................................................ 29

4 | P a g e
Operational Plan for y/e 31 March 2015 and 2016
This document completed by (and Monitor queries to be directed to):
The attached Operational Plan is intended to reflect the Trust’s business plan over the next
two years. Information included herein should accurately reflect the strategic and
operational plans agreed by the Trust Board.
In signing below, the Trust is confirming that:
The Operational Plan is an accurate reflection of the current shared vision of the Trust
Board having had regard to the views of the Council of Governors and is underpinned by
the strategic plan;
The Operational Plan has been subject to at least the same level of Trust Board scrutiny as
any of the Trust’s other internal business and strategy plans;
The Operational Plan is consistent with the Trust’s internal operational plans and provides
a comprehensive overview of all key factors relevant to the delivery of these plans; and
All plans discussed and any numbers quoted in the Operational Plan directly relate to the
Trust’s financial template submission.
Approved on behalf of the Board of Directors by:
Name
(Chair)
Rob Hughes
Signature
Approved on behalf of the Board of Directors by:
Name
(Chief Executive)
Peter Reading
Signature
Approved on behalf of the Board of Directors by:
Name
(Finance Director)
Caroline Walker
Signature
Name Keith Reynolds
Job Title Assistant Director of Strategy and Planning
e-mail address [email protected]
Tel. no. for
contact
01733 677952
Date 4 April 2014

5 | P a g e
Executive Summary
Peterborough and Stamford Hospital NHS Foundation Trust (PASHNFT) is a busy District General
Hospital serving the needs of the growing population in Peterborough, South Lincolnshire and
neighbouring areas from its sites in Peterborough and Stamford.
Our catchment area is demographically diverse with a relatively young and deprived population in
Peterborough, and a much older population with low levels of deprivation in Lincolnshire and Rutland.
Our catchment population is forecast to grow faster than the national average, particularly in
Peterborough, South Holland and Fenland. The number of people in the over 85 category in Rutland
and Fenland is forecast to grow much faster than the national average over the next five years.
This growth in population is reflected in demand for our services. Hospitals lack the capacity to
continue absorbing this demand and commissioners cannot continue to meet the associated rise in
costs. Commissioners and providers have worked together to develop alternatives to acute care. We
play a key role in working together with communuity services to deliver improvements for the people
we serve whilst reducing the time they spend avoidably in hospital.
Our local planning unit, comprising health and social care commissioners and providers in
Cambridgeshire and Peterborough and South Lincolnshire, has identified areas to reduce hospital
admissions. This includes reducing admissions for coronary heart disease, urinary tract infection, lobar
pneumonia, gastroenteritis, acute upper respiratory tract infection, cellulitis and acute tonsillitis. They
also want to support a higher proportion of older people in living independently at home following
discharge from hospital.
The planning unit want to ensure that when people are admitted to hospital, they are discharged in a
timely way. They also want to reduce deaths involving venous thromboembolism (VTE), medication
errors causing severe harm or death, and harm to children due to inadequate monitoring.
Our Trust is known for providing safe services and good patient experience. More people are choosing
to come here, particularly from South Lincolnshire. We will build on our reputation for quality and
positive patient experience, supported by excellent facilities. We have a high proportion of single
inpatient rooms in one of the most modern hospitals in the NHS. With planned investment in the
Stamford hospital site and new radiotherapy equipment in Peterborough, we anticipate more patients
will choose our Trust for their care.
Our staff are key to delivering ‘Right care; first time; every time.’ We have been too reliant on agency
and locum staff and will place sustained effort in 2014/15 on reducing the number of vacancies so that
we have more of the committed professionals who understand and live our values.
The Trust is also known for facing significant financial challenges, and we will continue to make
improvements in efficiency where this benefits patients. We will deliver a challenging Cost
Improvement Programme of 5% for each of the coming two years, to help deliver a forecast £45.0m
deficit for 2014/15 reducing to £42.3m deficit the following year. The 2014/15 deficit will be higher
than previous years due to the costs of the Project Orange market test, and loss of income associated
with the closure of the Ministry of Defence Hospital Unit (MDHU) in Summer 2014.
Our significant capacity constraints are in cardiology, neurology, gastroenterology and stroke, as well
as some surgical specialties including orthopaedics, ophthalmology, oral and maxillo facial and breast
services. We plan to improve capacity both through additional resource and improved efficiency, but
are placing significant reliance on commissioners reducing demand for emergency activity to deliver
planned activity. Therein lies the significant risk we face.
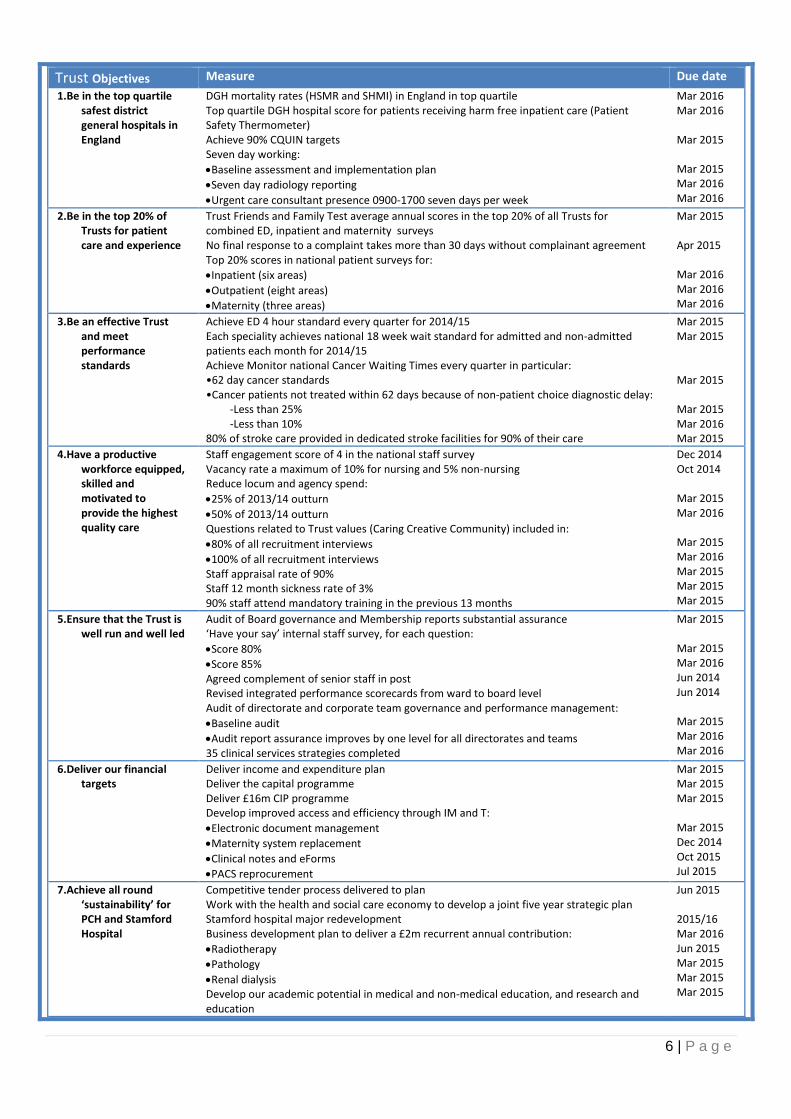
We have agreed the following seven objectives for 2014/15 to 2015/16.
6 | P a g e
Trust Objectives Measure Due date
1.Be in the top quartile safest district general hospitals in England
DGH mortality rates (HSMR and SHMI) in England in top quartile Top quartile DGH hospital score for patients receiving harm free inpatient care (Patient Safety Thermometer) Achieve 90% CQUIN targets Seven day working:
Baseline assessment and implementation plan
Seven day radiology reporting
Urgent care consultant presence 0900-1700 seven days per week
Mar 2016 Mar 2016 Mar 2015 Mar 2015 Mar 2016 Mar 2016
2.Be in the top 20% of Trusts for patient care and experience
Trust Friends and Family Test average annual scores in the top 20% of all Trusts for combined ED, inpatient and maternity surveys No final response to a complaint takes more than 30 days without complainant agreement Top 20% scores in national patient surveys for:
Inpatient (six areas)
Outpatient (eight areas)
Maternity (three areas)
Mar 2015 Apr 2015 Mar 2016 Mar 2016 Mar 2016
3.Be an effective Trust and meet performance standards
Achieve ED 4 hour standard every quarter for 2014/15 Each speciality achieves national 18 week wait standard for admitted and non-admitted patients each month for 2014/15 Achieve Monitor national Cancer Waiting Times every quarter in particular: •62 day cancer standards •Cancer patients not treated within 62 days because of non-patient choice diagnostic delay:
-Less than 25% -Less than 10%
80% of stroke care provided in dedicated stroke facilities for 90% of their care
Mar 2015 Mar 2015 Mar 2015 Mar 2015 Mar 2016 Mar 2015
4.Have a productive workforce equipped, skilled and motivated to provide the highest quality care
Staff engagement score of 4 in the national staff survey Vacancy rate a maximum of 10% for nursing and 5% non-nursing Reduce locum and agency spend:
25% of 2013/14 outturn
50% of 2013/14 outturn Questions related to Trust values (Caring Creative Community) included in:
80% of all recruitment interviews
100% of all recruitment interviews Staff appraisal rate of 90% Staff 12 month sickness rate of 3% 90% staff attend mandatory training in the previous 13 months
Dec 2014 Oct 2014 Mar 2015 Mar 2016 Mar 2015 Mar 2016 Mar 2015 Mar 2015 Mar 2015
5.Ensure that the Trust is well run and well led
Audit of Board governance and Membership reports substantial assurance ‘Have your say’ internal staff survey, for each question:
Score 80%
Score 85% Agreed complement of senior staff in post Revised integrated performance scorecards from ward to board level Audit of directorate and corporate team governance and performance management:
Baseline audit
Audit report assurance improves by one level for all directorates and teams 35 clinical services strategies completed
Mar 2015 Mar 2015 Mar 2016 Jun 2014 Jun 2014 Mar 2015 Mar 2016 Mar 2016
6.Deliver our financial targets
Deliver income and expenditure plan Deliver the capital programme Deliver £16m CIP programme Develop improved access and efficiency through IM and T:
Electronic document management
Maternity system replacement
Clinical notes and eForms
PACS reprocurement
Mar 2015 Mar 2015 Mar 2015 Mar 2015 Dec 2014 Oct 2015 Jul 2015
7.Achieve all round ‘sustainability’ for PCH and Stamford Hospital
Competitive tender process delivered to plan Work with the health and social care economy to develop a joint five year strategic plan Stamford hospital major redevelopment Business development plan to deliver a £2m recurrent annual contribution:
Radiotherapy
Pathology
Renal dialysis Develop our academic potential in medical and non-medical education, and research and education
Jun 2015 2015/16 Mar 2016 Jun 2015 Mar 2015 Mar 2015 Mar 2015

7 | P a g e
Operational Plan
1 The short term challenge
Peterborough and Stamford Hospitals NHS Foundation Trust is an acute services provider with two
sites at Peterborough and Stamford and a total of 612 beds. Our vision is ‘Delivering excellence in
patient centred care in the most efficient way in hospitals where it is great to work.’
Our strategy is in three parts:
Doing the very best inside the hospitals (quality and clinical performance; organizational
development)
Getting value for money from the hospitals (productivity and efficiency; maximizing the value
of the Trust’s estate)
Making the most of the hospitals (relationship management; business development).
We provide services from the new Peterborough City Hospital which is a Private Finance Initiative
(PFI) scheme, and at Stamford Hospital. We have a full range of District General Hospital (DGH)
services and some regional specialties for a catchment areas of just over 500,000 people living in
Peterborough, North and East Cambridgeshire, South Lincolnshire, and East Leicestershire and
Rutland (see Figure 1). The Trust’s main clinical commissioning groups (CCG) are Cambridgeshire
and Peterborough CCG, South Lincolnshire CCG, and East Leicestershire and Rutland CCG.
Figure 1 – Population and income from core areas served by Peterborough and Stamford
Hospitals 2012 populations served by PSH Cambridgeshire and
Peterborough CCG South
Lincolnshire CCG East Leicestershire
and Rutland CCG Total
Core area 257,713 66,375 13,523 337,611
Wider area 58,562 75,719 25,035 170,064
Income 2012-13/£m £116 £47 £5.3
Figure 2 shows the core and wider areas served by the Trust, developed from the percentage of
admitted patients in the past three years.
Core market – electoral ward of residence where >40% patients admitted to PSH
Wider market – electoral ward of residence where 5-40% patients admitted to PSH
Figure 2 - Core and wider areas served by Peterborough and Stamford Hospitals

8 | P a g e
1.1 Demographic profile
The population we serve has a varied demographic profile. Peterborough is predominantly urban with
26% of the population living in the most deprived areas in the country. Parts of South Kesteven have
the least deprived areas.
Peterborough
People living in Peterborough are generally in poorer health than the average English population
(Figure 3). Deprivation is higher than average and about 9,500 children live in poverty. Life
expectancy for men is lower than average. Life expectancy is 9.4 years lower for men and 5.6 years
lower for women in the most deprived areas of Peterborough than in the least deprived areas.
Figure 3 - Peterborough health profile
Over the last 10 years, all-cause mortality rates have fallen. The early death rate from heart disease
and stroke has fallen, but is still worse than average.
In school Year 6, 19.2% of children are classified as obese. Levels of teenage pregnancy, GCSE
attainment and smoking in pregnancy are worse than average. The estimated level of adult smoking
is worse than average as are rates of road injuries and deaths and hospital stays for alcohol related
harm.

9 | P a g e
The level of alcohol-specific hospital stays among those under 18 is better than average.
Priorities in Peterborough include reducing premature mortality, reducing inequalities in coronary
heart disease and promoting healthy lifestyles.
South Kesteven
The health of people in South Kesteven is generally better than the English average (Figure 4).
Deprivation is lower than average, however about 3,500 children live in poverty. Life expectancy for
both men and women is higher than average.
Figure 4 - South Kesteven health profile
Life expectancy is 8.6 years lower for men and 5.0 years lower for women in the most deprived areas
of South Kesteven than in the least deprived areas.
Over the last 10 years, all cause mortality rates have fallen. The early death rate from heart disease
and stroke has fallen and is better than average.
About 17.5% of Year 6 children are classified as obese. The level of smoking in pregnancy is worse
than average and alcohol-specific hospital stays is better (lower) than average. Levels of teenage

10 | P a g e
pregnancy, GCSE attainment and alcohol-specific hospital stays among those under 18 are better
than average.
An estimated 19.3% of adults smoke and 24.3% are obese. The rate of road injuries and deaths is
worse than average. Rates of sexually transmitted infections, smoking related deaths and hospital
stays for alcohol related harm are better than average. The rate of statutory homelessness is higher
than average.
Priorities in South Kesteven include tackling alcohol and tobacco abuse, and obesity.
1.2 Population
Office for National Statistics data for the Trust catchment population shows that it has grown at a rate
higher than the national average and will continue do so for at least the next five years. Total
population growth between 2002 and 2012 was 12.5%, increasing from 453k to 510k. This is 6%
higher than the rest of England which grew by 7.5%. The populations of Peterborough, South
Kesteven and South Holland have grown faster than average due to housebuilding and inward
migration.
The population is projected to grow at 5.7% over the next five years (Table 1), 0.6% above the
national average of 5.1%; the fastest growth in our catchment area will be in Peterborough (6.9%).
Table 1 - Population projections 2014 to 2019
Whole population/ ’000s Population forecast over 85/’000s
Area 2014 2019 % change 2014 2019 % change
England 53,493 56,198 5.1% 1,221 1,506 23.3%
East of England 6,003 6,295 4.9% 161 192 18.7%
PSH Trust area 869 919 5.7% 22.3 26.7 19.7%
-Peterborough 186 199 6.9% 3.4 3.9 14.7%
-Fenland 100 106 6.7% 3.0 3.7 23.3%
-Hunts 173 180 4.0% 3.9 4.7 20.5%
-E Northants 89 93 5.3% 2.3 2.7 17.4%
-S Holland 93 100 7.5% 3.0 3.6 20.0%
-S Kesteven 139 147 5.5% 4.0 4.7 17.5%
-Rutland 38 40 4.9% 1.3 1.7 30.8%
-Melton 51 53 3.7% 1.4 1.7 21.4%
Growth in the number of people aged over 85 years, is projected to grow at less than the national
average, but at a higher rate than the general population. The Office for National Statistics1 predicts
1 Office for National Statistics 2010 based subnational population predictions, quinary age groups, persons
(accessed Feb 2014)

11 | P a g e
that the number of people aged over 85 in our area will grow by 19.7% over the period 2014 to 2019,
compared with 18.7% for the East of England, and 23.3% for England. However, growth in this age
group will be much higher in two areas in our catchment; forecast growth in Rutland is 30.8%, and
Fenland is 23.3%.
This growth and ageing of the population will bring significant pressures on local health services as
people require increasing levels of care and support.
1.3 Local health economy
Cambridgeshire and Peterborough CCG (CPCCG), our main local commissioner, has amongst the
lowest per capita financial allocation in the country, 4.1% lower than the average or £35m. The
provider landscape is complex and financially-challenged, including our Trust which is under a Monitor
enforcement notice due to a recurrent £40 million deficit. The wider financial position has resulted in
CPCCG being in financial recovery for 2013/14 with a forecast year end outturn of between £4m to
£6m deficit.
Resource allocations to CCG’s announced in December uplifted the historical allocation by 2.9% in
2014/15 and by 2.45% in 2015/16, against an average of 2.5% for all CCG’s. The higher uplift in
allocation, the highest in East Anglia, goes part way to address the distance from target.
1.4 Better CareFund (BCF)
The government decision to move a total £3.2bn of health funding to social care in 2015/16 will
transfer £74m of funding from our main commissioners to support greater integration of health and
social care and reduce demand for health services. Reduction in funding will be allocated
proportionately across all providers, but we expect this to impact on our income from 2015/16.
Table 2 shows the highest transfer of funding will be from our main commissioner, Cambridgeshire
and Peterborough CCG (£47m), although the details of the impact on our Trust have not yet been
agreed.
Table 2 - Better Care Fund allocation to transfer from NHS to social care budgets 2015/16
Cambs and Pet CCG South Lincs CCG E Leics & Rut CCG Total
Better Care Fund allocation 2015/16
47,034 9,810 17,232 74,076
This poses a significant challenge and requires the local health economy partners to work together to
better serve the local population without defaulting to hospital care. The Trust has worked with
partners in the Local Health Economy to develop proposed schemes for the BCF and a wider five year
strategy.
1.5 The planning process
Given the scale of the challenge facing the Trust and the wider health economy, it is essential that all
health (commissioners and providers) and social care partners work together to develop locally owned
and agreed plans. Monitor and NHS England require local health economies to work toegther in
planning units across England. The Cambridgeshire and Peterborough planning unit has facilitated
mutual working between commissioners and providers, and shared assumptions. The Cambridgeshire
and Peterborough CCG agreed the following vision for the delivery of future services:
“As a health and social care system in Cambridgeshire and Peterborough, we will operate in an integrated way, putting patients’ best interests at the heart of all decision-making to achieve the best care outcomes for patients, their carers and the population. By working together in an open and transparent way, we, as commissioners and providers of care, aim to maximise the wellbeing of the population and provide the safest, highest quality care outcomes for patients in our system. We aspire to commission and provide the
safest, highest quality care and best patient experience within the resources available. We will seek to maximise the amount of care provided outside hospital as close to the patient’s home as possible.”
Cambridgeshire and Peterborough Outline Strategic 5 Year Plan 2014/15 to 2018/19 (Feb 2014)

12 | P a g e
Commissioner priorities to address these issues are:
1.Securing additional years of life for our local population with treatable conditions as measured
by potential years of life lost (PYLL) from causes amenable to healthcare with a focus on
cornonary heart disease and other areas yet to be identified.
2.Improving the health related quality of life of people with one or more long-term condition by
measuring patient reported outcomes of treatment using EQ 5D scores in the GP survey, and
using the results to identify key areas for improvement.
3.Reducing the amount of time people spend avoidably in hospital through better and more
integrated care in the community, outside of hospital by reducing admissions for:
Urinary tract infection
Lobar pneumonia
Gastroenteritis
Acute upper respiratory tract infection
Cellulitis
Acute tonsillitis
4.Increasing the proportion of older people living independently at home following discharge from
hospital by:
Expanding teams to provide 7 day discharge planning and discharge
Developing a ‘return home’ package with voluntary sector to aid speedy discharge and
post hospital discharge support
Establishing a joint team to oversee integration activity e.g. joint assessments, joined
up packages of care
Move to 7 day working for The Firm2 and multi-disciplinary teams and build on existing
intermediate care capacity and support
Improving psychiatric liaison support and mental health presence in MDTs
Developing the potential of telehealth and telecare as well as assistive technologies
Enhancing dementia care support for patients and provide better support for carers
5.Increasing the number of people having a positive experience of hospital care through timely
discharge.
6.Making significant progress towards eliminating avoidable deaths in our hospitals caused by
problems in care. This will be achieved through reducing deaths involving venous
thromboembolism (VTE), reducing the incidence of medication errors causing severe harm or
death, and reducing the incidence of harm to children due to failure to monitor.
The local planning unit anticipates a 15% reduction in emergency hospital admissions, although it is
not clear over what timeframe. Given the experience of recent years, it is far from clear whether
schemes are able to deliver, and there is a high level of risk with this ambition.
NHS England and Monitor recently announced additional support for the 11 most challenged health
economies, including Cambridgeshire and Peterborough, to develop integrated plans which deal with
the particular local challenges we face. This work is due to start shortly with findings presented at the
end of July 2014.
1.6 Project Orange
We moved into a new site, Peterborough City Hospital, in December 2010, funded through the Private
Finance Initiative (PFI). Since then, we have consistently made losses and reported the highest
2 The Firm is a 24 hour GP led triage service for elderly patients with complex needs referred by GP’s for possible
admission to hospital
13 | P a g e
proportional deficit in the NHS in the financial year ended 31 March 2012. In financial year 2013/14,
the Trust incurred an underlying deficit of c£37m - £40m.
The Trust is in breach of its terms of authorisation and was found in 2013 to be clinically and
operationally sustainable, but financially unsustainable. Monitor issued an enforcement notice which
requires that we deliver a £13m cost improvement each year for 2013/14 and 2014/15, and seek
ways of delivering better value from the PFI building through a tendering process. Patients’ interests
must remain at the heart of the solution and the burden should not be shifted onto other
organisations or local populations.
The Monitor Enforcement Undertaking requires a tender process to be undertaken “aimed at securing
the maximum value for patients and taxpayers from the utilisation of the Licensee’s assets”. The
Trust Board is clear that the delivery of the above outcome must be in the context of the Trust
maintaining and improving the quality of both clinical outcomes and patient experience. In addition,
the tender process must result in the Trust’s hospitals being run by an organisation, whether the
Trust itself or another healthcare provider, that can provide ongoing clinical and financial
sustainability. We aim to appoint a successful bidder by July 2015, and seek approval to move to the
new arrangement by January 2016. Compliance with the Enforcement Notice is a key element of this
annual plan.
2 Trust objectives 2014/15 to 2015/16
The Trust Board has agreed seven objectives summarised in Table 4. They align to the Monitor
enforcement notice, and commissioner priorities. There are links to patient safety and experience,
long term financial sustainability of the health system as well as support for staff who will deliver the
service throughout this short term challenge. Objectives were developed through engagement with
senior clinical leaders, the Trust Board and the Council of Governors and are supported by directorate
and specialty level plans.
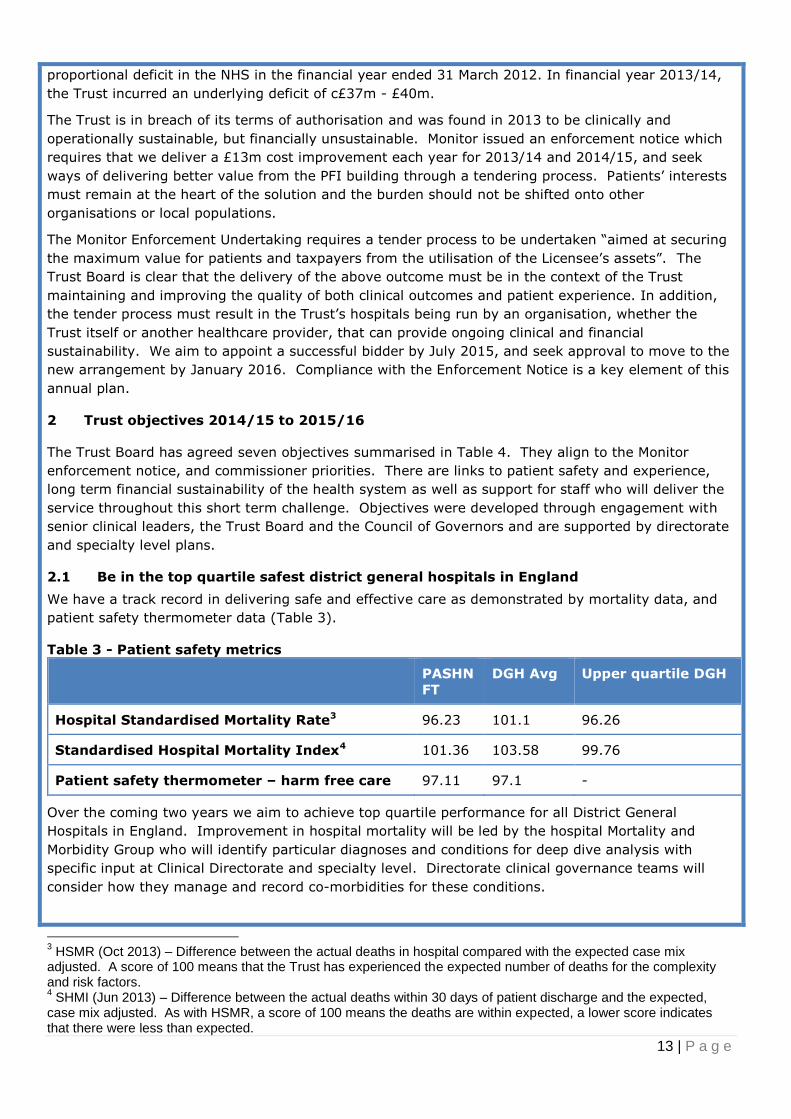
2.1 Be in the top quartile safest district general hospitals in England
We have a track record in delivering safe and effective care as demonstrated by mortality data, and
patient safety thermometer data (Table 3).
Table 3 - Patient safety metrics
PASHN
FT
DGH Avg Upper quartile DGH
Hospital Standardised Mortality Rate3 96.23 101.1 96.26
Standardised Hospital Mortality Index4 101.36 103.58 99.76
Patient safety thermometer – harm free care 97.11 97.1 -
Over the coming two years we aim to achieve top quartile performance for all District General
Hospitals in England. Improvement in hospital mortality will be led by the hospital Mortality and
Morbidity Group who will identify particular diagnoses and conditions for deep dive analysis with
specific input at Clinical Directorate and specialty level. Directorate clinical governance teams will
consider how they manage and record co-morbidities for these conditions.
3 HSMR (Oct 2013) – Difference between the actual deaths in hospital compared with the expected case mix
adjusted. A score of 100 means that the Trust has experienced the expected number of deaths for the complexity and risk factors. 4 SHMI (Jun 2013) – Difference between the actual deaths within 30 days of patient discharge and the expected,
case mix adjusted. As with HSMR, a score of 100 means the deaths are within expected, a lower score indicates that there were less than expected.

14 | P a g e
Table 4 - Trust objectives 2014/15 to 2015/16
Trust Objectives Measure Due date 1. Be in the top quartile safest district general hospitals in England
DGH mortality rates (HSMR and SHMI) in England in top quartile Top quartile DGH hospital score for patients receiving harm free inpatient care (Patient Safety Thermometer) Achieve 90% CQUIN targets Seven day working:
Baseline assessment and implementation plan
Seven day radiology reporting
Urgent care consultant presence 0900-1700 seven days per week
Mar 2016 Mar 2016 Mar 2015 Mar 2015 Mar 2016 Mar 2016
2. Be in the top 20% of Trusts for patient care and experience
Trust Friends and Family Test average annual scores in the top 20% of all Trusts for combined ED, inpatient and maternity surveys No final response to a complaint takes more than 30 days without complainant agreement Top 20% scores in national patient surveys for:
Inpatient (six areas)
Outpatient (eight areas)
Maternity (three areas)
Mar 2015 Apr 2015 Mar 2016 Mar 2016 Mar 2016
3. Be an effective Trust and meet performance standards
Achieve ED 4 hour standard every quarter for 2014/15 Each speciality achieves national 18 week wait standard for admitted and non-admitted patients each month for 2014/15 Achieve Monitor national Cancer Waiting Times every quarter in particular: •62 day cancer standards •Cancer patients not treated within 62 days because of non-patient choice diagnostic delay:
-Less than 25% -Less than 10%
80% of stroke care provided in dedicated stroke facilities for 90% of their care
Mar 2015 Mar 2015 Mar 2015 Mar 2015 Mar 2016 Mar 2015
4. Have a productive workforce equipped, skilled and motivated to provide the highest quality care
Staff engagement score of 4 in the national staff survey Vacancy rate a maximum of 10% for nursing and 5% non-nursing Reduce locum and agency spend:
25% of 2013/14 outturn
50% of 2013/14 outturn Questions related to Trust values (Caring Creative Community) included in:
80% of all recruitment interviews
100% of all recruitment interviews Staff appraisal rate of 90% Staff 12 month sickness rate of 3% 90% staff attend mandatory training in the previous 13 months
Dec 2014 Oct 2014 Mar 2015 Mar 2016 Mar 2015 Mar 2016 Mar 2015 Mar 2015 Mar 2015
5. Ensure that the Trust is well run and well led
Audit of Board governance and Membership reports substantial assurance ‘Have your say’ internal staff survey, for each question:
Score 80%
Score 85% Agreed complement of senior staff in post Revised integrated performance scorecards from ward to board level Audit of directorate and corporate team governance and performance management:
Baseline audit
Audit report assurance improves by one level for all directorates and teams 35 clinical services strategies completed
Mar 2015 Mar 2015 Mar 2016 Jun 2014 Jun 2014 Mar 2015 Mar 2016 Mar 2016
6.Deliver our financial
targets
Deliver income and expenditure plan Deliver the capital programme Deliver £16m CIP programme Develop improved access and efficiency through IM and T:
Electronic document management
Maternity system replacement
Clinical notes and eForms
PACS reprocurement
Mar 2015 Mar 2015 Mar 2015 Mar 2015 Dec 2014 Oct 2015 Jul 2015
7.Achieve all round
‘sustainability’ for PCH and
Stamford Hospital
Competitive tender process delivered to plan Work with the health and social care economy to develop a joint five year strategic plan Stamford hospital major redevelopment Business development plan to deliver a £2m recurrent annual contribution:
Radiotherapy
Pathology
Renal dialysis Develop our academic potential in medical and non-medical education, and research and education
Jun 2015 2015/16 Mar 2016 Jun 2015 Mar 2015 Mar 2015 Mar 2015

15 | P a g e
Increasing harm free patient care will focus on investigating and learning from mortality data,
extending the falls prevention programme, reducing urinary tract infections and C diff, and improving
the response to early warning signs that an inpatient’s health is deteriorating.
Safety of patients over the weekends is recognised by the NHS nationally and locally as an area for
improvement. In 2014/15, the Deputy Medical Director will prepare a seven day service specification
in line with the East Midlands Provider Collaborative Seven Day Services project, supported by local
specialty and directorate plans. Our baseline assessment of current provision will be used to develop
an implementation plan including an outline of the requirements and investment proposals for the
required medical cover. By 2015/16, we will increase urgent care consultant presence to 0900 to
1700 hours seven days per week, and increase radiology reporting at weekends.
2.2 Be in the top 20% of Trusts for patient care and experience
Our national Friends and Family Test scores put the Trust just outside the top quartile of all Trusts in
the combined inpatient, ED and maternity scores (Table 5).
Table 5 - National Friends and Family Test (FFT) results
PSH All NHS Providers
National FFT (Apr-Nov 2013) Average (mean) Top quartile
Combined ED, maternity and inpatient 71 63 73
Each directorate has identified areas for further improvement and developed action plans which
should bring the Trust into the top 20% by April 2015.
We will manage our complaints more effectively. When patients and carers need to complain about
any aspect of their care, we have a responsibility to investigate concerns in a timely and thorough
manner. Whilst parts of the Trust have performed well in responding within agreed timescales, this
has not been achieved consistently. By March 2015, no final response to a complaint should take
more than 30 days without the agreement of the complainant.
National patient surveys provide a good insight into our patient’s experience. The Care Quality
Commission (CQC) assess all national surveys and rates Trusts as ‘Better than average’ when scores
are within the top 20%. We perform better than average in a few areas of our national surveys and
average in other areas5. In the most recent surveys, we have three areas in the top 20% in the
inpatient survey, average scores for maternity and one area in the bottom 20% for the Emergency
Department survey (receiving test results before leaving the department). We aim to achieve no
scores in the bottom 20% and have top 20% scores in more areas by March 2016:
Inpatient (six areas)
ED (two areas)
Maternity (three areas)
2.3 Be an effective Trust and meet performance standards
For 2013/14, we are forecast to meet most of the national standards Monitor requires us to achieve
as a condition of our authorisation. Along with an increasing number of Trusts, we are failing to meet
the 4 hour standard, have exceeded the number of patients with C difficile, and for the final quarter
will not meet the 18 week admitted referral to treat standard.
Our position year to date as of January 2014 is shown in Table 6.
5 Surveys are conducted over different periods, the most recent being Inpatient 2012
http://www.cqc.org.uk/survey/inpatient/RGN ED 2012 http://www.cqc.org.uk/survey/accidentemergency/RGN and Maternity 2013 http://www.cqc.org.uk/survey/maternity/RGN

16 | P a g e
We will develop robust plans to improve the flow of patients and ensure that those who need to be
admitted are not delayed in the Emergency Department (ED). An urgent care pathway programme
board with six work streams will bring together senior clinical leadership and managers with the
Service Improvement and Transformation Team. They will develop high level plans, a monitoring
framework and progress reports to deliver improvement across the Trust to improve flow through the
Trust and ensure that patients who need to be admitted do so consistently throughout the year within
four hours. This work programme is key to the delivery of the 4 hour A&E and 18 week standards.
Table 6 - Monitor compliance framework January 2014
Monitor compliance framework standard Target YTD
RTT 18 weeks – admitted 90% 90.5%
RTT 18 weeks - non-admitted 95% 97.1%
RTT 18 weeks – incomplete pathways 92% 97.8%
Cancer 2 week wait 93% 97.2%
Cancer 31 day RTT 96% 99.9%
Cancer 62 day RTT 85% 89.1%
Cancer 62 day screening 90% 93.3%
Cancer – subsequent treatment – drugs 98% 100.0%
Cancer – subsequent treatment – surgery 94% 99.2%
Cancer – subsequent treatment – radiotherapy 94% 99.7%
Cancer – subsequent treatment – all 96% 99.8%
Breast symptomatic 93% 97.4%
A&E 4 hours or less 95% 93.6%
C diff rates - inpatient 26 31
MRSA6 bacteraemia 1 0
With the increasing demand for emergency care leading to less predictable elective capacity, the Trust
Management Board identified areas where we need to focus more on each stage of the 18 week
referral to treat (RTT) pathway to prevent breaches. We will continue to place increased emphasis on
managing each stage of the elective pathway to ensure that patients receive timely care.
We met the standards of care for patients with cancer or who have had a stroke, but have included
this as an objective for the coming two years to maintain focus on these important areas. Relevant
specialties have prepared plans to deliver sustainable performance.
2.4 Productive motivated workforce
The Trust has identified a number of key performance indicators for 2014/15 and 2015/16. Current
performance against these is summarised in Table 7.
We will measure our staff motivation using the National Staff Survey staff engagement score. In the
2013 national NHS staff survey, our score was 3.77 compared with an average of 3.74. We aim to
achieve a score of 4.0 in the 2014 survey through the various improvements we are making to staff
recruitment and engagement.
We will decrease reliance on locum and agency staff through reducing vacancies across the Trust. A
summary of the workforce plan is given at Table 8.
6 MRSA - meticillin-resistant staphylococcus aureusis

17 | P a g e
Table 7 - Workforce Key Performance Indicators
The Trust has a high number of vacancies for qualified nurses. The December 2013 vacancy rate was
15.33% for nursing and 6.12% for all other employees. Improvements in this area will not only
improve the quality of care by reducing our reliance on bank and agency staffing, but will also reduce
the cost of employing temporary workers.
We plan to reduce nurse vacancies to 10% of posts and non-nursing positions to 5% by October
2014. This will result in a reduction of locum and agency costs by almost 50% in 2014/15. Further
reductions in agency costs will be achieved through reducing premium pay costs where this is not
substantively covering a post, and reviewing the procurement of locum and agency staff to ensure we
are getting the best value for money.
Recruitment and retention will be improved through:
Band 5 nursing campaign which includes international recruitment from March 2014 onwards,
supported by a local advertising campaign targeted at nursing staff, and open days for those
considering a career in or a return to nursing.
Medical staff will be offered posts as trust grade doctors where possible.
We will reduce the time it takes to hire staff by reviewing the recruitment process and
introducing real time monitoring of the time it takes to hire individuals.
Collation and sharing of anonymous exit interview information to better understand why staff
leave the Trust.
Table 8 - Workforce plan 2014/15 to 2015/16
Staff group 2013/14
FOT £m
2014/15
Plan £m
Change 2015/16
Plan £m
Change
Consultants (not locums) 25.3 27.1 7.0% 27.1 0
Locum Consultants 7.1 3.3 -52.2% 3.3 0
Junior Medical 14.6 16.2 11.0% 16.2 0
Nurse & Midwives (Total inc Bank) 45.2 50.3 11.1% 50.3 0
Scientific, Tech & Therapies (inc bank) 19.3 18.4 -4.9% 18.4 0
Nurses and Midwives – agency/contr 2.9 0.9 -67.9% 0.9 0
Scien, Tech & Ther -agency, contract 0.6 0.1 -84.8% 0.1 0
Healthcare assistants 11.9 12.7 7.0% 12.7 0
Total clinical 126.9 129.0 1.6% 128.0 -0.8%
Non-clinical staff 29.0 30.8 6.0% 30.1 0
Analysis of staff costs
Permanent Staff 143.9 153.7 6.8% 152.7 -0.7%
Locums, Agency & Contract Staff 12.0 6.1 -49.3% 6.1 0
Total staff costs 155.9 159.7 2.5% 158.8 -0.6%
Key performance indicator Current Target
National Staff survey staff engagement score 3.77 4.0
Nursing vacancies 14.73% 10%
Other vacancies 7.65% 5%
Sickness rate 3.17% 3.0%
Appraisals 81% 90%
Mandatory training 51.7% 90%

18 | P a g e
Staff appraisal improves productivity by sharing a clear vision and expectation of individuals and
providing the opportunity to identify skills gaps. The Trust average 12 months staff appraisal rate as
of December 2013 was 80%, and we aim to increase this to 100% of eligible staff by December 2014
through close performance management arrangements from Board to ward.
We will continue the roll out of the ‘My Personal Appraisal’ (MPA) process across the Trust from March
2014, backed with training which focusses on the skills required to provide high quality appraisal.
We manage sickness absence as well as the private sector and better than the average public sector
organisation according to data provided by the Chartered Institute for Personnel Development7 (Table
9). Actions described previously should make an indirect improvement on sickness levels towards our
target of 3% by March 2015. We plan to ensure staff and managers follow the Trust sickness policy,
promoting use of the Occupational health and wellbeing services and ‘talking therapies’, and early
referral for musculo-skeletal advice.
Table 9 - Trust sickness rates compared with national sectors 2013
Employer Avg working time lost per
year 5% trimmed mean
Peterborough and Stamford Hospitals* 3.17%
Public sector services:
- Central government
- Education
- Health
- Local government
3.8%
3.7%
3.6%
4.8%
3.9%
Private sector services 3.2%
* as of December 2013
Mandatory training attendance remains a concern for the Trust and we aim to improve attendance to
at least 90% of all staff (allowing for turnover and long term absence) by March 2015. Directorates
have developed local plans to achieve this, and corporately there will be increased use of e-Learning
where appropriate to provide staff with more convenient access.
Our values are summarised as ‘Caring, Creative, and Community’. We will embed these into the
organisation from April 2014 by starting to assess of an individual’s values compared with the Trust
values. This will be included in our recruitment processes in 2014/15. It is planned that this
approach will extend to appraisal at a future date.
2.5 Ensure that the Trust is well run and well led
Monitor has reviewed the governance of the Trust and whilst finding that we were in breach of our
duty to be well governed in April 2013, the Contingency Planning Team (CPT) report produced in
September 2013 provided assurance that the Trust is clinically and operationally sustainable. The
Trust Board has since assessed the improvements we have made including a strengthened finance
function, board challenge and review, and further development and scrutiny from the Board’s Quality
Assurance and Finance and Investment Committees. The Trust has confirmed these improvements
with Monitor.
In the next two years we aim to achieve substantial assurance in the internal audits of corporate
governance. Our internal staff survey, ‘Have your say’ has questions relating to how staff perceive
leadership of the Trust. We aim to achieve scores of 80% in these sections by March 2015 and 85%
by March 2016.
7 Absence Management Annual Survey Report 2013 http://www.cipd.co.uk the survey was completed by 618
respondents in June–July 2013.
19 | P a g e
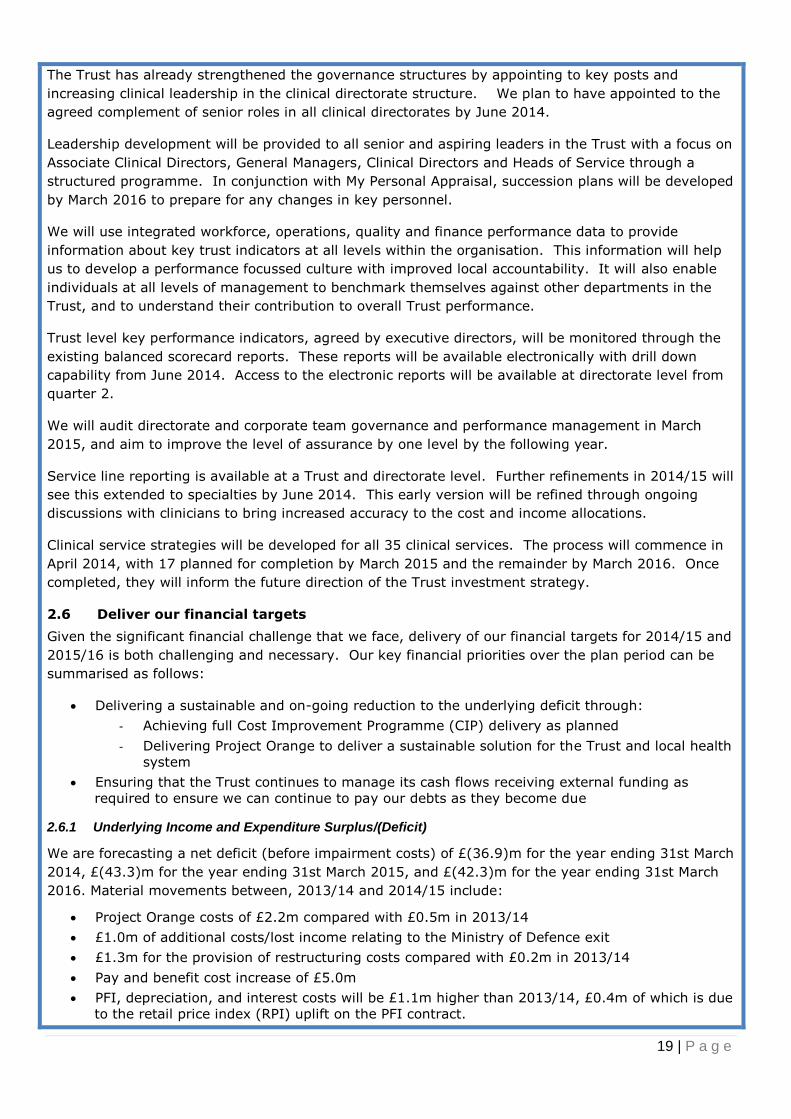
The Trust has already strengthened the governance structures by appointing to key posts and
increasing clinical leadership in the clinical directorate structure. We plan to have appointed to the
agreed complement of senior roles in all clinical directorates by June 2014.
Leadership development will be provided to all senior and aspiring leaders in the Trust with a focus on
Associate Clinical Directors, General Managers, Clinical Directors and Heads of Service through a
structured programme. In conjunction with My Personal Appraisal, succession plans will be developed
by March 2016 to prepare for any changes in key personnel.
We will use integrated workforce, operations, quality and finance performance data to provide
information about key trust indicators at all levels within the organisation. This information will help
us to develop a performance focussed culture with improved local accountability. It will also enable
individuals at all levels of management to benchmark themselves against other departments in the
Trust, and to understand their contribution to overall Trust performance.
Trust level key performance indicators, agreed by executive directors, will be monitored through the
existing balanced scorecard reports. These reports will be available electronically with drill down
capability from June 2014. Access to the electronic reports will be available at directorate level from
quarter 2.
We will audit directorate and corporate team governance and performance management in March
2015, and aim to improve the level of assurance by one level by the following year.
Service line reporting is available at a Trust and directorate level. Further refinements in 2014/15 will
see this extended to specialties by June 2014. This early version will be refined through ongoing
discussions with clinicians to bring increased accuracy to the cost and income allocations.
Clinical service strategies will be developed for all 35 clinical services. The process will commence in
April 2014, with 17 planned for completion by March 2015 and the remainder by March 2016. Once
completed, they will inform the future direction of the Trust investment strategy.
2.6 Deliver our financial targets
Given the significant financial challenge that we face, delivery of our financial targets for 2014/15 and
2015/16 is both challenging and necessary. Our key financial priorities over the plan period can be
summarised as follows:
Delivering a sustainable and on-going reduction to the underlying deficit through:
- Achieving full Cost Improvement Programme (CIP) delivery as planned
- Delivering Project Orange to deliver a sustainable solution for the Trust and local health
system
Ensuring that the Trust continues to manage its cash flows receiving external funding as
required to ensure we can continue to pay our debts as they become due
2.6.1 Underlying Income and Expenditure Surplus/(Deficit)
We are forecasting a net deficit (before impairment costs) of £(36.9)m for the year ending 31st March
2014, £(43.3)m for the year ending 31st March 2015, and £(42.3)m for the year ending 31st March
2016. Material movements between, 2013/14 and 2014/15 include:
Project Orange costs of £2.2m compared with £0.5m in 2013/14
£1.0m of additional costs/lost income relating to the Ministry of Defence exit
£1.3m for the provision of restructuring costs compared with £0.2m in 2013/14
Pay and benefit cost increase of £5.0m
PFI, depreciation, and interest costs will be £1.1m higher than 2013/14, £0.4m of which is due
to the retail price index (RPI) uplift on the PFI contract.

20 | P a g e
2.6.2 Income
Contracting principles based on those used last year were agreed with all significant commissioners.
Baseline activity was used to inform discussions about any changes. Commissioner Quality,
Innovation, Productivity and Prevention (QIPP) schemes for this year are ambitious, but have been
provided in more detail than previously, and are now sufficiently detailed to be mapped into the
Indicative Activity Plan (IAP). The Trust is planning for 50% of the Commissioners £9.1m QIPP target.
We have a single set of Commissioning for Quality Innovation (CQUIN) schemes across both lead
CCGs with the exception of one scheme, which should be finalised shortly.
There will be minor changes to contractual penalties compared with those in 2013/14:
Penalties will be per breach rather than the current percentage of service line
Penalties are subject to a nationally agreed cap of 2.5% in a quarter.
Areas where the Trust is at risk of incurring penalties based on current performance include the A&E
and 18-week referral to treat (RTT) targets. Under the 2014/15 arrangements penalties will become:
A&E £200 per breach (beyond the 95% threshold).
RTT £400 per breach (beyond the 90% Admitted RTT threshold).
MRSA £10,000 per case over threshold.
C-Diff £10,000 per case over threshold.
We moved to a new pricing structure for non-PbR activity in 2013/14 and because of the significant
change to previous rates, a 3-year phasing was agreed with commissioners in line with the PbR code
of conduct. In 2013/14, we received 1/3 of the difference, with 2/3 now reflected in the IAP for
2014/15. In net terms the impact of this increase for 2014/15 offsets the impact of the 1.5% tariff
deflator.
2.6.3 Expenditure planning
Detailed activity budgets 2014/15 have been developed with the involvement of Directorates to
ensure that resources including staffing, match the planned levels of activity.
Operating costs, excluding depreciation, are budgeted for 2014/15 at £244.5m. This compares with
forecast operating costs in 2013/14 of £242.0m and £245.7m in 2015/16.
Material changes between 2014/15 and 2013/14 forecast outturn include:
Pay
- Award of pay increments of £2.4m
- Additional staff to achieve safe staffing levels of £1.6m
- Inflationary pressure of £1.6m
- MOD exit staff backfill of £0.8m
Reduced activity resulting from QIPP schemes being delivered saving pay and related costs of
£1.3m
Clinical Negligence Scheme for Trusts, the Trust’s ‘insurance’ scheme, will incur an additional
premium of £1.2m
2.6.4 Private Finance Initiative (PFI)
PFI payments for 2014/15 of £19.3m are budgeted to be £0.4m higher than in 2013/14 in line with
the 2% RPI in the contract.
2.6.5 Revenue: Income and Expenditure planning
The income and expenditure referred to above has been analysed and modelled into an Income and
Expenditure account, a summary is in Table 10.
21 | P a g e
Table 10 - Income and Expenditure 2014/15 to 2015/16
Forecast
2013/14
Budget
2014/15
Plan 2015/16
Income
NHS clinical income 213.4 213.3 214.3
Other income 20.6 20.1 20.1
Total income 234.0 233.4 234.4
Expenditure
Pay 154.9 159.9 161.0
Consumables 68.2 65.3 64.7
Private Finance Initiative 18.9 19.3 19.8
Total expenditure 242.0 244.5 245.7
EBITDA (8.0) (11.1) (11.1)
Depreciation 13.4 13.9 14.4
Interest 12.5 12.7 13.0
Loss on assets disposed 0.2 0.0 0.0
Deficit from operations (34.1) (37.7) (38.5)
Restructuring costs 0.2 1.3 1.3
PMO costs 2.1 2.1 2.1
Project Orange costs 0.5 2.2 0.4
Deficit before impairment (36.9) (43.3) (42.3)
Impairment costs 1.0 1.7 0.0
Retained deficit (37.9) (45.0) (42.3)
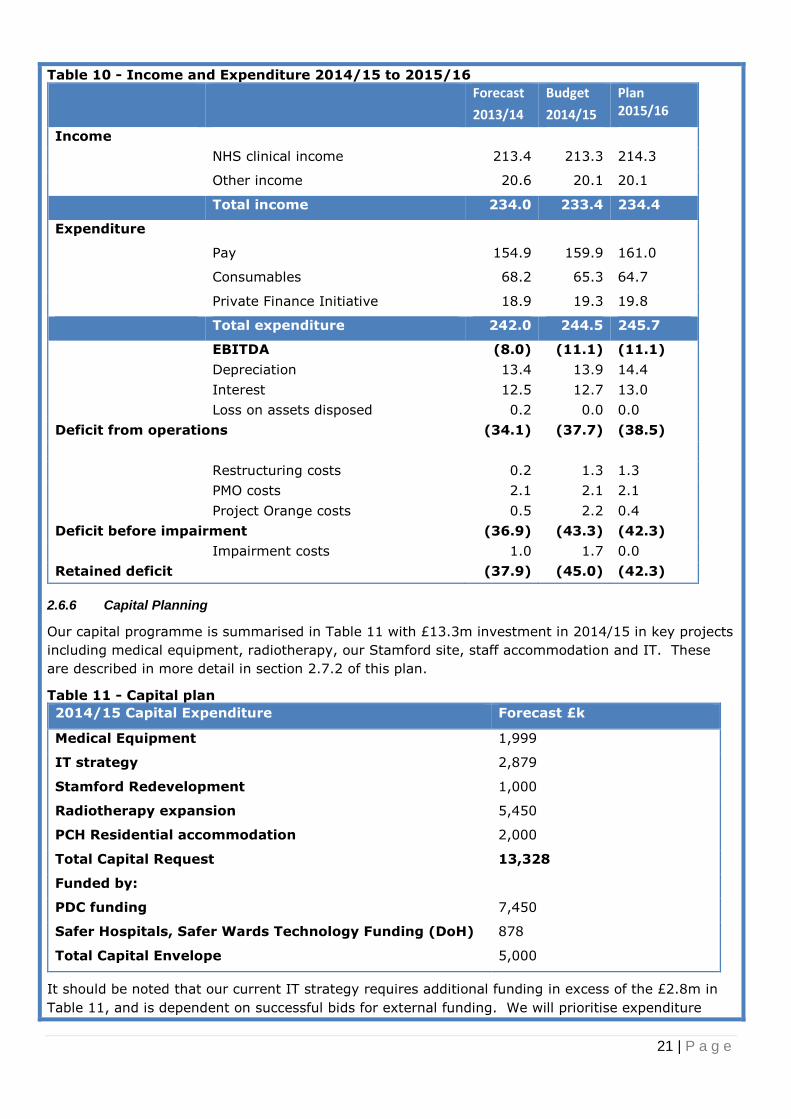
2.6.6 Capital Planning
Our capital programme is summarised in Table 11 with £13.3m investment in 2014/15 in key projects
including medical equipment, radiotherapy, our Stamford site, staff accommodation and IT. These
are described in more detail in section 2.7.2 of this plan.
Table 11 - Capital plan
2014/15 Capital Expenditure Forecast £k
Medical Equipment 1,999
IT strategy 2,879
Stamford Redevelopment 1,000
Radiotherapy expansion 5,450
PCH Residential accommodation 2,000
Total Capital Request 13,328
Funded by:
PDC funding 7,450
Safer Hospitals, Safer Wards Technology Funding (DoH) 878
Total Capital Envelope 5,000
It should be noted that our current IT strategy requires additional funding in excess of the £2.8m in
Table 11, and is dependent on successful bids for external funding. We will prioritise expenditure

22 | P a g e
within the available funding.
2.6.7 Cost improvement programme (CIP)
We agreed with Monitor as part of our enforcement notice that we would deliver a recurrent £13m
cost improvement in 2014/15. The Trust has set an internal stretch target of £16m CIP, to mitigate
against any potential risks to delivery.
Detailed schemes identified to date total £13m which will absorb some of the inflationary pressure
and deliver reductions in the overall deficit. Whilst most of these schemes are for 2014/15, some will
extend into 2015/16. The 2014/15 schemes totalling £13m to date are shown in Table 12.
Table 12 - Cost improvement schemes 2014/15
Schemes Effect
14/15
Pay (balances in pay) £6.5m
Income £2.6m
Health care providers £1.5m
Clinical supplies/services £1.2m
Other including procurement,
insurance etc
£1.2m
Total £13m
2.6.8 Cost improvement schemes
Pay cost improvement of £6.5m will be achieved through reduced medical and dental locum
expenditure, supported by recruitment to substantive posts. Medical agency provision will be
reviewed to improve value for money. We will review senior management posts in corporate
functions and throughout the Trust.
£1.5m health care provider costs will be reduced through repatriation of surgical activity outsourced
to private providers due to lack of capacity within the Trust as we increase elective capacity. The
Urgent Care Programme Board will be instrumental in delivering greater efficiency for urgent care with
the corresponding increase in elective capacity.
Income related CIP schemes of £2.6m include the protection of elective activity, improved efficiency
in the pathology service to increase capacity for direct access testing and increased critical care
capacity with a resulting increase in income for the Trust.
We will adopt ‘lean’ methodology across the Trust to deliver improvement in the way we work. Front
line staff will be trained in recognised tools and techniques such as structured problem solving to help
identify ways of working more efficiently whilst maintaining our focus on patient care. These teams of
front line staff will be supported by the Business Transformation Team (BTT) to deliver improvement
in their local areas, whilst Trust wide transformation will be facilitated by the BTT who will focus on
high value schemes worth £200K or more.
2.6.9 Risks to the financial plan
The significant risks to our financial plan are described in Table 13, the most significant risks are
related to failure to reduce the demands posed by emergency care, including the way we resource
care for these patients as they move through the hospital, and the need to work with commissioners
to deliver more care in the community. This risk also impacts on our ability to deliver elective work in
a timely and cost effective way.
At the same time, we face another year of challenging cost reduction to deliver to our financial plan.
Mitigating actions are described for each risk.

23 | P a g e
Table 13 - Risks to the financial plan
Assumption Risk Score
(Likelihood
x severity)
Mitigation
The Trust 2014/15 QIPP
budget target of £4.55m is
based on a 50% delivery
of the CCG target. Cost
reductions have been
planned at 60% (i.e. all
variable costs), and are
phased with a six month
lag
Based on current
performance (minimal QIPP
in 2013/14), delivery of
£4.55m is extremely
ambitious
4 x 5 = 20 Contract activity
monitoring
mechanisms where
activity varies
significantly (>5% for
3 three months for a
specialty or 5% for one
month for the Trust)
from Indicative Activity
Plan (IAP)8. Provisions
in the national contract
will be applied where
necessary, to recover
any additional costs
Activity growth will be in
line with the
commissioned activity
plan,
Growth outstrips capacity in
normal working hours and
the Trust incurs significant
excess costs and realises
lower margins through
premium payments and
activity outsourcing in order
to meet performance
standards
4 x 4 = 20 Urgent care
programme, and the
commissioner QIPP
schemes
Marginal Rate Emergency
Tariff (MRET)
reinvestment
The plan assumes MRET
reinvestment of £2.5m until
2017/18. If this funding
ceases, expenditure will still
be incurred which will have
an adverse impact on deficit
3 x 4 = 12 Contract management
arrangements
The plan is predicated on
achieving CIP’s of £13m
per year, every year
As projects increasingly
depend on transformation
rather than transactional
cost reduction there is an
increased risk of non-
delivery in year
3 x 4 = 12 CIP programme board
2.7 Achieve all round ‘sustainability’ for PCH and Stamford Hospital
2.7.1 Project Orange
Project Orange is a key requirement for the all-round sustainability for the Trust and could have a
significant positive impact on the local health economy. The project has eight objectives:
1. Maintain or improve quality for patients
2. Maintain or improve clinical and operational sustainability of our hospitals.
8Agreed with 2 out of our 3 main commissioners as of 26 March 2014

24 | P a g e
3. Maximise the use of our hospitals estate.
4. The Trust is able to retain and recruit staff of the necessary calibre to deliver quality services.
5. Contribute to the financial sustainability of our hospitals and minimises DH/NHS England
financial support.
6. Deliver value for money such that the contribution to future financial sustainability exceeds
what could be delivered by the Trust acting alone and significantly exceeds the costs of the
tender exercise.
7. Contribute to the development of health and social care service delivery and the long term
financial sustainability of the local health economy.
8. Deliver a solution that has the flexibility to facilitate the future development of health and
social care services in the health economy and allow it to respond effectively to future service
and financial challenges.
In 2014/15 the tender will be developed and advertised in the Official Journal of the EU (OJEU) and
potential bidders taken through the pre-qualification and competitive dialogue stages, with the
intention to select the preferred bidder after July 2015. In 2015/16 the Trust will prepare a full
business case including assessment of any competition issues and then complete detailed contract
negotiations prior to seeking final approvals in the final quarter of 2015/16.
2.7.2 Key financial investments
The Trust is planning investments which are included within the financial plan these are:
Radiotherapy expansion
Expansion of the radiotherapy services provided by the Trust by building a further two bunkers and
purchasing a new linear accelerator (LINAC) which will meet the growing demand for cancer
treatment.
Accommodation block
The completion of an accommodation block on the PCH site to accommodate medical and nursing
students.
Stamford hospital
The project will deliver a smaller Estate which provides hospital services for patients predominantly
from the South Lincolnshire area. A final decision on the clinical strategy, finance and programme of
works will be agreed by September 2014, with works planned throughout 2015 and 2016.
Investment in Information Management and Technology
The Trust four year IM and T strategy will support the Trust to implement Electronic Patient Records
by 2018 and the Trust’s overall strategy and expectation for continued productivity and efficiency.
This strategy will move our Health Records systems from paper-based to Electronic Patient Records
(EPR) and improve the sharing of data.
Projects which will be delivered during the period of this plan include:
Introduction of Electronic Document Management (EDM) the scanning and electronic viewing of
existing paper health records which will provide access to shared records for relevant health
care professionals with pay cost savings in the region of £2m in the first two years.
Development of a patient portal to allow secure communication between patients and clinical
or admin staff, and provide online booking
Maternity IT system replacement will deliver quality improvements with better sharing of
information and tracking of cases, assisting delivery of better care and reduce litigation risks.
NHS Litigation Authority reductions in contributions are anticipated as a result.
2.7.3 Research and education

25 | P a g e
The Medical and Non-Medical strategies have been approved by the Board and will be implemented
through the the Non-Medical Clinical Tutor and Associate Medical Director (Medical Education). The
recently approved Research and Development Strategy will be supported by investment management
proposals and overseen by the Quality Governance Operational Committee.
3 Quality plans
3.1 Quality goals
In our Trust, the delivery of patient centred and high quality care is “everyone’s business”. Delivery is
dependent on three quality domains being in place at all times; namely, safety, clinical effectiveness
and patient experience. Activities required of all staff to achieve the Quality Strategy objectives are
summarised as ‘Right care; first time; every time.’
3.2 Quality priorities
Our quality priorities for 2014/15 to 2015/16 are reflected in the first two Trust objectives to be in the
top 25% of District General Hospitals in England for mortality rates and harm free care measured on
the Patient Safety Thermometer; and to be in the top 20% of Trusts for patient experience as
measured by the Friends and Family Test and national patient survey data. The Quality Account for
2014/15 has not yet been prepared, but will reflect these objectives.
Achieving this will be challenging, and as other Trusts make incremental improvement, we will need
to improve at a faster than average rate.
We will further reduce the number of avoidable deaths through focus on areas where mortality data
suggests a review would be appropriate, and by increasing emergency and radiology medical cover at
weekends. In 2014/15 we will conduct a baseline of medical cover provided currently, and make
recommendations for change. New working arrangements in emergency teams and radiology will be
in place for the following year.
Increasing harm free patient care will focus on:
Reducing the four harms monitored via the Safety Thermometer i.e. falls, pressure ulcers,
venous thrombo-embolism and catheter associated urinary tract infection.
Reduce the number of avoidable Clostridium difficile infections acquired in hospital
Reduction in risks associated with medicines particularly prescribing errors
Full use of the ‘Sepsis 6’
Improve response to Early Warning Signs when the condition of a patient is deteriorating
3.3 Exisiting quality concerns
The Care Quality Commission completed an inspection of the Trust in March this year, as part of their
new regime. We will update our plan to reflect any issues identified during the inspection when we
receive the report in May 2014.
The Trust has an outstanding CQC compliance action and moderate concerns from their previous visit
as previous reports have not yet been lifted. The Trust has taken action to address these issues, and
will look to the CQC report in May to see whether these have been lifted.
3.4 Board quality assurance
The Quality Governance Framework sets out the Trust’s framework around strategy, risk, capability,
culture, structures and processes and measurement. Members of the Board of Directors have
recently assessed their knowledge and performance around quality governance using the Monitor
toolkit which demonstrated improvement compared with 2012/13.
Assurance for the Board is provided by the Quality Assurance sub-committee whose membership

26 | P a g e
includes three non-executive directors, four executive directors and key external stakeholders
including a public governor, a local GP and the chair of Healthwatch Peterborough.
3.5 Quality and the workforce
We have reviewed the Francis report and the Government’s response to it and have a series of action
plans in place to address relevant recommendations. This review has included the related reports
(e.g. Berwick, Keogh, Cavendish and Clwyd and Hart) and has wide ranging requirements for
development including workforce implications particularly relating to the National Quality board paper
relating to staffing levels and skill mix. Where appropriate, we have aligned these recommendations
to existing work plans, for example, complaints quality improvement plan, action plan to improve the
management of deteriorating patients.
3.6 Risks to achieving our quality plans
The significant risks to achieving our quality objectives are described in Table 14:
Table 14 - Risks to the quality plan
Assumption Risk Score
(Likelihhod x
severity)
Mitigation
Patient experience
improvement
including reduction in
cancelled operations
Failure to reduce
emergency activity
4 x 4 = 16 Urgent programme board
Elective pathway programme
QIPP programmes
We will achieve all
the Trust CQUIN
targets
Failure to achieve
improvement in
seven day cover and
pressure care
4 x 4 = 16 Clear accountability
Monitoring group
Achievement of the C
Diff target
Achievement of the C
diff target remains a
risk.
4 x 4 = 16 Build on the
recommendations from the
external review of our C diff
management in February
2014.
Revise our interpretation of
the national testing protocol
Review staffing levels and
skill mix in the infection
control nursing team
Recruit to the vacant
Consultant Microbiologist role
Complete the benchmarking
review for our cleaning
specification.
Infection prevention
programme
Achieve significantly
better than average
safety and
experience for our
patients through
committed and
motivated staff
Inability to recruit
substantive staff
3 x 5 = 15 Trust recruitment plans
Trust values in the
recruitment process

27 | P a g e
Quality initiatives are
adequately funded
Financial challenges
pose a significant risk
to improving the
quality of care our
patients have a right
to expect
3 x 4 = 12 Clear communication of
quality goals
Use of quality impact
assessments for any
proposed change necessitated
by financial pressure.
Compliance by every
member of staff with
agreed quality
standards
Staff who lack
knowledge or
commitment to
consistently
delivering the right
care, first time, every
time impacts on our
quality of care
2 x 5 = 10 Improved performance
management arrangements
Increased focus on Trust
values in recruitment and
appraisal
Increased reruitment to staff
vacancies
4 Operational requirements and capacity
Our activity plan for 2014/15 is shown in Table 15 below.
Table 15 - Trust activity plan 2014/15
2013/14 FOT 14/15 Plan Change % change
A&E 90,683 86,662 -4,021 -4%
Non-Electives 32,158 34,692 2,534 8%
Electives 7,103 7,674 571 8%
Day Cases 27,572 27,280 -292 -1%
Outpatients 331,596 328,291 -3,305 -1%
Critical Care 13,329 13,417 88 1%
Maternity 20,886 21,167 281 1%
Delivery of Chemotherapy 5,782 5,685 -97 -2%
Radiotherapy 15,777 15,635 -142 -1%
Diagnostics (Payment by Results) 1,773,612 1,712,794 -60,818 -3%
Other clinical income 98,249 113,249 15,000 15%
Overall demand due to population growth has been factored in based on the proportional increase in
catchment GP practice lists in the past year, and profiled by age-band.
Attendances to the Emergency Department are forecast to reduce by 4% compared with 2013/14 as a
result of various QIPP schemes including the impact of the Emergency Medical Unit (EMU) which will
receive some GP medical referrals which would have attended ED previously. These figures do not
yet include the reduction due to the new Minor Illnesses and Injury Unit operational since October.
We are planning for an increase of 8% in non-elective activity due to the EMU effect i.e. admitting GP
expected patients direct to EMU who would previously have been discharged from A&E.
An additional 8% elective capacity will be made available by the elective care pathway project and the
urgent care programme. Some additional ‘catch-up’ of elective activity to recover RTT performance
will also be required as a consequence of the recent volume of elective cancellations.
Day case and outpatient activity will remain relatively flat, although some activity will move from
elective inpatient towards day case, and from day case to outpatient minor procedures as part of the
elective pathway project.
Critical care capacity will increase by two beds to meet the ongoing demand, and there will be a 1%
year on year increase in 2014/15.
Maternity activity will increase by 1% in response to demand and changes in demographic profile.

28 | P a g e
Lack of capacity for cancer services means that there is limited scope in the Trust for growth until the
new radiotherapy linear accelerator is commissioned in 2015/16. There is a slight reduction in the
radiotherapy and chemothereapy plan due to the time the baseline was taken to calculate the
anticipated demand in 2014/15. We do not anticipate any reduction in activity in 2014/15 compared
with the forecast outturn for 2013/14.
The reduction in direct access diagnostics relates to relatively low cost pathology tests. The 15%
increase in other clinical income reflects the transfer of activity from non-elective to ambulatory care,
and an increase in direct access therapy activity.
4.1 Capacity constraints
There will be capacity constraints in five of our medical specialties, six surgical specialties and two
diagnostic services shown in Table 16. Constraints are a combination of beds and workforce capacity.
Commissioner and provider activity and revenue assumptions for 2014/15 and 2015/16 are not yet
congruent. Whilst we anticipate having signed agreements with commissioners before the start of the
financial year, there will be a gap in the assumptions on which this is based and operationalising the
plan may be difficult on QIPP. Taking a risk based approach, the Trust will make its own activity
assumptions based on historical demand and track record of QIPP scheme impact.
Table 16 - Capacity constraints and growth opportunities
Emergency and
Medicine
Surgery and
MSK
Family
and Public
Health
Cancer Diagnostic
Capacity
constraints
Cardiology
Neurology
Gastroenterology
/hepatology
Stroke
Ophthalmology
OMFS/
dermatology
ENT
Orthopaedics
Breast
- - MRI
Histo
pathology
Growth
opportunities
Cardiology
surgery
- Maternity Radiotherapy -
4.2 Assessment of capacity requirements
We have assessed the inputs needed over next 2 years, based on our understanding of the expected
activity levels. We plan to invest in these areas once a capacity assessment is completed.
4.2.1 Theatre Capacity
We have sufficient physical capacity but still have significant theatre nurse and operating department
practitioner (ODP) vacancies. This is being addressed as part of our recruitment plan.
4.2.2 Elective and Emergency (including stroke) bed capacity
We increased our day case bed capacity in 2013/14 but have experienced a shortage of inpatient
surgical bed capacity due to emergency pressures which has resulted in high cancellation rates,
particularly for patients requiring orthopaedics and general surgery/urology procedures.
Protection of all surgical beds is being explored, subject to sufficient emergency bed capacity being
identified through a combination of additional capacity, reduced length of stay and investment in
community services such as early supported discharge.
4.2.3 Magnetic Resonance Imaging (MRI) capacity
Demand for MRI continues to rise and whilst successful demand management would be the lowest

29 | P a g e
cost solution, MRI is increasingly seen as best practise for increasing numbers of conditions and
disease. A business case for further capacity expansion may be required.
4.2.4 Outpatients
The neurology service consultant provision is fragmented and insufficient to meet the rising demand.
A short term solution has been approved by the Trust whilst a longer term solution is identified.
Cardiology outpatient demand is not currently matched by the substantive consultant capacity. One
appointment has been made, with one more vacancy still to be recruited to.
Gastroenterology and endoscopy capacity may require further support to reduce diagnostic and
cancer pathway waits, but further work to improve processes and productivity may also be necessary.
The Ophthalmology department is not meeting elective and outpatient demand. One consultant
appointment has been made and a further appointment with short term support may also be possible
alongside further productivity improvements.
Oral and Maxillo Facial Surgery and dermatology capacity constraints mean that we will assess
demand and capacity with a case for consideration in 2014/15.
Histopathology is currently experiencing consultant shortages, and we will explore local capacity
solutions as part of a wider network.
Breast outpatient and surgery demand has increased significantly in recent years, partly due to the
age extension on screening. The Directorate is reviewing options to expand capacity.
4.3 Key capacity and demand risks
The three risks to the capacity plan are described in Table 17:
Table 17 - Risks to the capacity plan
Assumption Risk Score Mitigation
Emergency demand
will reduce providing
capacity to achieve
the 4 hour standard
and elective capacity
QIPP plans fail to deliver
the proposed reduction
in demand for
emergency care
4 x 5 = 20 Close review of the impact of
QIPP schemes on emergency
demand with commissioners
The Trust is
adequately staffed to
deliver the required
care and leadership
The Trust fails to
appoint key personnel
to provide the required
workforce capacity
3 x 5 = 15 Recruitment drive to reduce
nursing vacancies
Offer Trust contracts to more
locum medical staff
Agreed complement of
leadership staff in post by June
2014
Provide cancer
treatment within
national performance
times
Fail to meet the 31 day
wait for radiotherapy
due to lack of capacity
3 x 4 = 12 We are increasing capacity
from May 2015 with the
introduction of the new LINAC
on the Peterborough City
Hospital site.