opportunites in the food markets of india€¦ · opportunities in the food markets of india for...
TRANSCRIPT

OPPORTUNITIES IN THE FOOD MARKETS OF
INDIA
For further information about this report contact:
Dennis Pervis, Senior Markets AnalystMarketing and Trade TeamAgriculture and Agri-Food CanadaBritish Columbia Regional Office#420 - 4321 Still Creek DriveBurnaby, B.C.V5C 6S7Email: [email protected]
Last Updated: February, 2012
Although every effort is made to ensure that the information is correct. Agriculture and Agri-
Food Canada assumes no responsibility for its accuracy, reliability, or for any decisions arising
from the information contained herein.

ii
OPPORTUNITIES IN THE FOOD MARKETS OF INDIA
TABLE OF CONTENTS
EXECUTIVE SUMMARY . . . . . . . . . . . . . . . . . . . . . . . . . . . . . . . . . . . . . . . . . . . . . . . . . . . . vii
I. PURPOSE . . . . . . . . . . . . . . . . . . . . . . . . . . . . . . . . . . . . . . . . . . . . . . . . . . . . . . . . . . . . . . . . 1
II. BUSINESS PARADIGMS . . . . . . . . . . . . . . . . . . . . . . . . . . . . . . . . . . . . . . . . . . . . . . . . . . . 1A. The Competitive Environment . . . . . . . . . . . . . . . . . . . . . . . . . . . . . . . . . . . . . . . . . . . . . . 1B. Pure Export . . . . . . . . . . . . . . . . . . . . . . . . . . . . . . . . . . . . . . . . . . . . . . . . . . . . . . . . . . . . 2C. Export with Agreements . . . . . . . . . . . . . . . . . . . . . . . . . . . . . . . . . . . . . . . . . . . . . . . . . . 2D. Multi-National Operations . . . . . . . . . . . . . . . . . . . . . . . . . . . . . . . . . . . . . . . . . . . . . . . . . 2
III. PROFILE OF INDIA . . . . . . . . . . . . . . . . . . . . . . . . . . . . . . . . . . . . . . . . . . . . . . . . . . . . . . . . 3A. Geography . . . . . . . . . . . . . . . . . . . . . . . . . . . . . . . . . . . . . . . . . . . . . . . . . . . . . . . . . . . . . 3
1. The Himalayan Mountains . . . . . . . . . . . . . . . . . . . . . . . . . . . . . . . . . . . . . . . . . . . . . . 32. The Gangetic Plain . . . . . . . . . . . . . . . . . . . . . . . . . . . . . . . . . . . . . . . . . . . . . . . . . . . . 33. Peninsular India . . . . . . . . . . . . . . . . . . . . . . . . . . . . . . . . . . . . . . . . . . . . . . . . . . . . . . 4
B. Demography . . . . . . . . . . . . . . . . . . . . . . . . . . . . . . . . . . . . . . . . . . . . . . . . . . . . . . . . . . . . 4C. Culture . . . . . . . . . . . . . . . . . . . . . . . . . . . . . . . . . . . . . . . . . . . . . . . . . . . . . . . . . . . . . . . . 5
1. History . . . . . . . . . . . . . . . . . . . . . . . . . . . . . . . . . . . . . . . . . . . . . . . . . . . . . . . . . . . . . 52. Food . . . . . . . . . . . . . . . . . . . . . . . . . . . . . . . . . . . . . . . . . . . . . . . . . . . . . . . . . . . . . . . 5
a) Traditional . . . . . . . . . . . . . . . . . . . . . . . . . . . . . . . . . . . . . . . . . . . . . . . . . . . . . . . 5b) Recent Trends . . . . . . . . . . . . . . . . . . . . . . . . . . . . . . . . . . . . . . . . . . . . . . . . . . . . 7
i) Shopping Habits . . . . . . . . . . . . . . . . . . . . . . . . . . . . . . . . . . . . . . . . . . . . . . . . 7ii) Health and Wellness . . . . . . . . . . . . . . . . . . . . . . . . . . . . . . . . . . . . . . . . . . . 11
3. Religions and Philosophies . . . . . . . . . . . . . . . . . . . . . . . . . . . . . . . . . . . . . . . . . . . . 12D. Trade . . . . . . . . . . . . . . . . . . . . . . . . . . . . . . . . . . . . . . . . . . . . . . . . . . . . . . . . . . . . . . . . 13
1. Data Sources and Valuations . . . . . . . . . . . . . . . . . . . . . . . . . . . . . . . . . . . . . . . . . . . 132. Currencies . . . . . . . . . . . . . . . . . . . . . . . . . . . . . . . . . . . . . . . . . . . . . . . . . . . . . . . . . 143. Imports . . . . . . . . . . . . . . . . . . . . . . . . . . . . . . . . . . . . . . . . . . . . . . . . . . . . . . . . . . . . 144. Exports . . . . . . . . . . . . . . . . . . . . . . . . . . . . . . . . . . . . . . . . . . . . . . . . . . . . . . . . . . . . 15
E. International Transportation - Canada to India . . . . . . . . . . . . . . . . . . . . . . . . . . . . . . . . 161. Ocean . . . . . . . . . . . . . . . . . . . . . . . . . . . . . . . . . . . . . . . . . . . . . . . . . . . . . . . . . . . . . 162. Air Freight . . . . . . . . . . . . . . . . . . . . . . . . . . . . . . . . . . . . . . . . . . . . . . . . . . . . . . . . . 16
F. Economic . . . . . . . . . . . . . . . . . . . . . . . . . . . . . . . . . . . . . . . . . . . . . . . . . . . . . . . . . . . . . 171. Historical Development . . . . . . . . . . . . . . . . . . . . . . . . . . . . . . . . . . . . . . . . . . . . . . . 172. Recent Conditions . . . . . . . . . . . . . . . . . . . . . . . . . . . . . . . . . . . . . . . . . . . . . . . . . . . 173. Determinants of Food Demand . . . . . . . . . . . . . . . . . . . . . . . . . . . . . . . . . . . . . . . . . 194. Consumer Expenditures on Food and Non-Alcoholic Beverages, by Political Division
. . . . . . . . . . . . . . . . . . . . . . . . . . . . . . . . . . . . . . . . . . . . . . . . . . . . . . . . . . . . . . . . . . 21
iii
5. Determinants of Food Imports . . . . . . . . . . . . . . . . . . . . . . . . . . . . . . . . . . . . . . . . . . 22G. The Regions of India . . . . . . . . . . . . . . . . . . . . . . . . . . . . . . . . . . . . . . . . . . . . . . . . . . . . 24
1. East & Northeast India . . . . . . . . . . . . . . . . . . . . . . . . . . . . . . . . . . . . . . . . . . . . . . . . 242. North India . . . . . . . . . . . . . . . . . . . . . . . . . . . . . . . . . . . . . . . . . . . . . . . . . . . . . . . . . 253. South India . . . . . . . . . . . . . . . . . . . . . . . . . . . . . . . . . . . . . . . . . . . . . . . . . . . . . . . . . 254. West India . . . . . . . . . . . . . . . . . . . . . . . . . . . . . . . . . . . . . . . . . . . . . . . . . . . . . . . . . 25
IV. RISK FACTORS . . . . . . . . . . . . . . . . . . . . . . . . . . . . . . . . . . . . . . . . . . . . . . . . . . . . . . . 25A. Internal Political/Economic Conditions . . . . . . . . . . . . . . . . . . . . . . . . . . . . . . . . . . . . . . 25B. External Political/Economic Conditions . . . . . . . . . . . . . . . . . . . . . . . . . . . . . . . . . . . . . 26C. Handling Risks of International Trade . . . . . . . . . . . . . . . . . . . . . . . . . . . . . . . . . . . . . . . 26
V. PRODUCT ANALYSIS . . . . . . . . . . . . . . . . . . . . . . . . . . . . . . . . . . . . . . . . . . . . . . . . . . . . 27A. Selected Products Imported by India From Canada . . . . . . . . . . . . . . . . . . . . . . . . . . . . . 27B. Selected Products Imported by India But Currently Not From Canada . . . . . . . . . . . . . . 30
VI. GRID ANALYSIS . . . . . . . . . . . . . . . . . . . . . . . . . . . . . . . . . . . . . . . . . . . . . . . . . . . . . . 35A. All Agricultural, Agri-food & Seafood Products . . . . . . . . . . . . . . . . . . . . . . . . . . . . . . . 35B. Agricultural Agri-food & Seafood Imports of India From Canada vs From the Whole
World . . . . . . . . . . . . . . . . . . . . . . . . . . . . . . . . . . . . . . . . . . . . . . . . . . . . . . . . . . . . . . . . 36
VII. PRICE WORK-UPS . . . . . . . . . . . . . . . . . . . . . . . . . . . . . . . . . . . . . . . . . . . . . . . . . . . . 39A. The Research Price Work-up . . . . . . . . . . . . . . . . . . . . . . . . . . . . . . . . . . . . . . . . . . . . . . 40B. Prices . . . . . . . . . . . . . . . . . . . . . . . . . . . . . . . . . . . . . . . . . . . . . . . . . . . . . . . . . . . . . . . . 40
VIII. IDENTIFICATION OF CONTESTABLE MARKETS . . . . . . . . . . . . . . . . . . . . . . . . . 41A. Dairy Products . . . . . . . . . . . . . . . . . . . . . . . . . . . . . . . . . . . . . . . . . . . . . . . . . . . . . . . . . 42B. Opportunities . . . . . . . . . . . . . . . . . . . . . . . . . . . . . . . . . . . . . . . . . . . . . . . . . . . . . . . . . . 42C. Product Groups with an Index of Indicators of 1.00 . . . . . . . . . . . . . . . . . . . . . . . . . . . . 48D. Product Groups with an Index of Indicators from 0.75 to 0.99 . . . . . . . . . . . . . . . . . . . . 51E. Product Groups with an Index of Indicators from 0.50 to 0.74 . . . . . . . . . . . . . . . . . . . . 51F. Product Groups with an Index of Indicators from 0.25 to 0.49 . . . . . . . . . . . . . . . . . . . . 53G. Product Groups with an Index of Indicators from 0.00 to 0.24 . . . . . . . . . . . . . . . . . . . . 54
IX. CONCLUSIONS . . . . . . . . . . . . . . . . . . . . . . . . . . . . . . . . . . . . . . . . . . . . . . . . . . . . . . . 55
X. CONTACTS IN INDIA . . . . . . . . . . . . . . . . . . . . . . . . . . . . . . . . . . . . . . . . . . . . . . . . . . 56
XI. CONTACTS IN CANADA . . . . . . . . . . . . . . . . . . . . . . . . . . . . . . . . . . . . . . . . . . . . . . . 58
APPENDIX 1 . . . . . . . . . . . . . . . . . . . . . . . . . . . . . . . . . . . . . . . . . . . . . . . . . . . . . . . . . . . . . . . . 59
APPENDIX 2 . . . . . . . . . . . . . . . . . . . . . . . . . . . . . . . . . . . . . . . . . . . . . . . . . . . . . . . . . . . . . . . . 85

iv
Canada - New Zealand/US - Measures Affecting the Importation of Milk and the Exportationof Dairy Products . . . . . . . . . . . . . . . . . . . . . . . . . . . . . . . . . . . . . . . . . . . . . . . . . . . . . . . 85
A. The WTO Rulings Regarding Dairy Exports . . . . . . . . . . . . . . . . . . . . . . . . . . . . . . . . . . 85B. The Mutually Agreed Solutions . . . . . . . . . . . . . . . . . . . . . . . . . . . . . . . . . . . . . . . . . . . . 86
ENDNOTES . . . . . . . . . . . . . . . . . . . . . . . . . . . . . . . . . . . . . . . . . . . . . . . . . . . . . . . . . . . . . . . . 88

v
LIST OF TABLES
Table 1. Selected Traditional Cuisines of India . . . . . . . . . . . . . . . . . . . . . . . . . . . . . . . . . . . . . 5Table 2. Estimated Consumption of Packaged and Processed Food Products. India. 2006 and
2011. . . . . . . . . . . . . . . . . . . . . . . . . . . . . . . . . . . . . . . . . . . . . . . . . . . . . . . . . . . . . . . . 9Table 3. Value of Sales of Health and Wellness Classifications. India . . . . . . . . . . . . . . . . . . 11Table 4. Religions and Philosophies of India - Food Preferences. . . . . . . . . . . . . . . . . . . . . . 12Table 5. Average Tariff Rates Applied on Agricultural, Agri-food, Fish and Seafood Products,
2008. India . . . . . . . . . . . . . . . . . . . . . . . . . . . . . . . . . . . . . . . . . . . . . . . . . . . . . . . . . 18Table 6. Determinants of Changes in the Effective Demand for Food. 2005 to 2011. . . . . . . 19Table 7. Expenditure on Food and Non-alcoholic Beverages in Selected Political Divisions of
India. . . . . . . . . . . . . . . . . . . . . . . . . . . . . . . . . . . . . . . . . . . . . . . . . . . . . . . . . . . . . . 21Table 8. Production and Annual Increases of Selected Crops, India . . . . . . . . . . . . . . . . . . . . 22Table 9. Tariff Rates on Selected Imported Products. India. 2008. . . . . . . . . . . . . . . . . . . . . . 23Table 10. Ratios of Indian CIF Import Prices from Canada to Indian CIF Import Prices from the
World. Selected Products. 2010. . . . . . . . . . . . . . . . . . . . . . . . . . . . . . . . . . . . . . . . . 40Table 11. Summary of Indicators of Contestability of Selected Markets. India. . . . . . . . . . . . . 43Table 12. Area, Population and NSDP of States and Union Territories of India. 2011. . . . . . . 60Table 13. Population and GDP. India. 1992 - 2012. . . . . . . . . . . . . . . . . . . . . . . . . . . . . . . . . . 62Table 14. GDP by Origin, 2011. India. . . . . . . . . . . . . . . . . . . . . . . . . . . . . . . . . . . . . . . . . . . . 63Table 15. Percent of Employment by Sector. India. . . . . . . . . . . . . . . . . . . . . . . . . . . . . . . . . . 64Table 16. Distribution of Households by Disposable Income. India . . . . . . . . . . . . . . . . . . . . . 65Table 17. Value and Volume of Retail Sales of Packaged Food. India. 2005 and 2010. . . . . . 65Table 18. Compound Annual Rates of Change of Production and Consumption (Supply) of
Selected Products. India. 1997 - 2007. . . . . . . . . . . . . . . . . . . . . . . . . . . . . . . . . . . . . 68Table 19. Indicative CIF Prices of Imports to India from Canada, the World and Major
Competitors. 2010. . . . . . . . . . . . . . . . . . . . . . . . . . . . . . . . . . . . . . . . . . . . . . . . . . . . 69Table 20. Canada's WTO Dairy Export Subsidy Commitment Levels . . . . . . . . . . . . . . . . . . . 86

vi
LIST OF FIGURES
Figure 1. Population Pyramid. India. 2012. . . . . . . . . . . . . . . . . . . . . . . . . . . . . . . . . . . . . . . . . . 5Figure 2. Distribution of Households by Disposable Income Classes. India. . . . . . . . . . . . . . . . 7Figure 3. Proportion of Packaged Food Sales by Distribution Format. India. . . . . . . . . . . . . . . 8Figure 4. Value of the INR Expressed in CADs (CAD per INR). January 1993 to February
2012. . . . . . . . . . . . . . . . . . . . . . . . . . . . . . . . . . . . . . . . . . . . . . . . . . . . . . . . . . . . . . . 23Figure 5. Percentage Changes in Selected Indian Agricultural, Agri-food & Seafood Imports -
From Canada vs From the World. 2005 - 2010. Part 1. . . . . . . . . . . . . . . . . . . . . . . . 38Figure 6. Percentage Changes in Selected Indian Agricultural, Agri-food & Seafood Imports -
From Canada vs From the World. 2005 - 2010. Part 2. . . . . . . . . . . . . . . . . . . . . . . . 39Figure 7. Political Map of India. 2001. . . . . . . . . . . . . . . . . . . . . . . . . . . . . . . . . . . . . . . . . . . . 59

vii
EXECUTIVE SUMMARY
INDIA:
• is the second most populous country in the world after China; with 1.21 billionpeople increasing at an annual rate of 1.64%. - A positive influence on the demandfor food;
• experienced a 7.80% annual increase in GDP per person between 1999 and 2010.- A positive influence on the effective demand for food;
• has 20 political regions out of 35 with NSDP per person above the national average(Andaman & Nicobar Islands, Mizoram, Nagaland, Sikkim, Chandigarh, Delhi,Haryana, Himachal Pradesh, Punjab, Uttarakhand, Andhra Pradesh, Karnataka,Kerala, Lakshedweep, Pondicherry, Tamil Nadu, Dadra & Nagar Haveli, Goa,Gujarat and Maharashtra).- Canadian exporters should initially target one or more of these geographic areas;
• experienced a -3.99% annual decrease in the value of the Indian Rupee relative tothe Canadian Dollar, between January 1995 and February 2012. - A small butnegative influence on imports from Canada;
• is experiencing growing inequities in per capita income as measured by a gini ratioof 39.9 in 2011 and estimated NSDP per capita ranging from CAD 436 in BiharState to CAD 4,355 in Goa. - A negative influence on political stability;
• sourced 24.70% of its food imports from 32 American countries, in 2010. The topfive American countries were: Argentina, Brazil, the USA, Canada and Chile. - Canada faces considerable competition from emerging economies in SouthAmerica and from the USA;
• imported CAD 13,767 million worth of agricultural, agri-food & seafood products in2010, of which CAD 568 million worth (4.1%) was from Canada. As a supplier offood to India, Canada has moved from 9th place in 2005 to 7th place in 2010 - Canada must continue this progress;
• represents several risks for Canadian exporters. - The facilities of ExportDevelopment Canada and the Canadian Trade Commissioner service may be usefulin managing these risks.
Based on the analysis in this paper, Canadian food exporters may find new orcontinuing opportunities in the following Indian markets:
• Fish, Nesoi, With Bones, Fresh Or Chilled;

viii
• Milk & Cream, Concentrated, Sweetened, Powder, Granules / Other Solids, Not over1.5% Fat;
• Milk & Cream, Concentrated, Sweetened, Powder, Granules / Other Solids, Over1.5% Fat;
• Fats And Oils Derived From Milk, Nesoi;
• Peas, Dried Shelled, Including Seed;
• Kidney Beans & White Pea Beans, Dried Shelled, Including Seed;
• Beans Nesoi, Dried Shelled, Including Seed;
• Leguminous Vegetables Nesoi, Dried Shell, Including Seed;
• Nuts Nesoi, Fresh Or Dried, Shelled Or Not;
• Pears And Quinces, Fresh;
• Ginger;
• Poppy Seeds, Whether Or Not Broken;
• Natural Gums, Gum Resins, Resins And Balsams Nesoi;
• Cocoa Paste, Not Defatted;
• Cocoa Powder, Not Sweetened;
• Nonalcoholic Beverages, Nesoi;
• Ethyl Alcohol & Other Spirits Denatured Any Strength;
• Wool, Not Carded Or Combed, Greasy, Nesoi;
• Wool Not Carded / Combed Degreased Not Carbonized, Shorn.

1
OPPORTUNITIES IN THE FOOD MARKETS OFINDIA
I. PURPOSEThe purpose of this paper is to provide Canadian food exporters with indications of
opportunities or “contestable markets” in India. The analysis uses several indicators ofcontestability and ranks product groups according to the number of positive indicators associatedwith each.
The paper provides indications only. Individual companies should follow up on opportunitiesof interest with: further market research, including the determination of quality and packaging ofcompeting products; acquisition of information on sanitary/phyto-sanitary and labelling requirements; the development of a research price work-up; other barriers to trade and;eventually a specific price work-up.
The indicators of contestability used in this paper are based on historical statistics andtherefore assume Indian tastes and preferences are fixed. It also assumes that the images thatIndian consumers have of Canada and Canadian products are fixed and not always positiverelative to the images of competing products. The Branding Strategy for the CanadianAgriculture and Food Sector1 is designed to improve knowledge of Canadian products and foodsystems, to differentiate Canada from its competitors and establish a reputation for high quality.This program can have a major positive influence on Indian acceptance of Canadian foodproducts and increase the probabilities of finding opportunities in Indian markets.
II. BUSINESS PARADIGMSThere are several ways in which Canadian companies can participate in the food markets of
India. Some understanding of the competitive nature of the Indian food markets is necessary forCanadian companies to decide on the appropriate paradigm for them.
A. The Competitive EnvironmentIn 2010, the packaged food market was dominated by multinational companies local
manufacturers and government cooperatives. There was also a thriving unorganised sectorconsisting of many small entities. The market was highly competitive and fragmented. Even thelarge multinationals had to fight hard to maintain market positions. However, over the period2005 to 2010, the market has become slightly more concentrated. The top 10 food companiesproducing impulse and indulgence products accounted 68 percent of the market in 2005 and 73percent in 2009. Similarly, the top 10 food companies producing nutrition products / staplesaccounted for 38 percent of the market in 2005 and 41 percent in 2009. To compete in thisenvironment companies continuously reviewed product innovations as well as marketing andcommunication strategies. As the rural areas became increasingly important, companies engaged

2
in various promotional offers. Smaller packs at low prices were key to growth in sales of suchproducts as bakery products, soup, noodles, and confectionery products.
B. Pure ExportThe paradigm assumed in this paper is characterised by production in Canada by Canadian
companies with sea or air transport to India by any available carrier. Canadian companiesnormally cease to be interested in a shipment when it is loaded onto a ship or plane and paymentis received. Wholesaling, distributing and retailing is done by Indian companies at their risk.With this paradigm the emphasis is on identifying products that Canadian companies canprofitably export and Indian companies can profitably import from Canada and finding thoseIndian buyers.
C. Export with AgreementsThis paradigm is much the same as pure export except that Canadian companies enter into
various kinds of agreements with Indian companies to perform any one or more marketingfunctions such as wholesaling, storage, distributing, advertising and/or retailing.
D. Multi-National OperationsThis paradigm includes a mix of local (in India) production and imports. It might also
includes the performance of marketing functions throughout the marketing channel. Multi-nationals operate as if there were no borders, placing production plants in the most economicposition in relation to sources of inputs and the markets to be served. Tariffs and other tradebarriers are costs of doing business and influence the placement of production plants based onlyon economic and financial considerations. With barriers to trade falling, these companies are inthe best position to adjust and benefit from the comparative advantages of many countries.
Some multi-national companies active in India were 2:
Cadbury India Ltd. is a part of Kraft Foods of the USA. The company is involve in theproduction of chocolate confectionery, beverages, biscuits, gum and candy.
Frito-Lay India is a owned by PepsiCo Inc. of the USA. The company produces confectioneryproducts, specifically potato chips.
Perfetti Van Melle India Pvt Ltd is based in Europe. In India the company is involved in theproduction of gums, candies and chewies.
Nestle India Ltd is a subsidiary of Nestle SA of Switzerland. The company is involved in theproduction of milk products & nutrition, beverages, prepared dishes & cooking aids andchocolate & confectionery.

3
GlaxoSmithKline Consumer Healthcare Ltd is an associate of GlaxoSmithKline plc of theUK. It manufactures and distributes hot drinks and OTC healthcare products.
III. PROFILE OF INDIAA. GeographyIndia is located in Southern Asia with the Arabian sea to the west, the Bay of Bengal to the
east and the Indian Ocean to the south. On the north-west it is bordered by Pakistan, on the northby China, Nepal, and Bhutan. On the northeast, it is bordered by Bangladesh and Myanmar. Withan area of 3,287,590 Km2 3, it is almost one-third the size of Canada.
India can be divided into three main regions: the Himalayan Mountains, the Gangetic Plain,and Peninsular India.
1. The Himalayan MountainsThe Himalayan mountain system is 160 to 320 km wide and extends 2,400 km along the
northern and eastern borders of India. It includes the mountains surrounding the Vale of Kashmirin the Karakoram Range, and the central and eastern Himalayas. Ancient geological forcesmoulded the Himalayas as the Indian plate of the Earth’s crust subducted under the Eurasianlandmass, creating an uplift that continues to push this northernmost boundary of India everhigher.
The Himalayan Range is the highest mountain system in the world. Among its summits,wholly or partly within India or within territory claimed by India and administered by Pakistan,are K2 (8,611 m) and Kanchenjunga (8,598 m), which are the second and third highest peaks inthe world, after Mount Everest. Other prominent Indian peaks include Nanga Parbat (8,125 m),Nanda Devi (7,817 m), Rakaposhi (7,788 m), and Kamet peak (7,756 m). The Himalayan region,including the foothills, is sparsely settled. Agriculture and animal herding are the main economicactivities.
2. The Gangetic PlainSouth of, and parallel to, the Himalayas, lies the Gangetic Plain, a belt of flat, alluvial
lowlands 280 to 400 km wide. This area includes some of the most agriculturally productive landin India. The Indian portion of the broad Gangetic Plain encompasses several river systems, andstretches from Punjab state in the west to the Assam Valley in the east. Marking the western endof the Gangetic Plain are the Indus River and its tributaries, including the Sutlej and Chenabrivers, which flow through Punjab in India’s northwest corner. The Gangetic Plain is formed bythe Ganges River and its tributaries, which drain the southern slopes of the Himalayas. TheAssam Valley is separated from the Gangetic Plain by a narrow corridor of land near the city ofDarjeeling. The valley is watered by the Brahmaputra River, which rises in Tibet and crosses intoIndia at its northeast corner, then flows north of the Khasi Hills into Bangladesh. The Thar

4
Desert, a huge, dry, sandy region extending into Pakistan, lies at the southwestern end of theGangetic Plain.
3. Peninsular IndiaSouth of the plains region lies Peninsular India. The northern peninsula features a series of
mountain ranges and plateaus. The Aravalli Range runs in a north-south direction on the easternedge of the Thar Desert, and low hills cut by valleys lie along the border between the states ofUttar Pradesh and Madhya Pradesh in central India. The Narmada River flows southwestbetween the Vindhya Range and an associated plateau on the north, and the Satpura Range on thesouth. The plains of the Chota Nagpur Plateau in the eastern states of Chhattisgarh and Jharkhandalso lie within this region. The rocky and uneven lands of the northern peninsula are sparselypopulated. Herding is a major occupation in the west, and farming of coarse grains such as milletis common in the central part.
In the southern part of peninsular India lies the vast Deccan Plateau, a tableland lying withina triangle formed by the Satpura Range, the steep mountain slopes of the Western Ghats, and thegentler slopes of the Eastern Ghats. Elevations in the plateau region average 600 m, althoughoutcroppings as high as 1,200 m occur. At their northern end, the Western Ghats vary in heightfrom 900 to 1,200 m, but the Nilgiri Hills of the extreme south reach a height of 2,637 m at DodaBetta, their highest peak. The Eastern Ghats lie along the eastern flank of the Deccan Plateau,interrupted by the Krishna and Godavari river basins. Elevations of the Eastern Ghats are muchlower, averaging 600 m. The plateau itself, even rockier than the northern extension of peninsularIndia, supports a sparse agricultural population and is also home to industrial enterprises.
The Indian Peninsula is bordered by a mostly fertile seashore. The west coast, including theextensive Gujarat Plain in the north, the thin Konkan shore in Maharashtra state, and the MalabarCoast in the south, support substantial populations of farmers and fishermen. Ancient traderoutes to the west helped make the cities and towns of this region into market centers for textilesand spices. The east coast’s broad alluvial plains, stretching from the Kaveri River delta in thesouth to the Mahanadi River delta in the north, are intensely farmed.4
B. Demography The population of India was estimated to be 1,205,074,000 (2012). A compound trend line
fitted to the population data from 1992 to 2012 indicates an annual rate of increase of 1.64%. SeeTable 13.
The age/gender distribution of the population is presented in the population pyramid ofFigure 1. The largest age groups were between 0 and 19 years of age. The younger age groupswere almost the same size, indicating a reduction in the rate of growth of the population (from1.72% between 1999/2000 to 1.34% between 2011/2012).

5
Figure 1. Population Pyramid. India. 2012.
Source: Data from US B ureau of Census.
International Data Base.
C. Culture1. History
Many cultures have come together toinfluence the India of today. Indian historycan be traced back to 3000 - 2500 BC. Areader interested in the details of Indianhistory can access the website:http://www.sscnet.ucla.edu/southasia/History/mainhist.html 5. More recent events will bediscussed in section “F” Economic.
2. Fooda) Traditional
There is no single traditional cuisine ofIndia. The many cultures that have come toIndia over the centuries have contributed theirflavours and recipes using the basic productsavailable locally. A sampling of traditionalIndian cuisines and the products that might bysupplied by Canada is presented in Table 1.
Table 1. Selected Traditional Cuisines of India.
Cuisine Description
Kashmiri. Largely meat based, particularly lamb, goat and chicken flavoured withsaffron and chillies. Other products include walnuts, dried dates andapricots used in puddings, curries and snacks. Cottage cheese is popularwith meats and vegetables. Fresh water fish is also a delicacy. Populardesserts consist of fresh fruits such as strawberries, plums, cherries andapples.
Punjabi. Marinated chicken, fish, paneer, rotis and naans of many types arecooked in earthen ovens half buried in the ground. In the winter, makki kiroti (maize flour bread) is popular along with sarson ka saag (mustardleaf gravy). Fresh curd and white butter are consumed in large quantities.A popular drink is lassi (a sweet or salted drink made with curd). Otherpopular dishes are ma ki dal, rajma (kidney beans) and stuffed parathas.
Mughlai (Delhi). Rich sauces, butter-based curries, ginger flavoured roast meats anddelicious sweets.

Cuisine Description
6
Bengali. Fish in a variety of styles. Use of mustard oil rather than coconut oil.Five basic spices used: zeera, kalaunji, saunf, fenugreek and mustardseeds. Sweets made from burnt milk, yoghurt sweetened with jaggery,crisp samosas.
Maharashtrian. Subtly flavoured vegetarian delicacies and hot, aromatic meat and fishcurries. Crispy sweets made mostly of rice and jaggery. Konkani andMalwani cuisines originated in the coastal parts of this region and are sea-food based.
Goan. Influenced to some extent by Portugese culture. Tangy pork vindaloo,spicy sorpotel and fish curry with rice. Coconut and fish based dishes.Local wines or the local liqueur called Feni. Most, but not all Goandishes are chili hot, spicy and pungent. Seafood includes prawns,lobsters, crabs, and jumbo pomfrets (bream). Goa is not known asvegetarian. Hindus like lamb and chicken while Christians like pork andboth prefer fish and seafood to any other meat.
Gujarati. Vegetarian cuisine. Lentils and vegetables, yoghurt and buttermilk area part of a Gujarati daily diet. Potatoes, brinjal, and green beans andother vegetable are used in the winter to prepare undhyoo. Other dishesare prepared with chickpea flour, thickened milk, nuts and the srikhand.Yogurt, flavoured with saffron, cardamom, nuts and candied fruit.
Rajasthani. Historically the Rajas who went on hunting expeditions ate the meat ofthe game fowl they brought back. Vegetarian Rajasthanis cook in pureghee, famous for its aroma. Rajasthan includes a large desert area and thescarcity of water and lack of fresh green vegetables has affectedRajasthani cooking. Dried lentils and beans from indigenous plants likesangri, ker etc. are staples of the Rajasthani diet. Gram flour is an integralcooking ingredient. Bajra and corn are used all over the state for makingrotis and other breads. Other food items are millet bread, chutney, onionsand milk.
Hyderabadi(AndhraPradesh).
This category includes the original red hot Andhra cooking and theHyderabadi cuisine with its Mughlai influence. Vegetables are preparedwith different masalas giving the same vegetables different flavours.Traditional Andhra cuisine includes many non-vegetarian dishes whichare also spicy. Hyderabadi cuisine is rich and aromatic with a liberal useof spices and ghee as well as nuts and dried fruit. Lamb is the mostwidely use meat in non-vegetarian dishes. The biryanis (flavoured ricewith meat or vegetables) is one of the most distinct Hyderabadi foods.
Cuisine Description
7
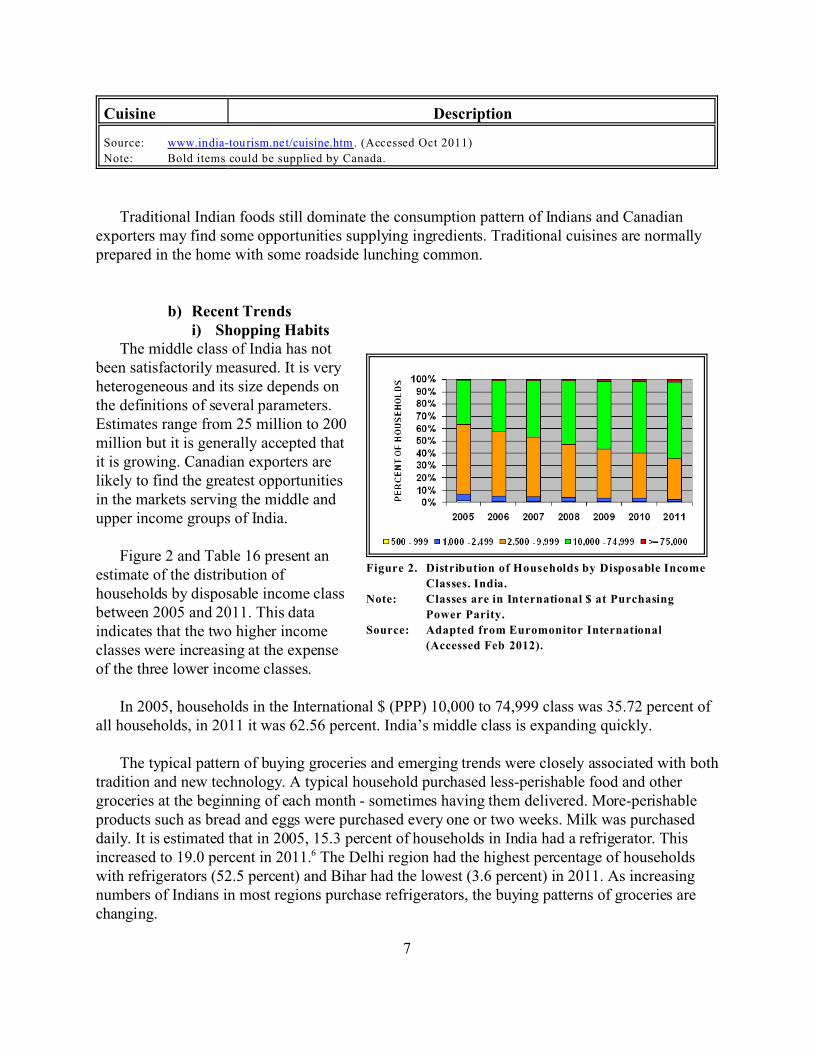
Figure 2. Distribution of Households by Disposable Income
Classes. India.
Note: Classes are in International $ at Purchasing
Power Parity.
Source: Adapted from Euromonitor International
(Accessed Feb 2012).
Source: www.india-tourism.net/cuisine.htm. (Accessed Oct 2011)
Note: Bold items could be supplied by Canada.
Traditional Indian foods still dominate the consumption pattern of Indians and Canadianexporters may find some opportunities supplying ingredients. Traditional cuisines are normallyprepared in the home with some roadside lunching common.
b) Recent Trendsi) Shopping Habits
The middle class of India has notbeen satisfactorily measured. It is veryheterogeneous and its size depends onthe definitions of several parameters.Estimates range from 25 million to 200million but it is generally accepted thatit is growing. Canadian exporters arelikely to find the greatest opportunitiesin the markets serving the middle andupper income groups of India.
Figure 2 and Table 16 present anestimate of the distribution ofhouseholds by disposable income classbetween 2005 and 2011. This dataindicates that the two higher incomeclasses were increasing at the expenseof the three lower income classes.
In 2005, households in the International $ (PPP) 10,000 to 74,999 class was 35.72 percent ofall households, in 2011 it was 62.56 percent. India’s middle class is expanding quickly.
The typical pattern of buying groceries and emerging trends were closely associated with bothtradition and new technology. A typical household purchased less-perishable food and othergroceries at the beginning of each month - sometimes having them delivered. More-perishableproducts such as bread and eggs were purchased every one or two weeks. Milk was purchaseddaily. It is estimated that in 2005, 15.3 percent of households in India had a refrigerator. Thisincreased to 19.0 percent in 2011.6 The Delhi region had the highest percentage of householdswith refrigerators (52.5 percent) and Bihar had the lowest (3.6 percent) in 2011. As increasingnumbers of Indians in most regions purchase refrigerators, the buying patterns of groceries arechanging.

8
Figure 3. Proportion of Packaged Food Sales by
Distribution Format. India.
Source: Adapted from Euromonitor International
(Accessed Oct 2011).
Small grocery stores were thedominant single food outlets but fruit andvegetables were bought from unorganizedvendors. Some grocery chains wereexpanding into the supermarket orhypermarket category offering a widerange of products; however, the purchaseof fruit and vegetables in this format wasnot yet fully accepted. Even so,supermarkets and hypermarkets wereputting pressure on the traditional grocerystore. Visits to a supermarket encouragedmore impulse buying than did visits to atraditional grocery store or phoneshopping.
Small grocery stores dominated thesales of packaged food but were being pressured by supermarkets and hypermarkets, particularlyin urban areas. In 2005, 57.4 percent of packaged food was sold through small grocery stores; in2010 the proportion was down to 51.7 percent. During the same period, sales throughsupermarkets/hypermarkets increased from 6.9 percent to 11.4 percent. See Figure 3.
Eating out was a very popular activity while attending other functions. It is estimated thatIndians spent INR 350 billion (approx. CAD 10.5 billion) eating out annually. Of this, organizedestablishments accounted for only INR 20 billion (CAD 0.6 billion). International fast foodchains such as Subway, McDonald’s and Pizza Hut were found in shopping malls and nearcinema theatres.
The “well-off” in urban areas were increasingly eating out in coffee shops, malls or retailstores. Lounge bars were the latest trend in urban areas and were frequented by youngprofessionals, successful executives and single women in their late 20's. This trend began inMumbai, Bangalore, Delhi and Kolkata and will no doubt spread to other urban areas.
Among the “affluent”, clubs were becoming popular. In addition to many recreationalfacilities they were upgrading their food facilities and were competing with some of the finestrestaurants or hotels of India. The “affluent” also had an interest in the performing arts. A play inMumbai could cost about INR 1,000 (approx. CAD 23) which was beyond the reach of mostIndians.

9
Middle to upper income families were increasingly two income, younger families. A smallproportion of Indian families were moving to quick ready-to-eat foods and frozen foods.However 90% of the population still prefered fresh foods and considered processed foods to benot fresh and containing harmful preservatives.
Table 2 presents estimates of the consumption of both regular and“health and wellness” packaged and processed food and beverages. In 2011, baked goods was the regular food categorywith the highest level of consumption (1,994.1 gm per person). Still bottled water was thebeverage category with the highest level of consumption (4,291.4 ml per person). Between 2006and 2011 chips / crisps and breakfast cereals were the fastest growing food categories.Consumption increased at a rate of 25.4 percent per year reaching 73.2 gm per person of chips /crisps and 24.7 gm per person of breakfast cereals, in 2011.
India has one of the fastest growing economies in the world. Rising incomes and a morehectic lifestyle have increased the incidence of the health problems of the affluent (obesity,diabetes, hypertension and heart trouble). This has increased consumer interest in “health andwellness” products. In 2011, “health and wellness” bakery products had the highest level ofconsumption ( 479 gm per person). The fastest growing “health and wellness” category wassnack bars. Consumption increased at a rate of 53.3 percent per year reaching a still small levelof 1.5 gm per person.
Table 2. Estimated Consumption of Packaged and Processed FoodProducts. India. 2006 and 2011.
Product 2006 2011 Change2006 to 2010(% / Year)
REGULAR PR ODUCTS
100% Juice (ml./person). 10.6 29.7 22.1
Baked G oods (gms./person). 1,801.2 1,994.1 2.2
Biscuits (gms./person). 818 .2 1,344.7 10.3
Breakfast Cereals
(gms./person).
8.2 24.7 25.4
Butter (gms./person). 34.8 40.1 2.6
Canned Meat and Meat
Products (gms./person).
0.2 0.3 11.0
Canned Vegetables
(gms./person).
0.9 1.3 7.3
Chips /Crisps (gms./person). 24.2 73.2 25.4

Product 2006 2011 Change2006 to 2010(% / Year)
10
Chocolate Confectionery
(gms./person).
35.4 79.3 17.2
Dehydrated Soup
(gms./person).
1.3 3.0 18.3
Dried Baby Food
(gms./person).
16.9 19.3 2.6
Dried Pasta (gms./person). 0.9 1.6 12.3
Extruded Snacks (gms./person). 24.1 59.4 19.4
Frozen Processed Fish/Seafood
(gms./person).
0.6 0.9 8.7
Honey (gms./person). 6.0 9.1 8.8
Instant Noodles (gms./person). 64.5 168 .5 21.3
Juice Drinks (up to 24% Juice)
(ml./person).
188 .9 478 .5 21.0
Ketchup (gms./person). 16.7 33.5 14.8
Nectars (25-99% Juice)
(ml./person).
41.9 110 .7 20.8
Nuts (gms./person). 3.1 4.0 5.1
Other Sweet and Savoury
Snacks (gms./person).
46.7 135 .0 24.3
Still Bottled Water
(ml./person).
1,632.2 4,291.4 21.0
Sugar Confectionery
(gms./person).
96.2 142 .6 8.2
Take-Home Ice Cream
(ml./person).
28.9 64.6 17.2
Vegetable and Seed Oils
(gms./person).
1,042.9 1,565.2 8.6
HEALTH AND WELLNESS PRODUCTS
Bakery Products (gms./person). 363 .9 479 .8 5.3
Noodles (gms./person). 3.1 12.2 31.5

Product 2006 2011 Change2006 to 2010(% / Year)
11
Sauces, Dressings and
Condiments (gms./person).
1.1 2.7 20.4
Snack Bars (gms./person). 0.2 1.5 53.3
Soft Drinks (ml./person). 40.9 76.1 13.4
Source: Euromonitor International from trade sources / national statistics. (Accessed Jan
2012)
ii) Health and WellnessHealth and wellness products are identified and classified as: organic, fortified/functional
(FF), better for you (BFY), naturally healthy (NH) and food intolerance. The largestclassification, by value of sales was BFY. Between 2005 and 2010, the value of sales of BFYproducts was increasing at a rate of 115.67 percent per year reaching CAD 4,235.1 million in2010. See Table 3.
Table 3. Value of Sales of Health and Wellness Classifications. India.
YearCAD per INR
Organic
(Million
CAD)
Fortified
/ Functional
(Million
CAD)
Better for
You
(Million
CAD)
Naturally
Healthy
(Million
CAD)
Food
Intolerance
(Million
CAD)
Total
(Million
CAD)
2005 0.027516 16.3 1,601.3 2,064.6 328 .9 3.2 4,014.3
2006 0.025117 18.0 1,611.8 2,347.7 349 .3 3.2 4,330.0
2007 0.026042 22.1 1,851.8 3,062.7 423 .1 3.6 5,363.4
2008 0.024576 24.8 1,996.6 3,356.7 471 .7 3.6 5,853.5
2009 0.023591 29.0 2,100.9 3,758.0 536 .3 3.7 6,428.1
2010 0.022556 35.7 2,258.0 4,235.1 605 .3 4.0 7,138.1
Annual
Change
-3.48% 16.94% 7.68% 15.67% 13.54% 4.74% 12.59%
Sources: Adapted from Euromonitor International, “Health and Wellness - India”. Nov 2011. (Accessed Jan
2012).
Pacific Exchange Rate Service.
In Regard to Health and Wellness Products:• Sales were expanding due to increasing number of products and targeting of lower-
income groups;• Sales were based on consumer demand for products with additional benefits and nutrients

12
such as proteins, vitamins and minerals and more recently omega-3 oil. Also the demandfor naturally healthy foods such as green tea and 100% juices;
• Production was dominated by small domestic companies serving small local nichemarkets. There were also a number of larger domestic companies specializing inparticular subsectors for example Hindustan Lever Ltd. lead in reduced fat soup, NestleIndia lead in high fibre noodles and GlaxoSmithKline Consumer Healthcare specializedin fortified/functional hot drinks;
• They were marketed through supermarkets and as these outlets become increasinglypopular so do health and wellness products.
3. Religions and PhilosophiesTable 4 presents a list of the major religions and philosophies of India and a brief indication
of their food preferences. Vegetarianism is often strongly associated with India and severalreligions do include it as one if their requirements. However, many Indians eat meat of some kindaccording to what their religion allows and others do not adhere strictly to food rules. There aremarkets in India for meat products.
Table 4. Religions and Philosophies of India - Food Preferences.
Religion /Philosophy
Percent ofPopulation
(%)
Brief Indication of Food Preferences
Hindu. 80.4 Do not eat beef of any kind but will eat other meats.
Devout H indus are vegetarians and do not eat meat at all.
This derives from the concept of Ahimsa or non-violence
to anything.
Islam. 13.4 Do not eat pork or drink alcohol. Strict Islamists will eat
only according to the rules of Halal and Haram. See:
http://www.eat-halal.com/halal.shtml (Apr 2006. Under
reconstruction Jan 2012) and
http://www.eat-halal.com/haram.shtml (Apr 2006. Under
reconstruction Jan 2012).
Christian. 2.2 Few or no food restrictions based on religion. Strict Roman
Catholics may eat fish on Fridays. Individuals may have
personal aversions to some foods.
Sikh. 1.9 Few food restrictions. There are some restrictions
regarding preparation. A strict Sikh will not drink alcohol.
Buddhist. 1.1 Food rules vary considerably. Some are vegetarian. The
eater of meat must believe that the animal was not killed
specifically to be eaten.

Religion /Philosophy
Percent ofPopulation
(%)
Brief Indication of Food Preferences
13
Jain. 0.4 Strictly vegetarian and some vegetables are forbidden. In
recent years the rules have not been strictly adhered to.
Other.* 0.5
Source: http://www.nationmaster.com/encyclopedia/demographics-of-India. (Accessed Oct
2011).
Punjab for Health-Care Workers. See
http://www.hospitalconnect.com/healthcareworkforce/content/PunjabiforHealthCare
Workers.pdf (Accessed Oct 2011).
* Jews, Parsis, Bahais, tribal animists and non-religous.
D. Trade1. Data Sources and Valuations
In this and following sections, trade data is presented and analysed. Unless otherwiseindicated, all trade data has been obtained from the Global Trade Atlas, a product of:
Global Trade Information Services, Inc. -GTI-2218 Devine StreetColumbia, SC 29205USATel: (803) 765-1860Fax: (803) 799-5589E-Mail: [email protected].
The data reported for India is supplied to GTI by the Indian Ministry of Commerce and isevaluated CIF for imports and FOB for exports. At the time of the analysis, data for 2010 is thelatest full year available.
CIF (Cost, Insurance and Freight): The landed value of merchandise at the firstport of arrival in the importing country. It is computed by adding “ImportCharges” to the “Customs Value” and therefore excludes import duties.
FOB (Free On Board): The value of exports as they are moved onto the ship at theport of export. The buyer bears all costs and risks of loss of or damage to thegoods from that point. The FOB term requires the seller to clear the goods forexport. This term is used only for sea or inland waterway transport. For othermodes of transport the FCA (Free Carrier) term should be used.
14
2. CurrenciesCurrency designations used in this paper are the ISO 4217 codes. Specifically:
Canadian Dollar . . . . CAD;Indian Rupee . . . . . . . INR;United States Dollar . USD.
For a complete list of the ISO currency codes see the website: www.xe.com/iso4217.htm. (Nov2011).
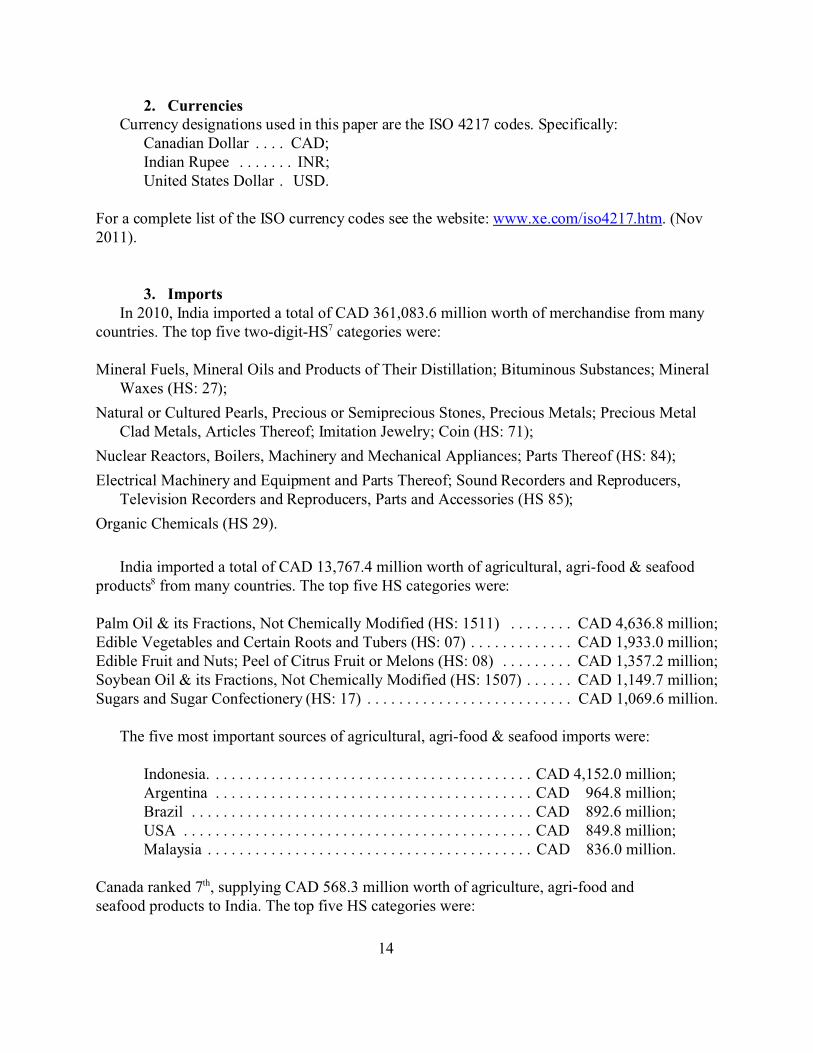
3. Imports In 2010, India imported a total of CAD 361,083.6 million worth of merchandise from many
countries. The top five two-digit-HS7 categories were:
Mineral Fuels, Mineral Oils and Products of Their Distillation; Bituminous Substances; MineralWaxes (HS: 27);
Natural or Cultured Pearls, Precious or Semiprecious Stones, Precious Metals; Precious MetalClad Metals, Articles Thereof; Imitation Jewelry; Coin (HS: 71);
Nuclear Reactors, Boilers, Machinery and Mechanical Appliances; Parts Thereof (HS: 84);
Electrical Machinery and Equipment and Parts Thereof; Sound Recorders and Reproducers,Television Recorders and Reproducers, Parts and Accessories (HS 85);
Organic Chemicals (HS 29).
India imported a total of CAD 13,767.4 million worth of agricultural, agri-food & seafoodproducts8 from many countries. The top five HS categories were:
Palm Oil & its Fractions, Not Chemically Modified (HS: 1511) . . . . . . . . CAD 4,636.8 million;Edible Vegetables and Certain Roots and Tubers (HS: 07) . . . . . . . . . . . . . CAD 1,933.0 million;Edible Fruit and Nuts; Peel of Citrus Fruit or Melons (HS: 08) . . . . . . . . . CAD 1,357.2 million;Soybean Oil & its Fractions, Not Chemically Modified (HS: 1507) . . . . . . CAD 1,149.7 million;Sugars and Sugar Confectionery (HS: 17) . . . . . . . . . . . . . . . . . . . . . . . . . . CAD 1,069.6 million.
The five most important sources of agricultural, agri-food & seafood imports were:
Indonesia. . . . . . . . . . . . . . . . . . . . . . . . . . . . . . . . . . . . . . . . . CAD 4,152.0 million;Argentina . . . . . . . . . . . . . . . . . . . . . . . . . . . . . . . . . . . . . . . . CAD 964.8 million;Brazil . . . . . . . . . . . . . . . . . . . . . . . . . . . . . . . . . . . . . . . . . . . CAD 892.6 million;USA . . . . . . . . . . . . . . . . . . . . . . . . . . . . . . . . . . . . . . . . . . . . CAD 849.8 million;Malaysia . . . . . . . . . . . . . . . . . . . . . . . . . . . . . . . . . . . . . . . . . CAD 836.0 million.
Canada ranked 7th, supplying CAD 568.3 million worth of agriculture, agri-food andseafood products to India. The top five HS categories were:

15
Edible Vegetables and Certain Roots and Tubers (HS: 07) . . . . . . . . . CAD 557.2 million;Sugars and Sugar Confectionery (HS: 17) . . . . . . . . . . . . . . . . . . . . . . CAD 2.7 million;Residues and Waste from the Food Industries; Prepared Animal
Feed (Fodder) (HS: 23) . . . . . . . . . . . . . . . . . . . . . . . . . . . . . . . . . CAD 2.7 million;Miscellaneous Edible Preparations (HS: 21) . . . . . . . . . . . . . . . . . . . . CAD 1.3 million;Cocoa and Cocoa Preparations (HS: 18) . . . . . . . . . . . . . . . . . . . . . . . . CAD 751,000.
4. Exports In 2010, India exported a total of CAD 229,277.5 million worth of merchandise to
many countries. The top five two-digit-HS categories were:
Mineral Fuels, Mineral Oils and Products of Their Distillation; Bituminous Substances;Mineral Waxes (HS: 27);
Natural or Cultured Pearls, Precious or Semiprecious Stones, Precious Metals; PreciousMetal Clad Metals, Articles Thereof; Imitation Jewelry; Coin (HS: 71);
Vehicles, Other than Railway or Tramway Rolling Stock, and Parts and Accessories Thereof (HS: 87);
Electrical Machinery and Equipment and Parts Thereof; Sound Recorders andReproducers, Television Recorders and Reproducers, Parts and Accessories (HS: 85);
Organic Chemicals (HS: 29).
India exported a total of CAD 23,208.1 million worth of agricultural, agri-food &seafood products. The top five HS categories were:
Cotton, not Carded or Combed (HS: 5201) . . . . . . . . . . . . . . . . . . . . CAD 3,059.4 million;Cereals (HS: 10) . . . . . . . . . . . . . . . . . . . . . . . . . . . . . . . . . . . . . . . . . CAD 3,012.5 million;Fish and Crustaceans, Molluscs and Other Aquatic Invertebrates
(HS: 03) . . . . . . . . . . . . . . . . . . . . . . . . . . . . . . . . . . . . . . . . . . . . CAD 2,231.4 million;Residues and Waste from the Food Industries; Prepared Animal
Feed (HS: 23) . . . . . . . . . . . . . . . . . . . . . . . . . . . . . . . . . . . . . . . . CAD 2,130.1 million;Coffee, Tea, Mate and Spices (HS: 09). . . . . . . . . . . . . . . . . . . . . . . CAD 2,064.8 million.
The five most important markets for India’s agricultural, agri-food & seafood exportswere:
China . . . . . . . . . . . . . . . . . . . . . . . . . . . . . . . . . . . . . . . . . . . . . . CAD 2,704.1 million;USA . . . . . . . . . . . . . . . . . . . . . . . . . . . . . . . . . . . . . . . . . . . . . . . CAD 1,656.5 million;United Arab Emirates . . . . . . . . . . . . . . . . . . . . . . . . . . . . . . . . . CAD 1,621.7 million;Pakistan . . . . . . . . . . . . . . . . . . . . . . . . . . . . . . . . . . . . . . . . . . . . CAD 1,258.9 million;

16
Vietnam . . . . . . . . . . . . . . . . . . . . . . . . . . . . . . . . . . . . . . . . . . . . CAD 1,211.7 million.
Canada ranked 32nd, taking CAD 167.8 million worth of India’s agri-food and seafood exports.The top five HS categories were:
Fish and Crustaceans, Molluscs and Other Aquatic Invertebrates (HS: 03) . . . CAD 44.8 million;Coffee, Tea, Mate and Spices. (HS: 09) . . . . . . . . . . . . . . . . . . . . . . . . . . . . . . CAD 25.1 million;Cereals (HS: 10) . . . . . . . . . . . . . . . . . . . . . . . . . . . . . . . . . . . . . . . . . . . . . . . . . CAD 18.1 million;Preparations of Vegetables, Fruit, Nuts or Other Parts of Plants (HS: 20) . . . . CAD 15.2 million;Oil Seeds and Oleaginous Fruits; Miscellaneous Grains, Seeds, and Fruit;
Industrial or Medicinal Plants; Straw and Fodder (HS: 12) . . . . . . . . . . . . . CAD 11.4 million.
E. International Transportation - Canada to India1. Ocean
A number of shipping companies provide container services from Vancouver BC and HalifaxNS to India, either direct or with transshipments. Exporters may contact a freight forwarder toarrange shipping and transshipping. Coordinates of freight forwarders may be found in thetelephone directories of most cities and at the following website: www.superpages.ca (Nov 2011).
A list of shipping companies serving Vancouver is available at the website:http://portmetrovancouver.com/en/users/landoperations/terminalsandfacilities/container/containercarriersandberthschedule.aspx. (Nov 2011).
Cosco shipping line serves the Port of Prince Rupert, B.C. See website:http://www.cosco-usa.com/fpdb/Services/schedules.aspx. (Nov 2011). From Prince Rupert, Coscoships primarily to China but transshipments are possible - contact a freight forwarder.
A list of international shipping companies serving Montreal is available at the website:http://www.port-montreal.com/site/3_0/3_2.jsp?lang=en. (Nov 2011).
A list of shipping companies serving Halifax is available at the website:http://www.portofhalifax.ca/english/cargo/sailing-schedule/index.html. (Nov 2011).
2. Air FreightMany airlines serve Canadian airports with international cargo services. For example,
Vancouver International Airport is served by more than 45 air carriers, that accept cargo.
A list of air carriers serving Vancouver International Airport is available at the followingwebsite: http://www.yvr.ca/en/business-at-YVR/cargo/Cargo-Village/Carriers.aspx. (Nov 2011)
A list of freight forwarders serving Vancouver International Airport is available at the
17
following website:http://www.yvr.ca/en/business-at-YVR/cargo/Cargo-Village/Freight-Forwarders.aspx. (Jun 2011).
A list of air carriers and air freight forwarders serving Calgary International Airport isavailable at the following website: http://www.calgaryairport.com/Default.aspx?cid=682&lang=1(Nov 2011).
A list of air carriers and freight forwarders serving Winnipeg International Airport is availableat the following website: http://www.waa.ca/business/cargo/airlines (Nov 2011).
A list of air carriers serving Toronto International Airport is available at the followingwebsite: http://www.torontopearson.com/PearsonContent.aspx?id=903 (Nov 2011).
A list of air carriers serving the airports of Montreal is available at the following website:http://www.admtl.com/Business/Cargo/CarriersAndIntegrators.aspx (Feb 2012).
A list of air carriers and freight forwarders serving Halifax International Airport is available atthe following website: http://www.hiaa.ca/default.asp?mn=70.1.261.286#AirCarriersCargo (Feb2012).
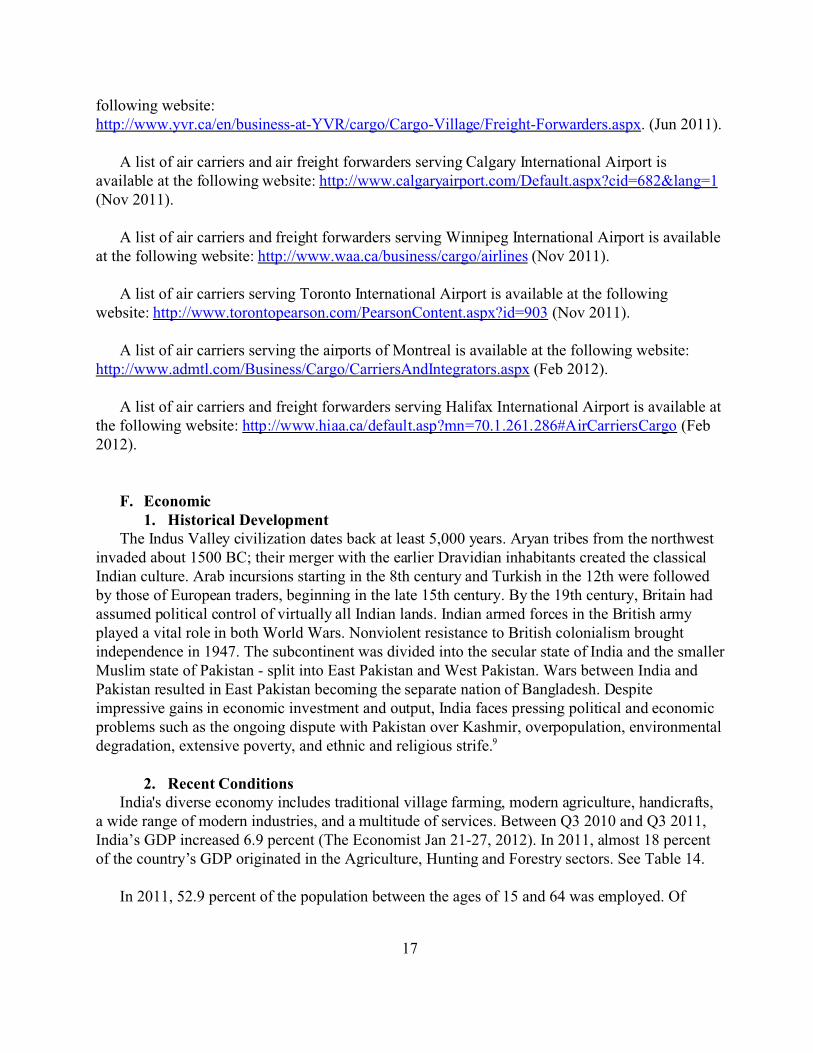
F. Economic1. Historical Development
The Indus Valley civilization dates back at least 5,000 years. Aryan tribes from the northwestinvaded about 1500 BC; their merger with the earlier Dravidian inhabitants created the classicalIndian culture. Arab incursions starting in the 8th century and Turkish in the 12th were followedby those of European traders, beginning in the late 15th century. By the 19th century, Britain hadassumed political control of virtually all Indian lands. Indian armed forces in the British armyplayed a vital role in both World Wars. Nonviolent resistance to British colonialism broughtindependence in 1947. The subcontinent was divided into the secular state of India and the smallerMuslim state of Pakistan - split into East Pakistan and West Pakistan. Wars between India andPakistan resulted in East Pakistan becoming the separate nation of Bangladesh. Despiteimpressive gains in economic investment and output, India faces pressing political and economicproblems such as the ongoing dispute with Pakistan over Kashmir, overpopulation, environmentaldegradation, extensive poverty, and ethnic and religious strife.9
2. Recent ConditionsIndia's diverse economy includes traditional village farming, modern agriculture, handicrafts,
a wide range of modern industries, and a multitude of services. Between Q3 2010 and Q3 2011,India’s GDP increased 6.9 percent (The Economist Jan 21-27, 2012). In 2011, almost 18 percentof the country’s GDP originated in the Agriculture, Hunting and Forestry sectors. See Table 14.
In 2011, 52.9 percent of the population between the ages of 15 and 64 was employed. Of

18
these, 52.8 percent were in the Agriculture, Hunting, Forestry and Fishing sectors, down from56.5 percent in 2006. See Table 15.
Government controls on foreign trade and investment have been reduced for some products,but high tariffs for agricultural and agri-food products remain (averaging 36.04 percent for alldutiable items from all countries). Tariff rates on agricultural and agri-food products that areimported from Canada averages 35.11 percent. The average tariff rates on these products weightedby the value of actual imports was 10.30 percent. See Table 5.
Privatization of government-owned industries has proceeded slowly, and continues to generatepolitical debate. Continued social, political, and economic rigidities hold back needed initiatives.
Table 5. Average Tariff Rates Applied onAgricultural, Agri-food, Fish andSeafood Products, 2008. India.
Source Country/ Region
SimpleAverageTariff by
Tariff Line(%) a
WeightedTariff Rate
(%) b
All Sources 36.04 23.38
NAFTA 36.04 15.34
Canada 35.11 10.30
Australia 12.67
EU 30.05
USA 24.75
China 30.48
Myanmar 10.00
Malaysia 27.37
Ukraine 10.00
Russia 10.38

Source Country/ Region
SimpleAverageTariff by
Tariff Line(%) a
WeightedTariff Rate
(%) b
19
Source: Tariff Analysis Facility of the WTO.
https://tariffanalysis.wto.org/welcome.aspx?Return
Url=%2f (Accessed Nov 2011).
Notes: a Simple Average = Sum of Duties / Number of
Tariff Lines.
b Weighted Average = (Sum of (Tariff Rate *
Import Value)) / Sum of Import Values.
The tariff on all fish and seafood products from all
sources is 30 %.
India is capitalizing on its large number of well-educated people skilled in the Englishlanguage to become a major exporter of software services and software workers. Despite stronggrowth, the World Bank and others worry about the combined state and federal budget deficit.The public debt was 64.2 percent of GDP in 2010 and expected to be 61.9 percent in 2011. Thebudget deficit in 2011 is expected to be 5.4 percent of GDP. The huge and growing population isthe fundamental social, economic, and environmental problem.
3. Determinants of Food DemandQuantitatively, the rate of increase in the effective demand for agricultural, agri-food &
seafood products is influenced by the rates of change of: population, product prices, income perperson / household and income distribution.
Qualitatively, the types of products demanded by consumers are determined by their tastes andpreferences which are in turn influenced by the cultures that make up today’s India and theirknowledge and acceptance of foreign cuisines. Income level also has an important influence onthe level of quality demanded.
Table 6. Determinants of Changes inthe Effective Demand forFood. 2005 to 2011.
Item Value(%)
Population, Annual Change. 1.45
Consumer Price Index, Annual
Change.9.02

Item Value(%)
20
Food and Non- Alcoholic Beverage
Price Index, Annual Change.9.37
Disposable Income per Household
Annual, Change. * 14.40
Number of Households in the
Disposable Income Range Int’l $
(PPP) 10,000 to 74,999, Annual
Change.
11.47
Source: Euromonitor International.
Note: Measured in INRs.
PopulationBetween 2005 and 2011, the Indian population was increasing at a rate of 1.45% per year,
reaching an estimated 1.21 billion people. The rate of increase was moderately rapid compared tosome other countries. This rate of increase and the size were very positive factors in the potentialdemand for food products.
PricesBetween 2005 and 2011, the price index of consumer goods generally were increasing rapidly
at 9.02 percent per year and the price index of food and non-alcoholic beverages was increasingeven faster at 9.37 percent per year. Generally this was a negative factor affecting the effectivedemand for food but may be offset by increases in income
IncomeBetween 2005 and 2011, disposable income per household was increasing at 14.40 percent per
year reaching INR 324,867 per year. This rate of increase was very positive and offset theincreases in prices.
Income DistributionBetween 2005 and 2011, the middle income household group (Int’l $ 10,000 to 74,999), was
increasing at a rate of 11.47 percent per year reaching 143.4 million households in 2011.
The overall national distribution of income was becoming slightly less equitable as the lowerincome groups still make up about 35 percent of households. The level of income inequality isindicated by the Gini ratio10. In 2005 it was calculated as 37.8; by 2011 it had reached 39.9(compared to Canada’s ratio of 38.5 in 2011).
Of all the Indian states/union territories, Bihar had the lowest average Net State Domestic Product(NSDP) per person at CAD 436 in 2011. Goa had the highest NSDP per person at CAD 4,355.

21
4. Consumer Expenditures on Food and Non-Alcoholic Beverages, by PoliticalDivision
Total expenditure on food and non-alcoholic beverages in a political division is influenced bypopulation, income and to some extent the preferences of consumers for food.
Household expenditure on food and non-alcoholic beverages is an average and is not affected bythe size of the population but is influenced by income and preferences.
The proportion of total expenditures allocated to food and non-alcoholic beverages generallydecreases as income increases. This effect may be somewhat softened as consumers withincreasing income demand higher quality, and higher priced, food.
Table 7. Expenditure on Food and Non-alcoholic Beverages in Selected PoliticalDivisions of India.
Political Division
Total Expenditure
on Food & Non-
Alcoholic Beverages
2011
Expenditure per
Household on Food &
Non-Alcoholic Beverages
(CAD)
Proportion of Total
Expenditure Allocated to Food
& Non-Alcoholic Beverages
(%)
CAD
(Million)% 2006 2011 2006 2011
India. 295 ,311 .0 100.00% 955.7 1,287.1 32.52% 26.30%
Andhra Pradesh. 20,686.1 7.00% 843.6 1,071.4 31.72% 26.29%
Bihar. 19,874.3 6.73% 942.8 1,199.5 45.97% 35.03%
Delhi. 6,474.8 2.19% 1,309.4 1,734.9 23.80% 17.74%
Goa. 892 .6 0.30% 2,130.6 2,280.7 24.89% 23.86%
Jammu & Kashmir. 4,123.4 1.40% 1,400.7 1,942.4 34.08% 28.91%
Maharashtra. 30,548.7 10.34% 982.0 1,334.8 27.98% 21.61%
Mizoram. 440 .7 0.15% 1,539.8 2,028.1 33.57% 21.96%
Orissa. 8,558.8 2.90% 761.1 966 .9 41.11% 33.93%
Punjab. 8,405.7 2.85% 1,300.5 1,675.6 27.59% 22.00%
Sikkim. 180 .8 0.06% 1,040.0 1,388.8 34.43% 28.09%
Uttar Pradesh. 42,761.3 14.48% 999.3 1,341.1 34.47% 28.13%
West Bengal. 23,569.7 7.98% 946.7 1,277.3 35.47% 30.99%
Source: Based on data from Euromonitor International (Accessed Jan 2012).

22
5. Determinants of Food ImportsMany factors influence the amount of food imported into a country including: total food
demand, productive capacity, exchange rate movements, transportation costs, tariffs and variousnon-tariff trade barriers. The capacity of a country to produce food is in turn influenced by theagricultural and fishery resources it possesses, the levels of technology and the number ofmanagers with modern management skills.
Food DemandBetween 2006 and 2011, the expenditure on food and non-alcoholic beverages, measured in
current INR prices was increasing at a rate of 11.60 percent per year. Measured in CADs it isincreasing at a rate of 7.50 percent per year, reaching CAD 300,752 million in 2011.
Measured at fixed 2011 prices, Indian expenditure on food was increasing at a rate of 1.77percent per year.
On a per household basis, Indian households were increasing expenditure (measured in currentINRs) on food and non-alcoholic beverages at a rate of 9.74 percent per year. In CADs, householdexpenditures on food and non-alcoholic beverages was increasing at a rate of 5.72 percent peryear, reaching CAD 1,311 in 2011.
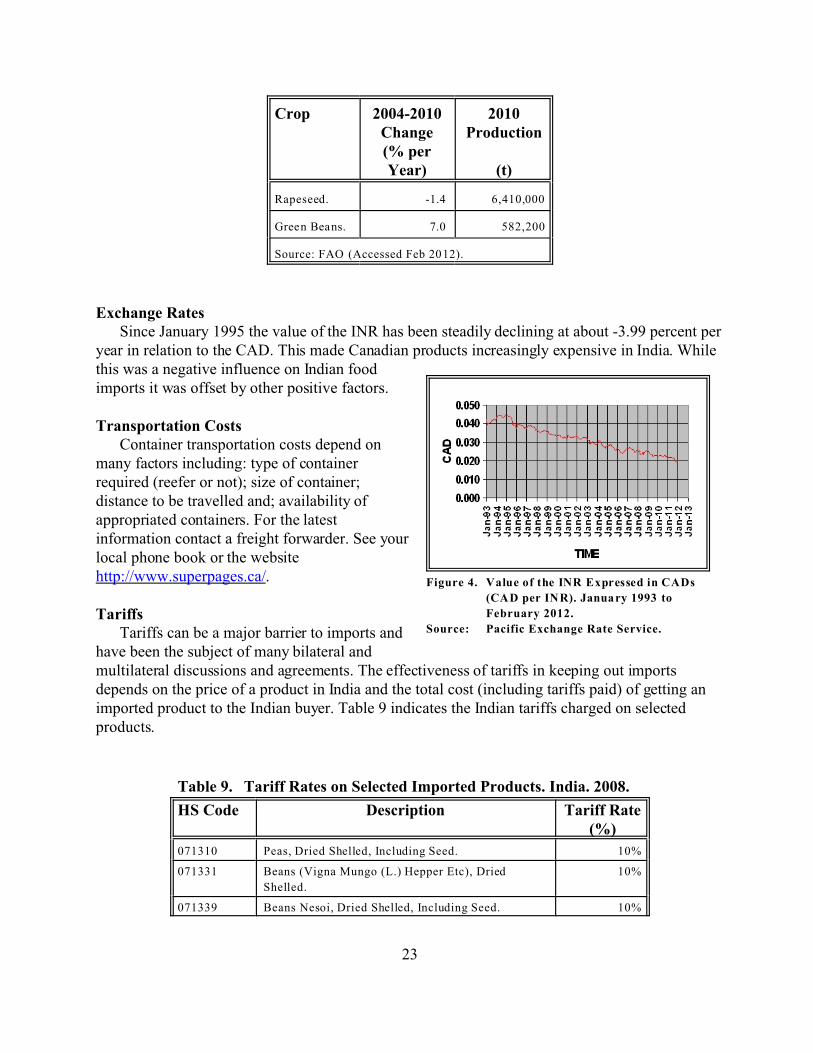
Productive CapacityTable 8 presents the production data for selected crops. The FAO food balance sheet for India
indicates that in 2007, India was almost self sufficient in wheat and “other pulses” and fully selfsufficient in rice, millet, sorghum and rapeseed & mustardseed. It was not self sufficient in beans,peas and soybean oil. In February 2012, FAO food balance sheets for 2010 were not available
Table 8. Production and AnnualIncreases of Selected Crops,India.
Crop 2004-2010Change(% perYear)
2010Production
(t)
Rice, Paddy. -0.3 120,620,000
Wheat. 2.8 80,710,000
Pulses. 3.3 17,110,000
Millet. -0.8 10,940,000
Sorghum. 0.6 6,980,000
Crop 2004-2010Change(% perYear)
2010Production
(t)
23
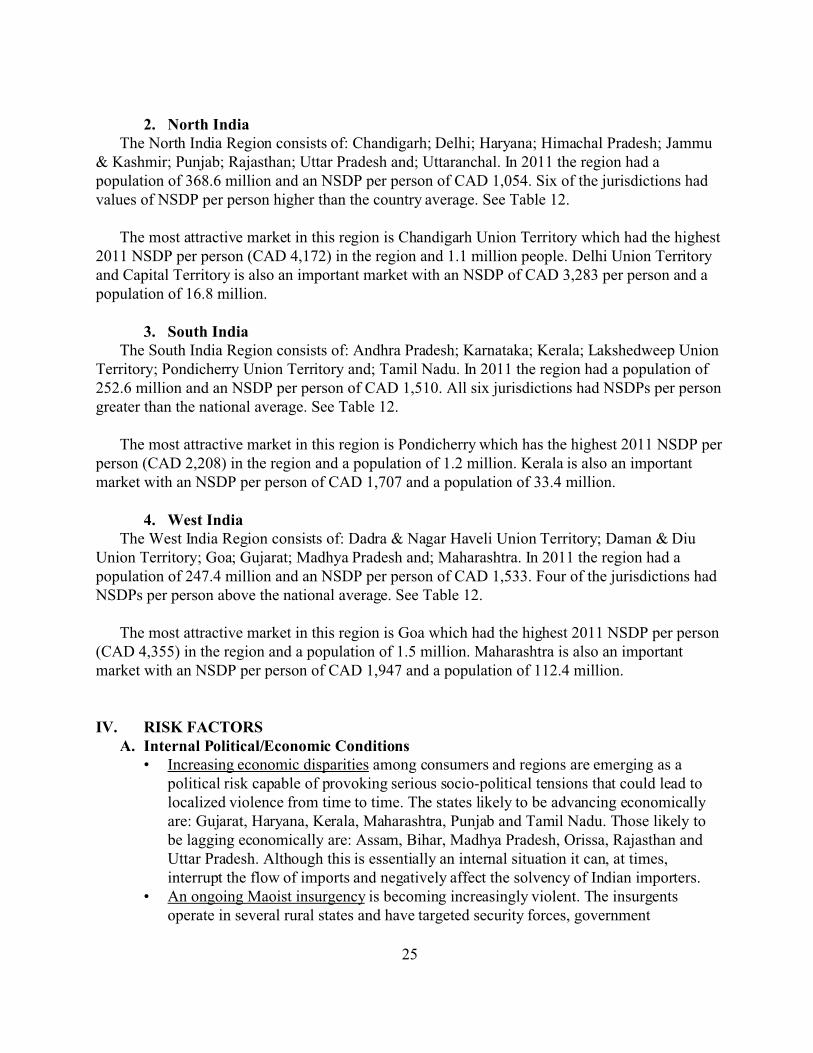
Figure 4. Value of the INR Expressed in CADs
(CAD per INR). January 1993 to
February 2012.
Source: Pacific Exchange Rate Service.
Rapeseed. -1.4 6,410,000
Green Beans. 7.0 582,200
Source: FAO (Accessed Feb 2012).
Exchange RatesSince January 1995 the value of the INR has been steadily declining at about -3.99 percent per
year in relation to the CAD. This made Canadian products increasingly expensive in India. Whilethis was a negative influence on Indian foodimports it was offset by other positive factors.
Transportation CostsContainer transportation costs depend on
many factors including: type of containerrequired (reefer or not); size of container;distance to be travelled and; availability ofappropriated containers. For the latestinformation contact a freight forwarder. See yourlocal phone book or the websitehttp://www.superpages.ca/.
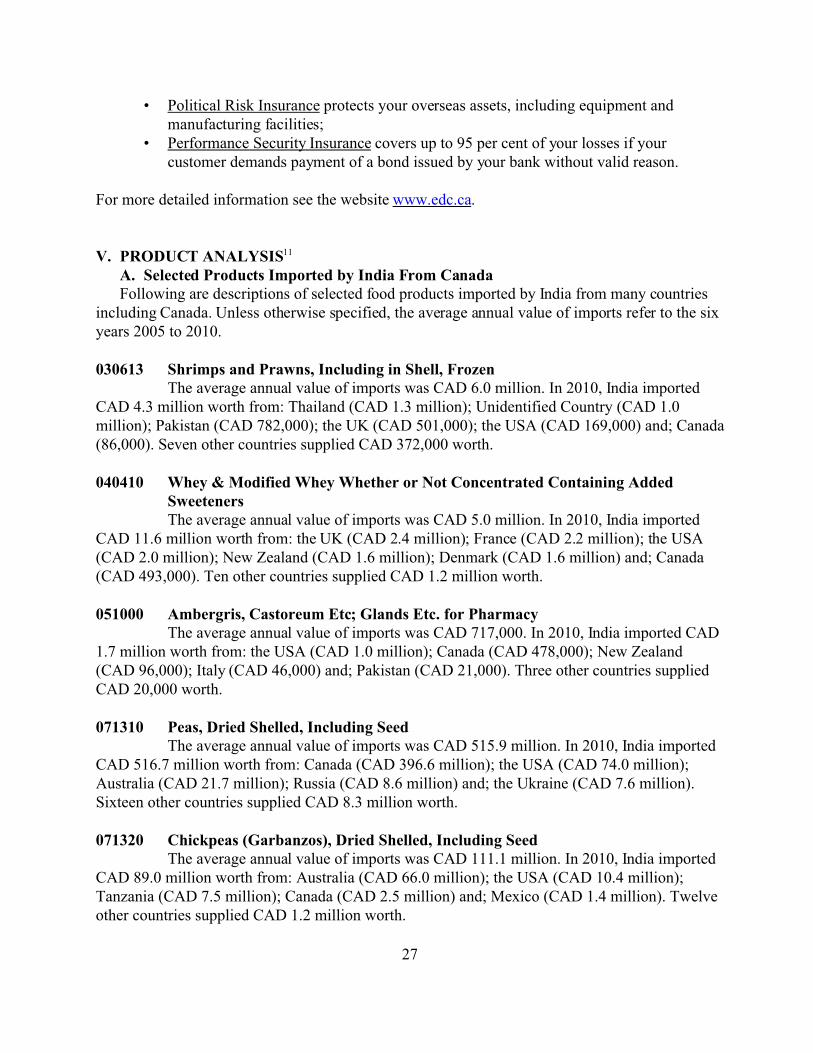
TariffsTariffs can be a major barrier to imports and
have been the subject of many bilateral andmultilateral discussions and agreements. The effectiveness of tariffs in keeping out importsdepends on the price of a product in India and the total cost (including tariffs paid) of getting animported product to the Indian buyer. Table 9 indicates the Indian tariffs charged on selectedproducts.
Table 9. Tariff Rates on Selected Imported Products. India. 2008.
HS Code Description Tariff Rate(%)
071310 Peas, Dried Shelled, Including Seed. 10%
071331 Beans (Vigna Mungo (L.) Hepper Etc), Dried
Shelled.
10%
071339 Beans Nesoi, Dried Shelled, Including Seed. 10%

HS Code Description Tariff Rate(%)
24
071340 Lentils, Dried Shelled, Including Seed. 10%
071390 Leguminous Vegetables Nesoi, Dried Shell,
Including Seed.
10%
080810 Apples, Fresh. 50%
100110 Durum W heat. 50%
150710 Soybean Oil & Fractions, Crude, Whether or Not
Degummed.
0%
151211 Sunflower-seed or Safflower Oil, Crude, and
Fractions Thereof, Etc.
0%
2106901900
2106909900
Food Preparations Nesoi. 90%
2106901901
2106909901
Food Preparations Nesoi Other, Compound
Alcoholic Preparations (Other than Those Based on
Odoriferous Substances) of a Kind Used for
Manufacture of Beverages, of Alcoholic Strength by
Volume Exceeding 0 .5% Volume.
150%
2106901902
2106909902
Food Preparations Nesoi Other [Excluding
Compound Alcoholic Preparations (Other than
Those Based on Odoriferous Substances) of a Kind
Used for M anufacture of B everages, of Alcoholic
Strength by Volume Exceeding 0.5% V olume].
30%
230990 Animal Feed Preparations Except Dog or Cat Food,
Put up for Retail Sale.
30%
510119 Wool, Not Carded or Combed, Greasy, Nesoi. 5%
Source: Tariff Analysis Facility of the WTO.
https://tariffanalysis.wto.org/welcome.aspx?ReturnUrl=%2f (Accessed Nov
2011).
G. The Regions of India1. East & Northeast India
The East & Northeast Region consists of: Andaman & Nicobar Islands; Arunachal Pradesh;Assam; Bihar; Chhattisgarh; Jharkhand; Manipur; Meghalaya; Mizoram; Nagaland; Orissa;Sikkim; Tripura and; West Bengal. In 2011 the region had a population of 341.6 million and anNSDP per person of CAD 783. Four jurisdictions had values of NSDP per person higher than thecountry average. See Table 12.
The Andaman & Nicobar Islands Union Territory had the highest 2011 NSDP per person(CAD 2,418) in the region but a population at only 379,944. Sikkim is also an important marketwith an NSDP of CAD 1,977 per person and a population of 607,688.
25
2. North IndiaThe North India Region consists of: Chandigarh; Delhi; Haryana; Himachal Pradesh; Jammu
& Kashmir; Punjab; Rajasthan; Uttar Pradesh and; Uttaranchal. In 2011 the region had apopulation of 368.6 million and an NSDP per person of CAD 1,054. Six of the jurisdictions hadvalues of NSDP per person higher than the country average. See Table 12.
The most attractive market in this region is Chandigarh Union Territory which had the highest2011 NSDP per person (CAD 4,172) in the region and 1.1 million people. Delhi Union Territoryand Capital Territory is also an important market with an NSDP of CAD 3,283 per person and apopulation of 16.8 million.
3. South IndiaThe South India Region consists of: Andhra Pradesh; Karnataka; Kerala; Lakshedweep Union
Territory; Pondicherry Union Territory and; Tamil Nadu. In 2011 the region had a population of252.6 million and an NSDP per person of CAD 1,510. All six jurisdictions had NSDPs per persongreater than the national average. See Table 12.
The most attractive market in this region is Pondicherry which has the highest 2011 NSDP perperson (CAD 2,208) in the region and a population of 1.2 million. Kerala is also an importantmarket with an NSDP per person of CAD 1,707 and a population of 33.4 million.
4. West IndiaThe West India Region consists of: Dadra & Nagar Haveli Union Territory; Daman & Diu
Union Territory; Goa; Gujarat; Madhya Pradesh and; Maharashtra. In 2011 the region had apopulation of 247.4 million and an NSDP per person of CAD 1,533. Four of the jurisdictions hadNSDPs per person above the national average. See Table 12.
The most attractive market in this region is Goa which had the highest 2011 NSDP per person(CAD 4,355) in the region and a population of 1.5 million. Maharashtra is also an importantmarket with an NSDP per person of CAD 1,947 and a population of 112.4 million.
IV. RISK FACTORSA. Internal Political/Economic Conditions
• Increasing economic disparities among consumers and regions are emerging as apolitical risk capable of provoking serious socio-political tensions that could lead tolocalized violence from time to time. The states likely to be advancing economicallyare: Gujarat, Haryana, Kerala, Maharashtra, Punjab and Tamil Nadu. Those likely tobe lagging economically are: Assam, Bihar, Madhya Pradesh, Orissa, Rajasthan andUttar Pradesh. Although this is essentially an internal situation it can, at times,interrupt the flow of imports and negatively affect the solvency of Indian importers.
• An ongoing Maoist insurgency is becoming increasingly violent. The insurgentsoperate in several rural states and have targeted security forces, government

26
infrastructure and extractive companies.• Corruption remains a problem. Several scandals came to light in late 2010 and early
2011, particularly in the organisation of the Commonwealth Games and the granting ofmobile telephony licences. Corruption in general can increase the cost of doingbusiness in India.
• Inadequate infrastructure is a problem in India. Unreliable electric power and lack ofroad maintenance are examples of this problem which is rooted in the constraints ofpublic sector finances.
B. External Political/Economic ConditionsIndia has major disputes with Pakistan and China.
• India disputes Pakistan’s claim to Kashmir and questions its claim to have stoppedsponsoring terrorism in Kashmir.
• Relations with China are strained by its claim to Arunachal Pradesh and a portion of landadjacent to Jammu and Kashmir.
• India has recently been the victim of terrorism and occasionally, attacks disrupt businessactivities.
Any outbreak of hostilities between India and its neighbours could disrupt trade.
C. Handling Risks of International Trade Some risks are normally covered by commercial cargo insurance in accordance with
minimum cover of the Institute Cargo Clauses (Institute of London Underwriters) or some similarclause. This insurance normally covers the standard risks involved in transporting goods, such asaccidents and weather.
If a Canadian exporter expects to incur costs, or receive payment in INRs, consideration maybe given to hedging against currency risks by participating in the futures market. This strategy isnot appropriate in all situations and the exporter should obtain advice from a bank or other trustedexpert.
Additional risks might be covered by Accounts Receivable Insurance and other productssimilar to those offered by Export Development Canada (EDC). The availability, terms and costsof this insurance will depend on conditions in the importing country, the reputation of theimporter and EDC policy. The risks covered are:
• Accounts Receivable Insurance covers your receivables up to 90 per cent of lossesresulting from commercial or political risks;
• Single Buyer Insurance covers unlimited sales to one customer for 180 days;• Contract Frustration Insurance covers up to 90 per cent of your losses for one export
contract;
27
• Political Risk Insurance protects your overseas assets, including equipment andmanufacturing facilities;
• Performance Security Insurance covers up to 95 per cent of your losses if yourcustomer demands payment of a bond issued by your bank without valid reason.
For more detailed information see the website www.edc.ca.
V. PRODUCT ANALYSIS11
A. Selected Products Imported by India From CanadaFollowing are descriptions of selected food products imported by India from many countries
including Canada. Unless otherwise specified, the average annual value of imports refer to the sixyears 2005 to 2010.
030613 Shrimps and Prawns, Including in Shell, FrozenThe average annual value of imports was CAD 6.0 million. In 2010, India imported
CAD 4.3 million worth from: Thailand (CAD 1.3 million); Unidentified Country (CAD 1.0million); Pakistan (CAD 782,000); the UK (CAD 501,000); the USA (CAD 169,000) and; Canada(86,000). Seven other countries supplied CAD 372,000 worth.
040410 Whey & Modified Whey Whether or Not Concentrated Containing AddedSweetenersThe average annual value of imports was CAD 5.0 million. In 2010, India imported
CAD 11.6 million worth from: the UK (CAD 2.4 million); France (CAD 2.2 million); the USA(CAD 2.0 million); New Zealand (CAD 1.6 million); Denmark (CAD 1.6 million) and; Canada(CAD 493,000). Ten other countries supplied CAD 1.2 million worth.
051000 Ambergris, Castoreum Etc; Glands Etc. for PharmacyThe average annual value of imports was CAD 717,000. In 2010, India imported CAD
1.7 million worth from: the USA (CAD 1.0 million); Canada (CAD 478,000); New Zealand(CAD 96,000); Italy (CAD 46,000) and; Pakistan (CAD 21,000). Three other countries suppliedCAD 20,000 worth.
071310 Peas, Dried Shelled, Including SeedThe average annual value of imports was CAD 515.9 million. In 2010, India imported
CAD 516.7 million worth from: Canada (CAD 396.6 million); the USA (CAD 74.0 million);Australia (CAD 21.7 million); Russia (CAD 8.6 million) and; the Ukraine (CAD 7.6 million).Sixteen other countries supplied CAD 8.3 million worth.
071320 Chickpeas (Garbanzos), Dried Shelled, Including SeedThe average annual value of imports was CAD 111.1 million. In 2010, India imported
CAD 89.0 million worth from: Australia (CAD 66.0 million); the USA (CAD 10.4 million);Tanzania (CAD 7.5 million); Canada (CAD 2.5 million) and; Mexico (CAD 1.4 million). Twelveother countries supplied CAD 1.2 million worth.

28
071340 Lentils, Dried Shelled, Including SeedThe average annual value of imports was CAD 97.9 million. In 2010, India imported
CAD 215.4 million worth from: Canada (CAD 158.1 million); the USA (CAD 46.5 million);Australia (CAD 7.1 million); Russia (CAD 3.3 million) and; Brazil (CAD 185,000). Five othercountries supplied CAD 379,000 worth.
080131 Cashew Nuts, Fresh or Dried, in ShellThe average annual value of imports was CAD 560.7 million. In 2010, India imported
CAD 590.3 million worth from: Cote d’ Ivoire (CAD 169.2 million); Tanzania (CAD 125.7million); Benin (CAD 81.1 million); Guinea-Bissau (CAD 61.0 million); Ghana (CAD 47.4million) and; Canada (CAD 112,000). Twenty-two other countries supplied 105.6 million worth.
080211 Almonds, Fresh or Dried, in ShellThe average annual value of imports was CAD 198.0 million. In 2010, India imported
CAD 252.8 million worth from: the USA (CAD 221.0 million); Australia (CAD 24.1 million);China (CAD 3.7 million); Afghanistan (CAD 1.3 million); the United Arab Emirates (CAD469,000) and; Canada (CAD 138,000). Fifteen other countries supplied CAD 2.0 million worth.
090940 Seeds of CarawayThe average annual value of imports was CAD 3.7 million. In 2010, India imported
CAD 4.7 million worth from: Afghanistan (CAD 3.4 million); Finland (CAD 458,000); Egypt(CAD 444,000); Canada (CAD 130,000) and; Syria (CAD 106,000). Three other countriessupplied CAD 170,000 worth.
120750 Mustard Seeds, Whether or Not BrokenThe average annual value of imports was CAD 1.3 million. In 2010, India imported
CAD 222,000 worth from Canada.
151419 Rapeseed / Colza Oil & Fractions, Low Erucic Acid, NesoiThe average annual value of imports was CAD 39,000. In 2010, India imported CAD
227,000 worth from: Canada (CAD 227,000) and; Japan (less than CAD 1,000).
151499 Rapeseed, Colza, Mustard Oil & Fractions Thereof, NesoiThe average annual value of imports was CAD 59,000. In 2010, India imported CAD
168,000 worth from: Canada (CAD 145,000); Italy (CAD 16,000) and; Singapore (CAD 7,000).
170199 Cane / Beet Sugar Chemically Pure Sucrose Refined NesoiThe average annual value of imports was CAD 73.7 million. In 2010, India imported
CAD 232.1 million worth from: Brazil (CAD 109.7 million); Thailand (CAD 71.5 million); theUnited Arab Emirates (CAD 18.4 million); Spain (CAD 10.2 million); Malaysia (CAD 6.4million) and; Canada (CAD 98,000). Twenty-one other countries supplied CAD 15.7 millionworth.
170211 Lactose & Lactose Syrup Containing 99% or More Lactose by Weight

29
The average annual value of imports was CAD 16.6 million. In 2010, India importedCAD 24.8 million worth from: Germany (CAD 8.0 million); the Netherlands (CAD 6.0 million);the USA (CAD 5.5 million); Canada (CAD 2.3 million) and; New Zealand (CAD 1.6 million).Twenty other countries supplied CAD 1.3 million worth.
170490 Sugar Confection (Including White Chocolate), Not Containing Cocoa, NesoiThe average annual value of imports was CAD 8.4 million. In 2010, India imported
CAD 13.3 million worth from: China (CAD 2.1 million); Australia (CAD 2.1 million); Indonesia(CAD 2.0 million); Thailand (CAD 1.7 million); Malaysia (CAD 1.3 million) and; Canada (CAD265,000). Thirty-six other countries supplied CAD 3.9 million worth.
180100 Cocoa Beans, Whole or Broken, Raw or RoastedThe average annual value of imports was CAD 21.4 million. In 2010, India imported
CAD 38.4 million worth from: Indonesia (CAD 13.4 million); the Dominican Republic (CAD10.4 million); Ghana (CAD 5.6 million); Ecuador (CAD 4.3 million); Uganda (CAD 2.0 million)and; Canada (CAD 742,000). Four other countries supplied CAD 2.0 million worth.
210210 Yeasts, ActiveThe average annual value of imports was CAD 2.7 million. In 2010, India imported
CAD 3.9 million worth from: China (CAD 2.2 million); the USA (CAD 463,000); Canada (CAD316,000); the UK (CAD 234,000) and; France (CAD 186,000). Twenty-five other countriessupplied CAD 507,000 worth.
210610 Protein Concentrates & Textured Protein SubstancesThe average annual value of imports was CAD 5.5 million. In 2010, India imported
CAD 11.3 million worth from: the USA (CAD 7.9 million); New Zealand (CAD 695,000); theNetherlands (CAD 411,000); Canada (CAD 387,000) and; Switzerland (CAD 361,000). Twenty-three other countries supplied CAD 1.5 million worth.
210690 Food Preparations NesoiThe average annual value of imports was CAD 28.0 million. In 2010, India imported
CAD 52.7 million worth from: the USA (CAD 16.2 million); Thailand (CAD 6.1 million);Singapore (CAD 6.1 million); the Netherlands (CAD 6.0 million); Denmark (CAD 4.0 million)and; Canada (CAD 528,000). Fifty-seven other countries supplied CAD 13.8 million worth.
220710 Ethyl Alcohol, Undenatured, Alcohol Not under 80% by VolumeThe average annual value of imports was CAD 5.8 million. In 2010, India imported
CAD 758,000 worth from: Canada (CAD 240,000); Germany (CAD 149,000); Italy (CAD147,000); the UK (CAD 123,000); China (CAD 59,000). Five other countries supplied CAD42,000 worth.
30
220830 WhiskiesThe average annual value of imports was CAD 41.3 million. In 2010, India imported
CAD 58.3 million worth from: the UK (CAD 43.3 million); the United Arab Emirates (CAD 2.8million); China (CAD 2.3 million); the USA (CAD 1.8 million); the Netherlands (CAD 1.8million) and; Canada (CAD 120,000). Twenty-seven other countries supplied CAD 6.2 millionworth.
220870 Liqueurs and CordialsThe average annual value of imports was CAD 5.5 million. In 2010, India imported
CAD 7.9 million worth from: the UK (CAD 5.8 million); France (CAD 800,000); the Netherlands(CAD 390,000); the USA (CAD 315,000); Italy (CAD 193,000) and; Canada (CAD 91,000).Twenty other countries supplied CAD 312,000 worth.
230690 Oilcake Etc. Resulting from the Extraction of Vegetable Fats and Oils NesoiThe average annual value of imports was CAD 5.7 million. In 2010, India imported
CAD 8.9 million worth from: Nepal (CAD 6.0 million); Canada (CAD 2.3 million); Ghana (CAD562,000); Italy (CAD 71,000) and; Sri Lanka (CAD 31,000).
230990 Animal Feed Preparations Except Dog or Cat Food, Retail PackagedThe average annual value of imports was CAD 94.7 million. In 2010, India imported
CAD 149.7 million worth from: Sri Lanka (CAD 43.6 million); China (CAD 22.8 million);Thailand (CAD 13.5 million); the USA (CAD 10.8 million); Germany (CAD 8.9 million) and;Canada (382,000). Thirty-seven other countries supplied CAD 49.8 million worth.
410190 Butts / Bends / Bellies of Bovine / Equine AnimalsThe average annual value of imports was CAD 27.8 million. In 2010, India imported
CAD 32.0 million worth from: the Netherlands (CAD 3.4 million); the USA (CAD 3.3 million);New Zealand (CAD 3.1 million); Italy (CAD 2.5 million); Myanmar (CAD 1.8 million) and;Canada (CAD 282,000). Fifty-seven other countries supplied CAD 17.6 million worth.
B. Selected Products Imported by India But Currently Not From CanadaUnless otherwise specified, the average annual value of imports refers to the six years 2005 to
2010.
030269 Fish, Nesoi, with Bones, Fresh or ChilledThe average annual value of imports was CAD 24.2 million. In 2010, India imported
CAD 39.4 million worth from: Bangladesh (CAD 38.6 million); Japan (CAD 572,000); Thailand(CAD 242,000) and; the Netherlands (CAD 11,000). In 2010, Canada exported these products to20 other countries.

31
040210 Milk & Cream, Concentrated, Sweetened, Powdered, Granules / Other Solids,Not over 1.5% FatThe average annual value of imports was CAD 11.8 million. In 2010, India imported
CAD 58.1 million worth from: Australia (CAD 41.3 million); New Zealand (CAD 15.0 million);Belarus (CAD 1.3 million); the Netherlands (CAD 249,000) and; Denmark (CAD 178,000). Fiveother countries supplied CAD 177,000 worth. In 2010, Canada exported these products to 31other countries.
040229 Milk & Cream, Concentrated, Sweetened, Powdered, Granules / Other Solids,over 1.5% Fat
The average annual value of imports was CAD 6.3 million. In 2010, India importedCAD 34.2 million worth from: New Zealand (CAD 32.7 million); Australia (CAD 965,000); theNetherlands (CAD 343,000); Denmark (CAD 73,000) and; the United Arab Emirates (CAD63,000). Four other countries supplied CAD 74,000 worth. Canada last supplied less than CAD1,000 these products to India in 2008. In 2010, Canada exported these products to eight othercountries.
040590 Fats and Oils Derived from Milk, NesoiThe average annual value of imports was CAD 24.5 million. In 2010, India imported
CAD 75.8 million worth from: New Zealand (CAD 73.7 million); Nepal (CAD 1.8 million);Uganda (CAD 245,000) and; Kenya (CAD 46,000). In 2010, Canada exported these products totwo other countries.
050100 Human Hair, Unworked and Waste of Human HairThe average annual value of imports was CAD 8.0 million. In 2010, India imported
CAD 16.6 million worth from: Myanmar (CAD 12.7 million); China (CAD 2.7 million); Thailand(CAD 758,000); Singapore (CAD 436,000) and; Vietnam (CAD 49,000). Three other countriessupplied CAD 15,000 worth. In 2010, Canada exported these products to one other country.
071333 Kidney Beans & White Pea Beans, Dried Shelled, Including SeedThe average annual value of imports was CAD 43.6 million. In 2010, India imported
CAD 69.3 million worth from: China (CAD 57.4 million); Myanmar (CAD 6.1 million); Ethiopia(CAD 4.4 million); Peru (CAD 512,000) and; Mozambique (CAD 308,000). Six other countriessupplied CAD 617,000 worth. In 2010, Canada exported these products to 70 other countries.
071339 Beans Nesoi, Dried Shelled, Including SeedThe average annual value of imports was CAD 107.8 million. In 2010, India imported
CAD 96.2 million worth from: Myanmar (CAD 71.5 million); Pakistan (CAD 6.9 million); Brazil(CAD 3.9 million); Madagascar (CAD 2.6 million) and; China (CAD 2.6 million). Fifteen othercountries supplied CAD 8.7 million worth. In 2010, Canada exported these products to 64 othercountries.

32
071390 Leguminous Vegetables Nesoi, Dried Shelled, Including SeedThe average annual value of imports was CAD 263.1 million. In 2010, India imported
CAD 303.2 million worth from: Myanmar (CAD 175.5 million); Tanzania (CAD 52.8 million);Mozambique (CAD 36.7 million); Malawi (CAD 32.5 million) and; Kenya (CAD 4.9 million).Six other countries supplied CAD 722,000 worth. Canada last supplied CAD 33,000 worth ofthese products to India in 2009. In 2010, Canada exported these products to 14 other countries.
080212 Almonds, Fresh or Dried, ShelledThe average annual value of imports was CAD 37.7 million. In 2010, India imported
CAD 48.2 million worth from: the USA (CAD 18.7 million); Iran (CAD 11.3 million);Afghanistan (CAD 8.6 million); Australia (CAD 4.5 million) and; Syria (CAD 4.5 million). Fourother countries supplied CAD 739,000 worth. In 2010, Canada exported these products to eightother countries.
080290 Nuts Nesoi, Fresh or Dried, Whether or Not ShelledThe average annual value of imports was CAD 26.2 million. In 2010, India imported
CAD 48.1 million worth from: Bangladesh (CAD 20.6 million); Nepal (CAD 12.4 million);Indonesia (CAD 10.6 million); Sri Lanka (CAD 2.6 million) and; Myanmar (CAD 875,000). Sixother countries supplied CAD 1.1 million worth. In 2010, Canada exported these products to 17other countries.
080620 Grapes, Dried (Including Raisins)The average annual value of imports was CAD 14.4 million. In 2010, India imported
CAD 14.8 million worth from: Afghanistan (CAD 13.5 million); China (CAD 881,000); Pakistan(CAD 191,000); Iran (CAD 63,000) and; Thailand (CAD 51,000). Three other countries suppliedCAD 42,000 worth. In 2010, Canada exported these products to 18 other countries.
080820 Pears and Quinces, FreshThe average annual value of imports was CAD 6.6 million. In 2010, India imported
CAD 12.8 million worth from: China (CAD 7.3 million); the USA (CAD 3.0 million); SouthAfrica (CAD 2.4 million); Australia (CAD 70,000) and; Chile (CAD 24,000). One other countrysupplied CAD 19,000 worth. Canada last supplied CAD 3,000 worth to India in 2005. In 2010,Canada exported these products to five other countries.
090240 Black Tea Fermented & Other Partly Fermented Tea NesoiThe average annual value of imports was CAD 34.9 million. In 2010, India imported
CAD 45.7 million worth from: Nepal (CAD 16.3 million); Kenya (CAD 13.5 million); Indonesia(CAD 4.1 million); Vietnam (CAD 3.4 million) and; Iran (CAD 2.4 million). Twenty othercountries supplied CAD 6.0 million worth. Canada last supplied less than CAD 1,000 to India in2007. In 2010, Canada exported these products to seven other countries.
33
091010 GingerThe average annual value of imports was CAD 14.2 million. In 2010, India imported
CAD 18.3 million worth from: Nepal (CAD 6.5 million); Nigeria (CAD 4.8 million); China(CAD 2.3 million); Ethiopia (CAD 2.3 million) and; Myanmar (CAD 1.8 million). Thirteen othercountries supplied CAD 540,000 worth. In 2010, Canada exported this product to 12 othercountries.
100110 Durum WheatFrom 2006 to 2010, the average annual value of imports was CAD 20.4 million. In
2010, India imported CAD 25.9 million worth from: Australia (CAD 21.8 million); the Ukraine(CAD 2.0 million); Russia (CAD 1.4 million); Romania (CAD 509,000) and; Iran (CAD197,000). In 2010, Canada exported these products to 27 other countries.
100190 Wheat (Other than Durum Wheat), and MeslinFrom 2006 to 2010, the average annual value of imports was CAD 209.6 million. In
2010, India imported CAD 78.5 million worth from: Australia (CAD 62.3 million); Iran (CAD10.9 million); Russia (CAD 3.4 million); the Ukraine (CAD 1.3 million) and; Turkey (CAD295,000). Four other countries supplied CAD 237,000 worth. Canada last supplied CAD 104.7million worth to India in 2007. In 2010, Canada exported these products to 63 other countries.
120791 Poppy Seeds, Whether or Not BrokenThe average annual value of imports was CAD 21.7 million. In 2010, India imported
CAD 32.9 million worth from: Turkey (CAD 28.8 million) and; China (CAD 4.2 million). In2010, Canada exported these products to four other countries.
120799 Oil Seeds & Oleaginous Fruits Whether or Not Broken, NesoiThe average annual value of imports was CAD 20.4 million. In 2010, India imported
CAD 15.2 million worth from: Ghana (CAD 11.1 million); Benin (CAD 1.5 million); Ethiopia(CAD 583,000); Pakistan (CAD 474,000) and; Costa Rica (CAD 382,000). Eleven other countriessupplied CAD 1.1 million worth. In 2010, Canada exported these products to 23 other countries.
120991 Vegetable Seeds for SowingThe average annual value of imports was CAD 39.2 million. In 2010, India imported
CAD 49.9 million worth from: Thailand (CAD 8.0 million); Chile (CAD 7.8 million); China(CAD 6.0 million); the USA (CAD 5.0 million) and; Taiwan (CAD 4.1 million). Twenty-fourother countries supplied CAD 18.9 million worth. In 2010, Canada exported these products to 12other countries.
130190 Natural Gums, Gum Resins, Resins and Balsams NesoiThe average annual value of imports was CAD 43.8 million. In 2010, India imported
CAD 75.9 million worth from: Afghanistan (CAD 42.2 million); Thailand (CAD 16.5 million);Indonesia (CAD 5.9 million); Uzbekistan (CAD 1.9 million) and; China (CAD 1.5 million).Thirty-nine other countries supplied CAD 7.9 million worth. Canada last supplied less than CAD1,000 worth of these products to India in 2007. In 2010, Canada exported these products to 19

34
other countries.
150710 Soybean Oil & Fractions, Crude, Whether or Not DegummedThe average annual value of imports was CAD 807.6 million. In 2010, India imported
CAD 1,148.5 million worth from: Argentina (CAD 901.4 million); the USA (CAD 157.3million); Brazil (CAD 65.7 million); Saudi Arabia (CAD 15.7 million) and; Paraguay (CAD 4.5million). Four other countries supplied CAD 4.0 million worth. In 2010, Canada exported theseproducts to one other country.
151211 Sunflower-seed or Safflower Oil, Crude, Fractions, EtcThe average annual value of imports was CAD 239.2 million. In 2010, India imported
CAD 598.3 million worth from: the Ukraine (CAD 530.8 million); Argentina (CAD 27.9 million);Russia (CAD 23.1 million); the USA (CAD 16.3 million) and; Australia (CAD 72,000). Twoother countries supplied CAD 69,000 worth. In 2010, Canada exported these products to fiveother countries.
170191 Cane or Beet Sugar, Refined, Solid, Added Flavour / ColourFrom 2009 to 2010, the average annual value of imports was CAD 53.9 million. In
2010, India imported CAD 98.6 million worth from: Thailand (CAD 37.6 million); Spain (CAD17.5 million); Brazil (CAD 11.7 million); the United Arab Emirates (CAD 11.3 million) and;Malaysia (CAD 4.1 million). Twelve other countries supplied CAD 16.5 million worth. In 2010,Canada exported these products to 21 other countries.
180310 Cocoa Paste, Not DefattedThe average annual value of imports was CAD 5.2 million. In 2010, India imported
CAD 19.2 million worth from: Sri Lanka (CAD 16.9 million); Ghana (CAD 1.6 million); Cote d’Ivoire (CAD 392,000); Singapore (CAD 191,000) and; Malaysia (CAD 101,000). In 2010,Canada exported these products to one other country.
180500 Cocoa Powder, Not SweetenedThe average annual value of imports was CAD 7.4 million. In 2010, India imported
CAD 15.4 million worth from: Malaysia (CAD 6.6 million); Indonesia (CAD 3.5 million);Singapore (CAD 2.7 million); China (CAD 1.3 million) and; Cote d’Ivoire (CAD 316,000).Twelve other countries supplied CAD 1.0 million worth. Canada last supplied less than CAD1,000 worth to India in 2005. In 2010, Canada exported these products to seven other countries.
220290 Nonalcoholic Beverages, NesoiThe average annual value of imports was CAD 31.8 million. In 2010, India imported
CAD 37.4 million worth from: Nepal (CAD 21.7 million); Austria (CAD 11.2 million); the USA(CAD 753,000); the United Arab Emirates (CAD 636,000) and; South Africa (CAD 583,000).Twenty-seven other countries supplied CAD 2.5 million worth. Canada last supplied less thanCAD 1,000 worth to India in 2005. In 2010, Canada exported these products to 76 other countries.

35
220720 Ethyl Alcohol & Other Spirits, Denatured, of Any StrengthThe average annual value of imports was CAD 84.3 million. In 2010, India imported
CAD 68.7 million worth from: the USA (CAD 35.6 million); Brazil (CAD 32.0 million); theUnited Arab Emirates (CAD 304,000); Unidentified Country (CAD 148,000) and; the UK (CAD133,000). Eight other countries supplied CAD 509,000 worth. Canada last supplied CAD 29,000worth to India in 2009. In 2010, Canada exported these products to 26 other countries.
500200 Raw Silk (Not Thrown)The average annual value of imports was CAD 202.9 million. In 2010, India imported
CAD 200.8 million worth from: China (CAD 193.6 million); Uzbekistan (CAD 2.5 million);Malaysia (CAD 740,000); Japan (CAD 718,000) and; Thailand (CAD 659,000). Twelve othercountries supplied CAD 2.6 million worth. In 2010, Canada exported these products to three othercountries.
510119 Wool, Not Carded or Combed, Greasy, NesoiThe average annual value of imports was CAD 152.4 million. In 2010, India imported
CAD 202.2 million worth from: Australia (CAD 121.5 million); South Africa (CAD 29.1million); Argentina (CAD 9.6 million); Uruguay (CAD 6.1 million) and; the USA (CAD 6.0million). Forty-four other countries supplied CAD 29.9 million worth. Canada last supplied CAD247,000 to India in 2007. In 2010, Canada exported these products to one other country.
510121 Wool Not Carded / Combed Degreased Not Carbonized, ShornThe average annual value of imports was CAD 14.1 million. In 2010, India imported
CAD 17.5 million worth from: the UK (CAD 8.2 million); Australia (CAD 6.9 million); Uruguay(CAD 1.5 million); South Africa (CAD 687,000) and; Argentina (CAD 211,000). In 2010, Canadaexported these products to two other countries.
510129 Wool, Not Carded / Combed Degreased Not Carbonized NesoiThe average annual value of imports was CAD 95.5 million. In 2010, India imported
CAD 89.1 million worth from: New Zealand (CAD 24.5 million); Australia (CAD 23.6 million);Pakistan (CAD 7.6 million); Russia (CAD 3.8 million) and; Turkey (CAD 3.6 million). Forty-twoother countries supplied CAD 25.9 million worth. In 2010, Canada exported these products to oneother country.
VI. GRID ANALYSISA. All Agricultural, Agri-food & Seafood ProductsBetween 2005 and 2010, the value of Indian imports of agricultural, agri-food & seafood
products from all sources increased at a rate of 18.6 percent12 per year while the value of importsfrom Canada increased at a rate of 27.3 percent per year from CAD 202.6 million to CAD 568.3million. In comparison, the same imports from: Indonesia increased at a rate of 29.35 percent peryear, reaching CAD 4,152.3 million in 2010; imports from Argentina increased at a rate of 1.09percent per year reaching CAD 964.8 million in 2010 and; imports from Brazil decreased at a rateof 29.81 percent per year reaching CAD 892.8 million in 2010. Canada was gaining market share

36
in a quickly expanding market.
In 2010 Canada held 4.11 percent of the market while Indonesia held 30.05 percent, Argentinaheld 6.98 percent and Brazil held 6.46 percent of this CAD 13,819.7 million market.
B. Agricultural Agri-food & Seafood Imports of India From Canada vs From the WholeWorld
The annual rates of change refer to the period 2005 to 2010.
051000 Ambergris, Castoreum Etc; Glands Etc for PharmacyThe value of imports from all sources increased at a rate of 146.2 percent per year while the
value of imports from Canada increased at a rate of 44.8 percent per year. Canada was losingmarket share in a rapidly growing market; India was increasing imports from Canada at a slowerrate than from the world. In 2010, Canada held 28.38 percent of this CAD 1.7 million market.
071310 Peas, Dried Shelled, Including SeedThe value of imports from all sources increased at a rate of 20.1 percent per year while the
value of imports from Canada increased at a rate of 22.1 percent per year. Canada was gainingmarket share in a fast growing market; India was increasing imports from Canada at a faster ratethan from the world. In 2010, Canada held 76.74 percent of this CAD 516.7 million market.
071320 Chickpeas (Garbanzos), Dried Shelled, Including SeedThe value of imports from all sources increased at a rate of 2.1 percent per year while the
value of imports from Canada increased at a rate of 22.7 percent per year. Canada was gainingmarket share in a slowly growing market; India was increasing imports from Canada at a fasterrate than from the world. In 2010, Canada held 2.79 percent of this CAD 89.0 million market.
071340 Lentils, Dried Shelled, Including SeedThe value of imports from all sources increased at a rate of 64.7 percent per year while the
value of imports from Canada increased at a rate of 85.5 percent per year. Canada was gainingmarket share in a fast growing market; India was increasing imports from Canada at a faster ratethan from the world. In 2010, Canada held 73.37 percent of this CAD 215.4 million market.
120750 Mustard Seeds, Whether or Not BrokenThe value of imports from all sources decreased at a rate of -26.4 percent per year while the
value of imports from Canada decreased at a rate of -26.5 percent per year. Canada was slowlylosing market share in a declining market; India was reducing imports from Canada at a slightlyfaster rate than from the world. In 2010, Canada held 100.00 percent of this CAD 222,000 market.
37
121190 Plants & Parts Etc for Medicaments Etc NesoiThe value of imports from all sources increased at a rate of 11.2 percent per year while the
value of imports from Canada decreased at a rate of -6.8 percent per year. Canada was losingmarket share in a growing market; India was reducing imports from Canada while increasingimports from the world. In 2010, Canada held 0.07 percent of this CAD 35.6 million market.
130219 Vegetable Saps and Extracts, NesoiThe value of imports from all sources increased at a rate of 26.3 percent per year while the
value of imports from Canada increased at a rate of 71.6 percent per year. Canada was gainingmarket share in a growing market; India was increasing imports from Canada at a faster rate thanfrom the world. In 2010, Canada held 0.38 percent of this CAD 14.4 million market.
170199 Cane / Beet Sugar Chemically Pure Sucrose Refined NesoiThe value of imports from all sources increased at a rate of 215.3 percent per year while the
value of imports from Canada increased at a rate of 45.4 percent per year. Canada was losingmarket share in a rapidly growing market; India was increasing imports from Canada at a slowerrate than from the world. In 2010, Canada held 0.04 percent of this CAD 232.1 million market.
170211 Lactose & Lactose Syrup Containing 99% or More Lactose by WeightThe value of imports from all sources increased at a rate of 24.1 percent per year while the
value of imports from Canada increased at a rate of 30.2 percent per year. Canada was gainingmarket share in a growing market; India was increasing imports from Canada at a faster rate thanfrom the world. In 2010, Canada held 9.46 percent of this CAD 24.8 million market.
210210 Yeasts, ActiveThe value of imports from all sources increased at a rate of 16.0 percent per year while the
value of imports from Canada decreased at a rate of -3.8 percent per year. Canada was losingmarket share in a growing market; India was reducing imports from Canada while increasingimports from the world. In 2010, Canada held 8.18 percent of this CAD 3.9 million market.
210610 Protein Concentrates & Textured Protein SubstancesThe value of imports from all sources increased at a rate of 27.3 percent per year while the
value of imports from Canada increased at a rate of 3.1 percent per year. Canada was losingmarket share in a growing market; India was increasing imports from Canada at a slower rate thanfrom the world. In 2010, Canada held 3.43 percent of this CAD 11.3 million market.
210690 Food Preparations NesoiThe value of imports from all sources increased at a rate of 36.6 percent per year while the
value of imports from Canada increased at a rate of 8.7 percent per year. Canada was losingmarket share in a growing market; India was increasing imports from Canada at a much slowerrate than from the world. In 2010, Canada held 1.00 percent of this CAD 52.7 million market.

38
Figure 5. Percentage Changes in Selected Indian
Agricultural, Agri-food & Seafood Imports
- From Canada vs From the World. 2005 -
2010. Part 1.
230990 Animal Feed Preparations Except Dog or Cat Food, Retail PackagedThe value of imports from all sources increased at a rate of 26.0 percent per year while the
value of imports from Canada increased at a rate of 38.6 percent per year. Canada was gainingmarket share in a growing market; India was increasing imports from Canada at a faster rate thanfrom the world. In 2010, Canada held 0.26 percent of this CAD 149.7 million market.
Legend to Figure 5.HS CODE DESCRIPTION
071310 Peas, Dried Shelled, Including Seed.
071320 Chickpeas (Garbanzos), Dried Shelled, Including Seed.
071340 Lentils, Dried Shelled, Including Seed.
120750 Mustard Seeds, Whether or Not Broken.
121190 Plants & Parts Etc for Medicaments Etc Nesoi.
130219 Vegetable Saps and Extracts, Nesoi.
170211 Lactose & Lactose Syrup Containing 99% or More
Lactose by W eight.
210210 Yeasts, Active.
210610 Protein Concentrates & Textured Protein Substances.
210690 Food Preparations Nesoi.
230990 Animal Feed Preparations Except Dog or Cat Food,
Retail Packaged.
330129 Essential Oils, Neso i.
ALL AGRIFOOD All Agricultural, Agri-food & Seafood Products.

39
Figure 6. Percentage Changes in Selected Indian
Agricultural, Agri-food & Seafood Imports -
From Canada vs From the World. 2005 -
2010. Part 2.
330129 Essential Oils, NesoiThe value of imports from all sources increased at a rate of 26.1 percent per year while the
value of imports from Canada decreased at a rate of -5.4 percent per year. Canada was losingmarket share in a growing market; India was reducing imports from Canada while increasingimports from the world. In 2010, Canada held 0.11 percent of this CAD 48.7 million market.
Legend to Figure 6
HS CODE DESCRIPTION
051000 Ambergris, Castoreum Etc; Glands Etc for Pharmacy.
170199 Cane / Beet Sugar Chemically Pure Sucrose Refined
Nesoi.
VII. PRICE WORK-UPSA market is truly contestable only if the total of accumulated production costs, margins and
other marketing costs of putting the product on the retail shelf are expected to compete favourablywith similar products. In order to further identify possible contestable markets, Canadianexporters should gather specific data and information to complete a research-price-work-up. A

40
research-price-work-up could be developed before opening negotiations with a potential buyerand only to obtain an indication of the contestability of the market. It will be necessary to do aspecific-price-work-up for the actual terms negotiated - usually FOB or CIF.
A. The Research Price Work-upA research-price-work-up is developed by starting with the exporters production cost and
adding margins and costs to calculate the: “ex works” (EXW)13 value; “free alongside” (FAS)value; “free on board” (FOB) value; “cost and freight” (CFR) value; “cost, insurance and freight”(CIF) value; “delivered duty paid” (DDP) value and; the minimum retail value of the product. Theminimum retail value can then be compared to the actual retail price of a similar product in theforeign market. This comparison, along with other information, such as quality and consumercharacteristics, can be of significant importance in determining if a market is contestable.
B. PricesTables 10 and 19 provide an indication of the price competition facing Canadian products in
Indian food markets. It should be noted that different prices may reflect different qualities. A pricefor a Canadian product which is higher than competitors does not necessarily mean that themarket is not contestable - further research needs to be done to compare quality and othercharacteristics important to consumers. In the absence of such research, ratios of CIF prices areused as indicators of contestability.
Table 10. Ratios of Indian CIF Import Prices from Canada toIndian CIF Import Prices from the World. SelectedProducts. 2010.
Product CIF PriceRatio
(Canada /World)
030613 Shrimps and Prawns, Including in Shell, Frozen. 0.907
040410 Whey & Modified Whey Whether or Not Concentrated
Containing Added Sweeteners.
0.380
051000 Ambergris, Castoreum Etc; Glands Etc for Pharmacy. 1.181
071310 Peas, Dried Shelled, Including Seed. 0.971
071320 Chickpeas (Garbanzos), Dried Shelled, Include Seed. 1.593
071340 Lentils, Dried Shelled, Including Seed. 1.012
080131 Cashew Nuts, Fresh or Dried, in Shell. 1.076
080211 Almonds, Fresh or Dried, in Shell. 1.442
090940 Seeds of Caraway. 1.500
120750 Mustard Seeds, Whether or Not Broken. 1.000

Product CIF PriceRatio
(Canada /World)
41
121190 Plants & Parts Etc for Medicaments Etc Nesoi. 1.663
130219 Vegetable Saps and Extracts, Nesoi. 1.933
151419 Rapeseed / Colza Oil & Fractions, Low Erucic Acid,
Nesoi.
1.000
151499 Rapeseed , Colza, Mustard Oil & Fractions Thereof,
Nesoi.
0.977
170199 Cane / Beet Sugar Chemically Pure Sucrose Refined
Nesoi.
1.704
170211 Lactose & Lactose Syrup Containing 99% or More
Lactose by W eight.
0.777
170490 Sugar Confection (Including White Chocolate), No
Cocoa, Nesoi.
2.010
180100 Cocoa Beans, Whole or Broken, Raw or Roasted. 0.944
210210 Yeasts, Active. 2.551
210610 Protein Concentrates & Textured Protein Substances. 1.390
210690 Food Preparations Nesoi. 3.586
220710 Ethyl Alcohol, Undenatured, Alcohol Not under 80% by
Volume.
0.680
220830 Whiskies. 0.789
220870 Liqueurs and Cordials. 0.837
230690 Oilcake Etc. Derived from the Extraction of Vegetable
Fats and Oils Nesoi.
4.821
230990 Animal Feed Preparations Except Dog or Cat Food,
Retail Packaged.
2.047
330129 Essential Oils, Neso i. 0.682
410190 Butts / Bends / Bellies of Bovine / Equine Animals. 1.602
Source: Calculated from data supplied by the Indian Ministry of Commerce and
Statistics Canada, via Global Trade Atlas. (Nov 2011).
Note: Ratios < 1 are positive indicators of contestability.

42
VIII. IDENTIFICATION OF CONTESTABLE MARKETSSearching for market opportunities is not an exact science but some indication of the
probability that Canadian companies will find an opportunity in a particular market can be gainedfrom an index calculated from the number of positive indicators and the total number of indicatorsavailable. See Table 11. A positive research price work-up would be another strong indicator of acontestable market but requires additional data and information specific to the product beingexported from Canada.
A. Dairy ProductsAs a result of a WTO decision and agreements between Canada & New Zealand and Canada
& the USA (See Appendix 2), Canadian dairy products produced from milk purchased at thelower industrial price are considered to be subsidized when exported. The export of these productsare limited to: 3,500 t of butter; 9,076 t of cheese; 44,953 t of skim milk powder and; 30,282 t ofother milk products. Although not normally economic, there is no limit to the export of dairyproducts produced from the domestic full-priced milk.
The quota limits apply to Canadian exports to all countries not just the USA and NewZealand.
A company wishing to export products produced from the lower priced industrial milkmust obtain a permit to export within the quota limits from:
The Canadian Dairy Commission (CDC)Chief Commercial OperationsMarketing OperationsBuilding 55, CEFFloor Upper, Room 302960 Carling AveOttawa, ONK1A 0Z2Ph: (613) 792-2010FAX: (613) 792-2009
If the company is using domestic full-priced milk, no permit from the CDC is required.
In any case a company wanting to export dairy products must be registered with the CanadianFood Inspection Agency (CFIA) - see website: http://www.inspection.gc.ca/.
B. OpportunitiesDuring the period January 1993 to December 1994 a trend line fitted to the value of the INR
increased at a rate of 4.57% per year. The increasing value of the INR was a positive factorfacilitating the search for contestable markets in India. In contrast, between January 1995 andFebruary 2012 the value of the INR fell at a rate of -3.99% per year. During this time, thedeclining value of the INR was a negative factor making the identification of contestable markets

43
increasingly difficult.
Table 11. Summary of Indicators of Contestability of Selected Markets. India.
Product Indicators of Contestability
Index of
Indicators
(No. of +) /
(no.
available)
CIF Price
Change a
(%/year)
CIF Price
Ratio b
(Canada /
World)
Change in
Consumption
Per Person c
(%/Year)
Change
in Value
of
Imports a
(%/ year)
Position
in Grid
Analysis d
PRODUCTS IMPORTED FROM CANADA
051000 Ambergris,
Castoreum Etc;
Glands Etc for
Pharmacy.
5.7 1.181 -1.30 146.20
2b 0.40
071310 Peas, Dried
Shelled,
Including Seed.
6.7 0.971 8.50 20.10 2a 1.00
071320 Chickpeas
(Garbanzos),
Dried Shelled,
Include Seed.
0.4 1.593 -2.00 2.10 2a 0.60
071340 Lentils, Dried
Shelled,
Including Seed.
15.2 1.012 -2.00 64.70 2a 0.60
120750 Mustard Seeds,
Whether or Not
Broken.
27.1 1.000 0.50 -26.40 3b 0.40
121190 Plants & Parts
Etc for
Medicaments Etc
Nesoi.
-6.4 1.663 -0.70 11.20 4 0.20
130219 Vegetable Saps
and Extracts,
Nesoi.
0.0 1.933 -0.70 26.30 2a 0.40
170199 Cane / Beet
Sugar
Chemically Pure
Sucrose Refined
Nesoi.
5.2 1.704 -0.40 215.30 2b 0.40
170211 Lactose &
Lactose Syrup
Containing 99%
or More Lactose
by W eight.
3.4 0.777 -1.60 24.10 2a 0.80
210210 Yeasts, Active. 11.2 2.551 n/a 16.00 4 0.50
210610 Protein -8.8 1.390 n/a 27.30 2b 0.25

Product Indicators of Contestability
Index of
Indicators
(No. of +) /
(no.
available)
CIF Price
Change a
(%/year)
CIF Price
Ratio b
(Canada /
World)
Change in
Consumption
Per Person c
(%/Year)
Change
in Value
of
Imports a
(%/ year)
Position
in Grid
Analysis d
44
Concentrates &
Textured Protein
Substances.
210690 Food
Preparations
Nesoi.
1.6 3.586 n/a 36.60 2b 0.50
230990 Animal Feed
Preparations
Except Dog or
Cat Food , Retail
Packaged.
11.4 2.047 n/a 26.00 2a 0.75
330129 Essential Oils,
Nesoi.
19.3 0.682 -1.10 26.10 4 0.60
PRODUCTS NOT IMPORTED FROM CANADA
030269 Fish, Nesoi, with
Bones, Fresh or
Chilled.
16.1 1.10 36.40
1.00
040210 Milk & Cream,
Concentrated,
Sweetened,
Powder,
Granules / Other
Solids, Not over
1.5% Fat.
4.8 1.10 150.20 1.00
040229 Milk & Cream,
Concentrated,
Sweetened,
Powder,
Granules / Other
Solids, over
1.5% Fat.
0.1 1.10 112.40 1.00
040590 Fats and Oils
Derived from
Milk, Nesoi.
10.0 5.50 78.80 1.00
050100 Human Hair,
Unworked and
Waste of Human
Hair.
2.8 n/a 71.40 0.67
071333 Kidney Beans &
White Pea
Beans, Dried
Shelled,
Including Seed.
7.4 1.80 27.30 1.00

Product Indicators of Contestability
Index of
Indicators
(No. of +) /
(no.
available)
CIF Price
Change a
(%/year)
CIF Price
Ratio b
(Canada /
World)
Change in
Consumption
Per Person c
(%/Year)
Change
in Value
of
Imports a
(%/ year)
Position
in Grid
Analysis d
45
071339 Beans Nesoi,
Dried Shelled,
Including Seed.
12.5 1.80 4.30 1.00
071390 Leguminous
Vegetables
Nesoi, Dried
Shell, Including
Seed.
15.1 1.80 19.30 1.00
080212 Almonds, Fresh
or Dried,
Shelled.
-4.6 1.40 13.20 0.67
080290 Nuts Nesoi,
Fresh or Dried,
Shelled or Not.
14.1 1.40 14.20 1.00
080620 Grapes, Dried
(Including
Raisins).
-1.7 5.00 3.80 0.67
080820 Pears and
Quinces, Fresh.
7.1 0.10 44.50 1.00
090240 Black Tea
Fermented &
Other Partly
Fermented Tea
Nesoi.
6.6 0.80 16.80 1.00
091010 Ginger. 1.2 1.30 9.10 1.00
100110 Durum W heat. 5.1 0.70 -35.80 0.67
100190 Wheat (Other
than Durum
Wheat), and
Meslin.
4.1 0.70 -50.30 0.67
120791 Poppy Seeds,
Whether or Not
Broken.
28.3 1.30 40.00 1.00
120799 Oil Seeds &
Oleaginous
Fruits Whether
or Not Broken,
Nesoi.
7.7 -1.10 21.50 0.67
120991 Vegetable Seeds
for Sowing.
-6.4 -0.70 14.70 0.33
130190 Natural Gums,
Gum Resins,
Resins and
16.6 n/a 22.20 1.00

Product Indicators of Contestability
Index of
Indicators
(No. of +) /
(no.
available)
CIF Price
Change a
(%/year)
CIF Price
Ratio b
(Canada /
World)
Change in
Consumption
Per Person c
(%/Year)
Change
in Value
of
Imports a
(%/ year)
Position
in Grid
Analysis d
46
Balsams Nesoi.
150710 Soybean Oil &
Fractions, Crude,
Whether or Not
Degummed.
7.1 6.20 -0.50 0.67
151211 Sunflower-seed
or Safflower O il,
Crude, Fractions,
Etc.
8.5 -2.00 100.50 0.67
180310 Cocoa Paste, Not
Defatted.
20.3 11.30 126.90 1.00
180500 Cocoa Powder,
Not Sweetened.
17.6 11.30 31.50 1.00
220290 Nonalcoholic
Beverages,
Nesoi.
0.3 n/a 9.90 1.00
220720 Ethyl Alcohol &
Other Spirits
Denatured Any
Strength.
2.6 2.40 7.80 1.00
500200 Raw Silk (Not
Thrown).
4.8 n/a 1.20 1.00
510119 Wool, Not
Carded or
Combed, Greasy,
Nesoi.
4.7 n/a 9.50 1.00
510121 Wool Not Cared
/ Combed
Degreased N
Carbonized,
Shorn.
3.2 n/a 13.30 1.00
510129 Wool, Not
Carded/combed
Degreased Not
Carbonized
Nesoi.
-0.2 n/a -10.40 0.00

Product Indicators of Contestability
Index of
Indicators
(No. of +) /
(no.
available)
CIF Price
Change a
(%/year)
CIF Price
Ratio b
(Canada /
World)
Change in
Consumption
Per Person c
(%/Year)
Change
in Value
of
Imports a
(%/ year)
Position
in Grid
Analysis d
47
Notes:
a Values > 0 .00 are positive indicators of contestability. Calculated from the CIF values of Indian imports
supplied by the World Trade Atlas and sourced from the Indian Ministry of Commerce, 2005 - 2010.
b Values < 1 .000 are positive ind icators of contestability.
c Values > 0.00 are positive indicators of contestability. Calculated from FAO food balance sheets 1997 - 2007
which do not use the HS codes. The approximate relationships are:
Beans: 071339, 071333
Beverages, Alcoholic: 220720
Butter, Ghee: 040590
Cocoa Beans: 180310, 180500
Fish, Seafood: 030269
Fruits, Other: 080820
Grapes: 080620
Milk - Excluding Butter: 040210, 040229
Offals: 051000
Oilcrops, Other: 330129, 120799
Peas: 071310
Pulses, Other: 071320, 071340, 071390
Rape and Mustard Oil: 120750
Soyabean Oil: 150710
Spices, Other: 091010, 120791
Sugar, Refined Equiv: 170199
Sunflowerseed Oil: 151211
Sweeteners, Other: 170211
Tea: 090240
Treenuts: 080212, 080290
Vegetables, Other: 121190, 130219, 120991
Wheat: 100110, 100190
d The meanings of the positions in the “Grid Analysis” are as follows:
1: Imports from Canada increasing; Canada gaining market share in a contracting market.
2a: Imports from Canada increasing; Canada gaining market share in an expanding market - a positive
indicator.
2b: Imports from Canada increasing; Canada losing market share in an expanding market.
3a: Imports from Canada decreasing; Canada gaining market share in a contracting market.
3b: Imports from Canada decreasing; Canada losing market share in a contracting market.
4: Imports from Canada decreasing; Canada losing market share in an expanding market.

48
C. Product Groups with an Index of Indicators of 1.00According to this analysis, Canadian exporters have the highest probability of finding
opportunities in the following Indian food markets. These discussions refer to the period 2005 to2010 (1997 to 2007 for consumption data) unless otherwise specified.
Unless otherwise indicated the recommendation for these products are:Increase Canada’s capacity to produce and export these products, taking advantageof economies of scale and modern technology. Conduct market research into thepreferences of Indian importers distributors and consumers. Improve the image ofCanadian products in India by branding.
030269 Fish, Nesoi, with Bones, Fresh or Chilled• The price was increasing;• Consumption per person was increasing;• The value of imports was increasing.
040210 Milk & Cream, Concentrated, Sweetened, Powder, Granules / Other Solids, Notover 1.5% Fat
• The price was increasing;• Consumption per person was increasing;• The value of imports was increasing.
Recommendation: Market research to examine the possibilities of exporting dairyproducts produced from full priced milk as food prices in general increase over thenext few decades.
040229 Milk & Cream, Concentrated, Sweetened, Powder, Granules / Other Solids, over1.5% Fat
• The price was increasing;• Consumption per person was increasing;• The value of imports was increasing.
Recommendation: Market research to examine the possibilities of exporting dairyproducts produced from full priced milk as food prices in general increase over thenext few decades.
040590 Fats and Oils Derived from Milk, Nesoi• The price was increasing;• Consumption per person was increasing;• The value of imports was increasing.
Recommendation: Market research to examine the possibilities of exporting dairyproducts produced from full priced milk as food prices in general increase over thenext few decades.

49
050100 Human Hair, Unworked and Waste of Human Hair• The price was increasing;• The value of imports was increasing.
071310 Peas, Dried Shelled, Including Seed• The price was increasing;• The Canada / world price ratio was favourable;• Consumption per person was increasing;• The value of imports was increasing;• Canada was gaining market share in an expanding market.
071333 Kidney Beans & White Pea Beans, Dried Shelled, Including Seed• The price was increasing;• Consumption per person was increasing;• The value of imports was increasing.
071339 Beans Nesoi, Dried Shelled, Including Seed• The price was increasing;• Consumption per person was increasing;• The value of imports was increasing.
071390 Leguminous Vegetables Nesoi, Dried Shelled, Including Seed• The price was increasing;• Consumption per person was increasing;• The value of imports was increasing.
080290 Nuts Nesoi, Fresh or Dried, Shelled or Not• The price was increasing;• Consumption per person was increasing;• The value of imports was increasing.
080820 Pears and Quinces, Fresh• The price was increasing;• Consumption per person was increasing;• The value of imports was increasing.
090240 Black Tea Fermented & Other Partly Fermented Tea Nesoi• The price was increasing;• Consumption per person was increasing;• The value of imports was increasing.

50
091010 Ginger• The price was increasing;• Consumption per person was increasing;• The value of imports was increasing.
120791 Poppy Seeds, Whether or Not Broken• The price was increasing;• Consumption per person was increasing;• The value of imports was increasing.
130190 Natural Gums, Gum Resins, Resins and Balsams Nesoi• The price was increasing;• The value of imports was increasing.
180310 Cocoa Paste, Not Defatted• The price was increasing;• Consumption per person was increasing;• The value of imports was increasing.
180500 Cocoa Powder, Not Sweetened• The price was increasing;• Consumption per person was increasing;• The value of imports was increasing.
220290 Nonalcoholic Beverages, Nesoi• The price was increasing;• The value of imports was increasing.
220720 Ethyl Alcohol & Other Spirits Denatured, Any Strength• The price was increasing;• Consumption per person was increasing;• The value of imports was increasing.
500200 Raw Silk (Not Thrown)• The price was increasing;• The value of imports was increasing.
510119 Wool, Not Carded or Combed, Greasy, Nesoi• The price was increasing;• The value of imports was increasing.
510121 Wool Not Carded / Combed Degreased Not Carbonized, Shorn• The price was increasing;• The value of imports was increasing.

51
D. Product Groups with an Index of Indicators from 0.75 to 0.99Canadian exporters have a high probability of finding opportunities in the following markets
in India although based on the analysis, the probability may be lower than for the product groupsabove.
Unless otherwise indicated, the recommendations for these product groups are:Increase Canada’s capacity to produce and export these products taking advantageof economies of scale and modern technology. Conduct market research into thepreferences of Indian importers, distributors and consumers. Improve the image ofCanadian products in India by branding.
170211 Lactose & Lactose Syrup Containing 99% or More Lactose by Weight• The price was increasing;• The Canada / world price ratio was favourable;• The value of imports was increasing;• Canada was increasing market share in an expanding market;• Consumption per person was decreasing.
230990 Animal Feed Preparations Except Dog or Cat Food, Retail Packaged
• The price was increasing;• The value of imports was increasing;• Canada was increasing market share in an expanding market;• The Canada / world price ratio was unfavourable.
E. Product Groups with an Index of Indicators from 0.50 to 0.74Canadian exporters have a high probability of finding opportunities in the following markets
in India although based on the analysis, the probability may be lower than for the product groupsabove.
Unless otherwise indicated, the recommendations for these product groups are:Conduct market research into the preferences of Indian importers, distributors andconsumers. Increase Canada’s capacity to produce and export these products asappropriate. Improve the image of Canadian products in India by branding.
071320 Chickpeas (Garbanzos), Dried Shelled, Include Seed• The price was increasing slowly;• The value of imports was increasing;• Canada was increasing market share in an expanding market;• The Canada / world price ratio was unfavourable;• Consumption per person was decreasing.

52
071340 Lentils, Dried Shelled, Including Seed• The price was increasing;• The value of imports was increasing;• Canada was increasing market share in an expanding market;• The Canada / world price ratio was unfavourable;• Consumption per person was decreasing.
080212 Almonds, Fresh or Dried, Shelled• Consumption per person was increasing;• The value of imports was increasing;• The price was decreasing.
080620 Grapes, Dried (Including Raisins)• Consumption per person was increasing;• The value of imports was increasing;• The price was decreasing.
100110 Durum Wheat• The price was increasing;• Consumption per person was increasing slowly;• The total value of imports was decreasing.
100190 Wheat (Other than Durum Wheat), and Meslin• The price was increasing;• Consumption per person was increasing slowly;• The total value of imports was decreasing.
120799 Oil Seeds & Oleaginous Fruits Whether / Not Broken, Nesoi• The price was increasing;• The total value of imports was increasing;• Consumption per person was decreasing.
150710 Soybean Oil & Fractions, Crude, Whether / Not Degummed• The price was increasing;• Consumption per person was increasing slowly;• The total value of imports was decreasing.
151211 Sunflower-seed or Safflower Oil, Crude, Fractions Thereof, Etc• The price was increasing;• The total value of imports was increasing rapidly;• Consumption per person was decreasing.

53
210210 Yeasts, Active• The price was increasing;• The total value of imports was increasing;• The Canada / world price ratio was unfavourable;• Imports from Canada were decreasing and Canada was losing market share in an
expanding market.
210690 Food Preparations Nesoi• The price was increasing;• The total value of imports was increasing;• The Canada / world price ratio was unfavourable;• Imports from Canada were increasing slower than from the world and Canada was losing
market share.
330129 Essential Oils, Nesoi• The price was increasing;• The Canada / world price ratio was favourable;• The total value of imports was increasing;• Consumption per person was decreasing;• Imports from Canada were decreasing and Canada was losing market share.
F. Product Groups with an Index of Indicators from 0.25 to 0.49Canadian exporters have a medium probability of finding opportunities in the following Indian
markets. Based on the analysis in this paper, the probability will be lower than for the productgroups above.
Unless otherwise indicated the recommendations for these product groups are:Conduct market research into the preferences of Indian importers, distributors andconsumers. Increase Canada’s capacity to produce and export these products asappropriate. Improve the image of Canadian products in India by branding.
051000 Ambergris, Castoreum Etc; Glands Etc for Pharmacy• The price was increasing;• The total value of imports was increasing;• The Canada / world price ratio was unfavourable;• Consumption per person was decreasing;• Imports from Canada were decreasing and Canada was losing market share.
120750 Mustard Seeds, Whether or Not Broken• The price was increasing;• Consumption per person was increasing slowly;• The Canada / world price ratio was 1.0;• The total value of imports was decreasing;
54
• Imports from Canada were decreasing and Canada was losing market share in a decliningmarket.
120991 Vegetable Seeds for Sowing• The total value of imports was increasing;• The price was decreasing;• Consumption per person was decreasing.
130219 Vegetable Saps and Extracts, Nesoi• The total value of imports was increasing;• Canada was increasing market share in an expanding market;• The price showed no change over the period 2005 to 2010;• The Canada / world price ratio was unfavourable;• Consumption per person was decreasing slowly.
170199 Cane / Beet Sugar Chemically Pure Sucrose Refined Nesoi• The price was increasing;• The total value of imports was increasing;• The Canada / world price ratio was unfavourable;• Consumption per person was decreasing slowly;• Imports from Canada were increasing slowly but Canada was losing market share in an
expanding market.
210610 Protein Concentrates & Textured Protein Substances• The total value of imports was increasing;• The price was decreasing;• The Canada / world price ratio was unfavourable;• Imports from Canada were increasing slowly and Canada was losing market share in an
expanding market.
G. Product Groups with an Index of Indicators from 0.00 to 0.24Canadian exporters have a medium to low probability of finding opportunities in the following
Indian markets. Based on the analysis in this paper, the probability will be lower than for theabove product groups.
121190 Plants & Parts Etc for Medicaments Etc Nesoi• The total value of imports was increasing;• The price was decreasing;• The Canada / world price ratio was unfavourable;• Consumption was decreasing;• Imports from Canada were decreasing and Canada was losing market share in an
expanding market.

55
510129 Wool, Not Carded /Combed Degreased Not Carbonized Nesoi• The price was decreasing;• The total value of imports was decreasing.
IX. CONCLUSIONSBetween 2005 and 2010, the value of Indian imports of agricultural, agri-food & seafood
products from all sources was increasing at a rate of 18.6 percent per year while the value of thesame imports from Canada was increasing at a rate of 27.3 percent per year. Canada wasincreasing market share in a rapidly expanding market. With the economic development of thecountry and the large population, India is increasingly important as a destination for Canadianagri-food and seafood products.
Based on the analysis in this paper, Canadian food exporters might find new or continuingopportunities in the following Indian markets:
• Fish, Nesoi, With Bones, Fresh Or Chilled;• Milk & Cream, Concentrated, Sweetened, Powder, Granules / Other Solids, Not over 1.5%
Fat;• Milk & Cream, Concentrated, Sweetened, Powder, Granules / Other Solids, Over 1.5%
Fat;• Fats And Oils Derived From Milk, Nesoi;• Peas, Dried Shelled, Including Seed;• Kidney Beans & White Pea Beans, Dried Shelled, Including Seed;• Beans Nesoi, Dried Shelled, Including Seed;• Leguminous Vegetables Nesoi, Dried Shell, Including Seed;• Nuts Nesoi, Fresh Or Dried, Shelled Or Not;• Pears And Quinces, Fresh;• Ginger;• Poppy Seeds, Whether Or Not Broken;• Natural Gums, Gum Resins, Resins And Balsams Nesoi;• Cocoa Paste, Not Defatted;• Cocoa Powder, Not Sweetened;• Nonalcoholic Beverages, Nesoi;• Ethyl Alcohol & Other Spirits Denatured Any Strength;• Wool, Not Carded Or Combed, Greasy, Nesoi;• Wool Not Carded / Combed Degreased Not Carbonized, Shorn.
Canadian companies considering entering the Indian food markets should act on the followingpoints before making major investments and other commitments:
Marketing:• marketing and branding strategies should be suitable for the Indian market. Branding style
and language should be familiar to the markets of India;

56
• market acceptance of a product should be determined early; by further identifyingappropriate local product flavours (taste tests), packaging sizes and consumption patterns.
Business:• potential local wholesale and/or retail partners in India should be identified;
• options for transportation/distribution and warehousing should be understood;
• establishing a corporate presence in India should be considered. This could include one ormore of: a representative office, formal joint venture or other forms as permitted underIndian law;
• understand local tax, invoicing and payment schedules - includes local payments and theidentification of legal means of repatriating money;
• understand customs clearance requirements, including export/import fees, productcertification or designation requirements.
•For more information on doing business in India readers may visit the Trade CommissionerService web site at www.infoexport.gc.ca.
X. CONTACTS IN INDIACanadian companies interested in exporting to India may contact the following for current
information:
NEW DELHICanadian High Commission,7/8 Shantipath, Chanakyapuri,New Delhi, 110 021,India.Tel: +91-11-4178-2000. Fax: +91-11-4178-2020.Email: [email protected]
HYDERABADCanadian Trade Office,ITC Hotel, The Kakatiya - 6-3-1187,
Begumpet,Hyderabad, 500 034, India.Tel: +91-40-2340-4518/19.Fax: +91-40 2340-4523.E-Mail:[email protected]
57
MUMBAIConsulate General of Canada,Fort House, 6th Floor,221, Dr. D.N. Road,Fort, Mumbai 400 001,India.Tel: +91-22-6749-4444.Fax: +91-22-6749-4454.E-mail: [email protected]
CHANDIGARHConsulate General of Canada, SCO 54-56, Sector 17-A, Chandigarh, 160 017, India.Tel: +91-172-505-0300.Fax: +91-172-505-0320.Email: [email protected]
CHENNAIConsulate of Canada,18 (Old 24), 3rd floor YAFA Tower,Khader Nawaz Khan Road, Nungambakkam,Chennai 600 006, India.Tel: +91-44-2833-0888.Fax: +91-44-4215-9393.E-mail: [email protected]
KOLKATACanadian Trade Office,Hyatt Regency Kolkata - JA-1 Sector III,Salt Lake City, Kolkata, 700 098, India.Tel: +91-033-2335-4010. Fax: +91-033-2335-4011. Email: [email protected]
BANGALORECanadian Trade Office, 103 Prestige Meridian 1, 29 M.G. Road, Bangalore, Karnataka, 560001, India.Tel: +91-80-2558-1116, 2559-9418.Fax: +91-80-2559-9424.Email: [email protected]
AHMEDABADCanadian Trade Office,Courtyard Marriott Ahmedabad,Ramdevnagar Cross Roads, Satellite,Nr. S.G. Highway, Ahmedabad - 380015,Tel: +91-79-6618-5012.Fax: +91-79-6618-5013.Email: [email protected]

58
XI. CONTACTS IN CANADAAgriculture and Agri-food Canada has seven offices across Canada to assist Canadian food
companies to export. Food companies interested in exporting should contact the nearest office forinformation and advice. ALBERTA AND TERRITORIESAlberta & Territories Regional Office,Agriculture and Agri-Food Canada,9700 Jasper Avenue, Suite 720,Edmonton, AB,CANADA,T5J 4G5.Tel: 780-495-4141.Fax: 780-495-3324.
ATLANTICAtlantic Regional Office,Agriculture and Agri-Food Canada,PO Box 248, 1791 Barrington Street, Floor4th,Halifax, NS,CANADA,B3J 2N7.Tel: 902-426-6151.Fax: 902-426-3439.
BRITISH COLUMBIABritish Columbia Regional Office,Agriculture and Agri-Food Canada,Suite 420, 4321 Still Creek Drive,Burnaby, BC,CANADA,V5C 6S7.Tel: 604-666-6344.Fax: 604-666-7235.Email: [email protected]
MANITOBAManitoba Regional Office,Agriculture and Agri-Food Canada,303 Main Street, Room 402,Winnipeg, MB,CANADA,R3C 3G7.Tel: 204-983-3032.Fax: 204-983-4583.
ONTARIOOntario Regional Office,Agriculture and Agri-Food Canada,174 Stone Road West,Guelph, ON,CANADA,N1G 4S9.Tel: 519-837-9400.Fax: 519-837-9782.
QUEBECQuebec Regional Office,Agriculture and Agri-Food Canada,2001, University (Room 671-M),Montréal, QC,CANADA,H3A 3N2.Tel: 514-283-8888.Fax: 514-496-3966.
SASKATCHEWANSaskatchewan Regional Office,401 - 1800 Hamilton Street,Regina, SK,CANADA,S4P 4K7.Tel: 306-780-5545.Fax: 306-780-7360.Email: [email protected]

59
Figure 7. Political Map of India.
Source: University of Texas Library On Line.
http://www.lib.utexas.edu/maps/middle_east_and_asia/india_pol01.jpg (Accessed Feb 2012).
APPENDIX 1
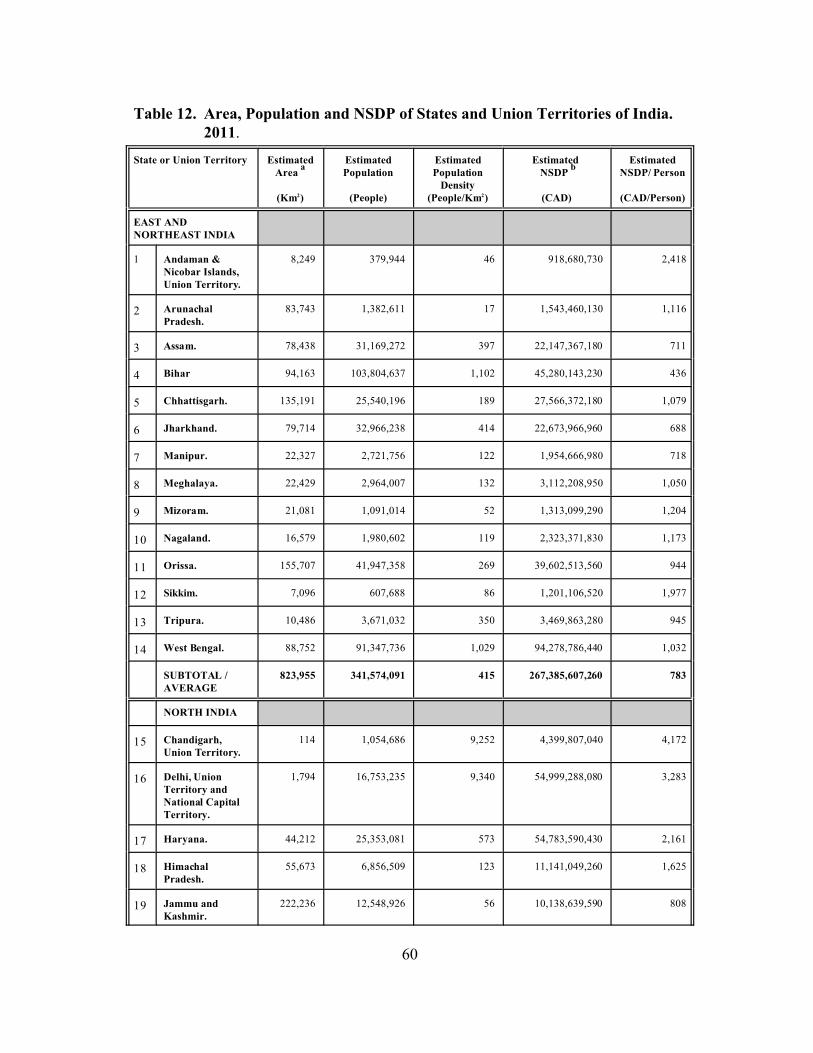
60
Table 12. Area, Population and NSDP of States and Union Territories of India.2011.
State or Union Territory EstimatedArea
a
(Km2)
EstimatedPopulation
(People)
EstimatedPopulation
Density(People/Km2)
Estimated NSDP
b
(CAD)
EstimatedNSDP/ Person
(CAD/Person)
EAST ANDNORTHEAST INDIA
1 Andaman &Nicobar Islands,Union Territory.
8,249 379,944 46 918,680,730 2,418
2 ArunachalPradesh.
83,743 1,382,611 17 1,543,460,130 1,116
3 Assam. 78,438 31,169,272 397 22,147,367,180 711
4 Bihar 94,163 103,804,637 1,102 45,280,143,230 436
5 Chhattisgarh. 135,191 25,540,196 189 27,566,372,180 1,079
6 Jharkhand. 79,714 32,966,238 414 22,673,966,960 688
7 Manipur. 22,327 2,721,756 122 1,954,666,980 718
8 Meghalaya. 22,429 2,964,007 132 3,112,208,950 1,050
9 Mizoram. 21,081 1,091,014 52 1,313,099,290 1,204
10 Nagaland. 16,579 1,980,602 119 2,323,371,830 1,173
11 Orissa. 155,707 41,947,358 269 39,602,513,560 944
12 Sikkim. 7,096 607,688 86 1,201,106,520 1,977
13 Tripura. 10,486 3,671,032 350 3,469,863,280 945
14 West Bengal. 88,752 91,347,736 1,029 94,278,786,440 1,032
SUBTOTAL /AVERAGE
823,955 341,574,091 415 267,385,607,260 783
NORTH INDIA
15 Chandigarh,Union Territory.
114 1,054,686 9,252 4,399,807,040 4,172
16 Delhi, UnionTerritory andNational CapitalTerritory.
1,794 16,753,235 9,340 54,999,288,080 3,283
17 Haryana. 44,212 25,353,081 573 54,783,590,430 2,161
18 HimachalPradesh.
55,673 6,856,509 123 11,141,049,260 1,625
19 Jammu andKashmir.
222,236 12,548,926 56 10,138,639,590 808

State or Union Territory EstimatedArea
a
(Km2)
EstimatedPopulation
(People)
EstimatedPopulation
Density(People/Km2)
Estimated NSDP
b
(CAD)
EstimatedNSDP/ Person
(CAD/Person)
61
20 Punjab. 50,362 27,704,236 550 47,035,263,320 1,698
21 Rajasthan. 342,239 68,621,012 201 64,466,608,580 939
22 Uttar Pradesh. 240,928 199,581,477 828 125,055,122,170 627
23 Uttarakhand. 53,483 10,116,752 189 16,486,525,800 1,630
SUBTOTAL 1,011,041 368,589,914 365 388,505,894,270 1,054
SOUTH INDIA
24 Andhra Pradesh. 275,045 84,665,533 308 120,628,326,360 1,425
25 Karnataka. 191,791 61,130,704 319 84,768,751,430 1,387
26 Kerala. 38,863 33,387,677 859 56,991,569,330 1,707
27 Lakshedweep,Union Territory.
32 64,429 2,013 93,929,420 1,458
28 Punducherry,Union Territory.
479 1,244,464 2,598 2,747,541,790 2,208
29 Tamil Nadu. 130,058 72,138,958 555 116,299,710,170 1,612
SUBTOTAL 636,268 252,631,765 397 381,529,828,500 1,510
WEST INDIA
30 Dadra and NagarHaveli, UnionTerritory.
491 342,853 698 421,619,840 1,230
31 Daman and Diu,Union Territory.
112 242,911 2,169 259,262,200 1,067
32 Goa. 3,702 1,457,723 394 6,348,311,230 4,355
33 Gujarat. 196,024 60,383,628 308 102,380,092,660 1,695
34 Madhya Pradesh. 308,245 72,597,565 236 51,053,189,890 703
35 Maharashtra. 307,713 112,372,972 365 218,804,758,710 1,947
SUBTOTAL 816,287 247,397,652 303 379,267,234,530 1,533
TOTAL 3,287,551 1,210,193,422 368 1,416,688,564,560 1,171
Sources: a http://en.wikipedia.org/wiki/List_of_states_and_union_territories_of_India_by_population (Accessed Nov 2011).b http://unidow.com/india%20home%20eng/statewise_gdp.html (Accessed Jan 2012).Pacific Exchange Rate Service.
Notes: INR 1.00 = CAD 0.021251.NSDP = Net State Domestic Product.

62
Table 13. Population and GDP. India. 1992 - 2012.
Year Population a Populationb GDPb
(CAD Current)
GDP / Person
(CAD)
1992 870,113,000
1993 886,744,000
1994 903,579,000
1995 920,585,000 932,180,000 488,984,735,693 525
1996 937,725,000 948,758,853 529,505,304,314 558
1997 954,926,000 965,428,183 568,938,758,252 589
1998 972,113,000 982,182,462 617,496,969,982 629
1999 989,250,000 999,016,010 669,248,839,251 670
2000 1,006,300,000 1,015,923,000 683,532,147,463 673
2001 1,023,295,000 1,032,473,426 740,086,339,756 717
2002 1,040,285,000 1,048,640,721 796,416,716,524 759
2003 1,057,251,000 1,064,398,612 839,771,973,104 789
2004 1,074,159,000 1,079,721,194 938,874,431,316 870
2005 1,090,973,000 1,094,583,000 1,010,293,281,861 923
2006 1,107,624,000 1,109,811,147 1,079,089,964,535 972
2007 1,124,135,000 1,124,786,997 1,334,200,139,248 1,186
2008 1,140,566,000 1,139,964,932 1,296,909,027,045 1,138
2009 1,156,898,000 1,155,347,678 1,571,713,837,497 1,360
2010 1,173,108,000 1,170,938,000 1,778,924,429,254 1,519
2011 1,189,173,000
2012 1,205,074,000
Sources: a http://www.census.gov/population/international/data/idb/informationGate
way.php.(Accessed Jan 2012).
b http://databank.worldbank.org/ddp/editReport?REQUEST_SOURCE=sear
ch&CNO=2&country=IND&series=&period=. (Accessed Jan 2012).
Pacific Exchange Rate Service.
Note: GDP data originally in INRs.

63
Table 14. GDP by Origin, 2011. India.
Origin Value(MillionCAD)
Percent
Agriculture, Hunting, and Forestry. 322,936.7 17.54
Financial Intermediation, Real Estate, Renting &Business Activities.
312,285.3 16.96
Wholesale and Retail Trade; Repair of MotorVehicles, Motorcycles & Personal & HouseholdGoods.
279,834.3 15.20
Manufacturing. 265,241.9 14.41
Construction. 147,197.6 8.00
Education, Health, Social Work and OtherCommunity, Social, Personal Service Activities.
137,941.7 7.49
Transport, Storage & Communications. 132,653.3 7.21
Public Administration & Defence; Compulsory SocialSecurity.
117,734.6 6.40
Mining and Quarrying. 48,501.3 2.63
Electricity, Gas and Water Supply. 27,334.9 1.48
Hotels and Restaurants. 25,078.6 1.36
Fishing. 20,433.6 1.11
Activities of Households. 3,766.7 0.20
TOTAL 1,840,940.4 100.00
Source: Calculated from Euromonitor International (Feb 2012).
Pacific Exchange Rate Service. (INR 1.00 = CAD 0.021251).
Note: The original GDP values were measured in INRs at current prices.

64
Table 15. Percent of Employment by Sector. India.
Sectors 2006(%)
2007(%)
2008(%)
2009(%)
2010(%)
2011(%)
Employment in Agriculture,Hunting, Forestry and Fishing.
56.5 56.5 56.0 54.8 53.2 52.8
Employment in Trade, MotorVehicles and Personal andHousehold Goods Repair, Hotelsand Restaurants.
9.6 9.5 9.6 10.0 10.8 10.9
Employment in Manufacturing. 13.2 13.1 12.8 12.0 11.0 10.7Employment in Construction. 4.9 4.8 5.5 7.2 9.6 10.2Employment in Community,
Education, Health, Social,Personal Services, Public Adminand Defence.
9.5 9.7 9.4 8.6 7.4 7.1
Employment in Transport, Storageand Communications.
3.3 3.3 3.4 3.8 4.3 4.4
Employment in Finance, Insurance,Real Estate and BusinessServices.
1.7 1.9 2.0 2.1 2.1 2.1
Employment in Undefined Sectors. 0.6 0.7 0.7 0.7 0.7 0.7Employment in Mining and
Quarrying.0.4 0.4 0.5 0.5 0.6 0.6
Employment in Electricity, Gas andWater Supply.
0.2 0.2 0.2 0.2 0.3 0.3
Employment Rate. 55.6 53.4 52.7 52.9 52.7 52.9Source: Euromonitor International (Feb 2012).
Note: Employment rate = percent of population of working age 15 to 64.
Percentages by sector are percentage of employed population.

65
Table 16. Distribution of Households by Disposable Income. India.
Annual
Disposable
Income
(Int’l $ at PPP)2005(‘000Hlds.)
2006(‘000Hlds.)
2007(‘000Hlds.)
2008(‘000Hlds.)
2009(‘000Hlds.)
2010(‘000Hlds.)
2011(‘000Hlds.)
500 - 999 1,408.7 1,182.2 1,062.9 889 .8 829 .8 735 .8 624 .2
1,000 - 2,499 11,371.0 9,558.2 8,522.9 7,093.7 6,494.1 5,802.3 4,958.1
2,500 - 9,999 118 ,000.4 110 ,302.0 104 ,239.4 94,312.3 88,535.3 83,281.6 75,640.2
10,000 - 74,999 73,891.9 87,110.8 97,786.9 112 ,603.4 122 ,378.8 131 ,718.2 143 ,420.1
>=75,000 2,185.8 2,527.0 2,838.1 3,313.5 3,675.6 4,062.6 4,616.7
Total. 206 ,857.8 210 ,680.2 214 ,450.2 218 ,212.7 221 ,913.6 225 ,600.5 229 ,259.3
Source: Adapted from Euromonitor International. (Accessed Feb 2012).
Table 17. Value and Volume of Retail Sales of Packaged Food. India. 2005 and 2010.
Sector Item 2005 2006 2007 2008 2009 2010
Confectionery. Sales (BillionINR).
33.2 37.3 43.3 51.2 58.9 68.4
Volume (‘000Tonnes).
150.1 164.6 185.4 208.2 229.8 254.4
Bakery. Sales (BillionINR).
113.1 121.1 132.4 150.3 165.4 181.2
Volume (‘000Tonnes).
2,811.3 2,942.4 3,132.2 3,344.3 3,513.7 3,673.4
Ice Cream. Sales (BillionINR).
9.3 11.3 13.9 17.0 20.4 24.4
Volume (MillionLitres).
68.0 81.3 98.8 118.2 136.6 157.7
Dairy Products. Sales (BillionINR).
154.9 181.7 224.4 265.3 312.3 369.5
Volume (‘000Tonnes).
n/a n/a n/a n/a n/a n/a

Sector Item 2005 2006 2007 2008 2009 2010
66
Sweet andSavoury Snacks.
Sales (BillionINR).
18.0 20.2 23.8 27.8 31.6 36.3
Volume (‘000Tonnes).
102.2 112.0 128.3 146.2 163.1 183.6
Meal ReplacementProducts.
Sales (BillionINR).
5.3 5.9 6.5 7.4 8.6 9.9
Volume (‘000Tonnes).
17.2 18.4 20.0 22.2 24.6 27.1
Ready Meals. Sales (BillionINR).
0.4 0.4 0.5 0.6 0.7 0.8
Volume (‘000Tonnes).
2.1 2.4 2.8 3.2 3.6 4.1
Meal Solutions. Sales (BillionINR).
26.7 29.2 32.4 36.1 40.6 46.3
Volume (‘000Tonnes).
174.8 190.1 208.3 227.9 249.7 277.2
Soup. Sales (BillionINR).
0.6 0.6 0.8 1.0 1.2 1.5
Volume (‘000Tonnes).
1.7 1.8 2.1 2.4 2.7 3.3
Pasta. Sales (BillionINR).
0.1 0.1 0.1 0.1 0.2 0.2
Volume (‘000Tonnes).
0.9 1.0 1.1 1.3 1.5 1.7
Noodles. Sales (BillionINR).
9.0 10.7 13.0 15.6 18.5 21.9
Volume (‘000Tonnes).
111.9 128.1 150.5 172.8 197.0 224.3
Canned/Preserved.
Sales (BillionINR).
2.0 2.2 2.4 2.6 2.8 3.2
Volume (‘000Tonnes).
21.6 23.0 24.6 26.4 28.5 31.2
Frozen Processed. Sales (BillionINR).
1.4 1.5 1.7 1.9 2.1 2.5
Volume (‘000Tonnes).
9.5 10.2 11.3 12.4 13.4 14.7
Dried Processed. Sales (BillionINR).
28.3 32.3 37.1 43.1 49.2 56.5
Volume (‘000Tonnes).
491.6 547.7 609.7 667.9 731.9 807.7

Sector Item 2005 2006 2007 2008 2009 2010
67
Oils and Fats. Sales (BillionINR).
101.6 109.0 118.5 134.9 151.8 172.6
Volume (‘000Tonnes).
1,392.3 1,474.2 1,586.7 1,701.2 1,856.6 2,059.7
Sauces, Dressingsand Condiments.
Sales (BillionINR).
20.9 22.8 25.4 28.3 31.8 36.3
Volume (‘000Tonnes).
132.7 145.1 159.6 175.5 193.3 215.6
Baby Food. Sales (BillionINR).
10.7 11.6 12.7 14.1 15.6 17.4
Volume. n/a n/a n/a n/a n/a n/a
Snack Bars. Sales (BillionINR).
n/a 0.1 0.1 0.2 0.5 0.7
Volume (‘000Tonnes
n/a 0.2 0.3 0.4 0.9 1.3
Spreads. Sales (BillionINR).
2.3 2.5 2.7 3.1 3.5 3.9
Volume (‘000Tonnes).
15.3 15.7 16.5 17.6 18.8 19.9
Impulse andIndulgenceProducts.
Sales (BillionINR).
130.7 145.4 166..9 196.2 222.6 252.9
Volume. n/a n/a n/a n/a n/a n/a
Nutrition / Staples. Sales (BillionINR).
343.6 385.0 445.5 514.9 591.3 683.5
Volume. n/a n/a n/a n/a n/a n/a
Source: Euromonitor International, “Packaged Food in India (Nov 2010).”

68
Table 18. Compound Annual Rates of Change ofProduction and Consumption (Supply) ofSelected Products. India. 1997 - 2007.
Product Change ofProduction
(% / Year)
Change ofConsumption
(Supply) Per Person(% / Year)
Alcoholic Beverages. 3.4 3.8
Animal Fats. 0.4 0.9
Apples. 4.5 4.8
Beans. 2.2 3.6
Cereals (ex beer). 0.9 1.5
Cocoa Beans. 7.6 15.4
Crustaceans. 4.1 1.2
Fish, Seafood. 2.8 2.6
Fruits (ex Wine). 3.3 3.3
Honey. 0.2 -2.3
Milk (ex Butter). 3.7 3.6
Oil Crops. -0.9 3.3
Other Oilcrops Oil. 3.4 -0.5
Other Pulses. -0.6 -0.4
Other Fruit. 1.9 1.8
Peas. 0.9 10.0
Potatoes. 3.6 3.5
Rape and Mustardseed. 3.4 3.4
Soybean Oil. 4.2 9.1
Spices. 2.8 2.3
Sugar & Sweeteners. 0.8 -0.4
Sunflower Seed Oil. 7.7 -0.4
Tomatoes. 3.8 3.7
Treenuts. 4.8 3.1

Product Change ofProduction
(% / Year)
Change ofConsumption
(Supply) Per Person(% / Year)
69
Vegetable Oils. 2.4 3.2
Vegetables. 2.4 2.2
Wheat. 0.3 2.1
Wine. n/a 23.1
Source: Calculated from FAO food balance sheets. (Accessed Dec
2011)
Note: n/a = Not available.
Table 19. Indicative CIF Prices of Imports to India from Canada, the World andMajor Competitors. 2010.
Product (Units) Canada
(CAD /Unit)
Ratio
(Canada/ World)
Major Competitors
Country Price(CAD /Unit)
010110 Purebred Breeding Animal.(Each)
7,737.47 0.161 World 48,064.42
Ireland 47,121.51
USA 39,555.90
France 549,595.39
Israel 16,494.58
UK 7,571.64
010690 Animals, Live, Nesoi.(Each)
59.09 0.684 World 86.44
USA 101.61
China 911.49
Netherlands 32.12
UK 39.36
Germany 40.47
030419 Fish Fillets & Other Meat,Fresh / Chilled, ExcludingSteaks Nesoi. (kg)
13.93 0.898 World 15.51
Singapore 17.71
Netherlands 8.70
UK 14.29

Product (Units) Canada
(CAD /Unit)
Ratio
(Canada/ World)
Major Competitors
Country Price(CAD /Unit)
70
030499 Fish Meat, Frozen, ExceptSteaks and Fillets Nesoi.(kg)
5.15 2.077 World 2.48
Vietnam 2.24
Singapore 10.62
Peru 1.18
Norway 10.65
China 1.93
030613 Shrimps and Prawns,Including in Shell, Frozen.(kg)
4.90 0.907 World 5.40
Thailand 6.53
Unidentifiedcountry
7.78
Pakistan 3.27
UK 5.48
USA 6.25
030739 Mussels, Frozen, Dried,Salted or in Brine. (kg)
3.24 0.544 World 5.96
UK 5.79
Singapore 6.13
Germany 7.62
Netherlands 5.08
New Zealand 2.44
030741 Cuttle Fish & Squid, Live,Fresh or Chilled. (kg)
5.29 1.474 World 3.59
Yemen 3.72
Oman 4.11
Bahrain 3.17
UAE 3.58
Indonesia 2.49
040310 Yogurt, Whether or NotSweetened, Flavored orContaining Fruit / Cocoa.(kg)
20.48 8.569 World 2.39
Spain 2.10
France 2.83
Germany 1.87
USA 4.84
Netherlands 1.38

Product (Units) Canada
(CAD /Unit)
Ratio
(Canada/ World)
Major Competitors
Country Price(CAD /Unit)
71
040410 Whey & Modified WheyWhether or NotConcentrated ContainingAdded Sweeteners. (kg)
0.79 0.380 World 2.08
UK 1.32
France 2.06
USA 2.84
New Zealand 6.98
Denmark 6.25
051000 Ambergris, Castoreum Etc;Glands Etc for Pharmacy.(kg)
11.03 1.181 World 9.34
USA 8.52
New Zealand 7.62
Italy 91.85
Pakistan 6.97
UAE 28.88
051110 Bovine Semen. (kg) 4.35 0.350 World 12.42
USA 14.78
051199 Dead Horses, Swine Etc(Inedible) & ProductsNesoi. (kg)
2,234.42 69.935 World 31.95
USA 27.10
Thailand 45.12
Hong Kong 104.96
Ireland 157.66
060313 Fresh Cut Orchids andBuds. (kg)
3.76 2.136 World 1.76
Thailand 1.73
USA 3.82
China 4.74
UK 3.20
Singapore 3.60
071220 Onions, Dried (PowderEtc), Not Further Prepared.(kg)
5.53 1.575 World 3.51
USA 3.25
Egypt 4.60
Brazil 2.53
Taiwan 9.77
UK 6.40

Product (Units) Canada
(CAD /Unit)
Ratio
(Canada/ World)
Major Competitors
Country Price(CAD /Unit)
72
071310 Peas, Dried Shelled,Including Seed. (kg)
0.33 0.971 World 0.34
USA 0.38
Australia 0.35
Russia 0.31
Ukraine 0.31
France 0.33
071320 Chickpeas (Garbanzos),Dried Shelled, IncludeSeed. (kg)
0.94 1.593 World 0.59
Australia 0.55
USA 1.00
Tanzania 0.48
Mexico 1.14
Argentina 0.84
071331 Beans (Vigna Mungo (L.)Hepper Etc), DriedShelled. (kg)
0.45 0.369 World 1.22
Myanmar 1.19
Australia 1.28
Tanzania 1.40
Kenya 1.27
Namibia 1.11
071340 Lentils, Dried Shelled,Including Seed. (kg)
0.87 1.012 World 0.86
USA 0.85
Australia 0.83
Russia 0.71
Brazil 0.83
UnidentifiedCountry
0.98
080131 Cashew Nuts, Fresh orDried, in Shell. (kg)
1.13 1.076 World 1.05
Cote d’ Ivoire 0.86
Tanzania 1.46
Benin 0.98
Guinea-Bissau 1.15
Ghana 0.89

Product (Units) Canada
(CAD /Unit)
Ratio
(Canada/ World)
Major Competitors
Country Price(CAD /Unit)
73
080211 Almonds, Fresh or Dried,in Shell. (kg)
5.87 1.442 World 4.07
USA 4.01
Australia 4.78
China 4.24
Afghanistan 4.13
UAE 3.81
080810 Apples, Fresh. (kg) 1.24 1.216 World 1.02
China 0.91
USA 1.16
Chile 1.03
New Zealand 1.29
Australia 1.14
080920 Cherries, Sweet or Tart,Fresh. (kg)
3.98 2.823 World 1.41
Chile 1.53
Iran 1.26
USA 1.19
Australia 3.38
Thailand 0.48
090940 Seeds of Caraway. (kg) 2.61 1.500 World 1.74
Afghanistan 1.80
Finland 1.38
Egypt 1.47
Syria 2.11
Pakistan 2.26
091030 Tumeric (Curcuma). (kg) 2.62 1.124 World 2.33
Indonesia 2.54
Myanmar 1.82
Vietnam 2.52
China 2.69
Nigeria 2.11
091099 Spices, Nesoi. (kg) 579.23 629.598 World 0.92
Pakistan 0.77
Nepal 0.57
Saudi Arabia 22.52
Germany 6.44
Morocco 3.46

Product (Units) Canada
(CAD /Unit)
Ratio
(Canada/ World)
Major Competitors
Country Price(CAD /Unit)
74
110290 Cereal Flours, Nesoi. (kg) 4.82 2.340 World 2.06
Germany 2.98
USA 5.97
Ukraine 0.76
Thailand 0.66
Singapore 0.82
110710 Malt, Not Roasted. (kg) 17.13 22.840 World 0.75
China 0.68
Germany 2.85
110811 Starch, Wheat. (kg) 9.76 15.742 World 0.62
France 0.55
Belgium 1.56
Germany 1.20
Hong Kong 1.67
China 1.73
110819 Starches, Nesoi. (kg) 0.18 0.400 World 0.45
Thailand 0.44
Vietnam 0.45
Philippines 0.38
Japan 3.13
USA 0.59
120750 Mustard Seeds, Whether orNot Broken. (kg)
1.47 1.000 World 1.47
121190 Plants & Parts Etc forMedicaments Etc Nesoi.(kg)
1.73 1.663 World 1.04
Congo 0.42
Australia 8.27
Pakistan 0.73
Vietnam 0.61
Netherlands 6.64
121220 Seaweeds & Other AlgaeFresh or Dried Whether orNot Ground. (kg)
1.56 1.515 World 1.03
Morocco 1.94
China 0.88
Sri Lanka 0.46
Japan 0.66
Indonesia 0.39

Product (Units) Canada
(CAD /Unit)
Ratio
(Canada/ World)
Major Competitors
Country Price(CAD /Unit)
75
130219 Vegetable Saps andExtracts, Nesoi. (kg)
45.52 1.933 World 23.55
China 27.35
USA 14.72
Italy 71.16
Germany 15.88
France 32.09
130239 Mucilage & ThicknerWhether or Not Modified,Form Vegetable ProductsNesoi. (kg)
5.21 0.425 World 12.25
USA 12.68
Philippines 9.59
China 23.43
Denmark 19.57
Chile 10.34
151419 Rapeseed/colza Oil &Fractions, Low ErucicAcid, Nesoi. (kg)
1.26 1.000 World 1.26
Japan 3.69
151499 Rapeseed, Colza, MustardOil & Fractions Thereof,Nesoi. (kg)
1.29 0.977 World 1.32
Italy 1.39
Singapore 2.26
151590 Fixed Vegetable Oil,Refined or Not, Nesoi, NotChemically Modified. (kg)
1.35 1.570 World 0.86
Nepal 0.75
Ghana 0.98
Bangladesh 0.90
Benin 0.90
Vietnam 0.47
151800 Animal / Vegetable Fats &Oils Chemically Modified;Inedible Mixture Etc. (kg)
16.23 6.315 World 2.57
Germany 6.69
USA 1.36
France 14.33
Malaysia 0.91
Nepal 15.79
160239 Prepared Etc. PoultryMeat, Except Turkey,Nesoi. (kg)
3.42 1.745 World 1.96
Netherlands 2.09
Thailand 2.24
Denmark 0.86
Italy 7.93
France 4.26

Product (Units) Canada
(CAD /Unit)
Ratio
(Canada/ World)
Major Competitors
Country Price(CAD /Unit)
76
160242 Prepared or PreservedSwine Nesoi, ShouldersEtc. (kg)
6.06 0.948 World 6.39
Spain 7.97
UAE 4.34
Italy 13.97
Germany 10.23
160249 Prepared Etc. Swine Meat,Offal, Etc. Nesoi. (kg)
4.39 0.790 World 5.56
Spain 6.55
France 6.01
Netherlands 4.49
Italy 6.90
Brazil 8.95
160290 Animal Meat Nesoi BloodPreparations of AnyAnimal, Prepared /Preserved. (kg)
5.07 1.028 World 4.93
Denmark 4.83
160411 Salmon, Prepared orPreserved, Whole orPieces. (kg)
8.21 1.743 World 4.71
Thailand 5.10
Australia 4.12
UK 4.22
Malaysia 5.44
Japan 6.02
160414 Tunas / Skipjack / BonitoPrepared / Preserved NotMinced. (kg)
5.34 1.459 World 3.66
Thailand 3.23
Malaysia 5.52
UK 6.96
Australia 3.36
Singapore 2.32
170199 Cane / Beet SugarChemically Pure SucroseRefined Nesoi. (kg)
1.21 1.704 World 0.71
Brazil 0.65
Thailand 0.81
UAE 0.68
Spain 0.72
Malaysia 0.70

Product (Units) Canada
(CAD /Unit)
Ratio
(Canada/ World)
Major Competitors
Country Price(CAD /Unit)
77
170211 Lactose & Lactose SyrupContaining 99% or MoreLactose by Weight. (kg)
1.29 0.777 World 1.66
Germany 3.05
Netherlands 1.59
USA 1.34
New Zealand 1.37
France 0.89
170220 Maple Sugar and MapleSyrup. (kg)
15.63 1.587 World 9.85
USA 10.80
France 6.03
Italy 6.03
Australia 7.22
Mexico 19.35
170490 Sugar Confection(Including WhiteChocolate), No Cocoa,Nesoi. (kg)
3.90 2.010 World 1.94
China 1.58
Australia 3.57
Indonesia 1.66
Thailand 2.07
Malaysia 1.49
180100 Cocoa Beans, Whole orBroken, Raw or Roasted.(kg)
3.53 0.944 World 3.74
Indonesia 4.24
DominicanRepublic
3.57
Ghana 3.58
Ecuador 3.41
Uganda 3.43
180690 Cocoa Preparations, Not inBulk Form, Nesoi. (kg)
2.10 0.577 World 3.64
Singapore 3.46
Italy 5.13
Switzerland 7.39
Netherlands 4.28
UAE 3.10
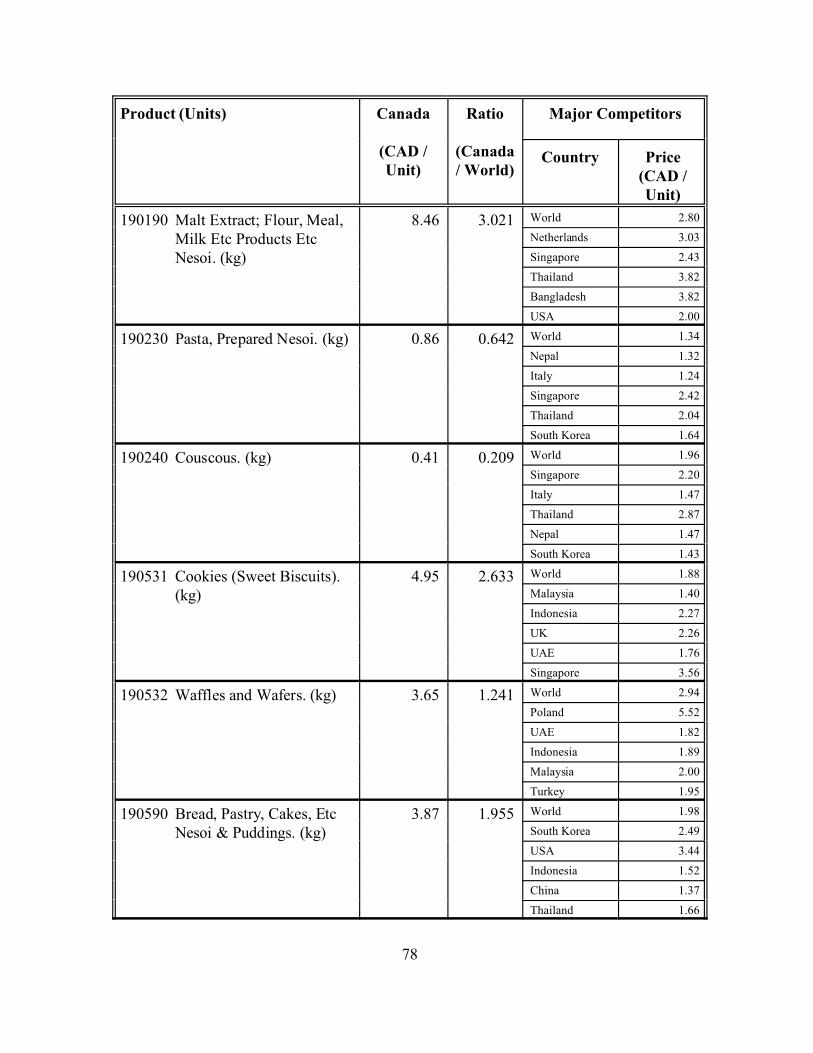
Product (Units) Canada
(CAD /Unit)
Ratio
(Canada/ World)
Major Competitors
Country Price(CAD /Unit)
78
190190 Malt Extract; Flour, Meal,Milk Etc Products EtcNesoi. (kg)
8.46 3.021 World 2.80
Netherlands 3.03
Singapore 2.43
Thailand 3.82
Bangladesh 3.82
USA 2.00
190230 Pasta, Prepared Nesoi. (kg) 0.86 0.642 World 1.34
Nepal 1.32
Italy 1.24
Singapore 2.42
Thailand 2.04
South Korea 1.64
190240 Couscous. (kg) 0.41 0.209 World 1.96
Singapore 2.20
Italy 1.47
Thailand 2.87
Nepal 1.47
South Korea 1.43
190531 Cookies (Sweet Biscuits).(kg)
4.95 2.633 World 1.88
Malaysia 1.40
Indonesia 2.27
UK 2.26
UAE 1.76
Singapore 3.56
190532 Waffles and Wafers. (kg) 3.65 1.241 World 2.94
Poland 5.52
UAE 1.82
Indonesia 1.89
Malaysia 2.00
Turkey 1.95
190590 Bread, Pastry, Cakes, EtcNesoi & Puddings. (kg)
3.87 1.955 World 1.98
South Korea 2.49
USA 3.44
Indonesia 1.52
China 1.37
Thailand 1.66

Product (Units) Canada
(CAD /Unit)
Ratio
(Canada/ World)
Major Competitors
Country Price(CAD /Unit)
79
200390 Mushrooms, Nesoi,Prepared / Preserved Otherthan by Vinegar. (kg)
0.66 0.303 World 2.18
China 2.01
South Korea 3.94
Afghanistan 5.20
France 10.88
Singapore 2.61
200559 Beans, Not Shelled,Prepared / PreservedNesoi, Not Frozen. (kg)
1.62 1.191 World 1.36
UK 1.33
Italy 0.81
Thailand 3.56
UAE 3.48
USA 1.39
200969 Grape Juice, Nesoi, NotFortified with Vitamins /Minerals. (kg)
6.39 3.672 World 1.74
Spain 1.66
Italy 2.29
Chile 3.52
Netherlands 2.87
Sri Lanka 3.64
200980 Juice of Any Single Fruit /Vegetable UnfermentedNesoi. (kg)
1.72 1.265 World 1.36
USA 4.00
Malaysia 1.36
UAE 1.50
South Africa 1.07
Germany 4.93
200990 Mixtures of Fruit and / orVegetable Juices. (kg)
1.55 1.000 World 1.55
USA 3.41
Philippines 1.64
Sri Lanka 0.90
Bhutan 0.84
Thailand 0.63
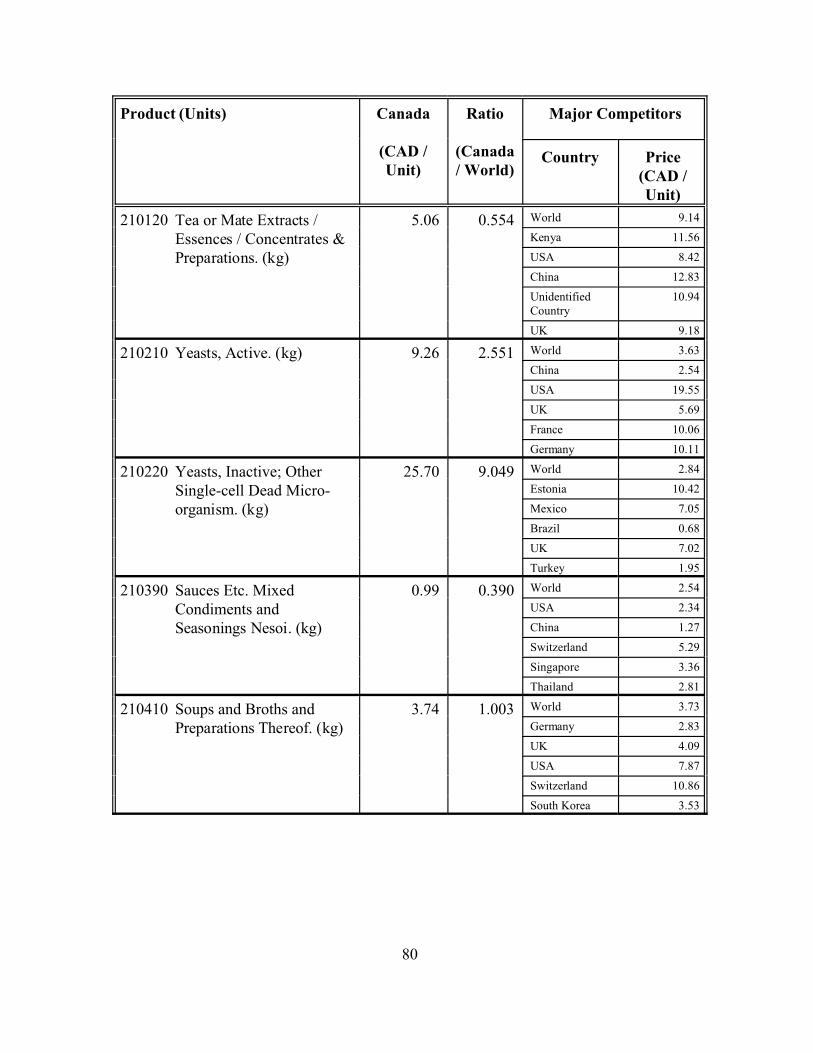
Product (Units) Canada
(CAD /Unit)
Ratio
(Canada/ World)
Major Competitors
Country Price(CAD /Unit)
80
210120 Tea or Mate Extracts /Essences / Concentrates &Preparations. (kg)
5.06 0.554 World 9.14
Kenya 11.56
USA 8.42
China 12.83
UnidentifiedCountry
10.94
UK 9.18
210210 Yeasts, Active. (kg) 9.26 2.551 World 3.63
China 2.54
USA 19.55
UK 5.69
France 10.06
Germany 10.11
210220 Yeasts, Inactive; OtherSingle-cell Dead Micro-organism. (kg)
25.70 9.049 World 2.84
Estonia 10.42
Mexico 7.05
Brazil 0.68
UK 7.02
Turkey 1.95
210390 Sauces Etc. MixedCondiments andSeasonings Nesoi. (kg)
0.99 0.390 World 2.54
USA 2.34
China 1.27
Switzerland 5.29
Singapore 3.36
Thailand 2.81
210410 Soups and Broths andPreparations Thereof. (kg)
3.74 1.003 World 3.73
Germany 2.83
UK 4.09
USA 7.87
Switzerland 10.86
South Korea 3.53

Product (Units) Canada
(CAD /Unit)
Ratio
(Canada/ World)
Major Competitors
Country Price(CAD /Unit)
81
210500 Ice Cream and OtherEdible Ice, with Cocoa orNot. (kg)
4.93 0.913 World 5.40
France 6.02
UAE 4.18
Switzerland 7.36
Swaziland 6.98
Bangladesh 7.67
210610 Protein Concentrates &Textured ProteinSubstances. (kg)
9.63 1.390 World 6.93
USA 6.60
New Zealand 7.78
Netherlands 8.82
Switzerland 9.37
China 3.97
210690 Food Preparations Nesoi.(kg)
16.53 3.586 World 4.61
USA 11.99
Thailand 1.44
Singapore 9.74
Netherlands 5.19
Denmark 5.20
220210 Waters, Including Mineral& Aerated, Sweetened orFlavoured. (L)
0.74 1.682 World 0.44
Bangladesh 0.37
Bhutan 0.45
UAE 0.92
Malaysia 2.19
UK 0.83
220421 Wine, from Grape Nesoi &Grape must with Alcohol,Not over 2 Litres. (L)
9.19 1.831 World 5.02
Italy 5.42
France 6.83
Australia 3.84
UK 5.91
New Zealand 6.93
220710 Ethyl Alcohol,Undenatured, Alcohol Notunder 80% by Volume. (L)
1.40 0.680 World 2.06
Germany 8.49
Italy 2.08
UK 1.97
China 4.16
Pakistan 1.16

Product (Units) Canada
(CAD /Unit)
Ratio
(Canada/ World)
Major Competitors
Country Price(CAD /Unit)
82
220830 Whiskies. (L) 4.55 0.789 World 5.77
UK 5.61
UAE 6.65
China 6.17
USA 7.57
Netherlands 6.65
220870 Liqueurs and Cordials. (L) 7.01 0.837 World 8.38
UK 9.73
France 9.00
Netherlands 4.16
USA 6.32
Italy 4.74
220890 Cordials, Liqueurs,Kirschwasser, Ratafia, Etc.(L)
5.04 1.775 World 2.84
UK 2.80
China 3.10
Mexico 3.69
Italy 2.26
France 3.81
230250 Bran Sharps Residue fromMilling LeguminousPlants. (kg)
0.63 5.727 World 0.11
Nepal 0.11
Sri Lanka 0.11
Tanzania 0.10
USA 0.14
Italy 0.14
230690 Oilcake Etc. fromVegetable Fats and OilsNesoi. (kg)
1.35 4.821 World 0.28
Nepal 0.26
Ghana 0.08
Italy 1.26
Sri Lanka 0.23
230990 Animal Feed Prep ExceptDog or Cat Food, RetailPackaged. (kg)
6.59 2.047 World 3.22
Sri Lanka 6.47
China 2.61
Thailand 3.12
USA 2.25
Germany 14.96

Product (Units) Canada
(CAD /Unit)
Ratio
(Canada/ World)
Major Competitors
Country Price(CAD /Unit)
83
330112 Essential Citrus Fruit Oilsof Orange. (kg)
5.14 1.911 World 2.69
Brazil 2.10
USA 7.79
Israel 8.16
UK 6.09
Italy 9.84
330113 Essential Citrus Fruit Oilsof Lemon. (kg)
17.26 0.615 World 28.07
USA 33.99
Italy 23.12
Germany 106.39
France 26.14
UK 42.33
330119 Essential Oils of CitrusFruit, Nesoi. (kg)
19.12 1.182 World 16.18
China 15.06
USA 13.81
UK 31.68
Italy 17.66
Indonesia 23.36
330129 Essential Oils, Nesoi. (kg) 17.84 0.682 World 26.17
Indonesia 30.08
China 10.84
Australia 223.88
EAU 177.86
France 44.58
330190 Concentrates Etc ofEssential Oils, Nesoi. (kg)
72.01 3.053 World 23.59
China 30.01
USA 29.38
France 31.34
Germany 5.69
UK 8.90
350300 Gelatin & Derivatives;Isinglass; Glues, AnimalOrigin Nesoi. (kg)
6.04 0.891 World 6.78
Germany 9.79
Colombia 5.65
France 7.66
USA 6.79
UK 7.12

Product (Units) Canada
(CAD /Unit)
Ratio
(Canada/ World)
Major Competitors
Country Price(CAD /Unit)
84
350400 Peptones, Other Proteins &Derivatives Etc; HidePowder. (kg)
22.59 5.076 World 4.45
USA 4.31
China 3.17
France 8.74
Germany 11.24
Israel 3.17
350510 Dextrins and OtherModified Starches. (kg)
6.58 5.023 World 1.31
Thailand 0.85
USA 2.88
Netherlands 1.51
Germany 1.51
France 2.17
350520 Glues Based on Starches.(kg)
2.09 0.694 World 3.01
Denmark 3.89
China 1.63
Germany 8.04
Taiwan 2.73
Italy 4.61
410120 Whole Hides & Skin,Weight/skin <=8 Kg Dried/ 10 Dry-salt / 16 Fresh.(kg)
2.27 0.904 World 2.51
Italy 4.25
Spain 3.57
Germany 2.66
Myanmar 0.96
Uruguay 2.60
410190 Butts / Bends / Bellies ofBovine / Equine Animals.(kg)
3.54 1.602 World 2.21
Netherlands 1.86
USA 1.97
New Zealand 6.54
Italy 3.27
Myanmar 1.25
410221 Sheep / Lamb SkinsWithout Wool on PickledWhether or Not Split.(Each)
5.98 1.077 World 5.55
New Zealand 4.55
Yemen 6.33
Iran 6.20
Turkey 8.73
Saudi Arabia 10.48
Product (Units) Canada
(CAD /Unit)
Ratio
(Canada/ World)
Major Competitors
Country Price(CAD /Unit)
85
Source: Indian Ministry of Commerce via Global Trade Atlas. (Accessed Jan 2012)

86
APPENDIX 2
Canada - New Zealand/US - Measures Affecting the Importation of Milk and theExportation of Dairy Products
A. The World Trade Organization (WTO) Rulings Regarding Dairy ExportsOn the basis of challenges from New Zealand and the United States, the WTO ruled in
1999 that certain Canadian dairy exports benefitted from export subsidies under the rules of theWTO Agreement on Agriculture. Thus, they were subject to Canada's WTO export subsidyreduction commitments. Since exports exceeded those commitments, Canada was found to be inbreach of its obligations. The milk sales affected by the WTO ruling accounted for about fourpercent of total Canadian production. The WTO ruling did not prevent the export of dairyproducts as Canada is allowed to use export subsidies for dairy products within specified limits(see Table 20). Canada's Measures to Implement the 1999 WTO Ruling.
Canada unsuccessfully appealed the Panel’s Report - in its Report in October 1999, theWTO Appellate Body upheld the Panel's key findings. The WTO Dispute Settlement Bodyadopted these findings, and recommended that Canada bring its measures into conformity with theWTO rules.
• New Zealand and the United States then reached an agreement with Canada in December
1999 on the time-frame for Canada's implementation of the outcome of the case. Thisagreement provided for a "phased" implementation over the 2000 calendar year. As part of itsimplementation, Canada would continue to make use of the "Special Milk Classes" scheme fordairy exports, but agreed to limit export volumes under the scheme to within its commitmentlevels.
However as part of its implementation, Canada introduced a number of new dairy exportmechanisms on a province-by-province basis. Canada claimed that the new schemes did notprovide export subsidies, and it would not therefore limit the volume of exports under them towithin its export subsidy commitment levels. New Zealand and United States officials consideredthat the new schemes continued to provide export subsidies and that Canada had therefore failedto comply with the Dispute Settlement Body's recommendations.
In February 2001, New Zealand, the United States and Canada held consultations on thisissue, but failed to resolve New Zealand's and the United State's concerns. Consequently, later inFebruary, New Zealand and the United States formally requested that the WTO reconvene theoriginal dispute settlement Panel to examine Canada's replacement schemes. The Panel receivedwritten and oral submissions from the parties in May 2001 and in July 2001, found that Canada'sreplacement schemes continued to provide export subsidies in breach of its WTO commitments.

87
Canada subsequently appealed this decision and in December 2001 the Appellate Bodyheld that the Panel had applied the wrong legal test to determine whether export subsidies hadbeen provided. The Appellate Body also determined that it was unable to make any determinationas to whether the Canadian measures were export subsidies since further factual information wasrequired before the correct legal test could be applied.
Following the December 2001 Appellate Body ruling, New Zealand and the United Statesrequested, for a second time, the reconvening of the original dispute settlement Panel to examineCanada's replacement measures against the legal test outlined by the Appellate Body. The Panelreceived written and oral submissions from the parties in March and April 2002 and in July 2002.the Panel, once again, found that Canada's replacement schemes continued to provide exportsubsidies in breach of its WTO commitments.
On 23 September 2002, Canada notified its decision to appeal the Panel decision.Following receipt of written submissions of the parties, the Appellate Body heard the appeal inGeneva on 31 October 2002. In its report of 20 December 2002 the Appellate Body upheld thePanel's finding that Canada was providing export subsidies in breach of its WTO commitments.The Appellate Body found that Canada's replacement scheme was contrary to Canada'sobligations under Article 3.3 and Article 8 of the Agreement on Agriculture. The Appellate Body'sdecision was adopted by the Dispute Settlement Body on 17 January 2003.
At the same time as initiating the dispute settlement process to investigate Canada'scompliance with the original panel's finding, New Zealand also lodged a request seekingauthorisation from the Dispute Settlement Body to take retaliatory action against Canada bysuspending tariff concessions up to the value of USD 35 million a year, which is the damagecalculated to be caused to New Zealand by Canada's illegal dairy export subsidy regime. The U.S.also made a similar request to the Dispute Settlement Body. The requests of New Zealand and theU.S. were referred to arbitration. A mutually agreed solution between Canada and New Zealandand separately between Canada and the United States was notified to the WTO on 9 May 2003.
B. The Mutually Agreed Solutions
Table 20. Canada's WTO Dairy Export SubsidyCommitment Levels.
Commodity QuantityCommitments
(t)
Budgetary OutlayCommitments
(CAD ‘000)
Butter. 3,500 11,025
Cheese. 9,076 16,228
Skim Milk Powder. 44,953 31,149
Other M ilk Products. 30,282 22,505

Commodity QuantityCommitments
(t)
Budgetary OutlayCommitments
(CAD ‘000)
88
Incorporated Products. 20,276
Source: Uruguay Round Schedule of Commitments, Schedule V -
Canada, Final Schedule of Agriculture Commitments.
Note: Based on dairy year (August 1-July 31).

89
1. Part of the Agricultural Policy Framework. For more information see:http://www.agr.gc.ca/cb/apf/index_e.php.
2. Euromonitor International. “Packaged Food in India (January 2005, November 2010) andcompany websites.”
3. The CIA World Factbook reports the total area of India at 3,287,590 sq km, consisting of2,973,190 sq km of land and 314,400 sq km of water.
4. "India," Microsoft® Encarta® Online Encyclopediahttp://encarta.msn.com (Accessed 2005)© 1997-2005 Microsoft Corporation. All RightsReserved. Discontinued in 2009.
5. Agriculture and Agri-food Canada takes no responsibility for the contents of other web pages.Any links are provided for the convenience of readers.
6. Euromonitor International data. (Accessed Feb 2012).
7. The Harmonized System (HS) of classifying traded products consists of between two and 10digits. The first six digits are common to all countries. The last 4 digits may be used byindividual countries to further disaggregate a classification for their own purposes.
8. Agricultural, agri-food & seafood products include the following HS codes: 01, 02, 03, 04,05, 06, 07, 08, 09, 10, 11, 12, 13, 14, 15, 16, 17, 18, 19, 20, 21, 22, 23, 24, 3301, 3501,3502, 4001, 4101, 4102, 4103, 4301, 5101, 5102, 5103, 5201, 5301, 5302.
9. The World Factbook, CIA. http://www.odci.gov/cia/publications/factbook/geos/in.html.
10. The Gini ratio is a measure of the inequality of income distribution. A value of zeroindicates that all incomes are equal, a value of 100 indicates total inequality.
11. The HS categories analysed here were chosen on the bases of the value of imports and thepossibilities of Canadian production and exportation.
12. All changes in imports refer to percent changes of a compound trend line fitted to the data.
13. For details of the obligations under the various Incoterms see “Incoterms 2000" by theInternational Chamber of Commerce. ICC Publishing, Inc., 156 Fifth Avenue, Suite 417,New York, NY 10010, USA. Email: [email protected] , www.iccbooks.com.
ENDNOTES