opportunities of airborne laser bathymetry · pdf filewith the aim of identifying the...
TRANSCRIPT
OPPORTUNITIES OF AIRBORNE LASER BATHYMETRY FOR THE MONITORING OFTHE SEA BED ON THE BALTIC SEA COAST
Joachim Niemeyer∗,a and Uwe Soergelb
a Institute of Photogrammetry and GeoInformation, Leibniz Universitat Hannover, Germanyb Institute of Geodesy, Chair of Remote Sensing and Image Analysis, TU Darmstadt, Germany
(niemeyer, soergel)@ipi.uni-hannover.de
Commission III/2
KEY WORDS: Laser Bathymetry, Coastal, 3D Point Cloud, LiDAR, Monitoring
ABSTRACT:
Traditional ship-based bathymetric surveys based on echo sounding are expensive and time consuming. This paper presents a projectwith the aim of identifying the opportunities of airborne laser bathymetry for the monitoring of the sea bed at the German Baltic Seacoast. Such devices operate with laser signal in the green part of the visible spectrum which is capable to penetrate the water. Thedepth is determined from the two-way runtime between the water surface and reflections from the ground underneath. Several flightcampaigns in representative test areas will be carried out in order to analyze the reachable depths, the accuracies of the acquired points,and the detection of obstacles depending on different water conditions (e.g. turbidity). We discuss some preliminary results of a pilotproject and the first campaign of a study area close to the island of Poel, Germany.
1 INTRODUCTION
The periodic monitoring of the sea bed is one of the most im-portant tasks of the hydrographic authorities. The correspond-ing measurements of the underwater topography (bathymetry)and detection of obstacles, which guarantee the safe navigationof ships, are currently carried out by ship-based echo sounding,but this method is very expensive and time consuming. In ad-dition, many operators are needed and it is a material-intensivetechnique. Due to international agreements and a steadily grow-ing maritime traffic relying on high precision navigation systemsthe demand for monitoring campaigns has increased.
Particularly challenging are the shallow water regions betweendepth of 0 m and 1-2 m. Due to the draft this areas are often notaccessible for vessels. Thus, data of these regions are difficult toobtain and often not very accurate, although they are needed formany applications such as a reliable determination of the coastline, coastal protection and coastal zone management.
In recent years the promising technique of airborne laser bathy-metry (ALB) became more and more important thanks to im-proved hardware and better processing software. Such devicesuse green laser which can penetrate the water column. The depthis determined from the two-way runtime between the water sur-face and reflections from the solid ground underneath. Especiallythe pulse repetition rate and thus the point density have been sig-nificantly increased for state-of-the-art sensors. Good results un-der optimal conditions were observed (Irish and Lillycrop, 1999;Steinbacher et al., 2012). However, there are many limiting fac-tors, in particular water turbidity. Some other issues are wind, thesea state, reflectance of the sea bed, and much more.
This paper puts emphasis on the goals of the project ’Investiga-tion on the use of airborne laser bathymetry in hydrographic sur-veying’, which is a cooperation of BSH (Federal Maritime andHydrographic Agency of Germany) and IPI (Institute of Pho-togrammetry and GeoInformation, Leibniz Universitat Hannover).It studies the opportunities of airborne laser bathymetry for the
∗Corresponding author.
monitoring of the sea bed in the Baltic Sea in comparison to tra-ditional ship-based echo sounding. Several flight campaigns inrepresentative test areas will be carried out in order to analyzethe reachable depths, the accuracies of the acquired points, andthe detection of obstacles depending on different water condi-tions (e.g. turbidity). In this investigation, we report preliminaryresults of the first campaign that took place in autumn of 2013.
2 LASER BATHYMETRY
Conventional bathymetry of water bodies is performed by echosounding systems mounted on vessels. However, especially inshallow water (for example close to the coast) these ships can-not access some areas due to the draft. Thus, these areas arechallenging for monitoring tasks. A relatively new method to ob-tain 3D information of near-shore shallow water regions is ALB.Mounted on an aircraft, a three dimensional description of theground is obtained by laserscanning. In contrast to topographicscanners operating with near infrared laser, bathymetric sensorsmake use of green laser of 532 nm wavelength. These pulsesare able to penetrate the water column and thus may reach thesea bed. The measuring depth is limited due to attenuation ofthe laser energy by absorption, scattering, and refraction effectswhile the laser pulse is traveling through the water column. Mostsensors work with a combination of a near infrared and a greenlaser. In this case the infrared one is reflected from the watersurface, whereas the green laser measures the ground. The differ-ence of both levels corresponds to the water depth.
The first systems were introduced in the 1960th for military taskssuch as the detection of submarines. Hickman and Hogg (1969)proposed to use an airborne laser for bathymetric surveying. Inthe next decades several prototypes of ALB sensors were devel-oped, for example from NASA and the U.S. Navy. The RoyalAustralian Navy constructed the first operational system calledLADS in 1986 (Lillycrop et al., 2002). As a strong green laserpulse is necessary in order to reach deeper areas in the ocean,the pulse repetition rate of the sensor was limited considerably.This leads to low point densities on the sea bed. Guenther et al.(2000) reported basic technical requirements for laser bathymetry
International Archives of the Photogrammetry, Remote Sensing and Spatial Information Sciences, Volume XL-7/W2, 2013ISPRS2013-SSG, 11 – 17 November 2013, Antalya, Turkey
This contribution has been peer-reviewed.doi:10.5194/isprsarchives-XL-7-W2-179-2013 179
and sensors are summarized by Mallet and Bretar (2009). Somesystems of the newest generation, such as the Riegl VQ-820-Gsensor (Riegl, 2013; Steinbacher et al., 2012) or Chiroptera (Air-borne Hydrography AB, 2013), are especially designed for higherpoint densities in shallow water regions of about one Secchi depth(the maximum depth of which the human eye can detect a specificdisk in the water) by increasing the pulse repetition rate. How-ever, they are not suitable for deeper water because the energy ofa pulse is too low for a longer travel through the water column.Thus, the sensors can be divided into two groups. In some cases acombined survey of bathymetric and topographic (on-shore) sur-vey is possible, which may decrease the relative costs and lead tomore homogeneous data sets.
Many of the published civil applications with laser bathymetryhave taken place in test studies with clear water. Promising resultswere obtained here and measurements of up to 60 m have beenreported (Irish and Lillycrop, 1999). In Costa et al. (2009) it wasshown that laser bathymetry was 6.6 % cheaper and took 40 hourless processing time with a drawback of lower spatial resolutioncompared to multi-beam sonar for a coral reef mapping projectwith water deeper than 50 m. In the case of Germany the BSHis responsible for bathymetric surveys of the North Sea and theBaltic Sea. However, there are strong tidal effects at the NorthSea coast leading to a turbidity of the water due to the whirledsediments. In contrast the water of the Baltic Sea coast is muchclearer, although it is still not optimal for laser bathymetry. Thisis the reason why the work of the presented project focuses on theBaltic Sea coast.
3 PILOT STUDY
In June 2008 a first pilot study was conducted by BSH. The studyarea was an approx. 14 km2 large region located close to the is-land of Poel in the German Baltic sea coast. The company Blomacquired data with a Hawkeye II sensor, carried on a RockwellAero Commander 690 aircraft. Flying height was 400 m. Duringacquisition it was partly windy with a little surge of waves. Thedelivery comprised x,y,z coordinates of the echoes and we do nothave access to the full waveform data.
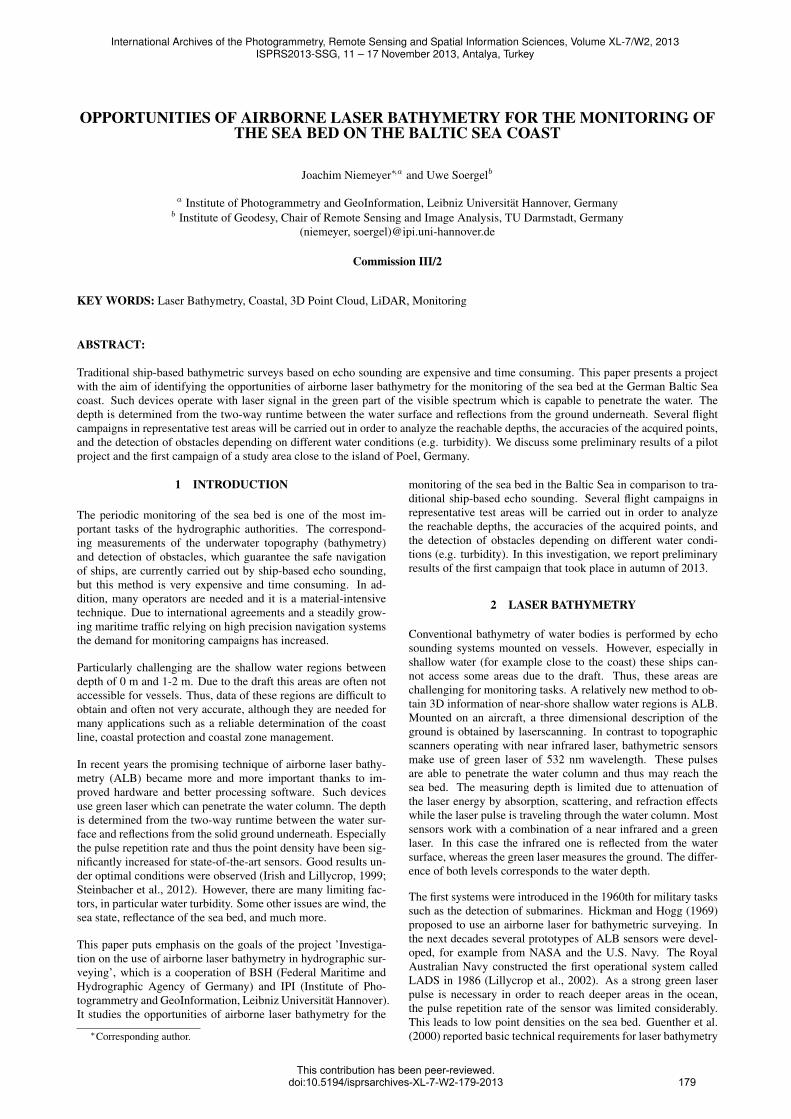
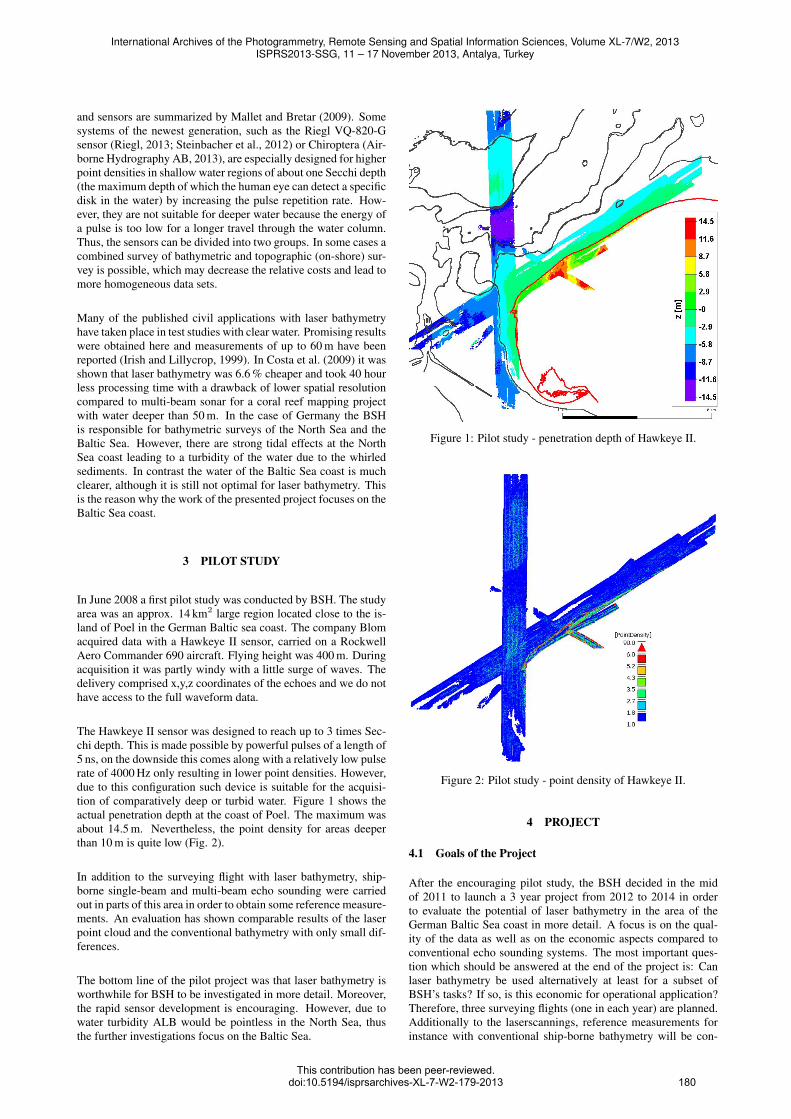
The Hawkeye II sensor was designed to reach up to 3 times Sec-chi depth. This is made possible by powerful pulses of a length of5 ns, on the downside this comes along with a relatively low pulserate of 4000 Hz only resulting in lower point densities. However,due to this configuration such device is suitable for the acquisi-tion of comparatively deep or turbid water. Figure 1 shows theactual penetration depth at the coast of Poel. The maximum wasabout 14.5 m. Nevertheless, the point density for areas deeperthan 10 m is quite low (Fig. 2).
In addition to the surveying flight with laser bathymetry, ship-borne single-beam and multi-beam echo sounding were carriedout in parts of this area in order to obtain some reference measure-ments. An evaluation has shown comparable results of the laserpoint cloud and the conventional bathymetry with only small dif-ferences.
The bottom line of the pilot project was that laser bathymetry isworthwhile for BSH to be investigated in more detail. Moreover,the rapid sensor development is encouraging. However, due towater turbidity ALB would be pointless in the North Sea, thusthe further investigations focus on the Baltic Sea.
Figure 1: Pilot study - penetration depth of Hawkeye II.
Figure 2: Pilot study - point density of Hawkeye II.
4 PROJECT
4.1 Goals of the Project
After the encouraging pilot study, the BSH decided in the midof 2011 to launch a 3 year project from 2012 to 2014 in orderto evaluate the potential of laser bathymetry in the area of theGerman Baltic Sea coast in more detail. A focus is on the qual-ity of the data as well as on the economic aspects compared toconventional echo sounding systems. The most important ques-tion which should be answered at the end of the project is: Canlaser bathymetry be used alternatively at least for a subset ofBSH’s tasks? If so, is this economic for operational application?Therefore, three surveying flights (one in each year) are planned.Additionally to the laserscannings, reference measurements forinstance with conventional ship-borne bathymetry will be con-
International Archives of the Photogrammetry, Remote Sensing and Spatial Information Sciences, Volume XL-7/W2, 2013ISPRS2013-SSG, 11 – 17 November 2013, Antalya, Turkey
This contribution has been peer-reviewed.doi:10.5194/isprsarchives-XL-7-W2-179-2013 180
ducted. In the context of the project a collaboration with the IPIas a scientific partner was started. Both partners, BSH and IPI,will validate the geometric accuracy of the laser data. Further-more, IPI will investigate the full waveform data in order to findout whether obstacles such as stones can be detected in the data.Of special interest are also shallow water areas and the transitionzone to shore. Taken as a whole all environmental influences suchas water turbidity, weather, strength of the waves and so on shouldbe determined to figure out the limitations of the technique. Thatis why heterogeneous test areas close to the island of Poel in theBaltic Sea were chosen.
Considering the quality of the data, laser bathymetry must meetthe constraints of the IHO Standards for Hydrographic Surveys(S-44) (International Hydrographic Organization, 2008), Order1a specifications to partly substitute ship-based bathymetry. Tolive up to this standard, full sea floor coverage is required duringsurveying. Moreover, it must be possible to detect cubic obstaclesof size of larger than 2 m in up to 40 m depth. The maximumallowable total horizontal uncertainty (THU) is defined by
THUmax = 5m + 5%depth (1)
whereas the total vertical uncertainty is computed by
TV Umax = ±√
(0.5m)2 + (0.013 · depth)2 (2)
For both parameters a 95 % confidence level must be fulfilled.
Based on the experience of the latest campaign, the call of tenderfor the next surveying is designed and adapted. This also enablesto react more quickly on ongoing developments of sensors. Be-side BSH and IPI also the federal states and other authorities areinvolved in the project.
4.2 First Campaign
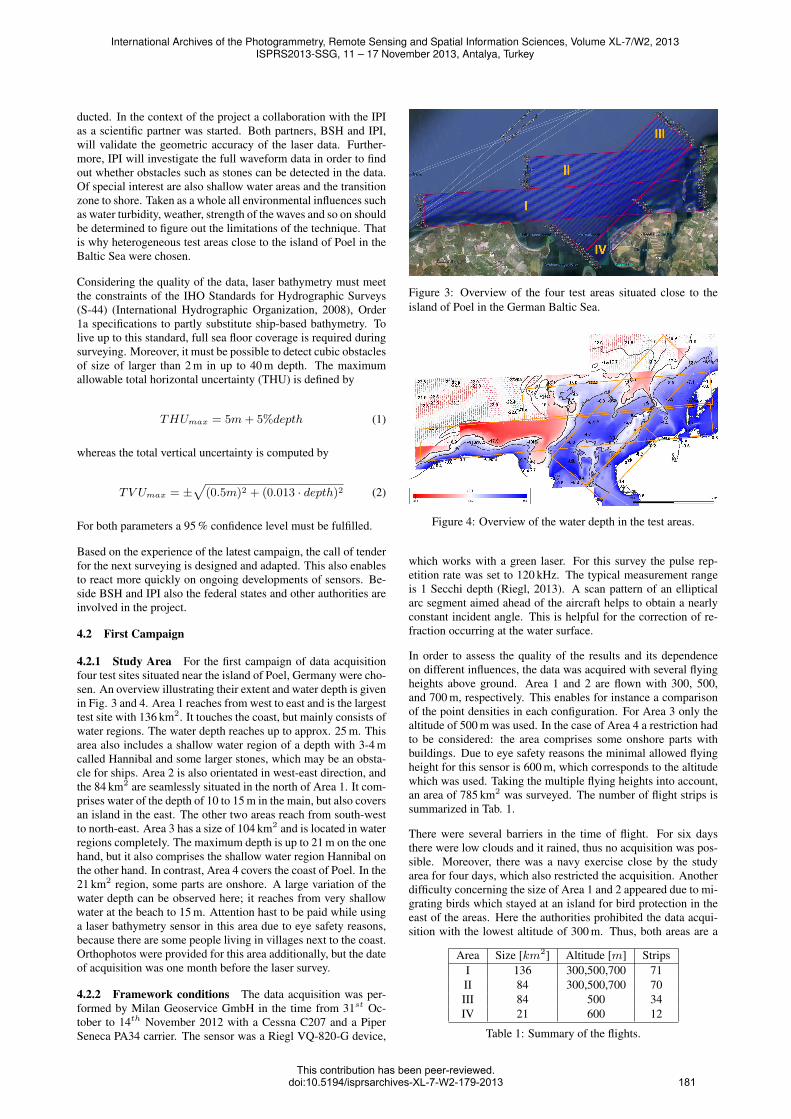
4.2.1 Study Area For the first campaign of data acquisitionfour test sites situated near the island of Poel, Germany were cho-sen. An overview illustrating their extent and water depth is givenin Fig. 3 and 4. Area 1 reaches from west to east and is the largesttest site with 136 km2. It touches the coast, but mainly consists ofwater regions. The water depth reaches up to approx. 25 m. Thisarea also includes a shallow water region of a depth with 3-4 mcalled Hannibal and some larger stones, which may be an obsta-cle for ships. Area 2 is also orientated in west-east direction, andthe 84 km2 are seamlessly situated in the north of Area 1. It com-prises water of the depth of 10 to 15 m in the main, but also coversan island in the east. The other two areas reach from south-westto north-east. Area 3 has a size of 104 km2 and is located in waterregions completely. The maximum depth is up to 21 m on the onehand, but it also comprises the shallow water region Hannibal onthe other hand. In contrast, Area 4 covers the coast of Poel. In the21 km2 region, some parts are onshore. A large variation of thewater depth can be observed here; it reaches from very shallowwater at the beach to 15 m. Attention hast to be paid while usinga laser bathymetry sensor in this area due to eye safety reasons,because there are some people living in villages next to the coast.Orthophotos were provided for this area additionally, but the dateof acquisition was one month before the laser survey.
4.2.2 Framework conditions The data acquisition was per-formed by Milan Geoservice GmbH in the time from 31st Oc-tober to 14th November 2012 with a Cessna C207 and a PiperSeneca PA34 carrier. The sensor was a Riegl VQ-820-G device,
Figure 3: Overview of the four test areas situated close to theisland of Poel in the German Baltic Sea.
Figure 4: Overview of the water depth in the test areas.
which works with a green laser. For this survey the pulse rep-etition rate was set to 120 kHz. The typical measurement rangeis 1 Secchi depth (Riegl, 2013). A scan pattern of an ellipticalarc segment aimed ahead of the aircraft helps to obtain a nearlyconstant incident angle. This is helpful for the correction of re-fraction occurring at the water surface.
In order to assess the quality of the results and its dependenceon different influences, the data was acquired with several flyingheights above ground. Area 1 and 2 are flown with 300, 500,and 700 m, respectively. This enables for instance a comparisonof the point densities in each configuration. For Area 3 only thealtitude of 500 m was used. In the case of Area 4 a restriction hadto be considered: the area comprises some onshore parts withbuildings. Due to eye safety reasons the minimal allowed flyingheight for this sensor is 600 m, which corresponds to the altitudewhich was used. Taking the multiple flying heights into account,an area of 785 km2 was surveyed. The number of flight strips issummarized in Tab. 1.
There were several barriers in the time of flight. For six daysthere were low clouds and it rained, thus no acquisition was pos-sible. Moreover, there was a navy exercise close by the studyarea for four days, which also restricted the acquisition. Anotherdifficulty concerning the size of Area 1 and 2 appeared due to mi-grating birds which stayed at an island for bird protection in theeast of the areas. Here the authorities prohibited the data acqui-sition with the lowest altitude of 300 m. Thus, both areas are a
Area Size [km2] Altitude [m] StripsI 136 300,500,700 71II 84 300,500,700 70III 84 500 34IV 21 600 12
Table 1: Summary of the flights.
International Archives of the Photogrammetry, Remote Sensing and Spatial Information Sciences, Volume XL-7/W2, 2013ISPRS2013-SSG, 11 – 17 November 2013, Antalya, Turkey
This contribution has been peer-reviewed.doi:10.5194/isprsarchives-XL-7-W2-179-2013 181
Area 1 300 m* 500 m 700 m# of points 888,141,103 113,916,063 13,256,704
Noise 0.45 % 0.32 % 0.65 %Water surface 45.09 % 18.44 % 1.28 %
Sea bed 33.46 % 56.17 % 38.18 %Vegetation 5.2*e−6 % 0.04 % -Onshore 21.00 % 25.04 % 59.89 %
Table 2: Distribution of classes in Area 1 (* area obtained with300 m altitude is smaller).
Area 2 300 m* 500 m 700 m# of points 134,770,086 67,942,332 25,124,149
Noise 0.10 % 0.30 % 0.33 %Water surface 98.98 % 28.19 % 2.59 %
Sea bed 0.92 % 11.00 % 24.56 %Vegetation - - -Onshore - 60.52 % 72.51 %
Table 3: Distribution of classes in Area 2 (* area obtained with300 m altitude is smaller).
bit smaller in this configuration, because the highlighted areas inFig. 5 were not accessible.
4.2.3 Statistics concerning the study areas As stipulated inthe contract, the delivery of the data comprises the point coordi-nates with the attributes concerning the echo return number, in-tensity values as well as a classification in one of the six objectclasses for each laser point:
• Onshore
• Water surface
• Sea bed
• Water vegetation
• Underwater obstacles
• Noise
The processed point cloud was also corrected to account for theangle of refraction, when the laser beam penetrated the waterbody on the water surface. Moreover, the speed of light is reducedin water compared to the propagation in the air. This differencein velocity must also be corrected. In addition to the processedpoint cloud the original waveform information was delivered forfurther research, too. The statistics of the Tables 2-4 are based onthe classification performed by Milan Geoservice.
Figure 5: Lowest altitude (300 m) for Area 1 and 2 is not possiblein highlighted parts because of migrating birds.
Area 3, 500 m Area 4, 600 m# of points 101,029,534 57,120,657
Noise 0.25 % 0.34 %Water surface 78.22 % 8.35 %
Sea bed 21.43 % 20.97 %Vegetation - -Onshore 0.10 % 70.34 %
Table 4: Distribution of classes in Area 3 and 4.
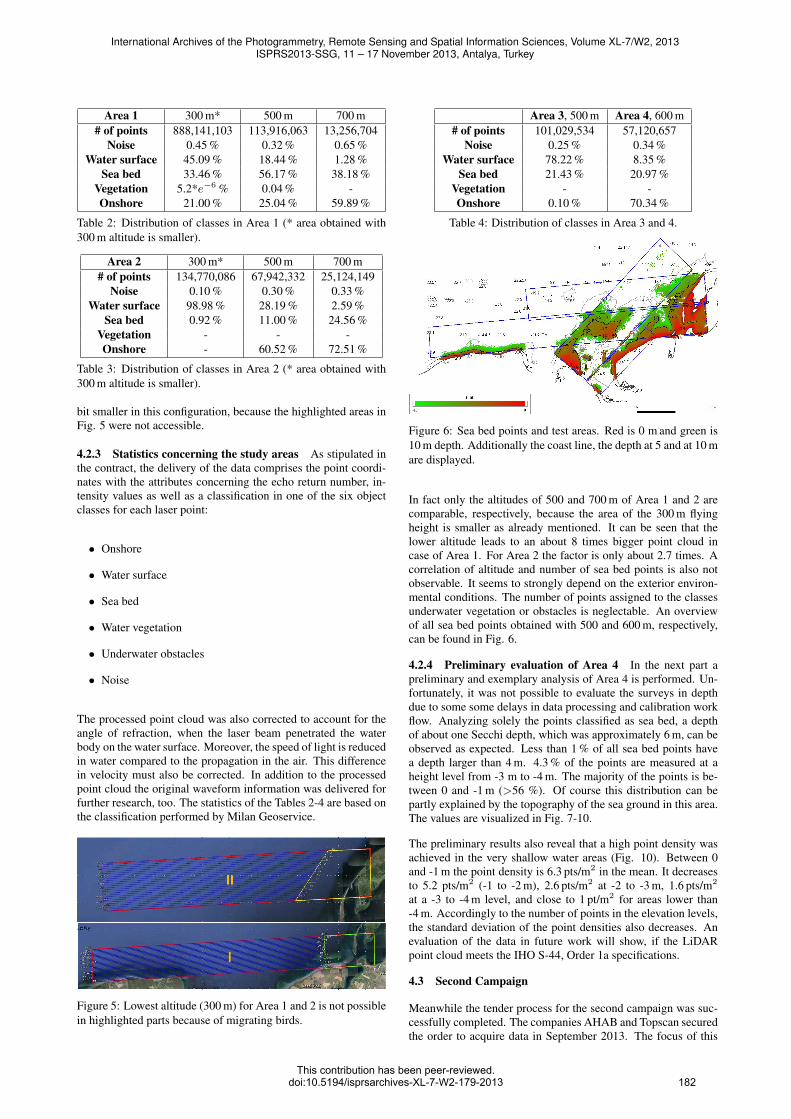
Figure 6: Sea bed points and test areas. Red is 0 m and green is10 m depth. Additionally the coast line, the depth at 5 and at 10 mare displayed.
In fact only the altitudes of 500 and 700 m of Area 1 and 2 arecomparable, respectively, because the area of the 300 m flyingheight is smaller as already mentioned. It can be seen that thelower altitude leads to an about 8 times bigger point cloud incase of Area 1. For Area 2 the factor is only about 2.7 times. Acorrelation of altitude and number of sea bed points is also notobservable. It seems to strongly depend on the exterior environ-mental conditions. The number of points assigned to the classesunderwater vegetation or obstacles is neglectable. An overviewof all sea bed points obtained with 500 and 600 m, respectively,can be found in Fig. 6.
4.2.4 Preliminary evaluation of Area 4 In the next part apreliminary and exemplary analysis of Area 4 is performed. Un-fortunately, it was not possible to evaluate the surveys in depthdue to some some delays in data processing and calibration workflow. Analyzing solely the points classified as sea bed, a depthof about one Secchi depth, which was approximately 6 m, can beobserved as expected. Less than 1 % of all sea bed points havea depth larger than 4 m. 4.3 % of the points are measured at aheight level from -3 m to -4 m. The majority of the points is be-tween 0 and -1 m (>56 %). Of course this distribution can bepartly explained by the topography of the sea ground in this area.The values are visualized in Fig. 7-10.
The preliminary results also reveal that a high point density wasachieved in the very shallow water areas (Fig. 10). Between 0and -1 m the point density is 6.3 pts/m2 in the mean. It decreasesto 5.2 pts/m2 (-1 to -2 m), 2.6 pts/m2 at -2 to -3 m, 1.6 pts/m2
at a -3 to -4 m level, and close to 1 pt/m2 for areas lower than-4 m. Accordingly to the number of points in the elevation levels,the standard deviation of the point densities also decreases. Anevaluation of the data in future work will show, if the LiDARpoint cloud meets the IHO S-44, Order 1a specifications.
4.3 Second Campaign
Meanwhile the tender process for the second campaign was suc-cessfully completed. The companies AHAB and Topscan securedthe order to acquire data in September 2013. The focus of this
International Archives of the Photogrammetry, Remote Sensing and Spatial Information Sciences, Volume XL-7/W2, 2013ISPRS2013-SSG, 11 – 17 November 2013, Antalya, Turkey
This contribution has been peer-reviewed.doi:10.5194/isprsarchives-XL-7-W2-179-2013 182
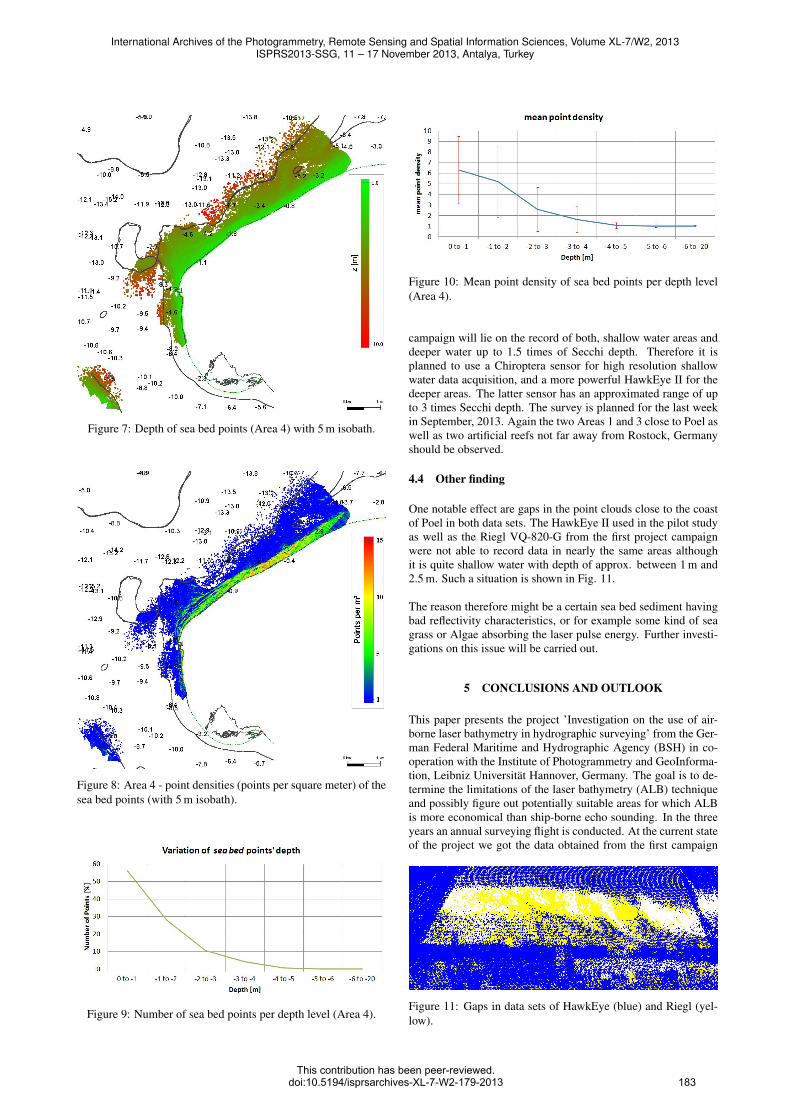
Figure 7: Depth of sea bed points (Area 4) with 5 m isobath.
Figure 8: Area 4 - point densities (points per square meter) of thesea bed points (with 5 m isobath).
Figure 9: Number of sea bed points per depth level (Area 4).
Figure 10: Mean point density of sea bed points per depth level(Area 4).
campaign will lie on the record of both, shallow water areas anddeeper water up to 1.5 times of Secchi depth. Therefore it isplanned to use a Chiroptera sensor for high resolution shallowwater data acquisition, and a more powerful HawkEye II for thedeeper areas. The latter sensor has an approximated range of upto 3 times Secchi depth. The survey is planned for the last weekin September, 2013. Again the two Areas 1 and 3 close to Poel aswell as two artificial reefs not far away from Rostock, Germanyshould be observed.
4.4 Other finding
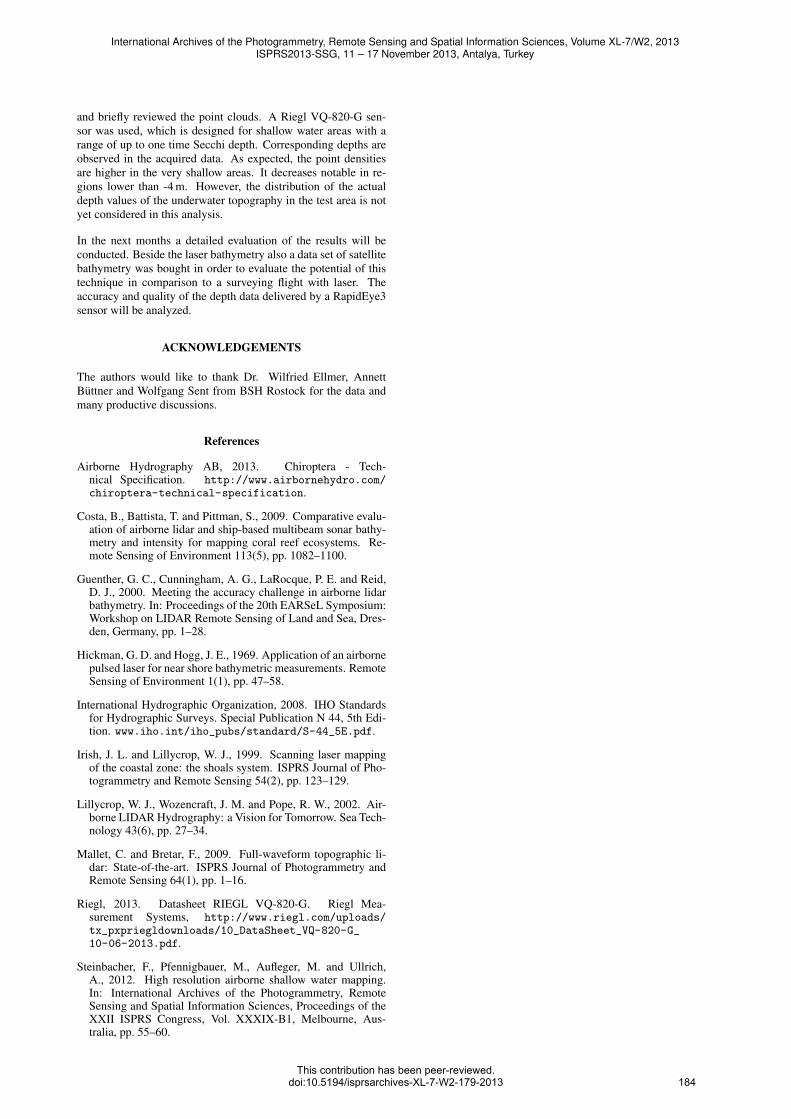
One notable effect are gaps in the point clouds close to the coastof Poel in both data sets. The HawkEye II used in the pilot studyas well as the Riegl VQ-820-G from the first project campaignwere not able to record data in nearly the same areas althoughit is quite shallow water with depth of approx. between 1 m and2.5 m. Such a situation is shown in Fig. 11.
The reason therefore might be a certain sea bed sediment havingbad reflectivity characteristics, or for example some kind of seagrass or Algae absorbing the laser pulse energy. Further investi-gations on this issue will be carried out.
5 CONCLUSIONS AND OUTLOOK
This paper presents the project ’Investigation on the use of air-borne laser bathymetry in hydrographic surveying’ from the Ger-man Federal Maritime and Hydrographic Agency (BSH) in co-operation with the Institute of Photogrammetry and GeoInforma-tion, Leibniz Universitat Hannover, Germany. The goal is to de-termine the limitations of the laser bathymetry (ALB) techniqueand possibly figure out potentially suitable areas for which ALBis more economical than ship-borne echo sounding. In the threeyears an annual surveying flight is conducted. At the current stateof the project we got the data obtained from the first campaign
Figure 11: Gaps in data sets of HawkEye (blue) and Riegl (yel-low).
International Archives of the Photogrammetry, Remote Sensing and Spatial Information Sciences, Volume XL-7/W2, 2013ISPRS2013-SSG, 11 – 17 November 2013, Antalya, Turkey
This contribution has been peer-reviewed.doi:10.5194/isprsarchives-XL-7-W2-179-2013 183
and briefly reviewed the point clouds. A Riegl VQ-820-G sen-sor was used, which is designed for shallow water areas with arange of up to one time Secchi depth. Corresponding depths areobserved in the acquired data. As expected, the point densitiesare higher in the very shallow areas. It decreases notable in re-gions lower than -4 m. However, the distribution of the actualdepth values of the underwater topography in the test area is notyet considered in this analysis.
In the next months a detailed evaluation of the results will beconducted. Beside the laser bathymetry also a data set of satellitebathymetry was bought in order to evaluate the potential of thistechnique in comparison to a surveying flight with laser. Theaccuracy and quality of the depth data delivered by a RapidEye3sensor will be analyzed.
ACKNOWLEDGEMENTS
The authors would like to thank Dr. Wilfried Ellmer, AnnettButtner and Wolfgang Sent from BSH Rostock for the data andmany productive discussions.
References
Airborne Hydrography AB, 2013. Chiroptera - Tech-nical Specification. http://www.airbornehydro.com/chiroptera-technical-specification.
Costa, B., Battista, T. and Pittman, S., 2009. Comparative evalu-ation of airborne lidar and ship-based multibeam sonar bathy-metry and intensity for mapping coral reef ecosystems. Re-mote Sensing of Environment 113(5), pp. 1082–1100.
Guenther, G. C., Cunningham, A. G., LaRocque, P. E. and Reid,D. J., 2000. Meeting the accuracy challenge in airborne lidarbathymetry. In: Proceedings of the 20th EARSeL Symposium:Workshop on LIDAR Remote Sensing of Land and Sea, Dres-den, Germany, pp. 1–28.
Hickman, G. D. and Hogg, J. E., 1969. Application of an airbornepulsed laser for near shore bathymetric measurements. RemoteSensing of Environment 1(1), pp. 47–58.
International Hydrographic Organization, 2008. IHO Standardsfor Hydrographic Surveys. Special Publication N 44, 5th Edi-tion. www.iho.int/iho_pubs/standard/S-44_5E.pdf.
Irish, J. L. and Lillycrop, W. J., 1999. Scanning laser mappingof the coastal zone: the shoals system. ISPRS Journal of Pho-togrammetry and Remote Sensing 54(2), pp. 123–129.
Lillycrop, W. J., Wozencraft, J. M. and Pope, R. W., 2002. Air-borne LIDAR Hydrography: a Vision for Tomorrow. Sea Tech-nology 43(6), pp. 27–34.
Mallet, C. and Bretar, F., 2009. Full-waveform topographic li-dar: State-of-the-art. ISPRS Journal of Photogrammetry andRemote Sensing 64(1), pp. 1–16.
Riegl, 2013. Datasheet RIEGL VQ-820-G. Riegl Mea-surement Systems, http://www.riegl.com/uploads/tx_pxpriegldownloads/10_DataSheet_VQ-820-G_10-06-2013.pdf.
Steinbacher, F., Pfennigbauer, M., Aufleger, M. and Ullrich,A., 2012. High resolution airborne shallow water mapping.In: International Archives of the Photogrammetry, RemoteSensing and Spatial Information Sciences, Proceedings of theXXII ISPRS Congress, Vol. XXXIX-B1, Melbourne, Aus-tralia, pp. 55–60.
International Archives of the Photogrammetry, Remote Sensing and Spatial Information Sciences, Volume XL-7/W2, 2013ISPRS2013-SSG, 11 – 17 November 2013, Antalya, Turkey
This contribution has been peer-reviewed.doi:10.5194/isprsarchives-XL-7-W2-179-2013 184