opportunities to enhance energy efficiency and...
TRANSCRIPT

National Centre for Engineering in Agriculture University of Southern Queensland Toowoomba
Opportunities to Enhance Energy Efficiency and Minimise Greenhouse Gases in Queensland’s
Intensive Agricultural Sector
Guangnan Chen, Paul Kupke and Craig Baillie
A Report for Queensland Farmers Federation (QFF)
NCEA Publication 1002801/1 10 June 2008

Disclaimer While the National Centre for Engineering in Agriculture and the authors have prepared this document in good faith, consulting widely, exercising all due care and attention, no representation or warranty, express or implied, is made as to the accuracy, completeness or fitness of the document in respect of any user's circumstances. Users of the report should undertake their own quality controls, standards, safety procedures and seek appropriate expert advice where necessary in relation to their particular situation or equipment. Any representation, statement, opinion or advice, expressed or implied in this publication is made in good faith and on the basis that the National Centre for Engineering in Agriculture, its agents and employees, and the Queensland Farmers Federation (the commissioning Agency) are not liable (whether by reason of negligence, lack of care or otherwise) to any person for any damage or loss whatsoever which has occurred or may occur in relation to that person taking or not taking (as the case may be) action in respect of any representation, statement or advice referred to above. Published 10 June 2008 by the National Centre for Engineering in Agriculture, Toowoomba. Material from this publication may not be used unless prior written approval has been obtained from the National Centre for Engineering in Agriculture and the Queensland Farmers Federation This document should be cited as follows: Chen, G., Kupke, P. and Baillie, C. (2008), Opportunities to Enhance Energy Efficiency and Minimise Greenhouse Gases in Queensland’s Intensive Agricultural Sector, National Centre for Engineering in Agriculture, Publication 1002801/1, USQ, Toowoomba Acknowledgments This project was funded by the Queensland Farmers Federation (QFF)

1
ACKNOWLEDGEMENTS
This project was funded by the Queensland Farmers Federation. The useful discussions and the assistance of QFF steering committee members and various farmers/producers involved in the case studies are greatly appreciated.
1002801 Opportunities to Enhance Energy Efficiency and Minimise Greenhouse Gases 2
ABSTRACT
On-farm energy efficiency is becoming increasingly important in the context of rising energy costs and concerns over greenhouse gas (GHG) emissions. Energy inputs represent a major and rapidly increasing cost to the producers in Queensland. This report presents a scoping study of opportunities to enhance energy efficiency and minimise GHG emissions in Queensland’s intensive agricultural sector. The aims of this research were to:
• Review and assess available tools and technologies for conducting on-farm operational energy assessments/audits
• Assess current practices in terms of energy efficiency • Identify opportunities to reduce operational energy inputs and impacts on
greenhouse gas emissions A significant literature review was conducted. It was found that a number of energy and greenhouse calculators have already been developed in Australia and overseas to estimate the energy uses and greenhouse gas emissions from agricultural systems. These include: USDA Energy Calculator, Alliant Energy Calculator, and EnergyCalc developed by NCEA. These softwares will need further development and will be very useful for conducting both level 2 and level 3 energy audits. To complement the energy calculation software, various hardware/technologies were also identified for undertaking field measurements. These include fuel flow meters, electricity power meters, data logging and monitoring equipment and various sensors for measuring temperature, pressure, torque, travel speed, and draft load etc. Because of the wide variety of agricultural machinery being used across the intensive agricultural sector, it may be difficult to prescribe a universal set of tools that will cover all the different operations. However, it is suggested that fuel flow meters, electricity power meters, and data loggers will be essential for all cases. A set of basic measurement tools may cost around $15,000~$20,000. For level 3 on-farm energy audits, it was found that pump efficiency can be relatively easily measured, with suitable standard protocols. As a result, a number of specialist companies have been set up to offer commercial consulting services in this area, particularly in the USA. In comparison, measuring tractor and engine performance for a level 3 audit is much more complicated, and will require substantial set-up and instrumentation. Because of this, performance measurement for tractors (ie the coupled tractor-implement systems) has not commonly been undertaken. Recently, commercial Tractor Performance Monitors (TPM) are becoming available. They are able to provide key energy and operation information such as engine speed, tractor forward speed, wheelslip, and fuel consumption rate etc. This can greatly assist tractor operators to monitor their fuel use and improve their operation, and therefore has the potential to significantly improve the operational fuel efficiency of many tractors. In this project, the previous version of EnergyCalc software is upgraded to include an additional higher order level above the current Cotton and Grains framework. The inclusion of this additional level has accommodated other industries included in this

1002801 Opportunities to Enhance Energy Efficiency and Minimise Greenhouse Gases 3
project and will also be extendable for future work. Other improvements to EnergyCalc included the refinements in user friendliness and increased data management capacities. Nine on-farm energy audits are conducted in this project, which include:
• Cotton × 2 • Sugar × 2 • Horticulture × 2 • Nursery × 2 • Prawn farm × 1
Two of these sites have also been upgraded to detailed level 3 audits, investigating specified processes of energy efficiency in water pumping and tractor operation. Analysis of data obtained from these case studies was undertaken to determine energy use and opportunities for improved energy efficiency. For these sites, energy uses were broken into different production processes. It was shown that energy uses vary significantly between different farms and different industries, ranging from $20.2/ha for sorghum production to $1305/ha for avocado production. The energy input cost for growing prawn was about $1525 per tonne of production. For the nursery industry, it was identified that heating is the most important energy user. Energy for irrigation/pumping was also found to be very important for all industries. This is particularly the case when complex multiple pumping is involved. For field work, the energy use by harvesters appeared to be very significant. When minimum tillage and controlled traffic are practiced, energy usage can be reduced by approximately 20%. It was demonstrated that considerable opportunities exist for the improvement of energy efficiency. It was shown that with suitable design improvement and engine speed adjustments, up to 10~50% of pumping energy can be realistically saved. Correct operation of tractors may also save up to 30% of fuel. It was suggested that any energy audit in agriculture in the future would best start from irrigation, as it consumes considerable proportion of on-farm energy cost. There is also relatively mature technology and successful examples available. Irrigation energy audits may also be combined with water efficiency audits using recently developed tools (eg, Irrigation Performance Audit and Reporting Tool) so that a combined service can be provided to interested farmers. It was identified that significant further research is required to conduct whole-farm energy audits. In addition to the practical difficulty in measuring tractor performance, there is currently a lack of systematic research for energy use in agriculture. As a result, there is currently a lack of quantified “rules of thumb” guides to estimate energy performance and return of energy improvement for different agricultural machinery. This is particularly important to reduce the costs of energy audits and ensure the quality of service. There is also a strong need to develop a detailed model report/manual so that effective and widespread energy audits in agriculture can take place.

1002801 Opportunities to Enhance Energy Efficiency and Minimise Greenhouse Gases 4
Significant work and case studies are also required in the individual industry so that sufficient data can be collected for the establishment of benchmarking energy use and the possible establishment of farm energy star-rating scheme in the future. From the current field work, it was found that some of the energy use data published previously may over estimate energy use by up to over 100%.

1002801 Opportunities to Enhance Energy Efficiency and Minimise Greenhouse Gases 5
TABLE OF CONTENTS
Acknowledgements........................................................................................................1 Abstract ..........................................................................................................................2 1 Introduction...........................................................................................................6 2 Queensland Intensive Agricultural Industries.......................................................9
2.1 Plant industries...............................................................................................9 2.2 Animal industries ...........................................................................................9
3 Benchmarking Energy Use Data.........................................................................10 3.1 Energy efficiency indicators ........................................................................10 3.2 Greenhouse gas emissions due to energy uses.............................................12
4 Current Tools and Energy Audit Methods..........................................................14 4.1 Definition of types of energy audits for agriculture.....................................14 4.2 Energy calculation software.........................................................................15 4.3 Greenhouse gas calculators..........................................................................16 4.4 Energy monitoring hardware .......................................................................17
5 Energy Audits in Australia and Overseas ...........................................................22 6 Energy Efficiency Framework............................................................................23 7 On-farm Energy Assessments.............................................................................24
7.1 Energy audit procedure ................................................................................24 7.2 Case studies..................................................................................................26
7.2.1 Level 2 Energy audits results...............................................................26 7.3 Detailed Assessments...................................................................................34
7.3.1 Detailed energy audit - pump testing ...................................................35 7.3.2 Detailed energy audit – tractor performance monitoring.....................37
7.4 Summary of case study results.....................................................................37 8 Conclusion ..........................................................................................................39
8.1 Major findings..............................................................................................39 8.2 Recommendations for further research........................................................40
9 References...........................................................................................................42 10 Appendix A – Framework and dropdown tables for EnergyCalc calculations ..45
10.1 Cotton and grains .........................................................................................45 10.2 Sugarcane.....................................................................................................49 10.3 Horticulture ..................................................................................................52 10.4 Nursary.........................................................................................................56 10.5 Aquaculture..................................................................................................59
11 Appendix B – Detailed individual case study reports.........................................62 11.1 Case study 1 (Cotton)...................................................................................62 11.2 Case study 2 (Cotton and Sorghum) ............................................................69 11.3 Case study 3 (Sugarcane).............................................................................77 11.4 Case study 4 (Sugarcane).............................................................................86 11.5 Case study 5 (Horticulture)..........................................................................95 11.6 Case study 6 (Horticulture)........................................................................101 11.7 Case study 7 (Nursery)...............................................................................110 11.8 Case study 8 (Nursery)...............................................................................116 11.9 Case study 9 (Aquaculture)........................................................................121

1002801 Opportunities to Enhance Energy Efficiency and Minimise Greenhouse Gases 6
1 INTRODUCTION
On-farm energy efficiency is becoming increasingly important in the context of rising energy costs and concern over greenhouse gas (GHG) emissions. Energy inputs represent a major cost and one of the fastest growing cost inputs to the producers in Queensland. In the United States, it has been found that the operations of food systems, including agricultural production, food processing, packaging, and distribution, account for 19% of America’s national fossil fuel energy use (Pimentel, 2006). Queensland’s intensive agricultural sector is characterized by mechanization – machinery is used to move water, distribute nutrients and modify the farming medium/environment (soil for crops and pasture, ponds for aquaculture, potting substrate for nursery production, litter for poultry, cooling of air for livestock). These machinery use a large amount of energy. For example, some heavy tractors or harvesters may use several liters of fuel per minute, which is an expensive exercise given the currently soaring price of fuels. The rising prices on energy are now one of the major challenges to agriculture industry in Queensland (Figs 1 and 2). Although the rapidly rising energy prices may have initially been viewed initially as temporary phenomenon, many people in the sector now agree that we are entering into an era of high energy prices. Continuous high fuel price, and the government’s target to reduce the GHG emissions 25 to 40% by 2020 makes the improvement of farming energy efficiency essential. After all, energy efficiency may be one of the fastest, cheapest and easiest ways to cut farmers energy expenditure and greenhouse gas emissions. Agriculture is also most severely affected by the global warming and climate change. It is likely that farmers in Queensland may face either an energy, water or carbon constrained future (Gurney et al, 2007). Rational and efficient use of energy is essential for sustainable development in agriculture.
Figure 1 Variations of NY crude oil prices ($/barrel) between 1996 and 2008
1002801 Opportunities to Enhance Energy Efficiency and Minimise Greenhouse Gases 7
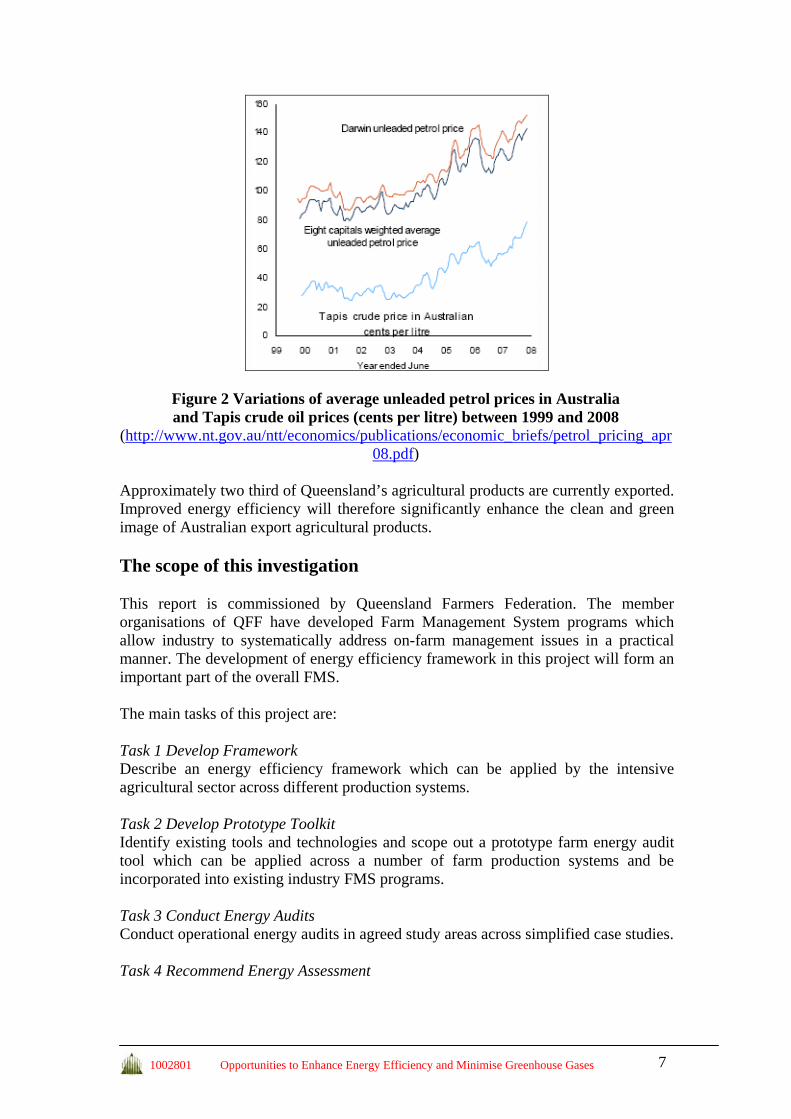
Figure 2 Variations of average unleaded petrol prices in Australia and Tapis crude oil prices (cents per litre) between 1999 and 2008
(http://www.nt.gov.au/ntt/economics/publications/economic_briefs/petrol_pricing_apr08.pdf)
Approximately two third of Queensland’s agricultural products are currently exported. Improved energy efficiency will therefore significantly enhance the clean and green image of Australian export agricultural products. The scope of this investigation This report is commissioned by Queensland Farmers Federation. The member organisations of QFF have developed Farm Management System programs which allow industry to systematically address on-farm management issues in a practical manner. The development of energy efficiency framework in this project will form an important part of the overall FMS. The main tasks of this project are: Task 1 Develop Framework Describe an energy efficiency framework which can be applied by the intensive agricultural sector across different production systems. Task 2 Develop Prototype Toolkit Identify existing tools and technologies and scope out a prototype farm energy audit tool which can be applied across a number of farm production systems and be incorporated into existing industry FMS programs. Task 3 Conduct Energy Audits Conduct operational energy audits in agreed study areas across simplified case studies. Task 4 Recommend Energy Assessment

1002801 Opportunities to Enhance Energy Efficiency and Minimise Greenhouse Gases 8
Recommend a process to establish an industry energy auditing advisory service or consultancy to conduct on-farm energy assessments and/or to develop strategies for farmers to reduce energy input costs.

1002801 Opportunities to Enhance Energy Efficiency and Minimise Greenhouse Gases 9
2 QUEENSLAND INTENSIVE AGRICULTURAL INDUSTRIES
Farming is one of Queensland’s most important industries. Currently, the member organisations of QFF include cotton, sugarcane, fruit and vegetables, dairy, nursery, and aquaculture industries. QFF collectively represents more than 13,000 primary producers across the State. Currently, farms and grazing properties cover 87% of Queensland’s land area (http://www.qff.org.au/farming.asp?dbid=6). Farming also underpins the food processing industry in Queensland. It is reported that nearly one in five jobs and one in five families in Queensland depend on the rural sector for employment. Each year, Queensland farming sector produces about $11 billion of products (the farm-gate value). Most of these products are exported.
2.1 Plant industries Every year, food, fibre and lifestyle plants contribute close to $7 billion to the Queensland economy. Broadacre field crops are estimated to be worth about $675 million (excluding sugarcane). Wheat is the major winter crop grown in southern and central Queensland where about 800,000 ha is harvested annually. State production averages approximately 1,000,000 tonnes. The gross value of cotton production in 2006-07 was estimated as $120 million. This was less than half the initial forecast of $250 million, because of the severe drought. This value was also 70% lower than the $395 million for 2005-06. Sugar is also an important industry for Queensland, which produces 95% of Australia’s raw sugar. In 2006, about 37 million tonnes of sugarcane was harvested in Queensland. The gross value of production (GVP) of lifestyle horticulture sector in Queensland was estimated as $1.22 billion for 2006-07.
2.2 Animal industries Queensland supports major animal industries such as beef, dairy, sheep, pigs, poultry and aquaculture. Every year, Queensland exports $3.3 billion of beef products. At present, it is estimated that Queensland has about 885 dairy farms, owning 150,000 cows, and producing 600 million litres of milk which is worth some $210 million a year. There are also between 4 and 5 million sheep in Queensland. The total value of the Queensland aquaculture industry is estimated as $70.5 million in 2005-06.

1002801 Opportunities to Enhance Energy Efficiency and Minimise Greenhouse Gases 10
3 BENCHMARKING ENERGY USE DATA
3.1 Energy efficiency indicators Extensive research has been conducted on energy use and conservation both in agriculture (Pellizzi et al, 1988; Stout, 1989; Tullburg and Wylie, 1994) and in other industries (Eastop and Croft, 1990). Table 1 summarizes the published energy use data reported for different crops in different countries. At the current market condition, 1 GJ of energy would typically cost Australian farmers $20-25. It can therefore be seen from Table 1 that energy inputs represent a major cost to the producer within most production systems. Table 1: Some of the key national or state averaged energy performance
data from the published literatures
Crops
Direct Energy Input
(GJ/ha)
Indirect Energy Input
(GJ/ha)
Total Energy Input
(GJ/ha)
Researchers
Country
Wheat 2.5 ~ 4.3 Pellizzi et al (1988) Europe Wheat 16 ~ 32 Tsatsarelis (1993) Greece Maize 4.7~5.0 Pellizzi et al (1988) Europe
Conventional arable
5.8 15.0 20.8 Cormack (2000) UK
Organic arable 3.8 2.3 6.1 Cormack (2000) UK Rice 64.89 Pretty (1995) USA
Cotton 21.14 28.59 49.73 Yilmaz et al (2005) Turkey Cotton 82.6 Tsatsarelis (1991) Greece Cotton 3.7-15.2 Chen & Baillie (2007) Australia
Pea 2.5~5.4 Gulden & Entz (2005) Canada Dairy pasture 8.2 10.0 18.2 Wells (2001) NZ
Grape 14.6 9.0 23..6 Ozkan et al (2007) Turkey Greenhouse
grape 14.9 9.6 24.5 Ozkan et al (2007) Turkey
Greenhouse tomato
53.4 53.3 106.7 Hatirli et al (2006) Turkey
Lemon ~ 31 63.0 Ozkan et al (2004) Turkey Orange ~ 30 61.0 Ozkan et al (2004) Turkey
Mandarin ~ 25 48.8 Ozkan et al (2004) Turkey Apple 31.7 29 50.7 Strapatsa et al (2006) Greece
Organic vegetable
6.8 3.0 9.8 Cormack (2000) UK
Pond fish 9.1 116.1 125.2 Singh & Pannu (1998) India
Operational energy use is however only one aspect of a farming operation’s total energy use, because energy is not only used in planting, cultivating, and harvesting of crops and animal products, but also used in the manufacture and transport of inputs

1002801 Opportunities to Enhance Energy Efficiency and Minimise Greenhouse Gases 11
such as pesticides, fertilisers, and machinery and in processing, packaging, and distribution of final products. It is estimated that with the current technology, the production of one kg of nitrogen fertiliser would require the energy input equivalent to 1.5-2 kg of fuel, while 1 kg of pesticides would require the energy input equivalent to up to 10 kg of fuel. It is therefore important to consider not only agriculture production but also post-harvest practices and the embodied energy. The latter may account for up to 50-70% of the total energy input in agricultural production. Grains Total energy inputs for soft winter wheat production in Greece were found to be between 16 and 26 GJ/ha (Tsatsarelis, 1993). Extra energy inputs of 3 GJ/ha and 1.5-3 GJ/ha will be required for straw harvesting, and for irrigation. The major energy inputs were found to be fertilizers and fuel, amounting to 81–84% of the total inputs. Wheat yields ranged between 2.5-6 t/ha. Pellizzi et al (1988) found that in Europe, for wheat-like cereals, 55-65% of the direct field energy consumption was accounted to soil tillage, while harvesting took about 25%. They also reported that the range of field energy consumption for wheat-like cereals varied from 2.5 GJ/ha to 4.3 GJ/ha. For maize, this was estimated to be between 12.6 GJ/ha to 16.2 GJ/ha including drying which alone would require 50 to 60% of the field fuel consumption. The average percentage contribution of the direct energy input for different farming processes in Europe is shown in Fig.3 (Pellizzi et al, 1988).
Cultivation Practices (20%)
Tillage (38%)Harvesting (32%)
Transports 5%Irrigation 5%
Figure 3 Direct on-farm energy inputs, Europe (Pellizzi et al, 1988)
By comparison, it was found that rice production in the United States requires a total energy input of 64.89 GJ/ha for a yield of 5.8t/ha or 11.19 GJ energy input for per tonne of grain produced (Pretty, 1995). Organic crops and legume crops (eg pea) are found to use much less (total) energy because of the reduced nitrogen fertilizer requirement (Gulden and Entz, 2005). Cotton

1002801 Opportunities to Enhance Energy Efficiency and Minimise Greenhouse Gases 12
Singh (2002) found that cotton has the highest energy usage among wheat, mustard, maize and cluster bean. Yaldiz et al. (1993) reported that fertilizers and irrigation energy dominate the total energy consumption in Turkish cotton production. Yilmaz et al (2005) showed that the energy intensity in agricultural production was closely related with production techniques. He estimated that cotton production in Turkey consumed a total of 49.73 GJ/ha energy, consisting of 21.14 GJ/ha (42.5%) direct energy input and 28.59 GJ/ha (57.5%) indirect energy input. Total sequestered energy in Greece was found to be 82.6 GJ/ha with irrigation and fertilizers as major inputs. Cotton yield was 1024 kg/ha lint and 2176 kg/ha seed. A recent study by Chen & Baillie (2007) showed that the direct energy inputs for cotton production in Australia ranged from 3.7 to 15.2 GJ/ha. Dairy pasture Through the collection and analysis of energy data of 150 dairy farms, Wells (2001) estimated that the total energy requirements of the ‘national average’ dairy farm in NZ were about 18.2 GJ/ha, of which fuel contributes (20%), fertiliser (35%), electricity (25%), capital (13%) and other indirect (7%). He also found that (total) energy uses vary significantly between different farms. He attributed this variation to the differences in the use of fertilisers and the use of electricity for irrigation pumping. Horticulture/viticulture (fruit, vegetable and nursery) A study was recently undertaken to determine the energy used for greenhouse heating in the NZ vegetable and flower industry (Barber, 2004). It was found that average energy use in the North Island is 1,210 MJ/m2 (12.1 GJ/ha) while it is 1,830 MJ/m2 (18.3 GJ/ha) in the South Island. Energy use was also strongly influenced by management practice, regional location, the type of greenhouse, greenhouse age and the type of crop being grown. Generally, smaller operations were less energy intensive, possibly due to capital constraints. In comparison, the total energy input for greenhouse grape production in Turkey was found to 24.5 GJ/ha, with 60.76% being direct energy use. For open-field grape production, Ozkan et al (2007) found that a total of 23.64 GJ/ha energy was consumed, of which 61.97% was direct and 36.88% was in indirect energy form. Aquaculture The total energy input in fish farming in India was found by Singh and Pannu (1998) to vary between 86.4-162.5 GJ/ha with an average value of 125.2 GJ/ha. Excluding the energy associated with initial pond construction and water filling operations, the actual energy required in fish production and harvesting was found to be in the range of 5.5-14.1 GJ/ha with an average value of 9.1 GJ/ha. The production of fish varied between 4050-4520 kg/ha with an average value of 4291 kg/ha.
3.2 Greenhouse gas emissions due to energy uses With the increased community concern on global warming and climate change, the greenhouse gas emissions from the fuel use of agricultural production will also need

1002801 Opportunities to Enhance Energy Efficiency and Minimise Greenhouse Gases 13
to be evaluated. In this report, the algorithms as outlined in the Australian Greenhouse Office (AGO) Factors and Methods workbook (2008) will be adopted http://www.greenhouse.gov.au/workbook/index.html:
GHG Emissions (kg CO2 equivalent) = Q × EF in which Q is the quantity of fuel (L) or electricity (kWh) used. EF is the relevant emission factor given below (Table 2).
Table 2 CO2 Emission factors for Queensland
Energy sources
Emission Factor kg CO2 equivalent per litre diesel/petrol/LPG or per kWh electricity
Diesel 2.9 Petrol 2.5 LPG 2.56
Electricity 1.04
Therefore Total greenhouse gas emissions of the farm due to energy use (kg CO2)
= 2.9 * Total diesel use (Litre) + 2.5 * Total petrol use (Litre) + 2.56 * Total LPG use (Litre) + 1.04 * Total electricity use (kWh)
Note that the above calculation has only included the greenhouse gas emissions from the direct energy use, and has not included the (biological) effect due to soil tillage/disturbance and applications of nitrogen fertilizer (http://www.isr.qut.edu.au/tools/index.jsp). The latter will change significantly with both time and locations.
A recent study by Chen & Baillie (2007) showed that the greenhouse gas emissions due to energy uses (alone) for cotton production in Australia may be up to 1404 kg CO2 equivalent /ha. This will cost $42/ha if in the future, a carbon tax of $30 per tonne is introduced (http://www.dpi.wa.gov.au/mediaFiles/ls_CAGAshton-GrahamGarnaut.pdf). .

1002801 Opportunities to Enhance Energy Efficiency and Minimise Greenhouse Gases 14
4 CURRENT TOOLS AND ENERGY AUDIT METHODS
Underpinning the energy audit assessment process is the identification and development of a set of toolkits (software and hardware) that can be applied to different farm production systems. From the literature search and industry interviews, following software and hardware tools are found available for energy and greenhouse gas calculations.
4.1 Definition of types of energy audits for agriculture Energy audits are a crucial part of the energy and environmental management process. Energy audits refer to the systematic examination of an entity, such as a firm, organisation, facility or site, to determine whether, and to what extent, it has used energy efficiently. They determine how efficiently energy is being used, identify energy and cost saving opportunities and highlight potential improvements in productivity and quality. They may also assess any potential energy savings, for example, through fuel switching, tariff negotiation and demand-side management. The terms used to describe different levels of energy audits in this report have following specific meanings: Energy Audit Method Level 1 Preliminary Audit (Overview of the Total Energy Consumption On-site, Whole Farm Approach) This is the simplest and cheapest form of energy audit. Whole farm approach is usually adopted. This involves collating all the energy use data from the farm, including the total fuel (diesel, petrol and other fuels) and the total electricity energy consumed. It is generally expected that these figures will be available from the farm receipts. The total energy uses are then divided by the total farm production (eg, head of cows, bales of cotton, tonnes of wheat) to derive the energy insensitivities of the site. Usually no additional tools are required for this level of audit. Energy Audit Method Level 2 Standard/General Audit (Itemised Farm Approach) Level two energy audits generally involve breaking down the total energy usage on the farm into energy used in each farming operation. A level 2 will usually consist of a bowser and electricity meter-box type measurement for all processes and with specific “spot” measurements for the key processes. It may also involve considerable farmers’ interviews to identify the major energy usuage. Energy Audit Method Level 3 Detailed Audit (Specific Operation Investigation) The aim of level three energy audits is to investigate ways to improve the efficiency of a specific operation. Typically, level 3 audits would focus where the greatest energy consumption has been identified from level 2. This will usually involve a range of different sensors to measure the performance of different machines. Examples of

1002801 Opportunities to Enhance Energy Efficiency and Minimise Greenhouse Gases 15
sensors used may include (irrigation head) pressure, flow rate, engine RPM, tractor travel speed, torque, load and temperature etc. A data logger may be required to record the data for a considerable period of time. A level 3 energy audit may be necessary to certify a product/farming operation and to establish the energy-star rating and labelling scheme. It is noted that the system suggested above for agriculture is similar to that used within the building industry (Australian/New Zealand AS/NZS 3598:2000). However, some differences do occur at the detail in which some measurements are conducted, particularly for a level 3 audit. This is mainly because:
• Agriculture is much more significantly influenced by seasonal factors than buildings. Energy use profile for agriculture may vary on both annual and daily bases.
• Much more diverse types of machinery are used in agriculture than by the building services system, so it is more difficult to identify the energy saving opportunities for these machinery. Different machines may be used at different times.
• Fuel use, rather than electricity, is most important for agriculture. • On-site operational energy is not necessarily the dominate energy user for
agriculture. • There is currently a lack of systematic research for energy use in agriculture.
As a result, there is currently a lack of “rules of thumb” for the calculations of the return of energy improvement and investment for agriculture (http://www.buildingcommission.com.au/resources/documents/Energy_Efficient_Strategies_Report.pdf). There is also an urgent need to develop a detailed model report/protocol/template so that effective and widespread energy audits can take place in agriculture (http://www.eecabusiness.govt.nz/emprove/emprove-library/implementation/conduct-an-audit/guide/model-audit-03.pdf; http://www.environment.gov.au/settlements/challenge/members/energyaudittools.html). This is necessary to reduce the costs of energy audits and from the quality assurance ponit of view if in the future an industry energy auditing advisory service or consultancy is to be introduced on any large scale.
4.2 Energy calculation software USDA Energy Calculador http://energytools.sc.egov.usda.gov In order to increase energy awareness in agriculture and to help farmers select the most suitable farming systems, four separate energy calculators were developed by United States Department of Agriculture (USDA) for estimating the energy uses in animal housing, irrigation, nitrogen, and tillage. In this way, the average diesel fuel use and costs in the production of key crops in different parts of USA can be estimated and compared. It is however found that these calculators do not explicitly relate the energy use to the particular farming methods or per unit of work. It can therefore only estimate the average energy use for the above four (large) operations in a given region.
1002801 Opportunities to Enhance Energy Efficiency and Minimise Greenhouse Gases 16
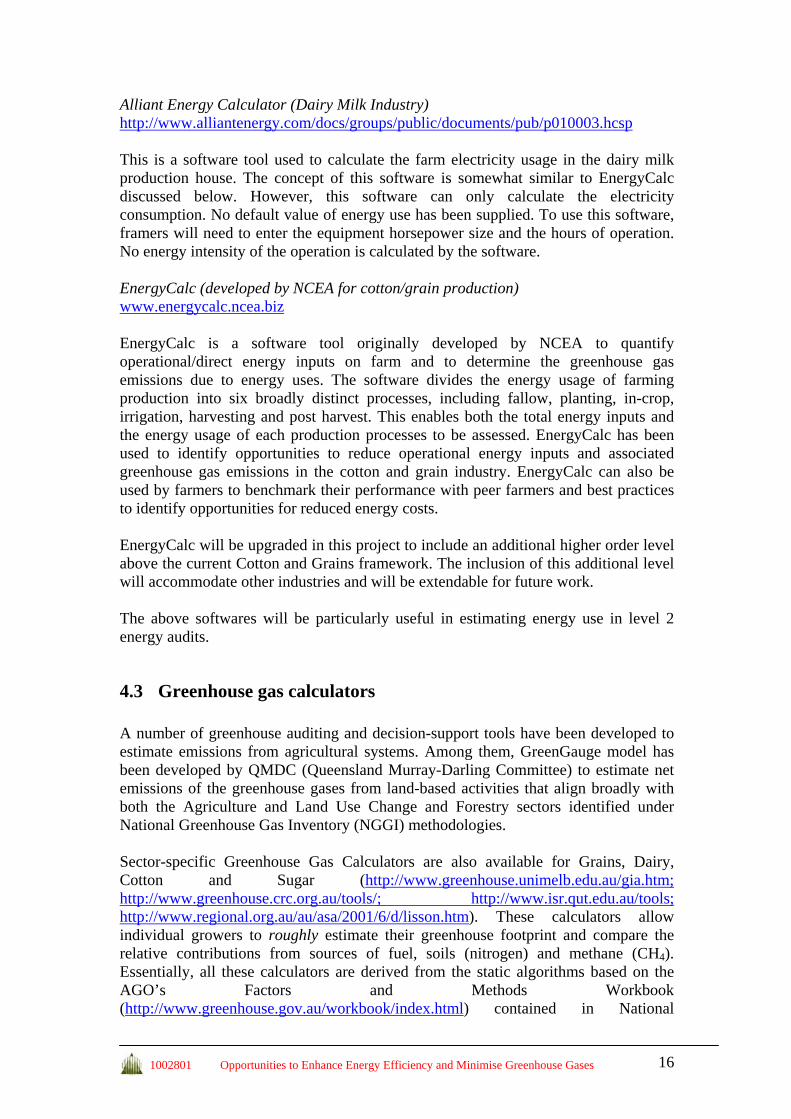
Alliant Energy Calculator (Dairy Milk Industry) http://www.alliantenergy.com/docs/groups/public/documents/pub/p010003.hcsp This is a software tool used to calculate the farm electricity usage in the dairy milk production house. The concept of this software is somewhat similar to EnergyCalc discussed below. However, this software can only calculate the electricity consumption. No default value of energy use has been supplied. To use this software, framers will need to enter the equipment horsepower size and the hours of operation. No energy intensity of the operation is calculated by the software. EnergyCalc (developed by NCEA for cotton/grain production) www.energycalc.ncea.biz EnergyCalc is a software tool originally developed by NCEA to quantify operational/direct energy inputs on farm and to determine the greenhouse gas emissions due to energy uses. The software divides the energy usage of farming production into six broadly distinct processes, including fallow, planting, in-crop, irrigation, harvesting and post harvest. This enables both the total energy inputs and the energy usage of each production processes to be assessed. EnergyCalc has been used to identify opportunities to reduce operational energy inputs and associated greenhouse gas emissions in the cotton and grain industry. EnergyCalc can also be used by farmers to benchmark their performance with peer farmers and best practices to identify opportunities for reduced energy costs. EnergyCalc will be upgraded in this project to include an additional higher order level above the current Cotton and Grains framework. The inclusion of this additional level will accommodate other industries and will be extendable for future work. The above softwares will be particularly useful in estimating energy use in level 2 energy audits.
4.3 Greenhouse gas calculators A number of greenhouse auditing and decision-support tools have been developed to estimate emissions from agricultural systems. Among them, GreenGauge model has been developed by QMDC (Queensland Murray-Darling Committee) to estimate net emissions of the greenhouse gases from land-based activities that align broadly with both the Agriculture and Land Use Change and Forestry sectors identified under National Greenhouse Gas Inventory (NGGI) methodologies. Sector-specific Greenhouse Gas Calculators are also available for Grains, Dairy, Cotton and Sugar (http://www.greenhouse.unimelb.edu.au/gia.htm; http://www.greenhouse.crc.org.au/tools/; http://www.isr.qut.edu.au/tools; http://www.regional.org.au/au/asa/2001/6/d/lisson.htm). These calculators allow individual growers to roughly estimate their greenhouse footprint and compare the relative contributions from sources of fuel, soils (nitrogen) and methane (CH4). Essentially, all these calculators are derived from the static algorithms based on the AGO’s Factors and Methods Workbook (http://www.greenhouse.gov.au/workbook/index.html) contained in National

1002801 Opportunities to Enhance Energy Efficiency and Minimise Greenhouse Gases 17
Greenhouse Gas Inventory (NGGI). These values can however vary very significantly with variables such as time, temperature, moisture content, and locations. Many farmers and landholders in Australia now recognise and are increasingly interested in the potential carbon offset/sink effect from changing agricultural practices, particularly by changing soil and vegetation management practice. A simple and reliable measurement method will therefore need to be developed to accurately quantify this effect to include it in the future carbon trading scheme http://www.newfarm.org/depts/NFfield_trials/2007/1116/ziegler.shtml. It is reported that New Zealand Government will soon introduce a scheme that will include agriculture in its emissions trading system from 2013 (http://www.beehive.govt.nz/speech/launch+emissions+trading+scheme). Sale of nitrogenous fertilisers is initially targeted.
4.4 Energy monitoring hardware To complement the energy calculation software, various hardware/technologies have also been identified in this project to conduct field measurements. These technologies include fuel flow meters, electricity power meters, data logging and monitoring equipment and various sensors including temperature, pressure, torque, travel speed, load and fuel flow rate. These parameters can then be used to calculate, for example, Pump Efficiency and Tractive Efficiency to determine the performance of these machinery. Other parameters may also be required for other specific machinery and operations. Low pumping efficiency has been identified as a widespread irrigation problem, and is often associated with poor system design. Pumps poorly matched to their flow rate and working pressure lead to low pumping efficiency and higher costs. Neglected maintenance such as water leaks, missing sprinklers, worn pump bearings, plugged sediment screens and improperly designed valves or fittings can also increase pressure and fuel costs significantly. To achieve best performance, correct engine speed and gear selection is required for tractors. Some of the common equipment for measuring individual parameters are listed below. Determination of Electricity Usage
• Electrical meter or sub-meter (box) installed on the site • Hand-held electrical power meter (eg, AEMC single-phase or three-phase
power quality analyzer) which can measure, calculate and store to memory the main parameters of electrical supply networks such as phase-to-neutral voltage, current, frequency, power (active, reactive and apparent), power factor, energy and quality parameters (harmonics, flickers, etc.). The measurement error of these instruments is typically less than 1.5%.
Determination of Fuel Usage
• Vehicle fuel/usage log book • (Portable) fuel flow metre to measure fuel input at every fill • Fuel flow sensors fitted to the tractor (eg McNaught A110 or Navman 3200
fuel system)

1002801 Opportunities to Enhance Energy Efficiency and Minimise Greenhouse Gases 18
• Tractor on-board monitor with instantaneous fuel usage readout (eg, John Deere 30 series tractor used for Level 3 case study in this project)
Figure 4 Electricity and diesel flow measurement meters
Figure 5 Portable ultrasonic flowmeter
Figure 6 Pressure head measurement

1002801 Opportunities to Enhance Energy Efficiency and Minimise Greenhouse Gases 19
Hydraulic System
• Pump flow: eg, by portable ultrasonic flowmeter (measurement error lower than 2.5%).
• Pressure head: eg, by pressure transducer (measurement error lower than 1%). Tractor and Engine
• Drawbar pull can be measured by using a load cell. • A radar velocity sensor can be used to measure the tractor forward velocity • A magnetic pickup or a revolution counters can be used to measure the engine
rotation speed • Engine output torque can be measured by using a wire-less inductive torque
meter. • Fuel consumption is often measured by means of a fuel flow meter. This flow
meter may be installed between the transfer pump and the filters in the diesel fuel supply line.
Among these sensors, it is found that the most involved, most costly, and least universal installations are the drive torque and fuel use measurement systems. Additional Monitoring Sensors for Other Individual Equipment
• For example, for monitoring crop dryer performance, additional sensors required are temperature, humidity, moisture content meters and airflow velocity measurement (Chen et al 2001).
Instead of having to manually assemble the toolkits individually (which may not be easy for an average agricultural extension officer), several monitoring systems have now been developed with automatic data logging capacity. This is also particularly suitable and convenient for research or level 3 energy audits.
Figure 7 A Tractor Performance Monitor
• Tractor Performance Monitors (TPM) are increasingly being supplied as
standard tractor electronic equipment, or factory-fitted option for commercial tractors. They are able to provide key energy efficiency information such as engine speed, tractor forward speed, wheelslip, and fuel consumption rate etc, so that the operator is continually provided with useful information regarding the tractor’s performance. Using these equipment, the operators can have the

1002801 Opportunities to Enhance Energy Efficiency and Minimise Greenhouse Gases 20
ability to configure and operate their equipment (eg Gear Up - Throttle Back) to provide the most effective and efficient operation. Examples include the John Deere 30 series tractor used for Level 3 case study in this project. Tractor Performance Monitors will be very useful for both level 2 and level 3 energy audits, although these systems currently do not have the capacity to measure the tractor drawbar force and engine torque.
• Pressurised Irrigation Monitoring System (PIMS). http://www.ncea.org.au/FactSheets/WirelessPIMS.pdf PIMS is developed by NCEA to continuously monitor the performance of a complete irrigation system, including water pump performance, storage water level, water quality, bore water level, water flow, irrigator applicator pressure, fuel consumption and power use over single or multiple irrigation events. This system is also designed to have the ability to provide real-time display and logging capacity. In addition, the PIMS wireless system also offers a flexible approach to telemetry. It can be operated with short distance telemetry modules such as a “Zigbee” unit (up to 2.5 km) or a long range unit such as “Xtend” (up to 20 km). The system is battery operated and can be deployed for weeks depending on the logging interval. They can be deployed indefinitely with a small solar cell. The system is currently in final development stage.
• P22 Thermodynamic Pump Efficiency and Flow Rate Monitor. http://www.pumpmonitor.com/ The P22 relies primarily on temperature and pressure measurements to calculate pump efficiency. Using the “indirect” thermodynamic method, it is claimed that the P22 Pump Monitor is able to provide high accuracy of pump performance monitoring whilst being quick and easy to apply. Currently, the basic version of this system costs some $35,600, plus $8,000 for training (3 days) on site.
Overall, it can be found that the pump efficiency can be relatively easily measured, with suitable standard protocols. With suitable expertise/training, a set of DIY basic measurement tools may cost around $15,500. These include one electrical network analyser ($2,500), one ultrasonic flow meter ($10,000), and one pressure transducer ($500), two fuel flow meters ($500×2), and one datalogger ($1,500). Several specialist companies have now also been set up to offer commercial consulting services in this area. It has been reported in the USA that energy efficiency audits on irrigation systems have on average identified savings of at least 10% of the energy bill – and in many instances up to 40~50%. Very often, the irrigators who owned these inefficient systems were also unaware of any problems. In comparison, measuring tractor and engine performance for a level 3 audit is a more challenging undertaking and will require substantial set-up and instrumentation. Because of this, performance measurement has not commonly been done on customer owned tractors operating in their specific conditions. Despite this, several tractor monitoring systems have been developed/assembled by various researchers in South Africa (by ARC Institute for Agricultural Engineering) and New Zealand (Yule et al 1999) to investigate in-field performance of an agricultural tractor. Rather than directly measuring the drawbar tillage force, a tillage-force measuring system was built with transducers in the three-point hitch mechanism (Bentaher et al, 2008). It is

1002801 Opportunities to Enhance Energy Efficiency and Minimise Greenhouse Gases 21
shown that the developed system can readily be applied in studies to minimize tillage energy consumption. For other machinery such as grain dryer or cold store, specific equipment will be needed. But as a minimum, these will include an electricity power or fuel meter, temperature, pressure or flowrate sensors and data logger etc. Some specific software for analysing specific equipment (eg, cold store) may also be used.

1002801 Opportunities to Enhance Energy Efficiency and Minimise Greenhouse Gases 22
5 ENERGY AUDITS IN AUSTRALIA AND OVERSEAS
A number of Energy or Eco-efficiency assessments have previously been conducted in Australia by various State Environmental Protection Agencies, covering a range of agricultural and food processing industries. Although summary reports describing the measures implemented and the expected payback periods can still be found (http://www.epa.qld.gov.au/environmental_management/sustainability/industry/case_studies), unfortunately, the full reports describing the detailed monitoring data and data analyses are not available any more. In the United States, since 1988, NCAT (National Center for Appropriate Technology, http://attra.ncat.org/energy.php) has conducted commercial energy efficiency audits on over 400 irrigation systems (http://attra.ncat.org/attra-pub/energytips_irrig.html). In the vast majority of these cases, it was identified that at least one equipment change or repair that would quickly pay for itself in energy savings alone. It was also found that most irrigation systems are not as efficient as they should be. For example, a Kansas study found that, on average, irrigation systems use about 40 percent more fuel than they would when properly sized, adjusted, and maintained. A study in Colorado, Wyoming, Nebraska, and other states also found that, on average, about 25 percent of the electrical energy used for irrigation pumping was wasted due to poor pump and motor efficiency (Loftis and Miles, 2004). Pathak and Bining (1985) found that savings of over 50% in the consumption of diesel fuel in irrigation and considerable savings in electric energy and fertilizers were feasible through improvement in the quality and maintenance of irrigation equipment and improved water and fertilizer management practices. Installation of variable speed drives (VSDs) on pumps and other equipment were also found to be effective in many situations. For tractor performance, for the reasons discussed in Section 4.4, there was no documented commercial energy audit for tractor operations. It is also noted that the reports of both the standard Nebraska Tractor Test Laboratory (NTTL) testing and Organization for Economic Cooperation and Development (OECD) testing for tractors (http://tractortestlab.unl.edu/testreports.htm) have serious limitations, because both testing schemes only measure drawbar performance on a concrete surface, which requires some very considerable interpretation of data before it can be used to predict performance on typical agricultural field conditions. The concept of calculating tractive efficiency (the ratio of drawbar power to wheel axle power) is also limited in use, as it is not directly related to the total power consumed (ie, the loss associated with the gear and transmission systems is not taken into account in this calculation).

1002801 Opportunities to Enhance Energy Efficiency and Minimise Greenhouse Gases 23
6 ENERGY EFFICIENCY FRAMEWORK
In this chapter, an energy efficiency framework is developed based on the previous model proposed for cotton and grain. An additional level above the current cotton/grain level is therefore added to EnergyCalc to reflect the other commodity groups (i.e. Sugarcane, Horticulture, Nursery and Prawns) of QFF and therefore make the framework more generic and extendable to other industries. As shown in the Appendix A, significant changes are required for the framework for prawns and nursery industry.
Queensland Rural Industries
Cotton Sugar Horticulture Nurseries Aquaculture
Farming Process
Farming Process
Farming Process
Farming Process
Farming Process
Farming Process
Farming Process
Farming Process
Farming Process
Farming Process
Farming Process
Farming Process
Farming Process
Farming Process
Farming Process
Farming Process
Farming Process
Farming Process
Farming Process
Farming Process
Figure 8 The new energy efficiency framework which include other commodity groups
During this project, a number of other issues/improvements have also been identified for the original version of EnergyCalc, in order to increase the software flexibility and capacity. These include the ability to export the data to csv files and production of a pre-formatted report in PDF for grower feedback. In the future, it is suggested that consideration should be given to enable EnergyCalc be both PDA and off-line accessible. The software may also be linked to other Greenhouse Gas Calculators or Farm Management/Accounting Tools or GPS packages. The accuracy of the estimates of energy use for different work will also need to be verified for the Australian condition through a rigorous monitoring program. This is essential if this software is to be confidently used in an energy audit.

1002801 Opportunities to Enhance Energy Efficiency and Minimise Greenhouse Gases 24
7 ON-FARM ENERGY ASSESSMENTS
During the months of March and April 2008, energy audits were conducted on a range of farming practices across South East Queensland. These energy audits were conducted as part of a scoping study to develop a framework for conducting energy audits across the range of farming practices.
7.1 Energy audit procedure
Level 2 Audits A Level 2 energy audit is a desk top study of the energy usage breakdown in a farming operation. It aims to itemise the energy usage for each operation of the farm. It uses easily available data either gained from the site or through literature. A Level 2 audit aims to reach an accuracy of ±20%. Level 2 audits were conducted on each of the sites visited. However on all sites except aquaculture they were later superseded by a Level 3 audit on selected items. Level 2 audits will generally involve the auditor undertaking a site visit. During this visit, the energy uses of different operations are recorded and discussed. The site representative will be asked what the biggest energy usage/concerns are. These are noted by the auditor as well as any other site specific information that could be useful. Generally the audit will include a tour of the site to allow the auditor to gain a high level of understanding of the practices undertaken at the site. During the tour of the site, relevant information is collected. This may include electric motor sizes on pumps and other equipment, tractors and vehicles used as well as any other data the site representative believes will be useful to the auditor. Either during the energy audit or through subsequent correspondence with the site representative, the auditor will collect all the relevant information to evaluate the total energy usage and production on the site. There are 4 main categories of information that are useful in the energy audits of farming operations. These are: area, time, volume and distance. Area measurements are generally used for tractor field operations. The auditor needs to compile figures for the amount of fuel used per hectare and the amount of hectares covered by the operation. The fuel used per hectare may be sourced directly from the site representative, or through calculations using some basic inputs from the operator or from literature if it is available. The basic inputs for the calculations include the tractor engine power, work load, speed of operation, width of operation and field work efficiency which takes into account turning and filling of the implement. The figures collected are used to calculate the amount of fuel used during the operation. Time measurements are used to calculate the hours of vehicle operation, as well as electrical motors. The auditor needs to determine the amount of hours a unit will perform per season. The vehicle hour figures are used with a fuel usage per hour

1002801 Opportunities to Enhance Energy Efficiency and Minimise Greenhouse Gases 25
figure which can usually be sourced from literature to calculate the total L of fuel used by the vehicle during the season. Electrical motors are generally estimated by asking the amount of hours per day the unit is operated for, and how many months a year the season lasts for. It is important to differentiate between operations which run 7 days a week and operations which are used for a 5 day working week. The electrical motor hours are combined with the kW rating of the motor to determine a kWh total for the motor during the season. Volume measurements are used for pumping and irrigation operations. The auditor needs to determine the volume of water pumped, and the flow rate of the water pumped. The auditor will also require the engine size if it is a fuel engine, or motor rating if it is electric. These values are used to determine the total L or kWh used in pumping and irrigation operations. Distance measurements are used for vehicles, the auditor requires the number of km travelled in a season, the amount of fuel used per km which is generally available from literature. These figures are then used to calculate the L of fuel used during a season. The auditor will then collate all of the information collected and input the data into the EnergyCalc program which complies the results for the operation. The site representative will then be supplied with a copy of the report from the EnergyCalc program as well as any recommendations for changes or further testing. Level 3 Audits A Level 3 energy audit is a more comprehensive study of the energy usage of farming operation. It uses site specific data either gained from on-site testing or through data/records provided by a site representative. A Level 3 audit generally aims to reach an accuracy of ±10%. Level 3 audits were undertaken at several sites during this study. The auditor has followed the same process as a level 2 audit. However, during the first site visit, plans are also made to return and perform further testing to collect site specific values of energy usage. Testing may include the use and installation of necessary equipment for fuel usage monitoring during tractor operations, pump performance testing to determine energy usage, pressure and flow rate and electric motor testing to determine start up and constant operation power requirements. In this project, electric testing was performed using an AEMC 8220 power analyser. The unit was used to measure the power supplied to the motor. This data was logged to a laptop or recorded from the screen. The data collected either from testing or from site representatives was then input into the EnergyCalc program to calculate the energy usage breakdown of the farming operations In this project, detailed tractor fuel monitoring and analysis has been conducted on one of the cotton operations. Detailed pump testing was undertaken at another cotton property. In both cases, performance and energy efficiency of these operations were calculated and analysed. Energy saving potential was also identified.

1002801 Opportunities to Enhance Energy Efficiency and Minimise Greenhouse Gases 26
7.2 Case studies To assess current practices in terms of energy efficiency, nine on-farm energy assessments were conducted in this project. These include:
• Cotton × 2 • Sugar × 2 • Horticulture × 2 • Nursery × 2 • Prawn farm × 1
Two of these sites (Case study 1 Cotton and Case study 2 Cotton) have also later been upgraded to detailed level 3 audits, investigating specified processes of energy efficiency in water pumping and tractor operation. This will be discussed in Section 7.3.
7.2.1 Level 2 Energy audits results Case study 1 (Cotton) is a surface irrigated farm covering 840 ha and located west of Dalby in South East Queensland. 250 ha of the farm were planted with cotton, 250 ha with sorghum/corn and 150 ha with wheat. The site has previously had a level two audit conducted as part of a previous project with the NCEA. Two visits were conducted to the site. The first was a scoping visit to investigate the site and the potential items requiring testing. The second visit was to demonstrate the effect of tractor set up on fuel usage. This was conducted with the assistance of one of the farm managers and a John Deere 8520 tractor with a fuel usage computer (Tractor Performance Monitor). The tractor operator demonstrated how the fuel usage of a particular operation can be minimised by effective tractor set up. The detailed findings and obtained data of this testing are discussed in Section 7.3. Because all irrigation pumps were not in operation during the period of the audit, their energy usages for irrigation had to be estimated.
Table 3: Energy use at case study 1 (cotton)
Crop
Crop area (ha)
Diesel use
(L/ha)
Electricity use
(kWh/ha)
Total energy cost ($)
Total Energy cost per ha
($/ha) Cotton 250 129.4 414.3 $48,539.80 $194.16
Sorghum/Corn 250 85.7 248.6 $31,495.99 $125.98 Wheat 150 34.7 0.0 $6,141.90 $40.95
The overall calculation results are shown in the table above. The costs are provided here as a guide only. It is assumed that diesel is $1.18/L and electricity averages are $0.1/kWh. The total greenhouse gas emissions due to energy uses at this site was estimated to be 343.4 tonne or 0.528 tonne/ha of CO2. The calculation results have also shown that harvesting and irrigating water was by far the highest energy usage (more than 60% for both irrigated crops) at this site. It is

1002801 Opportunities to Enhance Energy Efficiency and Minimise Greenhouse Gases 27
therefore recommended the pumping operations are tested to determine the total energy used by each pump and if any efficiency gains can be made in the pumping operations. This could significantly reduce the overall fuel consumption on the site. Case study 2 (Cotton and Sorghum) was located near Jandowae in South East Queensland. The farm comprises 248 ha of surface irrigated land with an additional 20 ha of non-irrigated land. The land is farmed in a rotation of cotton and sorghum, although recently the farm has been exclusively cropped with sorghum due to reduced farm input requirements. This site was also previously involved in a level 2 audit with the NCEA.
Table 4: Energy use at case study 2 (cotton and sorghum)
Crop
Operation energy cost
($)
Water pumping cost ($)
Total energy cost ($)
Energy cost per ha ($/ha)
Cotton + Sorghum 3636.79 13404.42 17041.20 160.5 Sorghum 6385.1 18471.06 24856.14 124.3
Fuel usage values for this audit have been estimated from fuel records by the farm owner. It is assumed that diesel is $1.18/L. Most of the operations were not conducted during the period of the trial so direct records had to be taken. It is found that the fuel usage values sourced from the farm operator were significantly lower (up to over 100%) than those default values adopted in the EnergyCalc program. This showed that further monitoring programs are required to provide or verify the average energy use data for various work in the Australian condition. The level 2 audit also demonstrated that a significant amount (74% when the two crops are combined together) of the energy consumed on the property was due to the complex multiple pumping operations for water harvest, storage and irrigation. This site was therefore later selected for detailed pump testing to determine energy usage during the pumping operation and to try to identify ways to reduce the overall energy costs of these operations. The detailed findings and obtained data of this testing are discussed in Section 7.3. The total greenhouse gas emissions due to energy uses at this site was estimated to be 49.4 tonne of CO2 for 120 ha cotton and 40 ha sorghum and 72.1 tonne of CO2 for 200 ha sorghum. Case study 3 (Sugarcane) is located near Childers in South East Queensland. The farm produces sugarcane for four years which is rotated with a crop of soybeans or watermelons in the break years. The farm area covers 122.8 hectares and all (except 2.8 ha) is irrigated. The farm is in the process of converting to a minimum tillage and controlled traffic farming system so that the same spacing as the heavy cane equipment is adopted throughout the farm. This will reduce the total number of tillage operations, and therefore save considerable energy.

1002801 Opportunities to Enhance Energy Efficiency and Minimise Greenhouse Gases 28
While on the site, two of the main pumps were tested to measure the water flow and energy consumed. The current draw of one of the bore pumps was recorded from a gauge on the electrical box. Many of the operations performed on the farm did not occur during the period of this trial. The fuel usage for these operations was therefore estimated, taking into account tractor size, workload and downtime. Some operations fuel usages were recorded during the period.
Table 5: Energy use at case study 3 (Sugarcane)
Crop
Crop area (ha)
Diesel use
(L/ha)
Electricity use
(kWh/ha)
Total energy cost ($)
Energy cost per ha ($/ha)
Sugarcane 95.65 159.3 1237.4 $29,816.43 $311.7 Soybeans 14.88 189.1 1080.1 $4,926.67 $331.1
Watermelons 12.26 668.7 641.5 $10,460.90 $853.3
The overall calculation results are shown in the table above. The costs are provided here as a guide only. It is assumed that diesel is $1.18/L and electricity averages are $0.1/kWh. The calculation results showed that watermelons were much more energy intensive than the other crops grown on the farm (three times the energy used to produce sugar cane). Particularly, the uses of rotary hoe and swing plough for preparation work have consumed considerable energy (37 L diesel/ha each pass). The total greenhouse gas emissions due to energy uses at this site was estimated to be 1.75 tonne of CO2 per hectare for sugarcane, 1.72 tonne for soybeans, and 2.79 tonne for watermelons. Case study 4 (Sugarcane) is located near Childers in South East Queensland. The farm produces sugar cane for five years which is rotated with soybeans or peanuts in the break years. The farm area covers 828 hectares and is all irrigated. The farm is in the process of converting to a minimum tillage and controlled traffic farming system so that the same spacing as the heavy cane equipment is adopted throughout the farm. This will reduce the total number of tillage operations, and therefore save considerable energy.
Table 6: Energy use at case study 4 (Sugarcane)
Crop
Crop area (ha)
Diesel use
(L/ha)
Total diesel cost
($)
Electricity use
(kWh/ha)
Total electricity
cost ($)
Total energy
cost ($/ha) Spring Cane 138 242.0 $39,405.25 1438.9 $19,856.67 $429.43 Ratoon Cane 522 138.3 $85,157.20 1438.9 $75,110.00 $307.03
Soybeans 52.2 70.8 $4,359.66 1027.8 $5,365.00 $186.30 Peanuts 82.8 105.9 $10,351.33 1438.9 $11,914.00 $268.90

1002801 Opportunities to Enhance Energy Efficiency and Minimise Greenhouse Gases 29
The farm operator has previously conducted extensive farm audits with the assistance of the FEAT Canegrower Farm Management program (Cameron, 2005). All of the data collected from this site is therefore sourced from these resources. No further testing was conducted. The overall calculation results are shown in the table above. The costs are provided here as a guide only. It is assumed that diesel is $1.18/L and electricity averages are $0.1/kWh. The calculation results showed that there was a significant difference (20%) in energy usage between the past and new (controlled traffic) operating practices. This clearly demonstrated the energy savings potential with GPS and controlled traffic. Other significant operations which consume energy were irrigation which the owner has had tested, and which were performing up to a suitable standard (411 kWh/ML), and cane harvesting. The cane harvesting energy use figure (168 L/ha) was supplied by the growers co-operative which supplies the machine. A fuel flow metre was being fit to this machine to confirm this figure. The total greenhouse gas emissions due to energy uses at this site was estimated to be 2.2 tonne of CO2 per hectare for Spring sugarcane, 1.9 tonne for Ratoon cane, 1.27 tonne for soybeans, and 1.8 tonne for peanuts. Case study 5 (Horticulture) is a small crop farm located in the Lockyer Valley near Gatton in South East Queensland. The farm contains 171 hectares of beetroot, 171 hectares of (dryland) wheat in winter and sorghum or mung beans during summer. The site consists of a number of separate blocks in the Lockyer valley area. The site had maintained excellent operation records including the dates each operation was performed, the fuel used and the water applied. This improved the effectiveness of the overall audit as the manager was able to source the data simply from records on the computer. Testing occurred at the site to determine the power consumption of electrical pumps used to transfer water from the main storage to the secondary storages ready for irrigation application. The pump at the secondary storage had been previously tested by Growcom. These results were used as part of this trial. The beetroot cleaning equipment was planned on being tested but was undergoing maintenance when the trials were occurring.
Table 7: Energy use at case study 5 (Horticulture)
Crop
Crop area (ha)
Diesel use
($/ha)
Electricity use
($/ha)
Total energy cost ($)
Total energy
cost ($/ha) Beetroot 171 171.6 121.9 50,188.57 293.50 Wheat 171 19.0 0 3,250.82 19.01
Sorghum 171 20.2 0 3,454.94 20.2

1002801 Opportunities to Enhance Energy Efficiency and Minimise Greenhouse Gases 30
Using the data from the site summaries, the energy usage for operations and water usage were calculated. All the data has been based on figures provided by the owner. It has been assumed 30% of the water pumped into holding is pumped with the alternative pump. Beetroot was shown to require much higher energy inputs than the other products produced on the site (costing about 15 times the energy inputs of sorghum, mung beans and wheat). The main energy usage for beetroot was the beetroot harvester and pumping for irrigation. During the first site visit the farmer identified the beetroot harvester (62 L/ha) was by far the most significant energy input comprising over 42% of the diesel inputs for the crop. As the harvester was a specially modified machine it is recommended that further investigation is required to reduce the total energy usage. The other significant cost was the cost of irrigation due to the water requiring three pumping operations. All the pumps have been tested and appear to be operating at the level they were designed to. It is not anticipated reductions could be easily made in this area. The total greenhouse gas emissions due to energy uses at this site was estimated to be 1.69 tonne of CO2 per hectare for beetroot, 50 kg for both wheat and sorghum Case study 6 (Horticulture) is a farm located in the Glass House Mountains near Beerwah in Sunshine Coast hinterland. The farm contains 11 hectares of mature Avocado trees, 10 hectares of mature Custard Apple trees and 17 hectares of juvenile Macadamia tress which are 3 years away from harvesting. The site was initially visited in early March 2008 with a follow up visit to perform testing and collect data conducted on the 18th of April 2008. The site did not have a fuel flow metre available at the time of investigation so the owner was asked questions about tractor and implement sizes as well as the operation speed, field efficiency and the tractor work load during operation. Using data from the NTTL/OECD tractor test report, the fuel usage for the site was estimated. During the second visit basic electrical testing was conducted to measure the electrical power used for post harvest operations and a pump test was conducted on the sprinkler supply pump. A visit was made to the Avocado growers Co-operative to measure the electricity consumed in the cleaning, sorting and storage of the fruit.
Table 8: Energy use at case study 6 (Horticulture)
Crop
Crop area (ha)
Diesel use
($/ha)
Petroluse
($/ha)
Electricity use
($/ha)
Total energy cost ($)
Total energy
cost ($/ha) Avocado 11 1170.9 10.4 124.1 14,359.33 1,305.39
Custard Apples 10 439.9 16.8 145.6 6,022.68 602.27 Macadamia 17 226.9 0 0 $4,551.74 267.76
It was found that the Avocado trees are the most energy intensive grown at the site. This was due to the extra maintenance operations which were required. In particular, operating the flail mower (476.2 L/ha) comprised over half of the diesel used on the

1002801 Opportunities to Enhance Energy Efficiency and Minimise Greenhouse Gases 31
Avocado's. The other operation which consumed a large amount of energy was slashing between the rows (163.7 L/ha). The high number and slower speed of these operations contributed to the large amount of diesel being used. Irrigation was a significant electricity cost associated with the production of all crops. The total greenhouse gas emissions due to energy uses at this site was estimated to be 4.17 tonne of CO2 per hectare for Avocado, 2.60 tonne for Custard Apples, and 0.56 tonne for Macadamia. Case study 7 (Nursery) is located at Rochdale in southern Brisbane. It is a large nursery, comprising two sites covering a total of 8 hectares. This audit considers the main office site which is a total of 5 ha. The company produces a wide variety of plants which are grown in fibreglass, solar weave and salon cloth buildings as well as a large outside growing area. The site contained a large amount of electrical equipment that was tested during the second site visit. A standard electrical pump was tested as well as a variable speed electrical pump. Additional equipment tested at the site included a potting machine, a mixing machine, a cart battery charger, a steam generator and a column water heater for (air) heating purpose.
Table 9: Energy use at case study 7 (Nursery)
TOTALS Amount Cost ($) Total Diesel (L) 22473 $26,518.14 Total Petrol (L) 4837 $5,804.70 Total LPG(L) 4645 $3,530.20
Total Electricity (kWh) 432928 $36,798.88 TOTAL $72,651.92
It was found that by far the largest energy usage on the site is heating. Heating comprised of 69% of the diesel and over 90% of the electricity as well as all of the gas usage. The owner described the changes that have been made to the operating procedure in an attempt to reduce the overall cost of heating the Nursery. A decision has also been made to change from heating with electricity to alternative heat source to try to reduce the energy cost. Further work could be done to investigate ways to reduce the energy used to maintain the heat within the Nursery at the correct temperature while still maintaining nursery function during the other months of the year. The Varispeed pump testing demonstrated the effectiveness of such installation, showing the range of duties which can be performed by the pump. This increased efficiency in operations which were required to apply a variety of flow rates depending on the application used. It was observed during the site visit and confirmed with the figures that a few of the items used at the site were significantly more powerful than they were required. Especially the mixer and the fogging pump were well oversized. It is however not believed that these units would use considerably more power than correct sized units. It is recommended that units are sized closer to their capacity to save capital costs.

1002801 Opportunities to Enhance Energy Efficiency and Minimise Greenhouse Gases 32
The total greenhouse gas emissions due to energy uses at this site was estimated to be 539.4 tonne of CO2. Case study 8 (Nursery) is located in the Lockyer Valley in south east Queensland. It is a large and extensive nursery, so a section of the nursery that operates semi independently from the rest of the nursery was investigated as part of the audit. The site produces both trees and shrubs. During the second site visit, a large amount of electrical equipment was tested. These included both standard and varispeed electrical pumps, potting machines, aerators and dosing pumps. Additional equipment was tested at other locations throughout the nursery to provide an indication of the power usage of equipment commonly used at other nurseries in south east Queensland. These included a small motor to operate screens, refrigeration units for seed, and fogger pump.
Using the data from the site summary (Appendix B), the energy usage for vehicles, heating and equipment were calculated. All the data has been based on figures provided by the owner. There were difficulties estimating the energy usages for water heating, which was set to run 24 hours a day. It was assumed the heater would average only 8 hours a day throughout the year.
Table 10: Energy use at case study 8 (Nursery)
Total Energy Cost ($) % Diesel 3122.3 29.3 Petrol 1633.0 15.3
Electricity 5890.3 55.3 Totals $10645.5 100.0
The figures shown for kWh/yr and L/Yr were the total values and included multiple units in some cases. Percentage values reflected the percentage of the total energy source used on the product. The costs are provided as a guide only and assume diesel is $1.18/L, Petrol $1.20, Gas $0.76 and electricity averages $0.1/kWh although energy costs are currently quite volatile. The testing at the site compared the start up power required compared to the power consumed during full operation. It was found the difference in power during the start up period (25s for most items) was negligible when the length of operation of these items is considered. Results showed that electricity was the most significant component of the energy cost at the location. The most significant components (37.1%) of the electrical power consumed were the aerator on the water recycling storage and the water heater. The aerator was used on a dam of approximately 5ML and was used to supply water to more that the Nursery site audited. It ran almost continuously all year round. The water heater also used over 1/3 of the electrical power consumed at the site, which could be reduced by using a different heat source. Pumping was the other significant energy usage. It was noted the main varispeed pump used a similar amount of energy to the transfer pump. The main pump operated at a higher pressure than the transfer

1002801 Opportunities to Enhance Energy Efficiency and Minimise Greenhouse Gases 33
pump as it needed to supply the pressure to the sprinklers, demonstrating its higher operating efficiency. The total greenhouse gas emissions due to energy uses at this site was estimated to be 72.3 tonne of CO2. Case study 9 (Aquaculture) is located at Woongoolba, near Jacobs Well in South East Queensland. The farm produced 300 tonnes of tiger prawns in 2007 with maximum production set to reach 500 tonne per annum year when at full production. Of the total stock, 30% of the prawns on the farm are grown from the site’s own brood stock with the remainder being grown from brood stock caught in the wild. It is planned that in the future, all brood stock will be sourced from the site. The site also produces small numbers of other miscellaneous fish species. During the site visit, information was collected to conduct a level two energy audit. Motor sizes were collected so that the energy usage could be calculated. The site manager stated the most significant part of their energy bill was electricity with diesel only being used for some vehicles and for heating of the hatchery for a few months during winter. He also stated pumping water was by far the largest energy cost at the site. Recently new variable speed pumps had been purchased for some pumping operations on the farm. This led to a reduction in energy usage. The site conducts all the harvesting, sorting, cooking, packing and freezing of the product before it leaves the farm gate. During the site visit, it was observed that pumping was a significant usage of power. The site includes large water storage dams plus pumping and agitation systems. Within these aerobic systems, considerable electrical energy is used for aeration of the wastewater to stimulate microbiological activity. The electrician at the site also measured the current supplied to the aerators and agitators. This information was used to calculate power supplied to these units. Calculation results showed that overall energy use at the site was around $460,503, which includes 25.37% at the hatchery, 40.11% at the growing, 19.61% at the processing and 14.91% at the estate (miscellaneous items). Assuming 300 tonnes of prawn output, this translated to $1525 of energy input for per tonne of production.
Calculation results also showed that heating was by far the most significant cost within the hatchery (more than 75%), when both the electric heaters and the diesel boilers were considered. There were no other major sources of power consumption within the hatchery. The site manager reported that pumping water was the most significant cost. However, the calculation results indicated that it only comprised 25% of the electricity used in the growing process. Due to the size of the pumps used, they would still comprise a large energy usage per item, so a small energy saving on an individual item would provide significant overall benefits. It is recommended that further pump testing is conducted to determine the efficiency of the large river pumps. Calculation results also showed that in terms of electricity, by far the largest consumption of power at the site was during the growing operation (58% of

1002801 Opportunities to Enhance Energy Efficiency and Minimise Greenhouse Gases 34
electricity). It was surprising that 75% of the total electricity consumed during growing was used to power the paddle wheel aerators and agitators. There were altogether 222 paddle wheels running continuously for 6 months of the year. With time, these paddle wheels would also build up with algae and draw more power. When they were subsequently cleaned they used noticeably less power. Due to the large usage of power of these items, it is recommended that the maintenance of the paddle wheels be closely monitored.
Table 11: Total energy usage costs and percentages for each section at case study 9 (Aquaculture)
Hatchery Growing Processing Estate Total Diesel (L) 50000 0 0 38554 88554 Diesel ($1.18/L) $59,000 $0 $0 $45,494 $104,494% 56 0 0 44 100 Petrol (L) 0 0 0 17171 17171 Petrol ($1.20/L) $0 $0 $0 $20,605 $20,605 % 0 0 0 100 100 LPG (L) 0 0 18000 2797 20797 LPG ($0.76/L) $0 $0 $13,680 $2,126 $15,806 % 0 0 87 13 100 Electrical (kWh) 737932 2356988 977441 5457 4077819 Electrical ($0.1/kWh) $57,835 $184,729 $76,607 $428 $319,599% 18 58 24 0 100 Total site energy cost ($) $116,835 $184,729 $90,287 $68,652 $460,503% 25.37 40.11 19.61 14.91 100
It was also observed the freezers used in the processing area were the most significant energy usage (nearly 70%) for the packing area, which was expected due to their size compared to the other components of the processing system. Reducing the total operation time of the freezers could therefore reduce the overall energy used in the processing section. The only other major energy component of the processing was the gas supplied to the cooking burners. The total greenhouse gas emissions due to energy uses at this site was estimated to be 4593.9 tonne of CO2.
7.3 Detailed Assessments The above-discussed overall energy insensitivity (GJ/ha) of a site is of direct interest to the farmers. However, this indicator ignores the difference caused by the adoption of different farming methods and different machinery. So it will be necessary to supplement this information with other “technical” indicators of energy efficiency such as pump and tractive efficiency.

1002801 Opportunities to Enhance Energy Efficiency and Minimise Greenhouse Gases 35
This project focuses on mechanical improvements (more efficient operation of tractors and pumping plants) so that these systems can use less energy for the given task during each hour it runs.
7.3.1 Detailed energy audit - pump testing As discussed above, the pump efficiency can be relatively easily measured, with suitable standard protocols. This can be achieved by measuring pressure, flow rate, pump power output; and then calculate the pumping plant efficiency according to the equation Pump efficiency = Flow rate × Pressure head/Pump energy input where
Pump energy input = Motor power consumed × Motor efficiency × Drive transmission efficiency
If low pump efficiency is found, suitable measures may be taken to rectify the situation. Because diesel engines can be set to run at any rpm within their range, it is also essential to know the RPM. The fuel usage during pumping operations was measured at a cotton and sorghum property near Jandowae in south east Queensland. A previous energy audit revealed pumping of irrigation water made up a very large percentage (over 70%) of the farm’s total energy usage. Pump testing was therefore conducted to determine the actual amount of fuel used, to try to identify operating procedures which might reduce fuel consumption. Three pumps were tested during the trial. The main pump was a 6" diesel pump which was used for three main operations on the property. Two diesel bore pumps were also tested during the trial. The main pump was fitted with a suction pressure transducer, a line pressure transducer, and ultrasonic flow metre and two in line fuel flow sensors, one for the fuel in and the another for fuel return. The values from each sensor were recorded using data logging equipment every 10 seconds during the operation of the test. The bores were tested with the same equipment although the suction sensor was not necessary. Instead an estimate was made for the depth of the bore. During operation of the pump, the pump speed was set to a constant value of RPM and the pump worked at this speed throughout the pumping operation. The two bores were set to operate at 1500 RPM while the main 6" pump can be operated at a range of RPM values between 1200 to 1500 RPM. During the main pump trial, water was pumped to three different locations, lifting from the sump into storage 1, pumping from the sump to storage 2 (1 km away), and pumping from the sump to the irrigation channel. During each of the operations the fuel usage was measured against the flow rate for different engine RPM settings to discover the most efficient settings of the motor.
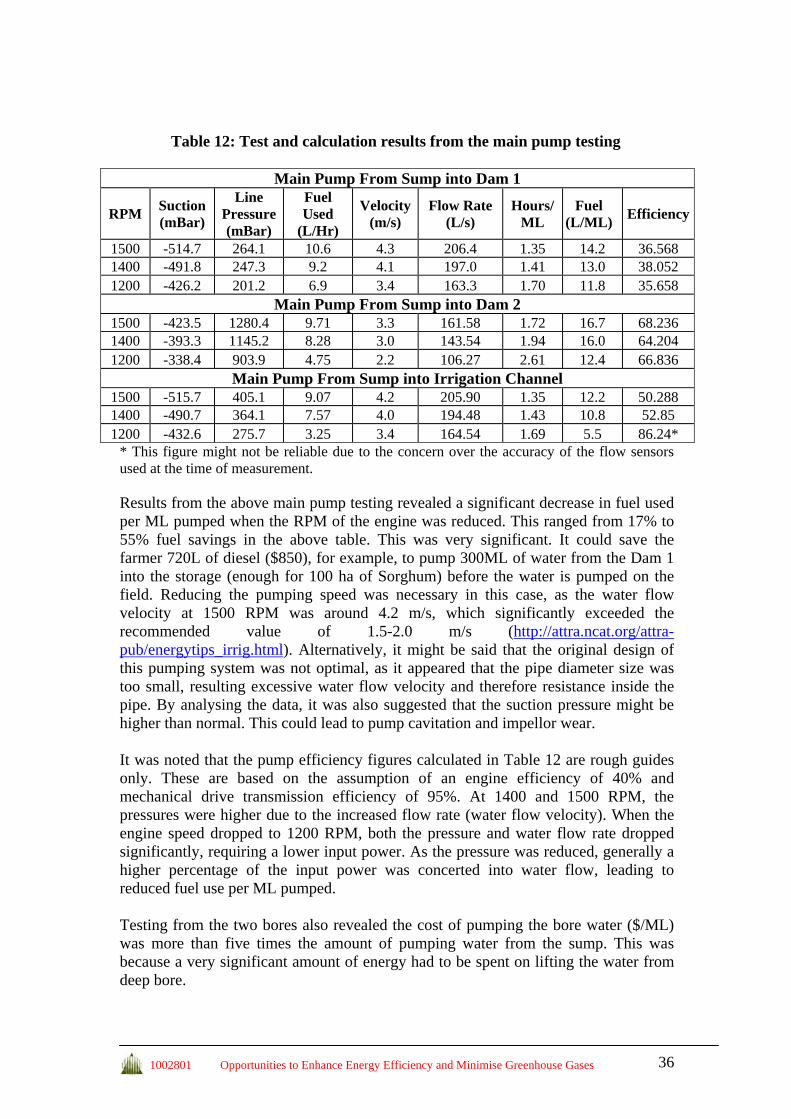
1002801 Opportunities to Enhance Energy Efficiency and Minimise Greenhouse Gases 36
Table 12: Test and calculation results from the main pump testing
Main Pump From Sump into Dam 1
RPM Suction (mBar)
Line Pressure (mBar)
Fuel Used
(L/Hr)
Velocity (m/s)
Flow Rate (L/s)
Hours/ML
Fuel (L/ML) Efficiency
1500 -514.7 264.1 10.6 4.3 206.4 1.35 14.2 36.568 1400 -491.8 247.3 9.2 4.1 197.0 1.41 13.0 38.052 1200 -426.2 201.2 6.9 3.4 163.3 1.70 11.8 35.658
Main Pump From Sump into Dam 2 1500 -423.5 1280.4 9.71 3.3 161.58 1.72 16.7 68.236 1400 -393.3 1145.2 8.28 3.0 143.54 1.94 16.0 64.204 1200 -338.4 903.9 4.75 2.2 106.27 2.61 12.4 66.836
Main Pump From Sump into Irrigation Channel 1500 -515.7 405.1 9.07 4.2 205.90 1.35 12.2 50.288 1400 -490.7 364.1 7.57 4.0 194.48 1.43 10.8 52.85 1200 -432.6 275.7 3.25 3.4 164.54 1.69 5.5 86.24*
* This figure might not be reliable due to the concern over the accuracy of the flow sensors used at the time of measurement. Results from the above main pump testing revealed a significant decrease in fuel used per ML pumped when the RPM of the engine was reduced. This ranged from 17% to 55% fuel savings in the above table. This was very significant. It could save the farmer 720L of diesel ($850), for example, to pump 300ML of water from the Dam 1 into the storage (enough for 100 ha of Sorghum) before the water is pumped on the field. Reducing the pumping speed was necessary in this case, as the water flow velocity at 1500 RPM was around 4.2 m/s, which significantly exceeded the recommended value of 1.5-2.0 m/s (http://attra.ncat.org/attra-pub/energytips_irrig.html). Alternatively, it might be said that the original design of this pumping system was not optimal, as it appeared that the pipe diameter size was too small, resulting excessive water flow velocity and therefore resistance inside the pipe. By analysing the data, it was also suggested that the suction pressure might be higher than normal. This could lead to pump cavitation and impellor wear. It was noted that the pump efficiency figures calculated in Table 12 are rough guides only. These are based on the assumption of an engine efficiency of 40% and mechanical drive transmission efficiency of 95%. At 1400 and 1500 RPM, the pressures were higher due to the increased flow rate (water flow velocity). When the engine speed dropped to 1200 RPM, both the pressure and water flow rate dropped significantly, requiring a lower input power. As the pressure was reduced, generally a higher percentage of the input power was concerted into water flow, leading to reduced fuel use per ML pumped. Testing from the two bores also revealed the cost of pumping the bore water ($/ML) was more than five times the amount of pumping water from the sump. This was because a very significant amount of energy had to be spent on lifting the water from deep bore.

1002801 Opportunities to Enhance Energy Efficiency and Minimise Greenhouse Gases 37
Table 13: Results from the bore testing
Pressure (mBar)
Fuel Used
(L/Hr)
Water Flow
Rate (L/s)
Depth of Bore
(m)
Hrs /ML
Fuel (L/ML) Efficiency
Bore 1 196.4 7.37 25.8 70 10.77 79.350 43.31 Bore 2 239.6 10.9 35 70 7.937 86.508 39.96
7.3.2 Detailed energy audit – tractor performance monitoring For the scope of this project, trials were run to demonstrate the feasibility of reducing the fuel usage per hectare of operation. This was undertaken by using a 30 series John Deere tractor with GPS, pulling a 6 m offset disc plough with fertilizer kit. For further testing, it may be necessary to measure the drawbar power required and then compare that to the power supplied from the engine. This will however require extensive instrumentation and will be an expensive exercise.
Table 14: Fuel usage at different tractor settings
Tractor Set Up Fuel Usage Work Rate
Set up # Gear
Speed (km/hr)
Engine RPM L/hr L/Ha
% of Optimum Ha/hr
1 8 6.4 1680 29.5 7.7 105.5 3.8 2 8 8.6 2250 49 9.5 130.4 5.2 3 9 8.9 2000 44 8.2 113.2 5.3 4 9 9.8 2250 51 8.7 119.1 5.9 5 10 9.5 1850 41.5 7.3 100 5.7 6 11 9.9 1700 46 7.7 106.4 5.9
The change in fuel consumption was demonstrated by modifying the gear used and the engine RPM to match with the implement draft. The different settings were made to correspond with ways the tractor could be set up by an operator who did not have the technology to view the fuel usage. All the operations were providing an effective operation. Table 14 showed that with the correct set up, different operations could reduce the fuel usage by up to 30%. In particular, it was found that set up 3 had a very similar work rate (actually slightly higher work rate) with set up 2, but the fuel use was reduced considerably (by 13.7%).
7.4 Summary of case study results To assess current practices in terms of energy efficiency, nine on-farm energy assessments have been conducted in this project. It has been found that most significant energy users were greenhouse heating, irrigation, and heavy tillage and harvesting work. For the nursery industry, heating may be the most important energy user. Energy for irrigation/pumping was also found to be very important for all industries. This was particularly the case when complex multiple pumping is involved for water harvest, storage and irrigation. For field work, it was found that the energy
1002801 Opportunities to Enhance Energy Efficiency and Minimise Greenhouse Gases 38
use by all harvesters appeared to be very significant. When minimum tillage and controlled traffic are practiced, energy usage can be reduced by approximately 20%. If it is assumed that diesel is $1.18/L and electricity averages are $0.1/kWh, the highest energy cost was $1305/ha for avocado. The energy input cost for growing prawn was about $1525 per tonne of production. Significant energy can be saved in these sites. For the irrigation pump system studied, it has been shown that with suitable design improvement and engine speed adjustments, up to 10~50% of pumping energy can be saved. Correct operation of tractors may also save up to 30% of fuel.

1002801 Opportunities to Enhance Energy Efficiency and Minimise Greenhouse Gases 39
8 CONCLUSION
On-farm energy efficiency is becoming increasingly important in the context of rising energy costs and concerns over greenhouse gas (GHG) emissions. Energy inputs also represent a major cost to the majority of producers in Queensland.
8.1 Major findings Software It has been shown that a number of energy and greenhouse calculators have been developed to estimate the energy uses and greenhouse gas emissions from agricultural systems. These softwares will need further development and may be very useful for conducting both level 2 and level 3 energy audits Hardware It has also been found that the pump efficiency can be relatively easily measured, with suitable standard protocols. The instruments utilised eg, electrical network analysers, ultrasonic flow meters, and pressure transducers are also easy to use. A set of these basic tools may cost around $15,000~$20,000. Technology applications In comparison, measuring tractor and engine performance for a level 3 audit is much more complicated and will require substantial set-up and instrumentation. Because of this, performance measurement has not commonly been done on customer owned tractors operating in their specific conditions. The installation of commercial Tractor Performance Monitors may greatly assist tractor operators to monitor their fuel use and improve their operation, and therefore has the potential to significantly improve the operational fuel efficiency of many tractors. Site assessments Nine on-farm energy audits have been conducted in this project, which include:
• Cotton × 2 • Sugar × 2 • Horticulture × 2 • Nursery × 2 • Prawn farm × 1
Two of these sites have later been upgraded to detailed level 3 audits, targeting specified processes of major energy-consuming equipment. It has shown that energy uses vary significantly between different farms and different industries. For the nursery industry, heating may be the most important energy user.

1002801 Opportunities to Enhance Energy Efficiency and Minimise Greenhouse Gases 40
Energy for irrigation pumping has been found to be very important for all industries. This is particularly the case when complex multiple pumping is involved. For field work, the energy use by all harvesters appears to be very significant. When minimum tillage and controlled traffic are practiced, energy usage can be reduced by approximately 20%. It has been demonstrated that considerable opportunities exist for the improvement of energy efficiency. For the irrigation pump system studied, it has been shown that with suitable design improvement and engine speed adjustments, up to 10~50% of pumping energy can be saved. Correct operation of tractors may also save up to 30% of fuel.
8.2 Recommendations for further research
• Significant work and case studies are required to establish benchmarking energy use data and to compare and evaluate energy use for alternative productions systems and impacts on greenhouse gas emissions. The current monitoring work showed that the fuel usage values sourced from the farm operator might be significantly different from (up to over 100%) the published data in the literature. This shows that further monitoring program will be required to provide or verify the average energy use data for various work in the Australian condition. These data will also be valuable for the possible establishment of farm energy star-rating scheme in the future.
• It is suggested that any energy audit in agriculture in the future would best start from irrigation, as it consumes considerable proportion of energy cost on farm. Previous research has shown that up to 30% to 50% of the energy consumed by pump systems could be realistically saved through appropriate equipment or control changes.
• Irrigation energy audits may be combined with water efficiency audits using recently developed IPART tool (Irrigation Performance Audit and Reporting Tool) so that a combined service can be provided to the interested farmers. Customised easy-to-use toolkits (hardware, software and training) will need to be developed and refined for this purpose.
• It is identified that significant further research is required to conduct whole-farm energy audits. In addition to the practical difficulty in measuring tractor performance, there is currently a lack of fundamental research for energy use in agriculture. As a result, there is currently a lack of quantified “rules of thumb” guides for energy improvement and investment calculations for different agricultural equipment. This is particularly important from the perspectives of reducing the costs of energy audits and to ensure the quality of service for this kind of work. There is also a strong need to develop a detailed model report/manual so that effective and widespread energy audits in agriculture can take place.
• The current on-farm energy efficiency research may need to be extended to incorporate further downstream processing including packaging, storage, and distribution. Such work is needed in order to better understand the main sources of overall energy expenditures and greenhouse gas footprints.

1002801 Opportunities to Enhance Energy Efficiency and Minimise Greenhouse Gases 41
It is finally noted that this report has not considered other factors/techniques that can potentially significantly influence energy use/demand in agriculture. These include irrigation scheduling, reducing irrigation field loss, reducing multiple pumping, and the uses of alternative fuels and other technologies/farming systems (eg, adoption of minimum tillage system). In an energy audit, these factors will also have to be reviewed. For large energy users, an Energy Audit Grant Scheme (http://www.eecabusiness.govt.nz/emprove/implementation/conduct-an-audit/index.htm) may be run by suitable government organizations to provide funding incentive (eg, funding for up to 50% of the cost of an energy audit to a maximum of $10,000) for the cost of identification of energy savings opportunities by a certified energy specialist .

1002801 Opportunities to Enhance Energy Efficiency and Minimise Greenhouse Gases 42
9 REFERENCES
Australian/New Zealand AS/NZS 3598:2000. Energy Audits.
Bentaher, H.; Hamza, E.; Kantchev, G.; Maalej, A.; Arnold, W. (2008), Three-point hitch-mechanism instrumentation for tillage power optimization, Biosystems Engineering, 100, pp.24 – 30.
Chen, G., Anderson, J.A., Bannister, P., Carrington, C.G. (2001), Monitoring and performance of a commercial grain dryer, Journal of Agricultural Engineering Research, Vol.81, No.1, pp.73-83, 2002.
Chen, G. and Baillie, C. (2007), “Development of EnergyCalc - A tool to assess cotton on-farm energy uses”, Technical Report, National Centre for Engineering in Agriculture Publication 1002565/1, University of Southern Queensland, Toowoomba, Australia.
Cameron, T. (2005), Farm Economic Analysis Tool (FEAT) - a decision tool released by FutureCane, Queensland Department Primary Industries & Fisheries.
Cormack, W. F. (2000), Energy use in organic farming systems (OF0182). Report, Terrington, ADAS Consulting Ltd, UK, http://orgprints.org/8169/; http://orgprints.org/8169/01/OF0182_181_FRP.pdf
Eastop, T.D. and Croft, D.R. (1990), Energy Efficiency for Engineers and Technologists, Longman Publishing Group, ISBN-10: 0582031842.
Gulden, R.H.and Entz, H.E, (2005), A Comparison of Two Manitoba Farms with Contrasting Tillage Systems, University of Manitoba, Canada, http://umanitoba.ca/outreach/naturalagriculture/articles/energy.html
Gurney, A., Ford, M., Low, K., Tulloh, C., Jakeman, G. and Gunasekera, D. (2007), Technology: Toward a Low Emissions Future, ABARE Research Report 07.16 Australian Bureau of Agricultural and Resource Economics. www.abareconomics.com/publications_html/climate/climate_07/technology.pdf
Hatirli, S.A, Ozkan,B. and Fert, C. (2006), Energy inputs and crop yield relationship in greenhouse tomato production, Renewable Energy, Volume 31, Issue 4, pp.427-438.
Loftis, J.C. and Miles, D.L., (2004), Irrigation Pumping Plant Efficiency, State University Cooperative Extension Service, http://www.ext.colostate.edu/pubs/crops/04712.html
Barber, A. (2004), Energy Use and Carbon Dioxide Emissions in the New Zealand Vegetable & Flower Greenhouse Industries, AgriLINK NZ Ltd, http://www.agrilink.co.nz/Portals/Agrilink/Files/Greenhouse%20Energy%20Use%20Article.pdf

1002801 Opportunities to Enhance Energy Efficiency and Minimise Greenhouse Gases 43
Ozkan, B. Akcaoz, H. and Karadeni, F. (2007), Energy requirement and economic analysis of citrus production in Turkey, Energy Conversion and Management Volume 45, Issues 11-12, pp.1821-1830.
Pathak, B.S. and Bining, A.S. (1985), Energy use pattern and potential for energy saving in rice-wheat cultivation, Energy in Agriculture, 4, pp.271-278.
Pellizzi, G; Cavalchini, A.G., Lazzari, M. (1988). Energy Savings in Agricultural Machinery and Mechanization, Elsevier Science Publishing Co. New York, USA. ISBN 1-85166-236-7.
Pimentel, D. 2006. “Impacts of Organic Farming on the Efficiency of Energy Use in Agriculture.” The Organic Center, Cornell University. http://www.organicvalley.coop/fileadmin/pdf/ENERGY_SSR.pdf
Pretty, J.N. (1995), Regenerating agriculture: Policies and Practice for Sustainability and Self-reliance, Earthscan Publications Ltd, London, pp:320.
Singh, J.M., (2002), On farm energy use pattern in different cropping systems in Haryana, India, University of Flensburg, Germany.
Singh, S. and Pannu, C. J. S. (1998), Energy requirements in fish production in the state of Punjab, Energy Conversion and Management, Volume 39, Issue 9, pp.911-914 .
ARC Institute for Agricultural Engineering, Agricultural Research Council, South Africa, Measuring of Optimum Tractor Performance, (http://www.datataker.com/public_domain/PD177%20Measuring%20optimum%20tractor%20performance%20PD177.pdf
Stout, B.A., (1990). Handbook of Energy for World Agriculture. Elsevier Science Publications Ltd, London.
Strapatsa, A.V., Nanos, G.D. and Tsatsarelis, C.A. (2006), Energy flow for integrated apple production in Greece, Agriculture, Ecosystems & Environment, Volume 116, Issues 3-4, pp.176-180.
Tsatsarelis, C.A. (1991), Energy requirements for cotton production in central Greece, Journal of Agricultural Engineering Research, Volume 50, pp. 239-246
Tsatsarelis, C.A. (1993), Energy inputs and outputs for soft winter wheat production in Greece, Agriculture, Ecosystems & Environment, Volume 43, Issue 2, pp.109-118.
Tullberg, J. and Wylie, P. (1994). Energy in Agriculture. Conservation Farming Information Centre, Dalby, Queensland.
Wells, C., (2001), ‘Total Energy Indicators of Agricultural Sustainability: Dairy Farming Case Study’, Final Report to MAF Policy, University of Otago, New Zealand. http://www.maf.govt.nz/mafnet/rural-nz/sustainable-resource-use/resource-management/total-energy-indicators-of-agricultural-stability/httoc.htm

1002801 Opportunities to Enhance Energy Efficiency and Minimise Greenhouse Gases 44
Yaldiz, O., Ozturk, H.H, Zeren, Y, Bascetincelik, A., (1993), Energy usage in production of field crops in Turkey. 5th Int. Congress on Mechanization and Energy Use in Agriculture, 11–14 Oct 1993. Kusadasi, Turkey.
Yilmaz, I, Akcaoz, H., and Ozkan, B. (2005), An analysis of energy use and input costs for cotton production in Turkey, Renewable Energy, 30, pp.145–155.
Yule, I.J, Kohnen, G. Nowak, M. (1999), A tractor performance monitor with DGPS capability, Computers and Electronics in Agriculture, 23, pp.155–174.

1002801 Opportunities to Enhance Energy Efficiency and Minimise Greenhouse Gases 45
10 APPENDIX A – FRAMEWORK AND DROPDOWN TABLES FOR ENERGYCALC CALCULATIONS
10.1 Cotton and grains Production Processes and (Drop Down) Operations Preparation • Tillage • Spraying • Fertilise • Other Planting • Planting • Tillage • Spraying • Fertilising • Other In Crop • Tillage • Spraying • Fertilising • Other Pumping and irrigation • Water Harvest • Water Transfer • Irrigation Harvest • Harvesting • Infield • Road transport • Other Post Harvest • Crop Destruction • Crop Storage • Crop Treatment • Other Estate • Vehicles • Earthworks • Maintenance

1002801 Opportunities to Enhance Energy Efficiency and Minimise Greenhouse Gases 46
• Other

1002801 Opportunities to Enhance Energy Efficiency and Minimise Greenhouse Gases 47
Operations and (Drop Down) Practices Planting • Conventional Drilling • Direct Drilling • Other Tillage • Bedforming • Subsoiling • Discing • Chiesel Ploughing • Power Harrowing • Light Harrowing • Weed Chipping • Inter-row Cultivating • Other Spraying • Boom spraying • Airplane Spraying • Other Fertilizer • Fertilise Spreading • Other Water harvest • Bore • Sump • River/Creek • Purchased • Other Water Transfer • Pump • Gravity • Other Irrigation • Surface Irrigation • Centre Pivot • Lateral Move • Drip Harvesting • Cotton Picker • Cotton Stripper

1002801 Opportunities to Enhance Energy Efficiency and Minimise Greenhouse Gases 48
• Combine Harvester Infield • Infield Trailer • Module Builder • Chaser Bin • Transport Field Bin Road Cartage • Road Cartage • Other Crop Destruction • Slashing • Stalk Pulling • Other Crop Storage • Other Crop Treatment • Grain Drying • Grain Treatment • Other Other • Other Vehicles • ATV • Trucks • Utes • Other Earth Works • Excavator • Bulldozer • Scraper • Grader • Other Maintenance • Workshop • Welder • Generator • Other

1002801 Opportunities to Enhance Energy Efficiency and Minimise Greenhouse Gases 49
10.2 Sugarcane Production Processes and (Drop Down) Operations Preparation • Tillage • Spraying • Fertilise • Other Planting • Planting • Tillage • Spraying • Fertilising • Other In Crop • Tillage • Spraying • Fertilising • Other Pumping and irrigation • Water Harvest • Water Transfer • Irrigation Harvest • Harvesting • Infield • Road transport • Other Post Harvest • Tillage • Spraying • Fertilizer • Crop Treatment • Other Estate • Vehicles • Earthworks • Maintenance • Other

1002801 Opportunities to Enhance Energy Efficiency and Minimise Greenhouse Gases 50
Operations and (Drop Down) Practices Planting • Billet Harvest • Billet Transport (or other seed, plant transport) • Billet planter • Conventional planting (Soybeans) • Direct Drilling • Specialty Planting Machine (Peanuts, Watermelon etc) • Other Tillage • Bedforming • Subsoiling • Discing • Ploughing • Power Harrowing • Light Harrowing • Weed Chipping • Inter-row Cultivating • Rotary Hoe • Marking out • Other Spraying • Boom spraying • Airplane Spraying • Other Fertilizer • Fertilise Spreading • Other Water harvest • Bore • Sump • River/Creek • Purchased • Other Water Transfer • Pump • Gravity • Other Irrigation • Surface Irrigation • Centre Pivot

1002801 Opportunities to Enhance Energy Efficiency and Minimise Greenhouse Gases 51
• Lateral Move • Drip Harvesting • Cane harvester • Combine Harvester • Specialty Harvester Infield • Infield Trailer • Haulage • Other Road Cartage • Road Cartage • Rail Transport • Other Crop Storage • Other Crop Treatment • Cleaning • Sorting • Other Other • Other Vehicles • ATV • Trucks • Utes • Other Earth Works • Excavator • Bulldozer • Scraper • Grader • Other Maintenance • Workshop • Welder • Generator • Other

1002801 Opportunities to Enhance Energy Efficiency and Minimise Greenhouse Gases 52
10.3 Horticulture Production Processes and (Drop Down) Operations Preparation • Tillage • Spraying • Fertilise • Other Planting • Planting • Tillage • Spraying • Fertilising • Other In Crop • Tillage • Spraying • Fertilising • Crop Maintenance • Other Pumping and irrigation • Water Harvest • Water Transfer • Irrigation Harvest • Harvesting • Infield • Road transport • Other Post Harvest • Tillage • Spraying • Fertilizer • Crop Treatment • Other Estate • Vehicles • Earthworks • Maintenance • Other

1002801 Opportunities to Enhance Energy Efficiency and Minimise Greenhouse Gases 53
Operations and (Drop Down) Practices Planting • Conventional planting • Direct Drilling • Specialty Planting Machine (Peanuts, Watermelon etc) • Seed Grass • Tillage • Other Tillage • Bedforming • Subsoiling • Discing • Ploughing • Power Harrowing • Light Harrowing • Weed Chipping • Inter-row Cultivating • Rotary Hoe • Marking out • Other Spraying • Boom spraying • Airplane Spraying • Row Spraying • Spot Spraying • Other Fertilizer • Fertilise Spreading • Other Crop Maintenance • Slashing • Mechanical Pruning • Powered Pruning (Hydraulic Chainsaw, Pneumatic Secateurs) • Chipping • Flail Mower • Carting • Other Water harvest • Bore • Sump • River/Creek • Purchased

1002801 Opportunities to Enhance Energy Efficiency and Minimise Greenhouse Gases 54
• Other Water Transfer • Pump • Gravity • Other Irrigation • Surface Irrigation • Centre Pivot • Lateral Move • Drip Harvesting • Combine Harvester • Specialty Harvester • Cherry Picker • Preparation (Pulverising Etc) Infield • Infield Trailer • Chaser Bin • Other Road Cartage • Road Cartage • Rail Transport • Other Crop Storage • Other Crop Treatment • Cleaning • Sorting • Spraying • Refrigeration • Grading • Manipulation (Tipping, conveying) • Other Other • Other Vehicles • ATV • Trucks • Utes

1002801 Opportunities to Enhance Energy Efficiency and Minimise Greenhouse Gases 55
• Other Earth Works • Excavator • Bulldozer • Scraper • Grader • Other Maintenance • Workshop • Welder • Generator • Other

1002801 Opportunities to Enhance Energy Efficiency and Minimise Greenhouse Gases 56
10.4 Nursary Production Processes and (Drop Down) Operations Planting • Prepare material • Potting • Germination • Other In Crop • Heating • Plant environment • Crop Maintenance • Other Pumping and irrigation • Water Harvest • Water Transfer • Irrigation Harvest • Product Transfer • Road transport • Other Estate • Vehicles • Maintenance • Other

1002801 Opportunities to Enhance Energy Efficiency and Minimise Greenhouse Gases 57
Operations and (Drop Down) Practices Prepare Material • Mixing material • Convey Material • Other Potting • Potting machine • Conveyor • Spraying • Other Germination • Refrigeration • Heating • Lighting • Humidifying • Other Heating • Diesel Boiler • Diesel Heat Exchanger • Gas Heater • Electric Water Heater • Other Plant Environment • Lighting • Air Circulation • Humidity • Open/Close storage • Other Crop Maintenance • Re-Potting • Spraying • Fertilizing • Other Water harvest • Bore • Sump • River/Creek • Purchased • Other Water Transfer

1002801 Opportunities to Enhance Energy Efficiency and Minimise Greenhouse Gases 58
• Pump • Gravity • Other Irrigation • Sprinkler • Drip Harvesting • Conveyor • Treatment • Other Road Cartage • Road Cartage • Rail Transport • Other Vehicles • ATV • Utility Vehicle • Truck • Company Vehicle • Bobcat • Forklift • Other Maintenance • Workshop • Welder • Generator • Other
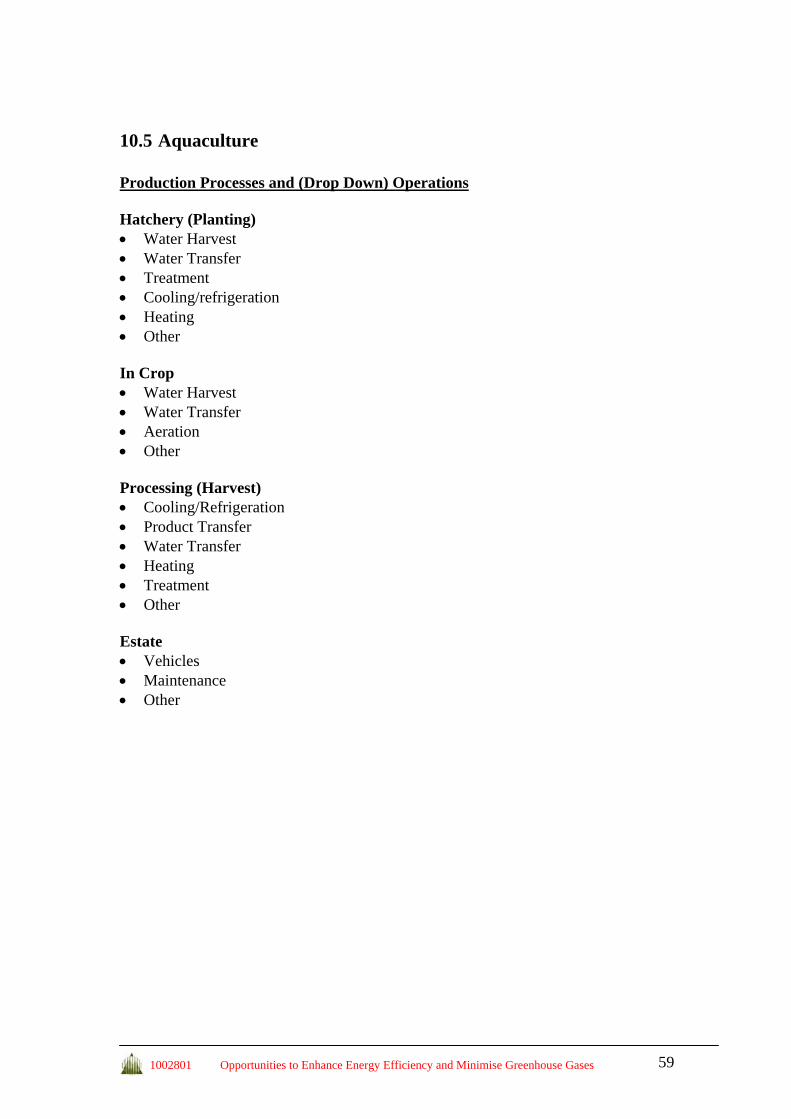
1002801 Opportunities to Enhance Energy Efficiency and Minimise Greenhouse Gases 59
10.5 Aquaculture Production Processes and (Drop Down) Operations Hatchery (Planting) • Water Harvest • Water Transfer • Treatment • Cooling/refrigeration • Heating • Other In Crop • Water Harvest • Water Transfer • Aeration • Other Processing (Harvest) • Cooling/Refrigeration • Product Transfer • Water Transfer • Heating • Treatment • Other Estate • Vehicles • Maintenance • Other

1002801 Opportunities to Enhance Energy Efficiency and Minimise Greenhouse Gases 60
Operations and (Drop Down) Practices Water harvest • Bore • Sump • River/Creek • Purchased • Other Water Transfer • Pump • Gravity • Other Treatment • Ozonator • Steam Generator • Lighting • Blower • Other Cooling/Refrigeration • Refrigeration • Freezer • Ice Machine • Air Conditioner • Other Heating • Diesel Boiler • Diesel Heat Exchanger • Gas Heater • Electric Water Heater • Gas Cooker • Other Aeration • Aerator • Force 7 • Water Circulation • Other Product Transfer • Conveyor • Bin Tipper • Hoist • Other

1002801 Opportunities to Enhance Energy Efficiency and Minimise Greenhouse Gases 61
Vehicles • ATV • Utility Vehicle • Truck • Company Vehicle • Bobcat • Forklift • Other Maintenance • Workshop • Welder • Generator • Compressor • Other

1002801 Opportunities to Enhance Energy Efficiency and Minimise Greenhouse Gases 62
11 APPENDIX B – DETAILED INDIVIDUAL CASE STUDY REPORTS
11.1 Case study 1 (Cotton) This site is a surface irrigated farm covering 840 Ha and located west of Dalby in South East Queensland. 250Ha of the farm is planted with cotton, 250Ha with sorghum/corn and 150Ha with Wheat. The site has previously had a level two audit conducted as part of a previous project with the NCEA. Two visits were conducted to the site, the first as a scoping visit to investigate the site and determine items for testing, the second visit was to demonstrate the effect of tractor set up on fuel usage. This was conducted with the assistance of a farm manager and a John Deere 8520 tractor with a fuel usage computer. The tractor operator demonstrated how the fuel usage of a particular operation can be minimised by effective tractor set up. The findings of this testing are contained within a separate report. The site has begun to collect detailed fuel records for all operations performed in each field. Some of these records have been used in this report, however the remainder of the fuel usage values were estimated by the operators because these operations have not been conducted since the record taking has begun. No pumping operations have occurred during the trial so energy usages were estimated. Detailed records will also be undertaken for the energy consumed in pumping operations. The farm manager described the difficulty in producing accurate fuel usage values as the usage is affected by different conditions, row spacing and application rates and also varies from season to season and property to property.
Ground preparation for a winter wheat crop.

1002801 Opportunities to Enhance Energy Efficiency and Minimise Greenhouse Gases 63
SUMMER – COTTON (250 Ha) Fallow
• 2 x boom sprays (herbicide) • Fertilise using a direct drill planter
Planting
• Direct drill planter JD Maximerge planter In-crop
• 2 x sprays herbicides (shielded or boom spray) • 2 x boom sprays (insecticide) • 2 x boom sprays (defoliate cotton)
Irrigate
• No Figures available - Pumps not operated during trial - Estimated from basic details or other operations
• Assume 5 ML / Ha - 35% of water from Bores (700ML out of 2000ML) remainder flood/sump harvested
• Water double pumped i.e. out of a bore and into storage; out of storage onto field
Harvesting
• 1 x cotton picker (3 row machine i.e. 1 row on 2m bed) • 1 x module builder • 2 x boll buggies (infield transport)
Post harvest
• 1 x Mulcher • 1 x Gessner root cutter
Fuel Usage Data Operation Operations L/Ha Herbicide Spray 4 0.35 Direct Drill Fertilizer 1 2.9 Planting - MaxEmerge 1 2 Insecticide Spray 2 0.35 Defloiate Spray 2 0.35 Cotton Picker 1 15 Module Builder 1 2 Boll Buggy 2 3.5 Mulcher 1 8.9 Root Cutter 1 1.6

1002801 Opportunities to Enhance Energy Efficiency and Minimise Greenhouse Gases 64
An irrigation pump which was not in operation during the period of the audit

1002801 Opportunities to Enhance Energy Efficiency and Minimise Greenhouse Gases 65
SORGHUM / CORN (250 Ha) Fallow
• Fertilise using direct till planter • Clean out furrows with light cultivation • 3 to 4 x herbicide sprays to maintain fallow (depending on 12 or 18 month
fallow) Planting
• 1 x direct drill planter (JD Maximerge) In-crop
• 1 x herbicide boom spray (Atrazine) • 1 x insecticide boom spray • 1 x sprayout sorghum
Irrigate
• No Figures available - Pumps not operated during trial - Estimated from basic details or other operations
• Assume 5 ML / Ha - 35% of water from Bores (700ML out of 2000ML) remainder flood/sump harvested
• Water double pumped i.e. out of a bore and into storage; out of storage onto field
Harvesting
• 1 x header • 2 x chaser bins
Fuel Usage Data Operation Operations L/Ha Herbicide Spray 5 0.35 Direct Drill Fertilizer 1 2.9 Light Cultivation 1 3.5 Prepare Seedbed 1 3.5 Planting - MaxEmerge 1 2 Insecticide Spray 1 0.35 Spray out Sorghum 1 0.35 Harvester 1 12 Chaser Bin 2 3.5

1002801 Opportunities to Enhance Energy Efficiency and Minimise Greenhouse Gases 66
WINTER – WHEAT (150 Ha) Fallow
• Pupae bust with offsets (6 m) • Level ground and clods with railway irons
Planting
• 1x Gyral combine Incrop
• 2 x sprays (24m boom spray / spray coupe) Irrigation
• Dryland Harvesting (15 L/Ha)
• 1 header • 2 x chaser bins
Fuel Usage Data Operation Operations L/Ha Pupate Bust with Offset 1 7.5 Level Ground 1 3 Gyral Combine 1 4.5 Herbicide Spray 2 0.35 Harvester 1 12 Chaser Bins 2 3.5
RESULTS Using the data from the site summaries, the energy usage for was calculated. Pump energy usage has been assumed to be simular to the tested values at other sites. The figures shown for L/Ha are the total values and include multiple operations in some cases. Percentage values reflect the percentage of the total energy source used on the product. The costs are provided as a guide only and assume diesel is $1.18/L and electricity averages $0.1/kWh although energy costs are currently quite volatile.

1002801 Opportunities to Enhance Energy Efficiency and Minimise Greenhouse Gases 67
Totals Total Diesel (L) Electricity (kWh) Ha $ Cotton 129.4 414.3 250 $48,539.80 Sorghum/Corn 85.7 248.6 250 $31,495.99 Wheat 34.7 0.0 150 $6,141.90
Energy Usage Breakdown Crop COTTON DIESEL L/Ha % Herbicide Spray 1.4 1.1 Direct Drill Fertilizer 2.9 2.2 Planting - MaxEmerge 2.0 1.5 Insecticide Spray 0.7 0.5 Defloiate Spray 0.7 0.5 Cotton Picker 15.0 11.6 Module Builder 2.0 1.5 Boll Buggy 7.0 5.4 Mulcher 8.9 6.9 Root Cutter 1.6 1.2 TOTAL OPERATION 42.2 32.6 Pump 42.3 32.6 Dam to Head Ditch 45.0 34.8 TOTAL WATER 87.3 67.4 TOTAL 129.4 100.0 ELECTRICITY kWh/Ha % Bore 414.3 100.0 TOTAL 414.3 100 TOTAL % Diesel ElectricityOPERATIONS 42.2 0.0 WATER 87.3 414.3 TOTAL 129.4 414.3 ENERGY TOTAL (MJ) 4996.1 1491.5 COST TOTAL 152.7 41.4
Crop Sorghum DIESEL L/Ha % Herbicide Spray 1.8 2.0 Direct Drill Fertilizer 2.9 3.4 Light Cultivation 3.5 4.1 Prepare Seedbed 3.5 4.1 Planting - MaxEmerge 2.0 2.3 Insecticide Spray 0.4 0.4 Sprayout sorghum 0.4 0.4

1002801 Opportunities to Enhance Energy Efficiency and Minimise Greenhouse Gases 68
Harvester 12.0 14.0 Chaser Bin 7.0 8.2 TOTAL OPERATION 33.4 38.9 Pump 25.4 29.6 Dam to Head Ditch 27.0 31.5 TOTAL WATER 52.4 61.1 TOTAL 85.7 100.0 ELECTRICITY kWh/Ha % Bore 248.6 100.0 TOTAL 248.6 100 TOTAL Diesel ElectricityOPERATIONS 33.4 0.0 WATER 52.4 248.6 TOTAL 85.7 248.6 ENERGY TOTAL (MJ) 3308.0 894.9 COST TOTAL 101.1 24.9
Crop Wheat DIESEL L/Ha % Pupate Bust with Offset 7.5 21.6 Level Ground 3.0 8.6 Gyral Combine 4.5 13.0 Herbacide Spray 0.7 2.0 Harvester 12.0 34.6 Chaser Bins 7.0 20.2 TOTAL OPERATION 34.7 100.0 TOTAL % Diesel ElectricityOPERATIONS 34.7 0.0 TOTAL 34.7 0.0 ENERGY TOTAL (MJ) 1339.4 0.0 COST TOTAL 40.9 0.0
Discussion and recommendations The results show harvesting and irrigating water is still by far the highest energy usage (more than 60% for both irrigated crops). These figures have been assumed as no values were able to be tested. It is recommended the pumping operations are tested to determine the total energy used by each pump and if any efficiency gains can be made in the pumping operations. This could significantly reduce the overall fuel consumption on the site. The fuel usage on the site is minimised by good operator practice and set up of machinery. The equipment used provides information that assists in good fuel usage performance for the operations performed. It is not anticipated the fuel usage is the best possible at the site given the current practice and conditions.

1002801 Opportunities to Enhance Energy Efficiency and Minimise Greenhouse Gases 69
11.2 Case study 2 (Cotton and Sorghum) This site was located near Jandowae in South East Queensland. The farm comprises 248 Ha of surface irrigated land with an additional 20 Ha of non irrigated land. The land is farmed in a rotation of Cotton and Sorghum although recently the farm has been exclusively cropped with sorghum due to reduced water and farm input requirements. This site has previously had a level 2 energy audit undertaken by the NCEA. The level 2 audit demonstrated a significant amount of the energy consumed on the property was in pumping water for irrigation. This site was selected for some detailed pump testing to determine energy usage during the pumping operation and to try to identify ways to reduce the overall energy costs of these operations. A separate report is included for this testing. The farm owner stated the diesel usage for pumping was the most significant energy usage on the property, with the bores being an especially costly supply of water. The detailed pump testing was conducted on the property during the second site visit. Fuel records were unavailable during the period of this study as the operations were not performed. The owner was able to source fuel usage records for some operations, and gained others from contractors that work on his property. The remainder of the fuel usage data was calculated using the method described in the level 2 energy audit procedure. Diesel was the only energy source used on the property.
The main irrigation pump responsible for a large amount of the energy consumed at the site.

1002801 Opportunities to Enhance Energy Efficiency and Minimise Greenhouse Gases 70
SUMMARY OF OPERATIONS SUMMER – COTTON (120 Ha Wet year/0 Ha Dry Year) Fallow
• 1 x side buster - hill up and fertilise in one pass • 1 x cultipacker • 2 herbicide boom sprays to maintain weeds in fallow
Planting
• Direct drill planter JD MaxEmerge planter (8.8 Ha / Hr) In-crop
• 1 x boom spray (pre-emergent or post emergent depending on roundup ready) • 2 x boom sprays (insecticide) • 1 x aerial sprays (insecticide) • 2 x inter-row cultivations • 2 x aerial sprays (defoliate cotton)
Irrigate
• 6 ML / Ha Applied • Water Harvested from Sump (55%), Creek (25%) and Bores (20%) • 300ML water transferred between storages (12.4L/ha) • Water pumped into storage; out of storage onto field (10.8L/ML) • Pumping costs tested price dependant on pumping rate.
Harvesting
• 1 x cotton picker (JD 9976) (all fuel figures combined) • 2 x module builders • 1 x boll buggy
Post harvest
• 1 x Jenke Eliminator Mulcher

1002801 Opportunities to Enhance Energy Efficiency and Minimise Greenhouse Gases 71
Fuel Usage Data Operations OPERATIONS Operations Tractor L/Ha Total L/Ha Side Buster 1 MX 240 6.9 6.9 Cultipacker 1 JD 8200 2.8 2.8 Herbicide Spray 3 JD 8200 0.7 2.0 Planting - MaxEmerge 1 JD 8200 3.5 3.5 Insecticide Spray 2 JD 8200 0.7 1.4 Aerial Spray - Insecticide 2 - 0.0 0.1 Inter Row Cultivation 2 JD 8200 5.4 10.8 Aerial Spray - Defoliate 2 - 0.0 0.1 Cotton Picker 1 JD9970 33.1 33.1 Mulcher 1 MX 270 10.4 10.4
Table showing the fuel usage for each farming operation Water Harvest
WATER HARVEST
Fuel L/Hr
Flow Rate L/s
% of water Supply ML/Ha* L/Ha*
Sump to Dam 1 6.9 163 40% 2.4 28.2 Creek to Dam 1 10.6 206.4 5% 0.3 4.3 Sump to Dam 2 6.9 163 15% 0.9 10.6 Creek to Dam 2 10.6 206.4 20% 1.2 17.1 Bore 1 to Dam 2 7.4 25.8 10% 0.6 47.8 Bore 2 to Dam 2 10.9 35 10% 0.6 51.9
Fuel usage for water harvest * Figures consider the water is divided up as the percentage supply indicated

1002801 Opportunities to Enhance Energy Efficiency and Minimise Greenhouse Gases 72
SUMMER – SORGHUM (40 Ha Wet Year/200Ha Dry Year) Fallow
• 1 x side buster - hill up and fertilise in one pass • 1 x cultipacker • 2 x herbicide boom sprays to maintain weeds in fallow
Planting
• 1x direct drill MaxEmerge planter • 1 x herbicide boom spray (pre emergence – paraquat and atrazine)
In-crop
• 1 x herbicide sprays (atrazine and starane) • 1 x inter-row cultivation • 1 x spray out sorghum
Irrigate
• 3 ML / Ha Applied • Water Harvested from Sump (55%), Creek (25%) and Bores (20%) • 200ML water transferred between storages (12.4L/ha) • Water pumped into storage; out of storage onto field (10.8L/ML) • Pumping costs tested price dependant on pumping rate.
Harvesting
• 1 header (2188 CASE) • 2 x chaser bins (mud buggies) • 1 x semi trailer to SILO (4 kms)

1002801 Opportunities to Enhance Energy Efficiency and Minimise Greenhouse Gases 73
Fuel Usage Data Operations Operations Tractor L/Ha Total L/Ha Side Buster/furrowing up 1 180 hp (JD8200) 5.8 5.8 Fertilizing 1 180hp (JD 8200) 4.2 4.2 Herbicide Spray 3 180 hp (JD8200) 0.7 2.0 Planting - MaxEmerge 1 180 hp (JD8200) 3.1 3.1 Inter Row Cultivation 1 180 hp (JD8200) 5.3 5.3 Spray Out Sorghum 1 Nitro sprayer 1.2 1.2 Harvester 1 JD 9600 6.0 6.0 Chaser Bin 2 180 hp (JD8200) 2.0 4.0 Field Bin 1 Fiat 650 0.35 0.35
Table showing the fuel usage for each farming operation Water Harvest WATER HARVEST Fuel/Hr
Flow Rate L/s
% Of water Supply ML/Ha* L/Ha*
Sump to Dam 1 6.9 163 40.0% 1.2 14.1 Creek to Dam 1 10.6 206.4 5.0% 0.15 2.1 Sump to Dam 2 6.9 163 15.0% 0.45 5.3 Creek to Dam 2 10.6 206.4 20.0% 0.6 8.6 Bore 1 to Dam 2 7.4 25.8 10.0% 0.3 23.9 Bore 2 to Dam 2 10.9 35 10.0% 0.3 26.0
Fuel usage for water harvest * Figures consider the water is divided up as the percentage supply indicated
RESULTS Using the data from the site summaries, the energy usage for was calculated. Totals were created to show the difference in energy usage when planting a wet season rotation of 120Ha of Cotton and 40 Ha of Sorghum, and then dryer season with 200Ha of sorghum. Pump energy usage of pump 1 has been assumed to be the same as the tested values of pump 2. It was also assumed the irrigation channel pumping tested was the average case. The figures shown for L/Ha are the total values and include multiple operations in some cases. Percentage values reflect the percentage of the total diesel used in on the product. The costs are provided as a guide only and assume diesel is $1.18/L although energy costs are currently quite volatile. Totals Crops Operations (L) Water (L) TOTAL (L) Cotton + Sorghum (L) 3637 13404 17041 Sorghum (L) 6385 18471 24856

1002801 Opportunities to Enhance Energy Efficiency and Minimise Greenhouse Gases 74
Energy usage breakdown Cotton OPERATION L/Ha % 120 Ha Side Buster 6.88 2.10 252.6 Cultipacker 2.78 0.85 102.1 Herbicide Spray 2.03 0.62 74.6 Planting - MaxEmerge 3.55 1.09 130.3 Insecticide Spray 1.35 0.41 49.7 Aerial Spray - Insecticide 0.07 0.02 2.6 Inter Row Cultivation 10.75 3.29 395.1 Aerial Spray - Defoliate 0.07 0.02 2.6 Cotton Picker 33.12 10.14 1216.6 Mulcher 10.43 3.19 383.1 OPERATION TOTAL 71.02 21.74 2609.26 WATER Sump to Dam 1 28.22 8.64 1036.8 Creek to Dam 1 4.28 1.31 157.2 Sump to Dam 2 10.58 3.24 388.8 Creek to Dam 2 17.12 5.24 628.9 Bore 1 to Dam 2 47.80 14.64 1756.2 Bore 2 to Dam 2 51.90 15.89 1906.9 Dam 2 to Dam 1 31.00 9.49 1138.9 Pump into Head Ditch 64.70 19.81 2377.0 WATER TOTAL 255.61 78.26 9390.74 TOTAL 326.63 100.00 12000.00
Fuel Usages for Each Operation - Cotton
0.00
5.00
10.00
15.00
20.00
25.00
Side B
uster
Cultipa
cker
Herbici
de S
pray
Plantin
g - M
axEmerg
e
Insec
ticide
Spra
y
Aerial
Spray -
Inse
cticid
e
Inter
Row C
ultiva
tion
Aerial
Spray -
Defo
liate
Cotton
Harv
est
Mulche
r
Sump t
o Dam
1
Creek t
o Dam
1
Sump t
o Dam
2
Creek t
o Dam
2
Bore 1
to Dam
2
Bore 2
to Dam
2
Dam 2
to Dam
1
Pump i
nto H
ead D
itch
% F
uel U
sage

1002801 Opportunities to Enhance Energy Efficiency and Minimise Greenhouse Gases 75
Sorghum OPERATION L/Ha % 40 Ha 200 Ha Side Buster/furrowing up 5.76 4.63 185.2 1151.0 Fertilizing 4.18 3.36 134.5 835.7 Herbicide Spray 2.03 1.63 65.4 406.3 Planting - MaxEmerge 3.13 2.52 100.7 625.7 Inter Row Cultivation 5.33 4.29 171.6 1066.4 Spray Out Sorghum 1.15 0.93 37.0 230.0 Harvester 6.00 4.83 193.1 1200.0 Chaser Bin 4.00 3.22 128.7 800.0 Field Bin 0.35 0.28 11.3 70.0 OPERATION TOTAL 31.93 25.69 1027.5 6385.1 WATER Sump to Dam 1 14.11 11.35 454.1 2822.1 Creek to Dam 1 2.14 1.72 68.9 428.0 Sump to Dam 2 5.29 4.26 170.3 1058.3 Creek to Dam 2 8.56 6.89 275.5 1711.9 Bore 1 to Dam 2 23.90 19.23 769.3 4780.4 Bore 2 to Dam 2 25.95 20.88 835.3 5190.5 Dam 2 to Dam 1 12.40 9.98 399.1 2480.0 Pump into Head Ditch 32.35 26.03 1041.2 6470.1 WATER TOTAL 92.36 74.31 4013.68 18471.1 TOTAL 124.28 100.00 5041.20 24856.14
Fuel Usages for Each Operation - Sorghum
0.00
5.00
10.00
15.00
20.00
25.00
30.00
Side B
uster
Cultipa
cker
Herbici
de S
pray
Plantin
g - M
axEmerg
e
Insec
ticide
Spra
y
Aerial
Spray -
Inse
cticid
e
Inter
Row C
ultiva
tion
Aerial
Spray -
Defo
liate
Cotton
Harv
est
Sump t
o Dam
1
Creek t
o Dam
1
Sump t
o Dam
2
Creek t
o Dam
2
Bore 1
to Dam
2
Bore 2
to Dam
2
Dam 2
to Dam
1
Pump i
nto H
ead D
itch
% F
uel U
sage

1002801 Opportunities to Enhance Energy Efficiency and Minimise Greenhouse Gases 76
Comparison of Previous Values Crop Cotton OPERATION L/Ha L/Ha Text Diff/100 Ha Side Buster 6.88 18.00 1112.5 Cultipacker 2.78 5.00 222.0 Herbicide Spray 0.68 2.00 132.3 Planting - MaxEmerge 3.55 5.00 145.5 Insecticide Spray 0.68 2.00 132.3 Aerial Spray - Insecticide 0.04 0.04 0.0 Inter Row Cultivation 5.38 5.00 -37.7 Aerial Spray - Defoliate 0.04 0.04 0.0 Cotton Harvest 33.12 49.00 1588.5 Mulcher 10.43 10.00 -42.8 DIFFERENCE TOTAL 3252.52 Crop Sorghum OPERATION L/Ha L/Ha Text Diff/100 Ha Side Buster/furrowing up 5.76 18.00 1224.5 Fertilizing 4.18 5.00 82.1 Herbicide Spray 0.68 2.00 132.3 Planting - MaxEmerge 3.13 5.00 187.2 Inter Row Cultivation 5.33 5.00 -33.2 Spray Out Sorghum 1.15 2.00 85.0 Harvester 6.00 20.00 1400.0 Chaser Bin 2.00 2.00 0.0 Field Bin 0.35 2.00 165.0 DIFFERENCE TOTAL 3242.88
Table comparing the literature fuel usage values used in the level 2 audit with the values derived with the farmer Discussion and recommendations The results show harvesting and irrigating water is still by far the highest energy usage (more than 74% for both crops). It has been assumed pump 1 uses a simular amount of fuel to pump 2 which was tested. The energy usage takes into account the reduced fuel usage due to changes in operation during testing. It is recommended the pump is further investigated as suggested in the pump testing case study. This could significantly reduce the overall fuel consumption on the site. The fuel usage values sourced from the farm operator are significantly lower than those used in the previous level 2 audit. Both of the crops would have had the fuel usage overestimated by over 3200L for a 100 hectare crop or 32L/Ha. This is a significant difference, as it represents a reduction of 50% for the Sorghum and 30% for the Cotton. The previous study significantly overestimated the fuel used in the side busting and harvesting. These differences demonstrate the advantages in auditors calculating the figures rather than using default values in the EnergyCalc program.

1002801 Opportunities to Enhance Energy Efficiency and Minimise Greenhouse Gases 77
11.3 Case study 3 (Sugarcane) This site is located near Childers in South East Queensland. The farm produces sugar cane for five years which is rotated with a crop of soybeans or watermelons in the break years. The farm area covers 122.8 hectares and all except 2.8Ha is all irrigated. The farm is in the process of changing the spacing of the sugarcane planted increasing the spacing width from 1.53m to 1.83m. This will convert the farm to controlled traffic as the 1.83m is the same spacing as the heavy cane harvesting equipment. Controlled traffic will reduce the amount of preparation operations occurring on the farm, as the soil tillage practices will change. This will lead to a reduction in the energy used in the planting operation. Preparation for a cane plant is dependant on the crop grown in the field previously, hence the preparation for the cane plant is added to the energy required for the previous crop. During the site visit two of the main pumps were tested to measure the water flow and energy used. The current supplied to one of the bore pumps was recorded from a gauge on the electrical box. Many of the operations performed on the farm did not occur during the period of this trial. The fuel usage for these operations was estimated using a level 2 calculations.

1002801 Opportunities to Enhance Energy Efficiency and Minimise Greenhouse Gases 78
SUGARCANE – (95.65 Ha) 4 Year Crop Preparation
• Operations dependant on crop cane is following - listed after other crops • 1 x Mark out cane
Planting
• 1 x MF 102 Cane Harvester • 1 x Transport (Tipper Bins) • 1 x Planting - 1 Row billet planter
In-crop (Plant Year)
• 3 x Cultivation - 3 Row Multi Weeder • 1 x Pre Emergent Herbicide • 1 x Cultivation • 1 x Herbicide Spray • 2 x Fertilizer (Double Row)
In-crop (Ratoon Year - 4 Years)
• 1 x Finger Wheel Rake • 1 x Herbicide Spray • 2 x Fertilizer (Double Row)
YEARLY OPERATIONS Irrigate
• Turbine Driven Travelling Irrigator • Some Furrow
Harvesting
• 1 x Cane Harvester • 3 x Haulage Bins

1002801 Opportunities to Enhance Energy Efficiency and Minimise Greenhouse Gases 79
Cane Energy Usage PLANT YEAR Operations L/Ha Markout Cane 1 7.5 Planting system 1 48.5 Herbicide Spray 1 4.4 Row Cultivation - 3 Row 3 8.8 Fertilizer - Double Row 2 13.2 Irvin Spray Boom 1 7.0 Cane Harvester and Haulage 1 120 RATOON YEAR Finger Wheel Rake 1 0.8 Irvin Spray Boom 1 7.0 Ratoon Fertilize 1 7.0 Cane Harvester and Haulage 1 120
IRRIGATION Pump Size
(kW) Flow
(L/hr) Ha
Covered kWh/Ha* Over road pump 50 36 15.75 222.3 Pump 2 44.5 32.6 15.75 218.5 Pump 3 44.5 32.6 25.72 356.9 Pump 4 44.5 32.6 29.36 407.4 Home Bore - Irrigation 10 11 3.5 32.3 Diesel Pump 2.77 3.4** Dry Land 0 2.8 0
* Figure considers area percentage **L/Ha

1002801 Opportunities to Enhance Energy Efficiency and Minimise Greenhouse Gases 80
Soy Beans – (14.88 Ha) Preparation
• 2 x Rotary Hoe • 1 x Ripper • 1 x Contract Lime application (75%) or Filter Press (25%)
Planting
• 1 x Contract Planting - Maximerge In-crop
• 2 x Herbicide Spray • 1 x Insecticide (Sometimes Helicopter) • 1 x Spray Defoliate
Harvesting
• 1 x Contract Harvester • 1 x Chaser Bins - Limited Use
Preparation for Cane
• 1 x Herbicide spray • 1 x Light Ripper
Soy Beans Energy Usage Operation Operations L/Ha Rotary Hoe 2 37 Rip Soil 1 22 Contract Lime Application 1 2.8 Contract filter press 1 39.6 Contract Planting 1 9.7 Herbicide Spray 2 4.4 Insecticide Spray 1 4.4 Defoliate Spray 1 4.4 Row Cultivation - 3 Row 1 8.8 Contract Harvester 1 11.0 Herbicide Spray 1 4.4 Rip Soil 1 8

1002801 Opportunities to Enhance Energy Efficiency and Minimise Greenhouse Gases 81
IRRIGATION Pump Size (kW) Flow L/hr Ha Covered kWh/Ha*
Pump 3 44.5 32.6 8.09 721.5 Pump 4 44.5 32.6 4.02 358.5
Diesel Pump 2.77 21.5** * Figure considers area percentage **L/Ha Watermelons – (12.26 Ha) Preparation
• 2 x Rotary Hoe • 1 x Ripper • 2 x Howard swing plough • 1 x Ripper • 1 x Rotary Hoe • 1 x Mark Out - 2 row bar • 1 x Fertilizer x Mound • 1 x Rotary Hoe - Bed Forming • 1 x Plastic Mulch & Trickle Tape
Planting
• 1 x Planting with Seedling Planter In-crop
• 1 x Herbicide Spray • 10 x Fungicide/Insecticide spray
Irrigate
• Trickle Tape (3 x Weekly) • Mostly Gravity feed some pumped from Bore
Harvesting
• 1 x Tractor + Trailer (Hand Picked) Post harvest
• 1 x Spray Herbicide • 1 x Pick up Mulch (Lifter and Winder) • 1 x Burn Mulch (No Energy Required) • 1 x Pull up tape with Tractor • 1 x Wind up tape with Tractor • 1 x Offset Disk Pass
Preparation for Cane • 1 x Ripper • 1 x Howard swing plough • 1 x Offset disc • 2 x Rotary Hoe

1002801 Opportunities to Enhance Energy Efficiency and Minimise Greenhouse Gases 82
Watermelon energy usage Operation Operations L/Ha Rotary Hoe 2 37 Rip Soil 1 22 Howard Swing Plow 2 37 Mark Out - Two row bar 1 18.5 Fertilizer and Mound 1 22.5 Rotary Hoe + Bed Forming 1 26.4 Plastic Mulch + Trickle Tape 1 22.5 Plant Seedlings 1 15.9 Herbacide Spray 1 8.4 Insecticide/Fungacide Spray 10 8.4 Tractor and Trailer Picking 4 24.7 Pick Up Mulch 1 22.0 Pull up Tape and Wind 1 39.6 Rip 1 22 Howard Swing Plow 1 37.4 Offset Disk 1 6.6 Rotary Hoe 2 37
IRRIGATION Pump Size (kW) Flow L/hr Ha Covered kWh/Ha*Sun Water Trickle 0 - 4.27 0.0 Other Bore - Irrigation 6 6 8.09 641.5
* Figure considers area percentage

1002801 Opportunities to Enhance Energy Efficiency and Minimise Greenhouse Gases 83
Results Using the data from the site summaries, the energy usage for was calculated. Totals assumed 4 ratoon's of cane per plant and assumed 20% of all cane was in a plant year. Pump energy usage of pump 3 and 4 have been assumed to be the same as the tested values of pump 2. The figures shown for L/Ha are the total values and include multiple operations in some cases. Percentage values reflect the percentage of the total diesel used in on the product. The costs are provided as a guide only and assume diesel is $1.18/L and electricity is and average of $0.1/kWh although energy costs are currently quite volatile. Totals
Total Diesel (L)
Electricity (kWh) Ha $
Cane 159.3 1237.4 95.65 $29,816.43 Soybeans 189.1 1080.1 14.88 $4,926.67 Watermelons 668.7 641.5 12.26 $10,460.90
Energy Usage Breakdown Crop SUGAR CANE DIESEL - PLANT YEAR (20%) L/Ha % Markout Cane 7.5 3.1 Planting system 48.5 19.9 Herbicide Spray 4.4 1.8 Row Cultivation - 3 Row 26.4 10.8 Fertilizer - Double Row 26.4 10.8 Irvin Spray Boom 7.0 2.9 Cane Harvester and Haulage 120.0 49.2 TOTAL PLANTING 240.3 98.6 Irrigation - Diesel Pump 3.4 1.4 TOTAL PLANT YEAR 243.7 100.0 DIESEL - RATOON YEAR (80%) L/Ha % Finger Wheel Rake 0.8 0.6 Irvin Spray Boom 7.0 5.1 Ratoon Fertilize 7.0 5.1 Cane Harvester and Haulage 120.0 86.8 TOTAL RATOON 134.9 97.6 Irrigation - Diesel Pump 3.4 2.4 TOTAL RATOON YEAR 138.2 100.0 ELECTRICITY kWh/Ha % Over road pump 222.3 18.0 Pump 2 218.5 17.7 Pump 3 356.9 28.8 Pump 4 407.4 32.9 Home Bore - Irrigation 32.3 2.6 TOTAL 1237.4 100.0

1002801 Opportunities to Enhance Energy Efficiency and Minimise Greenhouse Gases 84
TOTAL Per Ha Cane Diesel ElectricityPlanting 48.1 0 Ratoon 107.9 0 Water 3.4 1237.4 TOTAL 159.3 1237.4 ENERGY TOTAL (MJ) 6149.2 4454.7 COST TOTAL ($) $188.00 $123.70
Crop SOY BEANS DIESEL L/Ha % Rotary Hoe 74.0 39.1 Rip Soil 22.0 11.6 Contract Lime Application (75%) 2.1 1.1 Contract filter press (25%) 9.9 5.2 Contract Planting 9.7 5.1 Herbicide Spray 8.8 4.7 Insecticide Spray 4.4 2.3 Defoliate Spray 4.4 2.3 Row Cultivation - 3 Row 8.8 4.7 Contract Harvester 11.0 5.8 Herbicide Spray 4.4 2.3 Rip Soil 8.0 4.2 TOTAL 167.5 88.6 Irrigation - Diesel Pump 21.5 11.4 TOTAL 189.1 100.0 ELECTRICITY kWh/Ha % Pump 3 721.5 66.8 Pump 4 358.5 33.2 TOTAL 1080.1 100.0 TOTAL Diesel ElectricityOperations 167.5 0 Water 21.5 1080.1 TOTAL 189.1 1080.1 ENERGY TOTAL (MJ) 7297.6 3888.2 COST TOTAL $223.10 $108.00

1002801 Opportunities to Enhance Energy Efficiency and Minimise Greenhouse Gases 85
Crop WATERMELLONS DIESEL L/Ha % Rotary Hoe 74.0 11.1 Rip Soil 22.0 3.3 Howard Swing Plough 74.0 11.1 Mark Out - Two row bar 18.5 2.8 Fertilizer and Mound 22.5 3.4 Rotary Hoe + Bed Forming 26.4 4.0 Plastic Mulch + Trickle Tape 22.5 3.4 Plant Seedlings 15.9 2.4 Herbicide Spray 8.4 1.3 Insecticide/Fungicide Spray 84.3 12.6 Tractor and Trailer Picking 98.7 14.8 Pick Up Mulch 22.0 3.3 Pull up Tape and Wind 39.6 5.9 Rip 22.0 3.3 Howard Swing Plough 37.4 5.6 Offset Disk 6.6 1.0 Rotary Hoe 74.0 11.1 TOTAL 668.7 100.0 ELECTRICITY kWh/Ha % Sun Water Trickle 0.0 0.0 Other Bore - Irrigation 641.5 100.0 TOTAL 641.5 100.0 TOTAL % Diesel Electricity Operations 668.7 0 Water 0.0 641.5 TOTAL 668.7 641.5 ENERGY TOTAL (MJ) 25812.9 2309.5 COST TOTAL $789.10 $64.15
Discussion and Recommendations Watermelons are much more energy intensive than the other crops grown on the farm (three times the energy used to produce sugar cane.) This is due to the extra tillage and soil preparation work that needs to occur both before the crop is planted and then following the crop to prepare the field for cane. Significant fuel savings could occur if some of these operations could be reduced. The owner stated by going to controlled traffic farming some of preparation work could be reduced on all crops which will help reduce the total energy used on the property. Specifically it should reduce the number of passes required with the rotary hoe and swing plough which are the highest energy users.

1002801 Opportunities to Enhance Energy Efficiency and Minimise Greenhouse Gases 86
11.4 Case study 4 (Sugarcane) This site is 2 is located near Childers in South East Queensland. The farm produces sugar cane for five years which is rotated with a crop of soybeans or peanuts in a break year. The farm area covers 828 hectares and is all irrigated. The farm is in the process of changing the spacing of the new sugarcane planted increasing the spacing width from 1.53m to 1.80m. This is to convert the farm to controlled traffic to the same spacing as the heavy cane equipment. The change in practice, coupled with the assistance of GPS has reduced the ground perpetration work required. The hard compacted soil is not worked up and less passes are required. This has removed the need to use the rotary hoe and swing plough two of the largest energy consumers. As a comparison the energy usage values for the change in operation have been included in this report. The change in practice represents a reduction in farm yearly fuel usage of 21 percent, and less than 1/4 of the energy inputs for crop preparation. The old operation practices have been included in this report as an example of the energy that can be saved. The farm operator has conducted extensive farm audits with the assistance of the FEET cane grower program. All of the data collected from this site is sourced from these resources. No testing was required as previous testing has been performed on the site to measure the effectiveness of the irrigation and pumping systems.

1002801 Opportunities to Enhance Energy Efficiency and Minimise Greenhouse Gases 87
SUGARCANE - Spring Plant – (118 Ha) Autumn Plant (20 Ha) Preparation
• 1 x Offset Disc (Spring Plant only) • 1 x Zonal Tiller
Planting
• 1 x Acquire Billets • 1 x Planting + applications
In-crop
• 2 x Herbicide Spray • 1 x Incorporator • 1 x Hilling up • 1 x Fill in
Irrigate
• Turbine Driven Travelling Irrigator/pivot (3.5ML/Ha) Harvesting
• 1 x Cane Harvester • 3 x Haulage Bins
Spring Plant Fuel Usage Operation Operations L/Ha Offset Disc 1 10.4 Zonal Tiller 1 11.5 Aquire Billets 1 11.9 Billet Planter + Applications 1 24.9 Spray Tank - Weeds 2 0.6 Incorporator 1 3.9 Hilling Up 1 4.3 Fill In 1 5.8 Harvest and Haulage 1 168.0
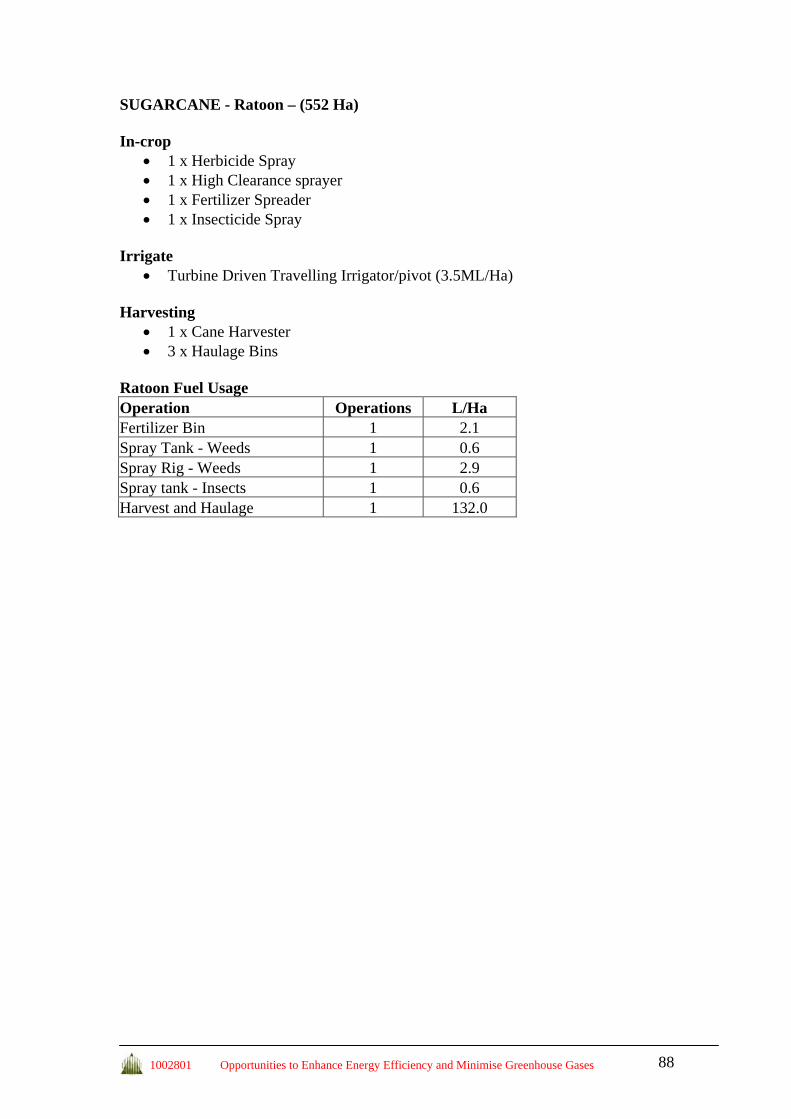
1002801 Opportunities to Enhance Energy Efficiency and Minimise Greenhouse Gases 88
SUGARCANE - Ratoon – (552 Ha) In-crop
• 1 x Herbicide Spray • 1 x High Clearance sprayer • 1 x Fertilizer Spreader • 1 x Insecticide Spray
Irrigate
• Turbine Driven Travelling Irrigator/pivot (3.5ML/Ha) Harvesting
• 1 x Cane Harvester • 3 x Haulage Bins
Ratoon Fuel Usage Operation Operations L/Ha Fertilizer Bin 1 2.1 Spray Tank - Weeds 1 0.6 Spray Rig - Weeds 1 2.9 Spray tank - Insects 1 0.6 Harvest and Haulage 1 132.0

1002801 Opportunities to Enhance Energy Efficiency and Minimise Greenhouse Gases 89
Soy Beans – (55.2 Ha) Preparation
• 3 x Offset Disc • 0.5 x Rotary Hoe • 1 x Bed Former
Planting
• 1 x Soy Planter In-crop
• 2 x Herbicide Spray • 2 x Insecticide Spray • 1 x Fertilizer spray • 1 x Spray Defoliate
Irrigate
• Turbine Driven Travelling Irrigator/pivot (3.5ML/Ha) Harvesting
• 1 x Contract Harvester (CR 970) Soy bean fuel usage Operation Operations L/Ha Offset Disc 3 10.4 Rotary Hoe 0.5 23.9 Bed Former 1 6.7 Soy Planter New 1 4.6 Peanut Sprayer - Fertilizer 1 0.9 Peanut Sprayer - Weeds 2 0.9 Peanut Sprayer - Insect 2 0.9 Peanut Sprayer - Defoliate 1 0.9 Harvesting - Contract 1 11.1

1002801 Opportunities to Enhance Energy Efficiency and Minimise Greenhouse Gases 90
Peanuts – (82.8 Ha) Preparation
• 3 x Offset Disc • 1 x Rotary Hoe • 1 x Bed Former
Planting
• 1 x Peanut Planter In-crop
• Fertilizer Spreader - Truck • 16 x Herbicide Spray • 9 x Fungicide spray
Irrigate
• Turbine Driven Travelling Irrigator/pivot (3.5ML/Ha) Harvesting
• 1 x Fluffing - Contract • 1 x Digging - Contract • 1 x Header - Contract
Operation Operations L/Ha Offset Disc 3 10.4 Rotary Hoe 1 23.9 Bed Former 1 6.7 Peanut Planter 1 2.8 Fertilizer spreader 1 2.4 Peanut Sprayer Weeds 16 0.9 Peanut Sprayer Disease 9 0.9 Fluffing - Contract 1 14.9 Digging - Contract 1 2.5 Header - Contract 1 40.0

1002801 Opportunities to Enhance Energy Efficiency and Minimise Greenhouse Gases 91
PREVIOUS OPERATIONS - Different Preparation SUGARCANE - Spring and Autumn Plant – (118 Ha) Preparation
• 2 x Offset Disc • 2 x 11 Tyne Ripper • 1 x Rotary 210 • 1 x Mark Out
SOY BEANS – (55.2 Ha) Preparation
• 2 x Offset Disc • 1 x Square Plough • 2 x 11 Tyne Ripper • 2 x Rotary Hoe • 1 x Bed Former
PEANUTS – (82.8 Ha) Preparation
• 2 x Offset Disc • 1 x Square Plough • 2 x 11 Tyne Ripper • 2 x Rotary Hoe • 1 x Bed Former
Previous operations fuel usage Operation Operations L/Ha Offset Disc 2 10.4 11 Tine Ripper 2 27.1 Rotary 210 1 21.0 Marking Out 1 2.6 Square Plow 1 40.9 Rotary Hoe 2 23.9 Bed Former 1 6.7

1002801 Opportunities to Enhance Energy Efficiency and Minimise Greenhouse Gases 92
Results Using the data from the site summaries, the energy usage for was calculated. Totals assumed 4 ratoon's of cane per plant and assumed 20% of all cane was in a plant year. Energy costs of the previous farming method are shown as a guide however detailed results are not included in this report. The figures shown for L/Ha are the total values and include multiple operations in some cases. Percentage values reflect the percentage of the total diesel used in on the product. The costs are provided as a guide only and assume diesel is $1.18/L and electricity is and average of $0.1/kWh although energy costs are currently quite volatile.
Energy usage Breakdown Crop SPRING CANE DIESEL L/Ha % Offset Disc 10.4 4.3 Zonal Tiller 11.5 4.8 Aquire Billets 11.9 4.9 Billet Planter + Applications 24.9 10.3 Spray Tank - Weeds 1.3 0.5 Incorporator 3.9 1.6 Hilling Up 4.3 1.8 Fill In 5.8 2.4 Harvest and Haulage 168.0 69.4 TOTAL 242.0 100.0 ELECTRICITY kWh/Ha % Water Part B 1438.9 100.0 TOTAL 1438.9 100.0 TOTALS Diesel ElectricityOperations 242.0 0 Water 0.0 1438.9
CURRENT Ha Diesel $ Electricity $ Total $ Spring Cane 138 242.0 $39,405.25 1438.9 $19,856.67 $59,261.92 Ratoon Cane 522 138.3 $85,157.20 1438.9 $75,110.00 $160,267.20Soybeans 52.2 70.8 $4,359.66 1027.8 $5,365.00 $9,724.66 Peanuts 82.8 105.9 $10,351.33 1438.9 $11,914.00 $22,265.33 Total 118028 $139,273.44 1122457 $112,245.67 $251,519.11
PAST Ha Diesel $ Electricity $ Total $ Spring Cane 138 328.8 $53,539.76 1438.9 $19,856.67 $73,396.42 Ratoon Cane 522 138.3 $85,157.20 1438.9 $75,110.00 $160,267.20Soybeans 52.2 191.6 $11,803.29 1027.8 $5,365.00 $17,168.29 Peanuts 82.8 254.6 $24,875.16 1438.9 $11,914.00 $36,789.16 TOTAL 148623 $175,375.42 1122457 $112,245.67 $287,621.08

1002801 Opportunities to Enhance Energy Efficiency and Minimise Greenhouse Gases 93
TOTAL 242.0 1438.9 ENERGY TOTAL (MJ) 9340.7 5180.0 COST TOTAL 285.5 143.9
Crop RATOON CANE DIESEL L/Ha % Fertilizer Bin 2.1 1.5 Spray Tank - Weeds 0.6 0.5 Spray Rig - Weeds 2.9 2.1 Spray tank - Insects 0.6 0.5 Harvest and Haulage 132.0 95.5 TOTAL 138.3 100.0 ELECTRICITY kWh/Ha % Water Part B 1438.9 100.0 TOTAL 1438.9 100.0 TOTALS Diesel Electricity Operations 138.3 0 Water 0.0 1438.9 TOTAL 138.3 1438.9 ENERGY TOTAL (MJ) 5336.5 5180.0 COST TOTAL 163.1 143.9
Crop SOYBEANS DIESEL L/Ha % Offset Disc 31.2 44.1 Rotary Hoe 12.0 16.9 Bed Former 6.7 9.5 Soy Planter New 4.6 6.5 Peanut Sprayer - Fertilizer 0.9 1.2 Peanut Sprayer - Weeds 1.7 2.4 Peanut Sprayer - Insect 1.7 2.4 Peanut Sprayer - Defoliate 0.9 1.2 Harvesting - Contract 11.1 15.7 TOTAL 70.8 100.0 ELECTRICITY kWh/Ha % Water Part B 1027.8 100.0 TOTAL 1027.8 100.0 TOTALS Diesel Electricity Operations 70.8 0 Water 0.0 1027.8 TOTAL 70.8 1027.8 ENERGY TOTAL (MJ) 2732.0 3700.0 COST TOTAL 83.5 102.8

1002801 Opportunities to Enhance Energy Efficiency and Minimise Greenhouse Gases 94
Crop PEANUTS L/Ha % Offset Disc 31.2 29.5 Rotary Hoe 23.9 22.6 Bed Former 6.7 6.4 Peanut Planter 2.8 2.7 Fertilizer spreader 2.4 2.2 Peanut Sprayer Weeds 13.8 13.0 Peanut Sprayer Disease 7.7 7.3 Fluffing - Contract 14.9 14.0 Digging - Contract 2.5 2.3 Header - Contract 40.0 37.8 TOTAL 105.9 100.0 ELECTRICITY kWh/Ha % Water Part B 1438.9 100.0 TOTAL 1438.9 100.0 TOTALS Diesel Electricity Operations 105.9 0 Water 0.0 1438.9 TOTAL 105.9 1438.9 ENERGY TOTAL (MJ) 4089.5 5180.0 COST TOTAL 125.0 143.9
Discussion and Conclusions The difference in energy usage between the past and current operating practices clearly demonstrated the energy savings which are possible due to GPS and controlled traffic. A saving of over 20% of the yearly diesel usage is very significant to farm profit and also to the environment. Preparation work was one of the biggest energy consumers within the operation. Other significant operations which consume energy are irrigation which the owner has had tested, and which are performing up to a suitable standard, and Cane harvesting. The cane harvesting figures are supplied by the growers co-operative which supplies the machine. Further work is being done to determine the fuel used by this unit including the fitting of a fuel flow metre. This should assist to operate the machine as efficiently as possible.

1002801 Opportunities to Enhance Energy Efficiency and Minimise Greenhouse Gases 95
11.5 Case study 5 (Horticulture) The site is a small crop farm located in the Lockyer Valley near Gatton in South East Queensland. The farm contains 171 hectares of beetroot, 171 hectares of wheat in winter and sorghum or mung beans during summer. The site consists of a number of separate blocks in the Lockyer valley area. The site had maintained exceptional operation records including the dates each operation was performed, the fuel used and the water applied. This improved the effectiveness of the overall audit as the manager was able to source the data simply from records on the computer. The manager stated the main energy cost on the site was the beetroot harvester. He suggested improvements to this machine would greatly assist the efficiency of his operation. During the second visit to the site testing was conducted to determine the power consumption of the electrical pumps used to transfer water from the main storage to the secondary storages ready for irrigation application. The pump at the secondary storage had been previously tested by Growcom. These results were used as part of this trial. Only energy was tested on the pumps as the ultra sonic flow sensor was not functioning correctly. The beetroot cleaning equipment intended to tested but in was undergoing maintenance when the trials were occurring. The owner estimated the power used in this process from the motor sizes and work load.

1002801 Opportunities to Enhance Energy Efficiency and Minimise Greenhouse Gases 96
OPERATION SUMMARY BEETROOT – (171 Ha) Preparation
• 2 x Rip Soil • 1 or 2 x Light Cultivation • 1 or 2 x Bed Forming • 1 or 2 x Herbicide Spray (Second with Fert) • 1 x Zinc Spray
Planting
• Planting In-crop
• 1 x Herbicide Spray • 2 x Insecticide Spray • 2 x Inter-row cultivation
Irrigate
• Diesel Operated Linear Move (Tractor) • Application dependant on need • Water Pumped Into Storage, To Secondary Storage, Then to an Irrigator - all
Electric • Average of 8 x 30mm applications - 2.4ML/ha
Harvesting
• 1 x Pulverising • 1 x Harvester • 2 x Chaser Bins
Post harvest
• Cleaning - Electric • Truck To Brisbane

1002801 Opportunities to Enhance Energy Efficiency and Minimise Greenhouse Gases 97
Beetroot Fuel Usage Operation Operations L/Ha Rip Soil 2 12.4 Light Cultivation 1 6.2 Bed Forming 1 11.1 Herbicide Spray 3 1.0 Fert Spray/spreading 1 0.8 Planting 1 4.9 Insecticide Spray 2 1.0 Inter-row Cultivation 2 4.0 Pulverising 1 4.0 Harvester 1 61.8 Chaser Bins 2 24.7 Cleaning (kW) 1 27.0
Water Transfer kW Used Flow Rate L/s Into Storage 160 1390 Into Holding 39.3* 55* Into Holding (Alternative) 31.8* 35 To Irrigator 50* 54*
*Tested Values

1002801 Opportunities to Enhance Energy Efficiency and Minimise Greenhouse Gases 98
Wheat – (171 Ha) - Winter Planting
• Planting - No Till In-crop
• 2 x Herbicide Spray • 1 x Fertilizer (Urea)
Harvesting
• 1 x Harvester Post harvest
• Truck To Brisbane Wheat Fuel Usage Operation Operations L/Ha Herbicide Spray 2 1.0 Fertilising 1 0.8 Planting 1 2.5 Harvester 1 11.9
Sorghum/Mung Beans – (171 Ha) - Summer Planting
• Planting - No Till In-crop
• 1 x Herbicide Spray • 1 x Fertilizer (Urea)
Harvesting
• 1 x Harvester Post harvest
• Truck To Brisbane Sorghum/Mung Beans Fuel Usage Operation Operations L/Ha Herbicide Spray 1 1.0 Fertilising 1 0.8 Planting 1 2.5 Harvester 1 11.9

1002801 Opportunities to Enhance Energy Efficiency and Minimise Greenhouse Gases 99
Results Using the data from the site summaries, the energy usage for operations and water usage were calculated. All the data has been based on figures provided by the owner. It has been assumed 30% of the water pumped into holding is pumped with the alternative pump. The figures shown for L/Ha are the total values and include multiple operations in some cases. Percentage values reflect the percentage of the total energy source used on the product. The costs are provided as a guide only and assume diesel is $1.18/L and electricity averages $0.1/kWh although energy costs are currently quite volatile. Total Crop Beetroot Wheat SorghumDiesel ($/Ha) 171.6 19.0 20.2 Electricity ($/Ha) 121.9 0.0 0.0 Ha 171 171 171 Total $36,711.73 $3,835.96 $4,076.83
Crop Breakdown Crop Beetroot DIESEL L/Ha % Rip Soil 12.4 8.5 Light Cultivation 6.2 4.2 Bed Forming 11.1 7.6 Herbicide Spray 1.0 0.7 Fert Spray/spreading 0.8 0.5 Planting 4.9 3.4 Insecticide Spray 1.0 0.7 Inter-row Cultivation 4.0 2.7 Pulverising 4.0 2.7 Harvester 61.8 42.5 Chaser Bins 24.7 17.0 TOTAL OPERATION 131.8 90.6 Irrigator 1 - 4 13.7 9.4 TOTAL 145.4 100.0 ELECTRICITY kWh/Ha % Into Storage 76.7 6.3 Into Holding 333.5 27.4 Into Holding (Alternative) 181.7 14.9 To Irrigator 600.0 49.2 WATER TOTAL 1191.9 97.8 Cleaning (kW) 27.0 2.2 TOTAL 1218.9 100

1002801 Opportunities to Enhance Energy Efficiency and Minimise Greenhouse Gases 100
TOTAL % Diesel ElectricityOPERATIONS 131.8 27.0 WATER 13.7 1191.9 TOTAL 145.4 1218.9 ENERGY TOTAL (MJ) 5613.7 4388.1 COST TOTAL 171.6 121.9
Crop Wheat DIESEL L/Ha % Herbicide Spray 1.0 6.1 Fert 0.8 4.9 Planting 2.5 15.3 Harvester 11.9 73.6 TOTAL OPERATION 16.1 100.0
Crop Sorghum DIESEL L/Ha % Herbicide Spray 2.0 11.7 Fert 0.8 4.6 Planting 2.5 14.4 Harvester 11.9 69.3 TOTAL OPERATION 17.1 100.0
Discussion and Conclusions Beetroot is shown to require much higher energy inputs than the other products produced on the site. Costing was just under 10 times the energy inputs than Sorghum, Mung Beans and Wheat. The main energy usage for Beetroot was the beetroot harvester and pumping for irrigation water. During the first site visit the farmer identified the beetroot harvester was by far the most significant energy input comprising over 42% of the Diesel inputs for the crop. This is a cost of nearly $73 per hectare just to operate the harvester. As the harvester is a specially modified machine it is recommended further investigation is performed to determine the total energy usage of the harvester is able to be reduced. The other significant cost was the cost of irrigation due to the water requiring three pumping operations. All the pumps have been tested and appear to be operating at the level they were designed to. It is not anticipated reductions could be easily made in this area.
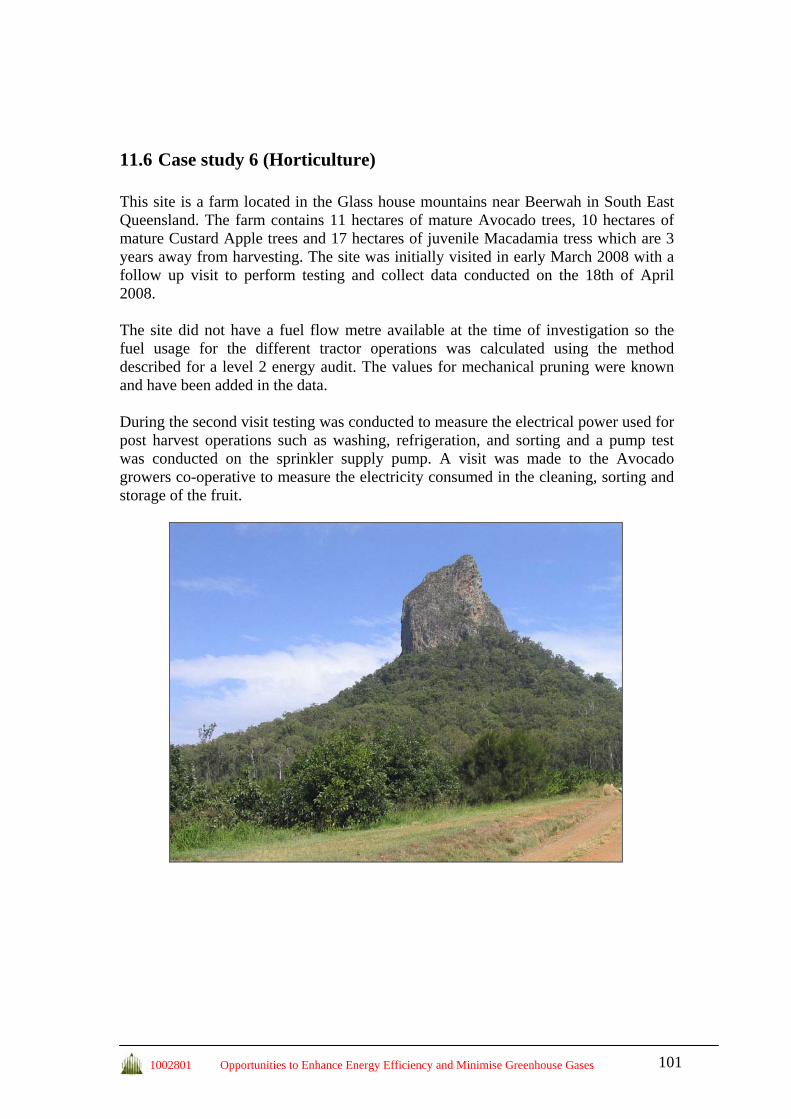
1002801 Opportunities to Enhance Energy Efficiency and Minimise Greenhouse Gases 101
11.6 Case study 6 (Horticulture) This site is a farm located in the Glass house mountains near Beerwah in South East Queensland. The farm contains 11 hectares of mature Avocado trees, 10 hectares of mature Custard Apple trees and 17 hectares of juvenile Macadamia tress which are 3 years away from harvesting. The site was initially visited in early March 2008 with a follow up visit to perform testing and collect data conducted on the 18th of April 2008. The site did not have a fuel flow metre available at the time of investigation so the fuel usage for the different tractor operations was calculated using the method described for a level 2 energy audit. The values for mechanical pruning were known and have been added in the data. During the second visit testing was conducted to measure the electrical power used for post harvest operations such as washing, refrigeration, and sorting and a pump test was conducted on the sprinkler supply pump. A visit was made to the Avocado growers co-operative to measure the electricity consumed in the cleaning, sorting and storage of the fruit.
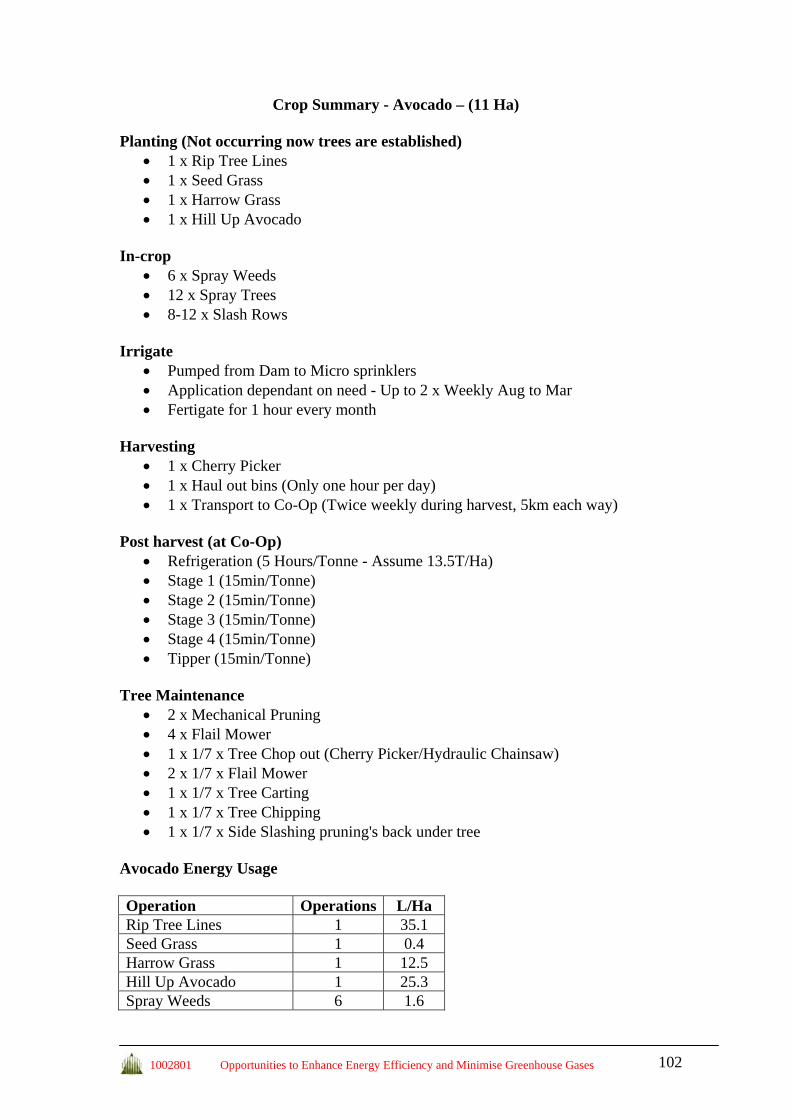
1002801 Opportunities to Enhance Energy Efficiency and Minimise Greenhouse Gases 102
Crop Summary - Avocado – (11 Ha) Planting (Not occurring now trees are established)
• 1 x Rip Tree Lines • 1 x Seed Grass • 1 x Harrow Grass • 1 x Hill Up Avocado
In-crop
• 6 x Spray Weeds • 12 x Spray Trees • 8-12 x Slash Rows
Irrigate
• Pumped from Dam to Micro sprinklers • Application dependant on need - Up to 2 x Weekly Aug to Mar • Fertigate for 1 hour every month
Harvesting
• 1 x Cherry Picker • 1 x Haul out bins (Only one hour per day) • 1 x Transport to Co-Op (Twice weekly during harvest, 5km each way)
Post harvest (at Co-Op)
• Refrigeration (5 Hours/Tonne - Assume 13.5T/Ha) • Stage 1 (15min/Tonne) • Stage 2 (15min/Tonne) • Stage 3 (15min/Tonne) • Stage 4 (15min/Tonne) • Tipper (15min/Tonne)
Tree Maintenance
• 2 x Mechanical Pruning • 4 x Flail Mower • 1 x 1/7 x Tree Chop out (Cherry Picker/Hydraulic Chainsaw) • 2 x 1/7 x Flail Mower • 1 x 1/7 x Tree Carting • 1 x 1/7 x Tree Chipping • 1 x 1/7 x Side Slashing pruning's back under tree
Avocado Energy Usage Operation Operations L/Ha Rip Tree Lines 1 35.1 Seed Grass 1 0.4 Harrow Grass 1 12.5 Hill Up Avocado 1 25.3 Spray Weeds 6 1.6

1002801 Opportunities to Enhance Energy Efficiency and Minimise Greenhouse Gases 103
Slash Rows 10 16.4 Spray Trees 12 9.1 Cherry Picker 1 32.3 Haul out Bins 1 16.1 Carting to Co-Op 1 4.2 Mechanical Pruning 2 14.9 Flail Mower 4 2/7 119.0 Side Slasher 1/7 16.4 Hydraulic Chainsaw 1/7 163.1 Chipping Remains 1/7 229.3 Carting Remains 1/7 137.6 Quad - Check Irrigation 3 2.3 Quad - Spot Spraying 2 0.9
EQUIPMENT Description kW* Refrigeration Runs 3/4 time 7.42Refrigeration Fan Runs remainder 1.58Stage 1 Convey 0.136Stage 2 Spray 0.652Stage 3 Convey 0.474Stage 4 Sorting Convenor 1.22Tipper Tip Avocado's 1.66
* Measured Values from Co-Operative
Post harvest treatment at the growers co-operative

1002801 Opportunities to Enhance Energy Efficiency and Minimise Greenhouse Gases 104
Crop Summary - Custard Apples – (10 Ha) Planting (Not occurring now trees are established)
• 1 x Rip Tree Lines • 1 x Seed Grass • 1 x Harrow Grass • 1 x Hill Up Custard Apples
In-crop
• 8 x Spray Weeds • 12 x Spray Trees • 12-16 x Slash Rows • Bait Spray 1-2 x Weekly During Season - ATV
Irrigate
• Pumped from Dam to Micro sprinklers • Application dependant on need - Up to 2 x Weekly Aug to Mar • Fertigate for 1 hour every month
Harvesting
• Weekly x Tractor (Feb-July) Post harvest
• Refrigeration (Approximately 45Hrs/Ha - By averaging total time over the season)
• Washing (8Hrs/Ha) • Spray/Dip (8Hrs/Ha) • Rotating Table (9.6Hrs/Ha) • Finishing Room (6.4Hrs/Ha) • Compressor (3Hrs/Ha)
Tree Maintenance
• 1 x Mechanical Pruning • 1 x Pneumatic Secateurs • 4 x Rake Pruning's

1002801 Opportunities to Enhance Energy Efficiency and Minimise Greenhouse Gases 105
Custard Apple Energy Usage Operation Operations L/Ha Rip Tree Lines 1 54.0 Seed Grass 1 0.4 Harrow Grass 1 2.5 Hill Up Apples 1 17.5 Spray Weeds 12 2.0 Slash Rows 14 12.3 Spray Trees 8 13.7 Harvest Tractor 1 24.1 Mechanical Pruning 1 14.9 Rake Pruning's 1 2.9 Pneumatic Secateurs 1 21.0 Quad - Check Irrigation 3 2.5 Quad - Bait Spraying 26 0.3
EQUIPMENT Description kW Refrigeration 9.6kW 5.3* Washing Grundfos 3kw 2.8 Spraying/dip TECO 0.37kW 0.37 Rotating Table BONFIG 0.18kW 0.15*Finishing Room Finishing only 3.5* Finishing Room Fan Fans separate 0.57*Compressor Cleaning Compressor 6.23*
* Tested Values
The Custard Apple Sorting Table and Dip

1002801 Opportunities to Enhance Energy Efficiency and Minimise Greenhouse Gases 106
Crop Summary - Macadamia – (17 Ha) Planting
• 1 x Rip Tree Lines • 1 x Seed Grass • 1 x Harrow Grass
In-crop
• 12 x Spray Weeds • 8 x Slash Rows
Irrigate
• Trees are not irrigated Harvesting
• No Harvesting for 3 years Results Using the data from the site summaries, the energy usage for planting, operations, tree maintenance, post harvest and irrigation were calculated. The planting is a once only cost, to compensate for this these figures are averaged out over 15 years, although some trees are much older. The refrigeration figures for the Avocado consider each tonne is refrigerated for 5 hours, but assume the refrigerator contains 5 tonnes of Avocado's at a time. The figures shown for L/Ha are the total values and include multiple operations in some cases. Percentage values reflect the percentage of the total energy source used on the product. The costs are provided as a guide only and assume diesel is $1.18/L and electricity averages $0.1/kWh although energy costs are currently quite volatile. Total Crop Avocado Custard Apples Macadamia Diesel ($/Ha) 1170.9 439.9 226.9 Electricity ($/Ha) 124.1 145.6 0.0 Petrol ($/Ha) 10.4 16.8 0.0 Ha 11 10 17 Total $14,359.33 $6,022.68 $4,551.74

1002801 Opportunities to Enhance Energy Efficiency and Minimise Greenhouse Gases 107
Energy Usage Breakdown Crop Avocado DIESEL L/Ha % Rip Tree Lines 2.4 0.2 Seed Grass 0.0 0.0 Harrow Grass 0.8 0.1 Hill Up Avocado 1.7 0.2 TOTAL PREPERATON 4.9 0.5 Spray Weeds 9.4 0.9 Slash Rows 163.7 16.5 Spray Trees 109.4 11.0 Cherry Picker 32.3 3.3 Haul out Bins 16.1 1.6 Carting to Co-Op 4.2 0.4 TOTAL OPERATION 335.1 33.8 Mechanical Pruning 29.9 3.0 Flail Mower 476.2 48.0 Hydraulic Chainsaw 23.3 2.3 Chipping Remains 32.8 3.3 Carting Remains 19.7 2.0 Flail Mower 68.1 6.9 Side Slasher 2.3 0.2 TOTAL MAINTAINANCE 652.3 65.7 TOTAL DIESEL 992.3 100.0 PETROL Quad - Check Irrigation 6.8 78.9 Quad - Spot Spraying 1.8 21.1 TOTAL PETROL 8.6 100.0 ELECTRICITY kWh/Ha % Refrigeration 75.1 24.0 Refrigeration Fan 5.3 1.7 Stage 1 0.5 0.0 Stage 2 2.2 0.1 Stage 3 1.6 0.1 Stage 4 4.1 0.3 Tipper 5.6 0.4 POST HARVEST TOTAL 94.4 26.6 IRRIGATION 1146.9 73.4 TOTAL 1241.3 100

1002801 Opportunities to Enhance Energy Efficiency and Minimise Greenhouse Gases 108
Crop Custard Apples DIESEL L/Ha % Rip Tree Lines 3.6 1.0 Seed Grass 0.0 0.0 Harrow Grass 0.2 0.0 Hill Up Apples 1.2 0.3 TOTAL PREPERATON 5.0 1.3 Spray Weeds 23.5 6.3 Slash Rows 171.9 46.1 Spray Trees 109.4 29.3 Harvest Tractor 24.1 6.5 Mechanical Pruning 14.9 4.0 Rake Pruning's 2.9 0.8 TOTAL OPERATION 346.8 93.0 Pneumatic Secateurs 21.0 5.6 TOTAL MAINTAINANCE 21.0 5.6 TOTAL DIESEL 372.8 100.0 PETROL Quad - Check Irrigation 7.5 53.6 Quad - Bait Spraying 6.5 46.4 TOTAL PETROL 14.0 100.0 ELECTRICITY kWh/Ha % Refrigeration 237.4 16.3 Washing 22.4 1.5 Spraying/dip 3.0 0.2 Rotating Table 1.4 0.1 Finishing Room 22.4 1.5 Finishing Room Fan 3.6 0.3 Compressor 18.7 1.3 POST HARVEST TOTAL 309.0 21.2 IRRIGATION 1146.9 78.8 TOTAL 1455.9 100
Crop Macadamias DIESEL L/Ha % Rip Tree Lines 4.5 2.4 Seed Grass 0.0 0.0 Harrow Grass 0.3 0.2 TOTAL PREPERATON 4.9 2.5 Spray Weeds 47.1 24.5 Slash Rows 140.4 73.0 TOTAL OPERATION 187.4 97.5 TOTAL DIESEL 192.3 100.0 ELECTRICITY kWh/Ha %

1002801 Opportunities to Enhance Energy Efficiency and Minimise Greenhouse Gases 109
IRRIGATION 0 0 TOTAL 0 0
Discussion and Recommendations The Avocado trees are the most energy intensive grown at the site. This is due to the extra maintenance operations which are required. Operating the flail mower on the pruning's and the chop out comprises over half of the diesel used on the Avocado's. The other operation which consumed a large amount of energy was slashing between the rows. The high number and slower speed of these operations contributes to the amount of Diesel which needs to be used. Irrigation was the most significant electricity cost associated with the production of all crops.

1002801 Opportunities to Enhance Energy Efficiency and Minimise Greenhouse Gases 110
11.7 Case study 7 (Nursery) This site is located at Rochdale in Southern Brisbane. It is a large nursery, comprising two sites covering a total of 8 Hectares. This audit considers the main office site which is a total of 5 Hectares. Harts produce a wide variety of plants which are grown in fibreglass, solar weave and salon cloth buildings as well as a large outside growing area. The nursery is planning a move to a completely new site. They hope this report will provide some guidance for the set up of the new site. During the second visit to the site, all of the main electrical equipment was tested. This included various pumps, a KW potting machine, a mixing machine, a cart battery charger, a steam generator and a column water heater. During the visit the site owner stated heating was by far the highest energy cost at the nursery. Particularly the electric water heaters, he noted raising the temperature by 1°C increased the electricity bill for that section by $250 a month. To combat rising energy costs they have reduced the amount of heating provided to all of the greenhouses. The reduction in plant growth is compensated for by the reduction in energy costs from the change in practice. Due to the high costs of the electric water heater they are planning on using a different system when they set up the new site.

1002801 Opportunities to Enhance Energy Efficiency and Minimise Greenhouse Gases 111
Vehicles (5 Days per week)
• Utility Vehicle JD Petrol Gator x 3 - 1.5Hrs/day - 12 Months • Utility Vehicle Electric x 2 - Charged daily • Bobcat x 1 - 1.9Hrs/day - 12 Months • Small Tractor JD X595 x 1 - 2.8Hrs/day - 12 Months • Forklift 1.5T Petrol x 1 - 0.75Hrs/day - 5 Months • 4WD Pajero x 20000km/yr • Truck 4T Diesel x 4000km.yr
Nursery Equipment (7 Days per week unless specified)
• Potting Machine - KW P-Line x 1 - 2.8 Hrs/Day - All year (5 Days/Week) • Mixer - 15 kW x 1 - 1.25 Hrs/Day - 10.5 Months (5 Days/Week) • Cart Charger - 36V x 2 - 6 Hrs/Day - All year (5 Days/Week) • Gas Heater - Fan x 2 - 610 Hrs/Year (2322L/Yr) • Diesel Boiler - 2.2kW Pump - 610 Hrs/Year (10067L/yr) • Diesel Heat Exchanger - Fan - 610 Hrs/Year (5380L/yr) • Varispeed Pump - (2 x 5.5kW) x 1 – 3.35 Hrs/day - 9 Months & 4.35 Hrs/Day
3 Months • Chlorine pump - 5kW x 1 - 4.5 Hrs/day - 6 Months & 1.5 Hrs/Day 6 Months • Aerator - For 0.57ML Dam x 1 - Continuous • Transfer pump - 5kW x 1 - 3 Hrs/day - 6 Months & 1 Hrs/Day 6 Months • Fogging pump - 4kW x 1 - 2.8 Hrs/Day - All year • Steam Generator - 60kW x 1 - 0.6 Hrs/Day - All year (5 Days/Week) • Water Heater system - Column 93kW x 3 - One unit 12hrs x 7 months - two
units 12 hours 4 months. Nursery Energy Usage VEHICLES Units Description L/hr or L/100km* Utility Vehicle 3 Gators Petrol 1.5 Bobcat 1 S150 Diesel 9 Tractor (s) 1 JD X595 Diesel 3 Forklift Petrol 1 1.5T Petrol 3 4WD 1 Pajero Petrol 14.5* Truck (s) 1 4T Diesel 15*

1002801 Opportunities to Enhance Energy Efficiency and Minimise Greenhouse Gases 112
EQUIPMENT Units Description kW Potting Machine 1 KW PF2006 P-Line 2.2* Mixer 1 15kW 4.5** Cart Charger 1 1 Plug in 36V 1.1* Cart Charger 2 1 Plug in 36V New 0.99* Gas Heater 2 Fan, pilot 0.475* Diesel Heat Exchanger 1 Fan, pilot 0.76* Diesel Boiler 1 Pump 2.2kW 0.27* Main Pump 1 Grundfos Varispeed 5** Chlorine Pump 1 5kW 2.35* Aerators 1 0.58 ML 1.03* Transfer Pump 1 5kW 2.35 Fogging Pump 1 4kW 0.68* Steam Generator 1 60kW + Pump, fan 64.8* Water Heaters Space 1 93kW 92.3* Water Heaters Bench 2 93kW 92.3* Water Heater pump 2 2kW 1.75 Bore 1 2.2kW 1.45*
* Measured Values, **Measured then adjusted

1002801 Opportunities to Enhance Energy Efficiency and Minimise Greenhouse Gases 113
Results Using the data from the site summary, the energy usage for vehicles, heating and equipment were calculated. All the data has been based on figures provided by the owner. There were difficulties estimating the energy usages for heating, in particular considering the water heaters. It is difficult to estimate the water heaters with much accuracy, after talking to the manufacturer there is no sure way to know the duty cycle of the heaters unless it is logged over a few days. This was not possible within the scope and time frame of this project. The manufacturer explained the size of the units is generally designed to get the water up to heat in a timely manner, the duty cycle will then use significantly less energy than the heat up. This project has estimated there is a 80% duty cycle for the bench heaters and 70% duty cycle for the space heaters. This allows for the time the water is getting up to heat and then maintaining heat. These results have been checked against the total value of the bills and represent the best estimate which can be made without further testing. The varispeed pump located at the site was tested for water flow rate and power consumption. The water flow figures were modified due to the flow sensor being located too close to a bend to achieve suitably accurate results. By comparing the maximum flow rate tested by using sprinkler flow rate data the values were able to be corrected. The power data used on the varispeed pump and mixer seemed inconsistent with the performance of the units, this is believed to be due to the equipment not being connected by the electrician in the correct area for the power measurements to work. To compensate for this the VA reading (which was correct) had a power factor applied of 0.85 and 0.6 applied respectively to provide representative figures. The figures shown for kWh/yr and L/Yr are the total values and include multiple units in some cases. Percentage values reflect the percentage of the total energy source used on the product. The costs are provided as a guide only and assume diesel is $1.18/L, Petrol $1.20/L, Gas (LPG) $0.76/L and electricity averages $0.1/kWh although energy costs are currently quite volatile.
Calculated Power Input and Flow rate
0
1000
2000
3000
4000
5000
6000
7000
8000
9000
10000
2:03:50 2:06:43 2:09:36 2:12:29 2:15:22 2:18:14 2:21:07 2:24:00 2:26:53 2:29:46 2:32:38
Time (s)
Pow
er W
0
1000
2000
3000
4000
5000
6000
7000
8000
9000
10000
Flow
(US
Gal
/hr)
W CalcFlow Rate

1002801 Opportunities to Enhance Energy Efficiency and Minimise Greenhouse Gases 114
Totals TOTALS Amount $ Total Diesel (L) 22473 $26,518.14Total Petrol (L) 4837 $5,804.70 Total Gas (L) 4645 $3,530.20 Total Electricity (kWh) 432928 $36,798.88TOTAL $72,651.92
Energy Usage Breakdown DIESEL L/yr % Bobcat 4309.2 19.2 Tractor (s) 2116.8 9.4 Truck (s) 600 2.7 VEHICLES TOTAL 7026 31.3 Diesel Boiler 10067 44.8 Diesel Heat Exchanger 5380 23.9 HEATING TOTAL 15447 68.7 DIESEL TOTAL 22473 100 PETROL L/yr % Utility Vehicle 1701 35.2 Forklift Petrol 236.25 4.9 4WD 2900 60.0 PETROL TOTAL 4837.25 100 GAS L/yr % Gas Heater 4645 100.0 GAS TOTAL 4645 100 ELECTRICITY kWh/yr % Potting Machine 1552 0.6 Mixer 1240 0.5 Cart Charger 1 1774 0.7 Cart Charger 2 1497 0.6 Gas Heater 580 0.2 Diesel Heat Exchanger 464 0.2 Diesel Boiler 165 0.1 Main Pump 4673 1.8 Main Pump 2023 0.8 Chlorine Pump 1967 0.8 Chlorine Pump 656 0.3 Aerators 9196 3.6 Transfer Pump 1311 0.5 Transfer Pump 437 0.2 Fogging Pump 443 0.2 Steam Generator 9798 3.8 EQUIPMENT TOTAL 37775 14.7

1002801 Opportunities to Enhance Energy Efficiency and Minimise Greenhouse Gases 115
Water Heaters Space 168244 38.9 Water Heaters Bench 219748 50.8 Water Heater pump 7161 1.7 HEATING TOTAL 395153 91.3 ELECTRICITY TOTAL 432928 100
Discussion and Recommendations By far the largest energy usage on the site is heating the Nursery. It comprises 69% of the Diesel and over 90% of the Electricity as well as all of the gas usage. The owner described the changes that have been made to the operating procedure in an attempt to reduce the overall cost of heating the Nursery. A decision has already been made to change from heating with electricity to alternative heat source to try to reduce the expense. Further work could be done to investigate ways to reduce the energy used to maintain the heat within the Nursery at the correct temperature while still maintaining nursery function during the other months of the year. The Varispeed pump testing demonstrated the effectiveness of such instillation, showing the range of power which can be supplied by the pump, which increases efficiency in operations which are required to apply a variety of flow rates depending on the application used. It was observed during the site visit and confirmed with the figures that a few of the items used at the site are significantly more powerful than they are required to be to perform they tasks they are required to. Especially the Mixer and the fogging pump were well oversized. It is not believed these units would use considerably more power than correct sized units however for capital reasons it is recommended units are sized closer to their capacity.

1002801 Opportunities to Enhance Energy Efficiency and Minimise Greenhouse Gases 116
11.8 Case study 8 (Nursery) This site is located in the Lockyer Valley in south east Queensland. It is a large and extensive nursery, so a section of the nursery that operates semi independently from the rest of the nursery has been investigated as part of the audit. The site produces both trees and shrubs. During the second site visit a large amount of electrical equipment was tested, including standard and varispeed electrical pumps, potting machines, aerators and dosing pumps. Additional equipment was tested at other locations throughout the nursery to provide an indication of the power usage of equipment commonly used at other nurseries in south east Queensland. Additional Equipment measured included a small motor to operate screens, refrigeration units for seed, and fogger pump. The owner stated he was aware of items which could operate more energy efficiently. However his priority was labour efficiency as that was a considerably higher expense than energy. He was prepared to use energy to reduce any labour costs possible. A varispeed pump was tested at the nursery site however due to the evenness of the water flow provided during the sprinkler operation which was monitored not change in power was recorded during operation.

1002801 Opportunities to Enhance Energy Efficiency and Minimise Greenhouse Gases 117
Vehicles (5 Day work week)
• Quad Bikes 1 x 250 & 1 x 350 - 4.5 Hrs/Day - All Year • Small Tractors 1 x 18 & 1 x 24 - 3.5 Hrs/Day - All Year
Nursery Equipment
• Potting Machine - Super Jarvo - 5 Hrs/Day - 10 months/year • Varispeed Pump - 37.5L/s - 2 Hrs/Day - All Year (7 Days) • Water Heater system - Single Column (Approx 25kW rating) (7 Days) • Aerators - For 5 ML Dam - Continuous when Transfer not running (7 Days) • Transfer pump - Southern Cross 7.5kW - 16L/s - 4 Hrs/Day - All Year (7
Days) • Soil Conveyor - 1.5kW - 2 Hrs/Day - 10 months/year • Bag Lifter - 0.32kW - 1 Hrs/Day - 10 months/year • Dosing Pump - Small Intermittent - When transfer pump operates (7 Days) • Small Pump - Davey 350 P8C - 0.45kW - 2Hrs/Day - All Year
Testing the Hot water heater and small pump (Right)

1002801 Opportunities to Enhance Energy Efficiency and Minimise Greenhouse Gases 118
Nursery Energy Usage EQUIPMENT Description kW Potting Machine Super Javo 4.58* Main Pump Grundfos Varispeed - 35L/s 14.09* Water Heater System Single Column 20.89* Wash Pump DAVEY 350 P8C 0.45kW 0.32* Aerators 5ML Dam 4.49* Dosing Pump Small Intermittant 0.03* Transfer Pump 7.5kW 16L/s 6.75* Bag Lift Motor 0.32kW 0.32 Soil Conveyor 1.5kW 1.5
* Tested Value Additional Equipment Tested at the Site
• Lighting - 400W Globes • Automatic screen motor (Small Guess 0.25kW) • Fogger Pump (5.5kW) • Refrigeration Compressor (3.16kW) Maintaining 17°C - Area approx 20m2 • Circulation Fan - Powerplant Aeromax (150W)
ADDITIONAL EQUIPMENT Description kW Lighting 400W 0.505 Screens Motor Small Motor (0.25kW) 0.17 Fogger 5.5kW 1.63 Refrigeration Compressor 3.16kW 2.26 Circulation Fan Powerplant 150W 0.21

1002801 Opportunities to Enhance Energy Efficiency and Minimise Greenhouse Gases 119
Results Using the data from the site summary, the energy usage for vehicles, heating and equipment were calculated. All the data has been based on figures provided by the owner. There were difficulties estimating the energy usages for water heating, the water heater is set to run 24 hours a day. It is assumed the heater would average only 8 hours a day throughout the year. The figures shown for kWh/yr and L/Yr are the total values and include multiple units in some cases. Percentage values reflect the percentage of the total energy source used on the product. The costs are provided as a guide only and assume diesel is $1.18/L, Petrol $1.20, Gas $0.76 and electricity averages $0.1/kWh although energy costs are currently quite volatile. The testing at the site compared the start up power required compared to the power consumed during full operation. It was found the difference in power during the start up period (25s for most items) was negligible when the length of operation of these items is considered. Totals TOTAL Energy $ % Petrol 1633.0 15.3 Diesel 3122.3 29.3 Electricity 5890.3 55.3 Totals 10645.5 100.0

1002801 Opportunities to Enhance Energy Efficiency and Minimise Greenhouse Gases 120
Energy usage breakdown PETROL L/ha % Quad Bikes 1360.8 100.0 DIESEL Tractor (s) 2646.0 100.0 ELECTRICITY kWh/Ha % Potting Machine 4809.0 5.3 Main Pump 10483.0 11.6 Wash Pump 161.3 0.2 Aerator 33405.6 37.1 Dosing Pump 0.0 0.0 Transfer Pump 10044.0 11.2 Bag Lift Motor 67.2 0.1 Soil Conveyor 630.0 0.7 EQUIPMENT TOTAL 58902.8 65.5 Water Heater System 31084.3 34.5 ELECTRICITY TOTAL 89987.2 100.0
Discussion and Recommendations Results show electricity is the most significant component of the energy cost at the location. The most significant components of the electrical power consumed are the aerator on the water storage and the water heater. The aerator is used on a dam of approximately 5ML and is used to supply water to more that the Nursery site audited. It runs almost continuously all year round. The water heater also uses over 1/3 of the electrical power consumed at the site, which could be reduced by using a different heat source. Pumping was the other significant energy usage, it is noted the main varispeed pump used a simular amount of energy to the transfer pump. The main pump operates at a higher pressure than the transfer pump as it needs to supply the pressure to the sprinklers, demonstrating its higher operating efficiency.
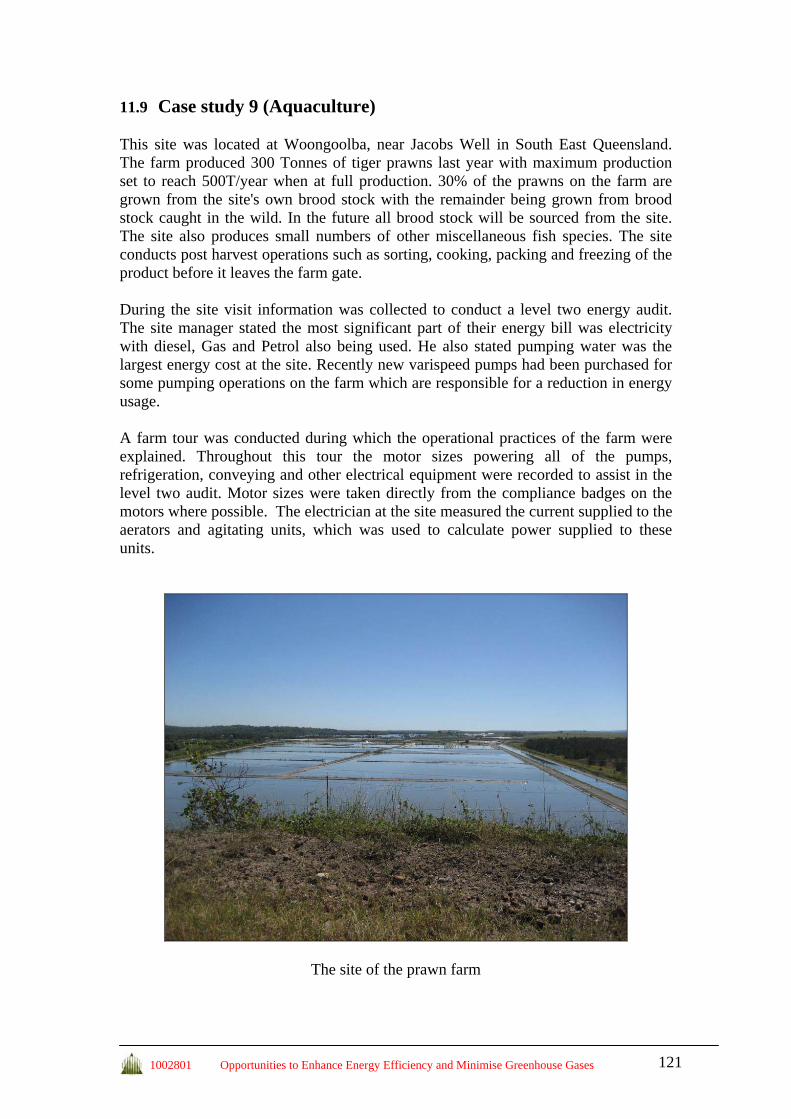
1002801 Opportunities to Enhance Energy Efficiency and Minimise Greenhouse Gases 121
11.9 Case study 9 (Aquaculture)
This site was located at Woongoolba, near Jacobs Well in South East Queensland. The farm produced 300 Tonnes of tiger prawns last year with maximum production set to reach 500T/year when at full production. 30% of the prawns on the farm are grown from the site's own brood stock with the remainder being grown from brood stock caught in the wild. In the future all brood stock will be sourced from the site. The site also produces small numbers of other miscellaneous fish species. The site conducts post harvest operations such as sorting, cooking, packing and freezing of the product before it leaves the farm gate. During the site visit information was collected to conduct a level two energy audit. The site manager stated the most significant part of their energy bill was electricity with diesel, Gas and Petrol also being used. He also stated pumping water was the largest energy cost at the site. Recently new varispeed pumps had been purchased for some pumping operations on the farm which are responsible for a reduction in energy usage. A farm tour was conducted during which the operational practices of the farm were explained. Throughout this tour the motor sizes powering all of the pumps, refrigeration, conveying and other electrical equipment were recorded to assist in the level two audit. Motor sizes were taken directly from the compliance badges on the motors where possible. The electrician at the site measured the current supplied to the aerators and agitating units, which was used to calculate power supplied to these units.
The site of the prawn farm

1002801 Opportunities to Enhance Energy Efficiency and Minimise Greenhouse Gases 122
The main river pumps for the farm.

1002801 Opportunities to Enhance Energy Efficiency and Minimise Greenhouse Gases 123
OVERVIEW OF SITE OPERATIONS
HATCHERY
• Pump River (6” Pump 18.6kW) x 1 – 4 Hours every 3 days, Year round • Filter pumps (Onga 143 - 2.4kW) x 2 - 12 Hours per day, Year round • Ozonater 30g/Hr (Pump 3.6kW, Drier, 0.5kW, Ozonator 0.5kW) x 1 -
Continuous 12 Months Per year • Water Supply from filter to hatchery (7.5kW) – 18 Hours/day, 4 Months per
year • Sundry Pumps (Onga 142 - 1.5kW) x 2 Continuous, 4 months per year • Blowers (7.5kW) x 2 – Continuous, all year • Hatchery Blowers (11kW) x 2 Continuous, 4 months per year • Submersible heater (3kW) x 80 – 12 Hours per day, 4 months per year • Submersible heater (5kW) x 16 – 12 Hours per day, 4 months per year • Fluorescent Lighting x 30 – run all year • Air Conditioner (2 kW) x 1 all year • Recirculation Pump (3.6kW) – When Heaters on - 8 hours, 4 months • Boiler Heaters (Diesel) – 50,000L/year • Steam Generator (40kW) – 4 hours/day, 4 months per year • Cold Room (Kirby Refrigeration – KCR 32 approx 2kW) x 1 – All Year
The Hatchery

1002801 Opportunities to Enhance Energy Efficiency and Minimise Greenhouse Gases 124
GROWING
• Pump River to Canal (26” 160kW) x 2 – 1000 Hours/year • Pump River to Canal (26” 110kW) x 1 – 1000 Hours • Lift Pump into Treatment (20” 55kW) x 1 – 2500Hours • Lift Pump into Treatment (16” 22kW) x 1 – 2500Hours • Lift Pump to New Farm (20” 55kW) x 1 – 1000Hours • Discharge Pump to New Farm (20” 55kW) x 1 – 100Hours • Additional River Pumps (6” 11kW) x 1 – 250Hours • Additional River Pumps (8” 11kW) x 1 – 250Hours • Paddle Wheel (3HP) x 21 – Draws 3.3A* Continuous for 6 Months • Paddle Wheel (2.5HP) x 52 – Draws 2.9A* Continuous for 6 Months • Paddle Wheel (2HP) x 149 – Draws 2.8A* Continuous for 6 Months • Force 7 x 80 – Draws 2.4A* Continuous for 6 Months * Measured By Site Electrician
The Prawn farm and harvest operation

1002801 Opportunities to Enhance Energy Efficiency and Minimise Greenhouse Gases 125
PROCESSING
• Ice Machine (25kW) x 1 – 24 Hours per day, 3 Months Per year • Conveyor Motor (1kW) x 10 – 9 Hours per day, 3 Months Per year • Bin Tipper (3kW) x 1 – 1 Hours per day, 3 Months Per year • Hoist (3kW) x 2 – 2 Hours per day, 3 Months Per year • Small Freezer Compressor (25kW) x 1 – 24 Hours per day, 11 Months Per
year • Cool Room Compressor (7kW) x 1 – 12 Hours per day, 3 Months Per year • Brine Freezer Compressor (45kW) x 1 – 18 Hours per day, 3 Months Per year • Air Conditioner (5kW) x 1 – 18 Hours per day, 3 Months Per year • Strapper (2kW) x 1 – 4 Hours per day, 3 Months Per year • Water Chiller Compressor (90kW) x 3 – 9 Hours per day, 3 Months Per year • Water Chiller Pump (3kW) x 3 – 9 Hours per day, 3 Months Per year • Big Freezer Compressor (25kW) x 4 – 12 Hours per day, 11 Months Per year • Packing Room/Bin Tipper Compressor (12kW) x 1 – 18 Hours per day, 3
Months Per year • Blast Freezer Compressor (15kW) x 3 – 12 Hours per day, 3 Months Per year • Ante Room 1 Compressor (12kW) x 1 – 12 Hours per day, 3 Months Per year • Washing Pump (3kW) x 2 – 1 Hours per day, 3 Months Per year • General Water Pump (2kW) x 4 – 6 Hours per day, 3 Months Per year • Brine Pump (2kW) x 1 – 1 Hours per day, 3 Months Per year • Brine Mixing Pump (2kW) x 1 – 1 Hours per day, 3 Months Per year • Ozone Generator (10kW) x 1 – 4 Hours per day, 3 Months Per year • Gas Burners (Yearly Gas 18000lt) x 1 – 9 Hours per day, 3 Months Per year
The sorting and cooking operations of the prawns

1002801 Opportunities to Enhance Energy Efficiency and Minimise Greenhouse Gases 126
ESTATE
Vehicles • Quad Bikes (350cc) x 4 - 8 hours/day 6 months per year • All Terrain Vehicle x 2 - 8 hours/day 6 months per year • Hiab Trucks x 2 - 4 hours/day 2 months per year • Tractors - average 10 hours per week (80HP light Load) • Forklift 1 x Gas – 4 hours/day 9 months per year • Forklift 2 x Petrol – 4 hours/day 9 months per year • Utes 2 x 28500km/yr • Feed Truck x 1 – 8 hours/day 5 months per year • Generator – 20HP portable – 1 hours/day 6 months per year • Tipper 12T – 50 Hours per Year • Gurney Truck x 1 – 3 Hours per day 6 Months per year
Earth Works
• Water Storage – Average hours over 20 year period • Hired Earthworks Equipment - 600 hours per year • Excavator x 1 - 600 Hours per year • D6 Dozer x 1 – 20 hours per year • Small Grader x 1 – 60 hours per year (60HP medium Load) • Bobcat x 1 – 420 Hours per year
Maintenance
• Welders (300amp Arc, Transmig 53C Cigweld, Weldmate 335) – 18 Hours per week
• Air Compressor (Renegade 52) – 1 Hour per day • Other Equipment for 3 people working reasonably constantly (lathe, hand held
power tools)

1002801 Opportunities to Enhance Energy Efficiency and Minimise Greenhouse Gases 127
RESULTS
Using the data from the site summaries, the energy usage for each section was calculated. With the exception of the values tested by the site electrician all calculations are performed from the values on the compliance plates of the motors. It has been assumed all motors are operating at 90% of their capacity (with the exception of the aerators). The figures shown are the total values and include multiple items in some cases. Percentage values reflect the percentage of the total energy source used in each section. The costs are provided as a guide only, as energy costs are currently quite volatile. I have assumed 65% of the electricity used is during the day.
Total
Hatchery Growing Processing Estate Total Electrical (kWh) 737932 2356988 977441 5457 4077819 Electrical ($0.1/kWh) $57,835 $184,729 $76,607 $428 $319,599% 18 58 24 0 100 Diesel (L) 50000 0 0 38554 88554 Diesel ($1.18/L) $59,000 $0 $0 $45,494 $104,494% 56 0 0 44 100 Gas (L) 0 0 18000 2797 20797 Gas ($0.76/L) $0 $0 $13,680 $2,126 $15,806 % 0 0 87 13 100 Petrol (L) 0 0 0 17171 17171 Petrol ($1.20/L) $0 $0 $0 $20,605 $20,605 % 0 0 0 100 100
The total energy usage costs and percentages for each section Hatchery
ELECTRICAL kWh % River Pump 8282 1.1 Filter Pump 6428 0.9 Ozonator - Pump 28382 3.8 Ozonator - Drier 3942 0.5 Ozonator - Ozonator 3942 0.5 Water Supply to Hatchery 15066 2.0 Sundry Pumps 8035 1.1 Blowers 118260 16.0 Hatchery Blowers 58925 8.0 Submersible Heaters Small 321408 43.6 Submersible Heaters Large 107136 14.5 Fluorescent Lighting 11826 1.6 Air Conditioner 15768 2.1 Recirculation Pump 3214 0.4 Steam Generator 17856 2.4 Cold Room 9461 1.3 TOTAL 737932 100

1002801 Opportunities to Enhance Energy Efficiency and Minimise Greenhouse Gases 128
DIESEL L % Boiler Heaters 50000 100 TOTAL 50000 100
Hatchery Energy Usage Growing
ELECTRICAL kWh % River Pump 67500 2.9 River Pump 288000 12.2 Lift Pump into Treatment 123750 5.3 Lift Pump into Treatment 49500 2.1 lift Pump into new farm 49500 2.1 Discharge pump to new farm 4950 0.2 Additional river pump 2475 0.1 Additional river pump 2475 0.1 Paddle Wheel - 3HP 404712 17.2 Paddle Wheel - 2.5HP 314496 13.3 Paddle Wheel - 2HP 856094 36.3 Agitating unit 193536 8.2 TOTAL 2356988 100
Growing Energy Usage Processing
ELECTRICAL kWh % Ice Machine 25515 2.6 Conveyor Motor 5103 0.5 Bin Tipper 170 0.0 Hoist 680 0.1 Small Freezer Compressor 138105 14.1 Cool Room Compressor 9374 1.0 Brine Freezer Compressor 135594 13.9 Air conditioner 9072 0.9 Strapper 907 0.1 Water Chiller Compressor 137781 14.1 Water Chiller Pump 4593 0.5 Big Freezer Compressor 429660 44.0 Packing Room Compressor 18079 1.8 Blast Freezer Compressor 45198 4.6 Ante Room 1 Compressor 1 12053 1.2 Washing Pump 340 0.0 General Water Pump 2722 0.3 Brine Pump 113 0.0 Brine Mixing Pump 113 0.0 Ozone Generator 2268 0.2 TOTAL 977441 100
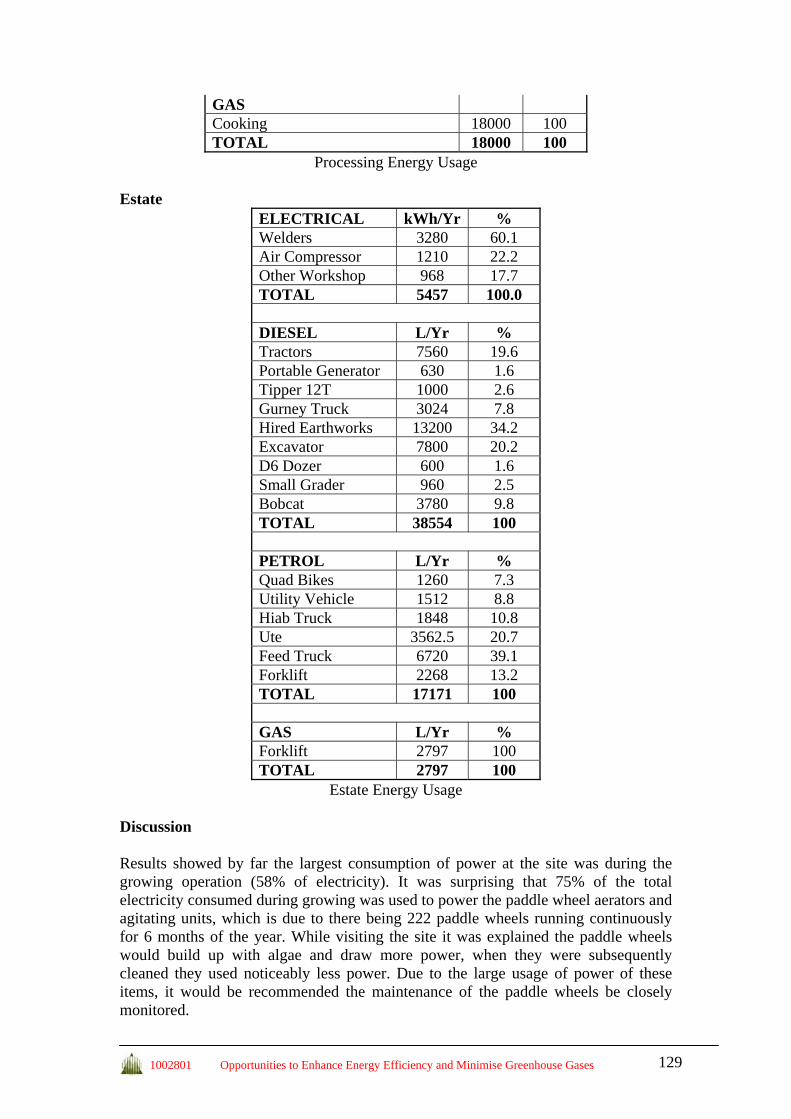
1002801 Opportunities to Enhance Energy Efficiency and Minimise Greenhouse Gases 129
GAS Cooking 18000 100 TOTAL 18000 100
Processing Energy Usage
Estate ELECTRICAL kWh/Yr % Welders 3280 60.1 Air Compressor 1210 22.2 Other Workshop 968 17.7 TOTAL 5457 100.0 DIESEL L/Yr % Tractors 7560 19.6 Portable Generator 630 1.6 Tipper 12T 1000 2.6 Gurney Truck 3024 7.8 Hired Earthworks 13200 34.2 Excavator 7800 20.2 D6 Dozer 600 1.6 Small Grader 960 2.5 Bobcat 3780 9.8 TOTAL 38554 100 PETROL L/Yr % Quad Bikes 1260 7.3 Utility Vehicle 1512 8.8 Hiab Truck 1848 10.8 Ute 3562.5 20.7 Feed Truck 6720 39.1 Forklift 2268 13.2 TOTAL 17171 100 GAS L/Yr % Forklift 2797 100 TOTAL 2797 100
Estate Energy Usage
Discussion Results showed by far the largest consumption of power at the site was during the growing operation (58% of electricity). It was surprising that 75% of the total electricity consumed during growing was used to power the paddle wheel aerators and agitating units, which is due to there being 222 paddle wheels running continuously for 6 months of the year. While visiting the site it was explained the paddle wheels would build up with algae and draw more power, when they were subsequently cleaned they used noticeably less power. Due to the large usage of power of these items, it would be recommended the maintenance of the paddle wheels be closely monitored.

1002801 Opportunities to Enhance Energy Efficiency and Minimise Greenhouse Gases 130
The site manager reported pumping water was the most significant cost but it comprised only 25% of the electricity used in the growing process. Due to the size of the pumps used they still comprise a large energy usage per item, and energy savings on an individual item would provide benefits. It is recommended further pump testing is conducted to determine the efficiency of the large river pumps. It was observed the freezers used in the processing area were the most significant energy usage for the packing, which was expected due to their size compared to the other components of the processing system. Reducing the total operation time of the freezers could reduce the overall energy used in the processing section. The only other major energy component of the processing was the gas supplied to the cooking burners. Heating was found to be by far the most significant cost within the hatchery (More than 75%), when both the electric heaters and the diesel boilers were considered. There were no other major sources of power consumption within the hatchery.
The Main Freezer Shed
Conclusions A level 2 energy audit of a prawn farm has indicated the most significant component of the energy consumption at the site was the operation of the 222 paddle wheel aerators. It is recommended further investigation is performed to determine if energy is able to be saved through the aeration process. While the pumps were not as large a component of the total energy consumed as expected, it is recommended the performance of the large river pumps is evaluated to determine the operating efficiency of the pumps.