opportunity day september 9th, 2016 -...
TRANSCRIPT

Opportunity DaySeptember 9th, 2016
Agenda
Business Overview
Business Strategy
GIFT History
Financial Summary

Opportunity DaySeptember 9th, 2016
GIFT History

2007
Raising capital to 78 millions THB, investing the warehouse, tank storage and packing system
1999
Established as a distributor of specialty chemicals with start up capital of 5 millions THB
2005
Raising investment fund to 58 millions THB, expanding the facilities
GIFT History
2011
Being the public company and entry MAI stock market with 130 million THB capital registered

GIFT History
2014
Capital investment achieved 302.6 millions THB by stock dividend
Purchase supplement plant and register under the name “Lavish Laboratory Co.,Ltd.” with capital Investment of 25 million THB
2014Capital increase to 212.33 millions THB by stock dividend
2013
GIFT has gained entry into SET since the 1st August 2016
2015

Opportunity DaySeptember 9th, 2016
Business Overview

Business Overview

Business Overview
BU #2 FBS (Foods, Beverage & Supplement)
BU #3 TC (Traditional & Conventional Medicine)
BU #1 HPC (Home Care, Personal Care & Cosmetic)
BU #4 PC (Plastic & Coating)
Market Segmentation

• Emollient• Emulsifier / Solubilizer / Dispersants• Special Ethoxylated• Special Ester• Silicone • Mild Surfactant• Carbomer• Fatty Acid/ Fatty Alcohol / Refined
Glycerine• Plant Extract / Essential Oil
• Thickener• Collagen• Pearlizing Agent• Soap Noodle• UV-Filter• Preservatives
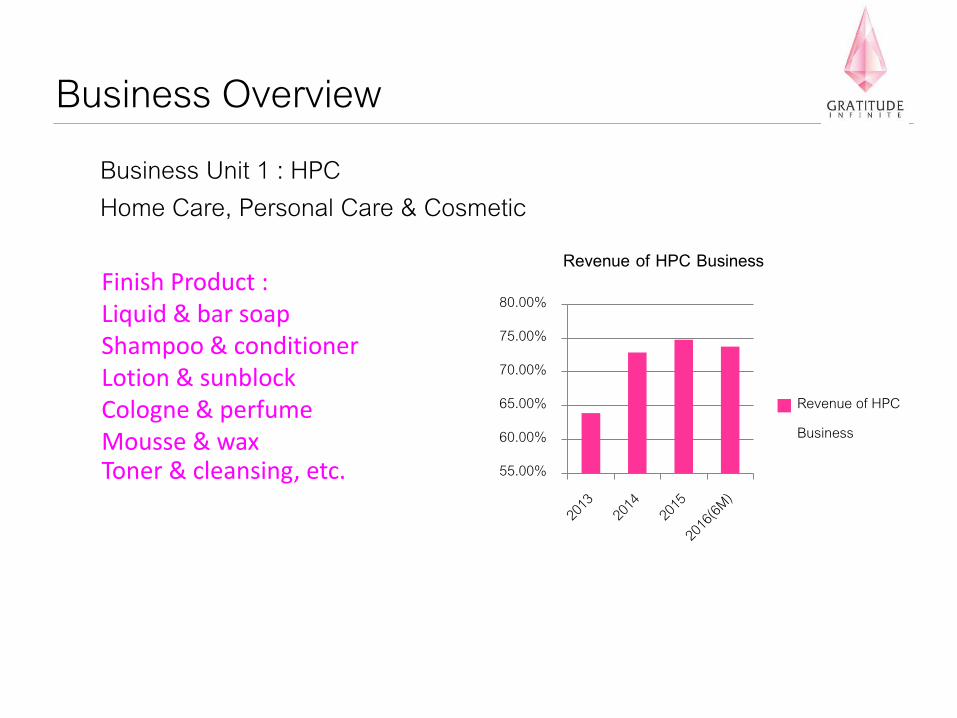
Business Unit 1 : HPC Home Care, Personal Care & Cosmetic
Business Overview
Business OverviewBusiness Unit 1 : HPC Home Care, Personal Care & Cosmetic
Finish Product : Liquid & bar soapShampoo & conditionerLotion & sunblockCologne & perfumeMousse & waxToner & cleansing, etc. 55.00%
60.00%
65.00%
70.00%
75.00%
80.00%
Revenue of HPC Business
Revenue of HPCBusiness

• Anti-Oxidant & Anti-aging• Bone and Joint supports• Cardio & vascular circulation supports• Detoxification & Cleanse Liver• Eye and vision protection• Immune supports anti-carcinogenic• Memory & brain boosting• Menopause and Women health• Men health• Sport and muscle Nutrition
• Sex and Libido boosting• Weight Management• Natural Product• Sweetener
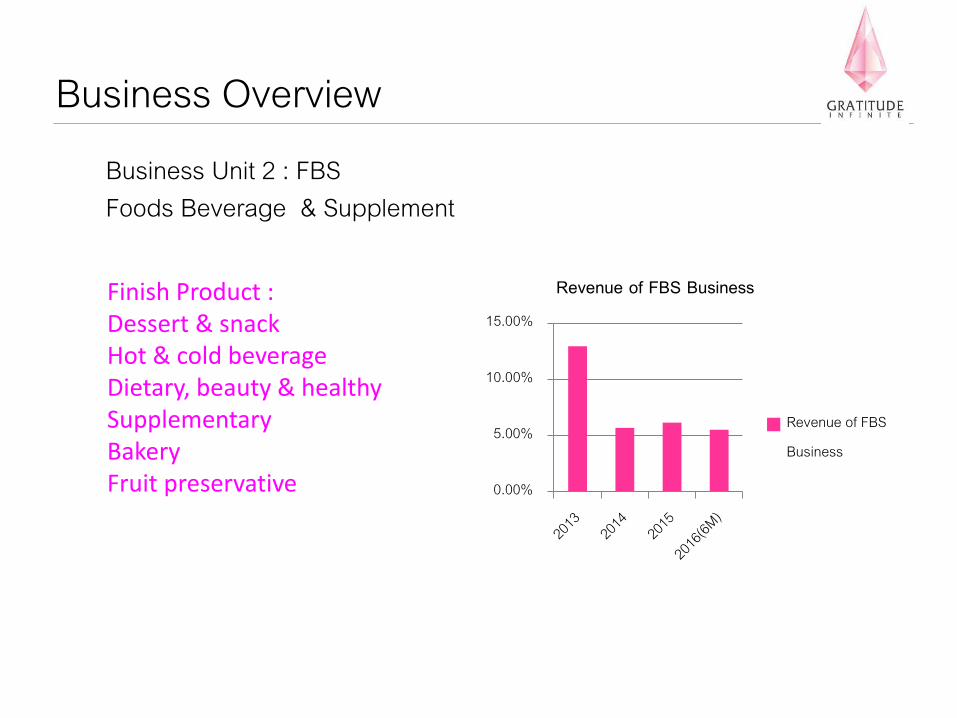
Business Unit 2 : FBSFoods Beverage & Supplement
Business Overview
Business Unit 2 : FBSFoods Beverage & Supplement
Business Overview
Finish Product :Dessert & snackHot & cold beverageDietary, beauty & healthy SupplementaryBakeryFruit preservative 0.00%
5.00%
10.00%
15.00%
Revenue of FBS Business
Revenue of FBSBusiness
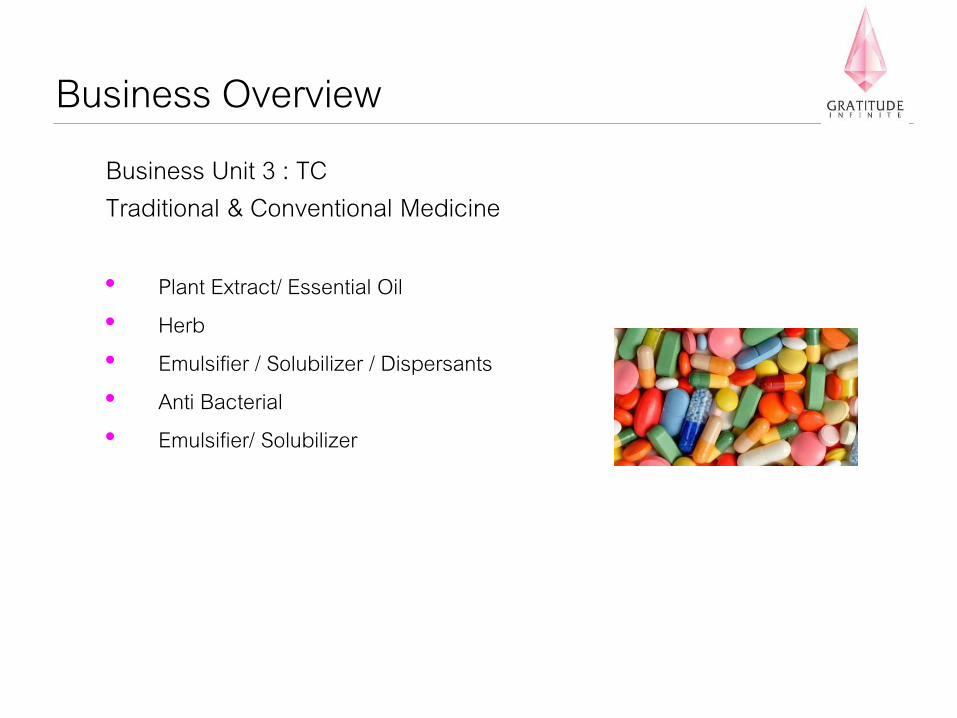
• Plant Extract/ Essential Oil• Herb• Emulsifier / Solubilizer / Dispersants• Anti Bacterial• Emulsifier/ Solubilizer
Business Unit 3 : TCTraditional & Conventional Medicine
Business Overview

Business Unit 3 : TCTraditional & Conventional Medicine
Business Overview
Finish Product :Natural HerbAntisepticNatural sweetener 5.50%
6.00%
6.50%
7.00%
7.50%
Revenue of TC Business
Revenue of TCBusiness

Business Unit 4 : PCPlastic & Coating
Business Overview
• Plastic Additive ie. Lubricant Wax, Antistatic, Metal Stearate • Special Solvent• Optical Brightener Agent• Lubricant Additive• Agro Adjuvant• Additive in Textile Auxiliaries

Business Unit 4 : PCPlastic & Coating
Business Overview
Finish Product :Paint & lacquerMasterbatch compoundBox & packagingPrinting inkCoating material 0.00%
5.00%
10.00%
15.00%
20.00%
Revenue of PC Business
Revenue of PCBusiness

Opportunity DaySeptember 9th, 2016
Business Strategy

Business Strategy
GIFT Resources
IncreaseRevenue
+ Number of products item+ Number of product value+ Number of customers+ Highly selective
ReduceOperationCost
- Optimize inventory turn over- Optimize transportation cost- Utilize production line- Review cost of material- Optimize cash on hand
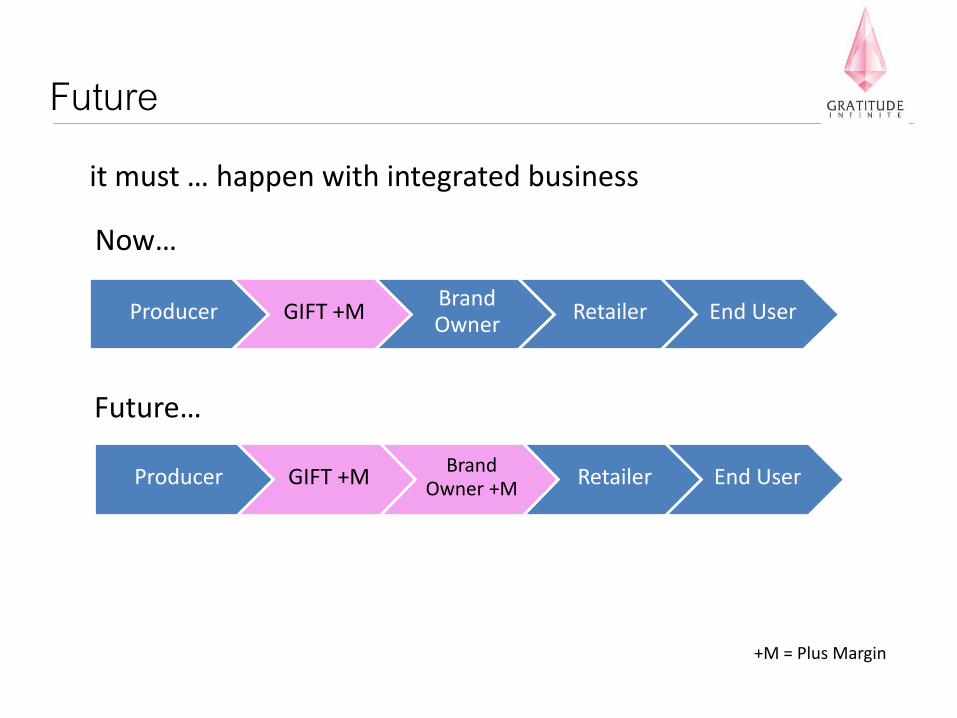
Futureit must … happen with integrated business
+M = Plus Margin
Producer GIFT +MBrand Owner
Retailer End User
Future…
Now…
Producer GIFT +MBrand
Owner +MRetailer End User

Futureit may … happen with other interesting business
• Renewable energy plus experienced business partner
• Upstream chemical business plus originated supply chain partners
• Other Utilities business to create recurring income with experienced business partner

Opportunity DaySeptember 9th, 2016
Financial Summary

74.77%
6.16%6.28%
12.79%
2015
63.88%12.96%
7.21%
15.95%
2013
72.87%
5.69%6.28%
15.16%
2014
Revenue of 666 million baht. Volume 12,230 MT
Revenue from sales and volumes by product group
Revenue of 817 million baht. Volume 12,702 MT
Revenue of 721 million baht. Volume 12,642 MT
73.76%
5.53%
6.71%
14.00%
2016(6M)
HPC Business
FBS Business
TC Business
PC Business
Revenue of 386 million baht. Volume 6,845 MT

658.96 670.54
826.52
753.25
399.10
105.54 121.38 139.98 143.7587.74
53.04 49.5475.54 90.15
52.764.89 24.55 10.190.00
100.00
200.00
300.00
400.00
500.00
600.00
700.00
800.00
900.00
2012 2013 2014 2015 2016(6M)
Million baht
Income Gross profit Net profit Investment profit
Year
Total Revenue and Profitability
(16.36%) (18.23%) (17.14%) (19.93%)
(8.05%) (7.39%)(9.14%) (11.97%)

Asset
144.61 184.87 162.02 212.47298.60
118.50124.42 129.84
125.86
137.9290.43
89.56 108.01119.07
119.78152.06
171.24232.10
193.03
189.4721.63
55.7473.26
59.49
3.83
2.43
8.075.82
7.32
0.00
100.00
200.00
300.00
400.00
500.00
600.00
700.00
800.00
900.00
2012 2013 2014 2015 2016(6M)
Million baht
Other assets
Investment
Account receivable
Land, Building andEquipmentInventories
Cash and cashequivalents
Total asset 509
Total asset 594
Total asset 696
Total asset 730
(28.39%)
(23.26%)
Year
(17.75%)
(29.85%)
(0.75%)
(28.82%)
(15.07%)
(20.94%)
(31.11%)
(3.64%)
(0.42%)
(23.29%)
(18.66%)
(33.36%)
(8.01%)
(1.16%)
(29.12%)
(17.25%)
(16.32%)
(26.46%)
(10.04%)
(0.81%)
(15.52%)
Total asset 813
(0.90%)
(7.32%)
(23.32%)
(14.74%)
(16.97%)
(36.75%)

Debt to Equity Ratio
232.20 276.47 310.69 258.68 309.75
277.22317.68
385.09470.83
502.83
0.840.87
0.81
0.550.62
0.00
0.10
0.20
0.30
0.40
0.50
0.60
0.70
0.80
0.90
1.00
0.00
100.00
200.00
300.00
400.00
500.00
600.00
700.00
800.00
900.00
2012 2013 2014 2015 2016(6M)
Increase ratioMillion baht
Total Liabilities Total Equities Debt to Equity Ratio
Total Liabilities 310
Year
Total Liabilities 232
Total Liabilities 311
Total Liabilities 276
Total Liabilities 259

19.93
16.71
21.64 21.30 21.05
14.40
11.92
15.4316.47 16.72
0.00
5.00
10.00
15.00
20.00
25.00
2012 2013 2014 2015 2016 (6M)
ROE ROA
Increase ratio
Year
Return on Equity(ROE) and Return on Asset (ROA)

Opportunity DaySeptember 9th, 2016
Question & Answer