opportunity for driving safety – 24/7 on and off the job for driving safety – 24/7 on and off...
TRANSCRIPT

5/24/2007 1
Opportunity for Driving Safety – 24/7On and Off the Job
Carol A. PalmiottoGlobal SHE Platform Manager AG&N
June 2007
25/24/2007
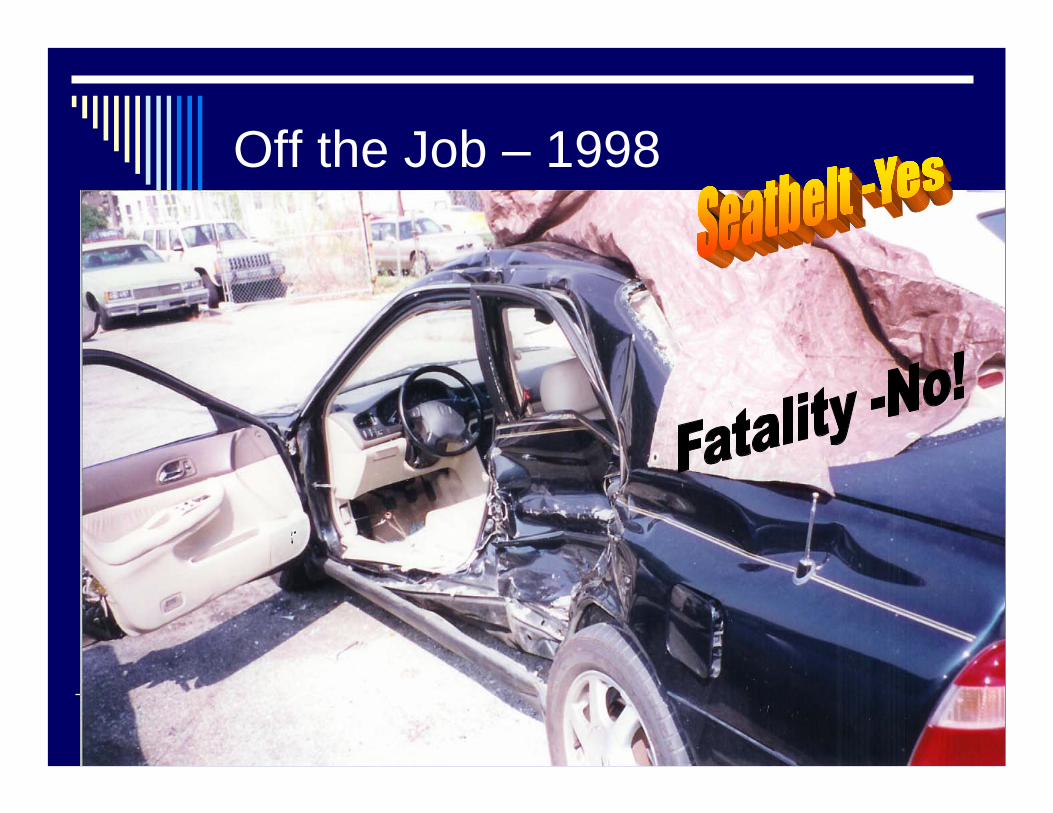
Off the Job – 1998

35/24/2007
Driving is the most dangerous activity we do!Fatality or not? Seatbelt use? You be the judge….

45/24/2007
Why ? SAFE DRIVING …..On and off the job! Safety 24/7 is a CORE VALUE
Prevention = Saves Pain & Aggravation
What is the “COST” of a Vehicle accident with or without an INJURY?Pain and Suffering of our ColleaguesLoss to their families & friends…and usFinancial Cost to the individual or business = Health care/ Workmen’s compensation+ Investigation cost + clean-up/repair costs+ loss of business+ OT +…..unquantifiable loss of reputation and time.
55/24/2007
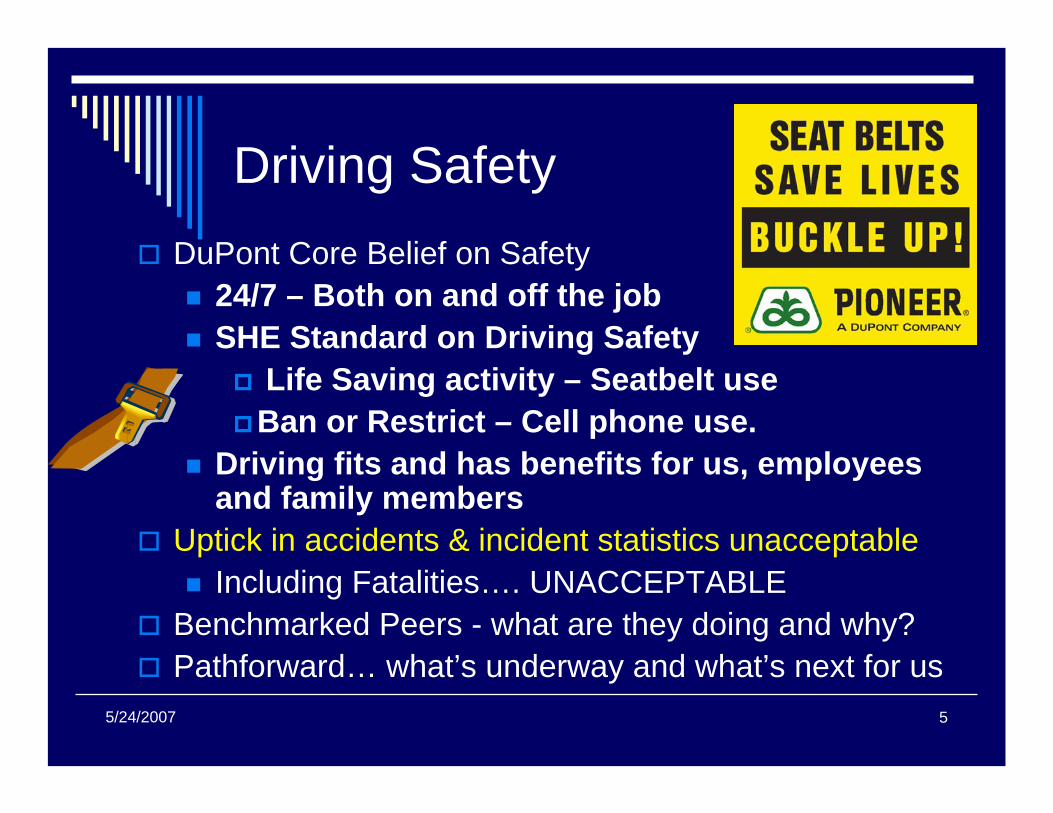
Driving SafetyDuPont Core Belief on Safety
24/7 – Both on and off the jobSHE Standard on Driving Safety
Life Saving activity – Seatbelt useBan or Restrict – Cell phone use.
Driving fits and has benefits for us, employees and family members
Uptick in accidents & incident statistics unacceptableIncluding Fatalities…. UNACCEPTABLE
Benchmarked Peers - what are they doing and why?Pathforward… what’s underway and what’s next for us

65/24/2007
Driving Safety US Only- Leased Vehicle accidents
108
1620
99
831
207
63
151
175
96
362
59
28
010
50
100
150
200
250
2003 2004 2005 2006 2007year
SBU ASBU BSBU CSBU DSBU E
2005 – 5 Vehicle Fatalities2 On the Job2 Off the Job1 Employee Biking to work
2006 – 2OTJ = 1 Vehicle + 1 Motorcycle
2007 – 2 OTJ Motorcycle Fatalities1 On the Job – Van to drop off point
2005 first year of accurateData collection

75/24/2007
Ag& N - SBU’s with most vehicles
0
0.02
0.04
0.06
0.08
0.1
0.12
0.14
0.16
Rat
io*
2003 2004 2005 2006 2007year
SBU B - NA
SBU A- NA
SBU A- Europe
SBU B- Europe
If assume 35,000 miles driven per year then…..
Ratio = #of accidents/ total# leasedvehicles
00.5
11.5
22.5
33.5
44.5
5
2004 2005 2006 ytd2007
SBU A NASBU B-NASBU A EuropeSBU B Europe
Accidents per million miles driven
Last Updated 5/2/07
* Includes Russia

85/24/2007
2007 Auto Accidents by Region 3%
38%
28%
11%
20%
AfricaNAEuropeLAAP
0% 12%
37%
21%
30%
AfricaNAEuropeLAAP
SBU BSBU A
Updated 5/07 Updated 5/07

95/24/2007
What did we do…Commissioned Special Driving Safety Task Team Corporate TeamReview Policy and Procedures – Revised Corporate Standard Benchmarked Other companiesFocus Areas : Training, Mandated Ride Checks, Communications, Metrics, Root cause analysis of AccidentsCommunications ,Communications, Communications
Used Sales & Marketing Team – Forward Energy Model
Audits – Seat belt/ Cell Phone Checks and audits

105/24/2007
BENCH MARK Program Comparison Early 2006
#1 STRONG LEADERSHIP COMMITMENT!!20, 000 Fleet vehicles; 40 K employeesFULL management commitment
CEO sponsor, COO launched in 2002Took it to the next level!
Multiple levels of training , Interactive, BTWTermination for Seatbelt infraction ON the job
Metrics: per Million miles drivenImproved performance, 1/2 rate in first yearAudit trail, Expense report or required to report monthly to Group Driver Rep, gas card
FULL time Director of VEHICLE DRIVING SAFETY PROGRAM….Reports to CEO!
EACH work group has designated Driving CoordinatorVehicle Safety Programs & Teams by SBU equivalent
Management commitment & ResponsibilityConduct Commentary checks annuallySupport training for all employees
PROGRAM For ALL employees & Family outreach component
Every employee participates in the programEncouragement of family training with CD
Training refreshed annually & tailored to Driving Employee environment
Same elements: Procedures, PracticesALLOWED SBU’s to manage & ImplementCorporate messages limited and from Central SHE officeStatistics vary by SBU, no across the company recordkeeping with audit trailFrequent Driver definition variesTraining Requirements varyVery limited family programs, Outreach?Management message and Line commitment varies

115/24/2007
Benchmark Program ComparisonAdditional Highlights
Management commitmentCommentary Drive Assessment/ ChecksSupportive of Training costs within their business or functionSupport and Name Driving Safety Coordinator for their groups… EVERY Organization!Have Vehicle Safety committee/ task team like Site Safety Activity Committee for sites/businesses
Every EmployeeDriver Safety Training- varies by level to Driving CoordinatorReport Company mileage monthly to systemCommitment that all will support program, sign off by Frequent DriversAll Company Drivers Self Report if moving violationMVR is reviewed; At Risk Classification assessment
Family & OutreachOffer Training programs – Defensive driving, DVD’s etc.

125/24/2007
Key Critical X’s for a Safe Driving Program & Improvement
When comparing to benchmark companies:Overall Driving Safety Coordinator
Leadership and commitment- strong messagesOversight to implementation
AuditingDriver Checks- self and othersMotor vehicle record checks
TrainingUnderstand the hazard of their driving environmentAnnualClassroom, Interactive & On the Road…Defensive DrivingInclude the outside community
Enforcement of core values / rulesSeat Belt UseCell phone

135/24/2007
Vehicle Motion
Coun
t
backingstationaryforward
80
60
40
20
0
backingstationaryforward
80
60
40
20
0
Who Caused = DP driver Who Caused = other
Who Caused = Other driver
forwardstationarybacking
Vehicle Motion
Pareto Chart of Vehicle Motion by Who Caused
Global SBU B Accidents 2005-06 –Who caused accident x Vehicle’s motion
Overall a high % of accidents
caused by our Drivers

145/24/2007
Global SBU B Accidents in 05-06 Region x Year
Year
Coun
t
20052006
60
45
30
15
0
20052006
60
45
30
15
0
Region = Asia Region = EMA
Region = LA Region = NA
20062005
Year
Pareto Chart of Year by Region
EMA & LA had increase in accidents in 06 vs 05

155/24/2007
Accident Type
Coun
t
Other
stru ck
anim
al
unkn
own
struc
k obje
ct
struc
k veh
icle
struc
k by v
ehicle
60
45
30
15
0
Other
struc
k anim
al
unkn
own
struc
k objec
t
struc
k vehic
le
struc
k by v
ehicle
60
45
30
15
0
Region = Asia Region = EMA
Region = LA Region = NA
struck by vehiclestruck vehiclestruck objectunknownstruck animalOther
Accident Type
Pareto Chart of Accident Type by Region
Global SBU B Accidents in 05-06 Accident Type x Region
NA has higher rate of striking vehicle and
objects
EMA & LA drivers usually struck by
other vehicle

165/24/2007
Collisions & Incidents by Category
60
4321
16
15
15
11
109
Collision between vehiclesStopped and hit by other partyHit rear of other partyOther party hit rearCollision with fixed objectDamage while parkedPedestrian/Animal crossingDamage while parking/backingOther
Total : 200
Asia Pacific Green Belt Project– to reduce accidents
Collisions and Incidents by Category
60
43
21
16
15
15
1110 9

175/24/2007
AccidentsPer year
VehicleCollisions
Awareness &Attention
Animal Mishaps
DP Driver at Fault
Focused Training
Punishment & Restrictions
Training
Performance Standard Reduce accidents by 25%
Equipment
(Y)
Controllable X’s
Vehicle Visibility
Parking Location
Vehicle Incidents
Vehicle Equipment
Other Driver at Fault
Awareness &Attention
Rewards

185/24/2007
Corporate Change: Seatbelt use on company business or in company car is mandatory. Classified as an inviolable Safety RuleThis means employee can be terminated if fails to comply absent
mitigating circumstancesRational:
Seatbelts save lives and our safety culture requires the use of all prevention equipmentWe have had multiple fatalities where the driver failed to wear his seatbelt , was ejected during the crash and killedSeatbelts must be worn in all company vehicles, in all vehicles on company business and at all time on company property.This safety rule is the equivalent of LTT.Many states mandate seatbelt use-primary moving vehicle offense
Action Plan Elements: Modify Company driving standard, issue, cascade communication major change; Consequences determined by Team including HR & Legal & Business reps. Conduct audits and share statistics
Modification Approved and Issued.
Communications issued . Preliminary seatbelt checks conducted. Corporate disciplinary procedure to be followed
195/24/2007
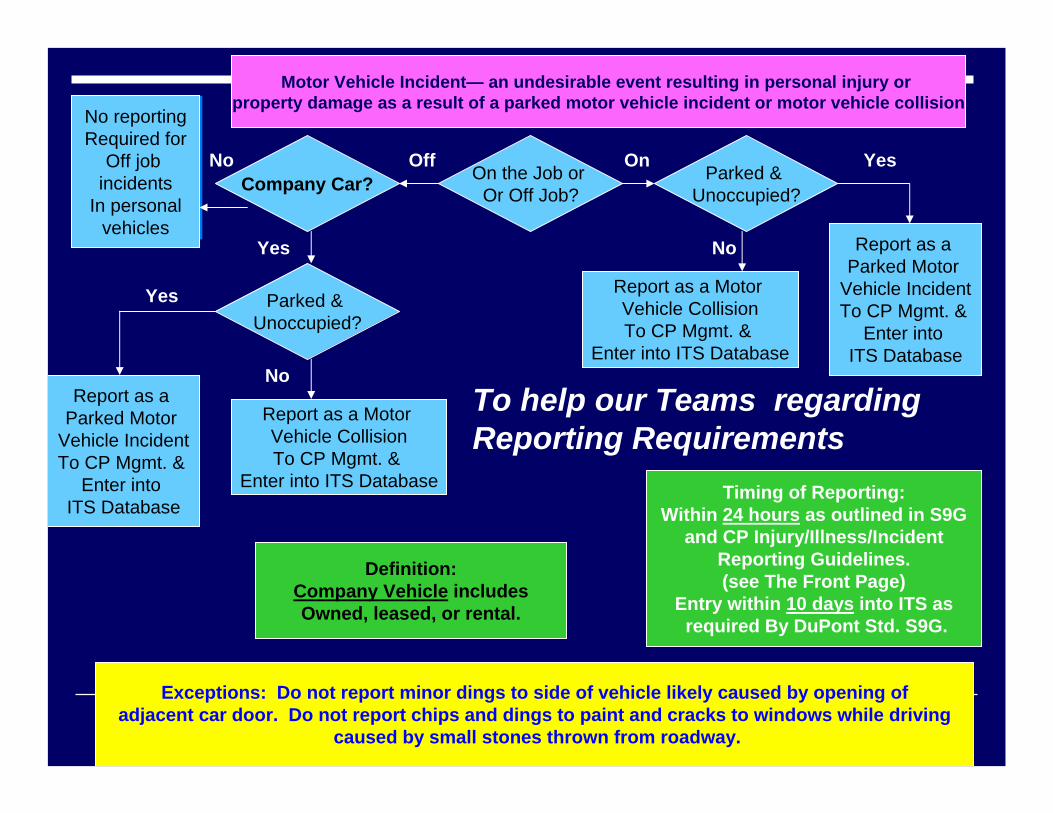
On the Job or Or Off Job?
Motor Vehicle Incident— an undesirable event resulting in personal injury or property damage as a result of a parked motor vehicle incident or motor vehicle collision
Company Car?OffNo
Parked & Unoccupied?
Report as a Motor Vehicle CollisionTo CP Mgmt. &
Enter into ITS Database
Yes
Yes
Report as a Parked Motor
Vehicle IncidentTo CP Mgmt. &
Enter into ITS Database
No
Parked & Unoccupied?
Report as a Parked Motor
Vehicle IncidentTo CP Mgmt. &
Enter into ITS Database
Report as a Motor Vehicle CollisionTo CP Mgmt. &
Enter into ITS Database
On Yes
No
Exceptions: Do not report minor dings to side of vehicle likely caused by opening ofadjacent car door. Do not report chips and dings to paint and cracks to windows while driving
caused by small stones thrown from roadway.
Timing of Reporting:Within 24 hours as outlined in S9G
and CP Injury/Illness/IncidentReporting Guidelines.(see The Front Page)
Entry within 10 days into ITS asrequired By DuPont Std. S9G.
No reportingRequired for
Off job incidents
In personalvehicles
Definition:Company Vehicle includesOwned, leased, or rental.
To help our Teams regardingReporting Requirements

205/24/2007
What have we done ?Company standard updated and communicatedExplicit communications around Seat belt and cell phone use… several Senior leadership communicationsInteractive Training module developed, more to follow
Encourage Defensive Driving training for allInsurers Driver’s Programs
Definition of Frequent driver expanded and requirements for training and checks specifiedDriver Checks – Required Quarterly for Frequent DriversLeadership – Meet and Greet and ChecksPositive Recognition of Safe Drivers!!!!Communications!: Internet & Email
Business Unit Front Page- available to all employeesForward Energy Model – Compilation of contribution from Sales& Marketing Teams globally – includes training tool , video or message
215/24/2007
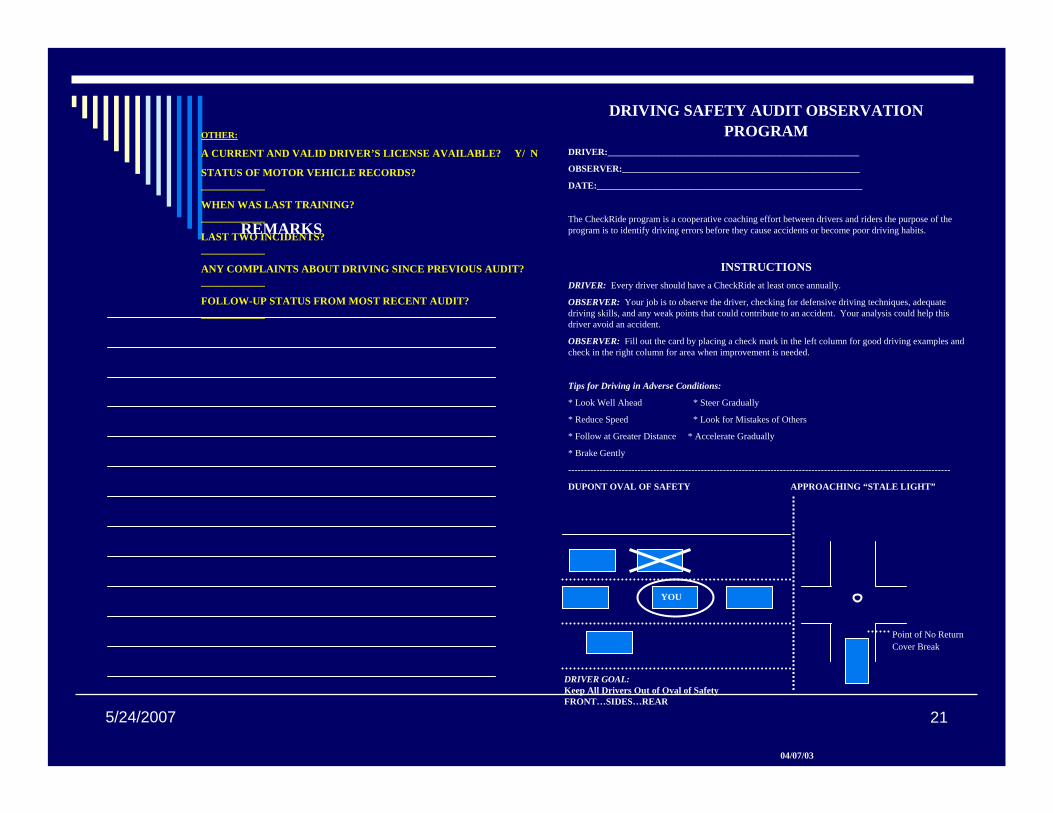
DRIVING SAFETY AUDIT OBSERVATION PROGRAM
DRIVER:______________________________________________________
OBSERVER:___________________________________________________
DATE:_________________________________________________________
The CheckRide program is a cooperative coaching effort between drivers and riders the purpose of the program is to identify driving errors before they cause accidents or become poor driving habits.
INSTRUCTIONSDRIVER: Every driver should have a CheckRide at least once annually.
OBSERVER: Your job is to observe the driver, checking for defensive driving techniques, adequate driving skills, and any weak points that could contribute to an accident. Your analysis could help this driver avoid an accident.
OBSERVER: Fill out the card by placing a check mark in the left column for good driving examples and check in the right column for area when improvement is needed.
Tips for Driving in Adverse Conditions:
* Look Well Ahead * Steer Gradually
* Reduce Speed * Look for Mistakes of Others
* Follow at Greater Distance * Accelerate Gradually
* Brake Gently
-------------------------------------------------------------------------------------------------------------------------
DUPONT OVAL OF SAFETY APPROACHING “STALE LIGHT”
YOU
DRIVER GOAL:Keep All Drivers Out of Oval of SafetyFRONT…SIDES…REAR
Point of No ReturnCover Break
REMARKS
04/07/03
OTHER:
A CURRENT AND VALID DRIVER’S LICENSE AVAILABLE? Y/ N
STATUS OF MOTOR VEHICLE RECORDS?____________
WHEN WAS LAST TRAINING?____________
LAST TWO INCIDENTS?____________
ANY COMPLAINTS ABOUT DRIVING SINCE PREVIOUS AUDIT? ____________
FOLLOW-UP STATUS FROM MOST RECENT AUDIT? ____________

225/24/2007
PREPARATION TO DRIVE
Vehicle Checks: _____ Tires _____ Windshields/Wipers _____ Lights _____ Brakes
_____ Appearance _____ Turn Signals _____ Horn _____ Safety Equipment
_____ Hazard Lights _____ Overall Condition
Adjustments: _____ Seat _____ Mirrors _____ Head Rest
_____ Restraints _____ Cellular Phone/Telematics
SKILLS GOOD NEEDS IMPROVEMENT
SEEINGSCANS 15/20 SECONDS AHEAD ______ ______MOVES EYES EVERY TWO SECONDS ______ ______DEVELOPS BIG PICTURE ______ ______CHECKS BLIND SPOT BEFORE LANE CHANGE ______ ______CHECKS FOR TAILGATERS ______ ______
SPACINGOBSERVES MINIMUM FOLLOWING DISTANCE ______ ______
(THREE SECONDS)SPACES VEHICLE PROPERLY WITH LANE ______ ______MAINTAIN AVENUE OF ESCAPE ______ ______AVOIDS DRIVING IN BLIND SPOT OF OTHERS ______ ______OBSERVES STOP DISTANCE (Min. 1 Car Length) ______ ______USES PROPER LANE ______ ______
COMMUNICATIONSUSES HORN WHEN IN DOUBT ______ ______USES DIRECTIONAL SIGNALS CORRECTLY ______ ______SIGNALS INTENT BY:
BRAKES ______ ______HEADLIGHTS ______ ______FLASHERS ______ ______
RESPONSEBACKS PROPERLY ______ ______DOESN’T CUT CORNERS ______ ______COVERS BRAKE IN DOUBTFUL SITUATIONS ______ ______ADJUSTS SPEED TO CONDITIONS ______ ______YIELDS TO OTHERS WHEN APPROPRIATE ______ ______APPROACHES LIGHTS AND INTERSECTIONS ______ ______
CORRECTLYDOESN’T GET UPSET AT OTHER DRIVERS ______ ______CHECKS REAR VIEW MIRRORS WHEN ______ ______STOPPING AND SLOWING DOWN ______ ______YIELDS AT EXITS CORRECTLY ______ ______
PREPARATION TO DRIVE (CONT’D)
SKILLSHAND POSITION (DRIVING STRAIGHT): ______ GOOD
______ TOO HIGH______ TOO LOW______ ELBOW ON THE DOOR______ ON THE GEAR STICK
HAND POSITION (WHEN TURNING): ______ GOOD______ TOO HIGH______ TOO LOW______ ELBOW ON THE DOOR______ ON THE GEAR STICK
BRAKE UTILIZATION: ______ LATE______ SHIFT DOWN WHILE BRAKING______ GOOD (COVERS)______ ABRUPT (NOT SMOOTH)
WHEN RENTING A VEHICLE, CHECK LOCATION OF (ENSURE ALL ARE OPERATIONAL):HEADLIGHTS TURN SIGNALSHORN REVERSE LIGHTSWARNING LIGHTS WIPERS & FLUID
PARKING:
PULLS THROUGH WHEN POSSIBLE Y/ N
BACKS IN WHEN APPROPRIATE Y / N
CHECKS AREA BEFORE BACKING Y / N
LOWERS WINDOW FOR IMPROVED HEARING Y / N WHEN BACKING AND TURNS OFF NOISE MAKING ITEMS
PARKS IN APPROPRIATE AREAS CONDUCIVE Y / NTO PERSONAL SAFETY AND VEHICLE SAFETY
CELLULAR PHONE/TELEMATICS/DISTRACTIONS:
REVIEW S9G REQUIREMENTS WITH DRIVER Y / N
ANY “COCKPIT” DISTRACTIONS? EXCESSIVE? Y / N Y / N
WERE DISTRACTIONS WELL MANAGED? Y / N
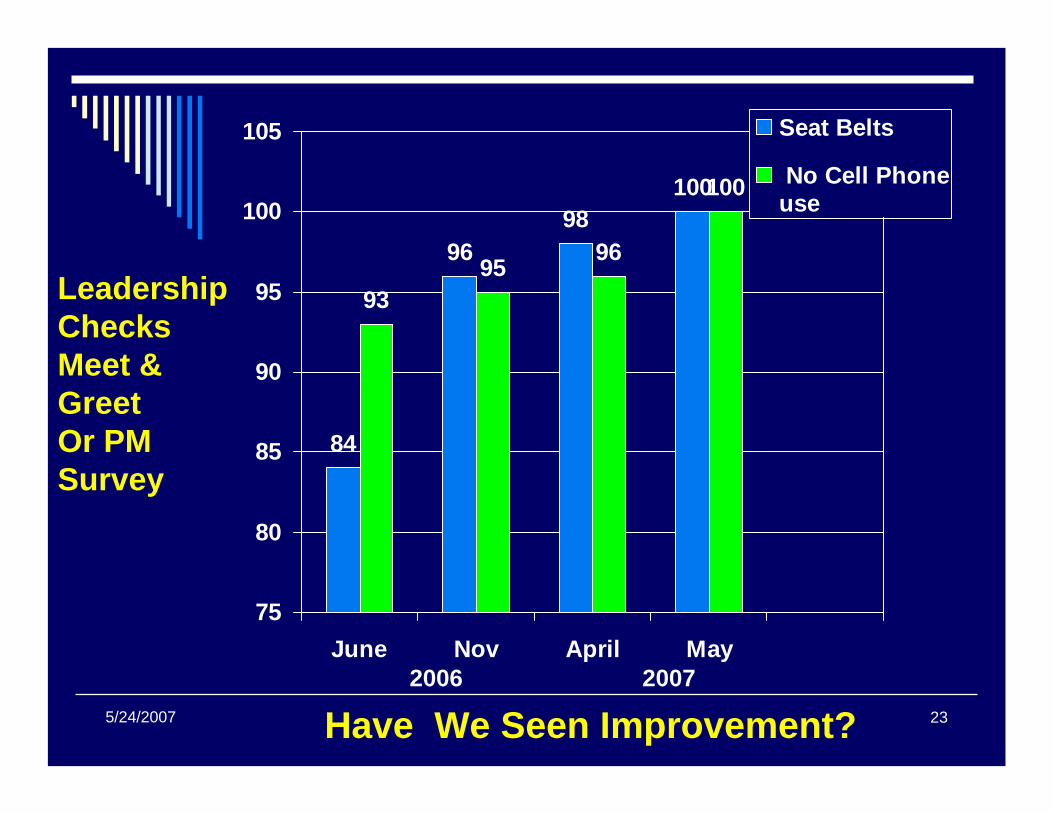
235/24/2007
84
9698
100
9395 96
100
75
80
85
90
95
100
105
June Nov April May
Seat Belts
No Cell Phoneuse
2006 2007
Have We Seen Improvement?
LeadershipChecksMeet & GreetOr PM Survey

245/24/2007
Driving Safety US Only- Leased Vehicle accidents
108
1620
99
831
207
63
151
175
96
362
59
28
010
50
100
150
200
250
2003 2004 2005 2006 2007year
SBU ASBU BSBU CSBU DSBU ETraining – Underway
Ride Checks - Ongoing
2005 first year of accurateData collection
2007 YTD

255/24/2007
WHAT ARE the Principles of SAFE DRIVING?
• Understand the hazards of the DRIVING…. the environment
• Ensure all have required skills and training• Maintain & USE Safety equipment
• Upgrade as needed Safety / prevention• Rules of the Road – MANDATORY SEATBELT USE.
• Manage changing environments• Anticipate the unexpected….always!• Identify and learn from incidents/ accidents
• Share the learnings and prevention opportunities• “Drive” continuous improvement… never accept
complacency.. Our people can get hurt!

265/24/2007