ops employee survey report 2011
TRANSCRIPT

2011 OPS Employee Survey
Enterprise Report
June 2011
© Queen’s Printer for Ontario, 20112011 OPS ENTERPRISE REPORT | Page 56

Table of Contents
Page
1. Introduction 1
1 1 Background 11.1 Background 1
1.2 2011 OPS Employee Survey Reporting Framework 2
2. Top Line Results 3
2.1 2011 OPS Results Scorecard 3
2.2 Index Trends 4
3. Employee Engagement Index 5
3.1 Employee Engagement Index Results 5
3.2 Distribution of Employee Engagement Scores 6
3.3 Inter‐jurisdictional Comparisons 7
4. Corporate Indices 9
4.1 Productive Capacity Index 94 1 1 Productive Capacity Index Results4.1.1 Productive Capacity Index Results
4.1.2 Priorities for Improvement
4.2 Workplace Culture Index 114.2.1 Workplace Culture Index Results
4.2.2 Priorities for Improvement
4.3 Talent Capacity Index 134 3 1 Talent Capacity Index Results4.3.1 Talent Capacity Index Results
4.3.2 Priorities for Improvement
4.4 Leadership Index 154.4.1 Leadership Index Results
4.4.2 Priorities for Improvement
5. Response rates 17
6 Acting on the Results 186. Acting on the Results 18
6.1 Communication and Awareness 18
6.2 Getting More Insight 20
6.3 Action Planning Steps 23
6.4 Resources 25
7. Detailed Results 26
Part A: Employee Engagement Themes 26
Part B: Ministry Scores 30
Part C: Discrimination, Harassment, Violence 31
Part D: Workforce Profile 36
Part E: Demographic Profile 42
Part F: Verbatim Summary 48Part F: Verbatim Summary 48
Appendix: OPS Employee Engagement Model
© Queen’s Printer for Ontario, 20112011 OPS ENTERPRISE REPORT |

1. Introduction
1.1 Background
The OPS Employee Survey was launched as a corporate program in 2006. Since 2007 it has beenconducted as a biennial census survey. The 2011 Employee Survey was fielded in February/March2011. This is the third employee census conducted by the Modernization Division, HROntario onbehalf of the OPS.
In the OPS Employee Engagement Model, employee engagement consists of both employeecommitment to the organization and the achievement of its goals, along with employee satisfactionwith the organizational culture and work environment. The OPS Employee Engagement Modelid tifi i t th th t i fl l t ( A di )identifies nineteen themes that influence employee engagement (see Appendix).
The OPS also subscribes to the Public Sector Service Value Chain which links employee engagement toorganizational performance and client satisfaction leading to public trust and confidence (seeAppendix).
• As in past reports, the Employee Engagement Index is based on nine key indicator questions.In addition to the Employee Engagement Index this report includes four sub indices thatIn addition to the Employee Engagement Index, this report includes four sub‐indices thatalign with broad corporate goals. These new Corporate Indices are: the Productive CapacityIndex; the Workplace Culture Index; the Talent Capacity Index and; the Leadership Index (seepage 2).
• The new Corporate Indices build on insight gained from previous waves of the OPS EmployeeEngagement Measurement Program. These four additional measures enhance the level of
bl h d dactionable insight provided.
• In this report you will first see the “Top Line” results of the 2011 Employee Survey followedby analysis of the Employee Engagement Index. The following sections then report on eachCorporate Index, including the respective employee engagement themes on which they arebased.
• Priorities for action are identified in the context of each Corporate Index and summarized inthe “2011 OPS Employee Survey Results Scorecard”. Guidance on how to obtain furtherinsight regarding the results and tailor corresponding action plans is also provided.
• Detailed results are provided in section 7. These include response rates, question byquestion results, demographics and other useful information.
• Community of Practice representatives in each Ministry are available to provide furtherinformation about the OPS Employee Engagement Measurement Program and this report.Your Ministry representatives can also support insight development, action planning andcommunication strategies.
© Queen’s Printer for Ontario, 20112011 OPS ENTERPRISE REPORT | Page 1

1. Introduction
1.2 2011 OPS Employee Survey Reporting Framework
The OPS Employee Survey Reporting Framework is a “balanced scorecard” that informs and supportskey corporate goals captured in the form of four Corporate Indices in addition to the overallEmployee Engagement Index. Each Corporate Index provides insight on an aspect of employeeEmployee Engagement Index. Each Corporate Index provides insight on an aspect of employeeengagement as outlined below. Each Corporate Index is in turn comprised of a set of EmployeeEngagement themes associated with the OPS Employee Engagement Model.
The Employee Engagement Index measures employee satisfaction with their immediate workenvironment and the broader organizational culture as well as their commitment to the organizationand the achievement of its goals.
The Productive Capacity Index reports on employees’ perceptions of their ability to effectivelyprovide service and discharge their duties.
The Workplace Culture Index reports on employees’ perceptions of the physical, social andorganizational environment in which they work.
The Talent Capacity Index reports on employees’ perceptions of the OPS’ ability to attract, developand optimize its human resources.
The Leadership Index reports on employees’ perceptions of the quality of leadership and supervisionthey receive.
OPS Employee Survey Reporting Framework
Corporate Indices• Job Fit
Themes
Productive Productive Capacity IndexCapacity Index
• Orientation\On‐Boarding• Performance Barriers• Quality of Service Provided• Support & Tools
• Co‐Worker Relationships
Employee Employee Engagement Engagement
IndexIndex
Workplace Workplace CultureCultureIndexIndex
• Inclusive Practices*• Independence & Innovation• Recognition• Safe & Healthy Workplace• Workplace Morale• Work‐Life Balance
C AdTalent Capacity Talent Capacity
IndexIndex
L d hiL d hi
• Career Advancement• Commitment to Public Service• Learning & Development
• Clear Expectations & Direction• Direct Supervision
© Queen’s Printer for Ontario, 20112011 OPS ENTERPRISE REPORT | Page 2
Leadership Leadership IndexIndex
• Direct Supervision• Leadership Practices• Organizational Communication
* Formerly Fair HR Practices

2. Top Line Results
2.1 2011 OPS Results Scorecard
The following chart summarizes the OPS’ survey scores on the Employee Engagement Index (EEI) andh f th f C t I di Th t d l t d di d t i
OPS Employee Survey Scorecard
each of the four Corporate Indices. These scores are presented on a scale standardized to a maximumof 100 points. The individual corporate index scores move in different ranges. A lower score in aparticular index does not mean that it should be a priority over the other corporate indices.
OPS Employee Survey Scorecard
Productive Productive
Priority Themes*
Capacity IndexCapacity Index(61.99)
Workplace CultureWorkplace CultureIndexIndexEmployee Employee
Job Fit
RecognitionIndexIndex(63.80)
Talent Capacity Talent Capacity IndexIndex
p yp yEngagement Engagement
IndexIndex
(69.21)(69.21)
Recognition
Career Advancement(64.09)
Leadership Leadership IndexIndex(60.79)
Leadership Practices(60.79)
*Indicates the top priority theme for each of the Corporate Indices.
© Queen’s Printer for Ontario, 2011
2. Top Line Results
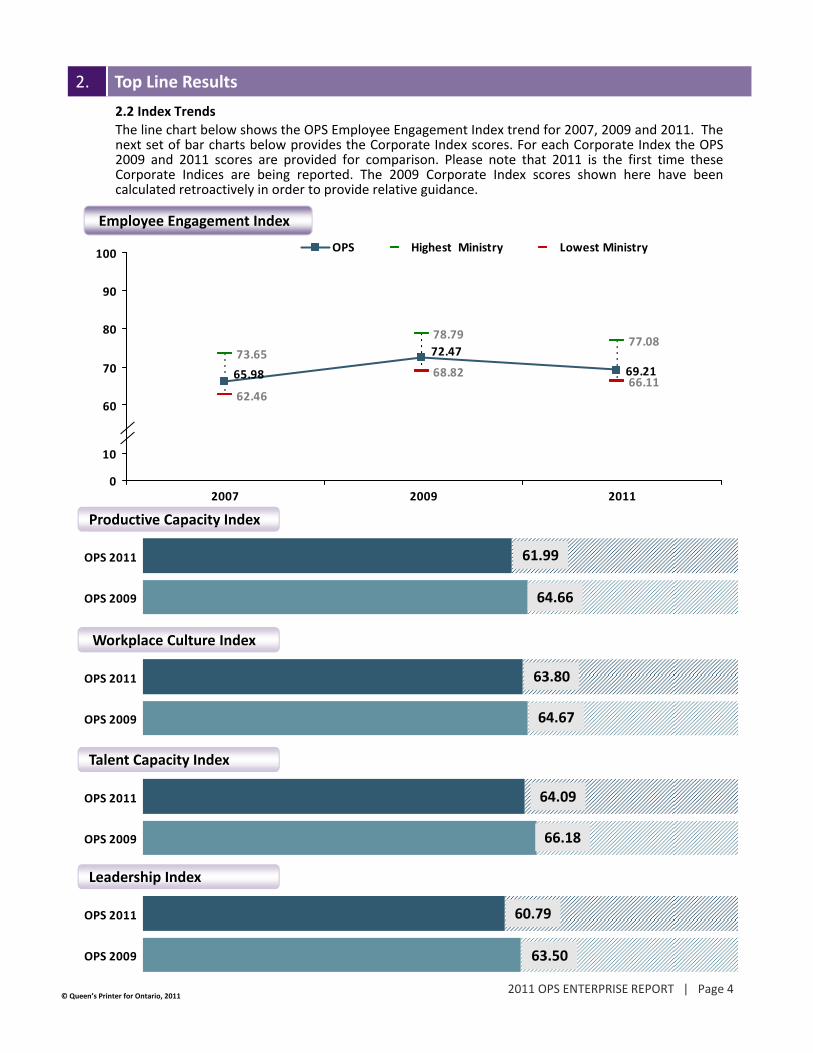
2.2 Index Trends
The line chart below shows the OPS Employee Engagement Index trend for 2007, 2009 and 2011. Thenext set of bar charts below provides the Corporate Index scores. For each Corporate Index the OPS2009 and 2011 scores are provided for comparison. Please note that 2011 is the first time theseCorporate Indices are being reported. The 2009 Corporate Index scores shown here have beencalculated retroactively in order to provide relative guidance.
Employee Engagement Index
100 OPS Highest Ministry Lowest Ministry
65.98
72.47
69.21
73.65
78.7977.08
62.46
68.8266.11
60
70
80
90
Productive Capacity Index
60
0
10
2007 2009 2011
OPS 2011
OPS 2009
p y
Workplace Culture Index
61.99
64.66
OPS 2011
OPS 2009
p
Talent Capacity Index
63.80
64.67
OPS 2011
OPS 2009
p y
Leadership Index
64.09
66.18
© Queen’s Printer for Ontario, 20112011 OPS ENTERPRISE REPORT | Page 4
OPS 2011
OPS 2009
60.79
63.50

3. Employee Engagement Index
The Employee Engagement Index measures employee satisfaction with their immediate workenvironment and the broader organizational culture as well as their commitment to the organizationand the achievement of its goals.
3.1 Employee Engagement Index (EEI) Results
As indicated on page 4, the OPS 2011 overall EEI score is 69.21. This is 3.26 points lower than in 2009but 3.23 higher than 2007. While the OPS achieved considerable progress from 2007 to 2009, therehas been a decline in 2011. Similarly, whereas the OPS engagement score was on par with the nationalbenchmark score in 2009, it has now slipped below on five of the six inter jurisdictional EEI indicators(see page 7).(see page 7).
The highest scoring EEI indicator in the 2011 results is “I strive to improve my Ministry’s results” (77%agree/strongly agree) while the lowest is “I am satisfied with my ministry” (50% agree/strongly agree).Employees have greater pride in their Ministries than in the OPS overall (70% versus 63%agree/strongly agree). Generally, they are also more satisfied with their own jobs and work than theyare with their Ministries. Research across organizations has shown that job and work satisfaction aretypically higher than organizational satisfaction.
Trends show that all EEI indicators in 2011 are lower than 2009 but most are higher than 2007. Theaverage score for “I am inspired to give my very best” dropped the most (.25 lower than 2009 OPSaverage and .03 lower than 2007), while “I would prefer to stay with the OPS…” dipped the least (.04)between 2009 and 2011. Hence, while feeling less inspired to give their best efforts overall, mostemployees remain firmly committed (albeit at lower levels than in 2009) to improving their Ministries’results.
5
7
9
12
23
32
38
36
25
14
OPS Average*
2011 2009 2007
I am satisfied with my job 3.69 3.77 3.58
I am satisfied with my Ministry 3.40 3.54 3.23
Employee Engagement Indicators (%)
5
5
4
9
9
5
22
24
21
38
31
35
26
32
35
y y
Overall, I am satisfied in my work as an OPS employee 3.71 3.82 3.56
I am proud to tell people I work for the OPS 3.77 3.86 3.58
I am proud to work for my Ministry 3.92 4.00 3.77
5
7
5
8
10
8
22
19
25
32
31
35
34
33
27
I would prefer to stay with the OPS, even if offered a similar job
elsewhere3.83 3.87 3.60
I am inspired to give my very best 3.73 3.98 3.76
I would recommend the OPS as a great place to work 3.71 3.85 3.50
© Queen’s Printer for Ontario, 20112011 OPS ENTERPRISE REPORT | Page 5
* Average of responses based on a 5‐point agreement scale
13 20 43 34
Strongly Disagree Disagree Neutral Agree Strongly Agree(n=40,625) (n=29,052)(n=41,502)
I strive to improve my Ministry’s results 4.05 4.24 4.04
“n” refers to the first question in the survey and will vary slightly by question“⁻*⁻” indicates that the question was not asked in that year“‐” indicates insufficient base size to report↑↓ indicates statistically significant direction of change 2011 – 2009 (95% confidence)

3. Employee Engagement Index
It should be noted that the EEI and its key indicators are “outcome” oriented measures. Hence, theytend not to be “actionable” directly but rather must be influenced through actions that target otherpriority findings as highlighted in the Corporate Index Priorities (see section 4).
3.2 Distribution of Employee Engagement Scores
The OPS workforce was segmented into low, medium and high engaged employees based on theirindividual EEI scores. The proportion of highly engaged employees has declined sharply since 2009.Specifically, just over one third of OPS employees (37%) in 2011 are highly engaged compared to overhalf (51%) in 2009 and 44% in 2007.
The 14 percentage point decline in highly engaged employees since 2009 has now shifted into theThe 14 percentage point decline in highly engaged employees since 2009 has now shifted into themedium engaged (6 percentage point increase) and low engaged (8 point increase) employeesegments. The 41% medium engaged employee group is a large “swing” segment with the potential tobecome more engaged if their key concerns are addressed. The Corporate Priorities (see section 4)identify specific priorities for potential initiatives in each of the four Corporate Indices that couldimprove employee engagement.
Additional insights into the reasons for employee engagement shifts are gained by exploring patternsg p y g g g y p g pin the OPS survey results by Workforce and Demographic Profiles (Section 7). Significant declines since2009 in some large subgroups are important to consider in action planning. For example, the largestemployment group, Bargaining Units (as self identified by staff), has seen a greater than averagedecline in employee engagement compared to the OPS overall since 2009. Employee engagement hasdeclined more sharply for employees who haven’t been appraised in the last 12 months, don’t havewritten performance and learning plans, and have initiated job changes within the last three years.
Proportion of Employees with High, Medium and Low Levels of Engagement
37%21%
13% 16%
and Low Levels of Engagement
2011
41%
2009
35%
51%2007
39%
44%
© Queen’s Printer for Ontario, 20112011 OPS ENTERPRISE REPORT | Page 6
Low 0‐50 Medium 50‐75 High 75‐100
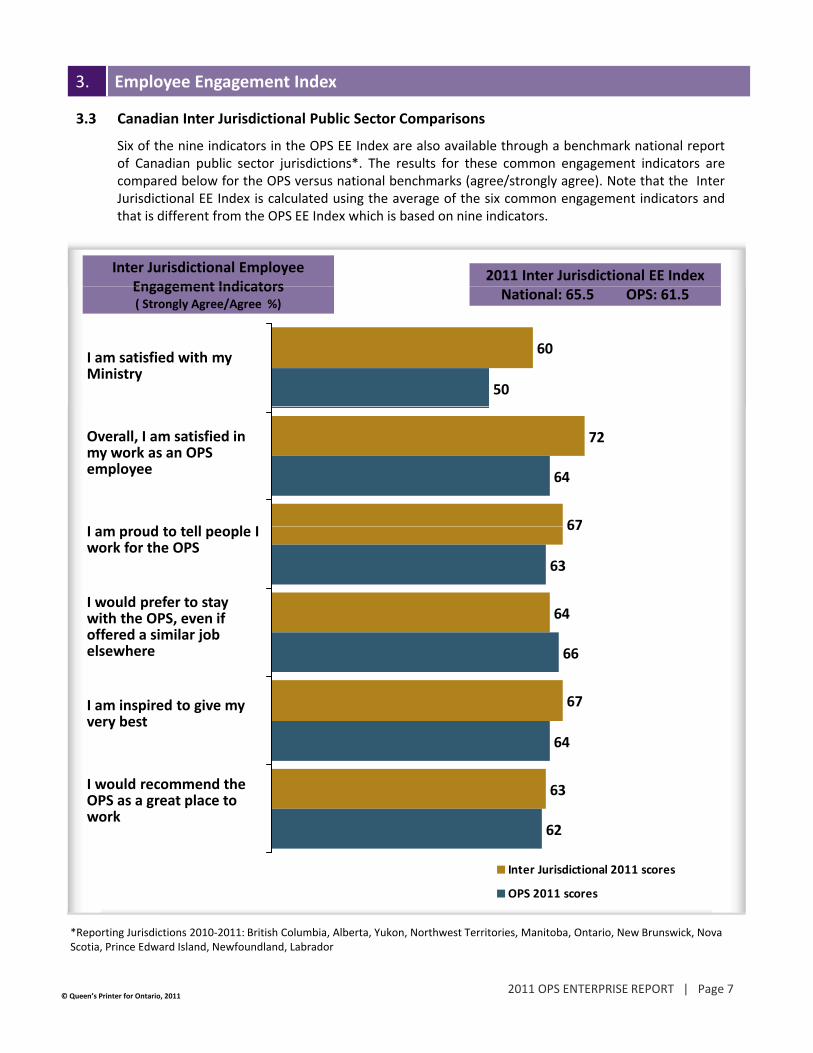
3.3 Canadian Inter Jurisdictional Public Sector Comparisons
Six of the nine indicators in the OPS EE Index are also available through a benchmark national reportof Canadian public sector jurisdictions*. The results for these common engagement indicators are
3. Employee Engagement Index
of Canadian public sector jurisdictions . The results for these common engagement indicators arecompared below for the OPS versus national benchmarks (agree/strongly agree). Note that the InterJurisdictional EE Index is calculated using the average of the six common engagement indicators andthat is different from the OPS EE Index which is based on nine indicators.
Inter Jurisdictional Employee Engagement Indicators
2011 Inter Jurisdictional EE Index Engagement Indicators ( Strongly Agree/Agree %)
I am satisfied with my Ministry
60
50
National: 65.5 OPS: 61.5
Overall, I am satisfied in my work as an OPS employee
I d ll l I
72
67
64
I am proud to tell people I work for the OPS
I would prefer to stay with the OPS, even if offered a similar job l h
67
64
63
elsewhere
I am inspired to give my very best
67
66
64
I would recommend the OPS as a great place to work
63
62
Inter Jurisdictional 2011 scores
© Queen’s Printer for Ontario, 2011
OPS 2011 scores
2011 OPS ENTERPRISE REPORT | Page 7
*Reporting Jurisdictions 2010‐2011: British Columbia, Alberta, Yukon, Northwest Territories, Manitoba, Ontario, New Brunswick, Nova Scotia, Prince Edward Island, Newfoundland, Labrador

3. Employee Engagement Index
The national inter‐jurisdictional EE Index has decreased from 67.2 in 2009 to 65.5 in 2011 (‐1.7points). The OPS inter‐jurisdictional EE Index has also decreased from 66 to 61.5 (‐4.5) in the sameperiod While in 2009 the OPS inter‐jurisdictional EE Index was just 1 2 points below the national EEperiod. While in 2009 the OPS inter‐jurisdictional EE Index was just 1.2 points below the national EEIndex, the gap has now widened.
The OPS has now slipped below the national benchmark on five of the six inter jurisdictionalengagement indicators. The most significant gaps between the OPS and other jurisdictions are onemployees’ satisfaction with their Ministries (10 percentage point gap) and with their work as OPSemployees (8 percentage point gap). These gaps likely relate to questions around Job Fit (see page10) where perceptions of job challenge and job fit with skills and interests have declined significantly10) where perceptions of job challenge and job fit with skills and interests have declined significantlywithin the OPS.
Gaps between the OPS and the national benchmark on four of the six inter jurisdictional engagementindicators are modest, ranging from 1 to 4 percentage points. The only indicator on which the OPS israted higher than other jurisdictions is “I would prefer to stay with the OPS, even if offered a similarjob elsewhere” (+2 percentage points)
The OPS engagement model and EEI distinguish between employee satisfaction and commitment.Clearly, both are required for strong employee engagement. The one item in the inter jurisdictionalengagement indicators that stands out from the rest is “I am satisfied with my Ministry” which israted favourably (agree/strongly agree) by only half of the OPS workforce as compared to between62% and 66% favourable for the five other indicators. This pattern of results suggests that, relativeto other jurisdictions, OPS employees are more dissatisfied with their Ministries than with their workor the OPS overall. Greater insight into more specific underlying causes can be facilitated throughthe Ministry level reports and action planning.
Employee engagement results from the private sector between 2009‐2011 are mixed. Mostreputable sources report downward or stable trends. To benchmark the OPS, the best comparator isthe Canadian public sector since provincial jurisdictions utilize similar methodologies includingseveral common indicators.
© Queen’s Printer for Ontario, 20112011 OPS ENTERPRISE REPORT | Page 8

4. Corporate Indices
4.1 Productive Capacity Index
The Productive Capacity Index reports on employees’ perceptions of their ability to effectivelyprovide service and discharge their duties. The OPS 2009 and 2011 scores are provided for
OPS 2011
OPS 2009
61.99
64 66
comparison. Please note that 2011 is the first time these Corporate Indices are being reported. The2009 Corporate Index scores shown here have been calculated retroactively in order to providerelative guidance.
OPS 2009 64.66
4.1.1 Productive Capacity Index (PCI) ResultsThe OPS PCI is the second lowest scoring Corporate Index (see page 4) behind Talent Capacity andWorkplace Culture. It has declined by 2.67 index points since 2009. This decline is consistent with thedirection of change in the three other Corporate Indices. It is also comparable with the magnitude ofchange in the Leadership Index (2.71 index point decline). It has, however, declined more sharply thanchange in the Leadership Index (2.71 index point decline). It has, however, declined more sharply thanthe Workplace Culture and Talent Capacity Indices which declined by .87 and 2.09 index points,respectively.
4.1.2 Priorities for ImprovementThe five themes comprising the Productive Capacity Index are positioned below on a Priority Matrixreflecting their survey scores and relative influence on employee engagement. Based on the OPSsurvey results, Job Fit was identified statistically as the top priority in this Index to improve employeeengagement.
While focusing on Job Fit as the top enterprise priority in this Index, it will be important to not losesight of other low scoring themes from a potential action planning perspective. Performance Barriers,in particular, has a sharply negative performance score and presents significant opportunities forimprovement.
Higher Score
LOW PRIORITY
Job Fit
Quality of
Service
Support & Tools
LowerScore HIGH PRIORITY
Orientation/On‐
Boarding
Performance
Barriers
Support & Tools
© Queen’s Printer for Ontario, 20112011 OPS ENTERPRISE REPORT | Page 9
Number of respondents = 40,625
Score HIGH PRIORITY
HigherLower Influence on Engagement
+ A low score in the Performance Barriers theme represents a positive outcome. Accordingly, the response scale for this theme has been reversed to position it appropriately in the graphic above
* The 2011 Index includes four extra questions that were not asked in 2009

4. Corporate Indices
Orientation/On‐Boarding is positioned about midway between Performance Barriers and Job Fit interms of strength of influence on employee engagement. It too may justify consideration from anaction planning perspective as it reflects relatively low performance and moderate influence onemployee engagementemployee engagement.
Quality of Service is the highest scoring theme and most influential on employee engagement in thisIndex. From a potential action planning perspective, it is important to determine whether actions maybe called for to “maintain” or even further enhance the relative strength of this theme in the OPS.Given the interconnected nature of Job Fit and Quality of Service identified in OPS studies, Job Fit canalso have a positive cross‐impact on this theme.
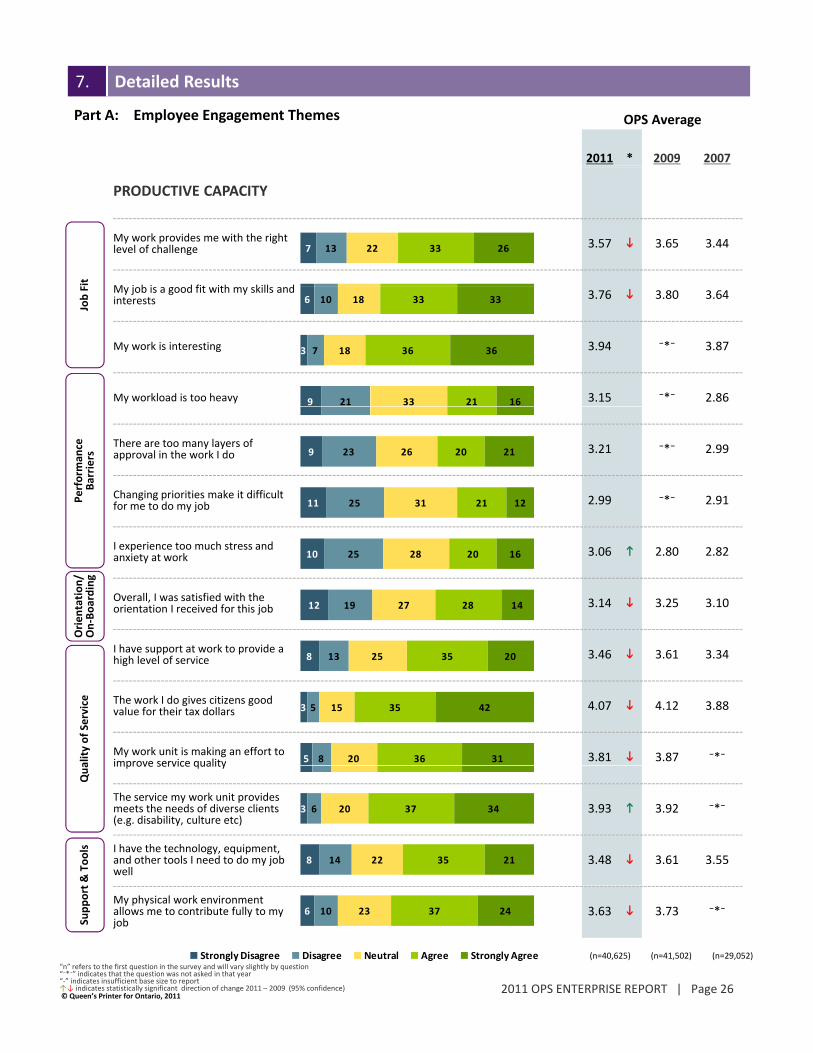
Looking more closely at the questions that comprise Job Fit (see chart below) helps identifyopportunities to strengthen the PCI within the OPS. Of the individual survey questions comprising thistheme, “My work is interesting” is the highest scoring item with 72% of OPS employeesagreeing/strongly agreeing. While not asked in 2009, the average for this question increased by .07compared to 2007. A majority of OPS employees are also positive about the two other questions inthis theme: “My job is a good fit with my skills and interests“ (66% agree/strongly agree); and, “Mywork provides me with the right level of challenge” (59% agree/strongly agree).
Still, trends show that the average scores on these questions declined significantly since 2009,although remaining higher than in 2007.
Job FitOPS Average*
2011 2009 2007
My work provides me with h i h l l f h ll 3 57 3 65 3 44the right level of challenge 3.57 3.65 3.44
My job is a good fit with my skills and interests 3.76 3.80 3.64
7
6
13
10
22
18
33
33
26
33
My work is interesting 3.94 ‐ 3.873 7 18 36 36
© Queen’s Printer for Ontario, 20112011 OPS ENTERPRISE REPORT | Page 10
* Average of responses based on a 5‐point agreement scale
Strongly Disagree Disagree Neutral Agree Strongly Agree (n=40,625)(n=41,502)(n=29,052)
“n” refers to the first question in the survey and will vary slightly by question“⁻*⁻” indicates that the question was not asked in that year“‐” indicates insufficient base size to report↑↓ indicates statistically significant direction of change 2011 – 2009 (95% confidence)

4. Corporate Indices
4.2 Workplace Culture Index
The Workplace Culture Index reports on employees’ perceptions of the physical, social andorganizational environment in which they work. The OPS 2009 and 2011 scores are provided for
i Pl h 2011 i h fi i h C I di b i d Th
OPS 2011
OPS 2009
63.80
64.67
comparison. Please note that 2011 is the first time these Corporate Indices are being reported. The2009 Corporate Index scores shown here have been calculated retroactively in order to providerelative guidance.
4.2.1 Workplace Culture Index (WCI) ResultsThe OPS WCI is the second highest scoring Corporate Index, behind Talent Capacity (see page 4). Ithas declined slightly by .87 index points since 2009 which is consistent with the direction of change inthe three other Corporate Indices), but not nearly as great in magnitude of change. The Leadership,Productive Capacity, and Talent Capacity Indices declined by 2.71, 2.67 and 2.09 index points,respectively.
4.2.2 Priorities for ImprovementThe seven themes comprising the WCI are positioned below on a priority matrix. Recognition wasidentified as the top priority for the OPS in the Workplace Culture Index. It is the lowest scoringtheme in this Index. Independence & Innovation is a “borderline” high priority but has strongerinfluence on engagement than Recognition. Hence, it is also important to not lose sight of its relativei t d t iti f i timportance and opportunities for improvement.
Inclusive Practices and Work‐Life Balance are less influential than the two aforementioned themesbut score at comparable levels. Consequently, while Recognition is the top enterprise priority in thisIndex, followed by Independence & Innovation, these two themes also offer opportunities forimprovement that can positively affect employee engagement.
Higher Score
LOW PRIORITY
Co‐Worker
Relationships
Safe & Healthy
Workplace
Workplace
Morale
L
Inclusive
Practices
Independence &
Innovation
Recognition
Workplace
Work‐Life
Balance
© Queen’s Printer for Ontario, 20112011 OPS ENTERPRISE REPORT | Page 11
Number of respondents = 40,625
LowerScore HIGH PRIORITY
HigherLower Influence on Engagement
* The 2011 Index includes seven extra questions that were not asked in 2009
4. Corporate Indices
Co‐Worker Relationships has the highest performance score within this Index but the least influenceon employee engagement. Safe and Healthy Workplace has greater influence on engagement but alower performance score While clearly lower priorities actions may be warranted to maintain and/orlower performance score. While clearly lower priorities, actions may be warranted to maintain and/orenhance their relative strength.
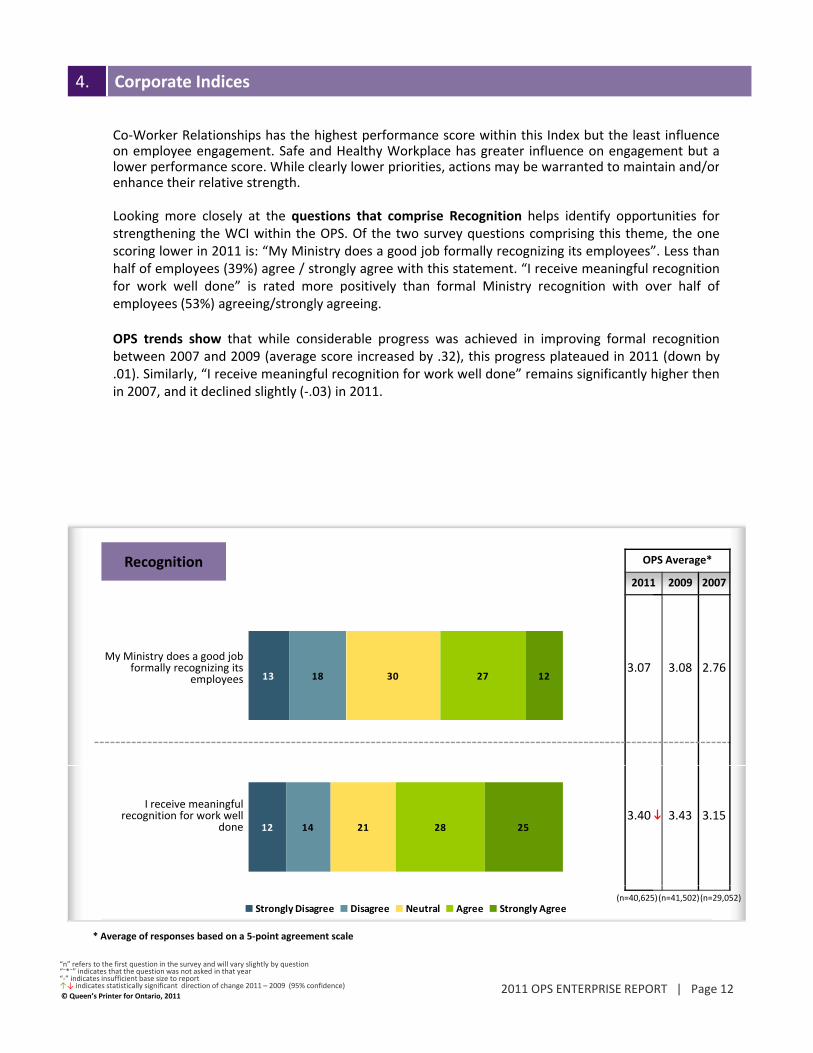
Looking more closely at the questions that comprise Recognition helps identify opportunities forstrengthening the WCI within the OPS. Of the two survey questions comprising this theme, the onescoring lower in 2011 is: “My Ministry does a good job formally recognizing its employees”. Less thanhalf of employees (39%) agree / strongly agree with this statement. “I receive meaningful recognitionfor work well done” is rated more positively than formal Ministry recognition with over half offor work well done is rated more positively than formal Ministry recognition with over half ofemployees (53%) agreeing/strongly agreeing.
OPS trends show that while considerable progress was achieved in improving formal recognitionbetween 2007 and 2009 (average score increased by .32), this progress plateaued in 2011 (down by.01). Similarly, “I receive meaningful recognition for work well done” remains significantly higher thenin 2007, and it declined slightly (‐.03) in 2011.
OPS Average*
2011 2009 2007
Recognition
My Ministry does a good job formally recognizing its
employees 3.07 3.08 2.76
13 18 30 27 12
I receive meaningful recognition for work well
done3.40 3.43 3.15
12 14 21 28 25
© Queen’s Printer for Ontario, 20112011 OPS ENTERPRISE REPORT | Page 12
* Average of responses based on a 5‐point agreement scale
Strongly Disagree Disagree Neutral Agree Strongly Agree(n=40,625)(n=41,502)(n=29,052)
“n” refers to the first question in the survey and will vary slightly by question“⁻*⁻” indicates that the question was not asked in that year“‐” indicates insufficient base size to report↑↓ indicates statistically significant direction of change 2011 – 2009 (95% confidence)

4. Corporate Indices
4.3 Talent Capacity Index
The Talent Capacity Index reports on employees’ perceptions of the OPS’ ability to attract, developand optimize its human resources. The OPS 2009 and 2011 scores are provided for comparison.
OPS 2011
OPS 2009
64.09
66.18
Please note that 2011 is the first time these Corporate Indices are being reported. The 2009Corporate Index scores shown here have been calculated retroactively in order to provide relativeguidance.
OPS 2009
4.3.1 Talent Capacity Index (TCI) ResultsThe OPS TCI is the strongest of the four corporate indices (see page 4). It has declined by 2.09 indexpoints since 2009 which is consistent with the direction of change of the three other CorporateIndices. It is sharper in magnitude of decline than the Workplace Culture Index (which declined by .87index points) but not as sharp as the Leadership and Productive Capacity Indices declines of 2.71 and2.67 index points, respectively.
4.3.2 Priorities for ImprovementOf the three themes comprising the TCI, Career Advancement was identified as the top enterprisepriority in this Index. Research across organizations has shown that perceptions of careeradvancement and learning and development are strongly correlated with employee engagement.
While focusing on Career Advancement as the top priority in this Index it is important to not loseWhile focusing on Career Advancement as the top priority in this Index, it is important to not losesight of the Learning and Development theme as it is a close second in priority and has slightly greaterinfluence on engagement. Actions aimed at addressing Career Advancement can also have a positivecross‐impact on Learning and Development and vice versa.
Higher Score
LOW PRIORITY
Commitment to
Public Service
Lower
Career
Advancement
Learning &
Development
© Queen’s Printer for Ontario, 20112011 OPS ENTERPRISE REPORT | Page 13
Number of respondents = 40,625
LowerScore HIGH PRIORITY
HigherLower Influence on Engagement
* The 2011 Index includes the same questions as asked in 2009
4. Corporate Indices
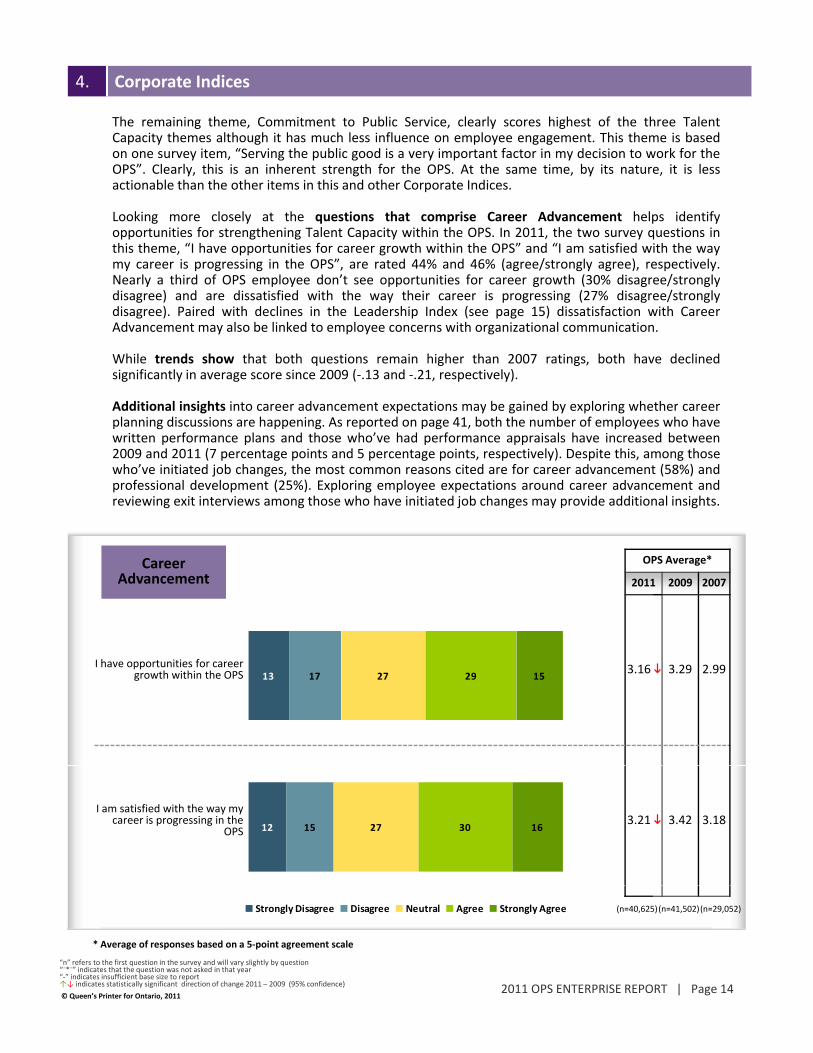
The remaining theme, Commitment to Public Service, clearly scores highest of the three TalentCapacity themes although it has much less influence on employee engagement. This theme is basedon one survey item, “Serving the public good is a very important factor in my decision to work for theOPS” Clearly this is an inherent strength for the OPS At the same time by its nature it is lessOPS”. Clearly, this is an inherent strength for the OPS. At the same time, by its nature, it is lessactionable than the other items in this and other Corporate Indices.
Looking more closely at the questions that comprise Career Advancement helps identifyopportunities for strengthening Talent Capacity within the OPS. In 2011, the two survey questions inthis theme, “I have opportunities for career growth within the OPS” and “I am satisfied with the waymy career is progressing in the OPS”, are rated 44% and 46% (agree/strongly agree), respectively.Nearly a third of OPS employee don’t see opportunities for career growth (30% disagree/stronglyy p y pp g g g ydisagree) and are dissatisfied with the way their career is progressing (27% disagree/stronglydisagree). Paired with declines in the Leadership Index (see page 15) dissatisfaction with CareerAdvancement may also be linked to employee concerns with organizational communication.
While trends show that both questions remain higher than 2007 ratings, both have declinedsignificantly in average score since 2009 (‐.13 and ‐.21, respectively).
Additional insights into career advancement expectations may be gained by exploring whether careerAdditional insights into career advancement expectations may be gained by exploring whether careerplanning discussions are happening. As reported on page 41, both the number of employees who havewritten performance plans and those who’ve had performance appraisals have increased between2009 and 2011 (7 percentage points and 5 percentage points, respectively). Despite this, among thosewho’ve initiated job changes, the most common reasons cited are for career advancement (58%) andprofessional development (25%). Exploring employee expectations around career advancement andreviewing exit interviews among those who have initiated job changes may provide additional insights.
OPS Average*
2011 2009 2007
Career Advancement
I have opportunities for career growth within the OPS 3.16 3.29 2.99
13 17 27 29 15
I am satisfied with the way my career is progressing in the
OPS 3.21 3.42 3.18
12 15 27 30 16
© Queen’s Printer for Ontario, 20112011 OPS ENTERPRISE REPORT | Page 14
* Average of responses based on a 5‐point agreement scale
Strongly Disagree Disagree Neutral Agree Strongly Agree (n=40,625)(n=41,502)(n=29,052)
“n” refers to the first question in the survey and will vary slightly by question“⁻*⁻” indicates that the question was not asked in that year“‐” indicates insufficient base size to report↑↓ indicates statistically significant direction of change 2011 – 2009 (95% confidence)

4. Corporate Indices
4.4 Leadership Index
The Leadership Index reports on employees’ perceptions of the quality of leadership and supervisionthey receive. The OPS 2009 and 2011 scores are provided for comparison. Please note that 2011 is
OPS 2011
OPS 2009
60.79
63.50
the first time these Corporate Indices are being reported. The 2009 Corporate Index scores shownhere have been calculated retroactively in order to provide relative guidance.
4.4.1 Leadership Index (LI) ResultsThe OPS LI is the lowest scoring of the four Corporate Indices. It has declined by 2.71 index pointssince 2009 which is consistent with the direction of change of the three other Corporate Indices (seepage 4). It is about the same magnitude of change as the Productive Capacity Index’s 2.67 index pointdecline, sharper than Talent Capacity’s 2.09 index point decline, and much sharper than WorkplaceCulture’s .87 index point decline.
4.4.2 Priorities for ImprovementThe four themes comprising the LI are positioned below on a priority matrix. Leadership Practiceswas identified as the top priority for this Index. Of the four themes in this Index, it has the greatestinfluence on employee engagement. Leadership has also been shown through research acrossorganizations to be strongly related to organizational performance.
While focusing on Leadership Practices as the top priority in this Index, it is important to not lose sightof Organizational Communication as it also is a clear opportunity for improvement and a close secondin priority within this Index. Actions aimed at addressing Leadership Practices can also have a positivecross‐impact on Organizational Communication and vice versa.
Higher Score
LOW PRIORITY
Clear
Expectations &
Direction
Direct
Supervision
Lower
Leadership
Practices
Organizational
Communication
© Queen’s Printer for Ontario, 20112011 OPS ENTERPRISE REPORT | Page 15
Number of respondents = 40,625
LowerScore HIGH PRIORITY
HigherLower Influence on Engagement
* The 2011 Index includes one extra question that was not asked in 2009

4. Corporate Indices
Clear Expectations & Direction is a clear strength for the OPS, having the highest theme score in thisIndex and strong influence on engagement. Clarity of direction is linked strongly to leadershipeffectiveness and has been shown through research across organizations to be one of the mosteffectiveness and has been shown through research across organizations to be one of the mostimportant attributes of high performing organizations.
Direct Supervision is a “borderline” enterprise strength for the OPS. Quality of supervision has beenfound through organizational research to strongly influence employee motivation and performanceand also foster positive employee relations. Hence, attention should be given to potential actions formoving this key theme from its current borderline position to a clear enterprise strength for the OPS.
Looking more closely at the questions that comprise Leadership Practices helps identify opportunitiesfor strengthening the LI within the OPS. Of the five survey questions comprising this theme, the tworated lowest in 2011 are: “Senior leaders in my Ministry make timely decisions” and “Senior leaders inmy Ministry provide clear direction” (40% and 38% agree/strongly agree, respectively).
Although trends show that considerable progress was achieved on both questions between 2007 and2009 (average scores increased by .31 and .32, respectively), results have slipped significantly in 2011(average scores decreased by .14 and .10, respectively). All of the other items in Leadership Practices(average scores decreased by .14 and .10, respectively). All of the other items in Leadership Practicesshow similar trends over time, with results declining significantly since 2009 but remaining higher thanin 2007. The question having the greatest decline by far since 2009, by far, is “My Ministry is on theright track in its planning for the future” (‐.26). “I have confidence in the senior leaders of myMinistry” and “Senior leaders in my Ministry make timely decisions” have declined the least since2009, although the decline is still statistically significant.
8 15 30 34 14
Leadership Practices
OPSMinistry Average*
2011 2009 2007
I have confidence in the senior leaders of my Ministry
3.23 3.34 3.05
9
10
18
16
34
29
29
31
11
14
Senior leaders in my Ministry make timely decisions
3.01 3.15 2.84
Senior leaders of my Ministry are genuinely interested in the
well‐being of employees 3.12 3.21 2.86
11
6
18
14
34
37
28
31
10
12
g p y
Senior leaders in my Ministry provide clear direction
3.05 3.15 2.83
My Ministry is on the right track in its planning for the
future3.14 3.40 3.06
© Queen’s Printer for Ontario, 20112011 OPS ENTERPRISE REPORT | Page 16
* Average of responses based on a 5‐point agreement scale
(n=41502)(n=29052)Strongly Disagree Disagree Neutral Agree Strongly Agree (n=40625)
future
“n” refers to the first question in the survey and will vary slightly by question“⁻*⁻” indicates that the question was not asked in that year“‐” indicates insufficient base size to report↑↓ indicates statistically significant direction of change 2011 – 2009 (95% confidence)

5. Response Rates
OPS Response Rate Trend
100 OPS Highest Ministry Lowest Ministry
58.963.5
70.3
91.3 91.5
40 540
50
60
70
80
90
43.5
24.5
34.440.5
20
30
40
0
10
2007 2009 2011
2011 2009 2007OPSAboriginal Affairs 82.0% 78.8% 49.3%Agriculture, Food and Rural Affairs 82.9% 77.0% 64.5%Attorney General 56.2% 57.4% 50.7%Cabinet Office 86.5% 81.1% 58.7%Children and Youth Services 74.1% 64.5% 37.6%Citizenship and Immigration 79.4% 87.4% 70.3%Community and Social Services 73.3% 72.7% 44.9%Community Safety and Correctional Services 40.5% 34.4% 24.5%Consumer Services 78.4% 78.0% n/aEconomic Development and Trade 83.5% 84.5% 56.3%Education 70.7% 65.8% 37.1%Energy 69.8% n/a n/aEnvironment 77 5% 79 2% 63 8%Environment 77.5% 79.2% 63.8%Finance 78.2% 74.8% 54.0%Government Services 80.7% 91.1% n/aHealth and Long‐Term Care 62.3% 70.9% 42.2%Health Promotion and Sport 91.5% 85.1% 58.1%Information and Information Technology 77.3% 84.3% 61.2%Infrastructure 84.7% n/a n/aLabour 72.3% 71.6% 55.0%7 .3% 71.6% 55.0%Landlord and Tenant Board 74.6% 77.2% NAMunicipal Affairs and Housing 85.8% 84.7% 61.3%Natural Resources 62.8% 45.1% 38.7%Northern Development, Mines and Forestry 81.3% 61.4% 54.9%Office of Francophone Affairs ‐ ‐ ‐Ontario Clean Water Agency 64.2% 57.0% 35.9%Research and Innovation 84.7% 91.3% 40.4%
© Queen’s Printer for Ontario, 20112011 OPS ENTERPRISE REPORT | Page 17
Revenue 72.7% 74.8% n/aServiceOntario 90.2% 79.0% NATourism and Culture 75.3% n/a n/aTraining, Colleges and Universities 76.3% 75.1% 54.8%Transportation 62.9% 68.5% 52.1%

The first step in action planning is communicating the survey results to all employees. This supportsan open and transparent working environment. Communicating through multiple channels and on
6. Acting on the Results
6.1 Communicating and Acting on Results
p p g g g pmore than one occasion is encouraged. In‐person discussion with staff should be the primary meansof communication for ministry leaders and managers. This can be supplemented by websites,OPSpedia and email.
Prior Survey Results Communicated
EE Index
2011* 2009
83%
17%
(n=32,309) (n=29,644)
Yes 70.83 73.79
No 64.96 69.27
While ministries often implement innovative employee engagement initiatives with positive impacts,our findings suggest that many employees are unaware of what actions, initiatives and programs havebeen implemented. It is important to make employees aware when initiatives are planned andimplemented, that these initiatives are in response to the priorities they have expressed through theEmployee Survey. This should be done in an ongoing fashion throughout the two year EmployeeSurvey cycle
( , ) ( , )
Awareness of Action Taken by OPS
Survey cycle.
EE Index
2011* 2009
55%
45%
2011* 2009
Yes 74.34 77.10
No 63.03 67.95
© Queen’s Printer for Ontario, 20112011 OPS ENTERPRISE REPORT | Page 18
(n=28,647) (n=25,792)
“n” refers to the first question in the survey and will vary slightly by question“⁻*⁻” indicates that the question was not asked in that year“‐” indicates insufficient base size to report↑↓ indicates statistically significant direction of change 2011 – 2009 (95% confidence)
6. Acting on the Results
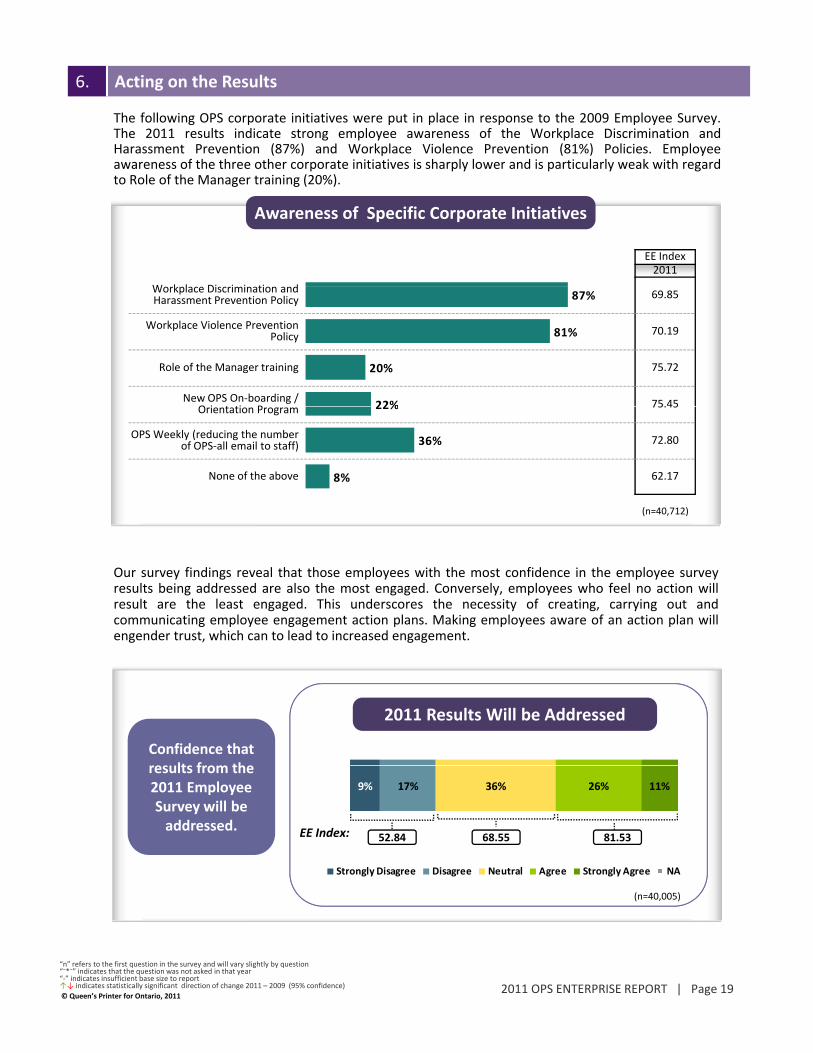
The following OPS corporate initiatives were put in place in response to the 2009 Employee Survey.The 2011 results indicate strong employee awareness of the Workplace Discrimination andHarassment Prevention (87%) and Workplace Violence Prevention (81%) Policies. Employeeawareness of the three other corporate initiatives is sharply lower and is particularly weak with regard
Awareness of Specific Corporate Initiatives
EE Index2011
Workplace Discrimination and
awareness of the three other corporate initiatives is sharply lower and is particularly weak with regardto Role of the Manager training (20%).
87%
81%
20%
22%
Workplace Discrimination and Harassment Prevention Policy 69.85
Workplace Violence Prevention Policy 70.19
Role of the Manager training 75.72
New OPS On‐boarding / O i t ti P 75.45
(n=40,712)
22%
36%
8%
Orientation Program 75.45
OPS Weekly (reducing the number of OPS‐all email to staff) 72.80
None of the above 62.17
Our survey findings reveal that those employees with the most confidence in the employee surveyresults being addressed are also the most engaged. Conversely, employees who feel no action willresult are the least engaged. This underscores the necessity of creating, carrying out andcommunicating employee engagement action plans. Making employees aware of an action plan willengender trust, which can to lead to increased engagement.
Confidence that results from the
2011 Results Will be Addressed
results from the 2011 Employee Survey will be addressed.
Strongly Disagree Disagree Neutral Agree Strongly Agree NA
9% 17% 36% 26% 11%
EE Index: 52.84 68.55 81.53
© Queen’s Printer for Ontario, 20112011 OPS ENTERPRISE REPORT | Page 19
(n=40,005)
“n” refers to the first question in the survey and will vary slightly by question“⁻*⁻” indicates that the question was not asked in that year“‐” indicates insufficient base size to report↑↓ indicates statistically significant direction of change 2011 – 2009 (95% confidence)

6. Acting on the Results
6.2 Getting More Insight
The following eleven techniques can be utilized to add depth and greater insight to the survey resultsat the ministry division and work unit levelsat the ministry, division and work unit levels.
Compare your 2011 EmployeeEngagement Index score to yourprevious 2009 score to assess thedirection and magnitude of change.
1. Review your scores over time
65.97
72.4775.83
80.00
90.0085.00
60.0060
70
80
90
100 OPS Highest Ministry Lowest Ministry
65.97
72.4775.83
80.00
90.0085.00
60.0060
70
80
90
100 OPS Highest Ministry Lowest Ministry
Identify trends over time that maysignal the need for action.
2. Benchmark your Employee Engagement Index scores against others in the OPS
Use the OPS and other Ministry Employee Engagement Index scores as benchmarks for howyour organization is doing. Significant gaps indicate the need for action. The Enterprise report
45.0050.00
40
50
0
10
2007 2009 2010
45.0050.00
40
50
0
10
2007 2009 2010
Employee Engagement Indicators (%)
OPS Average*
200720092011
OPS Average*
200720092011
y g g g g p p pallows you to see how you’re doing compared to other Ministries. The Ministry Reportprovides a similar comparison for divisions. Look for “best‐in‐class” performances andencourage divisions to share their successes with you.
3. Drill down into the nine employee engagement key indicator questions
The nine Employee EngagementIndex question scores are “outcome”
I am satisfied with my job
I am satisfied with my ministry
Overall, I am satisfied in my work as an OPS employee
I am proud to tell people I work for the OPS
I am proud to work for my ministry
I would prefer to stay with the OPS, even if offered a similar job
elsewhere
I am satisfied with my job
I am satisfied with my ministry
Overall, I am satisfied in my work as an OPS employee
I am proud to tell people I work for the OPS
I am proud to work for my ministry
I would prefer to stay with the OPS, even if offered a similar job
elsewhere
2
2
7
8
7
9
2
1
7
8
7
9
3
4
7
8
7
9
40
57
33
32
36
32
53
36
39
35
38
34
3.77 3.58 3.50
3.54 3.23 3.17
3.82 3.56 3.51
3.86 3.58 3.49
4.00 3.77 3.71
3.87 3.60 3.54
3.77 3.58 3.50
3.54 3.23 3.17
3.82 3.56 3.51
3.86 3.58 3.49
4.00 3.77 3.71
3.87 3.60 3.54
measures of the OPS EmployeeEngagement Model (see Appendix).Review the Employee EngagementIndex question scores to understandwhich aspects of employeeengagement need attention: workenvironment, organizational cultureor commitment I am inspired to give my very best
I would recommend the OPS as a great place to work
I strive to improve my ministry’s results
I am inspired to give my very best
I would recommend the OPS as a great place to work
I strive to improve my ministry’s results
8
11
8
8
11
8
8
11
8
39
38
40
28
19
27
Strongly Disagree Disagree Neutral Agree Strongly Agree (n=xx,xxx) (n=xx,xxx)
3.98 3.76 3.71
3.85 3.50 3.38
4.24 4.04 3.99
3.98 3.76 3.71
3.85 3.50 3.38
4.24 4.04 3.99
(n=xx,xxx)
Higher LOW PRIORITY
or commitment.
4. Use the four Corporate Indices to ensure that you’re covering all priority areas
This report identifies themes withineach Corporate Index that are
Quality of
Service
ProvidedJob Fit
Support & Tools
Orientation/
O B di
Performance
Barriers
Scoreeach Corporate Index that arepriorities for action for yourorganization. These themes shouldbecome key focal points for youraction planning. Covering themesfrom each of the four corporatepriority areas creates a holisticimpact on employee engagement in
© Queen’s Printer for Ontario, 20112011 OPS ENTERPRISE REPORT | Page 20
Number of respondents = 4591
On‐Boarding
LowerScore HIGH PRIORITY
HigherLower Influence on Engagement
your organization. While themes aregrouped under individual CorporateIndices, many themes cross over andinfluence one another.

6. Acting on the Results
5. Benchmark Corporate Indices against OPS/Ministry and Division scores
The Corporate Indices provide a second layer of analysis to the Employee Engagement Index.First study the relationship among the priority themes that surface and look for how they maybe linked. Then, as with the Employee Engagement Index, look at how your organization isdoing relative to the OPS overall and other Ministries. Share your “best in class” results andlook to other ministries/divisions to get ideas in areas where they are “best in class”.
6. Drill down into the question banks under the priority themes
For each priority theme you can drill down to review your performance on each questionunder the theme. Those questions with the weakest performance are likely the key levers toimprove engagementimprove engagement.
7. Look for significant downward shifts in question scores
Significant shifts in question scoressince the 2009 survey can signal anissue needing attention. This mayhave a link to priority issues alreadyidentified, or be unique issues intheir own right.
8. Link client satisfaction and other data outside of the Employee Surveyp y y
The Employee Survey data in this report provides you with the employee perspective. Anotherside of the equation is the client perspective. Relate your Employee Engagement Index scoresto your client satisfaction survey data (if available). According to the Public Sector ServiceValue Chain, employee engagement and customer satisfaction strongly influence each other.Analyzing how these two sets of data relate can provide useful information for improvementswithin your organization (see Appendix for more details on this linkage).
© Queen’s Printer for Ontario, 20112011 OPS ENTERPRISE REPORT | Page 21
6. Acting on the Results
Relate priority themes to other key survey data
There are three sets of additional data provided in this report that can be used to gain further insight .These sets of data can also be analyzed using the Archway online tool (see 6.4 Resources).
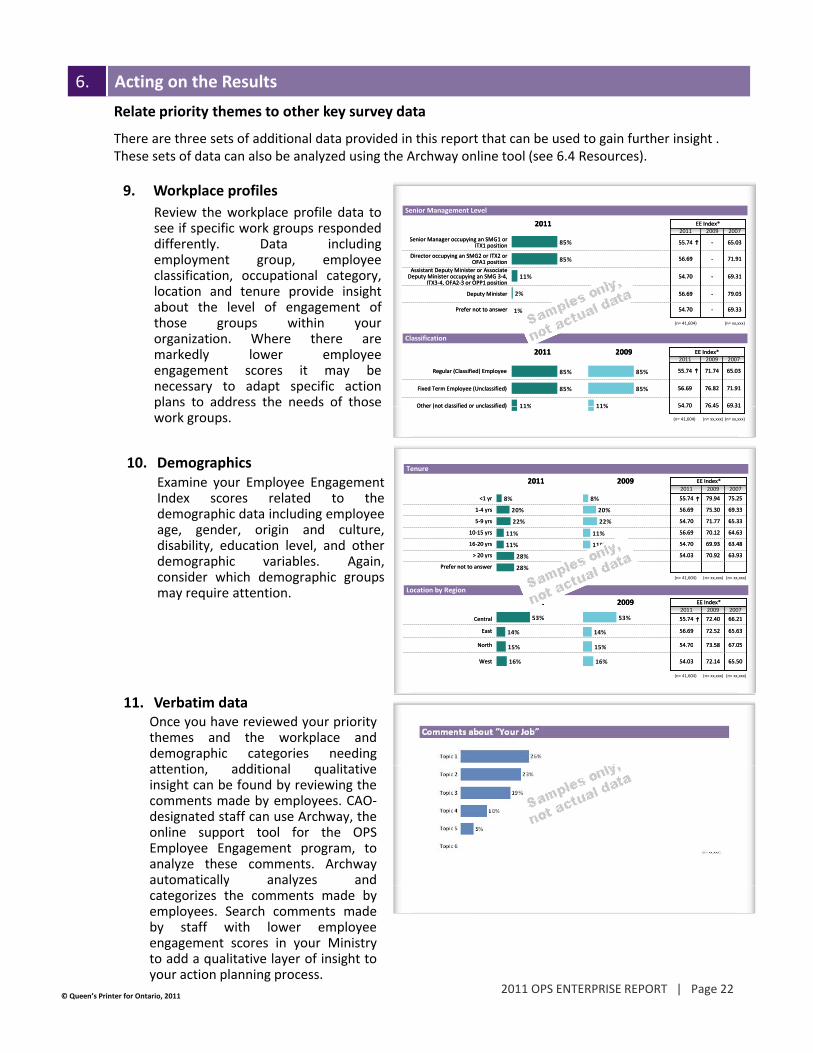
Review the workplace profile data tosee if specific work groups respondeddifferently. Data includingemployment group, employeeclassification, occupational category,l i d id i i h
9. Workplace profiles
EE Index*2011
69.31
71.91
65.03
200720092011
‐
‐
‐
54.70
56.69
55.74Senior Manager occupying an SMG1 or
ITX1 position
Director occupying an SMG2 or ITX2 or OFA1 position
Assistant Deputy Minister or Associate Deputy Minister occupying an SMG 3‐4,
ITX3‐4, OFA2‐3 or OPP1 position
EE Index*2011
69.31
71.91
65.03
200720092011
‐
‐
‐
54.70
56.69
55.74Senior Manager occupying an SMG1 or
ITX1 position
Director occupying an SMG2 or ITX2 or OFA1 position
Assistant Deputy Minister or Associate Deputy Minister occupying an SMG 3‐4,
ITX3‐4, OFA2‐3 or OPP1 position
85%
85%
11%
Senior Management Level
location and tenure provide insightabout the level of engagement ofthose groups within yourorganization. Where there aremarkedly lower employeeengagement scores it may benecessary to adapt specific actionplans to address the needs of those
79.03‐56.69Deputy Minister
69.33‐54.70Prefer not to answer
79.03‐56.69Deputy Minister
69.33‐54.70Prefer not to answer
(n= 41,604)
2%
1%
(n= xx,xxx)
2009
EE Index*2011
69 31
71.91
65.03
200720092011
76 45
76.82
71.74
54 70
56.69
55.74Regular (Classified) Employee
Fixed Term Employee (Unclassified)
Other (not classified or unclassified)
2009
EE Index*2011
69 31
71.91
65.03
200720092011
76 45
76.82
71.74
54 70
56.69
55.74Regular (Classified) Employee
Fixed Term Employee (Unclassified)
Other (not classified or unclassified)
85%
85%
11%
85%
85%
11%
Classification
10. DemographicsExamine your Employee EngagementIndex scores related to thedemographic data including employee
d i i d lt
pwork groups.
2009
EE Index*2011
65.33
69.33
75.25
200720092011
71.77
75.30
79.94
54.70
56.69
55.74<1 yr
1‐4 yrs
5‐9 yrs
2009
EE Index*2011
65.33
69.33
75.25
200720092011
71.77
75.30
79.94
54.70
56.69
55.74<1 yr
1‐4 yrs
5‐9 yrs
8%
20%
22%
8%
20%
22%
Tenure
(n= 41,604) (n= xx,xxx) (n= xx,xxx)
69.3176.4554.70Other (not classified or unclassified) 69.3176.4554.70Other (not classified or unclassified) 11% 11%
age, gender, origin and culture,disability, education level, and otherdemographic variables. Again,consider which demographic groupsmay require attention.
Prefer not to answer
64.6370.1256.6910‐15 yrs
63.4869.9354.7016‐20 yrs
63.9370.9254.03> 20 yrs
Prefer not to answer
64.6370.1256.6910‐15 yrs
63.4869.9354.7016‐20 yrs
63.9370.9254.03> 20 yrs
2009
67 0573 5854 70North
EE Index*2011
65.63
66.21
200720092011
72.52
72.40
56.69
55.74Central
East
2009
67 0573 5854 70North
EE Index*2011
65.63
66.21
200720092011
72.52
72.40
56.69
55.74Central
East
11%
11%
28%
28%
53%
14%
15%
53%
14%
15%
(n= 41,604) (n= xx,xxx) (n= xx,xxx)
11%
11%
28%
28%
Location by Region
11. Verbatim dataOnce you have reviewed your prioritythemes and the workplace anddemographic categories needingtt ti dditi l lit ti
67.0573.5854.70North
65.5072.1454.03West
67.0573.5854.70North
65.5072.1454.03West
15%
16%
15%
16%
(n= 41,604) (n= xx,xxx) (n= xx,xxx)
attention, additional qualitativeinsight can be found by reviewing thecomments made by employees. CAO‐designated staff can use Archway, theonline support tool for the OPSEmployee Engagement program, toanalyze these comments. Archwayautomatically analyzes and
© Queen’s Printer for Ontario, 20112011 OPS ENTERPRISE REPORT | Page 22
y ycategorizes the comments made byemployees. Search comments madeby staff with lower employeeengagement scores in your Ministryto add a qualitative layer of insight toyour action planning process.

6.3 Action Planning Steps
Building effective employee engagement requires a plan with input from all levels of the organizationincluding senior leaders, managers and staff. Successful plans are specific, measurable, realistic,
6. Acting on the Results
timely and flexible. Plans need to be evaluated, measured and adjusted as needed in a continuousimprovement process.
The OPS Employee Survey Program follows a 2‐year cycle. The steps to address results and implementaction plans (Act) are outlined below.
MMeasure
Conduct Survey
Process and
DesignSurvey
Monitor & Report
Action Results
Employee Survey Program
Cycle
Process and Analyze Data
Report Results
Select &
Plan & Implement Actions
Select &Communicate
ActionsCommunicateResults &Generate Action IdeasAct
Communicate Results and Generate Action Ideas
Leaders and managers can review and discuss results, compare and assess progress and communicatefindings to employees at staff meetings. The report results tell us “what’s happening” but “why it’shappening” is best informed through management‐staff discussions. Management and staff canbrainstorm ideas to identify potential response strategies.
Consider:
Step 1
• Various audiences in your organization and develop appropriate communication strategies
• Developing communications that are regular, multi‐channel, two‐way, clear and candid, strategicand intentional
• Scanning your organization to assess what initiatives are already underway that relate to thepriority areas identified in this report
• Assessing the actions taken in response to the 2009 results and what progress was made
© Queen’s Printer for Ontario, 20112011 OPS ENTERPRISE REPORT | Page 23
• Assessing the actions taken in response to the 2009 results and what progress was made
• Deciding what current initiatives need to be continued, stopped or improved and what newinitiatives need to be started

Select & Communicate Actions
Once your team has interpreted the priority areas for your organization the next step is to defineti d th t i t th i iti t ll t ff L i ti t
6. Acting on the Results
Step 2
actions and then to communicate the priorities to all staff. Leverage existing corporate programswhen they support the priorities identified for your organization. Link in local actions that align withyour initiatives to those happening at the corporate level.
Select actions that:
• Are responsive to the priority areas and send a clear message to employees that their concernsare important and that they have been heard
• Are bold enough to clearly signal a desire to drive organizational change
• Build on but do not duplicate strategies already in place
• Can be implemented quickly and demonstrate results while longer‐term actions are beingplanned
Plan & Implement Actions Step 3Plan & Implement Actions
Leaders and managers can work with staff teams to develop detailed action plans that includemeasurable outcomes. Teams can be identified to implement either the entire action plan or specificinitiatives.
Ensure that:
• Teams develop detailed implementation plans that identify the activities to be undertaken, the
Step 3
Teams develop detailed implementation plans that identify the activities to be undertaken, theresponsibilities, timelines and resources for completion
• Actions include quick wins along with longer‐term initiatives
• Outcomes to be achieved are identified and the performance measures to determine success inmeeting outcomes are clearly understood
• Managers and teams are accountable for initiatives undertaken and that all involved areproperly recognized for their effortsproperly recognized for their efforts
• Initiatives are supported by providing appropriate training when needed
Monitor & Report Results of Actions
Teams can monitor and report on progress and results to senior leaders and managers. It is importantto evaluate, measure and adjust your action plans as needed and continuously communicate progressto all staff throughout the two year employee survey program cycle
Step 4
to all staff throughout the two year employee survey program cycle.
Consider:
• The best practices that may have been uncovered and how these can be continued or adaptedto other initiatives
• How expected organizational changes may impact on your initiatives and how to manage risks toplan completion
© Queen’s Printer for Ontario, 20112011 OPS ENTERPRISE REPORT | Page 24
• A regular schedule for your teams to report results and issues to ADM and management team
• How to maintain the values of transparency, accountability and fairness in all reporting ofemployee engagement actions
6. Acting on the Results
6.4 Resources
A) Archway Online Tool
Access to the Archway On‐Line Tool is restricted to CAO‐designated staff from each Ministry.Access to the Archway On Line Tool is restricted to CAO designated staff from each Ministry. They are required to follow a set of protocols to ensure proper use of the tool and preserve the principle of confidentiality.
The Archway Online Tool provides access to the aggregated responses from the employee surveyquestionnaire. Automated reports for various organizational levels can be created. The Archway
l id d il d i i h d d d l i l l i l l
) d l
tool provides detailed insight needed to develop appropriate local action plans to supplementMinistry action plans.
Customized employee engagement reports can be created down to the unit level providing thatthere are a minimum of 20 respondents. Archway generates reports according to specificthemes, questions and demographic variables. Benchmark data are provided across work unitsfor 3 years (2011, 2009 and 2007). In 2011 Archway will also provide analysis of employeecomments.
B) ADMs Guidelines
These guidelines are intended to help ADMs effectively lead, communicate andact on divisional results from the OPS Employee Survey to improve employeeengagement. The process outlined can be adapted to suit your Division’scircumstances.
C) Guidelines for Managers
This document provides a guide to managers for communicating survey resultsThis document provides a guide to managers for communicating survey resultsand action planning. The process outlined can be adapted to suit your Branchcircumstances.
D) OPS Manager’s Guide to Internal Communications
This guide provides suggestions on how to be more strategic and effective incommunicating with staff including a quick guide to various communicationschannels in the OPS and how to use them A companion document is a referencechannels in the OPS and how to use them. A companion document is a referenceguide on communicating through the online channel.
E) OPS Pulse Survey Tool
This employee survey tool complements the biennial OPS Employee Survey. It canbe used to track progress on improving Employee Engagement in real time or toconduct surveys for defined groups of employees not included in the OPSEmployee survey (e.g. seasonal staff). It is an easy‐to‐use web‐based survey
© Queen’s Printer for Ontario, 20112011 OPS ENTERPRISE REPORT | Page 25
platform that enables any organizational unit to undertake Employee Engagementsurveys at their discretion. Its consistent set of questions aligned with the OPSEmployee Survey.
More information about existing resources and new tools as they are developed can be found on theModernization Division website (see contact information on the back page).
2011 * 2009 2007
7. Detailed Results
Part A: Employee Engagement Themes OPS Average
PRODUCTIVE CAPACITY
My work provides me with the right level of challenge 3.57 3.65 3.44
M j b i d fit ith kill dFit
7 13 22 33 26
My job is a good fit with my skills and interests 3.76 3.80 3.64
My work is interesting 3.94 ⁻*⁻ 3.87
My workload is too heavy 3.15 ⁻*⁻ 2.86
Job F
6
3
9
10
7
21
18
18
33
33
36
21
33
36
16
There are too many layers of approval in the work I do 3.21 ⁻*⁻ 2.99
Changing priorities make it difficult for me to do my job 2.99 ⁻*⁻ 2.91
9
11
23
25
26
31
20
21
21
12Perform
ance
Barriers
I experience too much stress and anxiety at work 3.06 2.80 2.82
Overall, I was satisfied with the orientation I received for this job 3.14 3.25 3.10
I h t t k t id
Orientation/
On‐Boarding
10
12
25
19
28
27
20
28
16
14
I have support at work to provide a high level of service 3.46 3.61 3.34
The work I do gives citizens good value for their tax dollars 4.07 4.12 3.88
My work unit is making an effort to improve service quality 3.81 3.87 ⁻*⁻
ality of Service
8
3
5
13
5
8
25
15
20
35
35
36
20
42
31improve service quality
The service my work unit provides meets the needs of diverse clients (e.g. disability, culture etc)
3.93 3.92 ⁻*⁻
I have the technology, equipment, and other tools I need to do my job well
3.48 3.61 3.55
Qua
& Tools
3
8
6
14
20
22
37
35
34
21
© Queen’s Printer for Ontario, 20112011 OPS ENTERPRISE REPORT | Page 26
My physical work environment allows me to contribute fully to my job
3.63 3.73 ⁻*⁻
Support
Strongly Disagree Disagree Neutral Agree Strongly Agree
6 10 23 37 24
(n=40,625) (n=41,502) (n=29,052)“n” refers to the first question in the survey and will vary slightly by question“⁻*⁻” indicates that the question was not asked in that year“‐” indicates insufficient base size to report↑↓ indicates statistically significant direction of change 2011 – 2009 (95% confidence)

2011 * 2009 2007
7. Detailed Results
Part A: Employee Engagement Themes OPS Average
elationships
WORKPLACE CULTURE
The people I work with are generally good at their jobs 3.92 ⁻*⁻ 3.88
My work group usually completes its assignments in a timely fashion 3.97 ⁻*⁻ 3.80
I have positive relations with my co‐
2
2
6
5
20
18
45
44
28
31
Co‐W
orker R
tices
I have positive relations with my co‐workers 4.28 4.25 4.17
My co‐workers invite me to join them in informal workplace social activities 3.92 ⁻*⁻ ⁻*⁻
The people I work with value my ideas and opinions 3.91 3.72 3.70
In my Ministry the process for selecting a person for a position is fair 2.99 2.87 2.60
1
5
3
16
2
7
5
18
11
17
19
28
39
36
45
26
47
36
29
12
Inclusive
Pract
tion
a person for a position is fair
The OPS hires and promotes people based on their skills, abilities and experience
3.27 3.39 3.13
My Ministry values diversity 3.87 ⁻*⁻ ⁻*⁻
I have the independence I need to make decisions about my daily work 3.77 3.78 3.62
14
3
5
15
6
8
23
23
20
28
36
40
21
32
27
Independence & In
nova I am encouraged to take reasonable risks
in doing my job 3.27 ⁻*⁻ 3.12
Innovation is valued in my work unit. 3.41 3.45 3.18
I feel free to express opinions that diverge from those of management without fear of reprisal
3.31 3.30 3.08
I have opportunities to provide input i t d i i th t ff t k 3.62 3.51 3.32
10
9
12
6
15
14
14
11
28
25
23
22
33
32
31
38
15
20
19
23
Recognition
Safe &
Healthy
Workplace
into decisions that affect my work 3.62 3.51 3.32
My Ministry does a good job formally recognizing its employees 3.07 3.08 2.76
I receive meaningful recognition for work well done 3.40 3.43 3.15
I have a safe and healthy work environment 3.62 3.76 3.52
6
13
12
7
11
18
14
11
22
30
21
22
38
27
28
34
23
12
25
26
Workplace
Morale
H
I am treated respectfully at work 4.02 ⁻*⁻ ⁻*⁻
People in my work unit take pride in their work 3.96 3.94 3.80
The morale in my work unit is good 3.25 ⁻*⁻ ⁻*⁻
I have support at work to balance my 3 50 3 58 3 38
3
3
13
9
5
6
14
12
16
19
25
24
41
38
31
32
36
34
17
23
© Queen’s Printer for Ontario, 20112011 OPS ENTERPRISE REPORT | Page 27
Work‐Life
Balan
ce
I have support at work to balance my work and personal life 3.50 3.58 3.38
I get support for my participation in volunteer activities in my community 3.18 3.44 3.20
9
12
12
15
24
31
32
26
23
16
Strongly Disagree Disagree Neutral Agree Strongly Agree (n=40,625) (n=41,502) (n=29,052)“n” refers to the first question in the survey and will vary slightly by question“⁻*⁻” indicates that the question was not asked in that year“‐” indicates insufficient base size to report↑↓ indicates statistically significant direction of change 2011 – 2009 (95% confidence)

7. Detailed Results
Part A: Employee Engagement Themes
OPS Average
nt
2011 * 2009 2007
TALENT CAPACITY
I have opportunities for career 3 16 3 29 2 99
Career Advanceme 13
12
17
15
27
27
29
30
15
16
I have opportunities for career growth within the OPS 3.16 3.29 2.99
I am satisfied with the way my career is progressing in the OPS 3.21 3.42 3.18
Commitment to
Public Service
2 5 17 34 42Serving the public good is a very important factor in my decision to work for the OPS
4.08 4.11 3.93
evelopment
7
7
12
13
21
30
29
35
31
15
I feel that I am always learning something new in my job 3.66 3.70 3.54
The quality of learning and development I have received is very good
3.38 3.44 3.17
Learning an
d De
9 17 29 31 13The amount of learning and development I have received has met my needs
3.23 3.27 3.01
Strongly Disagree Disagree Neutral Agree Strongly Agree
7 13 26 35 19My Ministry supports my work‐related learning and development 3.47 3.56 3.26
(n=40,625) (n=41,502) (n=29,052)
© Queen’s Printer for Ontario, 20112011 OPS ENTERPRISE REPORT | Page 28
“n” refers to the first question in the survey and will vary slightly by question“⁻*⁻” indicates that the question was not asked in that year“‐” indicates insufficient base size to report↑↓ indicates statistically significant direction of change 2011 – 2009 (95% confidence)

*
7. Detailed Results
Part A: Employee Engagement ThemesOPS Average
2011 * 2009 2007
LEADERSHIP
I clearly understand the mandate and goals of my Ministry 3.85 3.96 3.67
I know how my work contributes to the achievement of my Ministry’s goals 3.88 4.01 3.75
Expectations &
Direction
3
3
6
6
22
21
41
41
28
30
I have a clear understanding of my job and what is expected of me 3.98 ‐ 4.00
The person I report to is an effective leader 3.57 3.68 3.52
The person I report to keeps me informed of things that I need to know 3.65 3.69 3.55
Clear E D
3
10
8
5
11
11
17
20
19
40
31
32
35
28
30
The person I report to consults me on decisions that affect my work 3.62 3.67 3.51
The person I report to gives me constructive feedback on my work 3.56 3.74 3.50
The person I report to makes timely decisions 3.55 3.35 3.08D
irect Supervision
9
10
10
12
12
11
19
20
21
31
30
31
30
28
27
I have a positive working relationship with the person I report to 4.00 4.12 3.99
I am satisfied with the quality of supervision I receive 3.70 3.77 ⁻*⁻
I have confidence in the senior leaders of my Ministry 3.23 3.34 3.05
5
9
10
6
10
16
16
18
30
32
29
31
41
34
13
Senior leaders in my Ministry make timely decisions 3.01 3.15 2.84
Senior leaders of my Ministry are genuinely interested in the well‐being of employees
3.12 3.21 2.86
Senior leaders in my Ministry provide clear direction 3.05 3.15 2.83
Lead
ership Practices
13
13
12
19
17
19
32
29
32
26
28
27
10
13
10
My Ministry is on the right track in its planning for the future 3.14 3.40 3.06
Essential information flows effectively from senior leaders to staff 2.92 3.05 2.74
Essential information flows effectively from staff to senior leaders 2.99 3.15 2.89
nizational
munication
10
14
12
16
21
20
35
32
34
29
25
26
11
8
8
© Queen’s Printer for Ontario, 20112011 OPS ENTERPRISE REPORT | Page 29
There is good communication between my work unit and other units that we are involved with
3.20 3.41 2.99Orga
Comm
9 16 31 32 11
Strongly Disagree Disagree Neutral Agree Strongly Agree (n=40,625) (n=41,502) (n=29,052)“n” refers to the first question in the survey and will vary slightly by question“⁻*⁻” indicates that the question was not asked in that year“‐” indicates insufficient base size to report↑↓ indicates statistically significant direction of change 2011 – 2009 (95% confidence)

2011 2009 2011 2011 2011 2011
Productive Capacity Index
Workplace Culture Index
Talent Capacity Index
LeadershipIndex
7. Detailed Results
Part B: Ministry Scores EE Index*
OPS 69.21 72.47 61.99 63.80 64.09 60.79
Aboriginal Affairs 77.08 71.17 65.99 72.54 74.13 70.02
Agriculture, Food and Rural Affairs 73.88 78.79 65.6 70.11 70.55 64.25
Attorney General 70.85 74.08 63.78 63.44 64.60 62.23
Cabinet Office 71.99 75.17 64.52 69.43 67.04 70.29
Children and Youth Services 69.79 73.71 63.02 64.67 66.16 61.69
Citizenship and Immigration 71.54 72.34 63.8 68.84 68.53 63.92
Community and Social Services 71.69 73.76 61.87 64.96 67.87 63.22Community Safety and Correctional Services 66.59 68.82 61.01 59.29 61.98 58.44
Consumer Services 74.3 72.41 62.28 68.46 68.06 64.92
Economic Development and Trade 68.93 71.16 60.8 63.73 64.41 59.96
Education 73.22 76.44 64.77 67.22 66.70 64.41
Energy 72.89 n/a 61.18 68.66 65.20 65.99
Environment 72.00 75.43 62.21 68.2 67.38 61.02
Finance 70.51 73.42 64.25 66.8 65.34 64.57
Government Services 68.97 73.55 60.01 65.42 63.89 61.62
Health and Long‐Term Care 66.64 70.61 58.92 61.44 62.20 57.41
Health Promotion and Sport 66.11 71.17 57.46 64.35 67.62 57.83Information and Information Technology 69.11 72.8 61.1 65.78 61.50 60.50
Infrastructure 72.18 n/a 60.74 69.08 68.44 68.13
Labour 73.44 76.52 64.54 66.76 67.05 64.29
Landlord and Tenant Board 69.04 75.09 61.43 65.29 62.82 64.34
Municipal Affairs and Housing 71.76 73.66 62.48 68.7 67.57 65.47
Natural Resources 70.5 75.71 62.94 68.27 66.43 60.55
Northern Development, Mines and Forestry 73.18 76.73 65.73 71.42 66.83 66.79y
Office of Francophone Affairs ‐ ‐ ‐ ‐ ‐ ‐
Ontario Clean Water Agency 71.76 72.07 64.2 67.36 69.22 62.68
Research and Innovation 68.47 74.24 60.61 67.02 62.55 61.95
Revenue 66.46 71.85 60.95 62.32 58.65 58.22
ServiceOntario 68.72 74.17 62.94 65.23 63.81 62.30
© Queen’s Printer for Ontario, 20112011 OPS ENTERPRISE REPORT | Page 30
Tourism and Culture 71.21 n/a 62.37 67.68 64.40 61.73
Training, Colleges and Universities 68.1 71.11 59.77 64.44 63.71 59.37
Transportation 70.54 72.47 62.54 65.11 66.00 61.71
“‐” A dash indicates insufficient base size to report* Arrows indicate statistically significant direction of change 2011 – 2009 (95% confidence)

2011 Employee Engagement Index2011 Employee Engagement Index OPS: 69.21OPS: 69.21
7. Detailed Results
Part C: Discrimination
YesNo
p y g gp y g g
EE Index*2011 200957.06 58.3272 71 75 82
2011
17%
9%
2009
14%
11%
I have experienced discrimination in my work unit in the past 2 years
NoPrefer not to answer
72.71 75.8263.20 67.09
74%
(n=41,604)(n=40,712)
EE Index*
75%
33% 29%
Was the issue(s) reported?
YesNoPrefer not to answer
(n=5,389)(n=6,495)
EE Index*2011 200956.10 55.7557.00 59.6958.80 58.26
2011
20%
47%
2009
17%
54%If you have experienced discrimination, please indicate the type of discrimination
14%
5%
5%
8%
16%
6%
6%
2011 2009 EE Index*
2011 2009
Race 52.57 55.74
Marital status 48.08 51.89
Place of origin 51.80 ‐
Family status 49 89 54 178%
11%
4%
12%
4%
8%
6%
14%
5%
22%
11%
Family status 49.89 54.17
Disability (mental or physical) 48.12 51.16
Sexual orientation 52.31 54.41
Sex (incl. pregnancy and gender identity) 52.98 54.90
Ancestry 47.13 ‐
Ethnic Origin 51.49 56.69
1%
8%
3%
15%
1%
10%
5%
18%
Citizenship 43.60 ‐
Colour 51.47 54.70
Creed (religion) 52.02 54.03
Age 53.08 55.64
Record of offences 45.31 ‐
© Queen’s Printer for Ontario, 20112011 OPS ENTERPRISE REPORT | Page 31
29%
29%
39%
11%
Other 58.66 58.50
Prefer not to answer 59.68 61.24
(n=5,389)(n=6,495)
“n” refers to the first question in the survey and will vary slightly by question“⁻*⁻” indicates that the question was not asked in that year“‐” indicates insufficient base size to report↑↓ indicates statistically significant direction of change 2011 – 2009 (95% confidence)

7. Detailed Results
Part C: Discrimination
2011 Employee Engagement Index2011 Employee Engagement Index OPS: 69.21OPS: 69.21
2011 EE Index2011
Co‐workers(s) 57.70
Individual(s) with authority over me 52 33
43%
63%
p y g gp y g g
From whom did you experience workplace discrimination? (New Question in 2011)
Individual(s) with authority over me 52.33
Individual(s) working for me 59.04
Individual(s) for whom I have a custodial responsibility 45.20
Individual(s) from other OPS Ministries or agencies 46.98
Individual(s) from other government department or agencies 47.48
63%
6%
5%
6%
5%
Member(s) of the public (individuals or organizations) 51.03
Other 59.00
Prefer not to answer 65.31
(n=6,495)
9%
7%
9%
50%
48%
24%
25%
17%
17%
6%
6%
4%
4%
2011
2009
52.10 63.34 72.74EE Index
(n=5,424)
(n=4,401)
Overall, the issue(s) was resolved to my satisfaction
48% 25% 17% 6% 4%2009
Strongly Disagree Disagree Neutral Agree Strongly Agree
EE Index 53.38 66.78 73.13
(n 4,401)
© Queen’s Printer for Ontario, 20112011 OPS ENTERPRISE REPORT | Page 32
“n” refers to the first question in the survey and will vary slightly by question“⁻*⁻” indicates that the question was not asked in that year“‐” indicates insufficient base size to report↑↓ indicates statistically significant direction of change 2011 – 2009 (95% confidence)

2011 Employee Engagement Index2011 Employee Engagement Index OPS: 69.21OPS: 69.21
7. Detailed Results
Part C: Harassment (New Questions in 2011)
p y g gp y g g
I have experienced harassment in my work unit in the past 2 years
Was the issue(s) reported?
14%
8% d
47%
13%d
f
2011
8%
77%
EE Index2011
Yes 58.26
No 57.30
Prefer not to answer 57.32
(n=5,499)
f
2011
13%
41%
EE Index2011
Yes 57.75
No 71.96
Prefer not to answer 62.96
(n=40,712)
2011 EE Index2011
Co‐workers(s) 59.2354%
From whom did you experience harassment?
Yes No Prefer not to answer Yes No Prefer not to answer
( )
Individual(s) with authority over me 51.59
Individual(s) working for me 60.89
Individual(s) for whom I have a custodial responsibility 43.63
Individual(s) from other OPS Ministries or agencies 50.79
Individual(s) from other government department or 46 09
54%
52%
6%
5%
3%
Individual(s) from other government department or agencies 46.09
Member(s) of the public (individuals or organizations) 52.13
Other 59.39
Prefer not to answer 62.26
(n=5499)
3%
7%
6%
6%
49% 23% 17% 7% 4%2011 (n=4,853)
Overall, the issue(s) was resolved to my satisfaction
© Queen’s Printer for Ontario, 20112011 OPS ENTERPRISE REPORT | Page 33
Strongly Disagree Disagree Neutral Agree Strongly Agree
52.91 66.43 73.26EE Index
“n” refers to the first question in the survey and will vary slightly by question“⁻*⁻” indicates that the question was not asked in that year“‐” indicates insufficient base size to report↑↓ indicates statistically significant direction of change 2011 – 2009 (95% confidence)

2011 Employee Engagement Index2011 Employee Engagement Index OPS: 69.21OPS: 69.21
7. Detailed Results
Part C: Harassment (New Questions in 2011)
p y g gp y g g
If you have experienced harassment, what was the focus of the harassment ?
7%
4%
2011 EE Index2011
Race 51.74
Marital status 47 974%
3%
6%
8%
3%
8%
Marital status 47.97
Place of origin 51.15
Family status 47.16
Disability (mental or physical) 45.97
Sexual orientation 54.71
Sex (incl. pregnancy and gender identity) 52.52
47%
3%
5%
1%
4%
( p g y g y)
Personal harassment (bullying or psychological harassment) 57.77
Ancestry 51.10
Ethnic Origin 50.75
Citizenship 40.25
Colour 52.23
2%
8%
1%
21%
19%
Creed (religion) 51.76
Age 51.08
Record of offences 39.82
Other 59.09
Prefer not to answer 59.62
2011 EE Index2011
Insulting or derogatory remarks, gestures or actions 56.84
Malicious rumours, gossip or negative innuendo 56.90
62%
46%
(n=5,499)
If you have experienced harassment, what was the nature of the harassment?
Verbal aggression and/or verbal abuse 56.54
Persistent, unwarranted criticism 55.96
Mobbing and/or swarming 51.04
Isolation and/or exclusion from work‐related activities 52.99
Other 55.26
47%
42%
4%
30%
12%
© Queen’s Printer for Ontario, 20112011 OPS ENTERPRISE REPORT | Page 34
Prefer not to answer 62.47
12%
6%(n=5,499)
“n” refers to the first question in the survey and will vary slightly by question“⁻*⁻” indicates that the question was not asked in that year“‐” indicates insufficient base size to report↑↓ indicates statistically significant direction of change 2011 – 2009 (95% confidence)
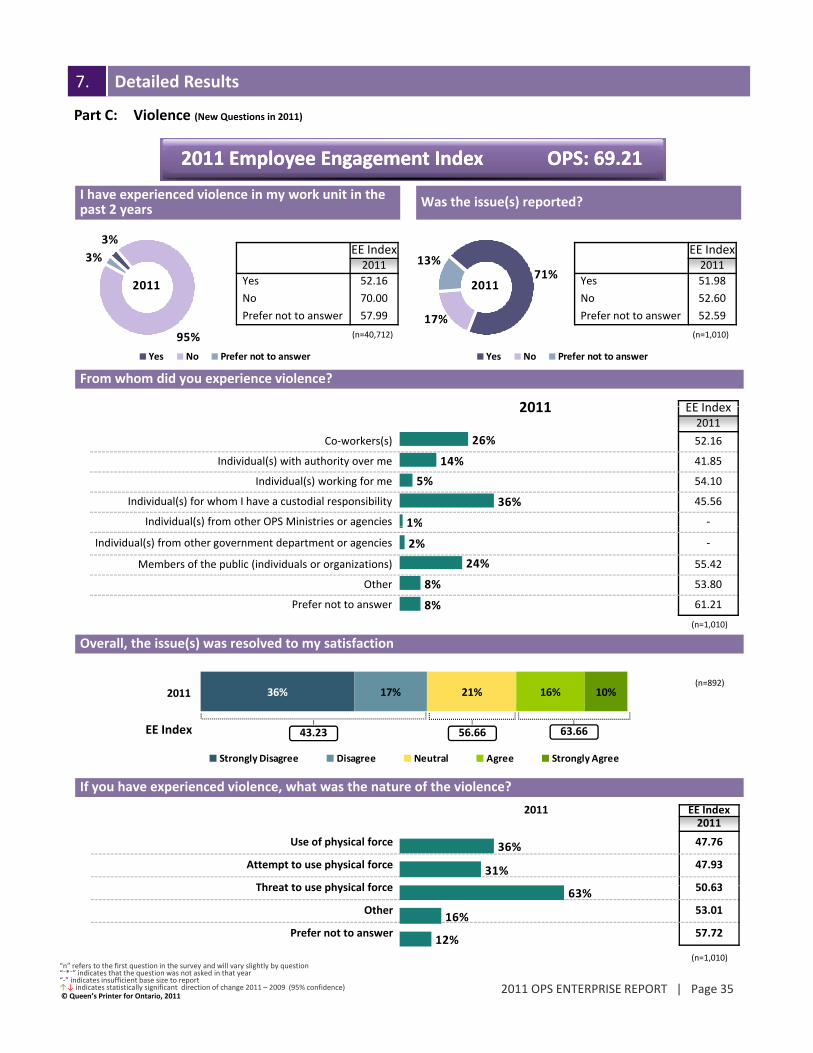
2011 Employee Engagement Index2011 Employee Engagement Index OPS: 69.21OPS: 69.21
7. Detailed Results
Part C: Violence (New Questions in 2011)
p y g gp y g g
I have experienced violence in my work unit in the past 2 years
Was the issue(s) reported?
2011
3%
3%
201171%
13%EE Index2011
Yes 51.98
EE Index2011
Yes 52.16
2011 EE Index
Yes No Prefer not to answer Yes No Prefer not to answer
From whom did you experience violence?
2011
95%
2011
17%
No 52.60
Prefer not to answer 52.59
(n=1,010)
No 70.00
Prefer not to answer 57.99
(n=40,712)
2011 EE Index2011
Co‐workers(s) 52.16
Individual(s) with authority over me 41.85
Individual(s) working for me 54.10
Individual(s) for whom I have a custodial responsibility 45.56
Individual(s) from other OPS Ministries or agencies ‐
26%
14%
5%
36%
1%( ) g
Individual(s) from other government department or agencies ‐
Members of the public (individuals or organizations) 55.42
Other 53.80
Prefer not to answer 61.21
(n=1,010)
1%
2%
24%
8%
8%
Overall, the issue(s) was resolved to my satisfaction
36% 17% 21% 16% 10%2011
Strongly Disagree Disagree Neutral Agree Strongly Agree
43.23 56.66 63.66EE Index
(n=892)
Overall, the issue(s) was resolved to my satisfaction
2011 EE Index2011
Use of physical force 47.76
Attempt to use physical force 47.93
Threat to use physical force 50 63
36%
31%
If you have experienced violence, what was the nature of the violence?
© Queen’s Printer for Ontario, 20112011 OPS ENTERPRISE REPORT | Page 35
Threat to use physical force 50.63
Other 53.01
Prefer not to answer 57.72
63%
16%
12%
(n=1,010)“n” refers to the first question in the survey and will vary slightly by question“⁻*⁻” indicates that the question was not asked in that year“‐” indicates insufficient base size to report↑↓ indicates statistically significant direction of change 2011 – 2009 (95% confidence)
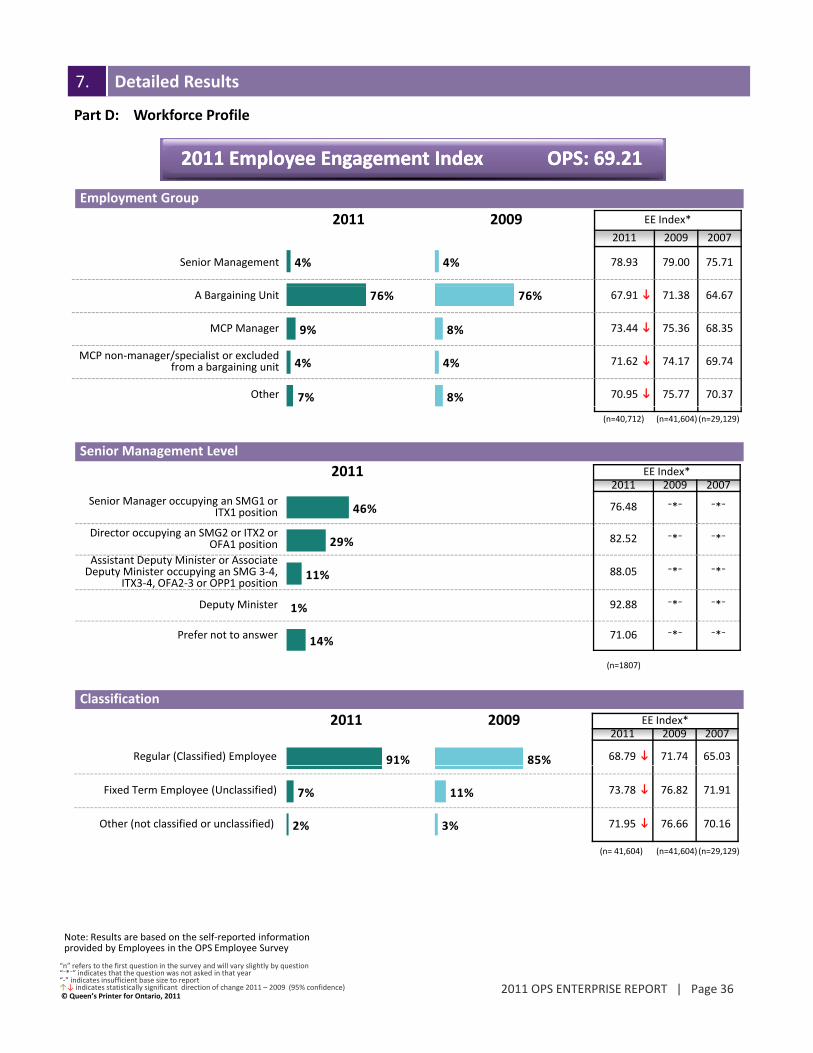
2011 Employee Engagement Index2011 Employee Engagement Index OPS: 69.21OPS: 69.21
7. Detailed Results
Part D: Workforce Profile
2011 2009 EE Index*
2011 2009 2007
Senior Management 78.93 79.00 75.714% 4%
p y g gp y g g
Employment Group
A Bargaining Unit 67.91 71.38 64.67
MCP Manager 73.44 75.36 68.35
MCP non‐manager/specialist or excluded from a bargaining unit 71.62 74.17 69.74
Other 70.95 75.77 70.37
76%
9%
4%
7%
76%
8%
4%
8%
2011 EE Index*2011 2009 2007
Senior Manager occupying an SMG1 or ITX1 position 76.48 ⁻*⁻ ⁻*⁻46%
(n=40,712) (n=41,604) (n=29,129)
Senior Management Level
Director occupying an SMG2 or ITX2 or OFA1 position 82.52 ⁻*⁻ ⁻*⁻
Assistant Deputy Minister or Associate Deputy Minister occupying an SMG 3‐4,
ITX3‐4, OFA2‐3 or OPP1 position88.05 ⁻*⁻ ⁻*⁻
Deputy Minister 92.88 ⁻*⁻ ⁻*⁻
Prefer not to answer 71.06 ⁻*⁻ ⁻*⁻
29%
11%
1%
14%
(n=1807)
2011 2009 EE Index*2011 2009 2007
Regular (Classified) Employee 68.79 71.74 65.0391% 85%
Classification
(n= 41,604) (n=41,604) (n=29,129)
Fixed Term Employee (Unclassified) 73.78 76.82 71.91
Other (not classified or unclassified) 71.95 76.66 70.16
7%
2%
11%
3%
© Queen’s Printer for Ontario, 20112011 OPS ENTERPRISE REPORT | Page 36
Note: Results are based on the self‐reported information provided by Employees in the OPS Employee Survey
“n” refers to the first question in the survey and will vary slightly by question“⁻*⁻” indicates that the question was not asked in that year“‐” indicates insufficient base size to report↑↓ indicates statistically significant direction of change 2011 – 2009 (95% confidence)
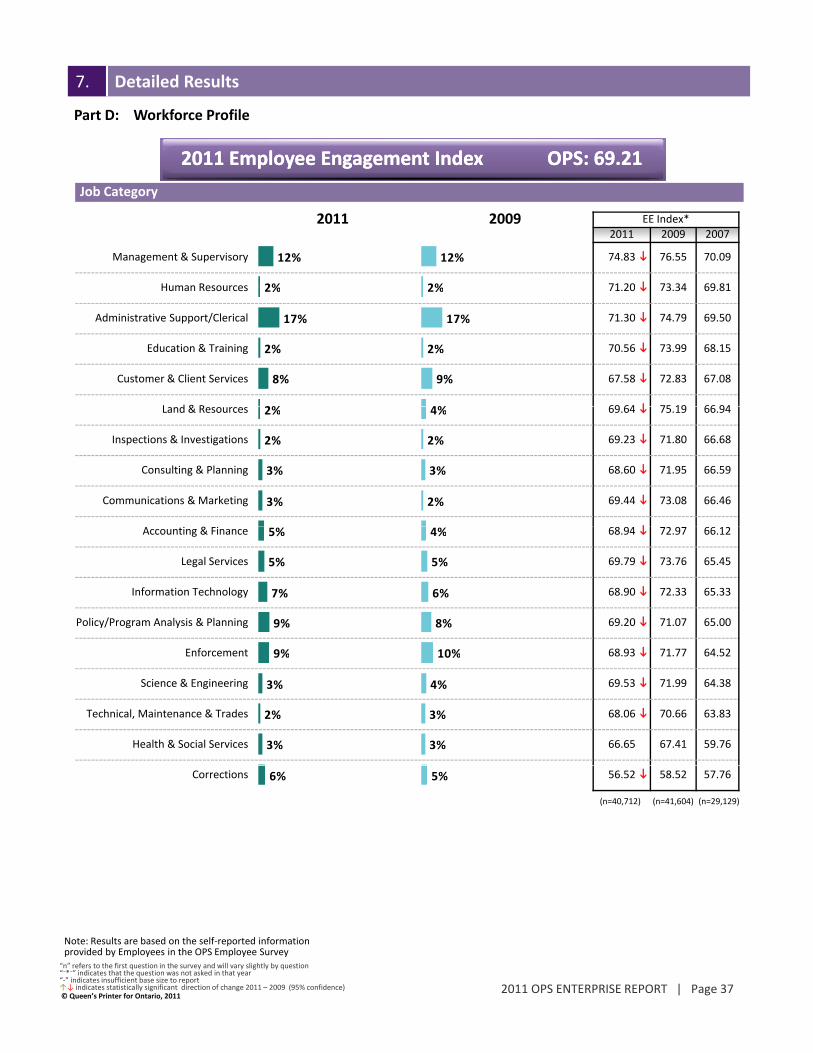
2011 Employee Engagement Index2011 Employee Engagement Index OPS: 69.21OPS: 69.21
7. Detailed Results
Part D: Workforce Profile
Job Category
2011 2009 EE Index*
2011 2009 2007
Management & Supervisory 74.83 76.55 70.09
Human Resources 71 20 73 34 69 81
12%
2%
12%
2%
p y g gp y g g
Human Resources 71.20 73.34 69.81
Administrative Support/Clerical 71.30 74.79 69.50
Education & Training 70.56 73.99 68.15
Customer & Client Services 67.58 72.83 67.08
L d & R 69 64 75 19 66 94
2%
17%
2%
8%
2%
2%
17%
2%
9%
4%Land & Resources 69.64 75.19 66.94
Inspections & Investigations 69.23 71.80 66.68
Consulting & Planning 68.60 71.95 66.59
Communications & Marketing 69.44 73.08 66.46
2%
2%
3%
3%
4%
2%
3%
2%
Accounting & Finance 68.94 72.97 66.12
Legal Services 69.79 73.76 65.45
Information Technology 68.90 72.33 65.33
Policy/Program Analysis & Planning 69.20 71.07 65.00
5%
5%
7%
9%
4%
5%
6%
8%
Enforcement 68.93 71.77 64.52
Science & Engineering 69.53 71.99 64.38
Technical, Maintenance & Trades 68.06 70.66 63.83
Health & Social Services 66.65 67.41 59.76
9%
3%
2%
3%
10%
4%
3%
3%
Corrections 56.52 58.52 57.766%
(n=40,712) (n=41,604) (n=29,129)
5%
© Queen’s Printer for Ontario, 20112011 OPS ENTERPRISE REPORT | Page 37
Note: Results are based on the self‐reported information provided by Employees in the OPS Employee Survey
“n” refers to the first question in the survey and will vary slightly by question“⁻*⁻” indicates that the question was not asked in that year“‐” indicates insufficient base size to report↑↓ indicates statistically significant direction of change 2011 – 2009 (95% confidence)

2011 Employee Engagement Index2011 Employee Engagement Index OPS: 69.21OPS: 69.21
7. Detailed Results
Part D: Workforce Profile
2011 2009 EE Index*2011 2009
None/NA 68.78 71.96
Occasionally (not every day) 70 54 73 51
35%
32%
32%
33%
p y g gp y g g
Interaction with Citizens/Businesses: Face‐To‐Face
Occasionally (not every day) 70.54 73.51
Up to 1 hour daily 70.72 73.47
Up to 2 hours daily 70.76 73.04
Up to 3 hours daily 68.56 72.48
3 hours or more daily 67.05 71.12
32%
6%
5%
4%
18%
33%
6%
5%
4%
20%
(n=40,712) (n=41,604)
2011 2009 EE Index*2011 2009
None/NA 68.09 71.6422% 20%
Interaction with Citizens/Businesses: Telephone
Occasionally (not every day) 69.91 73.14
Up to 1 hour daily 69.69 72.73
Up to 2 hours daily 69.44 72.09
Up to 3 hours daily 68.58 72.04
3 hours or more daily 68 28 71 96
37%
17%
11%
5%
9%
36%
18%
11%
5%
10%3 hours or more daily 68.28 71.969% 10%
2011 2009 EE Index*2011 2009
None/NA 67.58 71.6325% 25%
Interaction with Citizens/Businesses: Electronic Channels
(n=40,712) (n=41,604)
/
Occasionally (not every day) 69.99 72.95
Up to 1 hour daily 69.47 72.44
Up to 2 hours daily 69.75 72.29
Up to 3 hours daily 69.36 72.49
25%
34%
15%
9%
5%
25%
34%
16%
10%
5%
© Queen’s Printer for Ontario, 20112011 OPS ENTERPRISE REPORT | Page 38
Note: Results are based on the self‐reported information provided by Employees in the OPS Employee Survey
3 hours or more daily 69.62 73.1812% 11%
(n=40,712) (n=41,604)
“n” refers to the first question in the survey and will vary slightly by question“⁻*⁻” indicates that the question was not asked in that year“‐” indicates insufficient base size to report↑↓ indicates statistically significant direction of change 2011 – 2009 (95% confidence)

7. Detailed Results
Part D: Workforce Profile
2011 Employee Engagement Index2011 Employee Engagement Index OPS: 69.21OPS: 69.21
2011 2009 EE Index*
2011 2009 2007
<1 yr 77.00 79.94 75.26
1‐4 yrs 71.87 75.30 69.34
5%
18%
8%
20%
p y g gp y g g
Tenure
5‐9 yrs 69.29 71.77 65.33
10‐15 yrs 67.20 70.12 64.63
16‐20 yrs 67.78 69.93 63.48
> 20 yrs 68.37 70.92 63.93
Prefer not to answer 61.48 ‐ 62.96
21%
17%
7%
30%
2%
( 40 712) ( 41 604) ( 29 129)
22%
11%
11%
28%
0%
2011 2009 EE Index*2011 2009 2007
Central 69.42 72.40 66.21
East 68.00 72.52 65.63
58%
13%
53%
14%
(n=40,712) (n=41,604) (n=29,129)
Location by Region
North 69.80 73.58 67.05
West 69.01 72.14 65.50
13%
16%
15%
16%
Job Changes (Within the last 3 years)
(n=40,712) (n=41,604) (n=29,129)
2011 2009 EE Index*2011 2009 2007
None 68.21 71.64 65.03
Once 70.85 73.58 67.61
Twice 71.54 74.29 68.23
Three times or more 71.93 74.12 68.65
Prefer not to ans er 63 14 71 92 64 78
61%
22%
9%
6%
2%
62%
22%
10%
6%
0%Prefer not to answer 63.14 71.92 64.78
2011 2009 EE Index*2011 2009 2007
Initiated by management 70.95 73.70 68.24
2%
35% 32%
0%
Job Change was Initiated by …
(n=40,712) (n=41,604) (n=29,129)
© Queen’s Printer for Ontario, 20112011 OPS ENTERPRISE REPORT | Page 39
Note: Results are based on the self‐reported information provided by Employees in the OPS Employee Survey
I initiated it 71.32 73.93 67.9365%
(n=15,422) (n=16,345) (n=9,966)
68%
“n” refers to the first question in the survey and will vary slightly by question“⁻*⁻” indicates that the question was not asked in that year“‐” indicates insufficient base size to report↑↓ indicates statistically significant direction of change 2011 – 2009 (95% confidence)

7. Detailed Results
Part D: Workforce Profile
2011 Employee Engagement Index2011 Employee Engagement Index OPS: 69.21OPS: 69.21
2011 2009 EE Index*2011 2009 2007
Advance my career 73.78 76.45 ‐
Reduce stress 65.97 67.11 ‐
58%
8%
Reason for Self‐Initiated Job Change
57%
8%
p y g gp y g g
Have more interesting work 70.86 72.45 ‐
Have a better supervisor 67.93 68.26 ‐
Have more compatible colleagues 71.99 69.85 ‐
It was just time for a change 68.35 71.29 ‐
Professional Development 73.59 75.95 ‐
Other reasons 67.90 70.92 ‐
8%
22%
8%
1%
10%
25%
15%
8%
23%
8%
1%
11%
24%
17%Prefer not to answer 63.24 ‐ ‐
15%
1%
(n=10,016) (n=11,017)
Are Flexible Work Arrangements Available in your Ministry?
Are You Currently on a Flexible Arrangement?
17%
0%
2011 EE Index2011
Yes 71.43
No 63.05
Don’t Know 69.64
58%
22%
20%
2011 EE Index2011
Yes 70.07
No 72.44
Don’t Know 70.16
41%
57%
2%
(n=40,712) (n=23,477)
© Queen’s Printer for Ontario, 20112011 OPS ENTERPRISE REPORT | Page 40
Note: Results are based on the self‐reported information provided by Employees in the OPS Employee Survey
“n” refers to the first question in the survey and will vary slightly by question“⁻*⁻” indicates that the question was not asked in that year“‐” indicates insufficient base size to report↑↓ indicates statistically significant direction of change 2011 – 2009 (95% confidence)

7. Detailed Results
Part D: Workforce Profile
2011 Employee Engagement Index2011 Employee Engagement Index OPS: 69.21OPS: 69.21
Are you a Member of One or More OPS Employee Networks? (New Question in 2011)
2011 EE Index*2011 2009 2007
Yes 71.52 ⁻*⁻ ⁻*⁻
No 69.23 ⁻*⁻ ⁻*⁻
21%
64%
2011 EE Index*2011 2009
Black Ontario Public Service Employee Network (BOPSers) 69.11 ⁻*⁻
Employee Network You Belong To (New Question in 2011)
5%
Prefer not to answer 65.67 ⁻*⁻ ⁻*⁻15%
(n=40,712)
FrancoGO (francophone employee network) 72.14 ⁻*⁻
OPS Disability Network (DNET) 68.38 ⁻*⁻
OPS East Asian Network Group (EANG) 72.16 ⁻*⁻
OPS Pride (lesbian, gay, bisexual and transgender network) 70.42 ⁻*⁻
S th A i N t k (SAN) 71 90 *
8%
4%
9%
5%
South Asian Network (SAN) 71.90 ⁻*⁻
Tomorrow’s OPS (TOPS) 71.43 ⁻*⁻
4%
35%
(n=8,668)
2011 2009 EE Index*2011 2009
Performance Appraisal: Have a Written Performance and Learning Plan
Yes 70.34 73.57
No 62.35 67.19
Don’t know 68.19 73.14
83%
13%
4%
76%
17%
7%
(n=40,712) (n=41,604)
79%
20%
Performance Appraisal: Appraised in the last 12 months
2011 2009 2007 EE Index*
2011 2009 2007
Yes 70.50 73.76 67.61
No 64.19 68.85 62.72
P f
74%
26%
64%
31%
© Queen’s Printer for Ontario, 20112011 OPS ENTERPRISE REPORT | Page 41
Note: Results are based on the self‐reported information provided by Employees in the OPS Employee Survey
2%Prefer not to
answer 67.86 68.75 65.19
(n=40,712) (n=41,604) (n=29,129)
7% 6%
“n” refers to the first question in the survey and will vary slightly by question“⁻*⁻” indicates that the question was not asked in that year“‐” indicates insufficient base size to report↑↓ indicates statistically significant direction of change 2011 – 2009 (95% confidence)

2011 Employee Engagement Index2011 Employee Engagement Index OPS: 69.21OPS: 69.21
7. Detailed Results
Part E: Demographic Profile
Age
18%
24%
2011 2009 EE Index*Average Age = 45 Years Average Age = 44 Years 2011 2009 2007
Under 35 69.75 74.18 68.38
35 to 44 69 05 72 06 65 39
21%
24%
p y g gp y g g
Gender
24%
35%
17%
7%
35 to 44 69.05 72.06 65.39
45 to 54 69.24 71.68 64.70
55 and over 70.82 73.90 68.12
Prefer not to answer 64.06 67.70 63.02
24%
34%
15%
5%
(n=40,712) (n=41,604) (n=29,129)
54%
39%
0%
2011 2009 EE Index*2011 2009 2007
Female 70.60 73.75 67.49
Male 68.67 71.74 64.65
Trans‐gendered 52.60 44.22 ‐
54%
41%
0%
6%Prefer not to answer 60.68 64.10 60.66
Education
0%
2011 2009 EE Index*2011 2009
Grade/elementary school 57 41 52 78
5%
1%
(n=40,712) (n=41,604) (n=29,129)
0%
0%
7%
7%
20%
Grade/elementary school 57.41 52.78
Some high school 73.80 80.39
High school graduate 71.52 75.03
Some vocational, tech. college, or CEGEP 69.48 73.04
Vocational, tech. college or CEGEP graduate 68.39 72.66
1%
1%
8%
7%
20%
8%
30%
20%
8%
Some university 69.31 72.22
University graduate 69.60 72.17
Post graduate or higher 70.30 72.20
Prefer not to answer 64.04 69.41
9%
29%
18%
6%
(n=40,712) (n=41,604)
© Queen’s Printer for Ontario, 20112011 OPS ENTERPRISE REPORT | Page 42
Note: Results are based on the self‐reported information provided by Employees in the OPS Employee Survey
“n” refers to the first question in the survey and will vary slightly by question“⁻*⁻” indicates that the question was not asked in that year“‐” indicates insufficient base size to report↑↓ indicates statistically significant direction of change 2011 – 2009 (95% confidence)
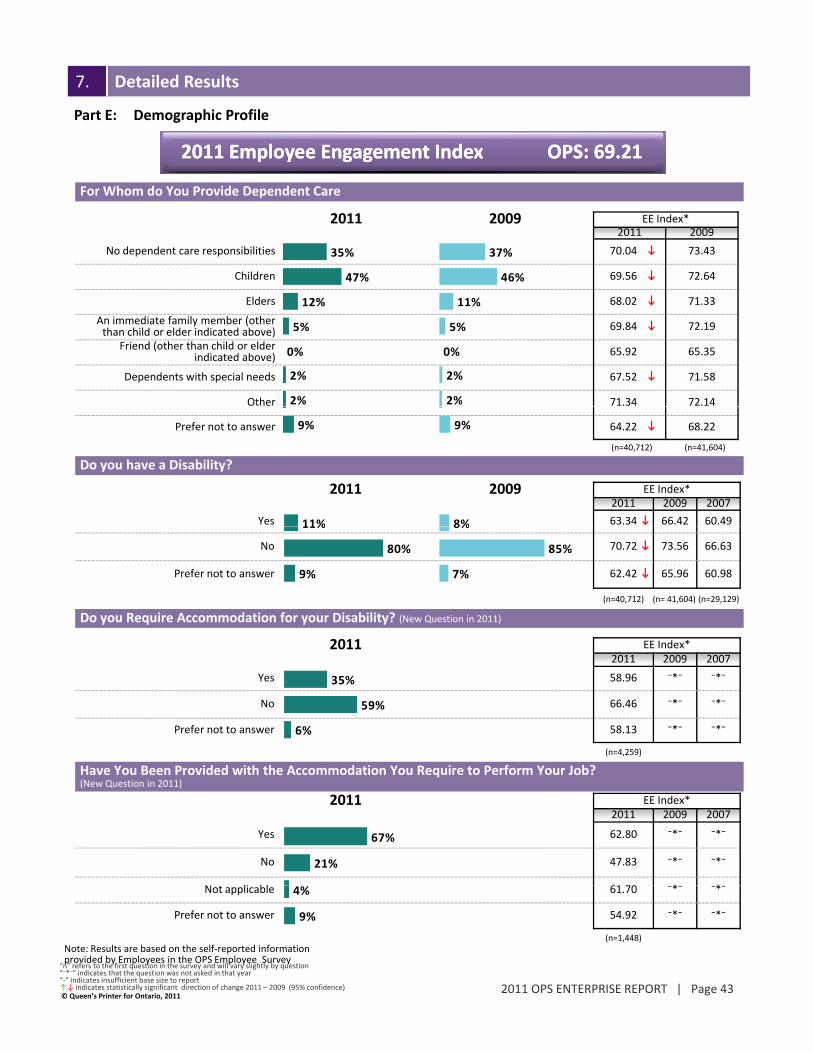
7. Detailed Results
Part E: Demographic Profile
2011 Employee Engagement Index2011 Employee Engagement Index OPS: 69.21OPS: 69.21
2011 2009 EE Index*2011 2009
No dependent care responsibilities 70.04 73.43
Children 69.56 72.64
For Whom do You Provide Dependent Care
35%
47%
37%
46%
Elders 68.02 71.33
An immediate family member (other than child or elder indicated above) 69.84 72.19
Friend (other than child or elder indicated above) 65.92 65.35
Dependents with special needs 67.52 71.58
Other 71.34 72.14
12%
5%
0%
2%
2%
11%
5%
0%
2%
2%
2011 2009 EE Index*2011 2009 2007
Yes 63.34 66.42 60.49
Prefer not to answer 64.22 68.22
Do you have a Disability?
9%
11%
(n=40,712) (n=41,604)
9%
8%
No 70.72 73.56 66.63
Prefer not to answer 62.42 65.96 60.98
11%
80%
9%
Do you Require Accommodation for your Disability? (New Question in 2011)
2011 EE Index*
(n=40,712) (n= 41,604) (n=29,129)
8%
85%
7%
2011 EE Index2011 2009 2007
Yes 58.96 ⁻*⁻ ⁻*⁻
No 66.46 ⁻*⁻ ⁻*⁻
Prefer not to answer 58.13 ⁻*⁻ ⁻*⁻
(n=4,259)
35%
59%
6%
H Y B P id d i h h A d i Y R i P f Y J b?
2011 EE Index*2011 2009 2007
Yes 62.80 ⁻*⁻ ⁻*⁻
No 47.83 ⁻*⁻ ⁻*⁻
N li bl 61 70 * *
67%
21%
Have You Been Provided with the Accommodation You Require to Perform Your Job?(New Question in 2011)
© Queen’s Printer for Ontario, 20112011 OPS ENTERPRISE REPORT | Page 43
Not applicable 61.70 ⁻*⁻ ⁻*⁻
Prefer not to answer 54.92 ⁻*⁻ ⁻*⁻
Note: Results are based on the self‐reported information provided by Employees in the OPS Employee Survey
4%
9%
(n=1,448)
“n” refers to the first question in the survey and will vary slightly by question“⁻*⁻” indicates that the question was not asked in that year“‐” indicates insufficient base size to report↑↓ indicates statistically significant direction of change 2011 – 2009 (95% confidence)

7. Detailed Results
Part E: Demographic Profile
2011 Employee Engagement Index2011 Employee Engagement Index OPS: 69.21OPS: 69.21
2011 2009 EE Index*2011 2009 2007
Yes 71.29 73.93 68.52
No 69.57 72.72 66.08
Francophone
7%
85%
8%
85%
p y g gp y g g
2011 2009 EE Index*2011 2009
Heterosexual 70 00 73 14
Prefer not to answer 63.13 67.44 61.88
Sexual Orientation
8%
80%
7%
81%
(n=40,712) (n= 41,604) (n=29,129)
Heterosexual 70.00 73.14
Gay 69.10 69.16
Lesbian 64.02 67.92
Bisexual 66.72 69.15
Two‐spirited 58.29 67.52
Q ti i 59 61 62 49
80%
1%
1%
1%
0%
81%
1%
1%
1%
0%
Questioning 59.61 62.49
Prefer not to answer 65.99 69.72
2011 2009 EE Index*2011 2009
Aboriginal
0%
17%
0%
15%
(n=40,712) (n= 41,604)
2011 2009
No 69.85 73.00
Yes, First Nations 71.32 71.09
Yes, Métis 68.66 70.21
Yes, Inuit ‐ 58.14
Prefer not to answer 61 44 66 08
90%
1%
1%
0%
8%
91%
1%
1%
0%
7%Prefer not to answer 61.44 66.088% 7%
(n=40,712) (n= 41,604)
© Queen’s Printer for Ontario, 20112011 OPS ENTERPRISE REPORT | Page 44
Note: Results are based on the self‐reported information provided by Employees in the OPS Employee Survey
“n” refers to the first question in the survey and will vary slightly by question“⁻*⁻” indicates that the question was not asked in that year“‐” indicates insufficient base size to report↑↓ indicates statistically significant direction of change 2011 – 2009 (95% confidence)

2011 Employee Engagement Index2011 Employee Engagement Index OPS: 69.21OPS: 69.21
7. Detailed Results
Part E: Demographic Profile
Visible Minority
2011 2009 EE Index*2011 2009 2007
Yes 70.82 72.97 66.47
No 69.61 72.93 66.14
17%
72%
15%
75%
p y g gp y g g
Prefer not to answer 63.89 68.01 64.13
Are You…
2011 2009 EE Index*2011 2009
72%
11%
75%
10%
(n=40,712) (n= 41,604) (n=29,129)
1%
3%
3%
1%
0%
Arab 70.37 69.22
Black 70.90 71.58
Chinese 71.33 73.39
Filipino 76.09 75.09
Japanese 66.79 69.41
0%
3%
3%
1%
0%
0%
1%
4%
0%
0%
Korean 70.82 73.05
Latin American 73.43 75.52
South Asian 72.96 75.57
Southeast Asian 72.58 73.15
West Asian 72 65 70 44
0%
1%
4%
0%
0%0%
69%
6%
14%
West Asian 72.65 70.44
White 69.62 73.01
Other 68.68 72.11
Prefer not to answer 64.19 67.85
0%
71%
6%
13%
(n=40,712) (n= 41,604)
© Queen’s Printer for Ontario, 20112011 OPS ENTERPRISE REPORT | Page 45
Note: Results are based on the self‐reported information provided by Employees in the OPS Employee Survey
“n” refers to the first question in the survey and will vary slightly by question“⁻*⁻” indicates that the question was not asked in that year“‐” indicates insufficient base size to report↑↓ indicates statistically significant direction of change 2011 – 2009 (95% confidence)

2011 Employee Engagement Index2011 Employee Engagement Index OPS: 69.21OPS: 69.21
7. Detailed Results
Part E: Demographic Profile
Ethnic or Cultural Origin
2011 2009 EE Index*2011 2009
Canadian 70.37 73.67
English 70.29 73.49
36%
15%
42%
18%
p y g gp y g g
Irish 69.13 72.84
Scottish 69.26 73.41
French 70.86 73.55
Italian 72.40 74.31
G 70 71 73 26
9%
9%
6%
4%
4%
12%
12%
8%
4%
6%German 70.71 73.26
Chinese 72.24 74.13
East Indian/India 73.96 75.48
British 69.62 72.40
Dutch 71.34 72.75
4%
3%
2%
2%
2%
6%
3%
2%
2%
3%
Polish 71.35 74.57
French Canadian 70.73 74.24
Ukrainian 70.96 73.66
American 71.37 73.51
Jamaican 69 32 71 70
2%
2%
2%
1%
1%
2%
3%
2%
1%
1%Jamaican 69.32 71.70
Jewish 70.18 73.17
Métis 71.26 73.65
Greek 73.89 76.70
Portuguese 71.79 76.45
1%
1%
1%
1%
1%
1%
1%
1%
1%
1%
Guyanese 74.09 74.85
Trinidadian 72.23 73.27
Filipino 78.16 77.21
First Nations 70.54 ‐
Other 72.77 74.40
1%
1%
1%
1%
12%
1%
1%
1%
13%
© Queen’s Printer for Ontario, 20112011 OPS ENTERPRISE REPORT | Page 46
Prefer not to answer 64.77 68.38
Note: Results are based on the self‐reported information provided by Employees in the OPS Employee Survey
12%
28%
13%
24%
(n=40,712) (n= 41,604)
“n” refers to the first question in the survey and will vary slightly by question“⁻*⁻” indicates that the question was not asked in that year“‐” indicates insufficient base size to report↑↓ indicates statistically significant direction of change 2011 – 2009 (95% confidence)

2011 Employee Engagement Index2011 Employee Engagement Index OPS: 69.21OPS: 69.21
7. Detailed Results
Part E: Demographic Profile
2011 2009 EE Index*2011 2009
No religion 68.23 71.20
Buddhism 69.32 71.73
Religion
18%
1%
18%
1%
p y g gp y g g
Christianity 70.86 73.93
Hinduism 74.69 76.29
Judaism 69.44 72.50
Islam 74.03 76.98
1%
51%
2%
1%
2%
1%
54%
1%
1%
2%
Sikhism 69.07 72.29
Other 69.65 74.17
Prefer not to answer 64.68 68.35
0%
5%
19%
1%
5%
18%
(n=40,712) (n= 41,604)
© Queen’s Printer for Ontario, 20112011 OPS ENTERPRISE REPORT | Page 47
Note: Results are based on the self‐reported information provided by Employees in the OPS Employee Survey
“n” refers to the first question in the survey and will vary slightly by question“⁻*⁻” indicates that the question was not asked in that year“‐” indicates insufficient base size to report↑↓ indicates statistically significant direction of change 2011 – 2009 (95% confidence)

7. Detailed Results
Part F: Verbatim SummaryThe charts below show the number of mentions pertaining to a category as a percentage of thetotal number of verbatim comments (n) made for each question.
Comments about “Your Job”
38%
24%
19%
Management General
Physical Work Environment
Career Advancement
16%15%
14%
11%
11%
10%
10%
Employee Morale
Performance Barriers
Salary & Benefits
Training
Supportive Environment
Communication
Job Fit
10%
10%9%
8%
6%
5%1%
Managing Change
Organizational Procedures/Policies
Job Competency
Citizen/Customer Interaction
Recruitment Process
Recognition
Learning Opportunities
(n= 11109)
Comments about “Your Workplace”
43%
37%
25%
Management General
Physical Work Environment
Employee Morale
15%14%
10%
9%
9%
9%
8%
Performance Barriers
Career Advancement
Salary & Benefits
Job Competency
Recruitment Process
Communication
Managing Change
7%
7%7%
6%
4%
3%0%
Organizational Procedures/Policies
Recognition
Supportive Environment
Job Fit
Training
Citizen/Customer Interaction
Learning Opportunities
© Queen’s Printer for Ontario, 20112011 OPS ENTERPRISE REPORT | Page 48
(n= 7992)

7. Detailed Results
Part F: Verbatim SummaryThe charts below show the number of mentions pertaining to a category as a percentage of thetotal number of verbatim comments (n) made for each question.
Comments about “Your Career”
52%
29%
28%
Career Advancement
Management General
Training
19%15%
14%
11%
10%
9%
8%
g
Salary & Benefits
Managing Change
Physical Work Environment
Job Competency
Recruitment Process
Learning Opportunities
Employee Morale
7%
7%6%
5%
5%
4%2%
Organizational Procedures/Policies
Supportive Environment
Job Fit
Communication
Performance Barriers
Recognition
Citizen/Customer Interaction
Comments about “Your Senior Leadership”(n= 5782)
78%
31%
11%
Management General
Communication
Managing Change 11%
11%11%
9%
8%
7%
6%
6%
Managing Change
Physical Work Environment
Career Advancement
Organizational Procedures/Policies
Job Competency
Salary & Benefits
Employee Morale
Job Fit 6%
5%
5%5%
4%
3%
3%1%
Job Fit
Recruitment Process
Performance Barriers
Supportive Environment
Recognition
Training
Citizen/Customer Interaction
Learning Opportunities
© Queen’s Printer for Ontario, 20112011 OPS ENTERPRISE REPORT | Page 49
(n= 5393)
1%Learning Opportunities
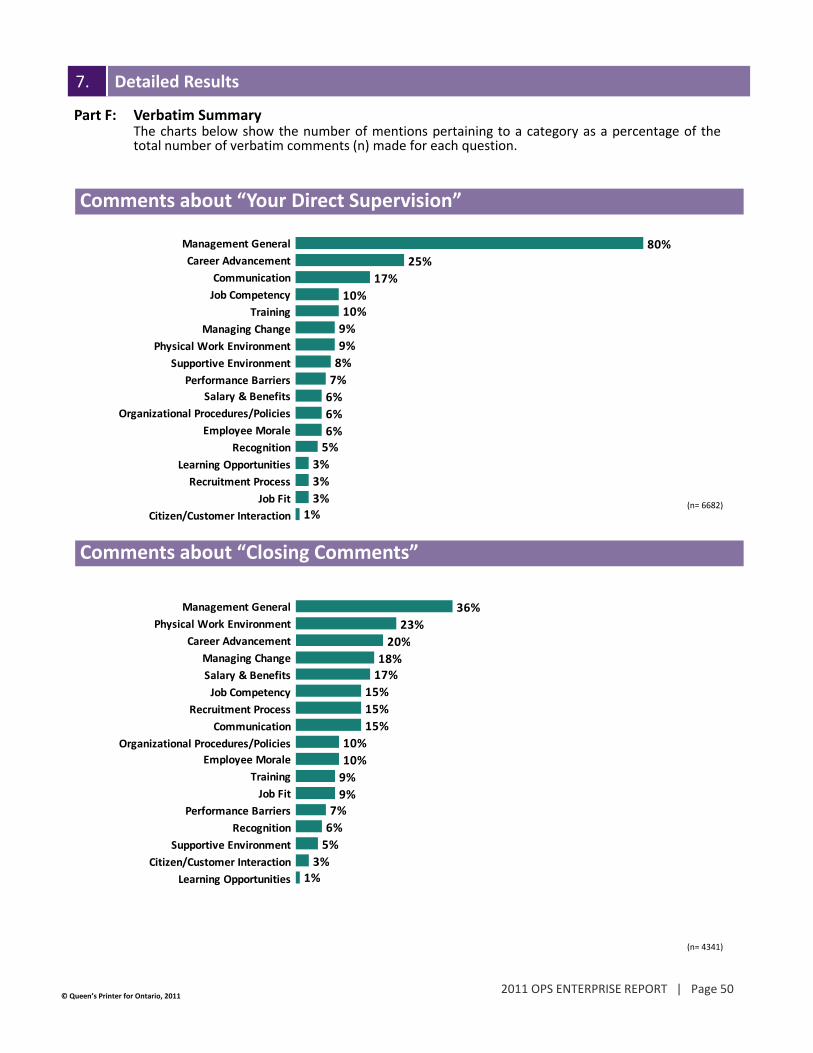
7. Detailed Results
Part F: Verbatim SummaryThe charts below show the number of mentions pertaining to a category as a percentage of thetotal number of verbatim comments (n) made for each question.
Comments about “Your Direct Supervision”
80%
25%
17%
Management General
Career Advancement
Communication
10%10%
9%
9%
8%
7%
6%
Job Competency
Training
Managing Change
Physical Work Environment
Supportive Environment
Performance Barriers
Salary & Benefits
(n= 6682)
6%
6%5%
3%
3%
3%1%
Organizational Procedures/Policies
Employee Morale
Recognition
Learning Opportunities
Recruitment Process
Job Fit
Citizen/Customer Interaction
Comments about “Closing Comments”
36%
23%
20%
Management General
Physical Work Environment
Career Advancement %
18%17%
15%
15%
15%
10%
10%
Managing Change
Salary & Benefits
Job Competency
Recruitment Process
Communication
Organizational Procedures/Policies
Employee Morale
9%
9%7%
6%
5%
3%1%
Training
Job Fit
Performance Barriers
Recognition
Supportive Environment
Citizen/Customer Interaction
Learning Opportunities
© Queen’s Printer for Ontario, 20112011 OPS ENTERPRISE REPORT | Page 50
(n= 4341)

Appendix:
OPS Employee Engagement Model
© Queen’s Printer for Ontario, 20112011 OPS ENTERPRISE REPORT | Page 51

The OPS Employee Engagement Model
Employee Engagement is a combination of both Satisfaction and Commitment.
f d f d f h h d k d
Appendix: OPS Employee Engagement Model
Satisfaction is composed of two dimensions ‐ satisfaction with the immediate Work Environment, and satisfaction with the broader Organizational Culture.
Commitment reflects the degree to which employees are committed to (staying with) the organization and the achievement of its goals.
FIGURE 1 – OPS Employee Engagement Model
Engagement is more than Job Satisfaction
SATISFACTIONSATISFACTION• Employee Satisfaction has two components: Work Environment and O i ti l C ltOrganizational Culture.
• Each address different aspects of the Employees’ relationship to work.
COMMITMENTCOMMITMENT• Satisfaction, while essential, does not necessarily lead to engagement. Commitment must also be present.
SATISFACTIONSATISFACTION
• Commitment emerges when employees have clarity about their role and are able to act based on clear expectations and direction. Under these conditions employees can engage in, and advance the goals of the organization.
EMPLOYEEEMPLOYEEENGAGEMENTENGAGEMENT
COMMITMENT
The elements of satisfaction and commitment in the OPS model of employee engagement arereflected in the nine indicator questions constituting the Employee Engagement Index:
COMMITMENT
• I am satisfied with my job
• I am satisfied with my ministry
• Overall, I am satisfied in my work as an OPS employee
• I am proud to tell people I work for the OPS
• I am proud to work for my ministry
• I would prefer to stay with the OPS, even if offered a similar job elsewhere
© Queen’s Printer for Ontario, 20112011 OPS ENTERPRISE REPORT | Page 52
I would prefer to stay with the OPS, even if offered a similar job elsewhere
• I am inspired to give my very best
• I would recommend the OPS as a great place to work
• I strive to improve my ministry’s results

In building its Employee Engagement model the OPS leverages 19 “themes” or “drivers” that have animpact on the three dimensions of Employee Engagement. These themes were initially identifiedbased on extensive research of current knowledge and best practice across the public and private
Appendix: OPS Employee Engagement Model
OPS Employee Engagement Themes
sectors in Canada and internationally and have since been validated through statistical testing andanalysis using OPS survey results.
Career AdvancementClear Expectations & DirectionCommitment to Public ServiceCo‐worker RelationshipsDirect SupervisionInclusive PracticesIndependence & Innovation
Quality of ServiceRecognitionSafe & Healthy WorkplaceSupport & ToolsWork‐Life BalanceWorkplace Morale
Job FitLeadership PracticesLearning and DevelopmentOrganizational CommunicationOrientation/On‐BoardingPerformance Barriers
The Public Service Commissioners’ Employee Engagement ModelThe OPS has participated in the work of an inter‐jurisdictional team representing the federal,provincial and territorial governments across Canada. This inter‐jurisdictional group has adopted anEmployee Engagement model that is consistent with that of the OPS and a set of common questionsthat are incorporated into Ontario’s survey questionnaire. The OPS uses national scores collected bythi t b h k it ltthis group to benchmark its own results.
FIGURE 2 ‐ Public Service Commissioners’ Employee Engagement Model
© Queen’s Printer for Ontario, 20112011 OPS ENTERPRISE REPORT | Page 53

The Public Sector Service Value ChainThe OPS subscribes to the conceptual framework set out in the Public Sector Service Value Chain andinvokes it in its approach to Employee Engagement
Appendix: OPS Employee Engagement Model
FIGURE 3 ‐ Public Sector Service Value Chain
invokes it in its approach to Employee Engagement.
The service profit chain concept is widely used in the private sector and has been adapted to thepublic sector to help institutions improve organizational performance. The Public Sector ServiceValue Chain posits a link between Employee Engagement, Organizational Performance and CustomerSatisfaction which in turn build Public Trust and Confidence.
The Public Sector Service Value Chain recognizes the symbiotic link between engaged employees andsatisfied clients of public services Building an engaged workforce committed to higher levels of
Increase Increase Employee Employee
EngagementEngagement
Strengthen Strengthen Organizational Organizational PerformancePerformance
Increase Increase Customer Customer SatisfactionSatisfaction
Trust & Trust & ConfidenceConfidence
satisfied clients of public services. Building an engaged workforce committed to higher levels ofservice quality, is a key component of the OPS modernization agenda.
The Link Between Employee Engagement and Customer Satisfaction
Research on the links between Customer Satisfaction and Employee Engagement was conducted forthe Ontario Public Service through the Modernization Division at MGS. The analysis linked the 2007Ontario Public Service Employee Survey data to the 2007 OCCIO Customer Satisfaction survey results.In the analysis it was learned that those Employee Engagement drivers that simultaneously impactboth Employee Engagement and Customer Satisfaction are Job Design, Support and Tools, Job Fit andOrientation and On‐boarding. Building on the Public Sector Service Value Chain therefore, the OPSmust focus on these key drivers associated with Work Environment in the OPS Employee EngagementModel for those staff providing internal or external client services.
FIGURE 4 – Connecting Employee Engagement and Customer Satisfaction
Linking Employee Engagement and Customer Satisfaction
Support &
Job DesignOpportunitiesfor Growth &Advancement
Accessibility
Support &
Job DesignOpportunitiesfor Growth &Advancement
Opportunitiesfor Growth &Advancement
AccessibilityAccessibility
EmployeeEmployeeEngagementEngagement
CustomerCustomerSatisfactionSatisfaction
Support & Tools
Orientation / On-boarding
Job FitLeadership Practices
Value for Money
Timeliness
EmployeeEmployeeEngagementEngagement
CustomerCustomerSatisfactionSatisfaction
Support & Tools
Orientation / On-boarding
Job FitLeadership Practices
Leadership Practices
Value for Money
TimelinessTimeliness
© Queen’s Printer for Ontario, 20112011 OPS ENTERPRISE REPORT | Page 54
Employees who are engaged view the organization as having strong Leadership Practices and offering Opportunities for Growth and Advancement.
Employees who are engaged and satisfy customers also have the necessary tools, a good fit of skills to task and have had a solid orientation for their role.
Satisfied customers receive service that is accessible, valuable and delivered in a timely manner.

CONTACT INFORMATION
Modernization Division, HROntario Mi i t f G t S iMinistry of Government Services375 University Ave., 5th FloorToronto, ON M5G 2J5
Phone: 416 325 7791Fax: 416 325 7798Email: Service Excellence@ontario caEmail: [email protected]: http://intra.mgs.gov.on.ca/MGSHome/MODHome/tabid/661/Default.aspx
© Queen’s Printer for Ontario, 20112011 OPS ENTERPRISE REPORT | Page 55
7202011v3