optical characterization of interface magnetization in
TRANSCRIPT
W&M ScholarWorks W&M ScholarWorks
Dissertations, Theses, and Masters Projects Theses, Dissertations, & Master Projects
2016
Optical Characterization of Interface Magnetization in Optical Characterization of Interface Magnetization in
Multifunctional Oxide Heterostructures Multifunctional Oxide Heterostructures
Fan Fang College of William and Mary, [email protected]
Follow this and additional works at: https://scholarworks.wm.edu/etd
Part of the Physical Sciences and Mathematics Commons
Recommended Citation Recommended Citation Fang, Fan, "Optical Characterization of Interface Magnetization in Multifunctional Oxide Heterostructures" (2016). Dissertations, Theses, and Masters Projects. Paper 1477067969. http://doi.org/10.21220/S2VC78
This Dissertation is brought to you for free and open access by the Theses, Dissertations, & Master Projects at W&M ScholarWorks. It has been accepted for inclusion in Dissertations, Theses, and Masters Projects by an authorized administrator of W&M ScholarWorks. For more information, please contact [email protected].

Optical Characterization of Interface Magnetization in Multifunctional Oxide Heterostructures
Fan Fang
Wuhu, Anhui, P. R. China
Bachelor of Science, University of Science and Technology of China, 2009
A Dissertation presented to the Graduate Faculty of the College of William and Mary in Candidacy for the Degree of
Doctor of Philosophy
Department of Applied Science
The College of William and Mary May, 2016

© Copyright by Fan Fang. Student 2016

ABSTRACT
Multifunctional oxides attract much attention recently. The strong correlated
electron system involves the notable properties of colossal magnetoresistance,
ferroelectric tunneling and spin transport, with the coupling of electron, spin
and orbital degrees of freedom. Their rich functional behavior is of potential
use for nanoelectronics and data storage. Particularly interesting are the
mulitferroic materials, which exhibit simultaneously electric and magnetic
ordering properties. Understanding the interface coupling mechanism of these
two order parameters are critical to future development of high-performance
spintronic devices. The goal of this dissertation is to elucidate the interfacial
magnetoelectric (ME) coupling with optical characterization method --
magnetization-induced second-harmonic generation (MSHG), which is
sensitive to the interface due to the broken spatial inversion symmetry.
First, ME coupling at the interface of BaTiO3 (BTO)/La0.67Sr0.33MnO3 (LSMO) is
observed by applying an external electric field. The voltage-dependent
magnetic contrast reveals a sharp transition from ferromagnetic (FM) to
antiferromagnetic (AFM) order occurring at positive voltage (applied to LSMO
contact). This novel effect is attributed to interface ME coupling. Strain or
ferroelectric (FE) polarization induced mechanisms do not play an important
role in this system. A new mechanism is proposed -- minority spin injection --
to modulate the interface magnetization. The minority spin injection at the
interface weakens the double-exchange coupling of nearby eg electrons,
thereby weakening the FM ordering. Thus the dominant AFM superexchange
coupling of localized t2g electrons causes the phase transition at positive
voltage. The magnetic transition is shifted to higher voltage by reducing the
carrier concentration of BTO.
Second, a non-multiferroic heterostructure -- SrTiO3 (STO)/La0.5Ca0.5MnO3
(LCMO)/La0.67Sr0.33MnO3 (LSMO) -- is studied to elucidate further the interface
ME effect. The magnetization transition is observed but shifted to negative
voltage. The LSMO is pushed to higher hole doping level due to the STO layer
which acts as a hole donating layer, while the LCMO interlayer at the medium
doping level displays complicated CE-type AFM phase. Thus, a negative
voltage is required to lower the hole doping level of LSMO to induce the FM
phase. The magnetic contrast reappears at high positive voltage, indicating the
occurrence of an A-type AFM phase, which is stable at high hole doping
concentration. The results of this dissertation show that the interface magnetic
phase of LSMO can be controlled by an applied electric field through
modulation of the hole doping level.
i
TABLE OF CONTENTS
Acknowledgements iv
Dedications v
List of Tables vi
List of Figures vii
Chapter 1. Introduction 1
1.1 Magnetic tunneling junction 1
1.2 Spin transfer torque 3
1.3 Magnetoelectric effect 5
1.3.1 Magnetoelectric effects on ferromagnetic metal 6
1.3.2 Magnetoelectric effect in multiferroic oxide
heterostructures 6
1.3.3 Magnetoelectric effect in spin transport 8
1.4 Scope of dissertation 9
Chapter 2. Experimental Techniques 12
2.1 Magneto-optic Kerr effect 12
2.2 Magnetization-induced second-harmonic-generation 16
2.2.1 Second-harmonic generation 16
2.2.2 Nonlinear magnetic susceptibility 17
2.3 Experimental setup 20
2.3.1 The ultrafast laser system 20
2.3.2 MOKE and MSHG experimental setup 23
ii
Chapter 3. Magnetoelectric coupling in BaTiO3/La0.67Sr0.33MnO3
heterostructure 25
3.1 Introduction 25
3.1.1 Motivation 26
3.1.2 Basic properties of La1-xSrxMnO3 27
3.1.3 Basic properties of BaTiO3 31
3.2 Samples and experiments 32
3.2.1 Sample preparation and characterization 32
3.2.2 MSHG and MOKE experiments 34
3.3 Results 36
3.3.1 Interfacial magnetic transition induced by
magnetoelectric effect 36
3.3.2 Voltage-dependent second-harmonic generation 39
3.3.3 Effect of La0.5Ca0.5MnO3 interlayer 41
3.3.4 Effect of dopants in BaTiO3 layer 46
3.4 Discussion 49
3.4.1 Possible mechanisms for interfacial
magnetoelectric effect 49
3.4.2 Microscopic mechanism for interfacial
magnetoelectric effect 56
Chapter 4. Magnetoelectric coupling in
SrTiO3/La0.5Ca0.5MnO3/La0.67Sr0.33MnO3 heterostructure 58
iii
4.1 Introduction 58
4.1.1 Basic properties of SrTiO3 58
4.1.2 Basic properties of La1-xCaxMnO3 59
4.2 Samples and experiments 62
4.3 Results and discussion 63
4.3.1 Interfacial magnetic transition induced by
magnetoelectric effect 63
4.3.2 Effects of dopants in SrTiO3 67
Chapter 5. Summary 72
Bibliography 75

iv
ACKNOWLEDGEMENTS
I am truly grateful to everyone who have directly or indirectly supported me during the completion of the work. First and Foremost, I wish to express my appreciation to Professor Gunter Luepke for his guidance and mentoring throughout my doctoral study at the College of William and Mary. He has always provided enthusiasm and perspective for the research process, and this work would not be possible without his support and guidance. I am particularly grateful to Professor Qi Li and her group member: Yuewei Yin. Thank you for their discussion about the multiferroic materials. I am indebted to them for providing a series of high-quality manganites samples and the characterization work. I also appreciate to their fruitful scientific discussion about the projects. I also thank my lab mates: Haowei Zhai, Xin Ma, Wei Zheng, Yichun Fan, Xiao Liu, Peiwen Liu. I appreciate their friendship and collective encouragement to finish this dissertation. In particular, I am thankful to Haowei Zhai for assistance in data collection and discussion. I have enjoyed every moment that we worked together. I express my appreciation to my doctoral dissertation defense committee members: Professor Michael Kelley of Applied Science, Professor Mark Hinders of Applied Science and Professor Qi Li of Physics (Pennsylvania State University). Thank you for their participation, comments and suggestion in the review of this dissertation. Finally, I wish to express my sincere gratitude to my family: Yuqi Fang, Jindi Cheng. Their truly and constant love and encouragement have always been the source of my strength and motivation. In particular, I appreciate my girl friend Xiaji Liu for her understanding and great support during my doctoral study.

v
This dissertation is dedicated to my family
vi
LIST OF TABLES
2.1 The Fresnel coefficients for p-polarized light incident on
the magnetic layer system with dielectric constant of .
and denote the incident and refracted angle in
the magnetic layer. The substitution and
are used. The Voigt coefficients ,
and are the polar, longitudinal and transverse
projection of the Voigt vector , respectively, which are
proportional to the magnitude of the magnetization
components along the corresponding directions. 15

vii
LIST OF FIGURES
1.1 Schematic spin tunneling process in MTJ 2 1.2 Principle of MRAM in the "cross point" architecture 3 1.3 Schematic of writing into MRAM cell with STT effect 5 2.1 Geometry of longitudinal, transverse, and polar Kerr effects 14 2.2 MSHG hysteresis loop measured with the sample LSMO/LCMO/STO. Red dash lines are two magnetization stages. 20 2.3 Sketch of the setup to measure the pulse duration 21 2.4 Schematic setup of compressor in the "RegA 9000" laser system. CM1, CM2, CM3 are compressor optics. DG is the diffraction grating. The position micrometer allows adjustment of the grating along the mount's horizontal axis. 22 2.5 Pulse duration adjusted by a) position micrometer (four different marked positions) and b) rotation screw (three rotations). Pulse duration is compressed and the pulse energy is increased with sharper peak. c) Pulse duration determined with sech^2 fitting for rotation 2. 23 2.6 Sketch of the MOKE & MSHG setup 24 3.1 Peroskite structure of compounds with chemical formula RxA1-xMO3 26
3.2 Schematic representation of the crystal-field splitting of the 3d orbital of Mn ion. a) corresponds to the cubic, while b) corresponds to the tetragonal configuration with lattice spacing c (between the layers) larger than a and b (in plane of the layer). 28

viii
3.3 Phase diagram of LSMO as concentration of Sr, courtesy of Y. Tokura and Y. Tomioka, prepared with data from reference 86 and 93. PM, PI, FM, FI and CI denote paramagnetic metal, paramagnetic insulator, FM metal, FM insulator, and spin-canted insulator states, respectively. TC is the Curie temperature and TN is the Néel temperature. 29 3.4 Idealized density of states N(E) for a half-metallic ferromagnetic. The Fermi energy is in the middle of a spin up band, but in between bands for the spin down band. 30 3.5 Illustration of the changes of BTO transforms from a paraelectric cubic into ferroelectric tetragonal phase with temperature. The permittivity curve represents data measured on a BTO ceramic. The arrows show possible directions of the spontaneous polarization. The unit cell is represented by a square in the cubic phase and rectangle in the tetragonal phase. 32 3.6 Ferroelectric polarization hysteresis loop of BTO from oxygen poor BTO/LSMO sample 33 3.7 Cross-sectional annular dark-field STEM image at the interface region of LSMO/BTO/LCMO/LSMO tunnel junction. The inset is the low-loss (EELS) map representing spectroscopic signatures of LSMO (blue), BTO (red) and LCMO (green) 34 3.8 Schematic of the optical measurements. MOKE measures the bulk magnetization of the LSMO film, while MSHG selectively probes the interface magnetization only. LSMO and ITO are two electrodes where a voltage is applied. 35 3.9 I-V curve of oxygen poor BTO/LSMO sample at 80 K. Inset is the semi-log current curve. 35 3.10 Schematic band diagram of the n-type Schottky contact. EC, EV, EF and Vbi denote conduction band, valence band, Fermi level and build-in potential, respectively. 36
ix
3.11 MSHG hysteresis loops at different voltage 37 3.12 Magnetic contrast A determined from MSHG measurements as a function of gate voltage Ug 38
3.13 MOKE hysteresis loops at different voltage 39 3.14 Magnetic contrast A determined from MOKE measurements as a function of gate voltage Ug 39
3.15 a) PinPout SHG signal measured at 80 K and the inset shows a comparison between the square-rooted PinPout
SHG curve (labeled in black and red) and the P-V loop (labeled in violet). b) SinS'out SHG signal measured at 80 K 41 3.16 I-V curve of oxygen-poor BTO/LCMO/LSMO sample. Inset represents I-V curve on log scale 42 3.17 Hysteresis loops with different voltage applied 42 3.18 Magnetic contrast as a function of gate voltage Ug 42 3.19 a) PinPout SHG signal and b) SinS'out signal as a function of gate voltage Ug 43
3.20 a) MOKE hysteresis loop of BTO/LCMO at 80K and b) Comparison of coercivities between MOKE and MSHG of BTO/LCMO/LSMO at 80 K 44 3.21 a) MSHG and b) MOKE hysteresis loops with different voltage applied 45 3.22 Magnetic contrast as a function of gate voltage Ug. 45 3.23 a) I-V curve, inset is semi-log curve. b) P-V curve 47 3.24 a) C-V curve; b) Carrier concentration calculated from C-V measurement 47 3.25 MSHG hysteresis loops at a series of voltage 48
x
3.26 MSHG magnetic contrast as a function of gate voltage Ug 48
3.27 SinS'out SHG as a function of gate voltage Ug 48
3.28 Capacitance as a function of gate Voltage Ug 52 3.29 Concentration of oxygen poor sample 53 3.30 Linear fitting to determine the build-in potential 54 3.31 Schematic model of spin alignment at BTO/LSMO interface. a) Below critical gate voltage Uc, majority spins (red arrows) of Mn3+ and Mn4+ ions are double-exchange coupled (right panel), leading to a ferromagnetic state of LSMO. b) Above Uc, The AFM super-exchange interaction of t2g electrons between neighboring Mn ions dominates, and the interfacial LSMO layer undergoes a FM-to-AFM phase transition. 55 3.32 Schematic band diagram of the n-type BTO/LSMO Schottky junction for Ug > Uc, depicting the electron current J-, ferroelectric polarization P, and considering an AFM- ordered LSMO interface layer and a half- metallic LSMO electrode with only spin-up states at the Fermi level EF. 57 4.1 Phase diagram of La1-xCaxMnO3, obtained using magnetization and resistivity data, reproduced from S.-W. Cheong and H. Y. Hwang. FM: ferromagnetic Metal, FI: Ferromagnetic Insulator, AF: Antiferromagnetism, CAF: Canted Antiferromagnetism and CO: Charge/Orbital Ordering. 61 4.2 a) C-type unite cell and b) E-type unit cell. c) The spin structure in plane at x = 1/2. Open can solid circle denote the spin up and down electrons, respectively. The white and gray squares denote the C- and E- type unit cells, respectively. At x = 1/2, C-type and E-type unit cells are equal. The thick blue and red lines indicate the zigzag FM path. 61
xi
4.3 Current-Voltage (I-V) curve shows diode effect. Inset is the semi-log curve 63 4.4 MSHG hysteresis loops at different voltage 64 4.5 Magnetic contrast A determined from MSHG measurements as a function of gate voltage Ug 64 4.6 MOKE hysteresis loops at different voltage 66 4.7 MOKE contrast A as a function of gate voltage Ug 66 4.8 a) PinPout and b) SinS'out SHG measured at 80K 67 4.9 Current-Voltage (I-V) curve shows diode effect. Inset is the semi-log curve. 69 4.10 MSHG hysteresis loops at different voltage 69 4.11 MSHG magnetic contrast A as a function of gate voltage Ug 70
4.12 MOKE hysteresis loops at different voltage 70 4.13 a) PinPout and b) SinS'out SHG measured at 80K 71
1
Chapter 1
Introduction
Electrons have charge and spin, which have been considered separately
until recently. In traditional electronic devices, electrical charges are moved by
an electric field to transport information and are stored in a capacitor to save it.
Increasing the integration density of electronic devices leads to faster
processing speed due to the shorter distance of the electron transport.
However, the following challenge emerges: the heat generated by the charging
and discharging process causes a high temperature, which can ruin the
function of a transistor as the integration density increases.
The spintronics technology offers the opportunity to solve the problem. It
is not based on the conduction by electrons or holes as in semiconductor
devices but relies on the different transport properties of the majority spin and
minority spin electrons.
1.1 Magnetic tunneling junction
The discovery in 1988 of giant magneto-resistance (GMR) on Fe/Cr
magnetic multilayers1 is considered the beginning of the new spin-based
electronics. The resistance is lowest when the magnetic moments in
ferromagnetic (FM) layers are aligned parallel and highest when aligned
anti-parallel. The GMR ratio is defined as:
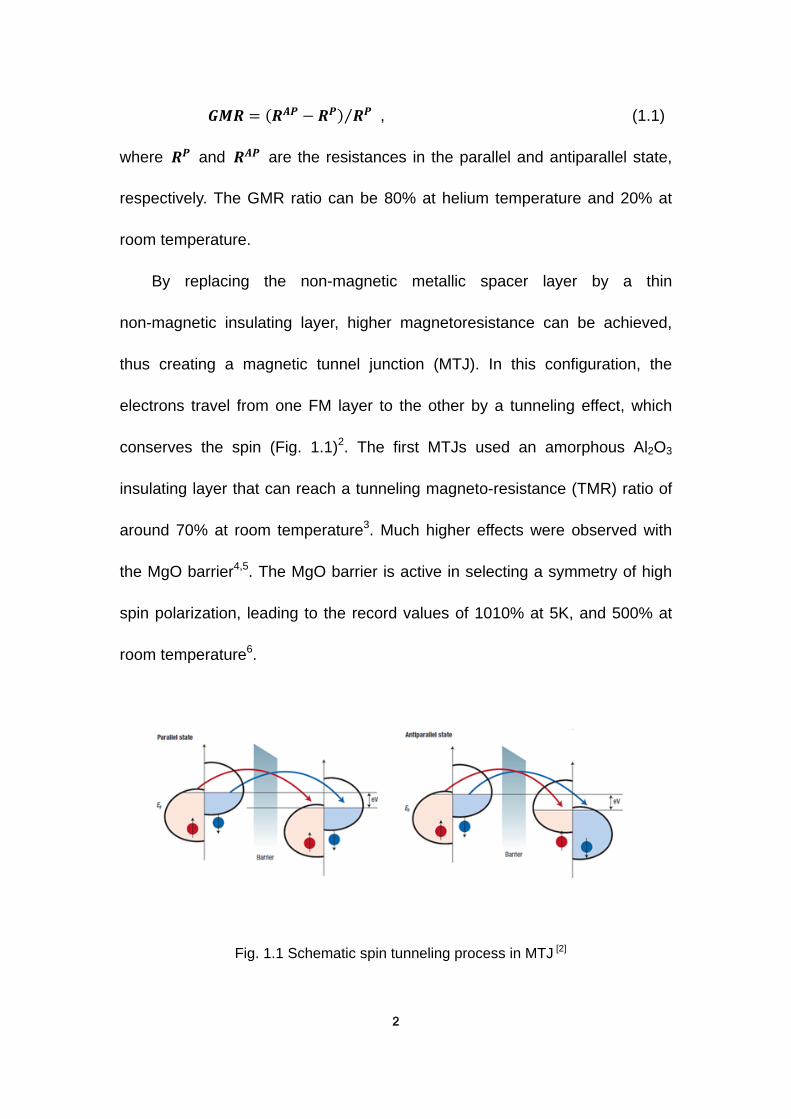
2
Fig. 1.1 Schematic spin tunneling process in MTJ [2]
𝑮𝑴𝑹 = (𝑹𝑨𝑷 − 𝑹𝑷) 𝑹𝑷⁄ , (1.1)
where 𝑹𝑷 and 𝑹𝑨𝑷 are the resistances in the parallel and antiparallel state,
respectively. The GMR ratio can be 80% at helium temperature and 20% at
room temperature.
By replacing the non-magnetic metallic spacer layer by a thin
non-magnetic insulating layer, higher magnetoresistance can be achieved,
thus creating a magnetic tunnel junction (MTJ). In this configuration, the
electrons travel from one FM layer to the other by a tunneling effect, which
conserves the spin (Fig. 1.1)2. The first MTJs used an amorphous Al2O3
insulating layer that can reach a tunneling magneto-resistance (TMR) ratio of
around 70% at room temperature3. Much higher effects were observed with
the MgO barrier4,5. The MgO barrier is active in selecting a symmetry of high
spin polarization, leading to the record values of 1010% at 5K, and 500% at
room temperature6.

3
Fig. 1.2 Principle of MRAM in the "cross point" architecture [2]
MTJ’s have been widely used in read-heads of hard-drive disks and
magnetic sensors. In addition, researchers have started to develop the
magnetic random access memory (MRAM)7. Figure 1.2 shows the principle of
MRAM in the "cross-point" architecture2. The binary information 0 and 1 is
recorded on the two opposite orientations of the magnetization of the free layer
along the easy axis.
1.2 Spin transfer torque
The use of a magnetic field to write the information is still considered a
limitation. The information is stored in the form of magnetization orientation of
a nanoparticle of volume. By reducing the volume, we need to increase the
writing field to overcome the thermal excitations. However, the power available

4
to create it decreases as the dimensions are downscaled.
Spin-transfer torque (STT) provides a new route for writing magnetic
information. The magnetization orientation of a free magnetic layer can be
controlled by direct transfer of spin-angular momentum from a spin-polarized
current. The first experimental demonstration of the low and high
magnetoresistance states by STT effect is carried out with a Co/Cu/Co
mulitlayer system in 20008. The polarized current flows through the FM layer
with different magnetization orientation. The s-d exchange coupling results in a
torque tending to align the magnetization of the layer towards the spin moment
of the incoming electrons. The amplitude of the torque per unit area is
proportional to the injected current density, so that the writing current
decreases proportionally to the cross-sectional area.
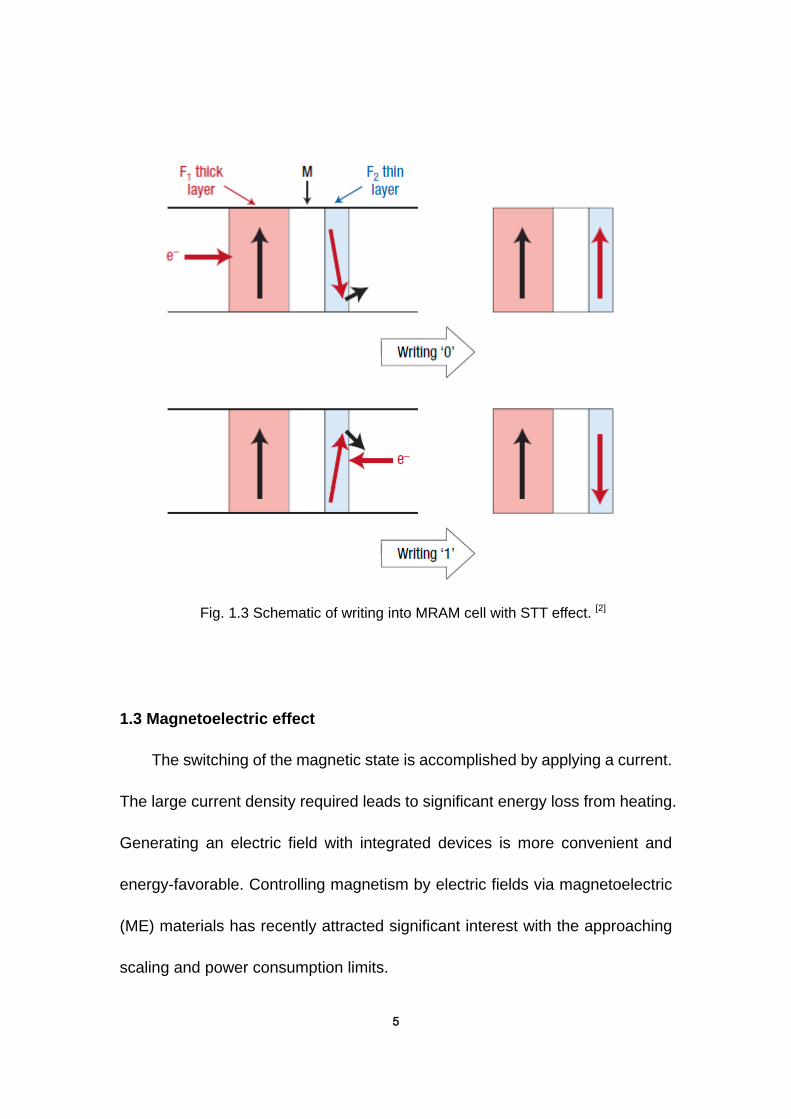
The principle of writing into MRAM cell with STT effect is shown in Fig 1.32.
Electrons flow from the thick FM layer F1 with certain magnetization orientation
to the thin free FM layer F2, and the magnetization of F2 would be favored
parallel to that of F1 with STT effect. When the electrons flow from the thin free
layer F2 to F1, a strong spin scattering process occurs at the thick layer. The
back-scattered electrons with antiparallel spin orientation apply a torque in
the thin layer to switch it antiparallel to that of F1. The dynamical behavior is
studied through a modified Landau-Lifshitz-Gilbert equation describing the
damped precession of magnetization with the effect of STT and thermal
excitation9.
5
1.3 Magnetoelectric effect
The switching of the magnetic state is accomplished by applying a current.
The large current density required leads to significant energy loss from heating.
Generating an electric field with integrated devices is more convenient and
energy-favorable. Controlling magnetism by electric fields via magnetoelectric
(ME) materials has recently attracted significant interest with the approaching
scaling and power consumption limits.
Fig. 1.3 Schematic of writing into MRAM cell with STT effect. [2]
6
1.3.1 Magnetoelectric effects on ferromagnetic metal
When a metal surface is exposed to an electric field, the induced surface
charge screens the electric field over a characteristic screening length of the
metal. In a FM metal, the screening charge is spin-dependent due to the
exchange splitting of the spin majority and spin minority density of states
(DOS)10. As a result, the surface magnetization changes with electric field. The
magnitude of the effect depends on the Fermi-level spin polarization of the
surface DOS, increasing with larger polarization up to the maximum 100
percent spin-polarized materials: half-metals11. The ME effect can be further
enhanced by using a ferroelectric (FE) material to form FM/FE interface. The
polarization charges at the interface in response to the electric field enhance
the spin-dependent screening.
In addition to the screening mechanism, the interface bonding change
during polarization reversal also plays an important role in ME effect at the
FM/FE interface12. Orbital hybridizations are altered with the change in atomic
displacement to affect the interface magnetic moments.
1.3.2 Magnetoelectric effect in multiferroic oxide heterostructures
Transition metal oxides (TMOs) are ideal candidates for the study of ME
coupling, as the strongly correlated d electrons constrained at a given lattice
site induce a local entanglement of the charge, spin and orbital degrees of
freedom13. The competition between different interactions in such strongly
7
correlated electron systems results in a complex phase diagram, which builds
a platform to manipulate the coupling between those order parameters. For
example, the magnetic superexchange interaction could be adjusted by the
polar bond-bending distortion between Mn and O ions in Sr1/2Ba1/2MnO3, which
causes large negative ME coupling14; ME coupling strength could also be
modulated by controlling the strain state (lattice order)15, Dzyaloshinskii-Moriya
interaction16,17, and Jahn-Teller distortion18. Despite of the profound physics in
such TMO systems, the obtained ME coupling in the bulk of complex
multiferroic oxides is weak19–21. The hopes of achieving practical devices
based on single-phase materials have been renewed recently by the discovery
of room-temperature ME effects in ferromagnetic multicomponent TMOs, such
as Sr3Co2Fe24O41 22, Sr3Co2Ti2Fe8O19
23, Aurivilius-phase oxides21,24,
[Pb(Zr0.53Ti0.47)O3]0.6-[Pb(Fe0.5Ta0.5)O3]0.4 solid solutions25,26, and epitaxial
ε-Fe2O3 27, Ga1-xFe1+xO3
28, and LuFeO3 29 thin films.
An alternative but challenging approach is the ME coupling across
interfaces of multifunctional oxide heterostructures consisting of a FE and a
FM component13,30–32, which could be amplified by a “bridge” between them,
such as FE/antiferromagnetic (AFM)/FM coupling in BiFeO3/La1-xSrxMO3
system33,34, strain state30,35,36, and charge transfer processes37,38. As a result,
some progress has been achieved in these multifunctional heterostructures
with the relative strong ME coupling at room temperature, like the
magnetization reversal triggered by an electric field39. The interfaces of TMO
8
heterostructures offer a unique and important experimental test-bed as spatial
symmetry is broken by the structure itself, and different phases could be
combined at the atomic-level40–43. Also, two-dimensionality usually enhances
the effects of electron correlations by reducing their kinetic energy.
Considering these features of oxide interfaces, many novel effects and
functions that cannot be attained in the bulk form might appear. As a result,
different symmetry constraints can be used to design structures exhibiting
phenomena not found in the bulk constituents. For example, at the domain
walls and structural interfaces, the emergent behavior with properties that
deviate significantly from the bulk appears in BiFeO3 44 and ErMnO3
45. Indeed,
theory has predicted the possibility of significant changes in the interfacial
magnetization and spin polarization in a ferromagnet in response to the
ferroelectric polarization state across the interface 11,12,37,46.
1.3.3 Magnetoelectric effect in spin transport
Electrical modulation of conductivity in multiferroic tunnel junctions
(MFTJs), in the configuration of a FE thin-film layer as the tunnel barrier
sandwiched between two ferromagnetic layers, has received significant
attention47–50. The key property is the tunnel electroresistance (TER) effect.
Polarization affects the interface transmission function by changing the
electrostatic potential at the interface, the interface bonding strength, and
strain associated with the piezoelectric response50. In the MFTJ, the TER and
9
tunnel magnetoresistance (TMR) effects coexist, making MFTJ a four-stage
resistance device where resistance can be switched by both electric and
magnetic fields. Recently, MFTJs consisting of BaTiO3 tunnel barriers and
La0.7Sr0.3MnO3 electrodes exhibit a TER of up to 10,000% by inserting a
nanometer-thick La0.5Ca0.5MnO3 interlayer 49.
1.4 Scope of dissertation
A fundamental understanding of the interface ME effect in multiferroic
oxide heterostructures is the major focus of this dissertation. Although the
interfacial ME behavior is to some extent studied by correlated electron and
spin transportation through the interface in magnetic tunneling junctions
(MTJs)51–53, direct characterization of interfacial spin states is still missing. The
resolution of most techniques to investigate magnetic states like SQUID can
only reach several nanometers, which is already way beyond the thickness of
the interface. Some others with higher surface sensitivity, such as
high-resolution transmission electron microscopy, require sample pretreatment
by ion milling or mechanical polishing which may cause an artificial effect on
the interface properties54–57. In contrast, optical second-harmonic generation
(SHG) is a convenient tool to study magnetic and charge states at buried
interfaces58–60, and it thus turns out to be suitable for investigating interfacial
ME coupling. In centrosymmetric materials, such as TMOs with perovskite
structure, SHG is allowed only at surfaces and interfaces that break the
10
inversion symmetry. Hence without modifying the sample, buried interfaces are
accessible by the SHG technique provided that they lie within the penetration
depth of light (~100 nm).
Chapter 2 introduces some basic experimental techniques to characterize
optically the bulk and interface properties. Magnetization-induced
second-harmonic generation (MSHG) is a nonlinear optical effect, which is
interface sensitive to selectively probe the interface magnetization.
Magneto-optic Kerr effect (MOKE) is used to probe the bulk property. The
experimental setup is also described.
Chapter 3 presents the ME coupling at the interface of the multiferroic
heterostructure BaTiO3 (BTO)/La0.67Sr0.33MnO3 (LSMO). By applying an
external electric field, an interface FM-AFM transition is observed at positive
voltage (applied to LSMO layer), which is attributed to ME coupling. Strain and
FE polarization mediated mechanisms are discussed, but they do not play an
important role for the observed effect. A new mechanism is proposed --
minority spin injection -- to modulate the interface magnetization. In brief, the
AFM superexchange interaction is strengthened and FM double-exchange
coupling is weakened with the injection of minority spins. Moreover, a high
voltage shift of the magnetic transition is observed by reducing the electron
carrier concentration of BTO.
Chapter 4 presents the study of a non-multiferroic heterostructure system
-- SrTiO3 (STO)/ La0.5Ca0.5MnO3 (LCMO)/La0.67Sr0.33MnO3 (LSMO) by replacing
11
the FE layer. The magnetization transition by ME coupling is also observed but
at negative voltage, in contrast to BTO/LSMO heterostructure. The STO layer
acts as a hole donating layer, and thus a negative voltage is required to lower
the hole doping level of LSMO and to stabilize the FM phase at the interface.
Moreover, an interface A-type AFM phase is also detected at high positive
voltage, i.e. high hole concentration in LSMO. The results of this dissertation
show that the interface magnetic phase of LSMO can be controlled by an
applied electric field through modulation of the hole doping level.
Chapter 5 provides the summary of this dissertation.
12
Chapter 2
Experimental Techniques
This chapter presents the optical characterization techniques which have
been widely used to study the magnetic properties of magnetic materials.
Section 2.1 introduces the magneto-optic Kerr effect (MOKE) and optical
geometries to measure the magnetization. Section 2.2 gives a basic
introduction to the surface- and interface-sensitive probing technique --
magnetization-induced second-harmonic generation (MSHG). The
experimental setup is described in section 2.3.
2.1 Magneto-optic Kerr effect
The magneto-optic Kerr effect was discovered by the Rev. John Kerr in
1877 when he was examining the polarization of the reflected light from the
polished electromagnet pole. This effect can be observed as the change in the
intensity and/or polarization state of the light reflected from a magnetic medium.
Magneto-optics is presently described in the context of either microscopic
quantum theory or macroscopic dielectric theory61,62.
Microscopically, the effect originates from the spin-orbit coupling between
the electrical field of the light and the electron spin, which gives rise to the
large Faraday rotation in the ferromagnetic materials with the imbalanced
population of spin-up and spin-down electrons. The electron seems as if it
13
moves through the electric field −𝛁𝑽 with momentum 𝐩��⃗ inside a medium
with spin-orbit coupling: (𝛁𝑽 × 𝐩��⃗ ) ∙ �⃗�, which connects the magnetic and optical
properties of a ferromagnet.
Macroscopic description of the magneto-optic effect is based on the
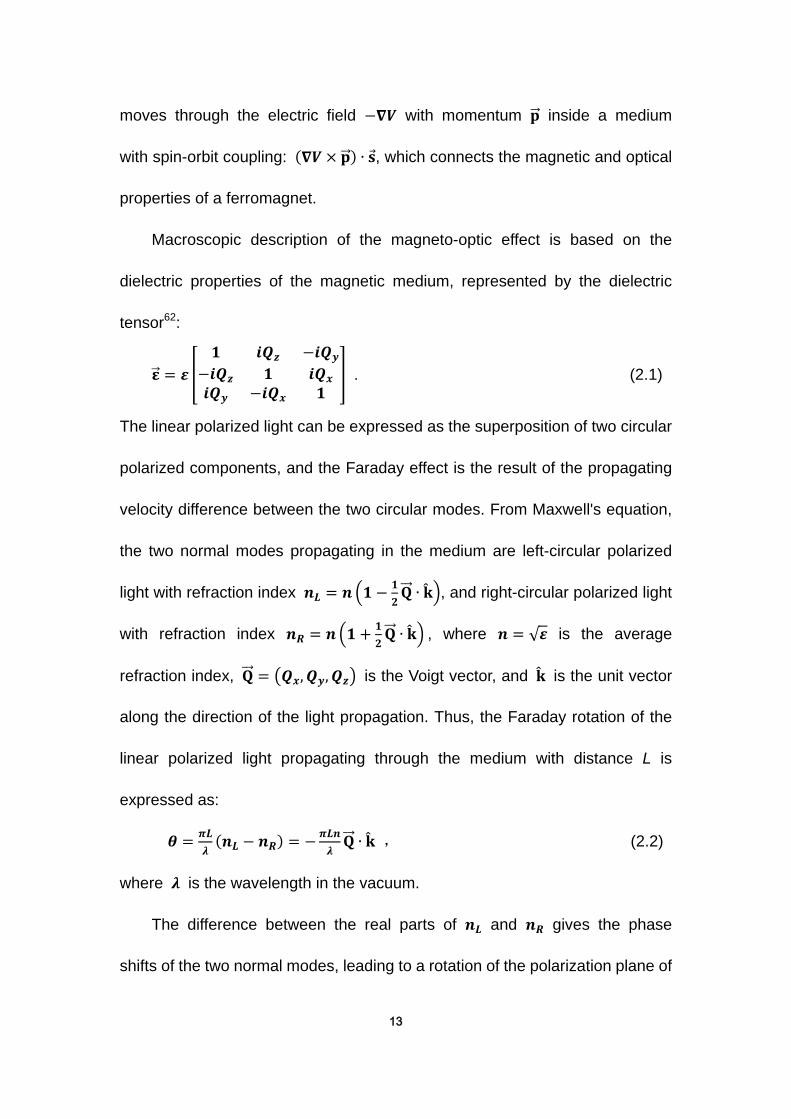
dielectric properties of the magnetic medium, represented by the dielectric
tensor62:
𝛆�⃗ = 𝜺 �𝟏 𝒊𝑸𝒛 −𝒊𝑸𝒚
−𝒊𝑸𝒛 𝟏 𝒊𝑸𝒙𝒊𝑸𝒚 −𝒊𝑸𝒙 𝟏
� . (2.1)
The linear polarized light can be expressed as the superposition of two circular
polarized components, and the Faraday effect is the result of the propagating
velocity difference between the two circular modes. From Maxwell's equation,
the two normal modes propagating in the medium are left-circular polarized
light with refraction index 𝒏𝑳 = 𝒏�𝟏 − 𝟏𝟐𝐐��⃗ ∙ �̂��, and right-circular polarized light
with refraction index 𝒏𝑹 = 𝒏�𝟏 + 𝟏𝟐𝐐��⃗ ∙ �̂�� , where 𝒏 = √𝜺 is the average
refraction index, 𝐐��⃗ = �𝑸𝒙,𝑸𝒚,𝑸𝒛� is the Voigt vector, and �̂� is the unit vector
along the direction of the light propagation. Thus, the Faraday rotation of the
linear polarized light propagating through the medium with distance L is
expressed as:
𝜽 = 𝝅𝑳𝝀
(𝒏𝑳 − 𝒏𝑹) = −𝝅𝑳𝒏𝝀𝐐��⃗ ∙ �̂� , (2.2)
where 𝝀 is the wavelength in the vacuum.
The difference between the real parts of 𝒏𝑳 and 𝒏𝑹 gives the phase
shifts of the two normal modes, leading to a rotation of the polarization plane of

14
the light. Meanwhile, the difference between the imaginary part of 𝒏𝑳 and 𝒏𝑹
results in the different absorption rates for the two normal modes, affecting the
ellipticity of the light.
The magneto-optic Kerr effect is categorized as three types according to
the geometry of the magnetization in relation to the plane of the incidence and
the plane of the sample: the longitudinal, transverse, and polar MOKE (Fig.
2.1). The longitudinal and transverse MOKE are observed at oblique angles of
incidence with the difference of the applied magnetic field orientation relative to
the optical plane of incidence. The applied field is parallel to the plane of the
sample in these two geometries and is oriented parallel to the plane of
incidence for longitudinal but perpendicular to the plane of the incidence in
transverse condition. The polar MOKE is carried out with the applied field
perpendicular to the sample surface, and often performed at normal incidence.
Fig. 2.1: Geometry of longitudinal, transverse, and polar Kerr effects.

15
The nature of the magneto-optic Kerr effect depends on the orientation of
the magnetization with respect to the plane of incidence and the plane of the
sample. In the longitudinal and polar conditions, the Kerr effect is shown as a
change in the polarization state of the reflected light. However, the Kerr effect
is seen as a change in the intensity of the reflected beam only (for p-polarized
incident light), and no ellipticity occurs for transverse MOKE . This is
summarized in Table 2.163.
Based on the Fresnel coefficients in Table 2.1, MOKE measurements
are usually performed with linear p-polarized light incident to the sample and
the s-component of the reflected beam is detected by the photodiode selected
by the analyzer for longitudinal and polar measurements, while for the
𝒓𝒑𝒑 𝒓𝒑𝒔
Polar √𝜺𝜶𝟏 − 𝜶𝟐√𝜺𝜶𝟏 + 𝜶𝟐
𝑸𝒑√𝜺𝜶𝟏
𝒊�√𝜺𝜶𝟏 + 𝜶𝟐��𝜶𝟏 + √𝜺𝜶𝟐�
Longitudinal √𝜺𝜶𝟏 − 𝜶𝟐√𝜺𝜶𝟏 + 𝜶𝟐
𝑸𝑳√𝜺𝜶𝟏 𝐭𝐚𝐧𝜽𝟏
𝒊�√𝜺𝜶𝟏 + 𝜶𝟐��𝜶𝟏 + √𝜺𝜶𝟐�
Transverse √𝜺𝜶𝟏�𝟏 − 𝑸𝑻
𝟐 𝜶𝟐𝟐⁄ − 𝜶𝟐 − 𝒊√𝜺𝑸𝑻𝜶𝟏 𝐭𝐚𝐧𝜽𝟐
√𝜺𝜶𝟏�𝟏 − 𝑸𝑻𝟐 𝜶𝟐𝟐⁄ + 𝜶𝟐 − 𝒊√𝜺𝑸𝑻𝜶𝟏 𝐭𝐚𝐧𝜽𝟐
0
Table 2.1: The Fresnel coefficients for p-polarized light incident on the magnetic
layer system with dielectric constant of 𝜺. 𝜽𝟏 and 𝜽𝟐 denote the incident and
refracted angle in the magnetic layer. The substitution 𝜶𝟏 = 𝐜𝐨𝐬 𝜽𝟏 and 𝜶𝟐 =𝐜𝐨𝐬 𝜽𝟐 are used. The Voigt coefficients 𝑸𝑷 ,𝑸𝑳 and 𝑸𝑻 are the polar, longitudinal
and transverse projection of the Voigt vector 𝐐��⃗ , respectively, which are proportional
to the magnitude of the magnetization components along the corresponding
directions. [63]
16
transverse measurements, we detect the p-component of the reflected beam.
2.2 Magnetization-induced second-harmonic-generation
2.2.1 Second-harmonic generation
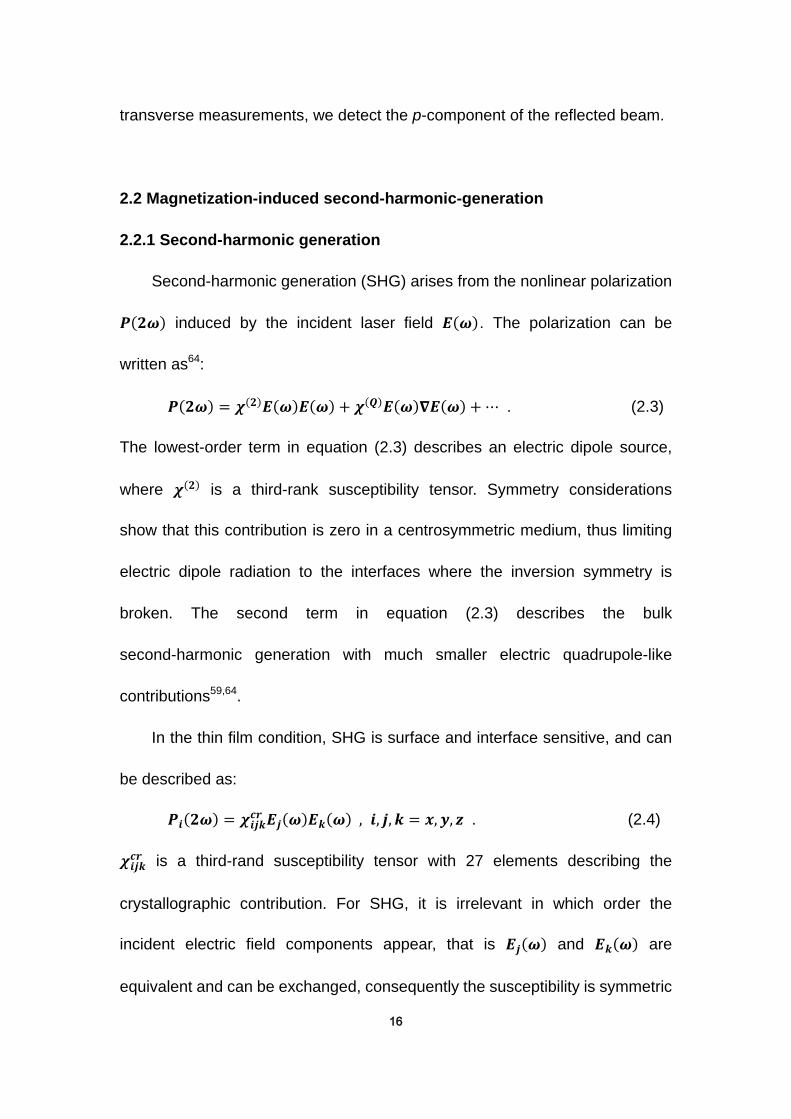
Second-harmonic generation (SHG) arises from the nonlinear polarization
𝑷(𝟐𝝎) induced by the incident laser field 𝑬(𝝎). The polarization can be
written as64:
𝑷(𝟐𝝎) = 𝝌(𝟐)𝑬(𝝎)𝑬(𝝎) + 𝝌(𝑸)𝑬(𝝎)𝛁𝑬(𝝎) + ⋯ . (2.3)
The lowest-order term in equation (2.3) describes an electric dipole source,
where 𝝌(𝟐) is a third-rank susceptibility tensor. Symmetry considerations
show that this contribution is zero in a centrosymmetric medium, thus limiting
electric dipole radiation to the interfaces where the inversion symmetry is
broken. The second term in equation (2.3) describes the bulk
second-harmonic generation with much smaller electric quadrupole-like
contributions59,64.
In the thin film condition, SHG is surface and interface sensitive, and can
be described as:
𝑷𝒊(𝟐𝝎) = 𝝌𝒊𝒋𝒌𝒄𝒓 𝑬𝒋(𝝎)𝑬𝒌(𝝎) , 𝒊, 𝒋,𝒌 = 𝒙,𝒚, 𝒛 . (2.4)
𝝌𝒊𝒋𝒌𝒄𝒓 is a third-rand susceptibility tensor with 27 elements describing the
crystallographic contribution. For SHG, it is irrelevant in which order the
incident electric field components appear, that is 𝑬𝒋(𝝎) and 𝑬𝒌(𝝎) are
equivalent and can be exchanged, consequently the susceptibility is symmetric
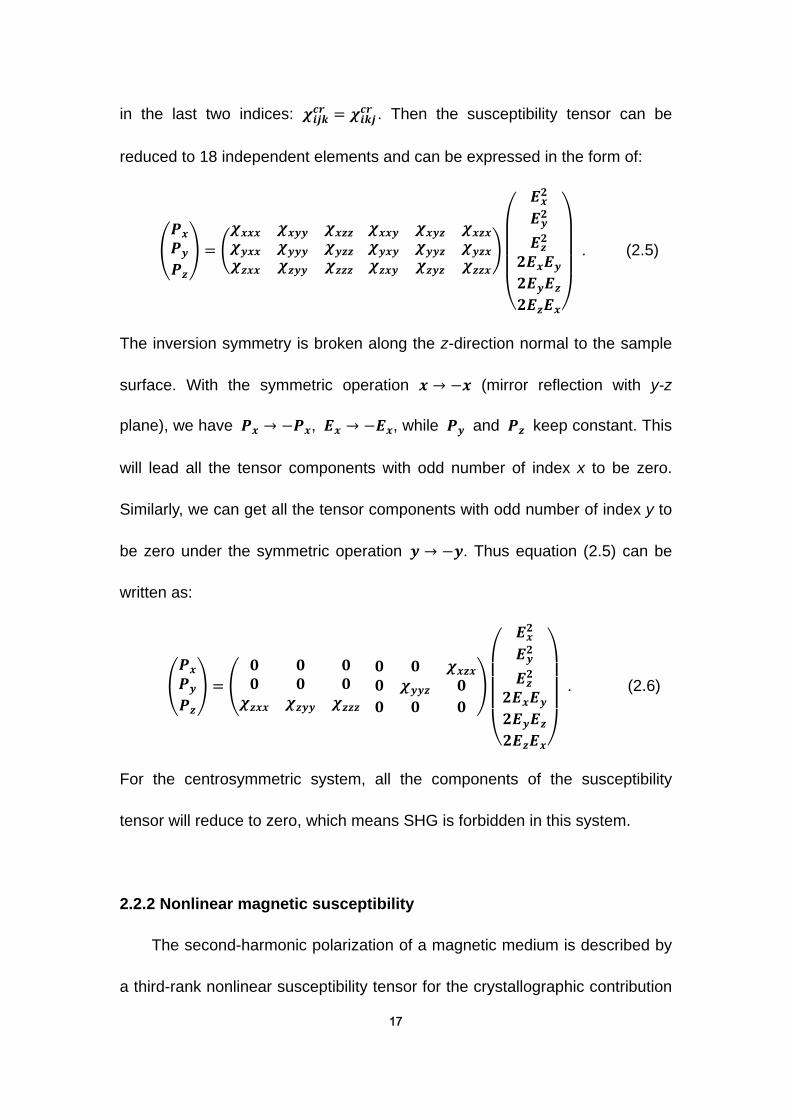
17
in the last two indices: 𝝌𝒊𝒋𝒌𝒄𝒓 = 𝝌𝒊𝒌𝒋𝒄𝒓 . Then the susceptibility tensor can be
reduced to 18 independent elements and can be expressed in the form of:
�𝑷𝒙𝑷𝒚𝑷𝒛� = �
𝝌𝒙𝒙𝒙 𝝌𝒙𝒚𝒚 𝝌𝒙𝒛𝒛𝝌𝒚𝒙𝒙 𝝌𝒚𝒚𝒚 𝝌𝒚𝒛𝒛𝝌𝒛𝒙𝒙 𝝌𝒛𝒚𝒚 𝝌𝒛𝒛𝒛
𝝌𝒙𝒙𝒚 𝝌𝒙𝒚𝒛 𝝌𝒙𝒛𝒙𝝌𝒚𝒙𝒚 𝝌𝒚𝒚𝒛 𝝌𝒚𝒛𝒙𝝌𝒛𝒙𝒚 𝝌𝒛𝒚𝒛 𝝌𝒛𝒛𝒙
�
⎝
⎜⎜⎜⎛
𝑬𝒙𝟐
𝑬𝒚𝟐
𝑬𝒛𝟐𝟐𝑬𝒙𝑬𝒚𝟐𝑬𝒚𝑬𝒛𝟐𝑬𝒛𝑬𝒙⎠
⎟⎟⎟⎞
. (2.5)
The inversion symmetry is broken along the z-direction normal to the sample
surface. With the symmetric operation 𝒙 → −𝒙 (mirror reflection with y-z
plane), we have 𝑷𝒙 → −𝑷𝒙, 𝑬𝒙 → −𝑬𝒙, while 𝑷𝒚 and 𝑷𝒛 keep constant. This
will lead all the tensor components with odd number of index x to be zero.
Similarly, we can get all the tensor components with odd number of index y to
be zero under the symmetric operation 𝒚 → −𝒚. Thus equation (2.5) can be
written as:
�𝑷𝒙𝑷𝒚𝑷𝒛� = �
𝟎 𝟎 𝟎𝟎 𝟎 𝟎
𝝌𝒛𝒙𝒙 𝝌𝒛𝒚𝒚 𝝌𝒛𝒛𝒛 𝟎 𝟎 𝝌𝒙𝒛𝒙𝟎 𝝌𝒚𝒚𝒛 𝟎𝟎 𝟎 𝟎
�
⎝
⎜⎜⎜⎛
𝑬𝒙𝟐
𝑬𝒚𝟐
𝑬𝒛𝟐𝟐𝑬𝒙𝑬𝒚𝟐𝑬𝒚𝑬𝒛𝟐𝑬𝒛𝑬𝒙⎠
⎟⎟⎟⎞
. (2.6)
For the centrosymmetric system, all the components of the susceptibility
tensor will reduce to zero, which means SHG is forbidden in this system.
2.2.2 Nonlinear magnetic susceptibility
The second-harmonic polarization of a magnetic medium is described by
a third-rank nonlinear susceptibility tensor for the crystallographic contribution

18
𝝌𝒊𝒋𝒌𝒄𝒓 and a fourth-rank axial tensor 𝝌𝒊𝒋𝒌𝒍𝒎 for the magnetization-induced part65.
In the bulk of the centrosymmetric medium, the electric dipole contribution is
forbidden. At the surface and interface, the inversion symmetry is broken,
leading to the surface and interface induced components. The presence of a
magnetization will not affect the inversion symmetry, but will introduce extra
nonzero surface tensor elements to modify the nonlinear susceptibility, which
will change sign when the orientation of the magnetization M is reversed. The
surface and interface can be simplified to one third-rank tensor with even and
odd components as:
𝑷𝒊𝑴𝒂𝒈(𝟐𝝎) = �𝝌𝒊𝒋𝒌+ (±𝑴) ± 𝝌𝒊𝒋𝒌− (±𝑴)�𝑬𝒋(𝝎)𝑬𝒌(𝝎) . (2.7)
The odd component 𝝌𝒊𝒋𝒌− (±𝑴) changes the sign with the magnetization
reversal and therefore contributes to the magnetic asymmetry in the MSHG
response.
The symmetry of the nonlinear susceptibility is determined by the
symmetry of the particular surface under consideration. The nonzero elements
of 𝝌 can be obtained under symmetry operations66:
𝝌𝒊𝒋𝒌(𝑴𝒍) = 𝚺𝚺𝚺𝑻𝒊𝒊′𝑻𝒋𝒋′𝑻𝒌𝒌′𝝌𝒊′𝒋′𝒌′ . (2.8)
where T is the transformation matrix for each symmetry operation. Take the
longitudinal configuration for example, from the mirror operation in the y-z
plane (𝒙 → −𝒙 ) with 𝑷𝒙𝑴𝒂𝒈 → −𝑷𝒙
𝑴𝒂𝒈, 𝑬𝒙 → −𝑬𝒙 and 𝑷𝒚
𝑴𝒂𝒈, 𝑷𝒚
𝑴𝒂𝒈and 𝑴𝒙
keeping constant, we can get all the components with odd number of index x
are equal to zero. By applying the mirror operation in the x-z plane (𝒚 → −𝒚)
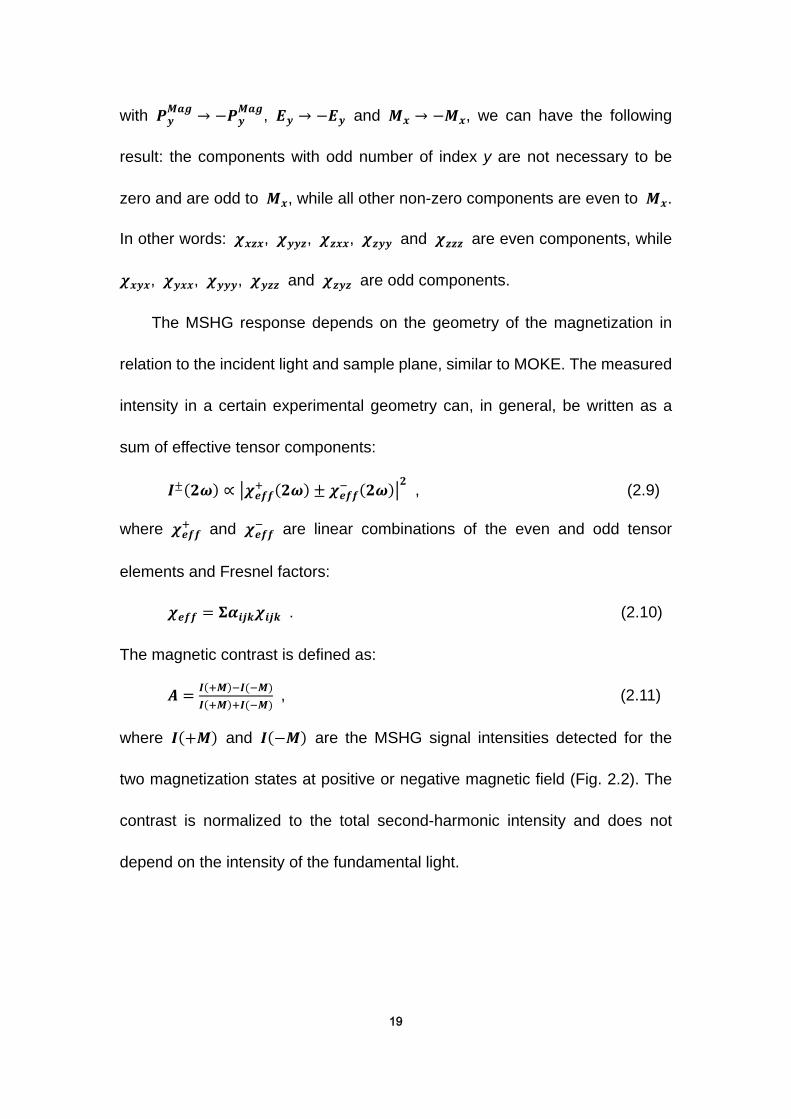
19
with 𝑷𝒚𝑴𝒂𝒈 → −𝑷𝒚
𝑴𝒂𝒈, 𝑬𝒚 → −𝑬𝒚 and 𝑴𝒙 → −𝑴𝒙, we can have the following
result: the components with odd number of index y are not necessary to be
zero and are odd to 𝑴𝒙, while all other non-zero components are even to 𝑴𝒙.
In other words: 𝝌𝒙𝒛𝒙, 𝝌𝒚𝒚𝒛, 𝝌𝒛𝒙𝒙, 𝝌𝒛𝒚𝒚 and 𝝌𝒛𝒛𝒛 are even components, while
𝝌𝒙𝒚𝒙, 𝝌𝒚𝒙𝒙, 𝝌𝒚𝒚𝒚, 𝝌𝒚𝒛𝒛 and 𝝌𝒛𝒚𝒛 are odd components.
The MSHG response depends on the geometry of the magnetization in
relation to the incident light and sample plane, similar to MOKE. The measured
intensity in a certain experimental geometry can, in general, be written as a
sum of effective tensor components:
𝑰±(𝟐𝝎) ∝ �𝝌𝒆𝒇𝒇+ (𝟐𝝎) ± 𝝌𝒆𝒇𝒇− (𝟐𝝎)�𝟐 , (2.9)
where 𝝌𝒆𝒇𝒇+ and 𝝌𝒆𝒇𝒇− are linear combinations of the even and odd tensor
elements and Fresnel factors:
𝝌𝒆𝒇𝒇 = 𝚺𝜶𝒊𝒋𝒌𝝌𝒊𝒋𝒌 . (2.10)
The magnetic contrast is defined as:
𝑨 = 𝑰(+𝑴)−𝑰(−𝑴)𝑰(+𝑴)+𝑰(−𝑴)
, (2.11)
where 𝑰(+𝑴) and 𝑰(−𝑴) are the MSHG signal intensities detected for the
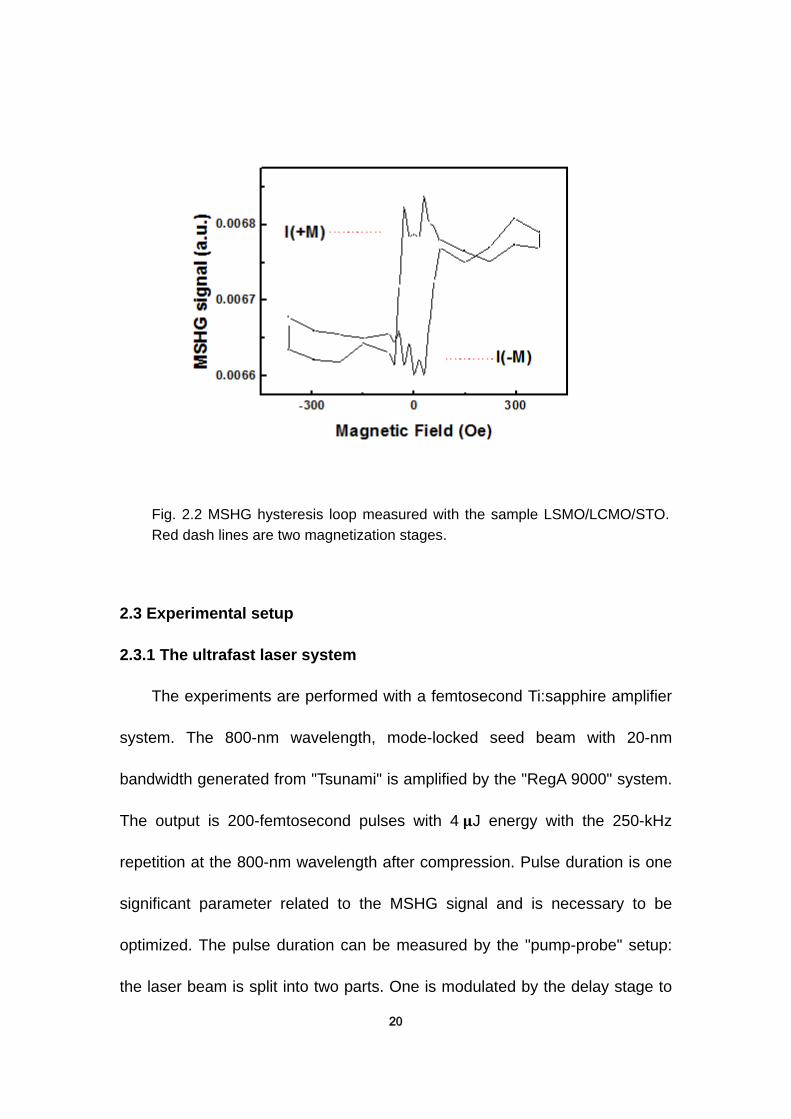
two magnetization states at positive or negative magnetic field (Fig. 2.2). The
contrast is normalized to the total second-harmonic intensity and does not
depend on the intensity of the fundamental light.
20
2.3 Experimental setup
2.3.1 The ultrafast laser system
The experiments are performed with a femtosecond Ti:sapphire amplifier
system. The 800-nm wavelength, mode-locked seed beam with 20-nm
bandwidth generated from "Tsunami" is amplified by the "RegA 9000" system.
The output is 200-femtosecond pulses with 4 𝛍J energy with the 250-kHz
repetition at the 800-nm wavelength after compression. Pulse duration is one
significant parameter related to the MSHG signal and is necessary to be
optimized. The pulse duration can be measured by the "pump-probe" setup:
the laser beam is split into two parts. One is modulated by the delay stage to
Fig. 2.2 MSHG hysteresis loop measured with the sample LSMO/LCMO/STO.
Red dash lines are two magnetization stages.
21
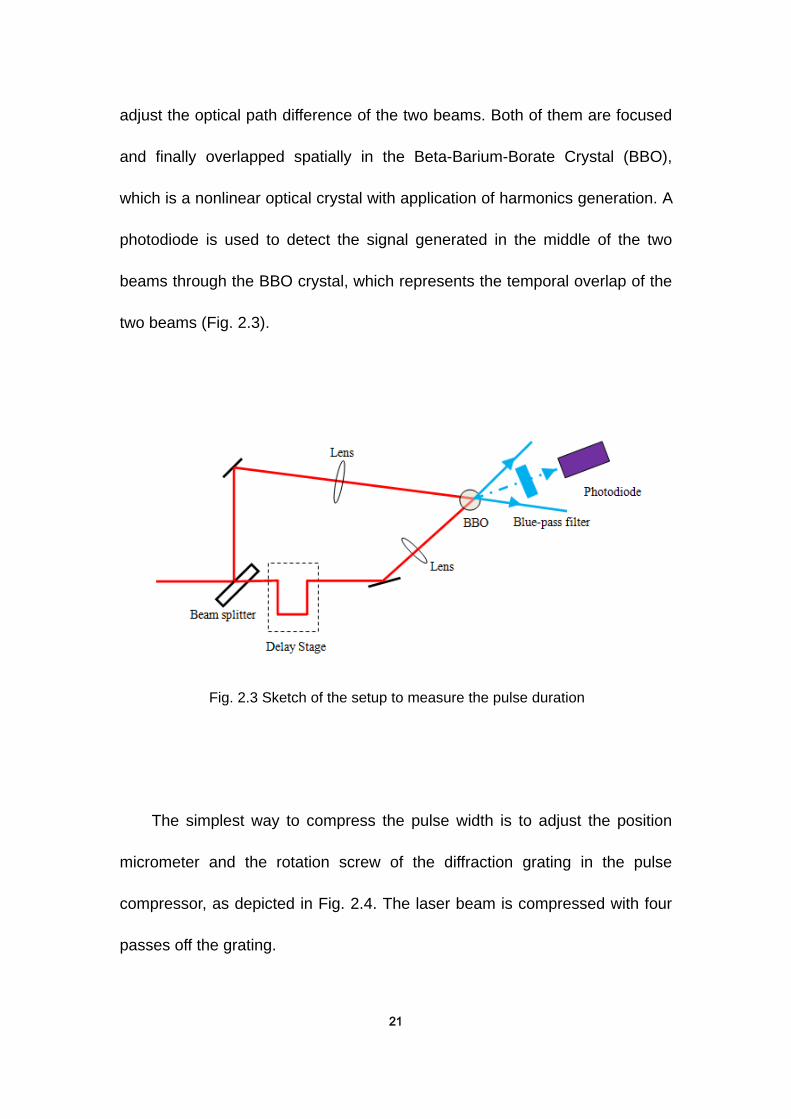
adjust the optical path difference of the two beams. Both of them are focused
and finally overlapped spatially in the Beta-Barium-Borate Crystal (BBO),
which is a nonlinear optical crystal with application of harmonics generation. A
photodiode is used to detect the signal generated in the middle of the two
beams through the BBO crystal, which represents the temporal overlap of the
two beams (Fig. 2.3).
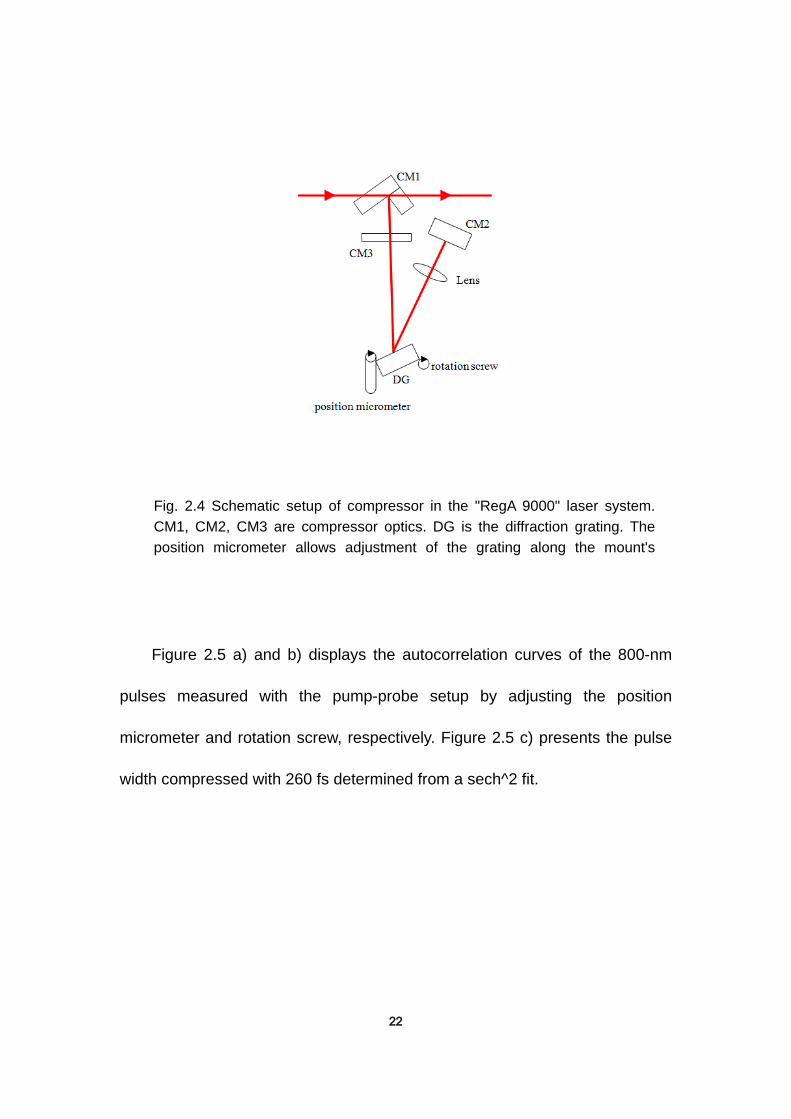
The simplest way to compress the pulse width is to adjust the position
micrometer and the rotation screw of the diffraction grating in the pulse
compressor, as depicted in Fig. 2.4. The laser beam is compressed with four
passes off the grating.
Fig. 2.3 Sketch of the setup to measure the pulse duration
22
Figure 2.5 a) and b) displays the autocorrelation curves of the 800-nm
pulses measured with the pump-probe setup by adjusting the position
micrometer and rotation screw, respectively. Figure 2.5 c) presents the pulse
width compressed with 260 fs determined from a sech^2 fit.
Fig. 2.4 Schematic setup of compressor in the "RegA 9000" laser system.
CM1, CM2, CM3 are compressor optics. DG is the diffraction grating. The
position micrometer allows adjustment of the grating along the mount's

23
2.3.2 MOKE and MSHG experimental setup
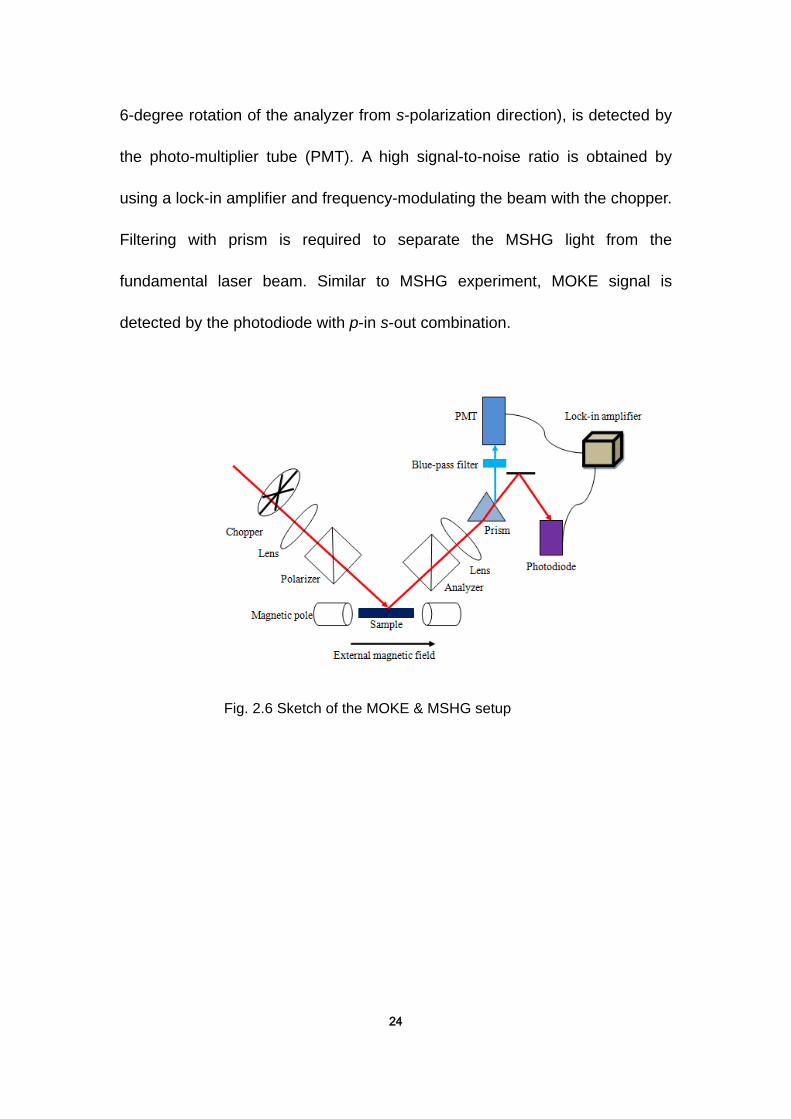
For MSHG experiment, the attenuated s-polarized beam (60 mW)
selected by the polarizer is focused and incident on to the sample at an angle
of 40 degree, as depicted in Fig. 2.6. The second-harmonic signal (400-nm
wavelength) is generated along the direction of the reflected beam. The
s-polarized component, in combination with a small p- component (around
Fig. 2.5 Pulse duration adjusted by a) position micrometer (four different marked
positions) and b) rotation screw (three rotations). Pulse duration is compressed
and the pulse energy is increased with sharper peak. c) Pulse duration
determined with sech^2 fitting for rotation 2.
24
6-degree rotation of the analyzer from s-polarization direction), is detected by
the photo-multiplier tube (PMT). A high signal-to-noise ratio is obtained by
using a lock-in amplifier and frequency-modulating the beam with the chopper.
Filtering with prism is required to separate the MSHG light from the
fundamental laser beam. Similar to MSHG experiment, MOKE signal is
detected by the photodiode with p-in s-out combination.
Fig. 2.6 Sketch of the MOKE & MSHG setup
25
Chapter 3
Magnetoelectric coupling in BaTiO3/La0.67Sr0.33MnO3
heterostructure
3.1 Introduction
Engineered thin-film heterostructures designed for electrical control of
magnetic properties, the so-called magnetoelectric (ME) interfaces, present a
novel route towards using the spin degree of freedom in electronic devices67,68.
Transition Metal Oxides (TMOs) are promising candidates for those
multifunctional devices, due to their strong correlated electron system with
coupled charge69, spin70 and orbital71 degrees of freedom. TMOs with the
perovskite structure have a long history of research and have been known as
materials with a variety of interesting properties, such as dielectric, magnetic,
optical and transport properties40,72. The interfaces of TMO heterostructures
have the genuine property of breaking space inversion symmetry, and thus
offer a unique and important test-bed to promote new phases and properties
that can be controlled at atomic precision, such as conducting electron gases69,
superconductivity73 or electric polarization dependent spin transfer49,74. In
recent years, there is enormous interest in the study of manganites, which are
members of a broader set of compounds with strong correlated electrons. The
RxA1-xMnO3 series form a perovskite structure, where rare earth R3+ and
alkaline earth A2+ cations occupy the corner of the cubic sites, while
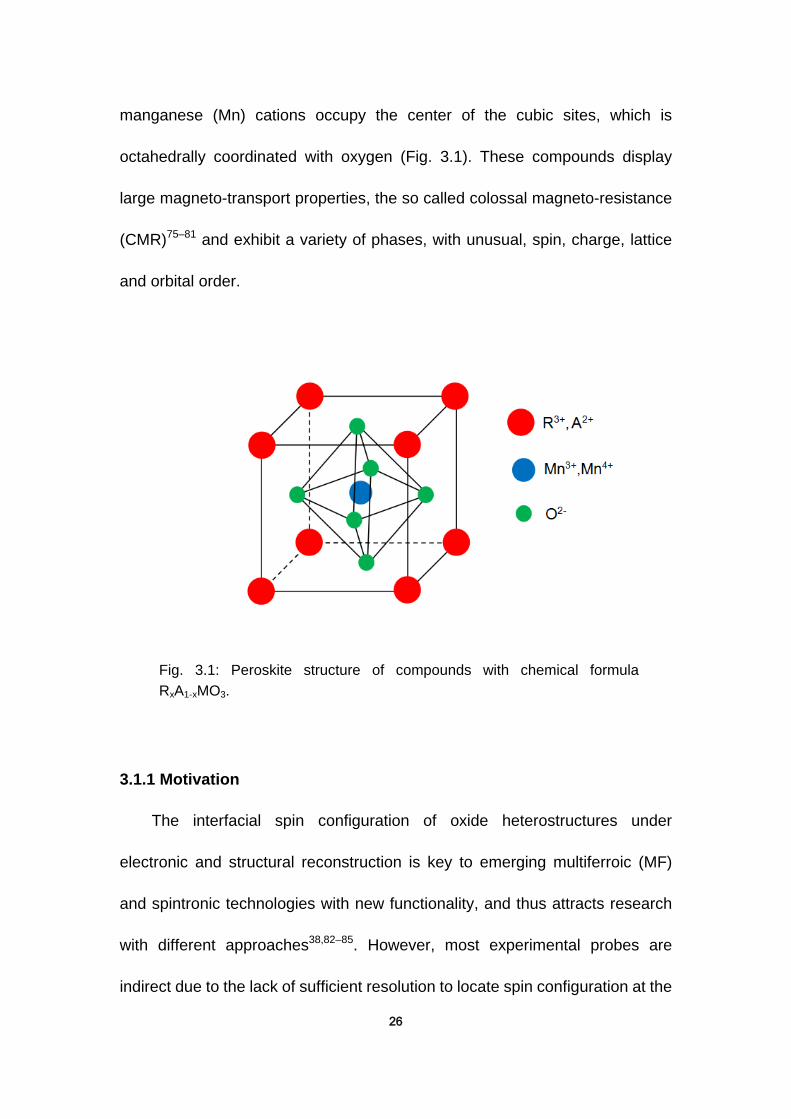
26
Fig. 3.1: Peroskite structure of compounds with chemical formula
RxA1-xMO3.
manganese (Mn) cations occupy the center of the cubic sites, which is
octahedrally coordinated with oxygen (Fig. 3.1). These compounds display
large magneto-transport properties, the so called colossal magneto-resistance
(CMR)75–81 and exhibit a variety of phases, with unusual, spin, charge, lattice
and orbital order.
3.1.1 Motivation
The interfacial spin configuration of oxide heterostructures under
electronic and structural reconstruction is key to emerging multiferroic (MF)
and spintronic technologies with new functionality, and thus attracts research
with different approaches38,82–85. However, most experimental probes are
indirect due to the lack of sufficient resolution to locate spin configuration at the
27
atomic scale. In this chapter, we use magnetization-induced second-harmonic
generation (MSHG) to directly detect the interfacial magnetization controlled
by the electric field with a series of BaTiO3 (BTO)/La0.67Sr0.33MnO3 (LSMO)
samples.
3.1.2 Basic properties of La1-xSrxMnO3
The manganite La1-xSrxMnO3 has received much attention in the past
decade. This material has a large Curie temperature, as high as 370 K at
intermediate hole doping86, and is widely considered as a representative of the
"large-bandwidth"87 family.
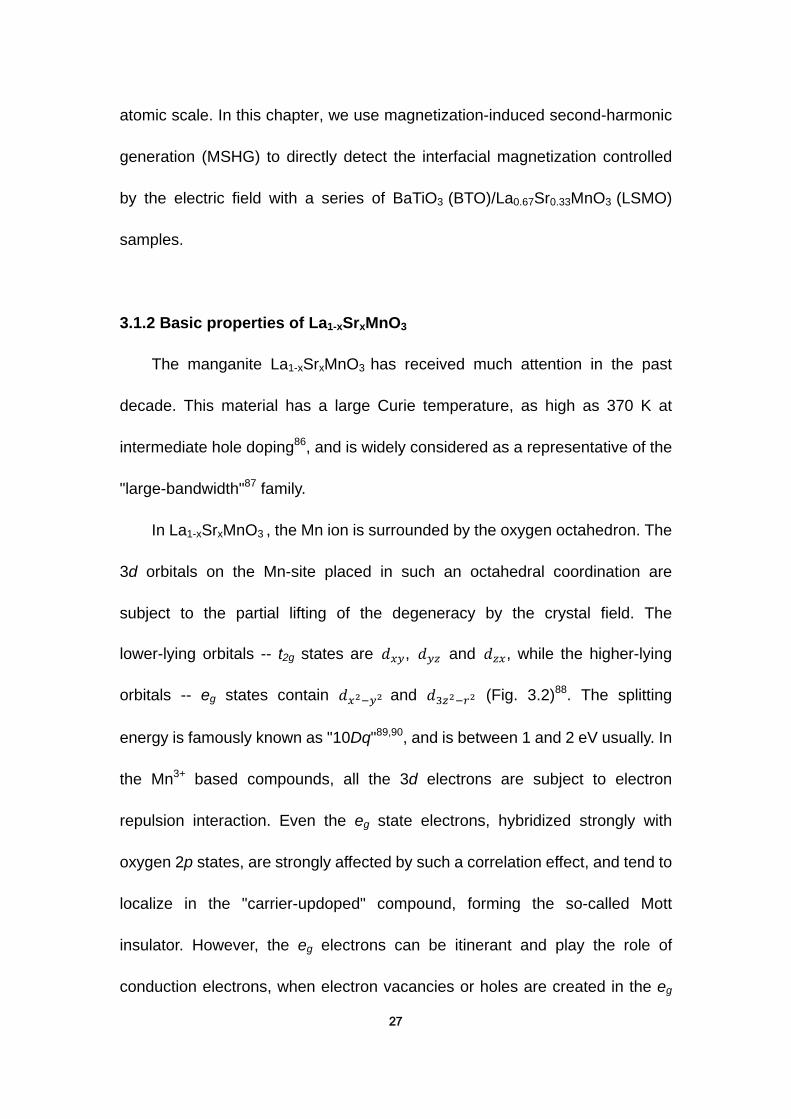
In La1-xSrxMnO3 , the Mn ion is surrounded by the oxygen octahedron. The
3d orbitals on the Mn-site placed in such an octahedral coordination are
subject to the partial lifting of the degeneracy by the crystal field. The
lower-lying orbitals -- t2g states are 𝑑𝑥𝑦, 𝑑𝑦𝑧 and 𝑑𝑧𝑥, while the higher-lying
orbitals -- eg states contain 𝑑𝑥2−𝑦2 and 𝑑3𝑧2−𝑟2 (Fig. 3.2)88. The splitting
energy is famously known as "10Dq"89,90, and is between 1 and 2 eV usually. In
the Mn3+ based compounds, all the 3d electrons are subject to electron
repulsion interaction. Even the eg state electrons, hybridized strongly with
oxygen 2p states, are strongly affected by such a correlation effect, and tend to
localize in the "carrier-updoped" compound, forming the so-called Mott
insulator. However, the eg electrons can be itinerant and play the role of
conduction electrons, when electron vacancies or holes are created in the eg
28
Fig. 3.2 Schematic representation of the crystal-field splitting of the 3d
orbital of Mn ion. a) corresponds to the cubic, while b) corresponds to
the tetragonal configuration with lattice spacing c (between the layers)
larger than a and b (in plane of the layer). [88]
orbital states. This hole-doping procedure leads to the creation of Mn4+ ions.
The transfer of electrons between two nearby Mn ions via the oxygen 2p orbital
is known as double-exchange coupling in favor of ferromagnetic (FM)
interaction91. The t2g electrons, less hybridized with oxygen 2p states and
stabilized by the crystal field splitting, are always localized by the strong
correlation effect.
The important consequence of the apparent separation of the 3d orbital
states is the effective strong coupling between the eg conduction electron spins
and t2g localized electron spins. This on-site ferromagnetic coupling JH is
described as Hund's rule (Fig. 3.2)88.
29
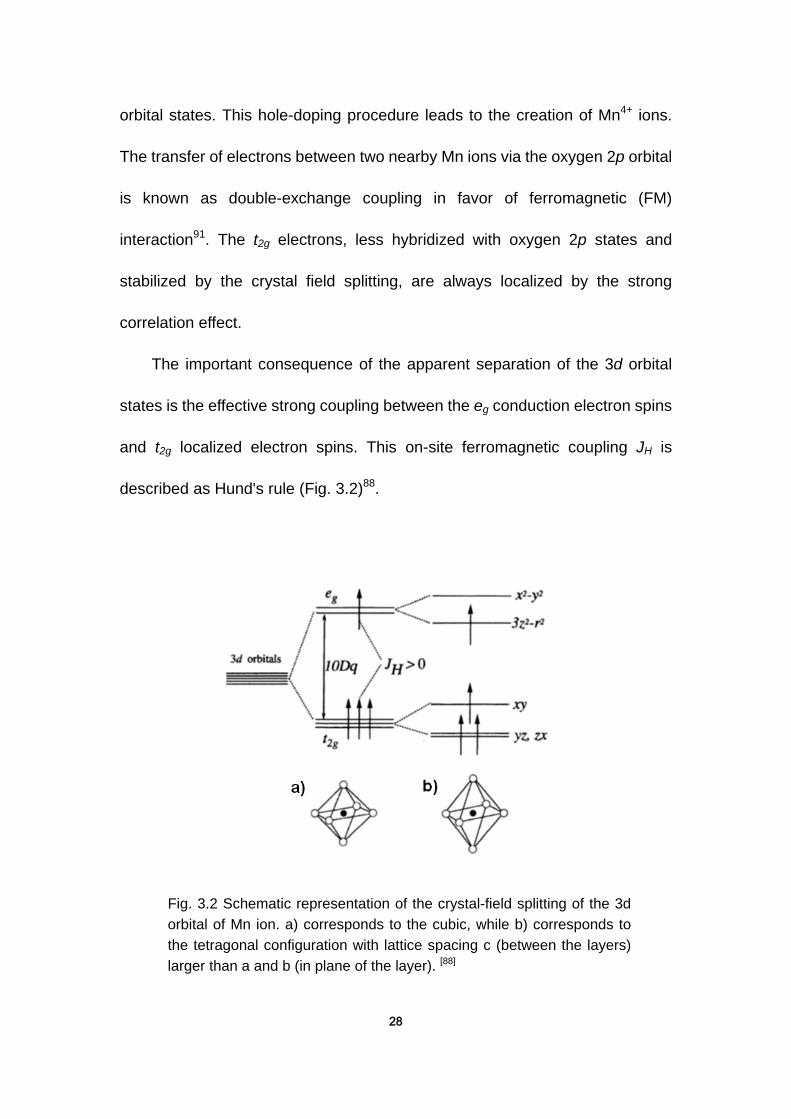
Fig. 3.3 Phase diagram of LSMO as concentration of Sr, courtesy of Y. Tokura
and Y. Tomioka, prepared with data from reference 86 and 93. PM, PI, FM, FI
and CI denote paramagnetic metal, paramagnetic insulator, FM metal, FM
insulator, and spin-canted insulator states, respectively. TC is the Curie
temperature and TN is the Néel temperature. [92]
The manganite LSMO exhibits a variety of phases (Fig. 3.3)86,92,93. In
the range from x ~ 0.16 to close to x ~ 0.5, the system at low temperature is in
the FM state and exhibits metallic behavior mostly due to the double-exchange
coupling. At large hole density, an antiferromagnetic (AFM) state is stabilized
with A-type ordering. This state is actually FM-ordered within the x-y planes,
and AFM-ordered only between planes. Within each plane, the orbital 𝑑𝑥2−𝑦2
is lower in energy, producing a state with a uniform orbital order94. The FM
state of LSMO is intrinsically interesting due to the CMR phenomenon
mentioned above and half-metallic property95.

30
Fig. 3.4 Idealized density of states N(E) for a half-metallic
ferromagnetic. The Fermi energy is in the middle of a spin up band, but
in between bands for the spin down band. [94]
Half-metallic ferromagnets are systems where the spins of the electrons
at the Fermi level have a particular direction: here, the spin-up electrons have
a partially occupied band, while the electrons with opposite spin direction --
spin down, occupy filled bands separated from the unoccupied ones by a gap
(Fig. 3.4)94. Thus, half-metallic ferromagnets exhibit the coexistence of metallic
behavior for spin-up electrons and insulating behavior for spin-down electrons.
The electronic density of state (DOS) is completely spin-polarized at the Fermi
level. It has 100% spin polarization for the conduction electrons
theoretically96–98, and thus offers potential technological applications such as
single-spin electron source, and high-efficiency magnetic sensors.
31
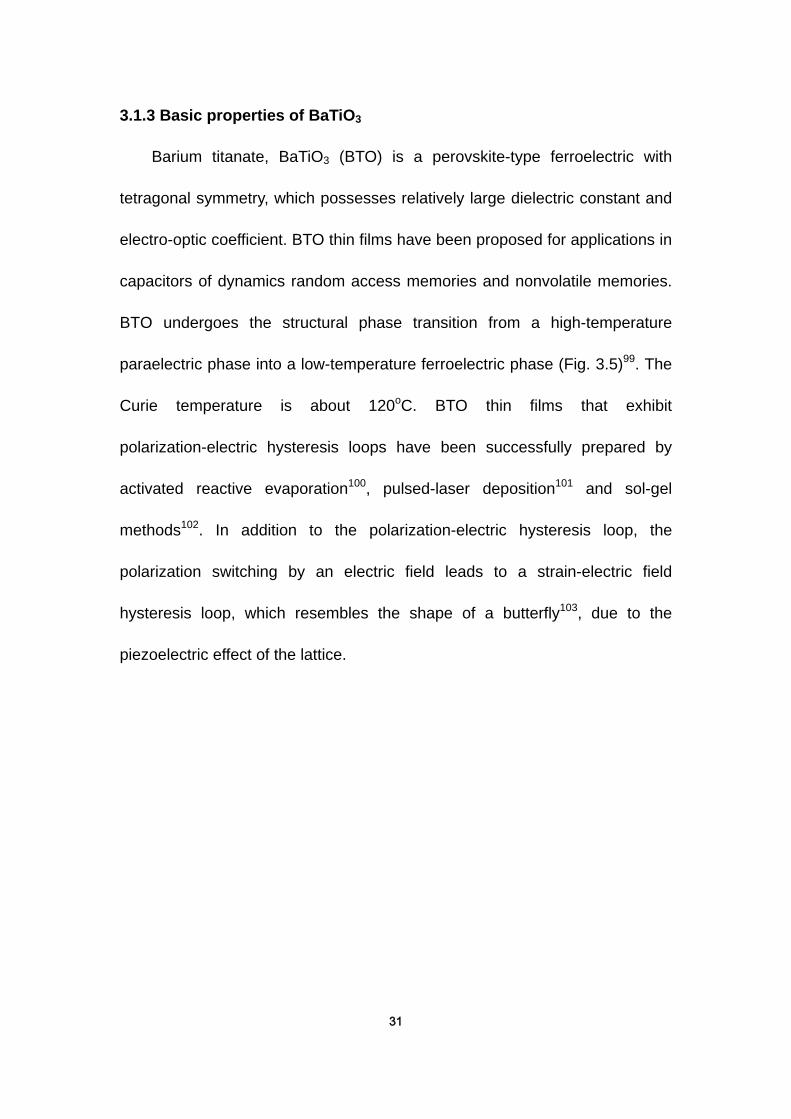
3.1.3 Basic properties of BaTiO3
Barium titanate, BaTiO3 (BTO) is a perovskite-type ferroelectric with
tetragonal symmetry, which possesses relatively large dielectric constant and
electro-optic coefficient. BTO thin films have been proposed for applications in
capacitors of dynamics random access memories and nonvolatile memories.
BTO undergoes the structural phase transition from a high-temperature
paraelectric phase into a low-temperature ferroelectric phase (Fig. 3.5)99. The
Curie temperature is about 120oC. BTO thin films that exhibit
polarization-electric hysteresis loops have been successfully prepared by
activated reactive evaporation100, pulsed-laser deposition101 and sol-gel
methods102. In addition to the polarization-electric hysteresis loop, the
polarization switching by an electric field leads to a strain-electric field
hysteresis loop, which resembles the shape of a butterfly103, due to the
piezoelectric effect of the lattice.
32
Fig. 3.5 Illustration of the changes of BTO transforms from a paraelectric cubic
into ferroelectric tetragonal phase with temperature. The permittivity curve
represents data measured on a BTO ceramic. The arrows show possible
directions of the spontaneous polarization. The unit cell is represented by a
square in the cubic phase and rectangle in the tetragonal phase. [99]
3.2 Samples and experiments
3.2.1 Sample preparation and characterization
The BTO (200 nm)/LSMO (50 nm) oxide heterostructures were grown on
SrTiO3 (001) substrates by using a multi-target pulsed-laser deposition system
(KrF excimer laser 248 nm). The BTO (200 nm)/ LSMO (50 nm) epitaxial
bilayer was deposited at a temperature of 750 oC in flowing oxygen of 300
mtorr pressure and cooled down in the same oxygen pressure (oxygen poor
condition). The indium-tin-oxide (ITO) (50 nm) layer was deposited in situ at
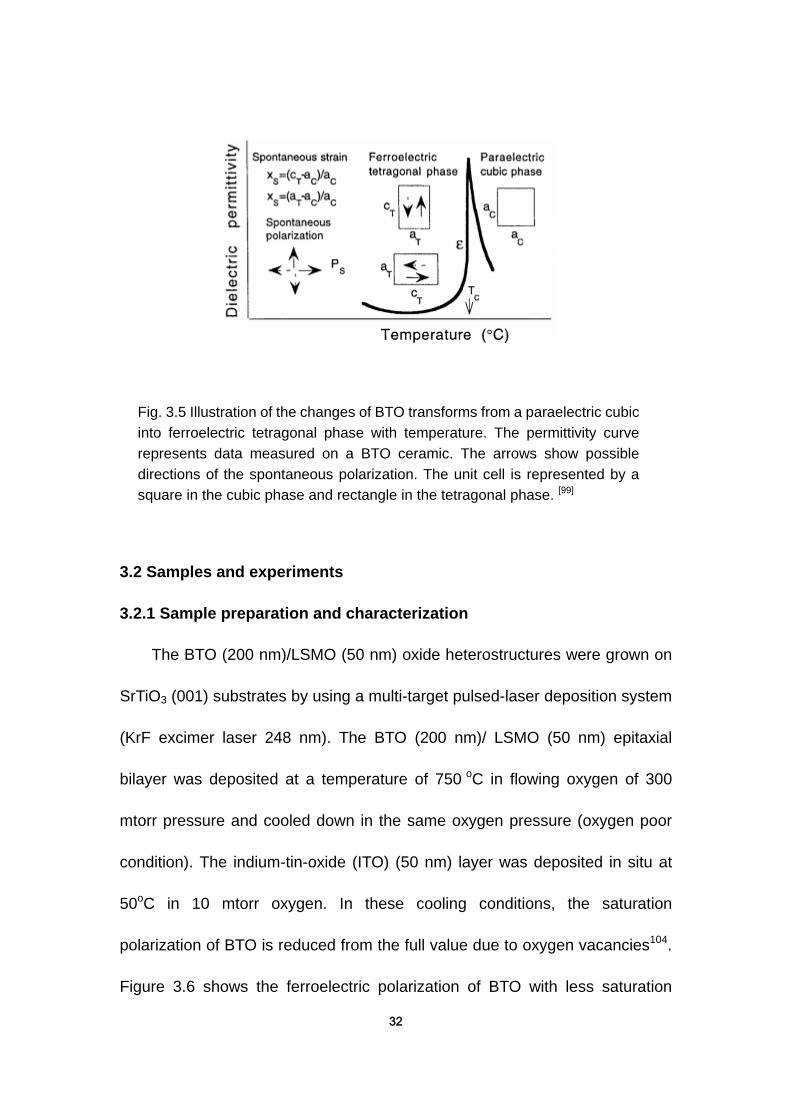
50oC in 10 mtorr oxygen. In these cooling conditions, the saturation
polarization of BTO is reduced from the full value due to oxygen vacancies104.
Figure 3.6 shows the ferroelectric polarization of BTO with less saturation
33
Fig. 3.6 Ferroelectric polarization hysteresis loop of BTO from oxygen
poor BTO/LSMO sample.
value around 10 𝜇𝐶 𝑐𝑚2⁄ as compared to the theoretical value 26
𝜇𝐶 𝑐𝑚2⁄ .105,106 A series of samples was fabricated, including inserting a 1-nm
thick La0.5Ca0.5MnO3 (LCMO) layer between BTO/LSMO and changing the
oxygen vacancy concentration of BTO by in-situ annealing the sample in 600
mtorr O2 at 450 oC for 0.5 hour, making it O2 richer than previous ones. The
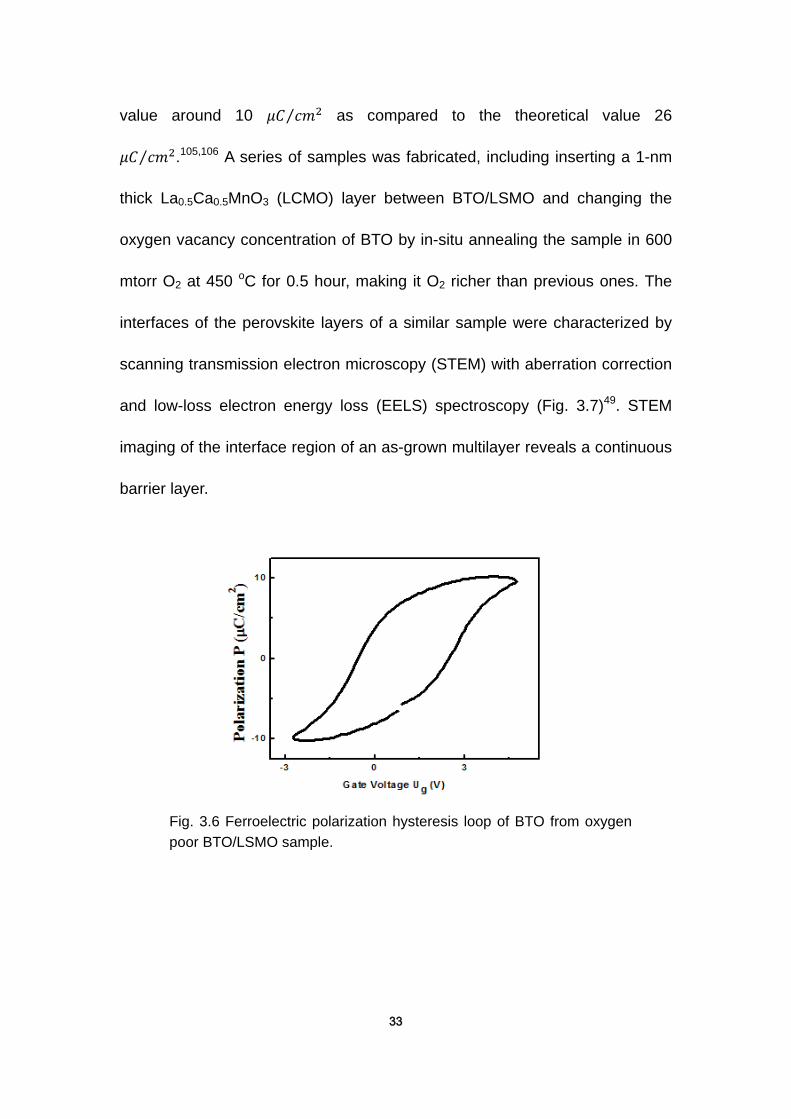
interfaces of the perovskite layers of a similar sample were characterized by
scanning transmission electron microscopy (STEM) with aberration correction
and low-loss electron energy loss (EELS) spectroscopy (Fig. 3.7)49. STEM
imaging of the interface region of an as-grown multilayer reveals a continuous
barrier layer.
34
Fig. 3.7 Cross-sectional annular dark-field STEM image at the interface
region of LSMO/BTO/LCMO/LSMO tunnel junction. The inset is the
low-loss (EELS) map representing spectroscopic signatures of LSMO
(blue), BTO (red) and LCMO (green). [49]
3.2.2 MSHG and MOKE experiments
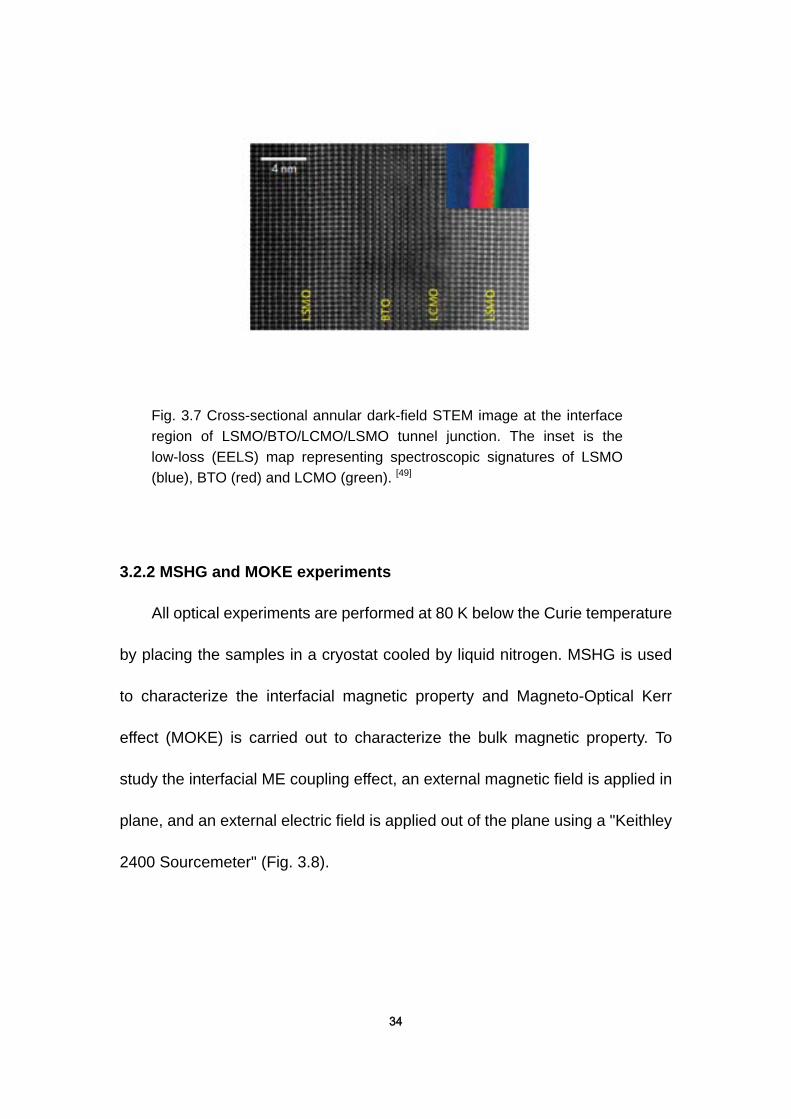
All optical experiments are performed at 80 K below the Curie temperature
by placing the samples in a cryostat cooled by liquid nitrogen. MSHG is used
to characterize the interfacial magnetic property and Magneto-Optical Kerr
effect (MOKE) is carried out to characterize the bulk magnetic property. To
study the interfacial ME coupling effect, an external magnetic field is applied in
plane, and an external electric field is applied out of the plane using a "Keithley
2400 Sourcemeter" (Fig. 3.8).
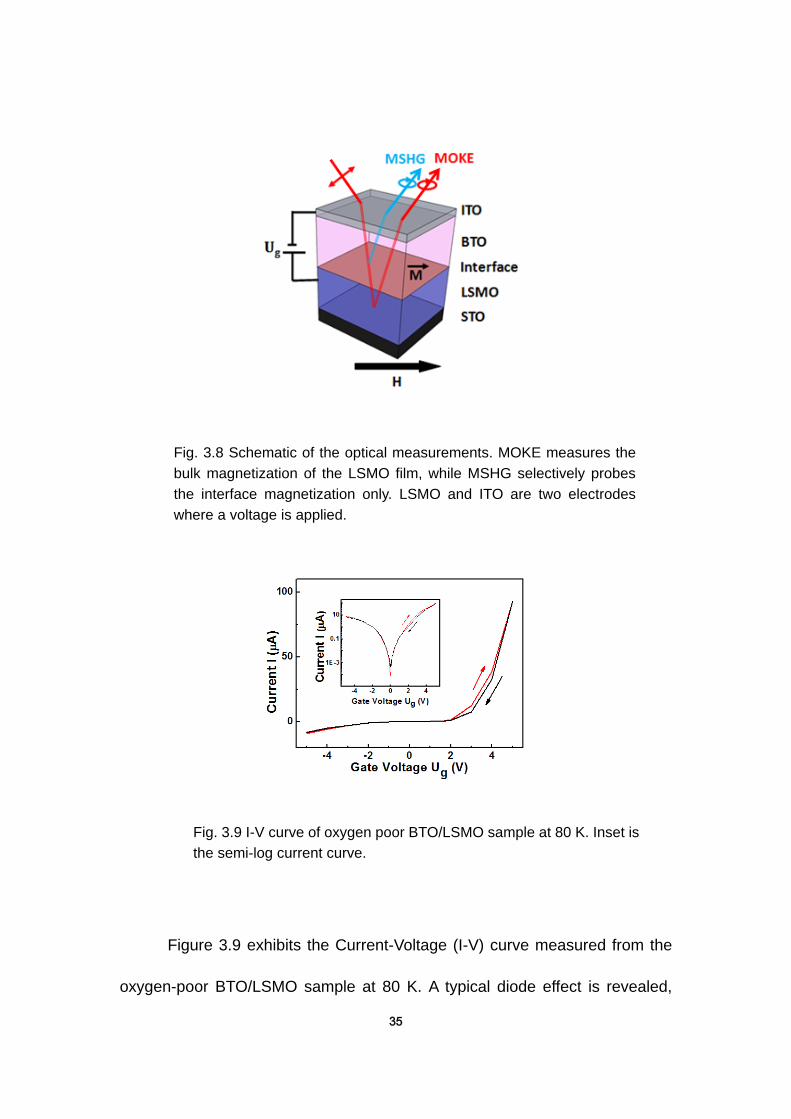
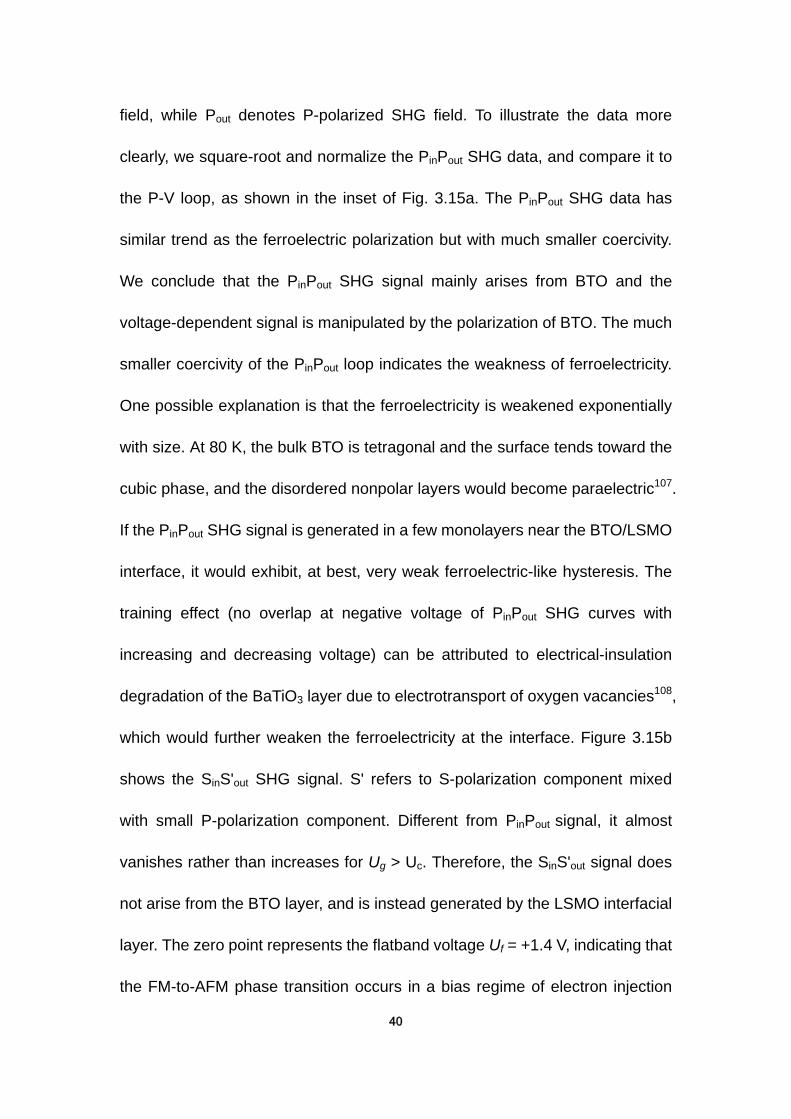
35
Fig. 3.9 I-V curve of oxygen poor BTO/LSMO sample at 80 K. Inset is
the semi-log current curve.
Figure 3.9 exhibits the Current-Voltage (I-V) curve measured from the
oxygen-poor BTO/LSMO sample at 80 K. A typical diode effect is revealed,
Fig. 3.8 Schematic of the optical measurements. MOKE measures the
bulk magnetization of the LSMO film, while MSHG selectively probes
the interface magnetization only. LSMO and ITO are two electrodes
where a voltage is applied.

36
Fig. 3.10 Schematic band diagram of the n-type Schottky contact. EC,
EV, EF and Vbi denote conduction band, valence band, Fermi level and
build-in potential, respectively.
indicating that a Schottky contact is formed at the BTO/LSMO interface (Fig.
3.10). The oxygen vacancies introduced by the oxygen-poor growth process
make the BTO n-type. The electron depletion (or accumulation) with the
applied field will play an important role in the interfacial ME effect.
3.3 Results
3.3.1 Interfacial magnetic transition induced by magnetoelectric effect
MSHG is used to selectively probe the interface of oxygen-poor BTO
(200 nm)/LSMO (50 nm) sample. Figure 3.11 shows the voltage dependent
MSHG hysteresis loops varying from -4V to +4V. When the gate voltage Ug is
below a critical voltage Uc = +1V, MSHG hysteresis loops are observed.
However, they vanish at higher positive voltage. To illustrate the phenomenon

37
Fig. 3.11 MSHG hysteresis loops at different voltage.
in detail, the MSHG contrast A is calculated for each loop and the
voltage-dependent contrast curve is displayed in Fig. 3.12 (red curve). For Ug
< Uc (+1 V), the interfacial LSMO is in the FM state since the magnetic contrast
is obvious. Above Uc the magnetic contrast A suddenly vanishes. A reversible
transition is observed by varying the gate voltage from +4V back to initial value
of -4V (Fig. 3.12 black curve). We attribute this sudden, reversible FM-to-AFM
phase transition to an interface ME effect.

38
Fig. 3.12 Magnetic contrast A determined from MSHG measurements
as a function of gate voltage Ug.
MOKE experiments are also performed to detect the bulk property of
LSMO. Figure 3.13 displays the MOKE hysteresis loops at different voltage.
MOKE contrast A as a function of gate voltage Ug is shown in Fig. 3.14. The
MOKE loops remain constant over the whole voltage range. Also, the contrast
A does not show much change. This demonstrates that the ME coupling has
no effect on the bulk magnetic property, and that it constitutes an interfacial
effect.

39
Fig. 3.13 MOKE hysteresis loops at different voltage
Fig. 3.14 Magnetic contrast A determined from MOKE measurements
as a function of gate voltage Ug.
3.3.2 Voltage-dependent second-harmonic generation
Furthermore, SHG as a function of gate voltage is measured. Figure 3.15a
exhibits the PinPout SHG intensity. Pin refers to P-polarized fundamental electric
40
field, while Pout denotes P-polarized SHG field. To illustrate the data more
clearly, we square-root and normalize the PinPout SHG data, and compare it to
the P-V loop, as shown in the inset of Fig. 3.15a. The PinPout SHG data has
similar trend as the ferroelectric polarization but with much smaller coercivity.
We conclude that the PinPout SHG signal mainly arises from BTO and the
voltage-dependent signal is manipulated by the polarization of BTO. The much
smaller coercivity of the PinPout loop indicates the weakness of ferroelectricity.
One possible explanation is that the ferroelectricity is weakened exponentially
with size. At 80 K, the bulk BTO is tetragonal and the surface tends toward the
cubic phase, and the disordered nonpolar layers would become paraelectric107.
If the PinPout SHG signal is generated in a few monolayers near the BTO/LSMO
interface, it would exhibit, at best, very weak ferroelectric-like hysteresis. The
training effect (no overlap at negative voltage of PinPout SHG curves with
increasing and decreasing voltage) can be attributed to electrical-insulation
degradation of the BaTiO3 layer due to electrotransport of oxygen vacancies108,
which would further weaken the ferroelectricity at the interface. Figure 3.15b
shows the SinS'out SHG signal. S' refers to S-polarization component mixed
with small P-polarization component. Different from PinPout signal, it almost
vanishes rather than increases for Ug > Uc. Therefore, the SinS'out signal does
not arise from the BTO layer, and is instead generated by the LSMO interfacial
layer. The zero point represents the flatband voltage Uf = +1.4 V, indicating that
the FM-to-AFM phase transition occurs in a bias regime of electron injection
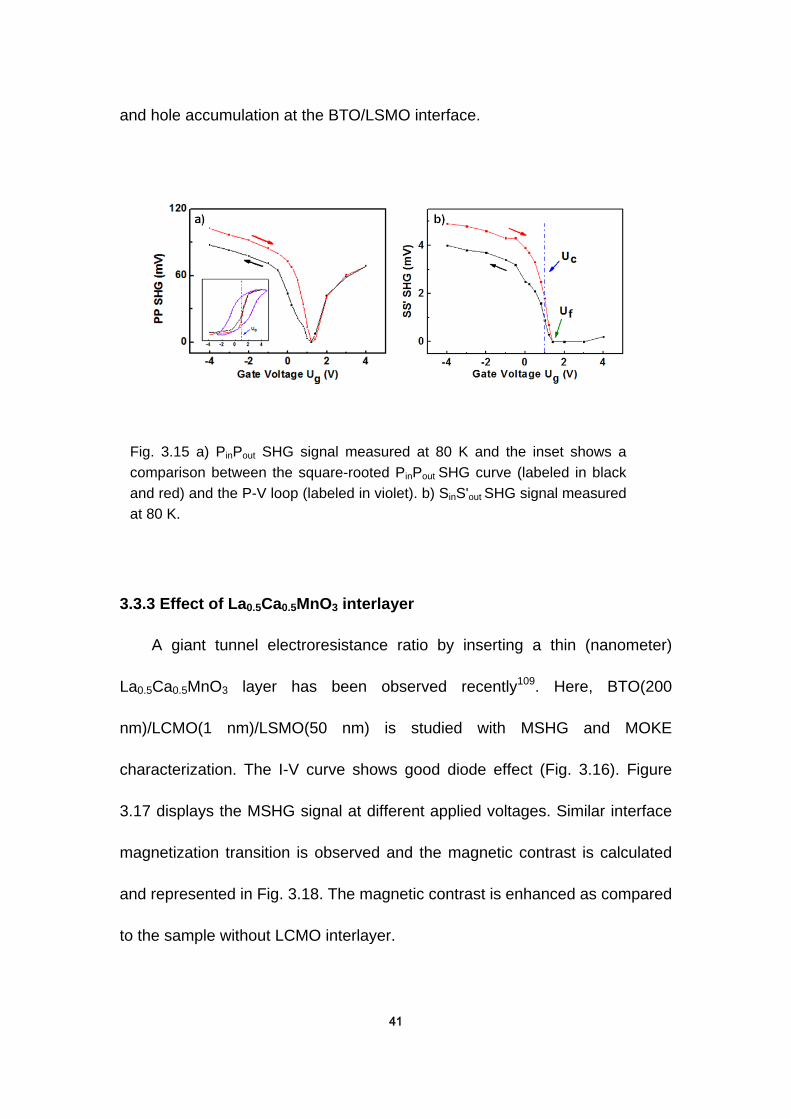
41
and hole accumulation at the BTO/LSMO interface.
3.3.3 Effect of La0.5Ca0.5MnO3 interlayer
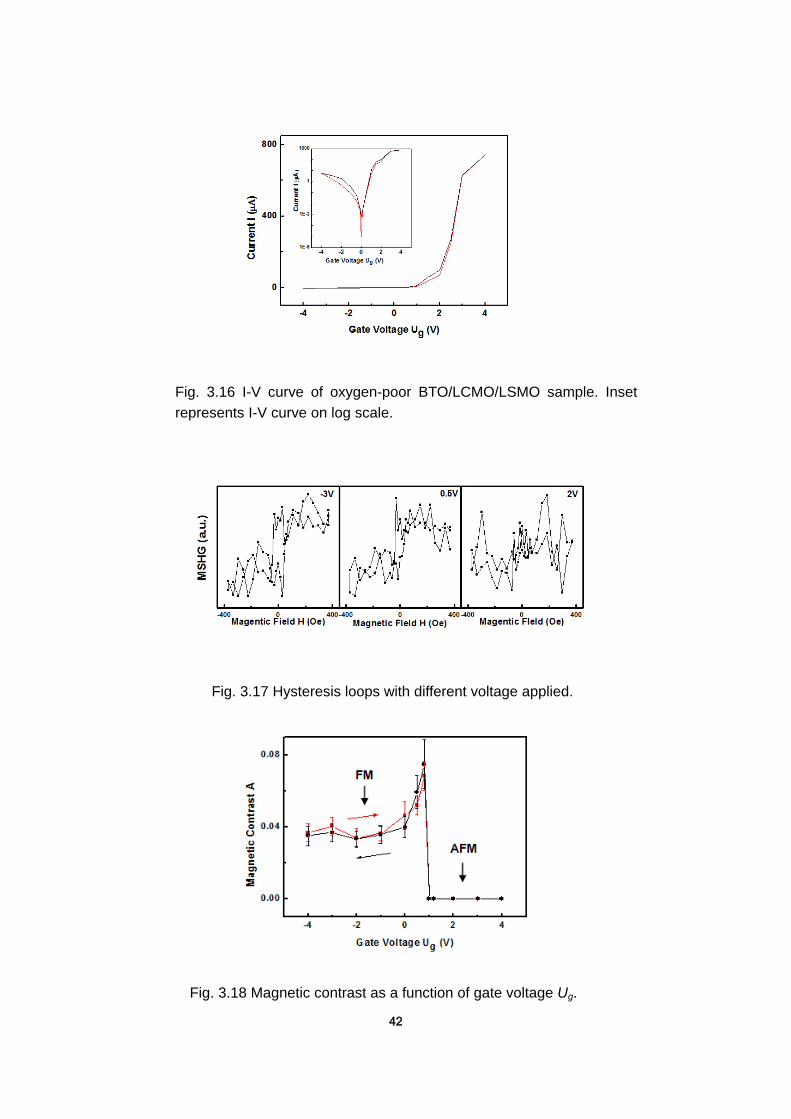
A giant tunnel electroresistance ratio by inserting a thin (nanometer)
La0.5Ca0.5MnO3 layer has been observed recently109. Here, BTO(200
nm)/LCMO(1 nm)/LSMO(50 nm) is studied with MSHG and MOKE
characterization. The I-V curve shows good diode effect (Fig. 3.16). Figure
3.17 displays the MSHG signal at different applied voltages. Similar interface
magnetization transition is observed and the magnetic contrast is calculated
and represented in Fig. 3.18. The magnetic contrast is enhanced as compared
to the sample without LCMO interlayer.
Fig. 3.15 a) PinPout SHG signal measured at 80 K and the inset shows a
comparison between the square-rooted PinPout SHG curve (labeled in black
and red) and the P-V loop (labeled in violet). b) SinS'out SHG signal measured
at 80 K.
42
Fig. 3.16 I-V curve of oxygen-poor BTO/LCMO/LSMO sample. Inset
represents I-V curve on log scale.
Fig. 3.17 Hysteresis loops with different voltage applied.
Fig. 3.18 Magnetic contrast as a function of gate voltage Ug.
43
Fig. 3.19 a) PinPout SHG signal and b) SinS'out signal as a function of
gate voltage Ug.
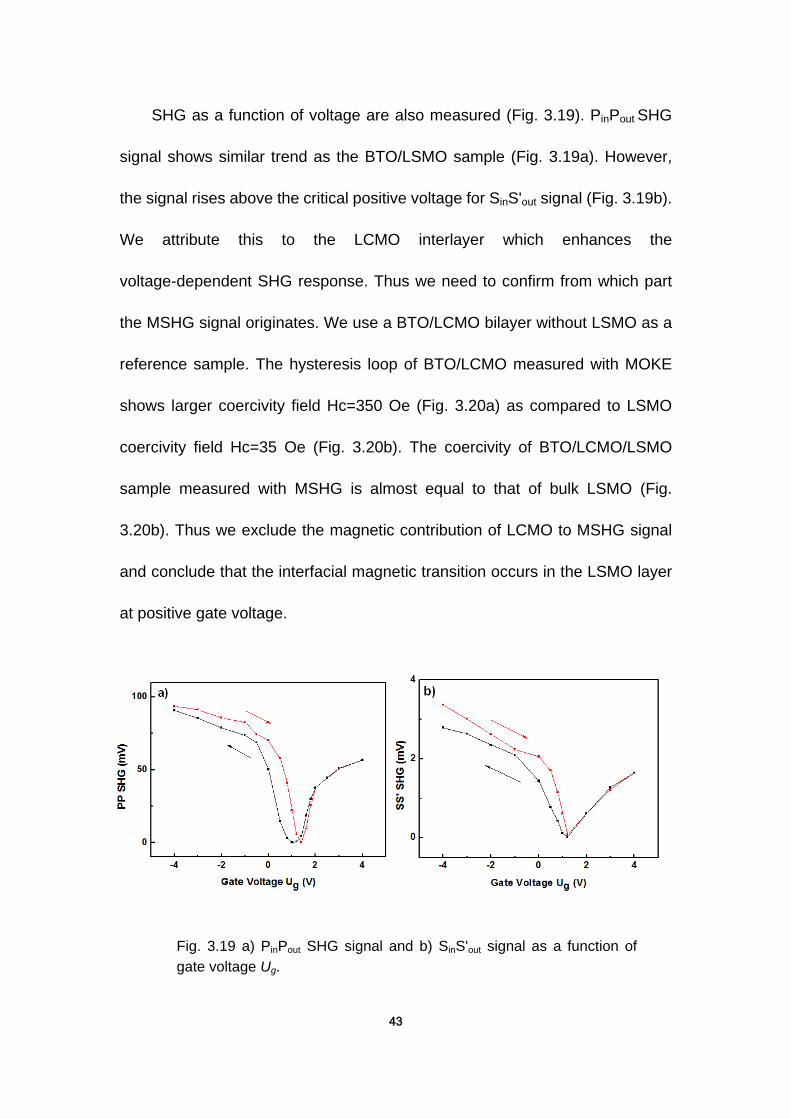
SHG as a function of voltage are also measured (Fig. 3.19). PinPout SHG
signal shows similar trend as the BTO/LSMO sample (Fig. 3.19a). However,
the signal rises above the critical positive voltage for SinS'out signal (Fig. 3.19b).
We attribute this to the LCMO interlayer which enhances the
voltage-dependent SHG response. Thus we need to confirm from which part
the MSHG signal originates. We use a BTO/LCMO bilayer without LSMO as a
reference sample. The hysteresis loop of BTO/LCMO measured with MOKE
shows larger coercivity field Hc=350 Oe (Fig. 3.20a) as compared to LSMO
coercivity field Hc=35 Oe (Fig. 3.20b). The coercivity of BTO/LCMO/LSMO
sample measured with MSHG is almost equal to that of bulk LSMO (Fig.
3.20b). Thus we exclude the magnetic contribution of LCMO to MSHG signal
and conclude that the interfacial magnetic transition occurs in the LSMO layer
at positive gate voltage.
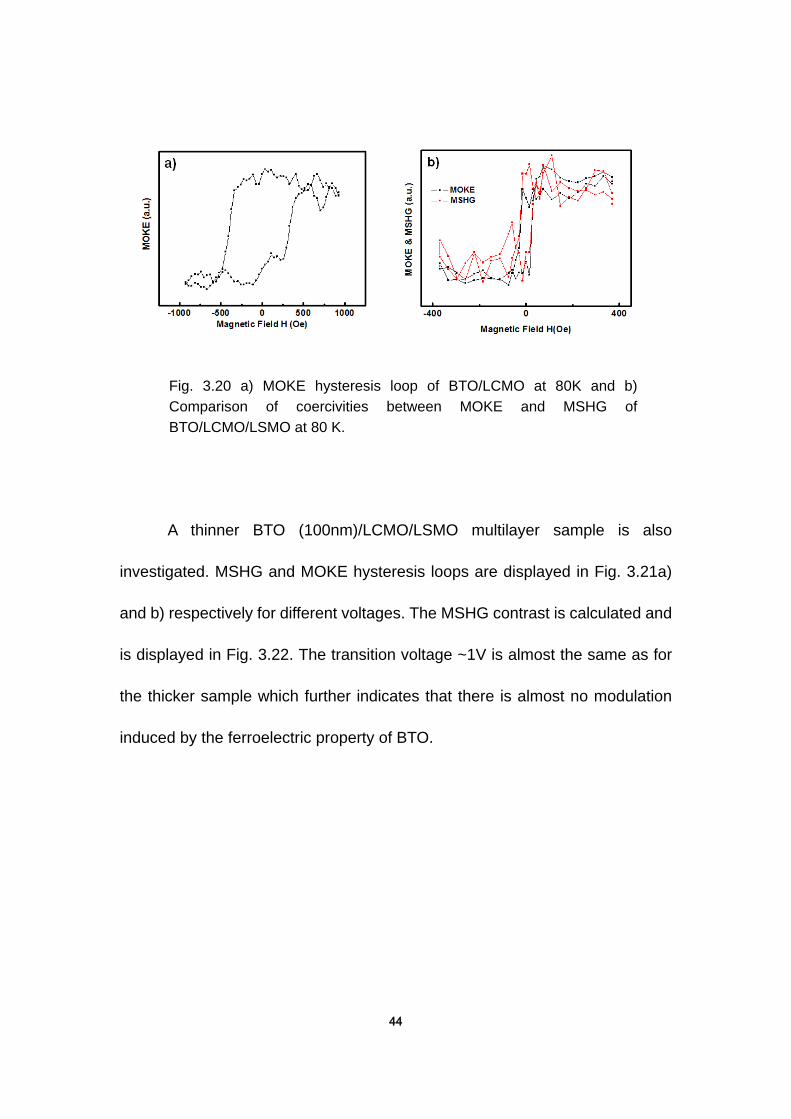
44
Fig. 3.20 a) MOKE hysteresis loop of BTO/LCMO at 80K and b)
Comparison of coercivities between MOKE and MSHG of
BTO/LCMO/LSMO at 80 K.
A thinner BTO (100nm)/LCMO/LSMO multilayer sample is also
investigated. MSHG and MOKE hysteresis loops are displayed in Fig. 3.21a)
and b) respectively for different voltages. The MSHG contrast is calculated and
is displayed in Fig. 3.22. The transition voltage ~1V is almost the same as for
the thicker sample which further indicates that there is almost no modulation
induced by the ferroelectric property of BTO.
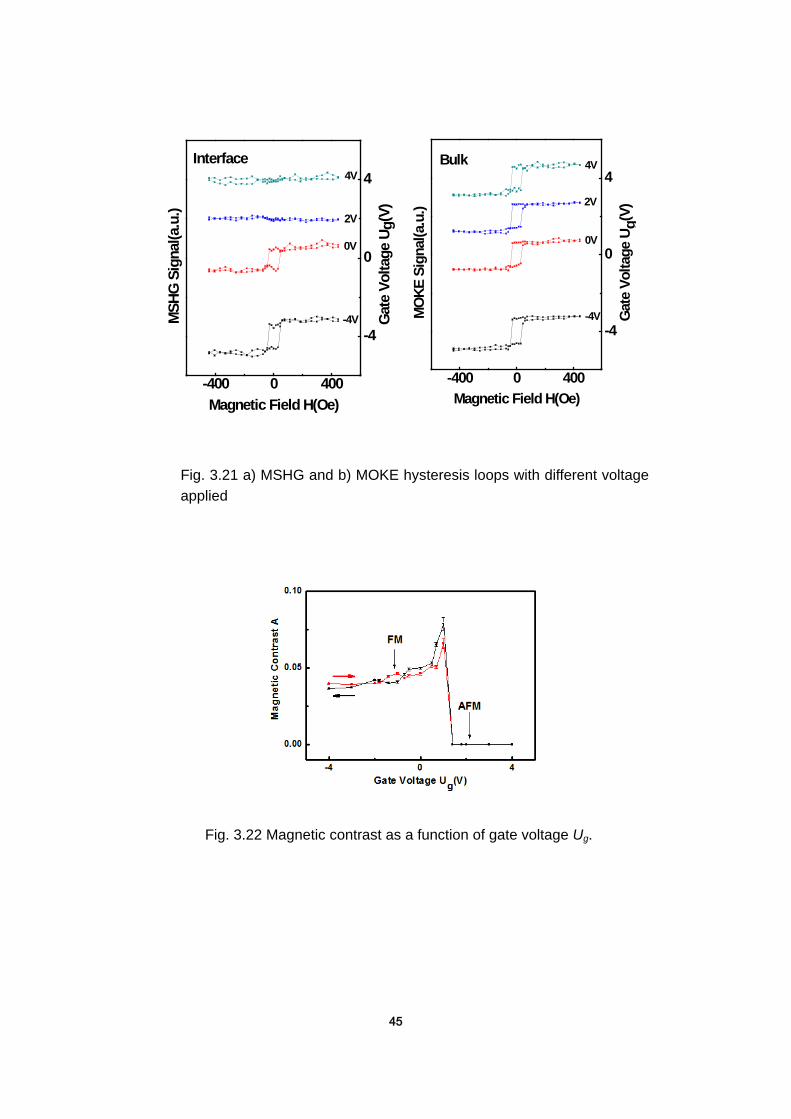
45
-400 0 400
-4
0
4
-4V
0V
2V
4V
Gate
Voltage U
g(V
)
MS
HG
Sig
nal(a.u
.)
Magnetic Field H(Oe)
Interface
-400 0 400
-4
0
4
-4V
0V
2V
4VBulk
Gate
Voltage U
g(V
)
MO
KE
Sig
nal(a.u
.)
Magnetic Field H(Oe)
Fig. 3.21 a) MSHG and b) MOKE hysteresis loops with different voltage
applied
Fig. 3.22 Magnetic contrast as a function of gate voltage Ug.
46
3.3.4 Effect of dopants in BaTiO3 layer
Further evidence for the ME coupling mechanism is provided from dopant
dependent studies of the BTO layer. BTO (200nm)/LSMO (50nm) under
oxygen rich condition is prepared. C-V measurements (Fig. 3.24a) reveal that
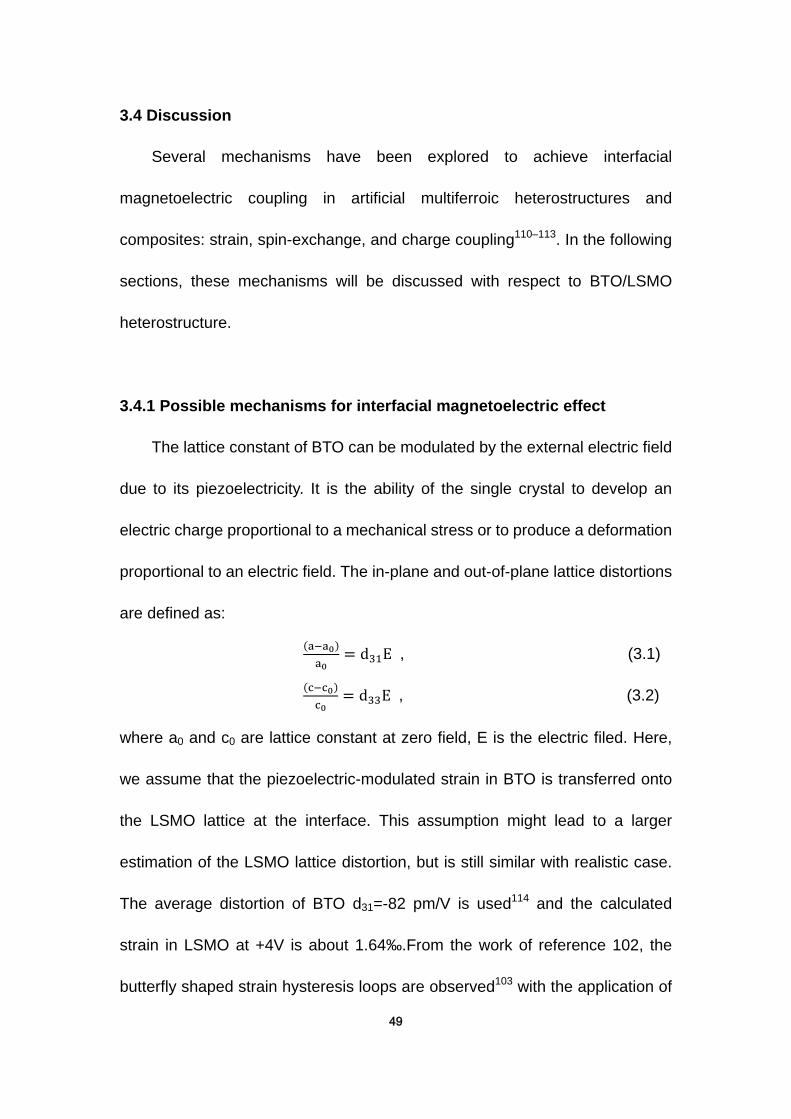
the oxygen rich sample has a lower electron concentration of 8×1017 cm-3 (Fig.
3.24b) as compared to that of oxygen poor sample (Fig. 3.). MSHG
measurements at a variety of gate voltages are performed (Fig. 3.25) and the
interface magnetic transition of the oxygen-rich sample is shifted to a much
higher gate voltage Ug = +6 V, as shown in Fig. 3.26. We note that the P-V
curve of oxygen-rich sample (Fig. 3.23b) is comparable to the oxygen-poor
sample, indicating further that the magnetic transition is not driven by the FE
polarization. In contrast, the I-V characteristic of the oxygen-rich sample
exhibits a much higher threshold voltage for the onset of current flow across
the heterojunction, as shown in Fig. 3.23a. The SinS'out SHG illustrates that
there is much smaller electric field at the interface and a higher voltage is
needed to cause the interfacial magnetic transition (Fig. 3.27). We attribute this
to the lower electron (oxygen vacancy) concentration of the oxygen rich
sample. This demonstrates that the electric field at the heterojunction is crucial
for the observed interface ME coupling effect.
47
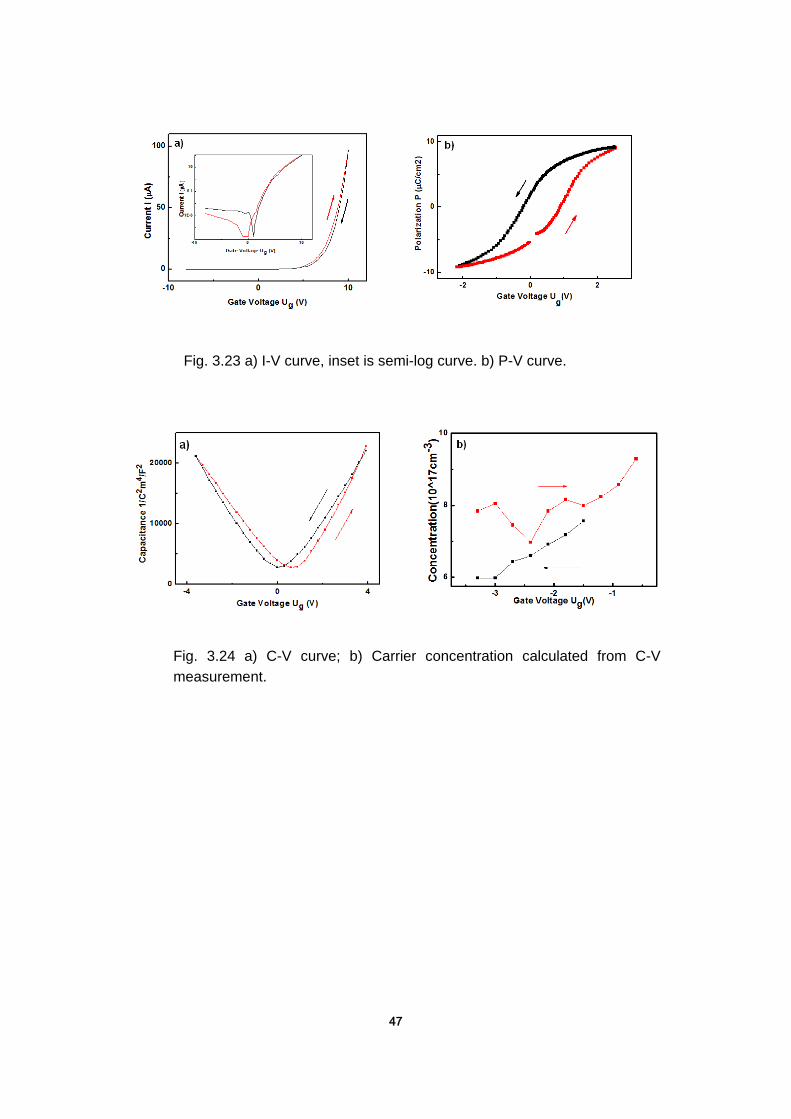
Fig. 3.23 a) I-V curve, inset is semi-log curve. b) P-V curve.
Fig. 3.24 a) C-V curve; b) Carrier concentration calculated from C-V
measurement.

48
Fig. 3.25 MSHG hysteresis loops at a series of voltage.
Fig. 3.26 MSHG magnetic contrast as a function of gate voltage Ug.
Fig. 3.27 SinS'out SHG as a function of gate voltage Ug.
49
3.4 Discussion
Several mechanisms have been explored to achieve interfacial
magnetoelectric coupling in artificial multiferroic heterostructures and
composites: strain, spin-exchange, and charge coupling110–113. In the following
sections, these mechanisms will be discussed with respect to BTO/LSMO
heterostructure.
3.4.1 Possible mechanisms for interfacial magnetoelectric effect
The lattice constant of BTO can be modulated by the external electric field
due to its piezoelectricity. It is the ability of the single crystal to develop an
electric charge proportional to a mechanical stress or to produce a deformation
proportional to an electric field. The in-plane and out-of-plane lattice distortions
are defined as:
(a−a0)a0
= d31E , (3.1)
(c−c0)c0
= d33E , (3.2)
where a0 and c0 are lattice constant at zero field, E is the electric filed. Here,
we assume that the piezoelectric-modulated strain in BTO is transferred onto
the LSMO lattice at the interface. This assumption might lead to a larger
estimation of the LSMO lattice distortion, but is still similar with realistic case.
The average distortion of BTO d31=-82 pm/V is used114 and the calculated
strain in LSMO at +4V is about 1.64‰.From the work of reference 102, the
butterfly shaped strain hysteresis loops are observed103 with the application of
50
an electric filed, which is not consistent with the voltage dependence of the
interface magnetization transition. Thus the strain would not play an important
role for this effect.
Modulation in the charge carrier density can lead to profound
modifications in the magnetic interactions by directly perturbing the relative
weight of the kinetic and Coulomb energy terms of the system68. The
ferroelectric property of BTO can modulate the charge density at the interface.
The charge-mediated mechanism is depicted by a model of screening charge
accumulation at the BTO/LSMO interface. When the electric displacement is
pointing away from the interface, the electron depletion (hole accumulation)
occurs. Otherwise, the electron accumulation (hole depletion) would occur at
the interface. Considering the boundary condition at the interface, the charge
distribution is expressed as 𝐷𝛿(𝑧), where 𝐷 is the electric displacement at
the interface and 𝑧 is the distance away from the interface. The density of
charge at the LSMO side exponentially decays with increasing distance away
from the interface. Thus the charge distribution can be expressed as
𝐷𝛿(𝑧) − 𝐷𝜆𝑒−
𝑧𝜆 , where 𝜆 = 4.14Å is the Thomas-Fermi screening length of
LSMO115. The modulation of hole doping level per Mn ion in the first unit cell at
the interface is approximately calculated by integration of the charge
distribution over a distance from the interface to one lattice constant in LSMO.
The saturation polarization of BTO is about 10 𝜇𝐶 𝑐𝑚2⁄ from Fig. 3.6. Thus,
the ferroelectric polarization would contribute to the hole injection with the

51
maximum value HFE = 0.044 𝑒 𝑢. 𝑐.2⁄ . The magnetization transition from FM to
AFM occurs around 0.5 doping level in LSMO, which means a hole doping
level of 0.167 𝑒 𝑢. 𝑐.2⁄ per Mn ion is required to achieve the magnetization
transition. The ferroelectric effect of modulated hole doping is far too small,
indicating that it would not dominate the hole injection in our case. The P-V
curve (Fig. 3.6) suggests that the observed interface magnetic transition is not
caused by polarization switching of the BTO layer. There is no sudden jump in
the P-V curve, nor does the magnetic contrast A exhibit a hysteresis loop (Fig.
3.12). The observed interface ME effect is therefore not related to the
polarization-induced interface magnetic transition of LSMO, as observed for
PZT/LSMO interface38,116.
The diode effect (Fig. 3.9) is shown on this sample. Thus the electric
displacement at the interface is not only caused by the ferroelectric
polarization effect, but also originates from the band bending. The
characteristic quantities of the Schottky contact can be deduced by solving
Poisson's equation117,118. The maximum electric field at the interface 𝐸𝑚 is
given by119,120:
𝐸𝑚 = �2𝑞𝑁𝑒𝑓𝑓|𝑉−𝑉𝑏𝑖|
𝜀0𝜀𝑠𝑡± 𝑃
𝜀0𝜀𝑠𝑡 , (3.3)
where Vbi is the build-in potential, Neff is the effective charge density in the
depletion region. P, q, 𝜀0 and 𝜀𝑠𝑡 denote ferroelectric polarization, electron
charge, permittivity of the free space and low frequency (static) dielectric
constant of the ferroelectric layer, respectively. Then the electric displacement
52
Fig. 3.28 Capacitance as a function of gate Voltage Ug
is given by:
𝐷 = 𝜀0𝜀𝑠𝑡𝐸𝑚 = �2𝑞𝜀0𝜀𝑠𝑡𝑁𝑒𝑓𝑓|𝑉 − 𝑉𝑏𝑖| ± 𝑃 . (3.4)
Capacitance measurements are done to estimate the charge density of the
sample (Fig. 3.28). For a Schottky contact, the capacitance is related to the
voltage by119,120:
1𝐶2
= 2𝑞𝜀0𝜀𝑠𝑡𝑁𝑒𝑓𝑓
�𝑉𝑏𝑖′ − 𝑉� . (3.5)
From the C-V measurement, the doping density can be evaluated, according
to119,120:
𝑁𝑑𝑜𝑝 = 2𝑞𝜀0𝜀𝑠𝑡[𝑑(1 𝐶2⁄ ) 𝑑𝑉⁄ ] . (3.6)
It is important to point out that 𝑁𝑑𝑜𝑝 is the density of free carriers to follow the
small ac probing voltage used to measure capacitance. The effective charge
density used in the theoretical equation of the capacitance includes not only
53
Fig. 3.29 Concentration of oxygen poor sample
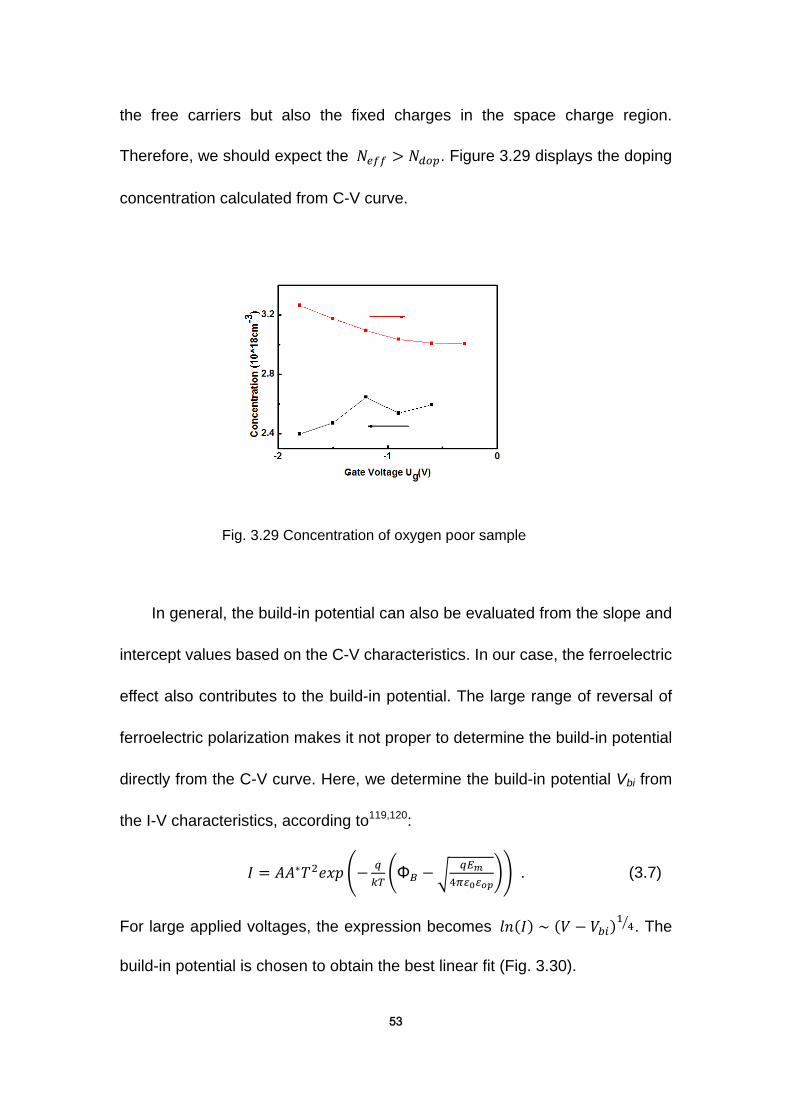
the free carriers but also the fixed charges in the space charge region.
Therefore, we should expect the 𝑁𝑒𝑓𝑓 > 𝑁𝑑𝑜𝑝. Figure 3.29 displays the doping
concentration calculated from C-V curve.
In general, the build-in potential can also be evaluated from the slope and
intercept values based on the C-V characteristics. In our case, the ferroelectric
effect also contributes to the build-in potential. The large range of reversal of
ferroelectric polarization makes it not proper to determine the build-in potential
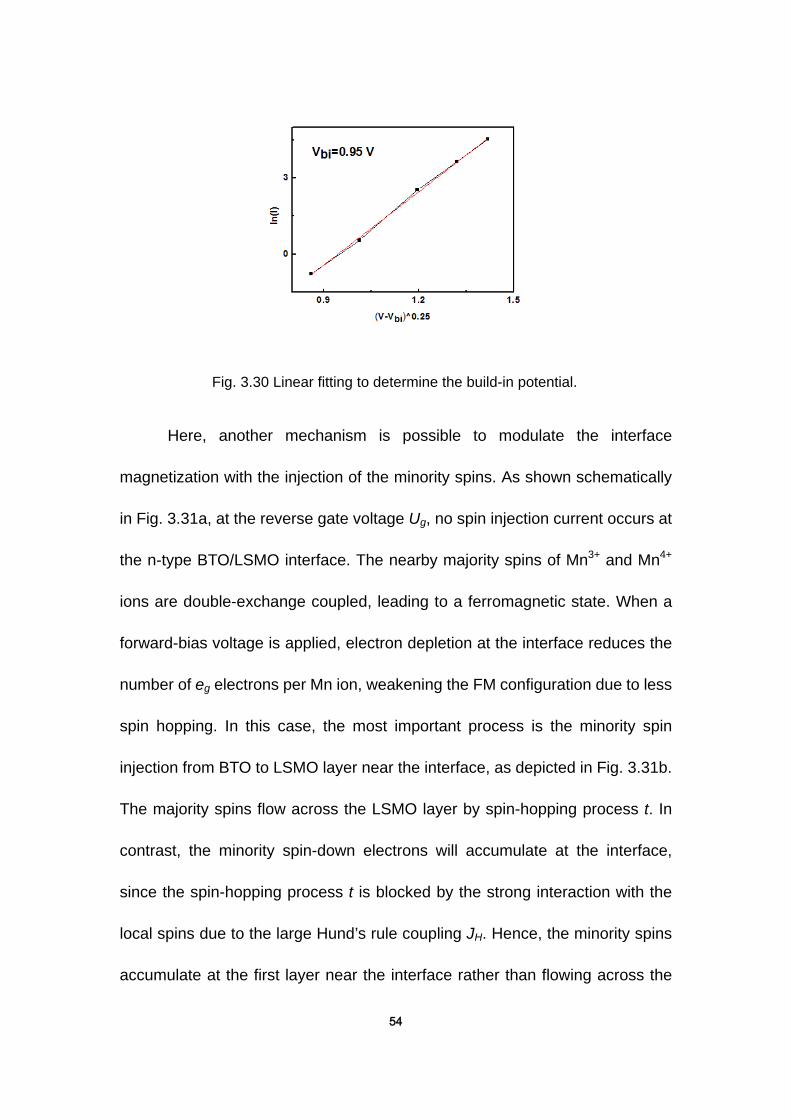
directly from the C-V curve. Here, we determine the build-in potential Vbi from
the I-V characteristics, according to119,120:
𝐼 = 𝐴𝐴∗𝑇2𝑒𝑥𝑝 �− 𝑞𝑘𝑇�Φ𝐵 − �
𝑞𝐸𝑚4𝜋𝜀0𝜀𝑜𝑝
�� . (3.7)
For large applied voltages, the expression becomes 𝑙𝑛(𝐼) ∼ (𝑉 − 𝑉𝑏𝑖)14� . The
build-in potential is chosen to obtain the best linear fit (Fig. 3.30).
54
Fig. 3.30 Linear fitting to determine the build-in potential.
Here, another mechanism is possible to modulate the interface
magnetization with the injection of the minority spins. As shown schematically
in Fig. 3.31a, at the reverse gate voltage Ug, no spin injection current occurs at
the n-type BTO/LSMO interface. The nearby majority spins of Mn3+ and Mn4+
ions are double-exchange coupled, leading to a ferromagnetic state. When a
forward-bias voltage is applied, electron depletion at the interface reduces the
number of eg electrons per Mn ion, weakening the FM configuration due to less
spin hopping. In this case, the most important process is the minority spin
injection from BTO to LSMO layer near the interface, as depicted in Fig. 3.31b.
The majority spins flow across the LSMO layer by spin-hopping process t. In
contrast, the minority spin-down electrons will accumulate at the interface,
since the spin-hopping process t is blocked by the strong interaction with the
local spins due to the large Hund’s rule coupling JH. Hence, the minority spins
accumulate at the first layer near the interface rather than flowing across the
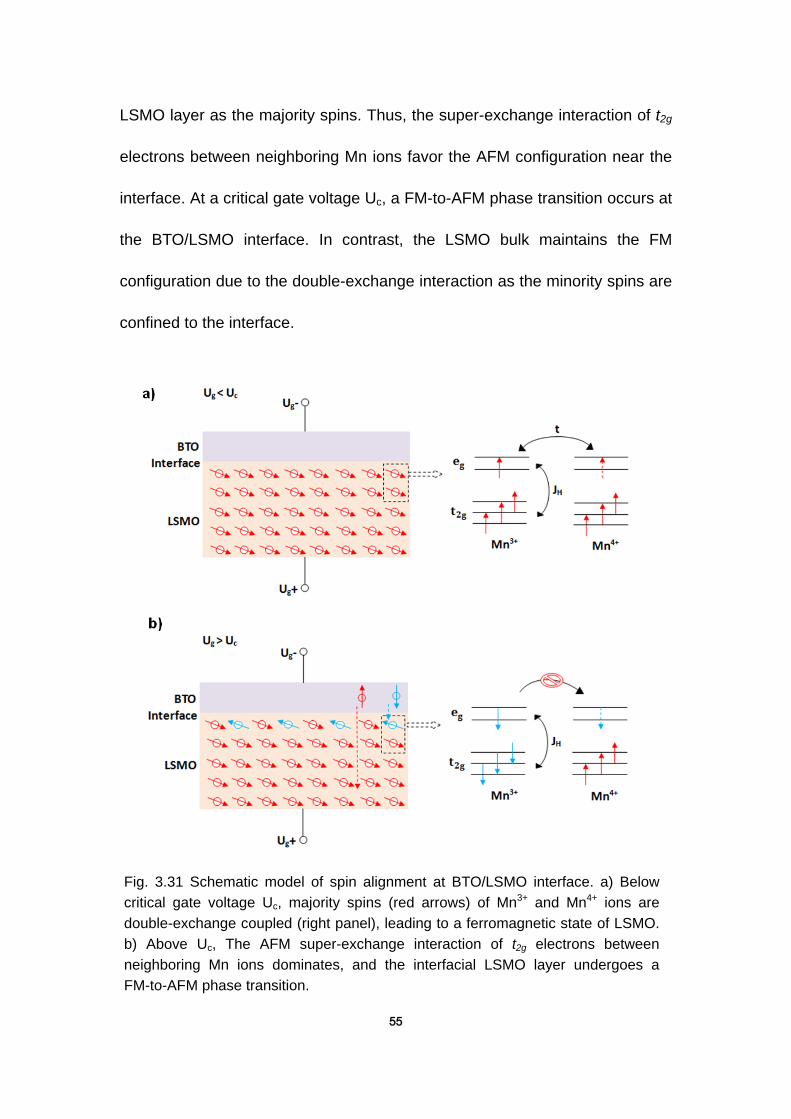
55
Fig. 3.31 Schematic model of spin alignment at BTO/LSMO interface. a) Below
critical gate voltage Uc, majority spins (red arrows) of Mn3+ and Mn4+ ions are
double-exchange coupled (right panel), leading to a ferromagnetic state of LSMO.
b) Above Uc, The AFM super-exchange interaction of t2g electrons between
neighboring Mn ions dominates, and the interfacial LSMO layer undergoes a
FM-to-AFM phase transition.
LSMO layer as the majority spins. Thus, the super-exchange interaction of t2g
electrons between neighboring Mn ions favor the AFM configuration near the
interface. At a critical gate voltage Uc, a FM-to-AFM phase transition occurs at
the BTO/LSMO interface. In contrast, the LSMO bulk maintains the FM
configuration due to the double-exchange interaction as the minority spins are
confined to the interface.
56
3.4.2 Microscopic mechanism for interfacial magnetoelectric effect
Next, we will discuss the microscopic mechanism of this novel interface
ME effect. Figure 3.32 shows a schematic of the proposed magnetic structure
and band alignment at the n-type BTO/LSMO Schottky junction with positive
gate voltage. For FE polarization (P) pointing away from the LSMO layer, the
hole accumulation biases the interfacial LSMO layer towards the AFM
insulating phase. The La0.7Sr0.3MnO3, however, has stoichiometry that is far
enough from the phase boundary and a change in magnetic order is not
expected owing solely to a build-up of screening charge109. On the other hand,
for a positive gate voltage applied to the LSMO layer, an electron current (J-)
begins to flow across the BTO/LSMO heterojunction. Both, spin-up and
spin-down electrons will be injected from the conduction band of BTO into the
interfacial LSMO layer, since the spin polarization of LSMO surfaces extracted
from transport measurements usually yield less than 95%121. The majority
spin-up electrons will quickly relax to the Fermi level and conduct through the
LSMO layer. In contrast, the minority spin-down electrons will accumulate at
the interface, since the spin-hopping process t is blocked by the strong
interaction with the local spins due to the large Hund’s rule coupling JH. This
will weaken the double-exchange mechanism and hence reduce the
ferromagnetic coupling between Mn ions at the LSMO interface. At a critical
gate voltage Uc, the injected minority spin-down electrons will reduce the
double-exchange mechanism such that the AFM super-exchange interaction
57
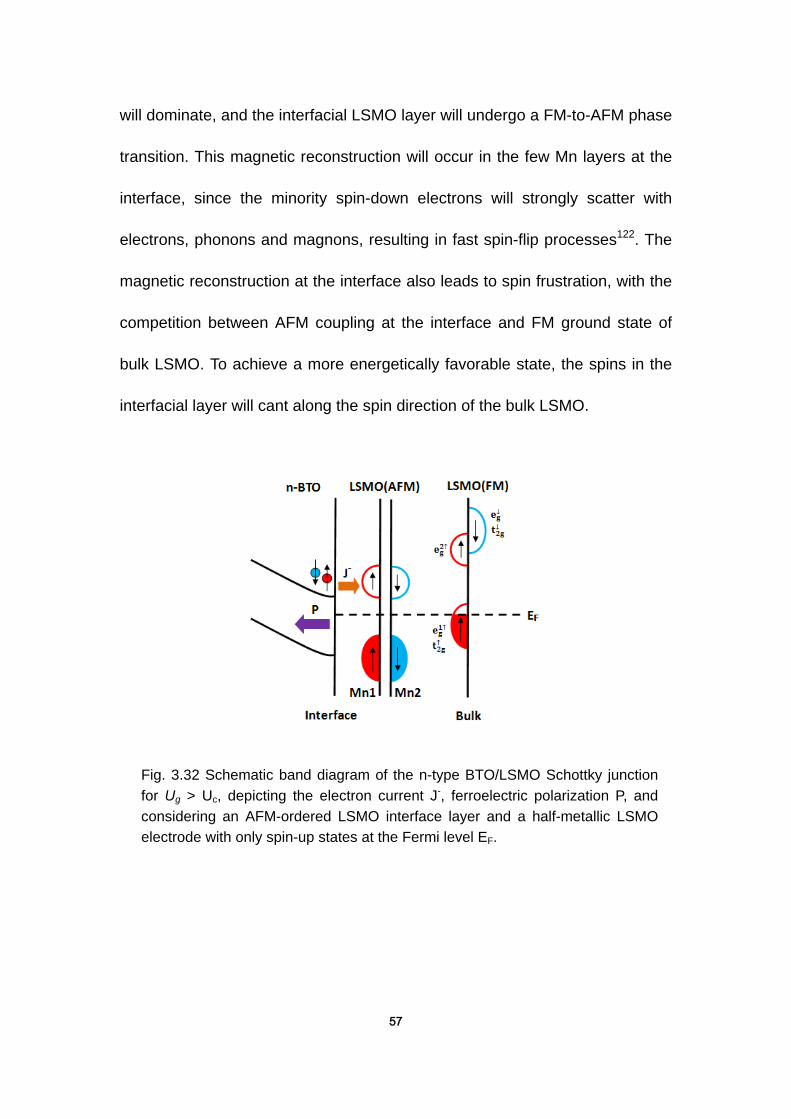
will dominate, and the interfacial LSMO layer will undergo a FM-to-AFM phase
transition. This magnetic reconstruction will occur in the few Mn layers at the
interface, since the minority spin-down electrons will strongly scatter with
electrons, phonons and magnons, resulting in fast spin-flip processes122. The
magnetic reconstruction at the interface also leads to spin frustration, with the
competition between AFM coupling at the interface and FM ground state of
bulk LSMO. To achieve a more energetically favorable state, the spins in the
interfacial layer will cant along the spin direction of the bulk LSMO.
Fig. 3.32 Schematic band diagram of the n-type BTO/LSMO Schottky junction
for Ug > Uc, depicting the electron current J-, ferroelectric polarization P, and
considering an AFM-ordered LSMO interface layer and a half-metallic LSMO
electrode with only spin-up states at the Fermi level EF.
58
Chapter 4
Magnetoelectric coupling in SrTiO3/La0.5Ca0.5MnO3/La0.67Sr0.33MnO3
heterostructure
4.1 Introduction
To elucidate further the observed magnetoelectric (ME) effect, a
non-ferroelectric system - SrTiO3/La0.5Ca0.5MnO3/La0.67Sr0.33MnO3 - is studied
in this section.
4.1.1 Basic properties of SrTiO3
Strontium titanate SrTiO3 (STO) is a good candidate. It is
paraelectric with a relative dielectric constant as high as 300 at
room temperature123,124 and has been widely studied due to its
variety of applications125. Stoichiometric STO with a simple-cubic
perovskite structure is an insulator at room temperature with a band
gap of 3.2 eV. The Ti4+ ion at the cubic body center is surrounded by O2- ions
at the face center sites and Sr2+ ions at the cubic corners. As the temperature
is reduced the crystal structure becomes tetragonal at 110 K, and at 65 K the
structure becomes orthorhombic126. However, the electrical property in the bulk
STO can be changed with oxygen vacancy127,128 or impurity doping, such as
Nb or La129,130. From the viewpoint of conductivity, STO can be changed from
an insulator to a n-type semiconductor and finally to a metallic conductor. In

59
the region of thin-film growth, STO is very often used as the substrate for
depositing other perovskite oxides owing to the small in-plane lattice
mismatch131. Because of its notable dielectric and doped semiconducting
properties, STO can be utilized to develop field-effect devices132 besides the
application in dynamic random-access memories, and high-density
capacitors.133
4.1.2 Basic properties of La1-xCaxMnO3
La1-xCaxMnO3 (LCMO) is among the most-studied compounds of the
manganite family due to its robust magnetoresistance effect134, larger than in
other much-studied materials such as La1-xSrxMnO3 (LSMO). The Ca ionic size
is almost identical to the La ionic size, and thus a true solid solution forms in
the entire range of Ca concentrations. Antiferromagnetic (AFM)
superexchange coupling exists between Mn4+ ions via an intervening oxygen,
while the superexchange interaction with a Mn3+ ion can be AFM or
ferromagnetic (FM) depending on the relative orbital orientation. The real
hopping between Mn3+ and Mn4+ through an oxygen produces a FM coupling
via the double exchange mechanism91. Therefore, it is expected that there
exists close interplay among charge carriers, magnetic couplings, and
structural distortions in LCMO. The phase diagram is depicted in Fig. 4.188.
Both perovskites LaMnO3 and CaMnO3 are AFM insulators. The prominent
phase is the FM low-temperature metallic state for Ca concentration of 0.2 ~
60
0.5 caused by the double exchange coupling. CMR behavior is displayed in
this region135. The ferromagnetism, optimized at x = 3/8, persists up to x ≈ 0.5,
charge ordering becomes stable for x > 1/2, and there exists a remarkable
competition between ferromagnetism and charge ordering at Ca concentration
of 1/2. The compound La0.5Ca0.5MnO3 is paramagnetic at room temperature
and changes on cooling to a mainly FM metallic phase at Curie temperature TC
≈ 220 K, and subsequently to charge-ordered antiferromagnetic (CO-AFM)
phase at TCO ≈ 150 K (180 K upon warming)135. The CE-state (combination of
C-AFM and E-AFM type) is observed for x = 0.5 doping, which contains
"zigzag" FM arrays of t2g spins, coupled antiferromagnetically perpendicular to
the zigzag direction94(Fig. 4.2).
It has been established that this system is better described as
magnetically phase-segregated over a wide range of temperatures136,137, a
phenomenon called phase separation (PS). At low temperatures, T<TCO; FM
metallic regions are trapped in a CO-AFM matrix and cannot grow against CO
in the application of moderate magnetic field, whereas at an intermediate
temperature range (TCO<T<TC), the FM phase coexists with insulating non-FM
regions. The FM phase is partially confined but can grow against the insulating
one while applying a low magnetic field137.
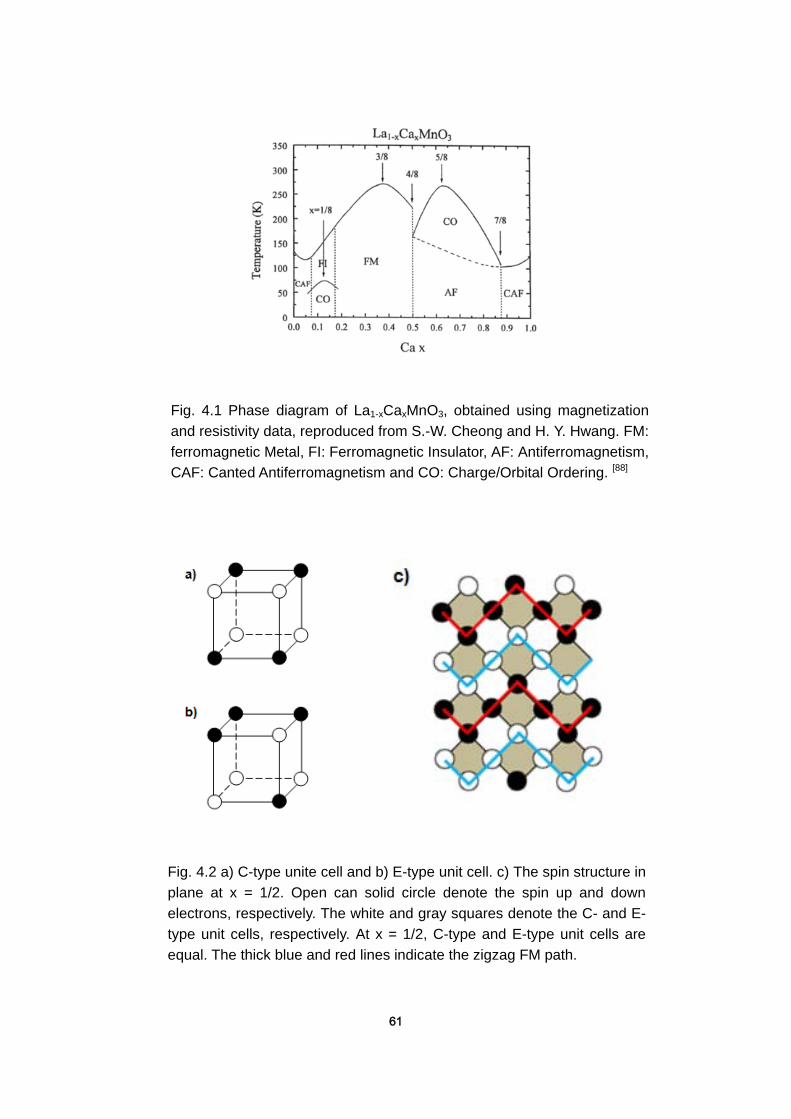
61
Fig. 4.1 Phase diagram of La1-xCaxMnO3, obtained using magnetization
and resistivity data, reproduced from S.-W. Cheong and H. Y. Hwang. FM:
ferromagnetic Metal, FI: Ferromagnetic Insulator, AF: Antiferromagnetism,
CAF: Canted Antiferromagnetism and CO: Charge/Orbital Ordering. [88]
Fig. 4.2 a) C-type unite cell and b) E-type unit cell. c) The spin structure in
plane at x = 1/2. Open can solid circle denote the spin up and down
electrons, respectively. The white and gray squares denote the C- and E-
type unit cells, respectively. At x = 1/2, C-type and E-type unit cells are
equal. The thick blue and red lines indicate the zigzag FM path.

62
4.2 Samples and Experiments
At the STO/LSMO interface, a magnetic and electrical "dead" layer138,139 is
presented due to the modifications at the interface, including stoichiometry, the
presence of interfacial strain, and point defects such as oxygen vacancies.
Thus, we insert a 1-nm thick La0.5Ca0.5MnO3 layer at the STO/LSMO interface
to avoid this effect.
The STO (200 nm)/ LCMO (1nm)/ LSMO (50 nm) oxide heterostructures
were grown on STO (001) substrates by using a multi-target pulsed laser
deposition system (KrF excimer laser 248 nm). The STO (200 nm)/LCMO (1
nm)/ LSMO (50 nm) epitaxial trilayer was deposited at a temperature of 750 oC
in flowing oxygen of 300 mtorr and cooled down in the same oxygen pressure
(oxygen poor condition). The indium-tin-oxide (ITO) (30 nm) layer was
deposited in situ at 50 oC in 10 mtorr oxygen. The oxygen vacancy
concentration of STO is reduced by in-situ annealing the sample in 600 mtorr
O2 at 450 oC for 0.5 hour, making it less n-type than the non-annealed one.
All optical experiments are performed at 80 K below the Curie temperature
by placing the samples in a cryostat cooled by liquid nitrogen. MSHG is used
to characterize the interfacial magnetic property and Magneto-Optical Kerr
effect (MOKE) is performed to characterize the bulk magnetic property. To
study the interfacial ME coupling effect, an external magnetic field is applied in
plane, and an external electric field is applied out of the plane using a "Keithley
2400 Sourcemeter".
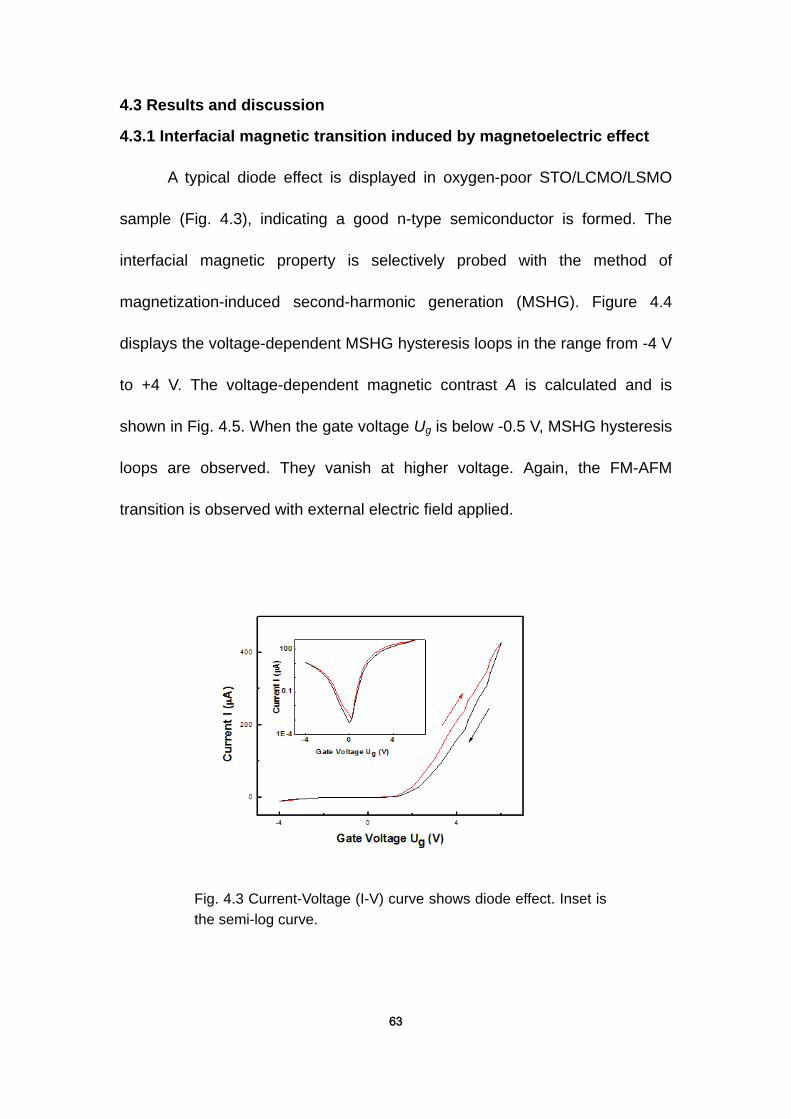
63
Fig. 4.3 Current-Voltage (I-V) curve shows diode effect. Inset is
the semi-log curve.
4.3 Results and discussion
4.3.1 Interfacial magnetic transition induced by magnetoelectric effect
A typical diode effect is displayed in oxygen-poor STO/LCMO/LSMO
sample (Fig. 4.3), indicating a good n-type semiconductor is formed. The
interfacial magnetic property is selectively probed with the method of
magnetization-induced second-harmonic generation (MSHG). Figure 4.4
displays the voltage-dependent MSHG hysteresis loops in the range from -4 V
to +4 V. The voltage-dependent magnetic contrast A is calculated and is
shown in Fig. 4.5. When the gate voltage Ug is below -0.5 V, MSHG hysteresis
loops are observed. They vanish at higher voltage. Again, the FM-AFM
transition is observed with external electric field applied.
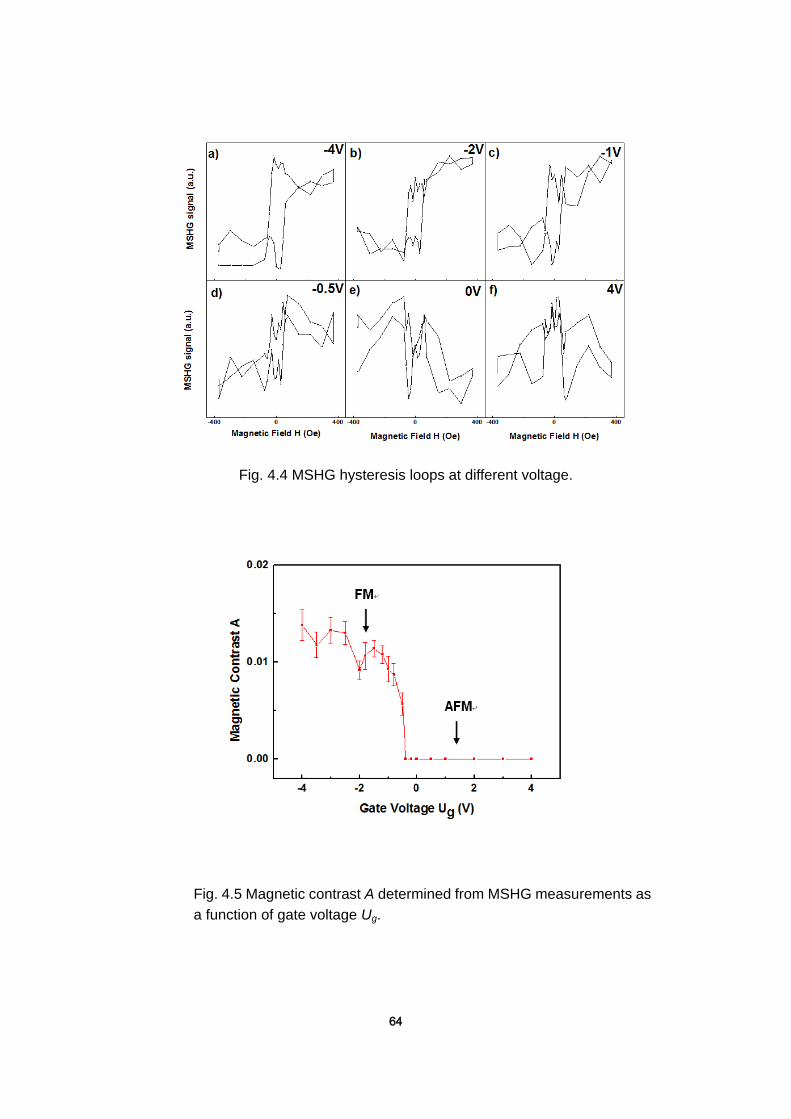
64
Fig. 4.4 MSHG hysteresis loops at different voltage.
Fig. 4.5 Magnetic contrast A determined from MSHG measurements as
a function of gate voltage Ug.
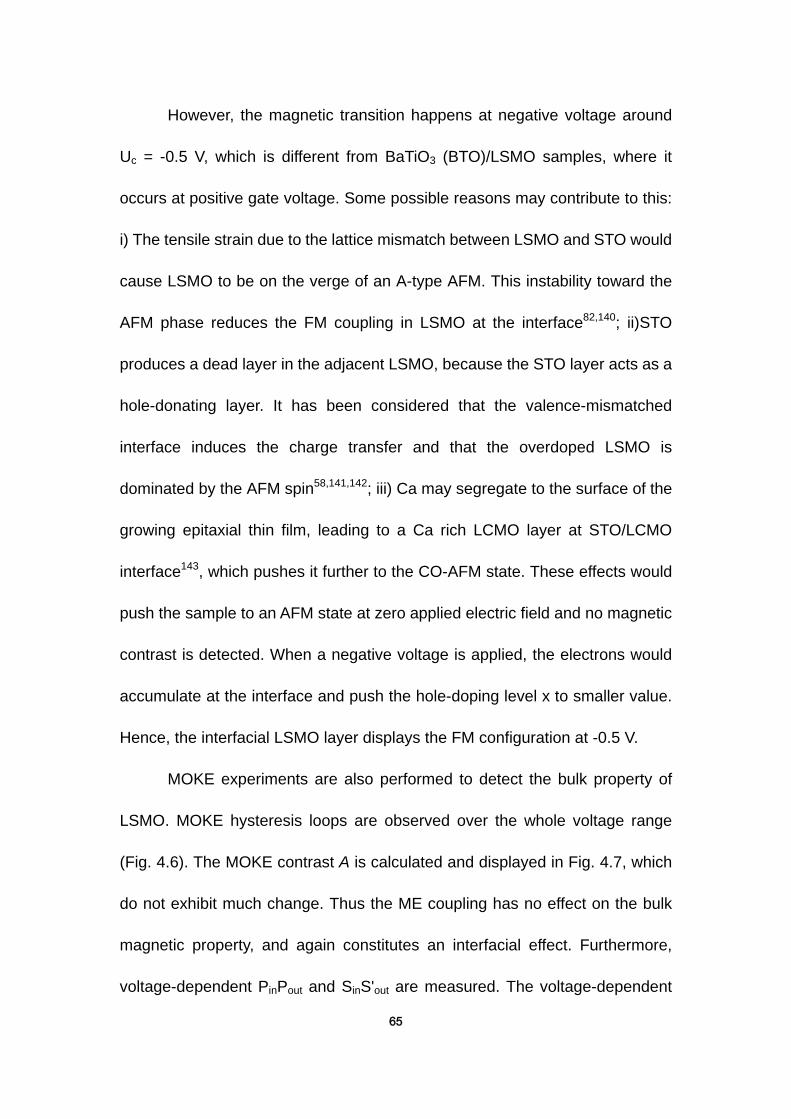
65
However, the magnetic transition happens at negative voltage around
Uc = -0.5 V, which is different from BaTiO3 (BTO)/LSMO samples, where it
occurs at positive gate voltage. Some possible reasons may contribute to this:
i) The tensile strain due to the lattice mismatch between LSMO and STO would
cause LSMO to be on the verge of an A-type AFM. This instability toward the
AFM phase reduces the FM coupling in LSMO at the interface82,140; ii)STO
produces a dead layer in the adjacent LSMO, because the STO layer acts as a
hole-donating layer. It has been considered that the valence-mismatched
interface induces the charge transfer and that the overdoped LSMO is
dominated by the AFM spin58,141,142; iii) Ca may segregate to the surface of the
growing epitaxial thin film, leading to a Ca rich LCMO layer at STO/LCMO
interface143, which pushes it further to the CO-AFM state. These effects would
push the sample to an AFM state at zero applied electric field and no magnetic
contrast is detected. When a negative voltage is applied, the electrons would
accumulate at the interface and push the hole-doping level x to smaller value.
Hence, the interfacial LSMO layer displays the FM configuration at -0.5 V.
MOKE experiments are also performed to detect the bulk property of
LSMO. MOKE hysteresis loops are observed over the whole voltage range
(Fig. 4.6). The MOKE contrast A is calculated and displayed in Fig. 4.7, which
do not exhibit much change. Thus the ME coupling has no effect on the bulk
magnetic property, and again constitutes an interfacial effect. Furthermore,
voltage-dependent PinPout and SinS'out are measured. The voltage-dependent

66
Fig. 4.6 MOKE hysteresis loops at different voltage.
Fig. 4.7 MOKE contrast A as a function of gate voltage Ug.
PinPout reveals a strong electric-field-induced SHG response (Fig. 4.8).
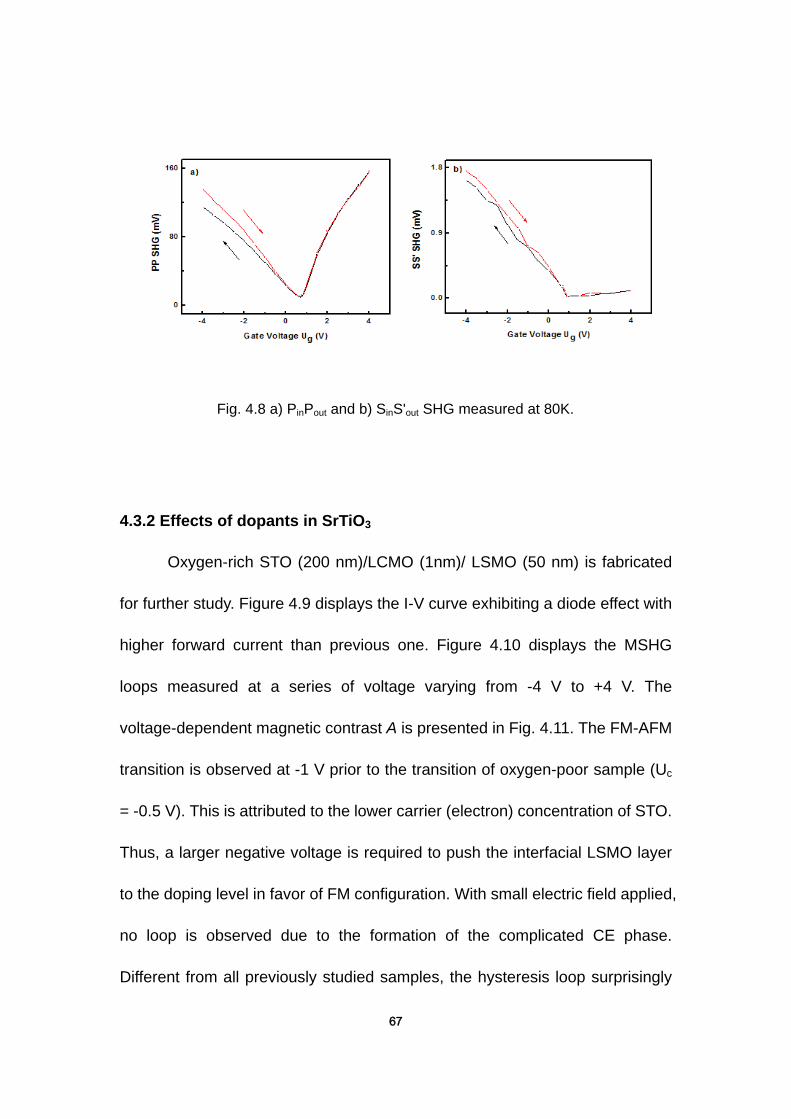
67
Fig. 4.8 a) PinPout and b) SinS'out SHG measured at 80K.
4.3.2 Effects of dopants in SrTiO3
Oxygen-rich STO (200 nm)/LCMO (1nm)/ LSMO (50 nm) is fabricated
for further study. Figure 4.9 displays the I-V curve exhibiting a diode effect with
higher forward current than previous one. Figure 4.10 displays the MSHG
loops measured at a series of voltage varying from -4 V to +4 V. The
voltage-dependent magnetic contrast A is presented in Fig. 4.11. The FM-AFM
transition is observed at -1 V prior to the transition of oxygen-poor sample (Uc
= -0.5 V). This is attributed to the lower carrier (electron) concentration of STO.
Thus, a larger negative voltage is required to push the interfacial LSMO layer
to the doping level in favor of FM configuration. With small electric field applied,
no loop is observed due to the formation of the complicated CE phase.
Different from all previously studied samples, the hysteresis loop surprisingly

68
reappears at +2.5V. A possible explanation is that the hole doping level in the
interfacial LSMO layer is far above 0.5 and an A-type AFM spin configuration is
favored in this situation. In this state, FM order is favored in the LSMO
intralayer and AFM coupling occurs perpendicular to the plane. Hence a
magnetic hysteresis loop will be observed in the MSHG measurement. The
lattice constant of STO, LSMO, BTO are 3.905Å , 3.871Å ,144 3.992Å ,114
respectively. Thus, the lattice mismatch is 0.87% between STO and LSMO,
while it is 3.12% between BTO and LSMO. The stronger tensile strain in the
plane would correspond to more compression perpendicular to the plane. Thus,
the interlayer coupling in STO/LCMO/LSMO is weaker than for BTO. Hence,
A-type AFM coupling maybe detected in STO/LCMO/LSMO sample, rather
than in BTO/LCMO/LSMO sample. For comparison, MOKE hysteresis loops at
different gate voltage Ug is displayed in Fig. 4.12, which reveals no modulation
of bulk property.
Figure 4.13a) and b) present the voltage-dependent PinPout and SinS'out
SHG measurements, respectively. The larger SinS'out SHG signal at positive
voltage as compared to oxygen-poor sample, may explain why the hysteresis
loop does not reappear in oxygen-poor sample at high positive voltage.
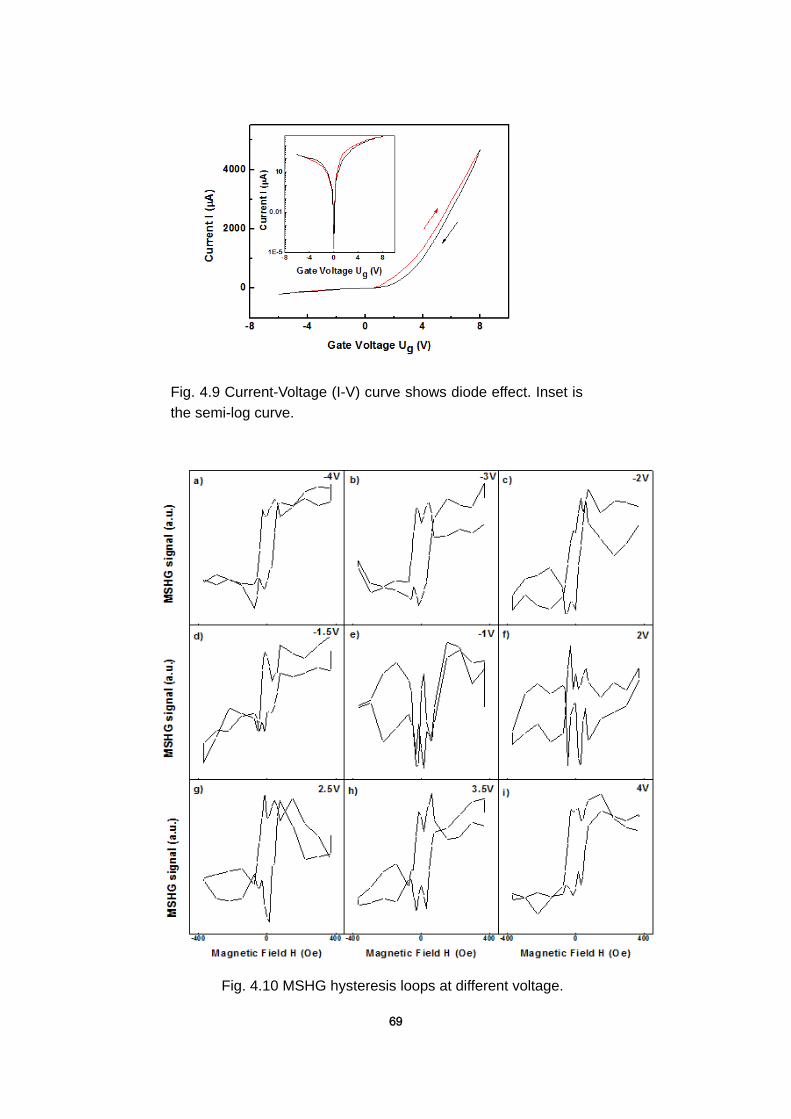
69
Fig. 4.9 Current-Voltage (I-V) curve shows diode effect. Inset is
the semi-log curve.
Fig. 4.10 MSHG hysteresis loops at different voltage.

70
Fig. 4.11 MSHG magnetic contrast A as a function of gate voltage Ug.
Fig. 4.12 MOKE hysteresis loops at different voltage.

71
Fig. 4.13 a) PinPout and b) SinS'out SHG measured at 80K.

72
Chapter 5
Summary
Transition metal oxides (TMOs) have attracted much attention in recent
years. The strong coupling between charge, spin, and orbital degrees of
freedom creates novel functional properties. The research at the interplay
between ferromagnetism, ferroelectricity and conductivity provides a promising
way to the development of future spintronic devices.
The interface characterization of multifunctional oxide heterostructures is
crucial to understand deeply the magnetic response, spin injection and spin
transport. We characterize optically the magnetic property with the method of
magnetization-induced second-harmonic generation (MSHG), which is a
sensitive technique to selectively probe the interface where the spatial
inversion symmetry is broken.
The interface of n-type BaTiO3 (BTO)/La0.67Sr0.33MnO3 (LSMO) forms a
Schottky barrier and displays a good diode effect. By applying an external
electric field across the sample, we observe the magnetoelectric (ME) coupling
effect to modulate the interface magnetization. The voltage dependent
magnetic contrast sharply vanishes at positive voltage (applied to LSMO
contact) and reveals a ferromagnetic (FM)-to- antiferromagnetic (AFM)
transition occurring at the interface, while the magneto-optic Kerr effect
(MOKE) indicates that the bulk property is not affected. The strain mediated
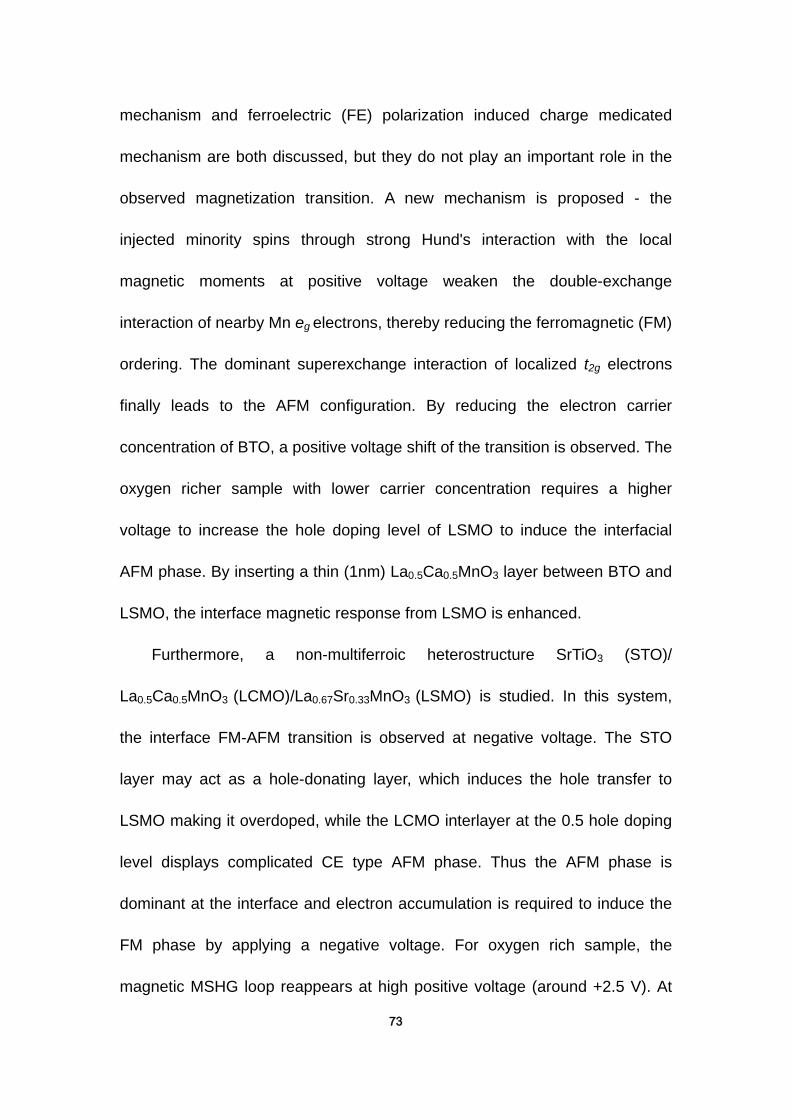
73
mechanism and ferroelectric (FE) polarization induced charge medicated
mechanism are both discussed, but they do not play an important role in the
observed magnetization transition. A new mechanism is proposed - the
injected minority spins through strong Hund's interaction with the local
magnetic moments at positive voltage weaken the double-exchange
interaction of nearby Mn eg electrons, thereby reducing the ferromagnetic (FM)
ordering. The dominant superexchange interaction of localized t2g electrons
finally leads to the AFM configuration. By reducing the electron carrier
concentration of BTO, a positive voltage shift of the transition is observed. The
oxygen richer sample with lower carrier concentration requires a higher
voltage to increase the hole doping level of LSMO to induce the interfacial
AFM phase. By inserting a thin (1nm) La0.5Ca0.5MnO3 layer between BTO and
LSMO, the interface magnetic response from LSMO is enhanced.
Furthermore, a non-multiferroic heterostructure SrTiO3 (STO)/
La0.5Ca0.5MnO3 (LCMO)/La0.67Sr0.33MnO3 (LSMO) is studied. In this system,
the interface FM-AFM transition is observed at negative voltage. The STO
layer may act as a hole-donating layer, which induces the hole transfer to
LSMO making it overdoped, while the LCMO interlayer at the 0.5 hole doping
level displays complicated CE type AFM phase. Thus the AFM phase is
dominant at the interface and electron accumulation is required to induce the
FM phase by applying a negative voltage. For oxygen rich sample, the
magnetic MSHG loop reappears at high positive voltage (around +2.5 V). At

74
high doping level (x > 0.5), LSMO exhibts A-type AFM order, consisting of AFM
superexchange coupling between adjacent layers and intralayer FM
double-exchange coupling. The less tensile strain of STO and LSMO due to a
smaller lattice mismatch as compared to BTO would result in a weaker
interlayer coupling . Thus, interfacial A-type AFM order can occur in
STO/LCMO/LSMO heterostructure at high hole doping concentration.
The study of ME coupling of multifunctional oxide heterostructures is
definitely important to the development and performance of future spintronic
devices. The results presented here regarding the interfacial magnetic
transition controlled by an external electric field offer some new perspective to
study the spin transport of magnetic tunnel junctions.

75
Bibliography
1. Baibich, M. N. et al. Giant Magnetoresistance of (001)Fe/(001)Cr
Magnetic Superlattices. Phys. Rev. Lett. 61, 2472–2475 (1988).
2. Chappert, C., Fert, A. & Van Dau, F. N. The emergence of spin
electronics in data storage. Nat. Mater. 6, 813–823 (2007).
3. Wang, D. et al. 70% TMR at Room Temperature for SDT Sandwich
Junctions With CoFeB as Free and Reference Layers. IEEE Trans. Magn. 40, 2269–2271 (2004).
4. Parkin, S. S. P. et al. Giant tunnelling magnetoresistance at room
temperature with MgO (100) tunnel barriers. Nat. Mater. 3, 862–867
(2004).
5. Yuasa, S., Nagahama, T., Fukushima, A., Suzuki, Y. & Ando, K. Giant
room-temperature magnetoresistance in single-crystal Fe/MgO/Fe
magnetic tunnel junctions. Nat. Mater. 3, 868–871 (2004).
6. Lee, Y. M., Hayakawa, J., Ikeda, S., Matsukura, F. & Ohno, H. Effect of
electrode composition on the tunnel magnetoresistance of
pseudo-spin-valve magnetic tunnel junction with a MgO tunnel
barrier. Appl. Phys. Lett. 90, 212507 (2007).
7. Daughton, J. M. Magnetic tunneling applied to memory (invited). J.
Appl. Phys. 81, 3758 (1997).
8. Albert, F. J., Katine, J. A., Buhrman, R. A. & Ralph, D. C.
Spin-polarized current switching of a Co thin film nanomagnet. Appl. Phys. Lett. 77, 3809 (2000).
9. Sun, J. Z. Spin-current interaction with a monodomain magnetic
body: A model study. Phys. Rev. B 62, 570–578 (2000).
76
10. Zhang, S. Spin-Dependent Surface Screening in Ferromagnets and
Magnetic Tunnel Junctions. Phys. Rev. Lett. 83, 640–643 (1999).
11. Duan, C.-G., Nan, C.-W., Jaswal, S. S. & Tsymbal, E. Y. Universality of
the surface magnetoelectric effect in half-metals. Phys. Rev. B 79,
(2009).
12. Duan, C.-G., Jaswal, S. S. & Tsymbal, E. Y. Predicted
Magnetoelectric Effect in Fe / BaTiO 3 Multilayers: Ferroelectric
Control of Magnetism. Phys. Rev. Lett. 97, (2006).
13. Multifunctional oxide heterostructures. (Oxford University Press,
2012).
14. Giovannetti, G., Kumar, S., Ortix, C., Capone, M. & van den Brink, J.
Microscopic Origin of Large Negative Magnetoelectric Coupling in
Sr 1 / 2 Ba 1 / 2 MnO 3. Phys. Rev. Lett. 109, (2012).
15. Rossell, M. D. et al. Atomic Structure of Highly Strained BiFeO 3 Thin
Films. Phys. Rev. Lett. 108, (2012).
16. Matsuda, M. et al. Magnetic Dispersion and Anisotropy in
Multiferroic BiFeO 3. Phys. Rev. Lett. 109, (2012).
17. Jeong, J. et al. Spin Wave Measurements over the Full Brillouin Zone
of Multiferroic BiFeO 3. Phys. Rev. Lett. 108, (2012).
18. Bersuker, I. B. Pseudo Jahn-Teller Origin of Perovskite Multiferroics,
Magnetic-Ferroelectric Crossover, and Magnetoelectric Effects: The
d 0 − d 10 Problem. Phys. Rev. Lett. 108, (2012).
19. Spaldin, N. A. MATERIALS SCIENCE: The Renaissance of
Magnetoelectric Multiferroics. Science 309, 391–392 (2005).
77
20. Ramesh, R. & Spaldin, N. A. Multiferroics: progress and prospects in
thin films. Nat. Mater. 6, 21–29 (2007).
21. Scott, J. F. Room-temperature multiferroic magnetoelectrics. NPG
Asia Mater. 5, e72 (2013).
22. Kitagawa, Y. et al. Low-field magnetoelectric effect at room
temperature. Nat. Mater. 9, 797–802 (2010).
23. Wang, L. et al. Electric control of magnetism at room temperature.
Sci. Rep. 2, (2012).
24. Sanchez, D. A. et al. Room-temperature single phase multiferroic
magnetoelectrics: Pb(Fe, M)x(Zr,Ti)(1−x)O3 [M = Ta, Nb]. J. Appl. Phys. 113, 074105 (2013).
25. Keeney, L. et al. Magnetic Field-Induced Ferroelectric Switching in
Multiferroic Aurivillius Phase Thin Films at Room Temperature. J. Am. Ceram. Soc. 96, 2339–2357 (2013).
26. Evans, D. M. et al. Magnetic switching of ferroelectric domains at
room temperature in multiferroic PZTFT. Nat. Commun. 4, 1534
(2013).
27. Gich, M. et al. Multiferroic Iron Oxide Thin Films at Room
Temperature. Adv. Mater. 26, 4645–4652 (2014).
28. Thomasson, A. et al. Room temperature multiferroicity in
Ga0.6Fe1.4O3:Mg thin films. J. Appl. Phys. 113, 214101 (2013).
29. Wang, W. et al. Room-Temperature Multiferroic Hexagonal LuFeO 3
Films. Phys. Rev. Lett. 110, (2013).
78
30. Fiebig, M. Revival of the magnetoelectric effect. J. Phys. Appl. Phys. 38, R123–R152 (2005).
31. Eerenstein, W., Mathur, N. D. & Scott, J. F. Multiferroic and
magnetoelectric materials. Nature 442, 759–765 (2006).
32. Cheong, S.-W. & Mostovoy, M. Multiferroics: a magnetic twist for
ferroelectricity. Nat. Mater. 6, 13–20 (2007).
33. Wu, S. M. et al. Reversible electric control of exchange bias in a
multiferroic field-effect device. Nat. Mater. 9, 756–761 (2010).
34. Wu, S. M. et al. Full Electric Control of Exchange Bias. Phys. Rev.
Lett. 110, (2013).
35. Eerenstein, W., Wiora, M., Prieto, J. L., Scott, J. F. & Mathur, N. D.
Giant sharp and persistent converse magnetoelectric effects in
multiferroic epitaxial heterostructures. Nat. Mater. 6, 348–351 (2007).
36. Wang, J. J. et al. Effect of strain on voltage-controlled magnetism in
BiFeO3-based heterostructures. Sci. Rep. 4, (2014).
37. Burton, J. D. & Tsymbal, E. Y. Prediction of electrically induced
magnetic reconstruction at the manganite/ferroelectric interface.
Phys. Rev. B 80, (2009).
38. Vaz, C. A. F. et al. Origin of the Magnetoelectric Coupling Effect in Pb
( Zr 0.2 Ti 0.8 ) O 3 / La 0.8 Sr 0.2 MnO 3 Multiferroic Heterostructures.
Phys. Rev. Lett. 104, (2010).
39. Heron, J. T. et al. Electric-Field-Induced Magnetization Reversal in a
Ferromagnet-Multiferroic Heterostructure. Phys. Rev. Lett. 107,
(2011).
79
40. Mannhart, J. & Schlom, D. G. Oxide interfaces--an opportunity for
electronics. Science 327, 1607–1611 (2010).
41. Zubko, P., Gariglio, S., Gabay, M., Ghosez, P. & Triscone, J.-M.
Interface Physics in Complex Oxide Heterostructures. Annu. Rev. Condens. Matter Phys. 2, 141–165 (2011).
42. Hwang, H. Y. et al. Emergent phenomena at oxide interfaces. Nat.
Mater. 11, 103–113 (2012).
43. Chakhalian, J., Millis, A. J. & Rondinelli, J. Whither the oxide
interface. Nat. Mater. 11, 92–94 (2012).
44. He, Q. et al. Magnetotransport at Domain Walls in BiFeO 3. Phys. Rev.
Lett. 108, (2012).
45. Geng, Y. et al. Direct visualization of magnetoelectric domains. Nat.
Mater. 13, 163–167 (2013).
46. Fechner, M. et al. Magnetic phase transition in two-phase
multiferroics predicted from first principles. Phys. Rev. B 78, (2008).
47. Zhuravlev, M. Y., Sabirianov, R. F., Jaswal, S. S. & Tsymbal, E. Y.
Giant Electroresistance in Ferroelectric Tunnel Junctions. Phys. Rev. Lett. 94, (2005).
48. Kohlstedt, H., Pertsev, N. A., Rodríguez Contreras, J. & Waser, R.
Theoretical current-voltage characteristics of ferroelectric tunnel
junctions. Phys. Rev. B 72, (2005).
49. Yin, Y. W. et al. Enhanced tunnelling electroresistance effect due to a
ferroelectrically induced phase transition at a magnetic complex
oxide interface. Nat. Mater. 12, 397–402 (2013).
80
50. Tsymbal, E. Y. APPLIED PHYSICS: Tunneling Across a Ferroelectric.
Science 313, 181–183 (2006).
51. Wang, W.-G., Li, M., Hageman, S. & Chien, C. L.
Electric-field-assisted switching in magnetic tunnel junctions. Nat. Mater. 11, 64–68 (2011).
52. Tsymbal, E. Y. Spintronics: Electric toggling of magnets. Nat. Mater.
11, 12–13 (2011).
53. Pantel, D., Goetze, S., Hesse, D. & Alexe, M. Reversible electrical
switching of spin polarization in multiferroic tunnel junctions. Nat. Mater. 11, 289–293 (2012).
54. Ohtomo, A., Muller, D. A., Grazul, J. L. & Hwang, H. Y. Artificial
charge-modulationin atomic-scale perovskite titanate superlattices.
Nature 419, 378–380 (2002).
55. Okamoto, S. & Millis, A. J. Electronic reconstruction at an interface
between a Mott insulator and a band insulator. Nature 428, 630–633
(2004).
56. Verbeeck, J., Lebedev, O. I., Van Tendeloo, G. & Mercey, B. SrTiO 3
( 100 ) / ( LaMnO 3 ) m ( SrMnO 3 ) n layered heterostructures: A
combined EELS and TEM study. Phys. Rev. B 66, (2002).
57. Pailloux, F. et al. Nanoscale analysis of a SrTiO 3 / La 2 / 3 Sr 1 / 3
MnO 3 interface. Phys. Rev. B 66, (2002).
58. Yamada, H. Engineered Interface of Magnetic Oxides. Science 305,
646–648 (2004).
59. Lüpke, G. Characterization of semiconductor interfaces by
second-harmonic generation. Surf. Sci. Rep. 35, 75–161 (1999).

81
60. Shen, Y. R. The principles of nonlinear optics. (Wiley-Interscience,
2003).
61. LANDAU, L. D. & LIFSHITZ, E. M. Electrodynamics of continuous
media vol. 8. (1960).
62. Qiu, Z. Q. & Bader, S. D. Surface magneto-optic Kerr effect. Rev. Sci.
Instrum. 71, 1243 (2000).
63. Daboo, C. et al. Vectorial magnetometry with the magneto-optic Kerr
effect applied to Co/Cu/Co trilayer structures. Phys. Rev. B 47,
11852–11859 (1993).
64. Rasing, T. Nonlinear magneto-optics. J. Magn. Magn. Mater. 175,
35–50 (1997).
65. Rasing, T. Nonlinear magneto-optical probing of magnetic interfaces.
Appl. Phys. B Lasers Opt. 68, 477–484 (1999).
66. Pan, R.-P., Wei, H. D. & Shen, Y. R. Optical second-harmonic
generation from magnetized surfaces. Phys. Rev. B 39, 1229–1234
(1989).
67. Burton, J. D. & Tsymbal, E. Y. Magnetoelectric interfaces and spin
transport. Philos. Trans. R. Soc. Math. Phys. Eng. Sci. 370,
4840–4855 (2012).
68. Vaz, C. A. F., Walker, F. J., Ahn, C. H. & Ismail-Beigi, S. Intrinsic
interfacial phenomena in manganite heterostructures. J. Phys. Condens. Matter 27, 123001 (2015).
69. Ohtomo, A. & Hwang, H. Y. A high-mobility electron gas at the
LaAlO3/SrTiO3 heterointerface. Nature 427, 423–426 (2004).
82
70. Ueda, K. Ferromagnetism in LaFeO3-LaCrO3 Superlattices. Science
280, 1064–1066 (1998).
71. Chakhalian, J. et al. Orbital reconstruction and covalent bonding at
an oxide interface. Science 318, 1114–1117 (2007).
72. Tokura, Y. & Hwang, H. Y. Condensed-matter physics: Complex
oxides on fire. Nat. Mater. 7, 694–695 (2008).
73. Reyren, N. et al. Superconducting interfaces between insulating
oxides. Science 317, 1196–1199 (2007).
74. Garcia, V. et al. Ferroelectric control of spin polarization. Science
327, 1106–1110 (2010).
75. Volger, J. Further experimental investigations on some
ferromagnetic oxidic compounds of manganese with perovskite
structure. Physica 20, 49–66 (1954).
76. Kusters, R. M., Singleton, J., Keen, D. A., McGreevy, R. & Hayes, W.
Magnetoresistance measurements on the magnetic semiconductor
Nd0.5Pb0.5MnO3. Phys. B Condens. Matter 155, 362–365 (1989).
77. von Helmolt, R., Wecker, J., Holzapfel, B., Schultz, L. & Samwer, K.
Giant negative magnetoresistance in perovskitelike La 2 / 3 Ba 1 / 3
MnO x ferromagnetic films. Phys. Rev. Lett. 71, 2331–2333 (1993).
78. Chahara, K., Ohno, T., Kasai, M. & Kozono, Y. Magnetoresistance in
magnetic manganese oxide with intrinsic antiferromagnetic spin
structure. Appl. Phys. Lett. 63, 1990 (1993).
79. Ju, H. L., Kwon, C., Li, Q., Greene, R. L. & Venkatesan, T. Giant
magnetoresistance in La1−xSrxMnOz films near room temperature. Appl. Phys. Lett. 65, 2108 (1994).
83
80. Jin, S. et al. Thousandfold Change in Resistivity in Magnetoresistive
La-Ca-Mn-O Films. Science 264, 413–415 (1994).
81. Xiong, G. C. et al. Giant magnetoresistive memory effect in
Nd0.7Sr0.3MnOz films. Appl. Phys. Lett. 67, 3031 (1995).
82. Fang, Z., Solovyev, I. V. & Terakura, K. Phase Diagram of Tetragonal
Manganites. Phys. Rev. Lett. 84, 3169–3172 (2000).
83. Molegraaf, H. J. A. et al. Magnetoelectric Effects in Complex Oxides
with Competing Ground States. Adv. Mater. 21, 3470–3474 (2009).
84. Dong, S., Zhang, X., Yu, R., Liu, J.-M. & Dagotto, E. Microscopic
model for the ferroelectric field effect in oxide heterostructures.
Phys. Rev. B 84, (2011).
85. Burton, J. D. & Tsymbal, E. Y. Giant Tunneling Electroresistance
Effect Driven by an Electrically Controlled Spin Valve at a Complex
Oxide Interface. Phys. Rev. Lett. 106, (2011).
86. Urushibara, A. et al. Insulator-metal transition and giant
magnetoresistance in La 1 − x Sr x MnO 3. Phys. Rev. B 51,
14103–14109 (1995).
87. Kajimoto, R., Yoshizawa, H., Tomioka, Y. & Tokura, Y. Stripe-type
charge ordering in the metallic A -type antiferromagnet Pr 0.5 Sr 0.5
MnO 3. Phys. Rev. B 66, (2002).
88. Colossal magnetoresistive oxides. (Gordon and Breach Science
Publishers, 2000).
89. Ōtsuka, J. Electrostatic Interaction of d n Systems in Tetragonal
Fields. J. Phys. Soc. Jpn. 21, 596–620 (1966).
84
90. Castellani, C., Natoli, C. R. & Ranninger, J. Metal-insulator transition
in pure and Cr-doped V 2 O 3. Phys. Rev. B 18, 5001–5013 (1978).
91. Zener, C. Interaction between the d -Shells in the Transition Metals. II.
Ferromagnetic Compounds of Manganese with Perovskite Structure.
Phys. Rev. 82, 403–405 (1951).
92. Moreo, A. Phase Separation Scenario for Manganese Oxides and
Related Materials. Science 283, 2034–2040 (1999).
93. Fujishiro, H., Ikebe, M. & Konno, Y. Phase Transition to
Antiferromagnetic State in La 1 - X Sr X MnO 3 ( X ≥0.5). J. Phys. Soc. Jpn. 67, 1799–1800 (1998).
94. Dagotto, E. Nanoscale phase separation and colossal
magnetoresistance: the physics of manganites and related compounds. (Springer, 2003).
95. de Groot, R. A., Mueller, F. M., Engen, P. G. van & Buschow, K. H. J.
New Class of Materials: Half-Metallic Ferromagnets. Phys. Rev. Lett. 50, 2024–2027 (1983).
96. Okimoto, Y. et al. Anomalous Variation of Optical Spectra with Spin
Polarization in Double-Exchange Ferromagnet: La 1 − x Sr x MnO 3. Phys. Rev. Lett. 75, 109–112 (1995).
97. Hwang, H. Y., Cheong, S.-W., Ong, N. P. & Batlogg, B. Spin-Polarized
Intergrain Tunneling in La 2 / 3 Sr 1 / 3 MnO 3. Phys. Rev. Lett. 77,
2041–2044 (1996).
98. de Boer, P. K., van Leuken, H., de Groot, R. A., Rojo, T. & Barberis, G.
E. Electronic structure of La0.5Ca0.5MnO3. Solid State Commun. 102, 621–626 (1997).
85
99. Damjanovic, D. Ferroelectric, dielectric and piezoelectric properties
of ferroelectric thin films and ceramics. Rep. Prog. Phys. 61,
1267–1324 (1998).
100. Iijima, K., Terashima, T., Yamamoto, K., Hirata, K. & Bando, Y.
Preparation of ferroelectric BaTiO3 thin films by activated reactive
evaporation. Appl. Phys. Lett. 56, 527 (1990).
101. Vaudin, M. D. et al. Texturing and Dielectric Properties of Laser
Deposited BaTiO3 Thin Films Grown on Heated Substrates. MRS Proc. 243, (1991).
102. Kuwabara, M., Takahashi, S. & Kuroda, T. Preparation of ferroelectric
BaTiO3 thin films on polycrystalline BaPbO3 substrates by sol-gel
processing and their electrical properties. Appl. Phys. Lett. 62, 3372
(1993).
103. Shieh, J., Yeh, J. H., Shu, Y. C. & Yen, J. H. Hysteresis behaviors of
barium titanate single crystals based on the operation of multiple 90°
switching systems. Mater. Sci. Eng. B 161, 50–54 (2009).
104. Fukuda, Y. et al. Dielectric Properties of (Ba, Sr)TiO3 Thin Films and
their Correlation with Oxygen Vacancy Density. Jpn. J. Appl. Phys. 36, L1514–L1516 (1997).
105. Jona, F. & Shirane, G. Ferroelectric crystals. (Dover Publications,
1993).
106. Wada, S. et al. Enhanced Piezoelectric Property of Barium Titanate
Single Crystals with Engineered Domain Configurations. Jpn. J. Appl. Phys. 38, 5505–5511 (1999).
107. Kim, E. et al. Second-Harmonic Generation of Single BaTiO 3
Nanoparticles down to 22 nm Diameter. ACS Nano 7, 5343–5349
(2013).
86
108. Yoo, H.-I., Chang, M.-W., Oh, T.-S., Lee, C.-E. & Becker, K. D.
Electrocoloration and oxygen vacancy mobility of BaTiO[sub 3]. J. Appl. Phys. 102, 093701 (2007).
109. Yin, Y. W. et al. Enhanced tunnelling electroresistance effect due to a
ferroelectrically induced phase transition at a magnetic complex
oxide interface. Nat. Mater. 12, 397–402 (2013).
110. Vaz, C. A. F., Hoffman, J., Ahn, C. H. & Ramesh, R. Magnetoelectric
Coupling Effects in Multiferroic Complex Oxide Composite
Structures. Adv. Mater. 22, 2900–2918 (2010).
111. Vaz, C. A. F. Electric field control of magnetism in multiferroic
heterostructures. J. Phys. Condens. Matter 24, 333201 (2012).
112. Fernandes Vaz, C. A. & Staub, U. Artificial multiferroic
heterostructures. J. Mater. Chem. C 1, 6731 (2013).
113. Huang, X. & Dong, S. Ferroelectric control of magnetism and
transport in oxide heterostructures. Mod. Phys. Lett. B 28, 1430010
(2014).
114. Tazaki, R., Fu, D., Itoh, M., Daimon, M. & Koshihara, S. Lattice
distortion under an electric field in BaTiO 3 piezoelectric single
crystal. J. Phys. Condens. Matter 21, 215903 (2009).
115. Burton, J. D. & Tsymbal, E. Y. Evolution of the band alignment at
polar oxide interfaces. Phys. Rev. B 82, (2010).
116. Ma, X. et al. Charge control of antiferromagnetism at
PbZr0.52Ti0.48O3/La0.67Sr0.33MnO3 interface. Appl. Phys. Lett. 104,
132905 (2014).
87
117. Goren, D., Amir, N. & Nemirovsky, Y. Determination of the interface
charge between an epilayer and a substrate using
capacitance-voltage measurements. J. Appl. Phys. 71, 318 (1992).
118. Goren, D. & Nemirovsky, Y. Determination of interface properties
between a depleted heteroepitaxial layer and a substrate from
capacitance measurements. J. Appl. Phys. 77, 244 (1995).
119. Pintilie, L. & Alexe, M. Metal-ferroelectric-metal heterostructures
with Schottky contacts. I. Influence of the ferroelectric properties. J. Appl. Phys. 98, 124103 (2005).
120. Pintilie, L. et al. Metal-ferroelectric-metal structures with Schottky
contacts. II. Analysis of the experimental current-voltage and
capacitance-voltage characteristics of Pb(Zr,Ti)O[sub 3] thin films. J. Appl. Phys. 98, 124104 (2005).
121. Bowen, M. et al. Nearly total spin polarization in La[sub 2/3]Sr[sub
1/3]MnO[sub 3] from tunneling experiments. Appl. Phys. Lett. 82, 233
(2003).
122. Rana, K. G. et al. Hot electron transport in a strongly correlated
transition-metal oxide. Sci. Rep. 3, (2013).
123. Neville, R. C. Permittivity of Strontium Titanate. J. Appl. Phys. 43,
2124 (1972).
124. Tomio, T., Miki, H., Tabata, H., Kawai, T. & Kawai, S. Control of
electrical conductivity in laser deposited SrTiO3 thin films with Nb
doping. J. Appl. Phys. 76, 5886 (1994).
125. Guo, X. ., Chen, X. . & Lu, W. Optical properties of Nb doped SrTiO3
from first principles study. Solid State Commun. 126, 441–446
(2003).
88
126. Lytle, F. W. X-Ray Diffractometry of Low-Temperature Phase
Transformations in Strontium Titanate. J. Appl. Phys. 35, 2212
(1964).
127.Yamada, H. & Miller, G. R. Point defects in reduced strontium titanate.
J. Solid State Chem. 6, 169–177 (1973).
128. Balachandran, U. & Eror, N. G. Electrical conductivity in strontium
titanate. J. Solid State Chem. 39, 351–359 (1981).
129. Frederikse, H. P. R., Thurber, W. R. & Hosler, W. R. Electronic
Transport in Strontium Titanate. Phys. Rev. 134, A442–A445 (1964).
130. Tufte, O. N. & Chapman, P. W. Electron Mobility in Semiconducting
Strontium Titanate. Phys. Rev. 155, 796–802 (1967).
131. Vigliante, A. et al. Coupling between lattice distortions and
magnetism in La 0.9 Sr 0.1 MnO 3 thin films. Europhys. Lett. EPL 54,
619–625 (2001).
132. Bellingeri, E., Pellegrino, L., Marré, D., Pallecchi, I. & Siri, A. S.
All-SrTiO[sub 3] field effect devices made by anodic oxidation of
epitaxial semiconducting thin films. J. Appl. Phys. 94, 5976 (2003).
133. Zhou, Q. et al. Transport property in SrTiO 3 p - n junction. Europhys.
Lett. EPL 71, 283–289 (2005).
134. Zhu, S. et al. Coexistence of large positive and negative
magnetoresistance in La0.7Ca0.3MnO3 films with microcracks. J. Magn. Magn. Mater. 313, 361–365 (2007).
135. Schiffer, P., Ramirez, A. P., Bao, W. & Cheong, S.-W. Low
Temperature Magnetoresistance and the Magnetic Phase Diagram of
La 1 − x Ca x MnO 3. Phys. Rev. Lett. 75, 3336–3339 (1995).
89
136.Levy, P. et al. Controlled phase separation in La0.5Ca0.5MnO3. Phys. Rev. B 62, 6437–6441 (2000).
137. Freitas, R. S., Ghivelder, L., Levy, P. & Parisi, F. Magnetization
studies of phase separation in La 0.5 Ca 0.5 MnO 3. Phys. Rev. B 65,
(2002).
138. Huijben, M. et al. Critical thickness and orbital ordering in ultrathin
La 0.7 Sr 0.3 MnO 3 films. Phys. Rev. B 78, (2008).
139. Herger, R. et al. Structure determination of monolayer-by-monolayer
grown La 1 − x Sr x MnO 3 thin films and the onset of magnetoresistance. Phys. Rev. B 77, (2008).
140. Konishi, Y. et al. Orbital-State-Mediated Phase-Control of
Manganites. J. Phys. Soc. Jpn. 68, 3790–3793 (1999).
141. Izumi, M. et al. Insulator-metal transition induced by interlayer
coupling in La 0.6 Sr 0.4 MnO 3 / SrTiO 3 superlattices. Phys. Rev. B
64, (2001).
142. Ogimoto, Y. et al. Tunneling Magnetoresistance above Room
Temperature in La 0.7 Sr 0.3 MnO 3 /SrTiO 3 /La 0.7 Sr 0.3 MnO 3
Junctions. Jpn. J. Appl. Phys. 42, L369–L372 (2003).
143. Simon, J. et al. Diffusion and segregation effects in doped
manganite/titanate heterostructures. Appl. Phys. Lett. 84, 3882
(2004).
144. Belenky, L. J., Ke, X., Rzchowski, M. & Eom, C. B. Epitaxial La[sub
0.67]Sr[sub 0.33]MnO[sub 3]∕La[sub 0.67]Ba[sub 0.33]MnO[sub 3] superlattices. J. Appl. Phys. 97, 10J107 (2005).