optimising management actions for the conservation of
TRANSCRIPT

Optimising management actions
for the conservation of threatened
species in Kakadu National ParkBackground Paper for Kakadu National Park Threatened Species Strategy
By J.C.Z. Woinarski and S. Winderlich - October 2014

Cover photo of Northern Quoll Dasyurus hallucatus by Jonathan Webb
Kakadu landscapes by Professor Michael Douglas (this page) and Michael Lawrence-Taylor (last page)
ISBN 978-1-925167-08-5
Acknowledgements
This document supports ‘A strategy for the conservation of threatened species and threatened ecological communities in Kakadu National Park | 2014-2024’.
The Strategy was commissioned by Kakadu National Park. It responds to the interest and concerns of the Kakadu Board of Management, traditional owners, staff in Kakadu National Park and Parks Australia, and the Kakadu Research Advisory Committee.
The strategy will be progressively implemented by Kakadu National Park over 10 years. Some recommendations are already being implemented, while others require further planning and consultation.
This strategy was developed with the support of the North Australian Hub of the National Environmental Research Program. Michael Douglas oversaw the management and production of this strategy, and Jaana Dielenberg and Carli Piltz its layout and production.
Vanessa Adams, Nick Dexter, Sam Flakus and Alaric Fisher provided helpful comments on earlier drafts.
The strategy was initiated at a workshop held in Kakadu in March 2013, with the attendance and significant inputs from Alan Andersen, Roy Anderson, Frederick Baird, Mathias Baird, Josh Bean, Ryan Barrowei, Stuart Blanch, Mary Blyth, Roman Chaloupka, Peter Christophersen, Peter Cooke, Anthony Contarino, Ian Cowie, Samantha Deegan, Mark Ellis, Katie Elsley, Alaric Fisher, Stephen Garnett, Cherie Gellert, Graeme Gillespie, Louise Harrison, Michael Hammer, Fred Hunter, Jenny Hunter, Craig Ingram, Sarah Kerin, Peter Kyne, Violet Lawson, Jeff Lee, Sandra McGregor, Dan McIntyre, Andrew McPhee, Brendan Mee, Greg Miles, Ian Morris, Gleeson Nabulwad, Grant Nayinggul, Connie Nayinggul, Anne O’Dea, Gabrielle O’Loughlin, Margaret Rawlinson, Buck Salau, Ben Tyler, Berribob Watson, Sean Webster, Dion Wedd, Kathy Wilson and Dean Yibarbuk. Subsequent further advice was provided by Alan Andersen, Ian Cowie, Alaric Fisher, Stephen Garnett, Graeme Gillespie, Peter Kyne and Dion Wedd.
For their participation in, and expert inputs to, the management prioritisation component background document, we thank Michael Braby, Andrew Burbidge, Josie Carwardine, Ian Cowie, Ron Firth, Alaric Fisher, Anke Frank, Stephen Garnett, Michael Hammer, Brydie Hill, Chris Humphrey, Michelle Ibbett, Sarah Kerin, Peter Kyne, Sarah Legge, Damian Milne, Ian Radford, Jeremy Russell-Smith, Simon Ward and Dion Wedd.

1
ContentsSummary ..............................................................................................................................3
Introduction .........................................................................................................................7
Methods ...............................................................................................................................8
Results ................................................................................................................................13
Discussion ...........................................................................................................................18
References .........................................................................................................................23
Appendix A - List of threatened species reported from Kakadu ...................................64
Appendix B - Species reported from Kakadu and listed as Near Threatened under the Northern Territory’s Parks and Wildlife Conservation Act .............................................. 66
Appendix C - List of culturally significant species included in this assessment .............69
Appendix D - Experts contributing to assessments and the groups to which they contributed .......................................................................................................................70
Appendix E - Hypothetical example to illustrate selection of best sets of management actions to solve different questions. ................................................................................ 71

2
Optimising management actions for the conservation of threatened species in Kakadu National Park
Dingo - Canis lupus dingo
Photo: Cassie McMaster
3
SummaryKakadu National Park is important for the conservation of very many threatened species, and the conservation of such species is a clear commitment under the Park’s Plans of Management. However, at least some of these threatened species are declining in Kakadu, suggesting that current management actions may not be optimal. Given the large number of threatened species, occurring across diverse habitats and affected by a wide range of threats, there is a large array of potential management actions that could, or need to, be implemented. However, resourcing for such management is finite, so there is a need to prioritise management actions in order to most cost-effectively make a substantial contribution to the conservation of threatened species. This report describes aspects of such prioritisation, following an approach previously used for management prioritisation for conservation in the Kimberley and Pilbara (Carwardine et al. 2011; Carwardine et al. 2014).
This report provides advice rather than a single definitive answer. One of its main conclusions is that the optimal management solution depends very much on the objective, and that there are many nuanced variations in objectives – e.g. whether the objective is to achieve the greatest benefit across all threatened species, the least likelihood of species becoming lost from Kakadu, the greatest likelihood of maintaining secure populations of species in Kakadu, and the extent to which these objectives are framed by budget constraints.
In this report, we consider all 75 threatened species that have been reported from Kakadu, along with 103 Near Threatened and 13 culturally significant species. Species are attributed values according to their conservation status, taxonomic distinctiveness, ecological significance and cultural value (and a combination of all of these attributes), and – in some analyses here – management actions that particularly benefit higher value species are accorded more weight.
A panel of 20 experts provided estimates of the likelihood of persistence (on a 0 to 100 scale) in Kakadu of all 191 species over a 20-year period under current management, under no management (i.e. abandonment) and under each of 7 existing and 35 possible candidate management actions. These actions were developed to encompass a wide range management options for putative threats for all species, and experts also rated the feasibility of the management action being implemented successfully.
For every candidate management action, cost (over a 20-year period) was also estimated, based largely on budgetary information for current Kakadu management activities. This costing is difficult to define explicitly because (i) current budgeting in Kakadu does not partition expenditure specifically towards threatened species’ conservation activities; (ii) many management are undertaken for multiple purposes and it is difficult to segregate out a component directed towards threatened species specifically; (iii) the costs and feasibility of some management actions is contingent on other actions (e.g. fire management will be substantially influenced by the control or otherwise of invasive pasture grasses); (iv) some of the candidate management actions may have highly variable costs depending upon contingencies (e.g. general weed biosecurity may be low in most years but may be high if a new outbreak of a highly invasive weed is detected); and (v) some candidate management actions have not been undertaken or implemented at large scale previously, so cost estimates may be partly conjectural.

4
Optimising management actions for the conservation of threatened species in Kakadu National Park
The experts considered that current management in Kakadu was benefitting most (but not all) of the species considered. Under no management, 13 species are considered unlikely to persist (i.e. persistence estimate <50) in Kakadu over a 20-year period. This group of species includes a set of species that may have already disappeared from Kakadu (Golden Bandicoot, Golden-backed Tree-rat, Northern Hopping-mouse, Water Mouse, Brush-tailed Rabbit-rat and the orchid Dienia montana) and another group of species that are probably currently declining (Northern Brush-tailed Phascogale, Northern Quoll, Spectacled Hare-wallaby, Arnhem Land Skink, Black-footed Tree-rat, Pale Field-rat and Nabarlek). In contrast, under current management, only the first six of these species (Golden Bandicoot to Dienia montana) are considered unlikely to persist in Kakadu over a 20-year period. If managers want to be more sure of species’ security (e.g. estimated persistence in Kakadu over a 20-year period of >80%), the number of species that need to be considered increases substantially (e.g. the number of species with persistence estimates over a 20-year period of <80 under current management is 33 and under no management is 77). Mammals comprise most of the species with low estimated persistence.
Across all species, the individual candidate management actions with greatest benefit (i.e. increase in persistence estimates above the level of persistence under no management) are strategic fire management in the lowlands and in the Stone Country (aiming to increase the extent of longer-unburnt habitat), broad-scale reduction of feral cats, and ex situ conservation and translocation of threatened plants. The ordering of actions according to their benefit varies substantially among different taxonomic groups of species. The relative ordering of candidate management actions changes appreciably when feasibility and cost is considered. Actions with high benefit:cost include control of gamba grass, general weed biosecurity, local-scale intensive control of cats, cat-proof exclosure fencing, pig-proof exclosure fencing, buffalo control, toad-proof exclosure fencing, the management of Indigenous harvest, and ex situ conservation and translocation of threatened plants.
This analysis uses Marxan to derive best sets (most cost-effective solutions) of management actions under a range of persistence targets (from 50% to 90%) and budget caps (from $20 m to $150 m over a 20-year period). The optimal mix of management actions, and the success rate (number of species meeting the persistence target) varied considerably across these scenarios. Solutions for scenarios with low persistence thresholds typically involved fewer, and mostly relatively inexpensive, management actions, and provided relatively little benefit across species generally. The number of species meeting persistence threshold targets under the optimal set of management actions was modelled across a threshold target levels and budget caps.
This modelling suggests that a 20-year budget of c. $35-40 million is required if the objective is to retain all species with a persistence estimate of at least 50%, of c. $140 million is required if the objective is to retain all species with a persistence estimate of at least 60%, and of c. $220-230 million is required if the objective is to retain all species with a persistence estimate of at least 70%.

5
Modelled (linear) distribution of the number of species failing to meet persistence thresholds (‘failures’) under varying combinations of persistence thresholds (‘persist_target’) and budget caps (‘cost_thresh’) in $m over 20 years. Black circles indicate points derived from the run Marxan scenarios; ; the colour codes represent the number of species that do not meet persistence targets.
Our interpretation of the results reported here suggests that a core set of management actions for threatened species in Kakadu should include:
(i) strategic fire management in the lowlands that increases the extent of longer-unburnt habitat. Although this is an expensive action, some form of fire management in Kakadu will be required for diverse reasons anyway, so it is desirable to implement a fire management approach that will provide more substantial benefit to threatened species, as this action does (Tables 8, 9) [estimated cost over 20 years of c. $28m];
(ii) at least localised intensive control of feral cats, or establishment and maintenance of some areas of cat exclosure fencing, with this action combined with reintroduction of a small set of mammal species that may already have been lost from Kakadu [estimated cost over 20 years of $6-16m];
(iii) maintenance of gamba grass control [estimated cost over 20 years of $3.5m];
(iv) maintenance and enhancement of fishing regulations and management of Indigenous hunting, in particular in relation to a set of threatened sawfish and sharks [estimated cost over 20 years of c. $7-8m];
(v) at least localised intensive control of pigs, at sites of conservation significance (e.g. rainforest patches that may have the orchid Dienia montana, and turtle nesting areas) [estimated cost over 20 years of $4-7 m];
(vi) maintenance of existing Stone Country fire management, or implementation of refinements to that program aimed at more intensive management of fire at key conservation sites [estimated cost over 20 years of $12-17m].
If even more resources were available, additional actions could include more attention to toad-susceptible species (potentially through introducing individuals that have toad-invaded areas elsewhere or localised toad-exclusion trials), ex situ conservation and reintroduction of some threatened plant species, broad-scale control of buffalo and of aquatic weeds.

6
Optimising management actions for the conservation of threatened species in Kakadu National Park
Cycas armstrongii
Photo: Kym Brennan

7
IntroductionFor many reasons, threatened species should be a focus for conservation management attention. There is an explicit obligation in national environmental legislation (the Environment Protection and Biodiversity Conservation Act) to seek to manage threatened species, and particularly so on lands owned or managed by the Commonwealth and where that management is framed by a recovery plan. By definition, many threatened species may become extinct rapidly if they are not appropriately managed, and such extinction may be seen to represent an especially tangible and irreversible failure of management. Many conservation reserves were established with an explicit purpose to conserve threatened species, and it is a reasonable expectation that such reserves will do this task better than lands managed without a primary objective for conservation. For Kakadu National Park, the conservation of many threatened species was one of the primary qualifying criteria for its World Heritage status. Furthermore, biodiversity conservation has continued to be an explicit and important component of the series of Plans of Management that guide the park’s operations and objectives.
However, there is relatively little evidence that threatened species are currently being managed effectively in Kakadu. There is no monitoring for most threatened species, so overall trends, and responses to management actions, are difficult to discern. For some monitored threatened species, the status in Kakadu is clearly towards decline (Woinarski et al. 2010; Woinarski et al. 2012).
In Kakadu, some management is explicitly directed towards some threatened species, but it is difficult to assess the extent of resourcing for any such management. Furthermore, there are very many threatened species in Kakadu, and there is no current framework for prioritising conservation actions among these threatened species.
Here, we use a systematic process of experts’ assessments to:
(i) evaluate the likelihood of persistence over the next 20 year period for all threatened species reported from Kakadu, assuming continuation of current management;
(ii) assess the extent to which current management is enhancing the likelihood of persistence relative to a default option of no management;
(iii) evaluate the likelihood of persistence over the next 20 year period for all threatened species, for each of a series of individual management actions;
(iv) assess the feasibility and cost of such management actions;
(v) identify the actions that achieve the greatest net conservation benefit to the set of threatened species; and
(vi) identify the optimal set of actions that collectively provide the greatest net conservation benefit to the set of threatened species, under a range of management resourcing scenarios.
Faced with a general pattern of biodiversity decline, and of reducing or constrained budgets, many management agencies are now recognising a need to prioritise among threatened species and/or management options. There has been a recent proliferation of approaches to this concern, broadly divided into prioritisation of species (based typically on societal value, evolutionary distinctiveness, ecological role, distribution, extent of endangerment or costs and likelihood of recovery) or of management actions (with prioritisation based on the number of species that are benefited (or for which extinction is averted) by an action, and its relative costs). There is a wide range of methodological approaches, and cost-benefit assessments have been evaluated across a range of different time-scales and weightings (Peeters 2014; Ponce-Reyes et al. 2014). However, most of these approaches are broadly complementary.
8
Optimising management actions for the conservation of threatened species in Kakadu National Park
In this assessment, we adopt an approach that has recently been developed, and applied, to prioritise management actions for threatened and other species in the Kimberley (Carwardine et al. 2011; Carwardine et al. 2012) and in the Pilbara (Carwardine et al. 2014). These are considered good precedents for Kakadu because they relate to broadly similar numbers of threatened species (including at least some of the same species as for Kakadu), broadly similar numbers of potential management actions (including at least some of the same actions as for Kakadu) and broadly similar environments. Furthermore, in both cases, the results from these previous studies have been implemented, at least in part, by the relevant management authority (the Western Australian Department of Parks and Wildlife), indicating that the outputs from the approach are realistic and applicable.
For the Kakadu case here, we also refine analyses to include some consideration of prioritisation of species (rather than of management actions alone). Where noted later, we also consider the extent to which actions selected as priorities for the management of threatened species also provide benefit (or detriment) for Near Threatened species and for culturally significant species.
The fundamental variable used in the Kimberley and Pilbara studies, and adopted here, is the likelihood of persistence of the species in the area over a 20 year period commencing at the initiation of the selected management action. This likelihood of persistence ranges from 0 (i.e. certain to become extinct over the 20 years) to 100 (certain to be still extant in the area 20 years hence): obviously, this variable can be subtracted from 100 to be re-labelled as the likelihood of extirpation (regional extinction). The 20 year time period is chosen because it represents a reasonable mix of foreseeable threatening factors and a long-enough period for management actions to have impact. If the interval was extended over a longer time period, most experts would be unlikely to offer plausible predictions (e.g. if substantial climate change re-cast the workings of these environments). If the interval was reduced, it is likely that most experts would score a likelihood of persistence for all species as 100 under all actions. The likelihood of persistence is selected as the outcome measure because it is considered too difficult to predict change in abundance, and especially so as, in most cases, current population size is unknown for most species.
MethodsList of species considered
Three groups of species were included in this assessment:
(i) threatened species, comprising all plant and animal species recorded from Kakadu that are currently (as at October 2014) listed as threatened (Critically Endangered, Endangered or Vulnerable) under Australian national legislation (the Environment Protection and Biodiversity Conservation Act), Northern Territory (the Australian jurisdiction in which Kakadu occurs) legislation (the Territory Parks and Wildlife Conservation Act) or in the IUCN Red List [Appendix A];
(ii) Near Threatened species, comprising all plant and animal species recorded from Kakadu that are currently listed as Near Threatened under Northern Territory legislation (noting that this category is not recognised under Australian legislation) [Appendix B]; and
(iii) Culturally Significant species, comprising a group of plant and animal species not currently listed as threatened or Near Threatened but which are known to be of cultural significance to Kakadu’s Aboriginal landowners (Winderlich and O’Dea 2014) [Appendix C]. Note that some culturally significant species are included also in the threatened and Near Threatened lists, and that we recognise that many other species have some cultural significance.
9
In the first set (i.e. threatened species), there is a notable level of discordance between listings, notwithstanding that IUCN Red List criteria are used for assessment for both the Northern Territory listing and IUCN Red List listing, and are modified only marginally for Australian listing. However, the listing processes and geographic context are notably different. The Northern Territory conservation status is based on a comprehensive review of all plant and vertebrate (and some invertebrate) species at c. 5 year intervals (most recently in 2012). The Australian conservation status is based on a listing developed prior to 1999, with relatively ad hoc subsequent additions or deletions. The IUCN Red List status is comprehensive and recent for some taxonomic groups, but consideration across groups has been patchy. Self-evidently, the IUCN Red List considers international context, the Australian list is based on conservation parameters for Australia only, and the Northern Territory list relates to parameters for populations only in that jurisdiction. Note that a small number of the listed threatened and Near Threatened species are subspecies: for simplicity, and following the usage in the EPBC Act, these are treated as species in this report.
Note that the Australian legislation also allows for listing of threatened ecological communities, and that one such community (Arnhem Plateau Sandstone Shrubland Complex) occurs in part in Kakadu. This entity is not included in this review, although many of its significant constituent species are included.
The Near Threatened and culturally significant species were included because (i) some Near Threatened species could be expected to become eligible for listing as threatened over the 20-year timeframe considered here, and hence may merit specific conservation attention over this time frame; (ii) Aboriginal landowners set a high priority on Kakadu management maintaining species that are culturally important to them (Director of National Parks 2007); (iii) we wanted to assess the extent to which the conservation actions considered for currently listed threatened species would also benefit, or be detrimental to, Near Threatened and culturally significant species.
The total numbers of species considered are summarised in Table 1. There are 75 threatened species (mostly comprising plants, reptiles, birds and mammals), 103 Near Threatened species (mostly plants) and 13 culturally significant species. Although at least 25 native amphibian species occur in Kakadu (Press et al. 1995), none are regarded as threatened, Near Threatened or culturally significant (Gillespie and Fisher 2014).
The listing includes two ‘marginal’ groups of species. There is a small set of threatened mammal species that were formerly resident in the Kakadu area but for which there are no recent records from Kakadu: Northern Hopping-mouse (recorded in Kakadu only from subfossils, but with a nearby recent (1973) record), Golden-backed Tree-rat (with the only confirmed records from Kakadu being in 1903 and 1969), Water Mouse (with the only confirmed Kakadu records being in 1903), and Golden Bandicoot (with the only Kakadu records in 1902-03 and 1967) (Woinarski 2004; Winderlich and Woinarski 2014). These species may have been extirpated from the Kakadu area, or may persist in very low numbers. A second set of species comprised some non-resident marine turtle species, and some shorebird and other species that may occur only occasionally in Kakadu: that is, they are essentially vagrants or incidentals in this area.
Comparable to other species’ prioritisation systems (Peeters 2014), for every species considered, values were attributed for four variables:
• Taxonomic distinctiveness. A score of 3 was assigned for species that are in a monospecific genus; 2 for species with 2-5 species in their genus; 1 for species with 6-10 species in their genus; and 0 for species in genera with more than 10 species.
• Cultural value. A score of 3 was assigned for species known to be important food sources or otherwise of profound spiritual significance; 2 for species with some spiritual significance or of some importance as a food source; 1 for species with little known cultural significance; and 0 for species with no known cultural significance, with scoring interpreted from Press (1986) and Winderlich and O’Dea (2014).

10
Optimising management actions for the conservation of threatened species in Kakadu National Park
• Ecological significance. A score of 3 was assigned for species that make an essential contribution to ecosystem function and whose removal may cause ecosystem collapse; 2 for species that make an important contribution to ecosystem function and whose removal may have substantial consequences for one to several other species; 1 for species with minor impacts on other species; and 0 for species whose loss is likely to lead to no consequences for any other species.
• Kakadu significance. A score of 5 was assigned for species that are endemic to Kakadu; 4 for species for which an estimated 30 to 99% of the range or population size occurs in Kakadu; 3 for species with 10 to 30% of the range or population in Kakadu; 2 for species with 5-10% of their range or population in Kakadu; and 1 for species with less than 5% of their range or population in Kakadu. In this case, this variable recognises that for some species Kakadu may be the only possible place at which conservation management can be affected, whereas for other species, actions in Kakadu may have negligible impacts on the overall species’ populations or conservation outlook because Kakadu comprises a negligible proportion of the species’ range or population.
Indicative of the significance of Kakadu for threatened and Near Threatened species, eight threatened and ten Near Threatened species are endemic to Kakadu, and a further 15 threatened and 20 Near Threatened species have at least 30% of their distribution or population size in Kakadu.
Species were also categorised into a primary habitat based on the major environmental disjunction in Kakadu between the lowlands (including marine and lower reaches of rivers) and uplands (the sandstone plateau and escarpment of western Arnhem Land). Only a small minority of species occurred in both of these environments.
Candidate management actions
A set of candidate management actions was developed based on the experience of current Kakadu managers, and with input from experts familiar with the threats known to affect threatened species in this region (Table 2). This listing is substantial because Kakadu is a very diverse area, the set of species considered here is very heterogeneous, and there are many threats and potential management responses to those threats. Most actions were listed separately for lowland and upland environments, in part because access differences render management costs notably different between these, and in part because some existing management strategies and actions are already being implemented separately for these two different environments (Petty et al. 2007). Most management actions related to a particular threat, but we also sought to provide alternative management responses to some threats (e.g. the establishment of predator-proof exclosures and the broad-scale control of feral cats were considered to be two separate but plausible management responses to the threat posed by feral cats).
For each action, respondents provided a feasibility (F) estimate [from 0 (impossible to achieve) to 1 (entirely feasible to achieve)], the likelihood that, given adequate funding, managers could implement the action successfully.

11
For each candidate management action, Kakadu managers provided an estimate of cost (C) over a 20 year period, including establishment costs (e.g. for material to install cat exclosure fencing), ongoing operational costs (e.g. to maintain such fencing), and field and supervisory wages. These estimates were not straightforward to derive, as (i) Kakadu’s existing budget structure does not provide delineation of costs, actions or staff devoted primarily to the management of threatened species; (ii) many of the current and proposed candidate management actions provide benefit (or were designed primarily) for purposes or attributes other than threatened species conservation, or as part of broader programs, so it is challenging to delineate a costing specifically for threatened species in isolation from these other purposes of management; (iii) personnel expenses may need to consider not only simple sums of wages by full time equivalent personnel, but also include associated housing, training and other costs; and (iv) projecting budgets across a 20 year cycle with factors that may be difficult to anticipate, is challenging.
Most management actions were considered individually, but we also included several packages of multiple actions. We sought to make candidate management actions as independent as possible, but given that at least some threats operate interactively (for example invasive grasses and fire), it is probably somewhat unrealistic to treat some management actions as autonomous and unrelated to other management actions.
We also included the maintenance of the set of existing management actions (i.e. status quo) and a ‘no management’ (abandonment) scenario. In the latter scenario, we assumed that existing legislative controls remain in place (e.g. the abandonment scenario didn’t envisage such activities as broad-scale clearing – instead simply the withdrawal of current management actions).
Contributing experts
We sought contributions from a wide range of experts with some familiarity with threatened species occurring in Kakadu, and of their management. In some cases, we also included experts familiar with the species elsewhere in their range, rather than in Kakadu. More than 30 experts, including scientists and Kakadu managers, were approached. Ultimately, we received assessments from 20 experts (Appendix D). Experts chose how many species they provided information on, rather than being obliged to provide opinions on all species, including those that they were unfamiliar with. Because of different degrees of specialisation and experience, experts varied substantially in the number of taxa that they assessed.
Experts provided assessments, by email in an excel spreadsheet (of a matrix of species x management actions), entirely independently of all other contributors, but were allowed to use a provided dossier of current information for every species.
Experts were also asked to provide an indication of their confidence in the assessment for each species, with this confidence rating being scored as 3 for species that the expert considered that they knew well, 2 for species that they had reasonable knowledge of, and 1 for species for which the expert considered that their assessment was of limited reliability.
An optimal Delphi process for expert elicitation allows for experts to reconsider and revise their original assessments in light of subsequent pooled comparable assessments from other experts (Martin et al. 2012; McBride et al. 2012). This step was not included in this exercise, because it was challenging enough to get one set of assessments from enough experts. Likewise, a recommended Delphi step of experts providing not only a single estimate of most likely value, but also a bounded range of plausible values and a confidence estimate for their assessed value, was not included because it would have very substantially added (by increasing four-fold the number of requested values) to the requests made from experts to an already large array (191 species x 42 management actions).

12
Optimising management actions for the conservation of threatened species in Kakadu National Park
Likelihood of persistence under different management actions
Experts were asked independently to estimate the likelihood of persistence over the next 20 years in Kakadu for all species for which they had some experience or expertise, with estimates given for continuation of current management, under no management and for every candidate management action operating alone or in the bundled sets of actions. This parameter was scaled from 0 (the species was certain to become extirpated in Kakadu if that action alone was implemented) to 100 (the species was certain to persist if that management action alone was implemented): i.e. a score of 50 indicates that the species was considered to be as likely to become extirpated as to persist over the 20 year period. For many species, such estimates were informed by population trend information from substantial monitoring programs in Kakadu extending over periods of up to 20 years (Edwards et al. 2003; Russell-Smith et al. 2009; Woinarski et al. 2010; Woinarski et al. 2012).
Every expert entered, to a structured excel spreadsheet, their estimates of persistence scores for the species that they assessed, for every candidate management action. These spreadsheets were examined and any apparently aberrant scores prompted queries back to the expert: these few cases typically arose as typographic errors. To examine variation among experts in scoring, we calculated, for every expert, the mean of their persistence estimate scores across the species that they assessed, for each of the two baseline management scenarios – maintenance of existing management and no management (abandonment). These means are not strictly comparable between experts because each expert scored a different set of species.
Scoring was then collated across experts. Across estimates of all experts, a weighted mean likelihood of persistence was calculated for each cell in the matrix of species by candidate management actions (including maintenance of existing management and no management), with weighting by the expert’s confidence in assessment for each species. For example, for species X if expert A considered that they knew the species well (i.e. gave themselves a confidence rating of 3) and scored its likelihood of persistence under management action T as 90, and expert A with confidence rating of 1 for that species estimated its likelihood of persistence under management action T as 60, then the weighted mean estimate of persistence was ((3x90)+(1x60))/4 = 82.5.
Individual species were ranked on the basis of their mean persistence scores under the regimes of current management and no management, in order to identify the species considered most likely to become extirpated in Kakadu over the 20 year period.
For most analyses reporting the response of individual species to individual candidate management actions, we record results as improvement from the null baseline (i.e. no management) estimate of persistence: e.g. if the mean estimate of persistence for species X under candidate management action T was 85 and the mean estimate of persistence for species X under no management (abandonment) was 50, then the benefit of action T for species X was given as 35. These benefit scores arising from a particular candidate management action were averaged over all species, to derive a mean benefit score for each candidate management action. In some analyses, as specified in the Results section, benefit scores were averaged over different sets of species (e.g. all threatened species, all Near Threatened species, all culturally significant species, all Stone Country species, all lowland species, all plant species, etc.). In some analyses, a weighted mean benefit score was calculated using different species-specific value factors (cultural value, ecological value, etc.): i.e. species considered to have particular priority were assigned more prominence in the assessment.
Mean benefit scores for individual candidate management actions were tabulated for all species, for different sets of species, and with priority-weighting of species. These scores assumed that the candidate management actions could be delivered successfully.
Benefit scores for each candidate management action were then multiplied by the mean assessment of the feasibility of successful implementation of the action, to derive a mean realistic benefit score for each action. These scores were then divided by the estimate of cost of the candidate management action to provide a mean realistic benefit per unit cost for each candidate management action.

13
Identifying the optimal set of candidate management actions
There is a very wide range of threatened species occurring in Kakadu, including for example estuarine fish and fire-sensitive plants that are highly localised in the Stone Country. It is unlikely that any single candidate management action will benefit all species across such a taxonomic and ecological range, and managers may be more interested instead in identifying the ‘best’ set of management actions – effectively, the combination of management actions that together most cost-effectively provides the most substantial benefit to the most threatened species. This is a nuanced consideration, and there may well not be a single simple solution. For example, if managers had $20 million per year at their disposal, the optimal solution may be a set of very many management actions that ‘guarantee’ the persistence of all species; whereas if they have $2 million per year at their disposal, the optimal solution may be a smaller set of management actions that either ‘guarantee’ the persistence of many but not all species or a different set of management actions that provide reasonable benefits, but not necessarily a ‘guarantee’ of persistence, to all species. Furthermore, it is possible that for some species, none of the candidate management actions will result in a high likelihood of persistence.
We treat the management set optimisation question as an analogue to a reserve design problem – what is the most cost-efficient way to design a reserve network from a set of candidate areas in such a manner that the selected network includes adequate representation of all attributes? Hence, we use the reserve selection software Marxan (Game and Grantham 2008), to choose the least-cost set of candidate management actions that collectively provide for the persistence (i.e. likelihood of persistence >50) for all considered species. Note that this approach was also used in the analogous study of prioritisation of management actions in the Kimberley (Carwardine et al. 2011). The analysis is iterated repeatedly with increasing threshold levels of persistence, i.e. what is the best set of management actions that collectively ensure that all considered species have a persistence of >60, of >75, etc. The analysis is also repeated with different caps on available management budgets. The results of these individual scenarios are then modelled, using linear and quadratic functions, to estimate the number of species failing to meet targets across a continuum of persistence target levels and budget caps.
Note that in these analyses, we use the mean realistic benefit scores (i.e. the increase in persistence above that estimated under no management, and weighted by the feasibility of the management action being implemented).
A hypothetical example is presented in Appendix E to illustrate how the analyses are worked, and how the solution depends upon the question asked.
ResultsExpert elicitation
Across the 191 species considered, the mean number of experts providing assessments of persistence was 4.9 per species, with range of 1 (for only two species) to 12 experts.
There was substantial variation among experts in their scoring of the likelihood of persistence for individual species under all management scenarios (Table 3). However, this comparison is constrained because each expert contributed scores to different sets of species. Some experts (e.g. experts A, R, I, T) were relatively optimistic (i.e. had high estimates of persistence for most of the species that they scored in most scenarios); others were more pessimistic (e.g. C, F, G, L, M, O, S). Some experts considered that current management was making little contribution relative to no management (e.g. A, D, H, I, K, T); others considered that current management was resulting in substantial benefit (e.g. B, C, E, G, L, M, N, O, P, Q, R, S).
14
Optimising management actions for the conservation of threatened species in Kakadu National Park
Likelihood of persistence under status quo and under no management
The mean estimate of persistence for all threatened species is summarised by taxonomic group in Figure 1. Under current (status quo) management, most threatened species (48 of 75) were rated as having a likelihood of persistence over the next 20 years of >80. Only six threatened species were considered more likely than not (i.e. estimated persistence of <50) to become extirpated in Kakadu over the next 20 years. Threatened mammal species were more likely than any other group to have low estimates of persistence.
The differences between species-groups in their likelihood of persistence are also apparent in collations of mean persistence scores across species (Table 4). Unsurprisingly, Near Threatened species, on average, are considered to be more likely to persist in Kakadu over a 20 year period than are threatened species. Among taxonomic groupings of species, mammals have the lowest mean likelihood of persistence and plants have the highest. Stone Country species are considered to be more likely, on average, to persist than lowland species. On average, current management is considered to be having the least beneficial impacts for invertebrate and bird species. However, this variable is influenced in part by the scoring for persistence under the regime of no management: if this is already relatively close to 100, then current management can add relatively little benefit.
The mean estimates of persistence, under status quo and under no management, are listed for individual species (including threatened, Near Threatened and culturally significant species) in Table 5. Unsurprisingly, a set of mammal species (Golden Bandicoot, Golden-backed Tree-rat and Northern Hopping-mouse) that have probably already disappeared from Kakadu are rated as having lowest likelihood of persistence under current management. The Brush-tailed Rabbit-rat is also considered most unlikely to persist: this species has declined rapidly in Kakadu over the last 20 or so years, and may already have been extirpated (Firth et al. 2010; Woinarski et al. 2010; Woinarski and Fisher 2014). Two other threatened species are considered more likely to become extirpated than to survive in Kakadu over the next 20 years – the Water Mouse (for which the only confirmed records in Kakadu were in 1903) and the orchid Dienia montana (not recorded in Kakadu since 1993). The Northern Brush-tailed Phascogale, Northern Quoll, Spectacled Hare-wallaby and the Arnhem Land Skink are considered only marginally more likely to persist than not (i.e. mean likelihood of persistence in Kakadu of 50-60).
Of threatened species with a high proportion (>30%) of their total range in Kakadu, six species were considered to have a likelihood of persistence of <80: the Arnhem Land Skink, Smooth Kakadu-shrimp, Yellow-snouted Gecko, Arnhem Rock-rat, Humped Kakadu-shrimp and Magela Shrimp.
Far more species were considered to have a lower likelihood of persistence in Kakadu if all management is withdrawn (abandonment) (Fig. 2). Again, mammal species were rated as having least likelihood of persistence. With abandonment, 12 threatened species (and two Near Threatened species) are considered to be more likely to become extirpated than to persist in Kakadu over a 20 year period: this represents 16% of Kakadu’s threatened species and 7.3% of all species considered in this assessment. These rates compare with 13 of 53 species (i.e. 24.5%) of conservation significance estimated to have persistence of <50 in the analogous Pilbara study (Carwardine et al. 2014) and 45 of 637 considered species (i.e. 7.1%) in the analogous Kimberley study (Carwardine et al. 2011).
Experts considered that there was substantial variation among species in the extent to which current management provided benefit relative to no management. Seventeen species were considered to benefit not at all from current management (i.e. their estimated persistence was the same in Kakadu under abandonment of management and under current management) (Table 6). This group comprised 12 migratory shorebirds, three endemic or nearly endemic shrimps possibly threatened by cane toads, and two highly localised plant species. All species for which the difference between the estimated persistence under current management and that under no management was less than 5 are listed in Table 6.
15
In contrast, many other species were considered to benefit substantially from current management (Table 7). These include one lowland wetland plant species (Monocharia hastata) that probably benefits from control of feral pigs and buffalo, and a series of lowland and stone country plant and animal species that probably derive some benefit from current fire management.
Management scenarios
Responses of species to candidate management actions
The predicted responses of individual species to the candidate management actions are summarised in Tables 8 and 9. This presents the mean (across specified groups of species) benefit arising from every candidate management action, with benefit being the estimated persistence under that candidate management action operating alone minus the estimated persistence under no management (i.e. abandonment).
These are complex tables, but there are several key conclusions:
• unsurprisingly, the package of existing management actions mostly does better than any single candidate management action;
• unsurprisingly, there is some variation between species-groups (taxonomic and habitat) in the relative ordering of benefits arising from candidate management actions. For example, management actions that provide the most benefit to threatened fish are different to the management actions that provide most benefit to highly localised and fire-sensitive Stone Country plants.
• unsurprisingly, the sets of combination candidate management actions generally provide more expected benefit that do individual candidate actions;
• the most beneficial individual candidate management actions are enhanced strategic fire management in lowland and Stone Country habitats and broad-scale control of feral cats;
• some candidate management actions (e.g. control of mimosa, invertebrate biosecurity) provide very little expected mean benefit to any species-group;
• weighting estimates by different dimensions of species’ prioritisations (Table 9) had relatively little impact on the differences among candidate actions in their expected benefits, although weighting by Kakadu significance led to an increase in the mean benefit of management actions undertaken in the Stone Country relative to actions in the lowlands.
Note that these Tables do not consider feasibility and costs of management actions, but simply assume that the management action is implemented successfully. The implications of cost and feasibility are considered in the following sections.
Furthermore, these Tables present mean benefits across species, but an overall objective may be for a set of management actions to provide sufficient benefits to all individual species in the most cost-effective manner. If some individual species are benefitted only by particular actions that benefit few other species, those management actions will be scored relatively low in these tables. A subsequent section considers the optimal mix of management actions to benefit every species.
16
Optimising management actions for the conservation of threatened species in Kakadu National Park
Feasibility
Experts considered that there was substantial variation between the candidate management actions in the feasibility of their implementation (Table 10). Most actions relating to management of toads were rated as having a very low feasibility; broad-scale control of cats was also rated to have low feasibility. Note that there was also considerable variation among experts in their estimates of feasibility for some management actions (e.g. broad-scale reduction of cats, with one expert rating the feasibility of this action in the lowlands as 0 and another rating it as 80).
Costs of candidate management actions
It proved somewhat difficult to estimate costs for some candidate management actions, because (i) there is no well-established existing budgetary break-down for threatened species activities in Kakadu, which would have provided a useful foundation for estimating costs associated with candidate management actions; (ii) there is no direct precedent for some management actions in the Kakadu area (e.g. broad-scale cat and toad control); (iii) many candidate management actions are packages of existing broader management programs, and it is difficult to sensibly unpack costings of individual components of these broader programs (e.g. disentangling costs of control of buffalo from those of control of pigs, given that aerial shooting campaigns typically target multiple feral pests); (iv) some management actions (e.g. fire management) are undertaken for multiple reasons, and it may be difficult or indeed nonsensical to attempt to apportion that part of the action undertaken for threatened species’ management from that part of the action undertaken for other objectives; (v) some of the candidate management actions (e.g. enhanced biosecurity to reduce risks of outbreaks of new weeds; ex situ conservation and experimental reintroduction of threatened plant species) may embrace a wide range of activities, and costs may be very contingent on circumstances – for example, for the weed biosecurity action, whether or not there are outbreaks of new weeds.
With due regard to these caveats and constraints, a 20-year estimated budget for every candidate management action is summarised in Table 11. This assessment indicates a substantial range in expected costs across candidate management actions, with relatively inexpensive items including general weed biosecurity, management of Indigenous harvest, management of tourists, establishment of barrages and invertebrate biosecurity (all estimated to cost <$2 million over 20 years) and relatively expensive items including strategic lowland fire management, strategic Stone Country fire management, control of aquatic weeds, control of Mimosa, and broad-scale control of feral cats in the lowlands (all estimated to cost >$10 million over 20 years). Most fire management actions were considered to be relatively expensive, largely because of the number of personnel involved.
Note that, with due caveats, the estimates given in Table 11 can be used to interpret the current budget allocated at least in part for threatened species management in Kakadu: about $4 million, or c. $80 million for the 20-year timeframe considered in this report.
Cost-benefits of individual candidate management actions
The average overall benefit of candidate management actions per unit cost is presented in Tables 12 and 13 for different groups of species (arranged as for Tables 8 and 9). This analysis produces some markedly different orderings to those indicated in Tables 8 and 9. It rates highly some relatively low cost actions even if their overall benefit is modest. All of the relatively expensive fire management actions are scored relatively low. There are some notable differences among different groupings of species, but some actions are rated across most groupings as providing relatively high benefit per unit cost: these include local-scale control of feral cats, cat exclosure fencing, general weed biosecurity, gamba grass management, toad-proof exclosures, buffalo management, management of Indigenous harvest, and ex situ conservation and reintroduction of threatened plants.

17
This rating quantifies the efficiency of individual actions, but it does not address the question of which set of management actions provides the most overall benefit for various expenditures, nor which action or set of actions are most likely to prevent extirpations of the most species in Kakadu.
Optimal set of management actions
A series of Marxan analyses was run to derive best sets of management actions: these varied in their settings for both budget caps and persistence targets, ranging from a target of 50% persistence for all species and a budget cap of $40 million (over 20 years) to a target of 75% persistence for all species and a budget cap of $150 million (over 20 years). Because of likely non-independence between some actions, a truncated set of actions was included in these analyses (see Table 14).
Results from all analyses are summarised in Tables 14, 15 and 16. These show that as persistence target levels are increased, then allocated budgets must increase substantially. Table 15 indicates that only two of best-sets of candidate management actions under the Marxan analyses succeeded in meeting target levels for all species within the specified budget cap, the scenarios with a low threshold of persistence (50% chance of being extinct in 20 years) and $35 and $40 million spent over the 20-year period. Failures (i.e. the number of species that could not reach persistence target levels within the available nominal allocated budget) increased as the target persistence level was increased and as the available budget decreased. With high target levels (i.e. 90% sure of persistence over a 20 year period), the highest budgets included in the analyses (i.e. $150 million over 20 years) was still insufficient, with 26 species still failing to meet the persistence threshold.
The ‘best set’ of candidate management actions varied substantially among different scenarios: i.e. the ‘answer’ very much depended upon how the question was framed, and there is no single consistent ‘best set’ of management actions. With relatively small budget caps, the best set of candidate management actions typically, and understandably, included relatively inexpensive actions (e.g. general weed biosecurity, pig control) – expensive actions (notably those relating to fire) were routinely not included in the selected set (Table 14). Such relatively expensive actions were more likely to be included as persistence target levels and budget caps increased.
Given that the small set of mammal species possibly already lost from Kakadu (Golden-backed Tree-rat, Northern Hopping-mouse, Brush-tailed Rabbit-rat) were always initially below target (i.e. their estimated persistence under abandonment was <50), the action that provided the greatest expected benefit to these species (i.e. ex situ management and reintroduction) was almost always included in the best set. Likewise, there was a substantial leverage (i.e. they were typically included in best sets) for two single actions (barrage establishment, pig control) that had relatively substantial expected benefit to two individual species with relatively low current persistence estimate (Water Mouse, Dienia montana, respectively). These actions were chosen in most scenarios, even though these provided expected substantial benefit to few other species.
Some candidate management actions were hardly ever included in the best sets: control of mission grass, control of feral horses and donkeys, invertebrate biosecurity, tourism regulation, introduction of ‘toad survivors’, and ex situ conservation and reintroduction of threatened plants (Table 14). Some candidate management actions were included in most of the best sets: lowland cat exclosures, lowland pig control, lowland buffalo control, management of lowland Indigenous harvest, strategic control of fire in the Stone Country, and ex situ conservation and reintroduction of ‘lost’ or very imperilled mammals.

18
Optimising management actions for the conservation of threatened species in Kakadu National Park
Some species failed repeatedly to reach target persistence levels in most best sets of management actions, particularly for higher persistence targets: these included Golden Bandicoot, Golden-backed Tree-rat, Northern Hopping-mouse, Water Mouse, Spectacled Hare-wallaby, Nabarlek, Dienia montana, Arnhem Land Skink, Largetooth Sawfish, Dwarf Sawfish, Northern Leaf-nosed Bat, Smooth Kakadu-shrimp and Narrow Sawfish (Table 16). For these species, no combination of the management actions considered will give a very high confidence in the persistence in Kakadu. For such species, more research may be required to better identify key threats and identify those management responses that may most substantially control those threats.
The results from these Marxan runs can be generalised and extrapolated (Figs. 3 and 4). This indicates, for example, if managers want to be 70% sure of maintaining all threatened species in Kakadu over a 20 year period, then the required budget is about $200-220 million; if they want to be 80% sure of maintaining all threatened species in Kakadu over a 20 year period, then the required budget is about $270 million (Fig. 4).
The best set solutions were designed to select those management actions that most effectively allowed under-target species to reach a target persistence level. But these actions may also have collateral benefits (or detriments) to other species, including those that may already be above persistence targets. Table 17 and Figure 5 report on these collateral outcomes. In all cases, the optimal sets of management actions also provide benefits broadly across all threatened, Near Threatened and culturally significant species. The benefits provided are generally greater for threatened than for Near Threatened and culturally significant species, at least partly because Near Threatened and culturally significant species typically already have higher persistence estimates under no management than do threatened species (so they have less potential to realise benefit from management impositions). This result shows clearly that management actions taken for threatened species are not likely to be detrimental to culturally significant species, but rather to also provide benefit to them.
In general, the higher the budget cap, the greater are the pervasive benefits to all groups of species (Table 17, Figure 5), largely because more management actions can be selected under scenarios with higher budget caps, and this greater diversity of management actions is likely to benefit more species. Scenarios with higher persistence targets tended to provide greater collateral benefits per any budget cap level than scenarios with lower persistence targets, because the latter focused selection of management actions to a smaller group of species.
With due caveats, the effectiveness of current management can be compared with that of the best set solutions, with budget capped to match that currently allocated (i.e. c. $80 million over 20 years). Under current management, the numbers of species failing to meet a target persistence of 50, 60, 70 and 80 are 6, 10, 14 and 32 (Table 5). From the modelled distribution of best sets, given a budget cap of $80 million over 20 years, the equivalent figures are 0, 6, 12 and 15 (Figure 4): i.e. this approach can deliver somewhat better outcomes (i.e. the persistence of more threatened species) than that under current management.
DiscussionThis assessment is based on the collective knowledge of most relevant experts about the likely fate of threatened (and other) species in Kakadu under a range of plausible management alternatives. That information base is likely to be as good as it is possible to get at present, however there are substantial knowledge gaps, relating particularly to current population size and its trends, major threats, and effectiveness of remedial management actions, for many of these species. These gaps constrain the robustness of this approach, and indicate that this report should not be considered as a final and definitive analysis, but rather a step in a process that can and should be refined iteratively as more knowledge becomes available.

19
There are also caveats on our assessments of the financial costs of at least some candidate management actions, with uncertainty of costing rooted in part on the limited availability of information on current spending on particular management actions designed to benefit threatened species, and on estimating costs for management actions that are not currently part of Park operations. Furthermore, there is some artificiality in treating candidate management actions as independent factors in this analysis. For example, the feasibility and costs of many fire management actions may be very dependent upon the implementation of management actions designed to control invasive pasture grasses. Likewise, the control of feral buffalo and of feral pigs can be considered to be complementary, because an efficient management program would involve at least some elements of coordinated control of both pests.
A further caveat is that there is some artificiality in treating management actions, and their costings, solely in terms of their direct effects upon threatened species. Many of the management actions undertaken in Kakadu have far broader environmental objectives and consequences, and many are also undertaken for reasons additional to or other than for threatened species management. Many of these latter (more multi-purpose) actions are likely to continue to be undertaken regardless of the extent of their relative benefit to threatened species. The ongoing management of Mimosa is illustrative of the former case – this program has very substantial broader environmental benefits (notably in maintaining the structure and integrity of floodplain environments), but probably provides relatively little explicit benefit to, and to only a small number of, currently listed threatened species. Hence, that program scores relatively low in this analysis. However, the abandonment of such a program would be likely to lead to the decline of many species to such an extent that over a period of decades many currently unthreatened species may become threatened.
Another caveat is that the measure of success or failure used here, a species’ persistence in Kakadu over a 20-year period, is a very crude measure. For example, a species that may have declined in population size by >90% (but less than 100%) in Kakadu over this period would be considered to have persisted, but this changed status is clearly not a substantial management success or a desirable outcome.
A final caveat is that this analysis revealed that there is no single and compelling answer to the question of what management action, or set of actions, best, and most efficiently, enhances the status of threatened species in Kakadu. The answer varies according to the level of certainty sought for persistence of the threatened species in Kakadu over the foreseeable future, how species are prioritised, and how much funding is available. The lack of definitive answer is also due in part to the multitude of threatened (and other) species present in Kakadu and their markedly contrasting management options. Inevitably, it will require a complex mix of management actions to secure or improve the fate of such a diversity of species.
With due regard to these caveats, the results do offer some important insights into threatened species management in Kakadu, and can help refine and enhance that management. The analysis reveals that the current mix of management actions is making a substantial contribution to the status of most (but by no means all) threatened species, relative to the outcome expected if all management actions were abandoned.
Under existing management, ‘only’ six threatened species (Golden Bandicoot, Golden-backed Tree-rat, Brush-tailed Rabbit-rat, Northern Hopping-mouse, Water Mouse and the orchid Dienia montana) are considered more likely to disappear from than persist in Kakadu over a 20-year period – however, it may be that all six have already disappeared. If a higher confidence in persistence is desired, the number of ‘at risk’ species increases: if the persistence objective was increased to 60 (i.e. a 40% likelihood of loss from Kakadu over the 20-year period), a further four species (Northern Brush-tailed Phascogale, Northern Quoll, Spectacled Hare-wallaby, Arnhem Land Skink) would be ‘at risk’ under current management. If the persistence objective was increased to 70 (i.e. a 30% likelihood of loss from Kakadu over the 20-year period), a further four species (Black-footed Tree-rat, Pale Field-rat,
20
Optimising management actions for the conservation of threatened species in Kakadu National Park
Nabarlek, Smooth Kakadu-shrimp) should be considered ‘at risk’. If the persistence objective was increased to 80 (i.e. a 20% likelihood of loss from Kakadu over the 20-year period), the number of ‘at risk’ species increases by a further 19, and thereafter increases rapidly. Unsurprisingly, the likelihood of achieving objectives depends substantially on how ambitiously those objectives are set.
The set of species considered to have lowest likelihood of persistence in Kakadu under current management is notably non-random. As evident in the listing of species in the previous paragraph, mammal species are far more substantially ‘at risk’ than other groups, and this result indicates that managers need to increase their focus on this group in order to achieve improved outcomes for threatened species. Unsurprisingly, given the factors defining their conservation status, threatened species tended to have lower likelihood of persistence in Kakadu than Near Threatened species and than culturally significant species.
Relevant managers and experts developed and assessed the benefits of a range of candidate management actions, in addition to the currently applied management. The most effective (i.e. delivering the greatest increase in likelihood of persistence, averaged over species) candidate management actions comprised the combination of strategic fire management, gamba grass control and control of feral cats, with the most effective individual actions being more strategic fire management (aimed at increasing the extent of long-unburnt habitat), broad-scale control of feral cats, and ex situ conservation and reintroduction of threatened plants (Tables 8, 9). The relative ordering of benefits of management actions varied with different groups of species.
Unsurprisingly, the assessed benefits of these actions differed between the ideal (i.e. the management action was treated as if it could be implemented fully) and the realistic (i.e. the action was weighted according to the assessed feasibility of its full implementation). Some candidate management actions (including broad-scale control of cane toads, broad-scale reduction of feral cats, control of aquatic weeds and establishment of barrages), were considered largely unfeasible to implement (at least with current knowledge and practices) (Table 10), even if ideally they would deliver substantial benefits to threatened species.
Current and candidate management actions also varied appreciably in their estimated costs (Table 11). Notably, most fire management actions were estimated to have far higher costs than actions addressing most other putative threats. This disparity meant that, although they were assessed as producing substantial benefits to threatened species, fire management actions had a relatively low benefit:cost ratio compared with other management actions (Tables 12, 13), and tended not to be included in best set selections of management actions when the budget cap was set to be relatively low (Table 14). Those individual actions found to have highest benefits across threatened species per unit cost were intensive local-scale control of feral cats, weed biosecurity, control of gamba grass, establishment of cat-proof exclosures, fishing management, management of Indigenous harvest, local-scale toad exclosures, and ex situ conservation and reintroduction of threatened plant species.
The ‘solutions’ were different again when considering the best set of candidate management actions, and these best sets themselves varied appreciably depending upon the persistence objectives and the budget caps (Table 14). With relatively low persistence objectives (i.e. a target that all species have at least a 50% change of persisting in Kakadu over a 20-year period), the consideration inevitably hinges on a relatively small set (13 species) rated to have low expected persistence under no management: for this set of species, relatively few candidate management actions provided benefits – ex situ conservation and reintroduction (for four mammal species) and pig and buffalo control (for Dienia montana and Water Mouse) – and these comprised the major part of the best set selected. These solutions are largely reactive and focus mostly on emergency responses for species that may well already be lost from Kakadu, although they do also address some conservation management needs of another group of extant but highly imperilled species – Northern Brush-tailed Phascogale, Northern Quoll, Spectacled Hare-wallaby, Arnhem Land Skink, Black-footed Tree-rat, Pale Field-rat and Nabarlek.

21
This small set of species continues to influence the selection of best set candidate management actions as the persistence objective increases (e.g. barrage establishment becomes a recurring component of the best set selection, because it was assessed as one of the only options for achieving a persistence of 60 for Water Mouse), but the number, range and costs of other management actions in the best set tends to increase because increasing numbers of species need to be considered. Fire actions tend to be included in the best set only when the available budget cap is relatively high. Ex situ conservation and reintroduction of threatened plants was rarely included in the best set selections, largely because relatively few plants started (under no management) below the persistence objective, and because strategic fire management in the Stone Country was more likely to be chosen instead given that it allowed many more species to reach the set persistence objectives.
The best set analyses also indicated that it was almost impossible to select a set of management actions that allowed for some individual threatened species to reach persistence objectives, other than very modest objectives (i.e. persistence target of 50) (Table 16). This finding suggests that it is likely that further management options may need to be designed specifically for such species. This suggests that there is a need for further research and monitoring to comprise a component in this adaptive management prioritisation process.
Although there is considerable uncertainty about the estimate, current spending in Kakadu on management that includes some benefit for threatened species is about $4 million per year. The best set analysis suggests that for the same level of spending, outcomes for threatened species can be improved somewhat with a different combination of management actions. These analyses also suggest that this level of spending will not be sufficient to be reasonably certain (e.g. persistence threshold of 70) of securing all threatened species in Kakadu over a 20-year period – to meet such a target, spending levels of c. $10 million per year would be required (Figure 4).
What are the key implications of these analyses? The most important conclusion is that there is no single best solution to the issue of optimising management to benefit threatened species in Kakadu. The answers depend upon nuances of the question asked, and of how much resourcing is available. This assessment should be seen to be providing a guide rather than a prescription. Current management is delivering substantial benefit and the experts considered it unlikely that many threatened species currently known from Kakadu will become extinct in the next 20 years (i.e. the great majority of threatened species known to be still present in Kakadu were considered more likely than not to be still present in Kakadu in 20 years with continuation of current management). This gives cause for some relief. However, the analyses indicate that some changes in management actions can deliver even better outcomes, even with the same budget outlay, and that increased budgets will provide even better outcomes.
If managers want to retain the full complement of threatened species in Kakadu in the short term, at least cost, then the priority is to invest most management actions specifically to the small set of species that may well have already been lost from Kakadu, through reintroductions of four mammal species and tailored research and management actions for local benefit of the orchid Dienia montana and the Water Mouse. But this is a highly reactive and narrowly focused response, and provides relatively little collateral benefit to other threatened, Near Threatened and culturally significant species (Table 17, Figure 5).
Our interpretation of the results reported here suggests that a core set of management actions for the longer-term maintenance of most threatened species should include:
(i) strategic fire management in the lowlands that increases the extent of longer-unburnt habitat. Although this is an expensive action, some form of fire management in Kakadu will be required for diverse reasons anyway, so it is desirable to implement a fire management approach. This analysis (Tables 8, 9) demonstrates that this action will provide substantial benefit to threatened species. [estimated cost over 20 years of c. $28m];

22
Optimising management actions for the conservation of threatened species in Kakadu National Park
(ii) at least localised intensive control of feral cats, or establishment and maintenance of some areas of cat exclosure fencing, with this action combined with reintroduction of a small set of mammal species that may already have been lost from Kakadu. This analysis (Tables 12, 13, 14) demonstrates that this action will provide substantial benefit per unit cost to threatened species. [estimated cost over 20 years of $6-16m];
(iii) maintenance of gamba grass control. This analysis (Tables 12, 13) demonstrates that this action will provide substantial benefit per unit cost to threatened species. [estimated cost over 20 years of $3.5m];
(iv) maintenance and enhancement of fishing regulations and management of Indigenous hunting, in particular in relation to a set of threatened sawfish and sharks. This analysis (Tables 12, 13) demonstrates that this action will provide substantial benefit per unit cost to these species, and that these are the only actions within the considered set to provide such benefit. [estimated cost over 20 years of c. $7-8m];
(v) at least localised intensive control of pigs, at sites of conservation significance (e.g. rainforest patches that may have the orchid Dienia montana, and turtle nesting areas). This analysis (Table 14) demonstrates that pig control is likely to be the most cost-effective conservation action for these species. [estimated cost over 20 years of $4-7 m];
(vi) maintenance of existing Stone Country fire management, or implementation of refinements to that program aimed at more intensive management of fire at key conservation sites. This analysis (Tables 8, 9) demonstrates that this action will provide substantial benefit to threatened species. [estimated cost over 20 years of $12-17m].
With additional resourcing, additional actions could include more attention to toad-susceptible species (potentially through introducing individuals that have toad-invaded areas elsewhere or localised toad-exclusion trials), ex situ conservation and reintroduction of some threatened plant species, broad-scale control of buffalo and of aquatic weeds.
Finally, the results from this assessment for Kakadu are compared with those reported for comparable analyses in the Kimberley and Pilbara in Table 18. The results are broadly consonant, although difficult to compare readily given different study area sizes and number of species.

23
ReferencesCarwardine J, Nicol S, Van Leeuwen S, Walters B, Firn J, Reeson A, Martin TG, Chadès I (2014) ‘Priority
threat management for Pilbara species of conservation significance.’ CSIRO Ecosystems Sciences, Brisbane.
Carwardine J, O’Connor T, Legge S, Mackey B, Possingham H, Martin TG (2011) ‘Priority threat management to protect Kimberley wildlife.’ CSIRO Ecosystems Sciences, Brisbane.
Carwardine J, O’Connor T, Legge S, Mackey B, Possingham HP, Martin TG (2012) Prioritizing threat management for biodiversity conservation. Conservation Letters 5, 196-204.
Director of National Parks (2007) ‘Kakadu National Park Management Plan 2007-2014.’ Department of the Environment and Water Resources, Darwin.
Edwards A, Kennett R, Price O, Russell-Smith J, Spiers G, Woinarski J (2003) Monitoring the impacts of fire regimes on vegetation in northern Australia: an example from Kakadu National Park. International Journal of Wildland Fire 12, 427-440.
Firth RSC, Brook BW, Woinarski JCZ, Fordham DA (2010) Decline and likely extinction of a northern Australian native rodent, the Brush-tailed Rabbit-rat Conilurus penicillatus. Biological Conservation 143, 1193-1201.
Game ET, Grantham HS (2008) ‘Marxan User Manual: For Marxan version 1.8.10.’ University of Queensland, St Lucia.
Gillespie G, Fisher A (2014) Threatened reptile and frog species of Kakadu National Park: current status; known and potential threats; and what needs to be done for them? In ‘Kakadu National Park Landscape Symposia Series 7: conservation of threatened species’. (Eds S Winderlich and J Woinarski) pp. 75-84. (Supervising Scientist: Darwin)
Martin TG, Burgman MA, Fidler F, Kuhnert PM, Low-Choy S, McBride M, Mengersen K (2012) Eliciting expert knowledge in conservation science. Conservation Biology 26, 29-38.
McBride MF, Garnett ST, Szabo JK, Burbidge AH, Butchart SHM, Christidis L, Dutson G, Ford HA, Loyn RH, Watson DM (2012) Structured elicitation of expert judgments for threatened species assessment: a case study on a continental scale using email. Methods in Ecology and Evolution 3, 906-920.
Peeters PJ (2014) ‘Back on Track Phase II: background, rationale and revised methodology.’ Department of Environment and Heritage Protection, Brisbane.
Petty A, Alderson J, Muller R, Scheibe O, Wilson K, Winderlich S (2007) ‘Kakadu National Park: Arnhemland Plateau draft fire management plan.’ Kakadu National Park and Tropical Savannas Cooperative Research Centre, Darwin.
Ponce-Reyes R, Martin T, Whitten S, Maron M, Carwardine J (2014) ‘Priority threat identification, management and appraisal: literature review.’ CSIRO, Brisbane.
Press AJ (1986) ‘The Gagudju species survey.’ Australian National Parks and Wildlife Service and the Gagudju Association, Jabiru.
Press T, Brock J, Andersen A (1995) Fauna. In ‘Kakadu: natural and cultural heritage and management’. (Eds T Press, D Lea, A Webb and A Graham) pp. 167-216. (Australian Nature Conservation Agency and North Australia Research Unit, The Australian National University: Darwin)
24
Optimising management actions for the conservation of threatened species in Kakadu National Park
Russell-Smith J, Edwards AC, Woinarski JCZ, McCartney J, Kerin S, Winderlich S, Murphy BP, Watt F (2009) Fire and biodiversity monitoring for conservation managers: a 10-year assessment of the ‘Three Parks’ (Kakadu, Litchfield and Nitmiluk) program. In ‘Culture, ecology and economy of fire management in north Australian savannas: rekindling the wurrk tradition’. (Eds J Russell-Smith, PJ Whitehead and P Cooke) pp. 257-286. (CSIRO Publishing: Collingwood)
Winderlich S, O’Dea A (2014) The views and knowledge of Bininj/Mungguy on Kakadu National Park’s threatened species. In ‘Kakadu National Park Landscape Symposia Series 7: conservation of threatened species’. (Eds S Winderlich and J Woinarski) pp. 3-30. (Supervising Scientist: Darwin)
Winderlich S, Woinarski J (2014) ‘Kakadu National Park Landscape Symposia Series 7: conservation of threatened species.’ Supervising Scientist, Internal report 623, Darwin.
Woinarski J (2004) ‘Threatened plants and animals in Kakadu National Park: a review and recommendations for management.’ Parks and Wildlife Commission of the Northern Territory, Darwin.
Woinarski J, Fisher A (2014) Threatened terrestrial mammals of Kakadu National Park: which species?; how are they faring? and what needs to be done for them? In ‘Kakadu National Park Landscape Symposia Series 7: conservation of threatened species’. (Eds S Winderlich and J Woinarski) pp. 93-104. (Supervising Scientist: Darwin)
Woinarski JCZ, Armstrong M, Brennan K, Fisher A, Griffiths AD, Hill B, Milne DJ, Palmer C, Ward S, Watson M, Winderlich S, Young S (2010) Monitoring indicates rapid and severe decline of native small mammals in Kakadu National Park, northern Australia. Wildlife Research 37, 116-126.
Woinarski JCZ, Fisher A, Armstrong M, Brennan K, Griffiths AD, Hill B, Choy JL, Milne D, Stewart A, Young S, Ward S, Winderlich S, Ziembicki M (2012) Monitoring indicates greater resilience for birds than for mammals in Kakadu National Park, northern Australia. Wildlife Research 39, 397-407.

25
Table 1. Summary of tallies of threatened, near threatened and culturally significant species, cross-referenced to taxonomic groups.
Taxonomic group No. of species
Threatened Near Threatened Culturally significant1
Total
Plants 15 68 2 85
Invertebrates 6 1 0 7
Fish 5 0 1 6
Frogs 0 0 0 0
Reptiles 13 4 6 23
Birds 17 23 1 41
Mammals 19 7 3 29
Total 75 103 13 191
1. These tallies do not include those species that are culturally significant but also either threatened or Near Threatened and are listed under
those categories.

26
Optimising management actions for the conservation of threatened species in Kakadu National Park
Table 2. List of candidate management actions included in prioritisation analyses.
Candidate management action Description Landscape
Status quo Maintain all existing management actions that are implemented at least in part to benefit threatened species
both habitats
WEEDS. Maintain existing program aimed at prevention of new incursions (and eradication of any current patches) of Mimosa
A dedicated group is responsible for intensive surveillance of all floodplain areas and eradicates all infestations of mimosa
lowlands
WEEDS. Maintain existing program aimed at prevention of new incursions (and eradication of any current or future patches) of gamba grass
All ranger staff are alert to new infestations of gamba and these are eliminated
lowlands
WEEDS. Minimise any further spread of mission grasses
Survey and eradicate new incursions; continually manage to reduce extent of current infestations, using chemical and other means
lowlands
WEEDS. Prevent new incursions (and eradicate any current patches) of para grass, olive hymenachne, cabomba, salvinia and other aquatic weeds
Survey and eradicate new incursions; continually manage to reduce extent of current infestations, using chemical and other means
lowlands
WEEDS. Establish and maintain a biosecurity program aimed at early detection and eradication of any new weeds (other than those explicitly mentioned in other actions here)
Implement biosecurity program that reduces risk of incursions from Jabiru gardens, tourists, new developments etc (based mainly on community awareness, and eradication of high risk plants present in township); survey regularly for and eradicate new occurrences of weeds
lowlands
FIRE Maintain existing fire management Ongoing program of strategic early dry season fires, with some wet season burning; but no overall program for maintaining substantial areas longer-unburnt
lowlands
FIRE. Increase strategic management of fire to achieve at least 5% of area unburnt for 10+ years, at least 25% unburnt for 3+ years, and reduce average fire patch size to <1 km2
Develop and implement more strategic lowland fire management planning, with annual assessment of fire history, and commitment to the given fire parameter outcomes
lowlands
FIRE. Implement a systematic program of strategic burns (aimed at prevention of subsequent hot fires) around rainforest patches and local sites important for threatened species
Implement fine scale fire management strategies targeting a small set (c. 5) of highest priority sites selected because of the occurrence of threatened species
lowlands
FERALS. Maintain existing feral animal management actions
Intensive and integrated park wide feral control programs at 5 year intervals; mostly for buffalo and, less so, pigs; mostly implemented by aerial shooting with follow-up trapping where appropriate
lowlands
FERALS. Undertake intensive baiting and trapping program to reduce feral cat abundance by 90%
Broad-scale lowland-wide aerial baiting campaign for cats undertaken at 2-3 year intervals
lowlands
FERALS. Undertake intensive baiting and trapping program to reduce feral cat abundance by 90%, in a key conservation area of at least 100 km2
Localised intensive and continuous baiting and trapping campaign at one or more sites (totalling c. 100 km2) selected because of occurrence of threatened species.
lowlands

27
Candidate management action Description Landscape
FERALS. Establish 20 km2 of cat-proof exclosures
Establish and maintain one or more cat-proof exclosures (totalling c. 20 km2 in area), with sites selected because of occurrence of threatened species.
lowlands
FERALS. Establish 20 km2 of pig-proof exclosure around rainforest patches and other local sites significant for threatened species
Establish and maintain one or more pig-proof exclosures (totalling c. 20 km2 in area), with sites selected because of occurrence of threatened species.
lowlands
FERALS. Undertake intensive control program to eradicate pigs (or at least reduce to and maintain at low numbers)
Intensive and integrated park wide feral control programs at 5 year intervals; with pig control mostly implemented by aerial shooting with follow-up trapping where appropriate
lowlands
FERALS. Undertake intensive control program to eradicate buffalo (or at least reduce to and maintain at low numbers)
Intensive and integrated park wide feral control programs at 5 year intervals; with buffalo control mostly implemented by aerial shooting with follow-up trapping where appropriate
lowlands
FERALS. Undertake intensive control program to eradicate horse and donkey (or at least reduce to and maintain at low numbers)
Intensive and integrated park wide feral control programs at 5 year intervals; with horse/donkey control mostly implemented by aerial shooting with follow-up trapping where appropriate
lowlands
FERALS. Establish and maintain a biosecurity program aimed at early detection and eradication of invasive invertebrates
Undertake annual sampling of areas recognised as high risk for new incursions; develop and implement community awareness programs; eliminate any newly discovered incursions of priority invasive invertebrates
lowlands
FERALS. Eradicate outbreaks of black rats Program of ongoing survey to locate infestations and intensive baiting and trapping to eliminate those infestations
lowlands
FERALS. Undertake intensive control program to eradicate cane toads (or at least reduce to and maintain at low numbers)
Significantly reduce toad numbers by exclosure fencing around all dry season waterholes
lowlands
FERALS. Establish 20 km2 of toad-proof exclosures
Establish and maintain one or more toad-proof exclosures (totalling c. 20 km2 in area), with sites selected because of occurrence of threatened spp. (and practicality of keeping toads out)
lowlands
TOURISM. Maintain current access and other constraints on tourists (other than those relating to fishing)
Including maintenance of access constraints and continuation of existing tourism facilities
lowlands
FISHING REGULATION. Increase surveillance and reporting to enhance compliance and enforcement of fishing regulations, including patrols/operations aimed at illegal fishing activities
Fishing (other than by TOs) is prohibited in some areas of the Park; and subjected to bag limits in other areas; threatened fish are not allowed to be retained. This action would substantially increase surveillance and reporting for both recreational fishers and illegal commercial operations. Includes also closure of West Alligator
lowlands
CLIMATE CHANGE. Establish barrages or other infrastructure to constrain saltwater intrusion
Establish one or more barrages at key sites to prevent ongoing saltwater intrusion into key lowland wetland sites
lowlands
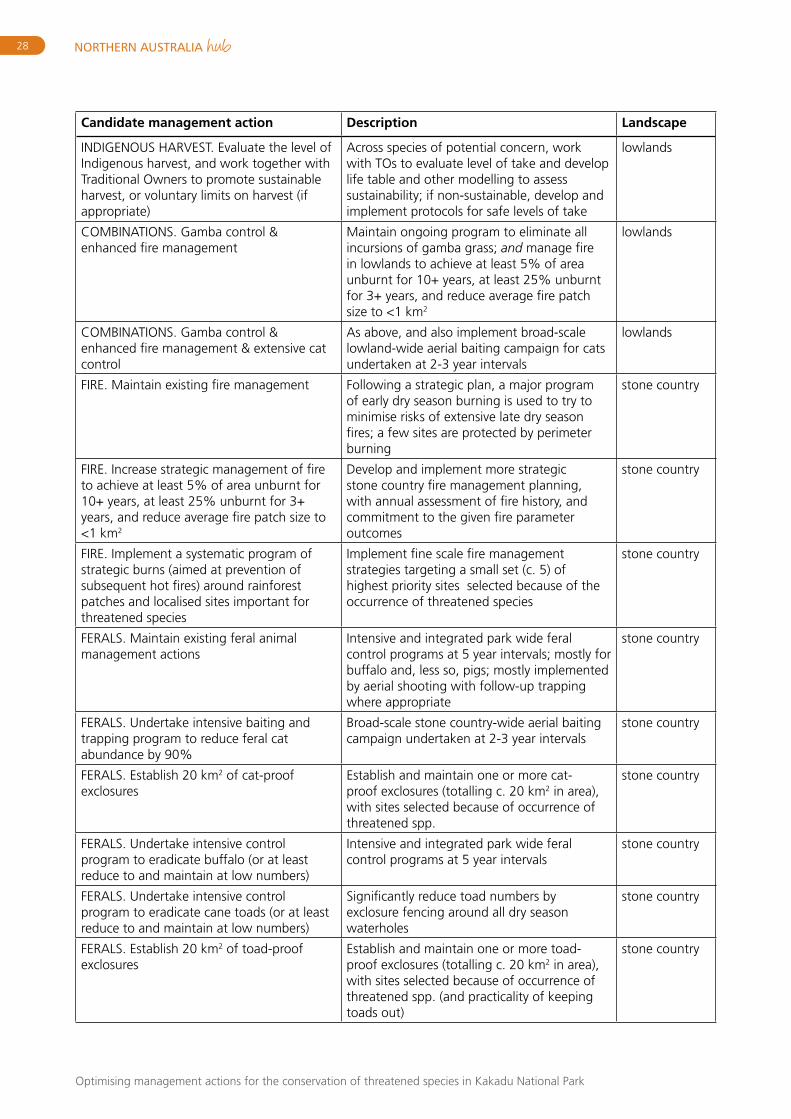
28
Optimising management actions for the conservation of threatened species in Kakadu National Park
Candidate management action Description Landscape
INDIGENOUS HARVEST. Evaluate the level of Indigenous harvest, and work together with Traditional Owners to promote sustainable harvest, or voluntary limits on harvest (if appropriate)
Across species of potential concern, work with TOs to evaluate level of take and develop life table and other modelling to assess sustainability; if non-sustainable, develop and implement protocols for safe levels of take
lowlands
COMBINATIONS. Gamba control & enhanced fire management
Maintain ongoing program to eliminate all incursions of gamba grass; and manage fire in lowlands to achieve at least 5% of area unburnt for 10+ years, at least 25% unburnt for 3+ years, and reduce average fire patch size to <1 km2
lowlands
COMBINATIONS. Gamba control & enhanced fire management & extensive cat control
As above, and also implement broad-scale lowland-wide aerial baiting campaign for cats undertaken at 2-3 year intervals
lowlands
FIRE. Maintain existing fire management Following a strategic plan, a major program of early dry season burning is used to try to minimise risks of extensive late dry season fires; a few sites are protected by perimeter burning
stone country
FIRE. Increase strategic management of fire to achieve at least 5% of area unburnt for 10+ years, at least 25% unburnt for 3+ years, and reduce average fire patch size to <1 km2
Develop and implement more strategic stone country fire management planning, with annual assessment of fire history, and commitment to the given fire parameter outcomes
stone country
FIRE. Implement a systematic program of strategic burns (aimed at prevention of subsequent hot fires) around rainforest patches and localised sites important for threatened species
Implement fine scale fire management strategies targeting a small set (c. 5) of highest priority sites selected because of the occurrence of threatened species
stone country
FERALS. Maintain existing feral animal management actions
Intensive and integrated park wide feral control programs at 5 year intervals; mostly for buffalo and, less so, pigs; mostly implemented by aerial shooting with follow-up trapping where appropriate
stone country
FERALS. Undertake intensive baiting and trapping program to reduce feral cat abundance by 90%
Broad-scale stone country-wide aerial baiting campaign undertaken at 2-3 year intervals
stone country
FERALS. Establish 20 km2 of cat-proof exclosures
Establish and maintain one or more cat-proof exclosures (totalling c. 20 km2 in area), with sites selected because of occurrence of threatened spp.
stone country
FERALS. Undertake intensive control program to eradicate buffalo (or at least reduce to and maintain at low numbers)
Intensive and integrated park wide feral control programs at 5 year intervals
stone country
FERALS. Undertake intensive control program to eradicate cane toads (or at least reduce to and maintain at low numbers)
Significantly reduce toad numbers by exclosure fencing around all dry season waterholes
stone country
FERALS. Establish 20 km2 of toad-proof exclosures
Establish and maintain one or more toad-proof exclosures (totalling c. 20 km2 in area), with sites selected because of occurrence of threatened spp. (and practicality of keeping toads out)
stone country

29
Candidate management action Description Landscape
TOURISM. Maintain current access and other constraints on tourists
Includes maintenance of access constraints and continuation of existing tourism facilities
stone country
INDIGENOUS HARVEST. Evaluate the level of Indigenous harvest, and work together with Traditional Owners to promote sustainable harvest, or voluntary limits on harvest (if appropriate)
Across species of potential concern, work with TOs to evaluate level of take and develop life table and other modelling to assess sustainability; if non-sustainable, develop and implement protocols for safe levels of take
stone country
COMBINATIONS. Enhanced fire management & extensive cat control
Develop and implement more strategic stone country fire management planning, with annual assessment of fire history, and commitment to the given fire parameter outcomes; combine with broad-scale stone country-wide aerial baiting for cats at 2-3 yr intervals
stone country
EX SITU & REINTRODUCTION. Establish ex situ populations of threatened plants; and use this to bolster existing or establish new wild populations
For the most threatened 5-10 plant species, establish ex situ populations and reintroduce stock from these populations to suitable habitat
both habitats
EX SITU & REINTRODUCTION (lowlands). Reintroduce populations of mammal species now lost from Kakadu (e.g. Brush-tailed Rabbit-rat) into 20 km2 predator-proof exclosure(s)
Reintroduce populations of lost or highly imperilled mammal species into suitable habitat in which cats are excluded by fencing and fire is intensively managed
both habitats
TOAD Train Maintain and extend program to undertake aversion-training of northern quolls (and any other feasible species) such that they do not consume toads, and then reintroduce populations of them
both habitats
INTRODUCE TOAD-SURVIVORS For toad-susceptible species, introduce individuals from sites at which they have persisted longer-term in areas with cane toads (e.g. north Queensland)
both habitats

30
Optimising management actions for the conservation of threatened species in Kakadu National Park
Table 3. Summary of variation among experts in their estimates of persistence for taxonomic groups of species.
PSQ=mean estimate of persistence in Kakadu over 20 years under current management (status quo);
>0=mean estimate of benefit of current management (i.e. difference between the estimate of persistence under status quo and estimate of persistence with no management) [marked in italics and red font].
Expertplants invertebrates fish reptiles birds mammals overall
PSQ >0 PSQ >0 PSQ >0 PSQ >0 PSQ >0 PSQ >0 PSQ >0
A 95.7 0 100 0 88.7 0 98.3 1.0 95.3 0.5
B 89.3 15.4 94.8 8.0 75.5 16.0 87.2 12.2
C 90.6 17.4 77.1 7.1 81.7 18.4 71.3 11.7 67.1 13.9 60.0 28.3 77.7 17.3
D 77.1 0 77.1 0
E 90.0 40.0 61.4 22.3 52.0 26.0 44.2 16.7 59.6 23.6
F 63.3 11.6 63.3 11.6
G 63.8 40.0 63.8 40
H 94.7 0 71.5 0 81.3 0
I 99.1 0 99.1 0
J 80.0 0 89.6 1.9 89.6 2.0 56.0 14.0 80.1 4.9
K 100 5.0 97.2 0.5 100 1.6 74.1 6.0 88.7 3.1
L 85.0 20.0 67.8 10.8 69.2 11.5
M 82.8 19.2 49.2 15.1 56.8 16.0
N 81.7 15.0 81.5 15.0
O 30.0 20.0 30.0 20.0
P 80.0 17.5 90.0 70.0 90.0 10.0 81.0 11.0 87.3 15.2 58.3 25.2 81.0 17.3
Q 78.3 23.3 78.3 23.3
R 96.7 46.7 82.0 35.0 85.4 37.7
S 70.0 50.0 71.7 20.0 70.0 21.7 69.0 34.7 58.3 24.9 65.6 26.5
T 97.8 5.0 97.8 5.0
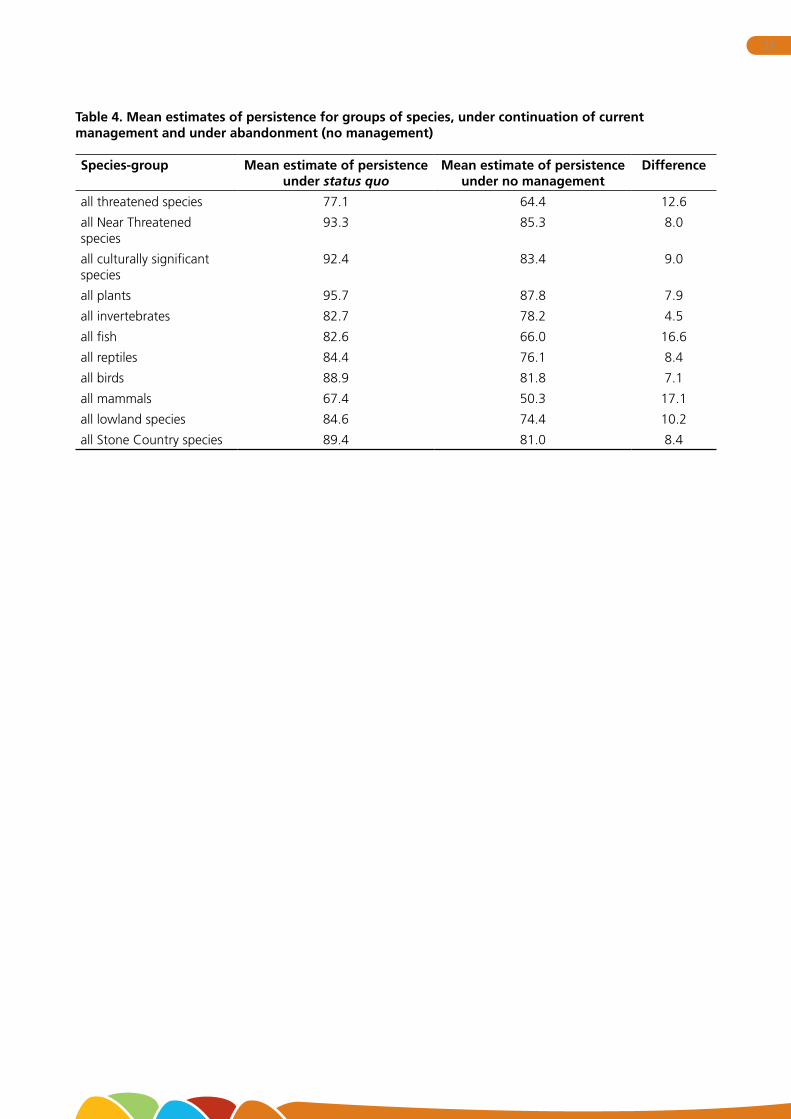
31
Table 4. Mean estimates of persistence for groups of species, under continuation of current management and under abandonment (no management)
Species-group Mean estimate of persistence under status quo
Mean estimate of persistence under no management
Difference
all threatened species 77.1 64.4 12.6
all Near Threatened species
93.3 85.3 8.0
all culturally significant species
92.4 83.4 9.0
all plants 95.7 87.8 7.9
all invertebrates 82.7 78.2 4.5
all fish 82.6 66.0 16.6
all reptiles 84.4 76.1 8.4
all birds 88.9 81.8 7.1
all mammals 67.4 50.3 17.1
all lowland species 84.6 74.4 10.2
all Stone Country species 89.4 81.0 8.4

32
Optimising management actions for the conservation of threatened species in Kakadu National Park
Table 5. List of all considered species, ordered by increasing likelihood of persistence under status quo management.
‘persist. status quo’ is the mean estimate of persistence in Kakadu over a 20 year period under current management. ‘taxon group’: P=plant; I=invertebrate; F=fish; R=reptile; B=bird; M=mammal. ‘habitat’: L=lowland; SC=Stone country; B=both. Conservation status under IUCN, EPBC Act and in the Northern Territory: CR=Critically Endangered; EN=Endangered; VU=Vulnerable; NT=Near Threatened. ‘Kak. signif.’: 5=endemic to Kakadu; 4=30 to 99% of the range or population size occurs in Kakadu; 3= 10-30%; 2=5-10%; 1=<5%. ‘persist. no mgmt’ is the mean estimate of persistence in Kakadu over a 20 year period under no management; ‘diff.’ is the difference between estimated persistence under status quo and no management
Species
persist. status quo
taxon group
habitat IUCN EPBCANT
statusKak.
signif.
persist. no
mgmtdiff.
Golden Bandicoot 1.0 M B VU VU EN 1 0.1 0.9
Golden-backed Tree-rat 2.3 M SC VU CR 1 1.4 0.9
Brush-tailed Rabbit-rat 7.8 M L VU EN 3 2.6 5.2
Northern Hopping-mouse 11.3 M SC EN VU VU 1 6.9 4.4
Water Mouse 41.4 M L VU VU NT 1 31.4 10.0
Dienia montana 47.5 P L VU 2 45.0 2.5
Northern Brush-tailed Phascogale
54.0 M L VU VU EN 3 31.1 22.9
Northern Quoll 54.2 M B EN EN CR 1 26.9 27.3
Spectacled Hare-wallaby 54.5 M L NT 1 37.5 17.0
Arnhem Land Skink 60.0 R SC EN VU 4 49.1 10.9
Black-footed Tree-rat 63.0 M L VU 2 36.5 26.5
Pale Field-rat 64.6 M L VU 1 38.7 25.9
Nabarlek 65.7 M SC VU 2 46.4 19.3
Smooth Kakadu-shrimp 66.0 I SC CR 5 66.0 0.0
Plains Death Adder 70.5 R L EN VU 3 59.1 11.4
King Brown Snake 70.8 R L NT 1 56.7 14.1
Yellow-snouted Gecko 71.7 R L EN VU 4 52.5 19.2
Mitchell’s Water Monitor 72.9 R L VU 2 61.4 11.5
Bolbitis quoyana 73.8 P SC VU 2 73.8 0.0
Ghost Bat 74.6 M B VU NT 2 54.6 20.0
Flock Bronzewing 75.0 B L NT 0 68.9 6.1
Largetooth Sawfish 75.7 F L CR VU VU 1 52.1 23.6
Yellow-spotted Monitor 76.0 R L VU 2 62.0 14.0
Northern Brown Bandicoot 76.1 M L NT 1 52.0 24.1
Arnhem Rock-rat 76.8 M SC VU VU 4 57.8 19.0
Merten’s Water Monitor 76.9 R L VU 2 63.8 13.1
Northern Leaf-nosed Bat 77.1 M SC VU 2 60.0 17.1
Humped Kakadu-shrimp 78.0 I SC VU 5 78.0 0.0
Magela Shrimp 78.0 I SC VU 5 78.0 0.0
Leichhardt’s Grasshopper 79.4 I SC NT 3 55.6 23.8
Speartooth Shark 80.0 F L EN CR VU 3 72.4 7.6
Dwarf Sawfish 80.0 F L EN VU VU 3 57.1 22.9

33
Species
persist. status quo
taxon group
habitat IUCN EPBCANT
statusKak.
signif.
persist. no
mgmtdiff.
Freckled Duck 80.0 B L NT 0 77.5 2.5
Gouldian Finch 80.2 B L EN VU 2 60.8 19.4
Western Chestnut Mouse 81.0 M L NT 1 57.8 23.2
Northern River Shark 81.7 F L CR EN EN 2 71.1 10.6
Northern Ridge-tailed Monitor
82.0 R L NT 2 70.0 12.0
Fawn Antechinus 82.0 M L EN 3 53.8 28.2
Narrow Sawfish 82.3 F L EN NT 1 66.2 16.1
Yellow Chat (Alligator R.) 82.3 B L EN EN 4 67.7 14.6
Pale-vented Bush-hen 82.5 B L NT 0 80.0 2.5
Northern Brushtail Possum 82.7 M L NT 2 50.2 32.5
Kakadu Pebble-Mouse 83.1 M SC VU NT 3 63.9 19.2
Arnhem Leaf-nosed Bat 83.3 M SC VU VU 4 62.5 20.8
Partridge Pigeon 83.4 B L VU VU VU 3 59.3 24.1
Common Blue-tongued Lizard
83.8 R L 1 73.8 10.0
White-throated Grass-wren 84.5 B SC VU VU 4 60.9 23.6
Centralian Blue-tongued Lizard
85.0 R SC 1 78.3 6.7
Letter-winged Kite 85.7 B L NT 0 82.9 2.8
Chameleon Dragon 86.0 R L NT 1 78.0 8.0
Monochoria hastata 86.0 P L VU 2 50.0 36.0
Acacia equisetifolia 86.0 P SC CR CR 5 68.0 18.0
Bare-rumped Sheath-tailed Bat
86.0 M L EN NT 1 63.0 23.0
Australian Reed-warbler 86.7 B L NT 1 75.0 11.7
Frillneck Lizard 86.7 R L 1 74.7 12.0
Mangrove Monitor 87.3 R L NT 1 78.2 9.1
Utricularia dunstaniae 87.6 P L VU 2 74.0 13.6
Yellow-rumped Mannikin 88.0 B L NT 0 78.0 10.0
Pictorella Mannikin 88.0 B L NT 0 78.0 10.0
Northern Nailtail Wallaby 88.0 M L NT 1 65.3 22.7
Grey Plover 88.3 B L NT 1 88.3 0.0
Whimbrel 88.3 B L NT 1 88.3 0.0
Grey-tailed Tattler 88.3 B L NT 1 88.3 0.0
Star Finch 88.3 B L NT 0 77.5 10.8
Black-tailed Godwit 88.5 B L NT 1 88.5 0.0
Greater Sand Plover (Mongolian)
88.6 B L VU 1 88.6 0.0
Lesser Sand Plover 88.6 B L VU 1 88.6 0.0
Bar-tailed Godwit 88.6 B L VU 1 88.6 0.0
Eastern Curlew 88.6 B L VU VU 1 88.6 0.0
Asian Dowitcher 88.6 B L VU 0 88.6 0.0

34
Optimising management actions for the conservation of threatened species in Kakadu National Park
Species
persist. status quo
taxon group
habitat IUCN EPBCANT
statusKak.
signif.
persist. no
mgmtdiff.
Red Knot 88.6 B L VU 1 88.6 0.0
Great Knot 88.6 B L VU VU 1 88.6 0.0
Curlew Sandpiper 88.6 B L VU 1 88.6 0.0
Ruddy Turnstone 88.6 B L NT 1 86.8 1.8
Emu 88.8 B B NT 1 71.8 17.0
Oenpelli Python 89.0 R SC VU 4 80.0 9.0
Orange Leaf-nosed Bat 89.1 M SC NT 1 72.7 16.4
Black Wallaroo 89.4 M SC 4 71.5 17.9
Hibbertia pancerea 89.5 P SC VU 5 65.0 24.5
Hibbertia tricornis 89.5 P SC VU 5 65.0 24.5
Jacksonia divisa 89.5 P SC VU 5 65.0 24.5
Eastern Grass Owl 89.5 B L NT 1 81.5 8.0
Melaleuca stipitata 90.0 P L NT 5 70.0 20.0
Hibbertia guttata 90.0 P SC NT 3 80.0 10.0
Masked Owl (northern) 90.0 B L VU VU 2 73.1 16.9
Hooded Parrot 90.0 B L NT 1 78.2 11.8
Arnhem Sheath-tailed Bat 90.0 M L NT 2 68.8 21.2
Crested Shrike-tit (northern) 90.3 B L VU 2 80.0 10.3
Square-tailed Kite 90.8 B L NT 0 89.2 1.6
Australian Painted Snipe 91.0 B L EN EN VU 0 79.0 12.0
Caldesia acanthocarpa 91.3 P L NT 1 77.5 13.8
Hibbertia brennanii 91.4 P SC VU 4 70.0 21.4
Hibbertia sp. South Magela 91.4 P SC VU 4 74.2 17.2
Echidna 91.7 M B 1 79.4 12.3
Flatback Turtle 91.7 R L VU NT 2 85.0 6.7
Magpie Goose 91.8 B L 2 84.7 7.1
Green Turtle 92.5 R L EN VU 1 90.0 2.5
Top End Dragon 92.5 I SC VU 4 90.0 2.5
Kakadu Vicetail 92.5 I SC VU 4 90.0 2.5
Rock Narrow-wing 92.5 I SC VU 4 90.0 2.5
Pig-nosed Turtle 92.9 R B VU NT 3 87.9 5.0
Olive Ridley 93.0 R L VU EN NT 1 90.0 3.0
Hawksbill Turtle 93.0 R L CR VU VU 1 90.0 3.0
Loggerhead Turtle 93.0 R L EN EN VU 1 90.0 3.0
Freycinetia excelsa 93.1 P SC VU 2 88.1 5.0
Gleichenia dicarpa 93.3 P SC NT 1 90.0 3.3
Dugong 93.3 M L VU NT 1 91.7 1.6
Antilopine Wallaroo 93.5 M L 1 82.4 11.1
Cycas armstrongii 93.7 P L VU VU 1 85.1 8.6
Chestnut-quilled Rock-pigeon 94.3 B SC NT 4 83.8 10.5
Hibiscus brennanii 94.6 P SC VU VU 5 81.3 13.3
Lithomyrtus linariifolia 94.6 P SC VU 4 81.3 13.3

35
Species
persist. status quo
taxon group
habitat IUCN EPBCANT
statusKak.
signif.
persist. no
mgmtdiff.
Drummondita calida 94.6 P SC NT 3 85.6 9.0
Red Goshawk 94.7 B L VU VU 1 84.0 10.7
Freshwater Crocodile 94.7 R B 1 91.6 3.1
Arafura File Snake 95.0 R L 2 91.0 4.0
Australian Bustard 95.2 B L NT 1 84.2 11.0
Bush Stone-curlew 95.3 B L NT 1 85.9 9.4
Vallisneria triptera 95.4 P L NT 2 90.2 5.2
Calytrix inopinata 95.4 P SC NT 5 86.2 9.2
Calytrix rupestris 95.4 P SC NT 4 86.2 9.2
Calytrix surdiviperana 95.4 P SC NT 4 86.2 9.2
Grey Falcon 95.7 B L VU VU 0 91.4 4.3
Banded Fruit-dove 95.9 B SC NT 3 88.8 7.1
Nymphoides subacuta 96.0 P L NT 1 80.0 16.0
Hibbertia auriculiflora subsp. auriculiflora
96.0 P SC NT 5 90.0 6.0
Hibbertia extrorsa 96.0 P SC NT 5 90.0 6.0
Hibbertia solanifolia 96.0 P SC NT 4 90.0 6.0
Callitris intratropica 96.1 P B 1 86.5 9.6
Barramundi 96.1 F L 1 77.2 18.9
Bursaria incana 96.3 P SC NT 1 93.3 3.0
Microlepia speluncae 96.7 P SC NT 5 96.7 0.0
Boronia rupicola 96.7 P SC NT 4 90.1 6.6
Boronia suberosa 96.7 P SC NT 4 90.1 6.6
Boronia verecunda 96.7 P SC NT 5 89.3 7.4
Avicennia integra 96.8 P L VU NT 3 96.0 0.8
Heterostemma magnificum 96.8 P SC NT 2 91.3 5.5
Nymphoides planosperma 96.8 P SC NT 5 90.3 6.5
Omegandra kanisii 96.8 P L NT 2 85.0 11.8
Pentapetes phoenicea 96.8 P L NT 1 83.8 13.0
Hibiscus inimicus 96.8 P SC NT 3 91.3 5.5
Triodia contorta 97.0 P SC NT 3 91.0 6.0
Triodia uniaristata 97.0 P SC NT 4 91.0 6.0
Eucalyptus koolpinensis 97.1 P L NT 5 93.1 4.0
Boronia laxa 97.1 P SC NT 4 91.4 5.7
Dichapetalum timoriense 97.1 P SC NT 1 93.1 4.0
Acacia amanda 97.7 P SC NT 4 90.0 7.7
Sonneratia lanceolata 97.8 P L NT 1 97.3 0.5
Boronia xanthastrum 97.8 P SC NT 4 92.5 5.3
Boronia grandisepala subsp. acanthophida
98.0 P SC NT 5 94.0 4.0
Emmenosperma cunninghamii
98.0 P SC NT 2 95.0 3.0
Psychotria loniceroides 98.0 P SC NT 1 95.0 3.0
Saltwater Crocodile 98.1 R L 1 96.9 1.2

36
Optimising management actions for the conservation of threatened species in Kakadu National Park
Species
persist. status quo
taxon group
habitat IUCN EPBCANT
statusKak.
signif.
persist. no
mgmtdiff.
Arytera bifoliolata 98.1 P SC NT 3 93.6 4.5
Atalaya salicifolia 98.1 P SC NT 2 93.6 4.5
Citrus gracilis 98.1 P L NT 3 91.4 6.7
Gossypium cunninghamii 98.1 P L NT 2 95.0 3.1
Nephrolepis acutifolia 98.1 P SC NT 1 92.1 6.0
Terminalia sp. Black Point 98.1 P L NT 3 92.9 5.2
Boronia prolixa 98.1 P SC NT 4 94.4 3.7
Borya jabirabela 98.1 P SC NT 3 95.9 2.2
Dubouzetia australiensis 98.1 P SC NT 3 95.0 3.1
Hibbertia sp. Mount Howship 98.1 P SC NT 4 95.9 2.2
Hibiscus symonii 98.1 P SC NT 4 92.9 5.2
Buff-sided Robin 98.2 B L NT 1 93.6 4.6
Dingo 98.2 M SC VU 1 92.8 5.4
Histiopteris incisa 98.3 P SC NT 1 96.7 1.6
White-lined Honeyeater 98.6 B SC NT 3 90.0 8.6
Crotalaria quinquefolia 99.3 P L NT 1 86.3 13.0
Utricularia hamiltonii 99.3 P L NT 3 91.3 8.0
Utricularia holtzei 99.3 P L NT 3 91.3 8.0
Utricularia subulata 99.3 P L NT 2 91.3 8.0
Scleria sp. Jabiru 99.3 P SC NT 4 91.3 8.0
Stylidium notabile 99.3 P SC NT 5 93.8 5.5
Tephrosia humifusa 99.3 P SC NT 3 91.3 8.0
Desmodium rhytidophyllum 99.3 P L NT 1 93.3 6.0
Dipteracanthus bracteatus 99.3 P L NT 2 86.7 12.6
Utricularia cheiranthos 99.3 P SC NT 4 90.0 9.3
Utricularia rhododactylos 99.3 P SC NT 4 91.3 8.0
Micraira compacta 99.5 P SC NT 4 96.0 3.5
Micraira viscidula 99.5 P SC NT 4 96.0 3.5
Fatoua villosa 99.6 P L NT 1 94.3 5.3
Ximenia americana 99.6 P L NT 1 92.9 6.7
Sauropus filicinus 99.6 P SC (VU) NT 4 95.9 3.7
Acacia proiantha 99.6 P SC NT 4 94.4 5.2
Neobyrnesia suberosa 99.6 P SC NT 4 96.4 3.2
Tiliacora australiana 99.6 P SC NT 2 90.7 8.9
Acacia rigescens 99.6 P SC NT 4 92.8 6.8
Hildegardia australiensis 99.6 P SC NT 4 95.6 4.0
Ternstroemia cherryi 99.7 P SC NT 1 96.7 3.0
Allosyncarpia ternata 99.7 P SC 4 96.0 3.7

37
Table 6. Plant and animal species rated by experts as deriving least benefit from current management. Abbreviations as for Table 5.
Speciesdifference persist. SQ persist
abandon
Smooth Kakadu-shrimp 0.0 66.0 66.0
Bolbitis quoyana 0.0 73.8 73.8
Humped Kakadu-shrimp 0.0 78.0 78.0
Magela Shrimp 0.0 78.0 78.0
Black-tailed Godwit 0.0 88.5 88.5
Microlepia speluncae 0.0 96.7 96.7
Grey Plover 0.0 88.3 88.3
Whimbrel 0.0 88.3 88.3
Grey-tailed Tattler 0.0 88.3 88.3
Greater Sand Plover (Mongolian) 0.0 88.6 88.6
Lesser Sand Plover 0.0 88.6 88.6
Bar-tailed Godwit 0.0 88.6 88.6
Eastern Curlew 0.0 88.6 88.6
Asian Dowitcher 0.0 88.6 88.6
Red Knot 0.0 88.6 88.6
Great Knot 0.0 88.6 88.6
Curlew Sandpiper 0.0 88.6 88.6
Sonneratia lanceolata 0.5 97.8 97.3
Avicennia integra 0.8 96.8 96.0
Golden Bandicoot 0.9 1.0 0.1
Golden-backed Tree-rat 0.9 2.3 1.4
Saltwater Crocodile 1.2 98.1 96.9
Square-tailed Kite 1.6 90.8 89.2
Dugong 1.6 93.3 91.7
Histiopteris incisa 1.6 98.3 96.7
Ruddy Turnstone 1.8 88.6 86.8
Borya jabirabela 2.2 98.1 95.9
Hibbertia sp. Mount Howship 2.2 98.1 95.9
Dienia montana 2.5 47.5 45.0
Freckled Duck 2.5 80.0 77.5
Pale-vented Bush-hen 2.5 82.5 80.0
Green Turtle 2.5 92.5 90.0
Top End Dragon 2.5 92.5 90.0
Kakadu Vicetail 2.5 92.5 90.0
Rock Narrow-wing 2.5 92.5 90.0
Letter-winged Kite 2.8 85.7 82.9
Ternstroemia cherryi 3.0 99.7 96.7
Olive Ridley 3.0 93.0 90.0
Hawksbill Turtle 3.0 93.0 90.0
Loggerhead Turtle 3.0 93.0 90.0

38
Optimising management actions for the conservation of threatened species in Kakadu National Park
Speciesdifference persist. SQ persist
abandon
Emmenosperma cunninghamii 3.0 98.0 95.0
Psychotria loniceroides 3.0 98.0 95.0
Bursaria incana 3.0 96.3 93.3
Freshwater Crocodile 3.1 94.7 91.6
Gossypium cunninghamii 3.1 98.1 95.0
Dubouzetia australiensis 3.1 98.1 95.0
Neobyrnesia suberosa 3.2 99.6 96.4
Gleichenia dicarpa 3.3 93.3 90.0
Micraira compacta 3.5 99.5 96.0
Micraira viscidula 3.5 99.5 96.0
Allosyncarpia ternata 3.7 99.7 96.0
Sauropus filicinus 3.7 99.6 95.9
Boronia prolixa 3.7 98.1 94.4
Arafura File Snake 4.0 95.0 91.0
Boronia grandisepala subsp. acanthophida 4.0 98.0 94.0
Eucalyptus koolpinensis 4.0 97.1 93.1
Dichapetalum timoriense 4.0 97.1 93.1
Hildegardia australiensis 4.0 99.6 95.6
Grey Falcon 4.3 95.7 91.4
Northern Hopping-mouse 4.4 11.3 6.9
Arytera bifoliolata 4.5 98.1 93.6
Atalaya salicifolia 4.5 98.1 93.6
Buff-sided Robin 4.6 98.2 93.6
Pig-nosed Turtle 5.0 92.9 87.9
Freycinetia excelsa 5.0 93.1 88.1

39
Table 7. Plant and animal species rated by experts as deriving most benefit from current management. Abbreviations as for Table 5.
Speciesdifference persist. SQ persist
abandon
Monochoria hastata 36.0 86.0 50.0
Northern Brushtail Possum 32.5 82.7 50.2
Fawn Antechinus 28.2 82.0 53.8
Northern Quoll 27.3 54.2 26.9
Black-footed Tree-rat 26.5 63.0 36.5
Pale Field-rat 25.9 64.6 38.7
Hibbertia pancerea 24.5 89.5 65.0
Hibbertia tricornis 24.5 89.5 65.0
Jacksonia divisa 24.5 89.5 65.0
Partridge Pigeon 24.1 83.4 59.3
Northern Brown Bandicoot 24.1 76.1 52.0
Leichhardt’s Grasshopper 23.8 79.4 55.6
White-throated Grass-wren 23.6 84.5 60.9
Largetooth Sawfish 23.6 75.7 52.1
Western Chestnut Mouse 23.2 81.0 57.8
Bare-rumped Sheath-tailed Bat 23.0 86.0 63.0
Northern Brush-tailed Phascogale 22.9 54.0 31.1
Dwarf Sawfish 22.9 80.0 57.1
Northern Nailtail Wallaby 22.7 88.0 65.3
Hibbertia brennanii 21.4 91.4 70.0
Arnhem Sheath-tailed Bat 21.2 90.0 68.8
Arnhem Leaf-nosed Bat 20.8 83.3 62.5
Ghost Bat 20.0 74.6 54.6
Melaleuca stipitata 20.0 90.0 70.0
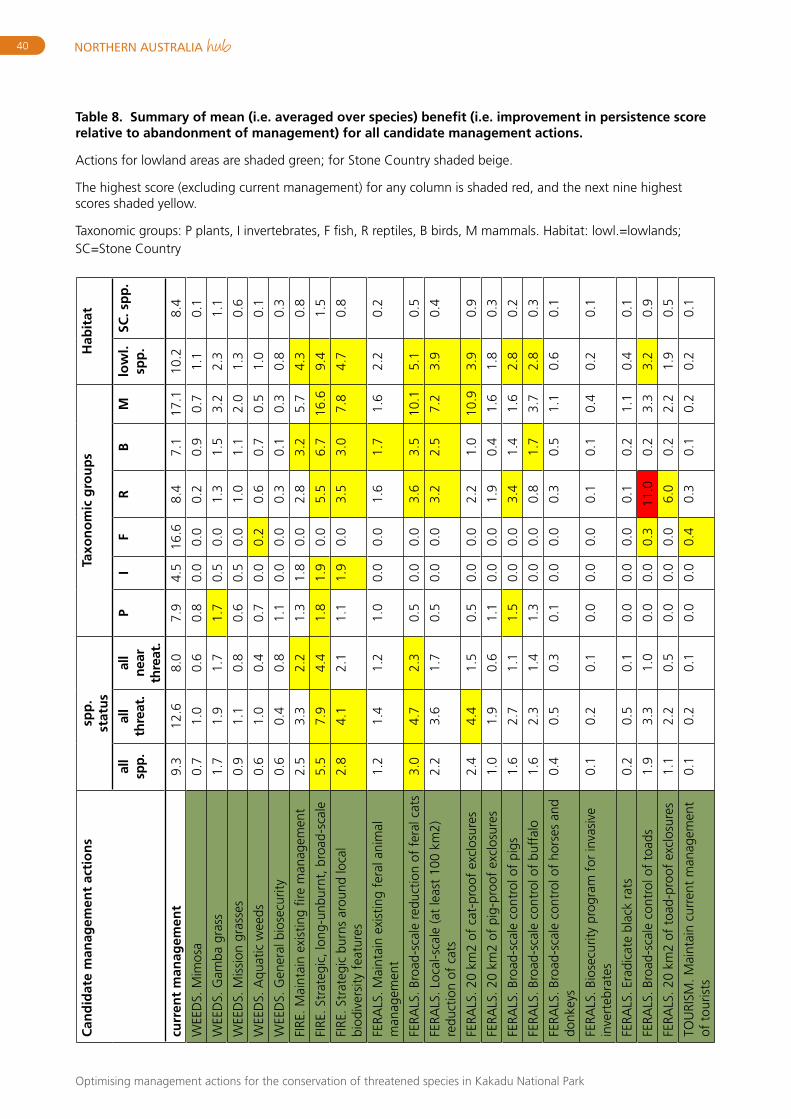
40
Optimising management actions for the conservation of threatened species in Kakadu National Park
Table 8. Summary of mean (i.e. averaged over species) benefit (i.e. improvement in persistence score relative to abandonment of management) for all candidate management actions.
Actions for lowland areas are shaded green; for Stone Country shaded beige.
The highest score (excluding current management) for any column is shaded red, and the next nine highest scores shaded yellow.
Taxonomic groups: P plants, I invertebrates, F fish, R reptiles, B birds, M mammals. Habitat: lowl.=lowlands; SC=Stone Country
Can
did
ate
man
agem
ent
acti
on
ssp
p.
stat
us
Taxo
no
mic
gro
up
sH
abit
at
all
spp.
all
thre
at.
all
near
th
reat
.
PI
FR
BM
low
l. sp
p.
SC. s
pp
.
curr
ent
man
agem
ent
9.3
12.6
8.0
7.9
4.5
16.6
8.4
7.1
17.1
10.2
8.4
WEE
DS.
Mim
osa
0.7
1.0
0.6
0.8
0.0
0.0
0.2
0.9
0.7
1.1
0.1
WEE
DS.
Gam
ba g
rass
1.7
1.9
1.7
1.7
0.5
0.0
1.3
1.5
3.2
2.3
1.1
WEE
DS.
Mis
sion
gra
sses
0.9
1.1
0.8
0.6
0.5
0.0
1.0
1.1
2.0
1.3
0.6
WEE
DS.
Aqu
atic
wee
ds0.
61.
00.
40.
70.
00.
20.
60.
70.
51.
00.
1
WEE
DS.
Gen
eral
bio
secu
rity
0.6
0.4
0.8
1.1
0.0
0.0
0.3
0.1
0.3
0.8
0.3
FIRE
. Mai
ntai
n ex
istin
g fir
e m
anag
emen
t2.
53.
32.
21.
31.
80.
02.
83.
25.
74.
30.
8
FIRE
. Str
ateg
ic, l
ong-
unbu
rnt,
bro
ad-s
cale
5.5
7.9
4.4
1.8
1.9
0.0
5.5
6.7
16.6
9.4
1.5
FIRE
. Str
ateg
ic b
urns
aro
und
loca
l bi
odiv
ersi
ty f
eatu
res
2.8
4.1
2.1
1.1
1.9
0.0
3.5
3.0
7.8
4.7
0.8
FERA
LS. M
aint
ain
exis
ting
fera
l ani
mal
m
anag
emen
t1.
21.
41.
21.
00.
00.
01.
61.
71.
62.
20.
2
FERA
LS. B
road
-sca
le r
educ
tion
of f
eral
cat
s3.
04.
72.
30.
50.
00.
03.
63.
510
.15.
10.
5
FERA
LS. L
ocal
-sca
le (a
t le
ast
100
km2)
re
duct
ion
of c
ats
2.2
3.6
1.7
0.5
0.0
0.0
3.2
2.5
7.2
3.9
0.4
FERA
LS. 2
0 km
2 of
cat
-pro
of e
xclo
sure
s2.
44.
41.
50.
50.
00.
02.
21.
010
.93.
90.
9
FERA
LS. 2
0 km
2 of
pig
-pro
of e
xclo
sure
s1.
01.
90.
61.
10.
00.
01.
90.
41.
61.
80.
3
FERA
LS. B
road
-sca
le c
ontr
ol o
f pi
gs1.
62.
71.
11.
50.
00.
03.
41.
41.
62.
80.
2
FERA
LS. B
road
-sca
le c
ontr
ol o
f bu
ffal
o1.
62.
31.
41.
30.
00.
00.
81.
73.
72.
80.
3
FERA
LS. B
road
-sca
le c
ontr
ol o
f ho
rses
and
do
nkey
s0.
40.
50.
30.
10.
00.
00.
30.
51.
10.
60.
1
FERA
LS. B
iose
curit
y pr
ogra
m f
or in
vasi
ve
inve
rteb
rate
s0.
10.
20.
10.
00.
00.
00.
10.
10.
40.
20.
1
FERA
LS. E
radi
cate
bla
ck r
ats
0.2
0.5
0.1
0.0
0.0
0.0
0.1
0.2
1.1
0.4
0.1
FERA
LS. B
road
-sca
le c
ontr
ol o
f to
ads
1.9
3.3
1.0
0.0
0.0
0.3
11.0
0.2
3.3
3.2
0.9
FERA
LS. 2
0 km
2 of
toa
d-pr
oof
excl
osur
es1.
12.
20.
50.
00.
00.
06.
00.
22.
21.
90.
5
TOU
RISM
. Mai
ntai
n cu
rren
t m
anag
emen
t of
tou
rists
0.1
0.2
0.1
0.0
0.0
0.4
0.3
0.1
0.2
0.2
0.1

41
Can
did
ate
man
agem
ent
acti
on
ssp
p.
stat
us
Taxo
no
mic
gro
up
sH
abit
at
all
spp.
all
thre
at.
all
near
th
reat
.
PI
FR
BM
low
l. sp
p.
SC. s
pp
.
FISH
ING
MA
NA
GEM
ENT.
0.8
1.9
0.3
0.1
0.0
21.4
0.9
0.1
0.1
1.4
0.1
CLI
MA
TE C
HA
NG
E. E
stab
lish
barr
ages
0.
1-0
.20.
30.
20.
0-8
.20.
70.
50.
30.
10.
1
MA
NA
GE
IND
IGEN
OU
S H
ARV
EST
0.9
1.2
0.6
0.1
0.0
7.4
2.4
0.8
0.8
1.4
0.3
CO
MBI
NA
TIO
NS.
Gam
ba g
rass
, enh
ance
d fir
e m
anag
emen
t5.
98.
64.
72.
40.
50.
35.
16.
718
.110
.01.
6
CO
MBI
NA
TIO
NS.
Gam
ba g
rass
, enh
ance
d fir
e m
anag
emen
t &
ext
ensi
ve c
at c
ontr
ol6.
59.
85.
12.
20.
50.
36.
07.
620
.711
.21.
6
FIRE
. Mai
ntai
n ex
istin
g fir
e m
anag
emen
t2.
93.
72.
64.
03.
40.
00.
71.
04.
50.
75.
8
FIRE
. Str
ateg
ic, l
ong-
unbu
rnt,
bro
ad-s
cale
4.7
6.4
3.9
5.8
4.7
0.0
1.6
2.0
8.6
1.2
9.5
FIRE
. Str
ateg
ic b
urns
aro
und
loca
l bi
odiv
ersi
ty f
eatu
res
3.5
5.0
3.0
4.8
4.9
0.0
0.8
1.4
5.5
0.7
7.1
FERA
LS. M
aint
ain
exis
ting
fera
l ani
mal
m
anag
emen
t 0.
60.
60.
60.
51.
80.
00.
40.
21.
60.
41.
0
FERA
LS. B
road
-sca
le r
educ
tion
of f
eral
cat
s1.
32.
20.
80.
31.
90.
01.
50.
94.
90.
62.
5
FERA
LS. 2
0 km
2 of
cat
-pro
of e
xclo
sure
s0.
91.
80.
50.
30.
00.
00.
40.
34.
70.
71.
7
FERA
LS. B
road
-sca
le r
educ
tion
of b
uffa
lo0.
60.
80.
50.
40.
00.
00.
30.
22.
10.
41.
0
FERA
LS. B
road
-sca
le r
educ
tion
of t
oads
1.0
1.3
0.4
0.1
8.5
0.0
1.5
0.1
2.9
0.9
1.9
FERA
LS. 2
0 km
2 of
toa
d-pr
oof
excl
osur
es0.
61.
00.
20.
15.
10.
00.
70.
11.
90.
51.
2
TOU
RISM
. Mai
ntai
n cu
rren
t m
anag
emen
t of
tou
rists
0.3
0.0
0.3
0.0
6.1
0.3
0.0
0.1
0.3
0.2
0.5
MA
NA
GE
IND
IGEN
OU
S H
ARV
EST.
0.2
0.1
0.2
0.1
0.0
0.3
0.3
0.2
0.5
0.2
0.3
CO
MBI
NA
TIO
NS.
Enh
ance
d fir
e m
anag
emen
t &
ext
ensi
ve c
at c
ontr
ol5.
17.
44.
15.
85.
40.
02.
32.
110
.41.
310
.3
EX S
ITU
& R
EIN
TRO
DU
CTI
ON
. Thr
eate
ned
plan
ts3.
13.
93.
26.
90.
00.
00.
00.
00.
31.
35.
1
EX S
ITU
& R
EIN
TRO
DU
CTI
ON
. Thr
eate
ned
mam
mal
s1.
64.
50.
20.
00.
00.
00.
80.
09.
92.
32.
2
TOA
D-T
RAIN
ING
. Ave
rsio
n tr
aini
ng0.
81.
30.
50.
00.
00.
03.
30.
02.
41.
30.
8
INTR
OD
UC
E TO
AD
SU
RVIV
ORS
.0.
51.
10.
10.
00.
00.
02.
50.
01.
00.
80.
3

42
Optimising management actions for the conservation of threatened species in Kakadu National Park
Table 9. Summary of mean (i.e. averaged over species) benefit (i.e. improvement in persistence score relative to abandonment of management) for all candidate management actions, weighted by different components of species’ prioritisations.
Conventions as for Table 8. Note that the ‘all spp.’ column is repeated from Table 8.
Can
did
ate
man
agem
ent
acti
on
sal
l sp
p.
Wei
gh
ted
by
spec
ies
pri
ori
tisa
tio
n
thre
aten
ed
valu
eta
xon
om
ic
valu
ecu
ltu
ral
valu
eec
olo
gic
al
valu
eK
akad
u
sig
nifi
can
cesu
mm
ed
spec
ies
valu
es
curr
ent
man
agem
ent
9.3
11.2
9.9
11.0
10.2
9.7
10.2
WEE
DS.
Mim
osa
0.7
0.8
1.0
0.6
0.7
0.5
0.7
WEE
DS.
Gam
ba g
rass
1.7
1.9
1.7
2.1
1.7
1.6
1.8
WEE
DS.
Mis
sion
gra
sses
0.9
1.2
1.1
1.3
1.0
0.8
1.0
WEE
DS.
Aqu
atic
wee
ds0.
60.
71.
00.
80.
80.
40.
7
WEE
DS.
Gen
eral
bio
secu
rity
0.6
0.5
0.3
0.4
0.4
0.6
0.5
FIRE
. Mai
ntai
n ex
istin
g fir
e m
anag
emen
t2.
53.
13.
53.
53.
02.
02.
7
FIRE
. Str
ateg
ic, l
ong-
unbu
rnt,
bro
ad-s
cale
5.5
7.4
7.8
7.6
6.9
4.2
6.1
FIRE
. Str
ateg
ic b
urns
aro
und
loca
l bio
dive
rsity
fe
atur
es2.
83.
74.
14.
33.
52.
33.
2
FERA
LS. M
aint
ain
exis
ting
fera
l ani
mal
m
anag
emen
t1.
21.
41.
61.
41.
30.
91.
2
FERA
LS. B
road
-sca
le r
educ
tion
of f
eral
cat
s3.
04.
54.
33.
83.
62.
13.
2
FERA
LS. L
ocal
-sca
le (a
t le
ast
100
km2 )
re
duct
ion
of c
ats
2.2
3.4
3.2
2.8
2.6
1.7
2.5
FERA
LS. 2
0 km
2 of
cat
-pro
of e
xclo
sure
s2.
44.
13.
33.
03.
11.
72.
7
FERA
LS. 2
0 km
2 of
pig
-pro
of e
xclo
sure
s1.
01.
31.
71.
61.
20.
81.
2
FERA
LS. B
road
-sca
le c
ontr
ol o
f pi
gs1.
62.
02.
32.
11.
81.
21.
7
FERA
LS. B
road
-sca
le c
ontr
ol o
f bu
ffal
o1.
62.
12.
11.
51.
71.
11.
6
FERA
LS. B
road
-sca
le c
ontr
ol o
f ho
rses
and
do
nkey
s0.
40.
50.
50.
40.
40.
30.
4
FERA
LS. B
iose
curit
y pr
ogra
m f
or in
vasi
ve
inve
rteb
rate
s0.
10.
20.
20.
20.
20.
10.
1
FERA
LS. E
radi
cate
bla
ck r
ats
0.2
0.4
0.3
0.3
0.3
0.2
0.3
FERA
LS. B
road
-sca
le c
ontr
ol o
f to
ads
1.9
3.0
1.8
3.6
3.8
1.4
2.3
FERA
LS. 2
0 km
2 of
toa
d-pr
oof
excl
osur
es1.
12.
01.
02.
12.
30.
81.
4
TOU
RISM
. Mai
ntai
n cu
rren
t m
anag
emen
t of
to
uris
ts0.
10.
20.
20.
30.
20.
10.
2
FISH
ING
MA
NA
GEM
ENT.
0.8
1.7
1.8
2.3
2.2
0.7
1.5

43
Can
did
ate
man
agem
ent
acti
on
sal
l sp
p.
Wei
gh
ted
by
spec
ies
pri
ori
tisa
tio
n
thre
aten
ed
valu
eta
xon
om
ic
valu
ecu
ltu
ral
valu
eec
olo
gic
al
valu
eK
akad
u
sig
nifi
can
cesu
mm
ed
spec
ies
valu
es
CLI
MA
TE C
HA
NG
E. E
stab
lish
barr
ages
0.
1-0
.10.
2-0
.1-0
.30.
00.
0
MA
NA
GE
IND
IGEN
OU
S H
ARV
EST
0.9
1.1
1.7
2.5
2.0
0.6
1.3
CO
MBI
NA
TIO
NS.
Gam
ba g
rass
, enh
ance
d fir
e m
anag
emen
t5.
97.
98.
07.
97.
24.
56.
4
CO
MBI
NA
TIO
NS.
Gam
ba g
rass
, enh
ance
d fir
e m
anag
emen
t &
ext
ensi
ve c
at c
ontr
ol6.
59.
09.
18.
78.
15.
07.
1
FIRE
. Mai
ntai
n ex
istin
g fir
e m
anag
emen
t2.
93.
11.
92.
62.
14.
23.
2
FIRE
. Str
ateg
ic, l
ong-
unbu
rnt,
bro
ad-s
cale
4.7
5.6
3.2
4.2
3.7
6.6
5.2
FIRE
. Str
ateg
ic b
urns
aro
und
loca
l bio
dive
rsity
fe
atur
es3.
54.
22.
33.
12.
55.
23.
9
FERA
LS. M
aint
ain
exis
ting
fera
l ani
mal
m
anag
emen
t 0.
60.
70.
70.
90.
60.
70.
7
FERA
LS. B
road
-sca
le r
educ
tion
of f
eral
cat
s1.
32.
11.
81.
81.
51.
51.
7
FERA
LS. 2
0 km
2 of
cat
-pro
of e
xclo
sure
s0.
91.
81.
11.
11.
40.
91.
1
FERA
LS. B
road
-sca
le r
educ
tion
of b
uffa
lo0.
60.
80.
50.
50.
70.
60.
6
FERA
LS. B
road
-sca
le r
educ
tion
of t
oads
1.0
1.6
1.9
1.2
1.1
1.3
1.4
FERA
LS. 2
0 km
2 of
toa
d-pr
oof
excl
osur
es0.
61.
31.
00.
60.
80.
80.
9
TOU
RISM
. Mai
ntai
n cu
rren
t m
anag
emen
t of
to
uris
ts0.
30.
20.
70.
50.
20.
50.
5
MA
NA
GE
IND
IGEN
OU
S H
ARV
EST.
0.2
0.2
0.2
0.4
0.3
0.3
0.3
CO
MBI
NA
TIO
NS.
Enh
ance
d fir
e m
anag
emen
t &
ext
ensi
ve c
at c
ontr
ol5.
16.
43.
94.
84.
07.
05.
7
EX S
ITU
& R
EIN
TRO
DU
CTI
ON
. Thr
eate
ned
plan
ts3.
13.
10.
90.
71.
14.
52.
7
EX S
ITU
& R
EIN
TRO
DU
CTI
ON
. Thr
eate
ned
mam
mal
s1.
64.
52.
72.
02.
51.
12.
1
TOA
D-T
RAIN
ING
. Ave
rsio
n tr
aini
ng0.
81.
31.
11.
61.
40.
61.
0
INTR
OD
UC
E TO
AD
SU
RVIV
ORS
.0.
51.
00.
30.
91.
00.
30.
6

44
Optimising management actions for the conservation of threatened species in Kakadu National Park
Table 10. Estimates by experts on the feasibility of candidate management actions, based on a scale from 0 (even with adequate resources, the action cannot be achieved) to 100 (with adequate resources, the action can be fully implemented).
‘range, N, s.e.’ refers to the minimum and maximum values given by experts for that action, N is the number of experts who scored the action, and s.e. is the standard error of scores.
Management action areamean
feasibilityrange, N, s.e.
WEEDS. Mimosa lowlands 85.6 70-100, 9, 3.4
WEEDS. Gamba grass lowlands 79.0 60-90, 10, 2.8
WEEDS. Mission grasses lowlands 54.4 20-90, 9, 7.7
WEEDS. Aquatic weeds lowlands 47.8 30-70, 9, 6.0
WEEDS. General biosecurity lowlands 84.4 60-100, 9, 4.1
FIRE. Maintain existing fire management lowlands 93.6 80-100, 11, 2.4
FIRE. Strategic, long-unburnt, broad-scale lowlands 66.8 20-90, 11, 6.7
FIRE. Strategic burns around local biodiversity features lowlands 79.1 50-100, 11, 4.6
FERALS. Maintain existing feral animal management lowlands 85.5 60-100, 11, 5.3
FERALS. Broad-scale reduction of feral cats lowlands 41.8 0-80, 11, 7.6
FERALS. Local-scale (at least 100 km2) reduction of cats lowlands 54.5 0-90, 11, 8.1
FERALS. 20 km2 of cat-proof exclosures lowlands 79.1 20-100, 11, 8.6
FERALS. 20 km2 of pig-proof exclosures lowlands 77.3 20-100, 11, 8.5
FERALS. Broad-scale control of pigs lowlands 70.0 50-100, 11, 4.9
FERALS. Broad-scale control of buffalo lowlands 82.7 40-100, 11, 5.4
FERALS. Broad-scale control of horses and donkeys lowlands 80.0 20-100, 11, 6.9
FERALS. Biosecurity program for invasive invertebrates lowlands 61.1 30-80, 9, 6.8
FERALS. Eradicate black rats lowlands 52.7 20-80, 11, 6.5
FERALS. Broad-scale control of toads lowlands 16.0 0-50, 10, 4.8
FERALS. 20 km2 of toad-proof exclosures lowlands 49.1 10-100, 11, 11.6
TOURISM. Maintain current management of tourists lowlands 95.5 80-100, 10, 2.2
FISHING MANAGEMENT. lowlands 79.1 20-100, 11, 6.5
CLIMATE CHANGE. Establish barrages lowlands 45.6 10-70, 9, 7.5
MANAGE INDIGENOUS HARVEST lowlands 68.2 30-100, 11, 5.2
COMBINATIONS. Gamba grass, enhanced fire management
lowlands 70.0 30-100, 11, 7.4
COMBINATIONS. Gamba grass, enhanced fire management & extensive cat control
lowlands 56.4 0-80, 11, 8.2
FIRE. Maintain existing fire management Stone Country 89.1 60-100, 11, 4.1
FIRE. Strategic, long-unburnt, broad-scale Stone Country 70.9 20-100, 11, 6.8
FIRE. Strategic burns around local biodiversity features Stone Country 77.7 40-100, 11, 6.2
FERALS. Maintain existing feral animal management Stone Country 85.5 60-100, 11, 4.9
FERALS. Broad-scale reduction of feral cats Stone Country 41.8 0-70, 11, 8.1
FERALS. 20 km2 of cat-proof exclosures Stone Country 66.0 20-100, 10, 9.7
FERALS. Broad-scale reduction of buffalo Stone Country 81.4 40-100, 11, 5.9
FERALS. Broad-scale reduction of toads Stone Country 15.6 0-50, 9, 5.0
FERALS. 20 km2 of toad-proof exclosures Stone Country 42.2 10-90, 9, 10.8

45
TOURISM. Maintain current management of tourists Stone Country 93.6 80-100, 11, 2.8
MANAGE INDIGENOUS HARVEST. Stone Country 71.0 30-100, 10, 6.0
COMBINATIONS. Enhanced fire management & extensive cat control
Stone Country 50.5 0-80, 11, 8.8
EX SITU & REINTRODUCTION. Threatened plants both 87.8 70-100, 9, 3.6
EX SITU & REINTRODUCTION. Threatened mammals both 77.0 30-100, 10, 6.5
TOAD-TRAINING. Aversion training both 32.5 12-50, 3, 11.1
INTRODUCE TOAD SURVIVORS. both 42.5 25-60, 3, 10.1
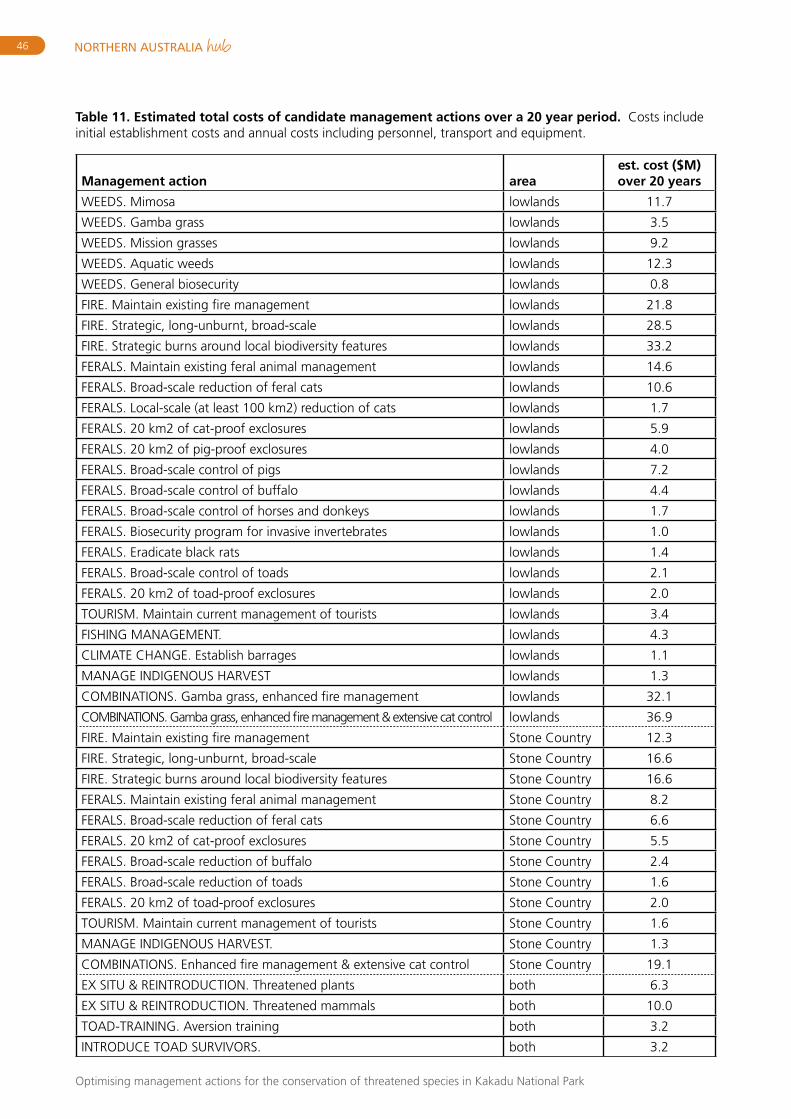
46
Optimising management actions for the conservation of threatened species in Kakadu National Park
Table 11. Estimated total costs of candidate management actions over a 20 year period. Costs include initial establishment costs and annual costs including personnel, transport and equipment.
Management action areaest. cost ($M) over 20 years
WEEDS. Mimosa lowlands 11.7
WEEDS. Gamba grass lowlands 3.5
WEEDS. Mission grasses lowlands 9.2
WEEDS. Aquatic weeds lowlands 12.3
WEEDS. General biosecurity lowlands 0.8
FIRE. Maintain existing fire management lowlands 21.8
FIRE. Strategic, long-unburnt, broad-scale lowlands 28.5
FIRE. Strategic burns around local biodiversity features lowlands 33.2
FERALS. Maintain existing feral animal management lowlands 14.6
FERALS. Broad-scale reduction of feral cats lowlands 10.6
FERALS. Local-scale (at least 100 km2) reduction of cats lowlands 1.7
FERALS. 20 km2 of cat-proof exclosures lowlands 5.9
FERALS. 20 km2 of pig-proof exclosures lowlands 4.0
FERALS. Broad-scale control of pigs lowlands 7.2
FERALS. Broad-scale control of buffalo lowlands 4.4
FERALS. Broad-scale control of horses and donkeys lowlands 1.7
FERALS. Biosecurity program for invasive invertebrates lowlands 1.0
FERALS. Eradicate black rats lowlands 1.4
FERALS. Broad-scale control of toads lowlands 2.1
FERALS. 20 km2 of toad-proof exclosures lowlands 2.0
TOURISM. Maintain current management of tourists lowlands 3.4
FISHING MANAGEMENT. lowlands 4.3
CLIMATE CHANGE. Establish barrages lowlands 1.1
MANAGE INDIGENOUS HARVEST lowlands 1.3
COMBINATIONS. Gamba grass, enhanced fire management lowlands 32.1
COMBINATIONS. Gamba grass, enhanced fire management & extensive cat control lowlands 36.9
FIRE. Maintain existing fire management Stone Country 12.3
FIRE. Strategic, long-unburnt, broad-scale Stone Country 16.6
FIRE. Strategic burns around local biodiversity features Stone Country 16.6
FERALS. Maintain existing feral animal management Stone Country 8.2
FERALS. Broad-scale reduction of feral cats Stone Country 6.6
FERALS. 20 km2 of cat-proof exclosures Stone Country 5.5
FERALS. Broad-scale reduction of buffalo Stone Country 2.4
FERALS. Broad-scale reduction of toads Stone Country 1.6
FERALS. 20 km2 of toad-proof exclosures Stone Country 2.0
TOURISM. Maintain current management of tourists Stone Country 1.6
MANAGE INDIGENOUS HARVEST. Stone Country 1.3
COMBINATIONS. Enhanced fire management & extensive cat control Stone Country 19.1
EX SITU & REINTRODUCTION. Threatened plants both 6.3
EX SITU & REINTRODUCTION. Threatened mammals both 10.0
TOAD-TRAINING. Aversion training both 3.2
INTRODUCE TOAD SURVIVORS. both 3.2

47
Table 12. Summary of mean (i.e. averaged over species) benefit (i.e. improvement in persistence score relative to abandonment of management) for all candidate management actions, per unit ($M) cost and including consideration of the feasibility of implementing the management action successfully. Actions for lowland areas are shaded green; for Stone Country shaded beige.
The highest score (excluding current management) for any column is shaded red, and the next nine highest scores shaded yellow.
Taxonomic groups: P plants, I invertebrates, F fish, R reptiles, B birds, M mammals. Habitat: lowl.=lowlands; SC=Stone Country
Can
did
ate
man
agem
ent
acti
on
ssp
p.
stat
us
Taxo
no
mic
gro
up
sH
abit
at
all
spp.
all
thre
at.
all
near
th
reat
.
PI
FR
BM
low
l. sp
p.SC
. sp
p.
curr
ent
man
agem
ent
WEE
DS.
Mim
osa
0.05
0.07
0.05
0.06
0.00
0.00
0.01
0.07
0.05
0.08
0.01
WEE
DS.
Gam
ba g
rass
0.38
0.42
0.38
0.37
0.11
0.00
0.29
0.34
0.71
0.52
0.24
WEE
DS.
Mis
sion
gra
sses
0.05
0.06
0.05
0.03
0.03
0.00
0.06
0.06
0.12
0.08
0.03
WEE
DS.
Aqu
atic
wee
ds0.
020.
040.
020.
030.
000.
010.
020.
030.
020.
040.
00
WEE
DS.
Gen
eral
bio
secu
rity
0.61
0.38
0.85
1.11
0.00
0.02
0.26
0.15
0.35
0.79
0.35
FIRE
. Mai
ntai
n ex
istin
g fir
e m
anag
emen
t0.
110.
140.
090.
060.
080.
000.
120.
140.
240.
180.
03
FIRE
. Str
ateg
ic, l
ong-
unbu
rnt,
bro
ad-s
cale
0.13
0.18
0.10
0.04
0.04
0.00
0.13
0.16
0.39
0.22
0.03
FIRE
. Str
ateg
ic b
urns
aro
und
loca
l bio
dive
rsity
fe
atur
es0.
070.
100.
050.
030.
040.
000.
080.
070.
190.
110.
02
FERA
LS. M
aint
ain
exis
ting
fera
l ani
mal
m
anag
emen
t0.
070.
080.
070.
060.
000.
000.
100.
100.
090.
130.
01
FERA
LS. B
road
-sca
le r
educ
tion
of f
eral
cat
s0.
120.
190.
090.
020.
000.
000.
140.
140.
400.
200.
02
FERA
LS. L
ocal
-sca
le (a
t le
ast
100
km2)
re
duct
ion
of c
ats
0.73
1.17
0.55
0.16
0.00
0.01
1.02
0.81
2.34
1.27
0.11
FERA
LS. 2
0 km
2 of
cat
-pro
of e
xclo
sure
s0.
320.
590.
200.
070.
000.
000.
300.
131.
470.
530.
12
FERA
LS. 2
0 km
2 of
pig
-pro
of e
xclo
sure
s0.
200.
370.
120.
210.
000.
000.
370.
080.
310.
350.
05
FERA
LS. B
road
-sca
le c
ontr
ol o
f pi
gs0.
160.
260.
110.
140.
000.
000.
330.
130.
150.
270.
02
FERA
LS. B
road
-sca
le c
ontr
ol o
f bu
ffal
o0.
300.
430.
260.
240.
000.
000.
140.
320.
690.
510.
06
FERA
LS. B
road
-sca
le c
ontr
ol o
f ho
rses
and
do
nkey
s0.
170.
240.
140.
070.
000.
010.
130.
240.
510.
290.
06
FERA
LS. B
iose
curit
y pr
ogra
m f
or in
vasi
ve
inve
rteb
rate
s0.
070.
110.
050.
030.
000.
010.
040.
060.
230.
090.
05
FERA
LS. E
radi
cate
bla
ck r
ats
0.08
0.18
0.04
0.01
0.00
0.01
0.04
0.06
0.39
0.14
0.03
FERA
LS. B
road
-sca
le c
ontr
ol o
f to
ads
0.14
0.25
0.07
0.00
0.00
0.02
0.84
0.01
0.25
0.24
0.07
FERA
LS. 2
0 km
2 of
toa
d-pr
oof
excl
osur
es0.
270.
540.
120.
010.
000.
001.
460.
050.
530.
470.
12
TOU
RISM
. Mai
ntai
n cu
rren
t m
anag
emen
t of
to
uris
ts0.
030.
060.
010.
010.
000.
110.
080.
020.
060.
050.
01
FISH
ING
MA
NA
GEM
ENT.
0.15
0.34
0.05
0.01
0.00
3.90
0.16
0.01
0.03
0.26
0.01

48
Optimising management actions for the conservation of threatened species in Kakadu National Park
Can
did
ate
man
agem
ent
acti
on
ssp
p.
stat
us
Taxo
no
mic
gro
up
sH
abit
at
all
spp.
all
thre
at.
all
near
th
reat
.
PI
FR
BM
low
l. sp
p.SC
. sp
p.
CLI
MA
TE C
HA
NG
E. E
stab
lish
barr
ages
0.
03-0
.07
0.10
0.10
0.00
3.30
0.30
0.18
0.12
0.03
0.05
MA
NA
GE
IND
IGEN
OU
S H
ARV
EST
0.44
0.59
0.30
0.04
0.00
3.79
1.22
0.41
0.43
0.73
0.18
CO
MBI
NA
TIO
NS.
Gam
ba g
rass
, enh
ance
d fir
e m
anag
emen
t0.
130.
190.
100.
050.
010.
010.
110.
150.
400.
220.
03
CO
MBI
NA
TIO
NS.
Gam
ba g
rass
, enh
ance
d fir
e m
anag
emen
t &
ext
ensi
ve c
at c
ontr
ol0.
100.
150.
080.
030.
010.
000.
090.
120.
320.
170.
02
FIRE
. Mai
ntai
n ex
istin
g fir
e m
anag
emen
t0.
210.
270.
190.
290.
250.
000.
050.
070.
330.
050.
42
FIRE
. Str
ateg
ic, l
ong-
unbu
rnt,
bro
ad-s
cale
0.20
0.27
0.17
0.25
0.20
0.00
0.07
0.09
0.37
0.05
0.41
FIRE
. Str
ateg
ic b
urns
aro
und
loca
l bio
dive
rsity
fe
atur
es0.
170.
230.
140.
220.
230.
000.
040.
060.
260.
030.
33
FERA
LS. M
aint
ain
exis
ting
fera
l ani
mal
m
anag
emen
t 0.
060.
060.
060.
050.
180.
000.
040.
020.
160.
040.
10
FERA
LS. B
road
-sca
le r
educ
tion
of f
eral
cat
s0.
080.
140.
050.
020.
120.
000.
090.
060.
310.
040.
16
FERA
LS. 2
0 km
2 of
cat
-pro
of e
xclo
sure
s0.
110.
220.
060.
030.
000.
000.
050.
040.
560.
080.
21
FERA
LS. B
road
-sca
le r
educ
tion
of b
uffa
lo0.
200.
250.
170.
140.
000.
010.
100.
080.
710.
130.
35
FERA
LS. B
road
-sca
le r
educ
tion
of t
oads
0.10
0.12
0.04
0.01
0.82
0.00
0.14
0.01
0.28
0.08
0.18
FERA
LS. 2
0 km
2 of
toa
d-pr
oof
excl
osur
es0.
140.
220.
040.
031.
070.
000.
150.
030.
390.
110.
25
TOU
RISM
. Mai
ntai
n cu
rren
t m
anag
emen
t of
to
uris
ts0.
19-0
.00
0.19
0.03
3.56
0.17
0.02
0.08
0.15
0.09
0.30
MA
NA
GE
IND
IGEN
OU
S H
ARV
EST.
0.12
0.08
0.11
0.07
0.00
0.16
0.15
0.10
0.27
0.12
0.16
CO
MBI
NA
TIO
NS.
Enh
ance
d fir
e m
anag
emen
t &
ext
ensi
ve c
at c
ontr
ol0.
140.
200.
110.
150.
140.
000.
060.
060.
280.
030.
27
EX S
ITU
& R
EIN
TRO
DU
CTI
ON
. Thr
eate
ned
plan
ts0.
430.
540.
450.
960.
000.
000.
000.
000.
040.
180.
71
EX S
ITU
& R
EIN
TRO
DU
CTI
ON
. Thr
eate
ned
mam
mal
s0.
120.
340.
010.
000.
000.
000.
060.
000.
760.
170.
17
TOA
D-T
RAIN
ING
. Ave
rsio
n tr
aini
ng0.
080.
130.
050.
000.
000.
000.
330.
000.
240.
130.
08
INTR
OD
UC
E TO
AD
SU
RVIV
ORS
.0.
060.
140.
010.
000.
000.
000.
330.
000.
140.
110.
04
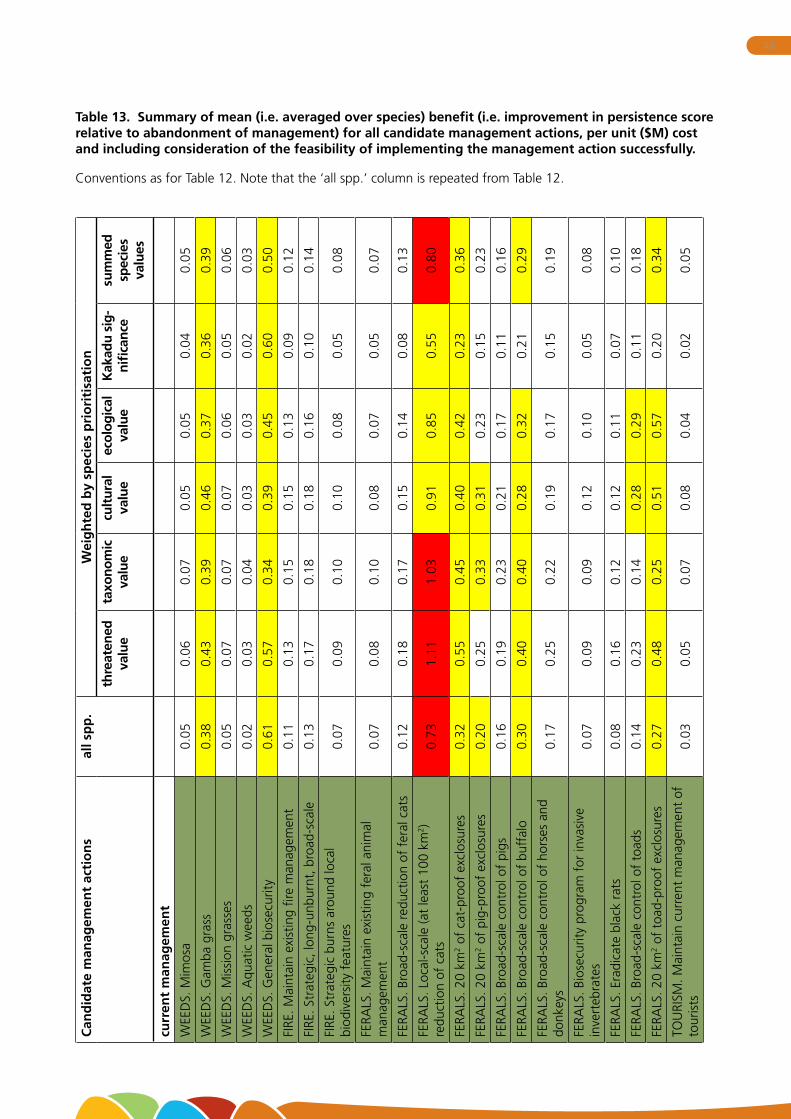
49
Table 13. Summary of mean (i.e. averaged over species) benefit (i.e. improvement in persistence score relative to abandonment of management) for all candidate management actions, per unit ($M) cost and including consideration of the feasibility of implementing the management action successfully.
Conventions as for Table 12. Note that the ‘all spp.’ column is repeated from Table 12.
Can
did
ate
man
agem
ent
acti
on
sal
l sp
p.
Wei
gh
ted
by
spec
ies
pri
ori
tisa
tio
n
thre
aten
ed
valu
eta
xono
mic
va
lue
cult
ural
va
lue
ecol
ogic
al
valu
eK
akad
u si
g-ni
fica
nce
sum
med
sp
ecie
s va
lues
curr
ent
man
agem
ent
WEE
DS.
Mim
osa
0.05
0.06
0.07
0.05
0.05
0.04
0.05
WEE
DS.
Gam
ba g
rass
0.38
0.43
0.39
0.46
0.37
0.36
0.39
WEE
DS.
Mis
sion
gra
sses
0.05
0.07
0.07
0.07
0.06
0.05
0.06
WEE
DS.
Aqu
atic
wee
ds0.
020.
030.
040.
030.
030.
020.
03
WEE
DS.
Gen
eral
bio
secu
rity
0.61
0.57
0.34
0.39
0.45
0.60
0.50
FIRE
. Mai
ntai
n ex
istin
g fir
e m
anag
emen
t0.
110.
130.
150.
150.
130.
090.
12
FIRE
. Str
ateg
ic, l
ong-
unbu
rnt,
bro
ad-s
cale
0.13
0.17
0.18
0.18
0.16
0.10
0.14
FIRE
. Str
ateg
ic b
urns
aro
und
loca
l bi
odiv
ersi
ty f
eatu
res
0.07
0.09
0.10
0.10
0.08
0.05
0.08
FERA
LS. M
aint
ain
exis
ting
fera
l ani
mal
m
anag
emen
t0.
070.
080.
100.
080.
070.
050.
07
FERA
LS. B
road
-sca
le r
educ
tion
of f
eral
cat
s0.
120.
180.
170.
150.
140.
080.
13
FERA
LS. L
ocal
-sca
le (a
t le
ast
100
km2 )
re
duct
ion
of c
ats
0.73
1.11
1.03
0.91
0.85
0.55
0.80
FERA
LS. 2
0 km
2 of
cat
-pro
of e
xclo
sure
s0.
320.
550.
450.
400.
420.
230.
36
FERA
LS. 2
0 km
2 of
pig
-pro
of e
xclo
sure
s0.
200.
250.
330.
310.
230.
150.
23
FERA
LS. B
road
-sca
le c
ontr
ol o
f pi
gs0.
160.
190.
230.
210.
170.
110.
16
FERA
LS. B
road
-sca
le c
ontr
ol o
f bu
ffal
o0.
300.
400.
400.
280.
320.
210.
29
FERA
LS. B
road
-sca
le c
ontr
ol o
f ho
rses
and
do
nkey
s0.
170.
250.
220.
190.
170.
150.
19
FERA
LS. B
iose
curit
y pr
ogra
m f
or in
vasi
ve
inve
rteb
rate
s0.
070.
090.
090.
120.
100.
050.
08
FERA
LS. E
radi
cate
bla
ck r
ats
0.08
0.16
0.12
0.12
0.11
0.07
0.10
FERA
LS. B
road
-sca
le c
ontr
ol o
f to
ads
0.14
0.23
0.14
0.28
0.29
0.11
0.18
FERA
LS. 2
0 km
2 of
toa
d-pr
oof
excl
osur
es0.
270.
480.
250.
510.
570.
200.
34
TOU
RISM
. Mai
ntai
n cu
rren
t m
anag
emen
t of
to
uris
ts0.
030.
050.
070.
080.
040.
020.
05

50
Optimising management actions for the conservation of threatened species in Kakadu National Park
Can
did
ate
man
agem
ent
acti
on
sal
l sp
p.
Wei
gh
ted
by
spec
ies
pri
ori
tisa
tio
n
thre
aten
ed
valu
eta
xono
mic
va
lue
cult
ural
va
lue
ecol
ogic
al
valu
eK
akad
u si
g-ni
fica
nce
sum
med
sp
ecie
s va
lues
FISH
ING
MA
NA
GEM
ENT.
0.15
0.31
0.34
0.41
0.40
0.13
0.26
CLI
MA
TE C
HA
NG
E. E
stab
lish
barr
ages
0.
03-0
.05
0.06
-0.0
3-0
.13
0.02
-0.0
1
MA
NA
GE
IND
IGEN
OU
S H
ARV
EST
0.44
0.57
0.85
1.26
1.03
0.32
0.66
CO
MBI
NA
TIO
NS.
Gam
ba g
rass
, enh
ance
d fir
e m
anag
emen
t0.
130.
170.
180.
170.
160.
100.
14
CO
MBI
NA
TIO
NS.
Gam
ba g
rass
, enh
ance
d fir
e m
anag
emen
t &
ext
ensi
ve c
at c
ontr
ol0.
100.
140.
140.
130.
120.
080.
11
FIRE
. Mai
ntai
n ex
istin
g fir
e m
anag
emen
t0.
210.
230.
140.
190.
150.
300.
23
FIRE
. Str
ateg
ic, l
ong-
unbu
rnt,
bro
ad-s
cale
0.20
0.24
0.14
0.18
0.16
0.28
0.22
FIRE
. Str
ateg
ic b
urns
aro
und
loca
l bi
odiv
ersi
ty f
eatu
res
0.17
0.20
0.11
0.14
0.12
0.24
0.18
FERA
LS. M
aint
ain
exis
ting
fera
l ani
mal
m
anag
emen
t 0.
060.
070.
080.
100.
060.
070.
07
FERA
LS. B
road
-sca
le r
educ
tion
of f
eral
cat
s0.
080.
130.
110.
110.
090.
090.
10
FERA
LS. 2
0 km
2 of
cat
-pro
of e
xclo
sure
s0.
110.
210.
130.
130.
160.
110.
14
FERA
LS. B
road
-sca
le r
educ
tion
of b
uffa
lo0.
200.
280.
170.
170.
250.
220.
22
FERA
LS. B
road
-sca
le r
educ
tion
of t
oads
0.10
0.16
0.18
0.12
0.11
0.12
0.14
FERA
LS. 2
0 km
2 of
toa
d-pr
oof
excl
osur
es0.
140.
260.
210.
120.
160.
170.
18
TOU
RISM
. Mai
ntai
n cu
rren
t m
anag
emen
t of
to
uris
ts0.
190.
100.
400.
290.
110.
310.
27
MA
NA
GE
IND
IGEN
OU
S H
ARV
EST.
0.12
0.10
0.13
0.23
0.19
0.15
0.15
CO
MBI
NA
TIO
NS.
Enh
ance
d fir
e m
anag
emen
t &
ext
ensi
ve c
at c
ontr
ol0.
140.
170.
100.
130.
110.
190.
15
EX S
ITU
& R
EIN
TRO
DU
CTI
ON
. Thr
eate
ned
plan
ts0.
430.
440.
130.
100.
150.
630.
38
EX S
ITU
& R
EIN
TRO
DU
CTI
ON
. Thr
eate
ned
mam
mal
s0.
120.
350.
210.
150.
190.
080.
17
TOA
D-T
RAIN
ING
. Ave
rsio
n tr
aini
ng0.
080.
130.
110.
170.
150.
060.
10
INTR
OD
UC
E TO
AD
SU
RVIV
ORS
.0.
060.
140.
040.
120.
140.
040.
08

51
Table 14. Summary of management actions that were selected by Marxan within the best set of actions across a set of 23 scenarios. Each scenario was run 25 times, and the numbers in the body of the table indicate the number of times that candidate action was selected in the best set. Actions that were selected every time are shaded green; those that were selected a majority of times are shaded yellow. Note that the set of candidate management actions is truncated from that shown in previous tables, to seek to maintain independence.
Pers
iste
nce
targ
et50
5050
5050
6060
6060
6060
6075
7575
7575
7575
7575
9090
Budg
et c
ap ($
M o
ver 2
0 ye
ars)
2025
3035
4030
4050
6070
8090
5055
6065
7075
8090
120
120
150
Can
did
ate
man
agem
ent
acti
on
s
WEE
DS.
Mim
osa
00
00
00
00
015
2525
00
00
00
00
018
25
WEE
DS.
Gam
ba g
rass
00
01
00
03
10
00
2525
2525
170
00
2525
25
WEE
DS.
Mis
sion
gra
sses
00
00
00
00
00
00
00
00
00
00
00
25
WEE
DS.
Aqu
atic
wee
ds0
00
00
00
024
2525
250
00
00
00
025
725
WEE
DS.
Gen
eral
bio
secu
rity
020
250
50
2116
40
10
00
124
170
00
2525
25
FIRE
. Str
ateg
ic, l
ong-
unbu
rnt
00
00
00
00
00
00
00
00
825
2525
2525
25
FERA
LS. 2
0 km
2 of
cat
exc
losu
res
11
024
2025
2525
2525
2525
2525
2525
2525
2525
2525
25
FERA
LS. B
road
-sca
le c
ontr
ol o
f pi
gs25
2525
2525
2525
2525
2525
2525
2525
2517
2525
2525
2525
FERA
LS. B
uffa
lo c
ontr
ol24
2425
2525
025
2525
2525
2525
2525
2525
2525
250
2525
FERA
LS. B
road
-sca
le h
orse
con
trol
00
04
10
02
71
00
00
00
00
00
024
25
FERA
LS. I
nver
tebr
ate
bios
ecur
ity0
00
00
00
54
23
00
00
017
00
025
2525
FERA
LS. E
radi
cate
bla
ck r
ats
022
252
50
2521
2525
2525
00
019
170
025
2525
25
FERA
LS. B
road
-sca
le t
oad
cont
rol
02
01
20
01
59
40
2525
2525
2525
2525
2525
25
FISH
ING
MA
NA
GEM
ENT
00
00
00
014
2423
2525
00
525
170
025
2525
25
CLI
MA
TE C
HA
NG
E. B
arra
ges
01
01
20
2424
2525
2525
00
136
170
00
2525
25
MA
NA
GE
IND
IGEN
OU
S H
ARV
EST
00
01
00
2522
1512
2225
2525
2525
2525
2525
2525
25
SC F
IRE.
Str
ateg
ic, l
ong-
unbu
rnt
00
00
525
013
210
1522
2525
2525
2525
2525
2525
25
SC F
ERA
LS. B
road
-sca
le c
at c
ontr
ol0
225
2520
025
1223
1510
30
220
2517
00
2525
2525
SC F
ERA
LS. B
uffa
lo r
educ
tion
00
00
125
513
2425
2525
023
50
170
250
2525
25
SC F
ERA
LS. t
oad-
proo
f ex
clos
ures
01
01
00
2011
187
83
023
2525
250
2525
2525
25
SC T
OU
RISM
00
00
00
02
12
00
00
00
00
00
2524
25
SC IN
DIG
ENO
US
HA
RVES
T0
200
22
00
1223
1211
30
00
00
00
00
025
EX S
ITU
Thr
eate
ned
plan
ts0
00
00
00
00
00
00
00
00
00
00
2525
EX S
ITU
Thr
eate
ned
mam
mal
s25
2525
2525
2525
2525
2525
2525
2525
2525
2525
2525
2525
INTR
OD
UC
E TO
AD
SU
RVIV
ORS
00
00
00
01
01
00
00
00
00
00
01
25

52
Optimising management actions for the conservation of threatened species in Kakadu National Park
Table 15. Summary of outcomes of Marxan scenarios, showing the number of species that failed to reach persistence targets for each scenario. Cost threshold is $m over 20 years.
Persistence target Cost threshold No. of species not meeting threshold
50 20 6
50 25 6
50 30 5
50 35 0
50 40 0
60 30 6
60 40 4
60 50 5
60 60 3
60 70 1
60 80 3
60 90 3
75 50 16
75 55 17
75 60 16
75 65 13
75 70 13
75 75 12
75 80 13
75 90 9
75 120 5
90 120 29
90 150 26

53
Table 16. Extent to which species reach target persistence levels under a range of Marxan scenarios of varying budget caps ($million over 20 years) and persistence targets. ‘Aband’ represents the estimated persistence in Kakadu under no management (averaged over experts’ assessments). ‘threat’ indicates whether the species is listed under either the EPBC Act or TPWC Act (1 if listed as threatened under either; otherwise 0).
Values in body of table indicate whether the best set of management actions increases the expected persistence level from that under abandonment to the target level, where 1.00 indicates that target has been achieved and X indicates that the target was already achieved under abandonment. Other values (highlighted in yellow) signify that the target has not been met and the given values represent the proportion to which the set of management actions advance the species to the target [for example, if the estimated persistence under abandonment is 20, the target persistence is 50, and the best set of actions increases the estimated persistence to 45, then the proportion to which the target is approached is (45-20)/(50-20)=0.83. Note that this Table is continued below for higher target levels.
Persistence target 50 50 50 50 50 60 60 60 60 60 60 60
Budget cap 20 25 30 35 40 30 40 50 60 70 80 90
Species Aband threat
Golden Bandicoot 0.1 1 1.00 1.00 1.00 1.00 1.00 1.00 1.00 1.00 1.00 1.00 1.00 1.00
Golden-backed Tree-rat 1.4 1 0.94 0.99 0.99 1.00 1.00 1.00 1.00 1.00 1.00 1.00 1.00 1.00
Brush-tailed Rabbit-rat 2.6 1 1.00 1.00 1.00 1.00 1.00 1.00 1.00 1.00 1.00 1.00 1.00 1.00
Northern Hopping-mouse 6.9 1 0.83 0.87 0.87 1.00 1.00 0.81 0.89 0.94 0.96 1.00 0.96 0.96
Northern Quoll 26.9 1 1.00 1.00 1.00 1.00 1.00 1.00 1.00 1.00 1.00 1.00 1.00 1.00
Northern Brush-tailed
Phascogale31.1 1 0.71 0.75 0.93 1.00 1.00 1.00 1.00 1.00 1.00 1.00 1.00 1.00
Water Mouse 31.4 1 0.89 0.89 0.97 1.00 1.00 0.41 0.76 0.70 0.83 0.83 0.87 0.87
Black-footed Tree-rat 36.5 1 0.75 0.75 1.00 1.00 1.00 1.00 1.00 1.00 1.00 1.00 1.00 1.00
Spectacled Hare-wallaby 37.5 0 0.47 0.47 0.70 1.00 1.00 0.64 1.00 1.00 1.00 1.00 1.00 1.00
Pale Field-rat 38.7 1 1.00 1.00 1.00 1.00 1.00 1.00 1.00 1.00 1.00 1.00 1.00 1.00
Dienia montana 45.0 1 1.00 1.00 1.00 1.00 1.00 1.00 1.00 1.00 1.00 1.00 1.00 1.00
Nabarlek 46.4 1 0.00 1.00 1.00 1.00 1.00 0.90 0.92 1.00 0.98 1.00 0.96 0.98
Arnhem Land Skink 49.1 1 0.00 1.00 1.00 1.00 1.00 0.77 1.00 1.00 1.00 1.00 1.00 1.00
Monochoria hastata 50.0 1 X X X X X 1.00 1.00 1.00 1.00 1.00 1.00 1.00
Northern Brushtail Possum 50.2 0 X X X X X 1.00 1.00 1.00 1.00 1.00 1.00 1.00
Northern Brown Bandicoot 52.0 0 X X X X X 1.00 1.00 1.00 1.00 1.00 1.00 1.00
Largetooth Sawfish 52.1 1 X X X X X 1.00 1.00 1.00 1.00 1.00 1.00 1.00
Yellow-snouted Gecko 52.5 1 X X X X X 1.00 1.00 1.00 1.00 1.00 1.00 1.00
Fawn Antechinus 53.8 1 X X X X X 1.00 1.00 1.00 1.00 1.00 1.00 1.00
Ghost Bat 54.6 0 X X X X X 1.00 1.00 1.00 1.00 1.00 1.00 1.00
Leichhardt’s Grasshopper 55.6 0 X X X X X 1.00 1.00 1.00 1.00 1.00 1.00 1.00
King Brown Snake 56.7 0 X X X X X 1.00 1.00 1.00 1.00 1.00 1.00 1.00
Dwarf Sawfish 57.1 1 X X X X X 0.86 0.86 0.86 1.00 1.00 1.00 1.00
Western Chestnut Mouse 57.8 0 X X X X X 1.00 1.00 1.00 1.00 1.00 1.00 1.00
Arnhem Rock-rat 57.8 1 X X X X X 1.00 1.00 1.00 1.00 1.00 1.00 1.00
Plains Death Adder 59.1 1 X X X X X 1.00 1.00 1.00 1.00 1.00 1.00 1.00
Partridge Pigeon 59.3 1 X X X X X 1.00 1.00 1.00 1.00 1.00 1.00 1.00
Northern Leaf-nosed Bat 60.0 1 X X X X X X X X X X X X
Gouldian Finch 60.8 1 X X X X X X X X X X X X
White-throated Grass-wren 60.9 1 X X X X X X X X X X X X
Mitchell’s Water Monitor 61.4 1 X X X X X X X X X X X X
Yellow-spotted Monitor 62.0 1 X X X X X X X X X X X X
Arnhem Leaf-nosed Bat 62.5 1 X X X X X X X X X X X X

54
Optimising management actions for the conservation of threatened species in Kakadu National Park
Persistence target 50 50 50 50 50 60 60 60 60 60 60 60
Budget cap 20 25 30 35 40 30 40 50 60 70 80 90
Bare-rumped Sheath-tailed
Bat63.0 1 X X X X X X X X X X X X
Merten’s Water Monitor 63.8 1 X X X X X X X X X X X X
Kakadu Pebble-Mouse 63.9 0 X X X X X X X X X X X X
Hibbertia pancerea 65.0 1 X X X X X X X X X X X X
Hibbertia tricornis 65.0 1 X X X X X X X X X X X X
Jacksonia divisa 65.0 1 X X X X X X X X X X X X
Northern Nailtail Wallaby 65.3 0 X X X X X X X X X X X X
Smooth Kakadu-shrimp 66.0 0 X X X X X X X X X X X X
Narrow Sawfish 66.2 0 X X X X X X X X X X X X
Yellow Chat (Alligator R.) 67.7 1 X X X X X X X X X X X X
Acacia equisetifolia 68.0 1 X X X X X X X X X X X X
Arnhem Sheath-tailed Bat 68.8 0 X X X X X X X X X X X X
Flock Bronzewing 68.9 0 X X X X X X X X X X X X
Hibbertia brennanii 70.0 1 X X X X X X X X X X X X
Northern Ridge-tailed Monitor 70.0 0 X X X X X X X X X X X X
Melaleuca stipitata 70.0 0 X X X X X X X X X X X X
Northern River Shark 71.1 1 X X X X X X X X X X X X
Black Wallaroo 71.5 0 X X X X X X X X X X X X
Emu 71.8 0 X X X X X X X X X X X X
Speartooth Shark 72.4 1 X X X X X X X X X X X X
Orange Leaf-nosed Bat 72.7 0 X X X X X X X X X X X X
Masked Owl (northern) 73.1 1 X X X X X X X X X X X X
Bolbitis quoyana 73.8 1 X X X X X X X X X X X X
Common Blue-tongued Lizard 73.8 0 X X X X X X X X X X X X
Utricularia dunstaniae 74.0 1 X X X X X X X X X X X X
Hibbertia sp. South Magela 74.2 1 X X X X X X X X X X X X
Frillneck Lizard 74.7 0 X X X X X X X X X X X X
Australian Reed-warbler 75.0 0 X X X X X X X X X X X X
Barramundi 77.2 0 X X X X X X X X X X X X
Freckled Duck 77.5 0 X X X X X X X X X X X X
Star Finch 77.5 0 X X X X X X X X X X X X
Caldesia acanthocarpa 77.5 0 X X X X X X X X X X X X
Chameleon Dragon 78.0 0 X X X X X X X X X X X X
Humped Kakadu-shrimp 78.0 0 X X X X X X X X X X X X
Magela Shrimp 78.0 0 X X X X X X X X X X X X
Yellow-rumped Mannikin 78.0 0 X X X X X X X X X X X X
Pictorella Mannikin 78.0 0 X X X X X X X X X X X X
Mangrove Monitor 78.2 0 X X X X X X X X X X X X
Hooded Parrot 78.2 0 X X X X X X X X X X X X
Centralian Blue-tongued
Lizard78.3 0 X X X X X X X X X X X X
Australian Painted Snipe 79.0 1 X X X X X X X X X X X X
Echidna 79.4 0 X X X X X X X X X X X X
Oenpelli Python 80.0 1 X X X X X X X X X X X X
Crested Shrike-tit (northern) 80.0 1 X X X X X X X X X X X X
Pale-vented Bush-hen 80.0 0 X X X X X X X X X X X X
Hibbertia guttata 80.0 0 X X X X X X X X X X X X

55
Persistence target 50 50 50 50 50 60 60 60 60 60 60 60
Budget cap 20 25 30 35 40 30 40 50 60 70 80 90
Nymphoides subacuta 80.0 0 X X X X X X X X X X X X
Hibiscus brennanii 81.3 1 X X X X X X X X X X X X
Lithomyrtus linariifolia 81.3 1 X X X X X X X X X X X X
Eastern Grass Owl 81.5 0 X X X X X X X X X X X X
Antilopine Wallaroo 82.4 0 X X X X X X X X X X X X
Letter-winged Kite 82.9 0 X X X X X X X X X X X X
Pentapetes phoenicea 83.8 0 X X X X X X X X X X X X
Chestnut-quilled Rock-pigeon 83.8 0 X X X X X X X X X X X X
Red Goshawk 84.0 1 X X X X X X X X X X X X
Australian Bustard 84.2 0 X X X X X X X X X X X X
Magpie Goose 84.7 0 X X X X X X X X X X X X
Flatback Turtle 85.0 1 X X X X X X X X X X X X
Omegandra kanisii 85.0 0 X X X X X X X X X X X X
Flock Bronzewing 68.9 0 X X X X X X X X X X X X
Drummondita calida 85.6 0 X X X X X X X X X X X X
Bush Stone-curlew 85.9 0 X X X X X X X X X X X X
Calytrix inopinata 86.2 0 X X X X X X X X X X X X
Calytrix rupestris 86.2 0 X X X X X X X X X X X X
Calytrix surdiviperana 86.2 0 X X X X X X X X X X X X
Crotalaria quinquefolia 86.3 0 X X X X X X X X X X X X
Callitris intratropica 86.5 0 X X X X X X X X X X X X
Dipteracanthus bracteatus 86.7 0 X X X X X X X X X X X X
Ruddy Turnstone 86.8 0 X X X X X X X X X X X X
Pig-nosed Turtle 87.9 0 X X X X X X X X X X X X
Freycinetia excelsa 88.1 1 X X X X X X X X X X X X
Grey Plover 88.3 0 X X X X X X X X X X X X
Whimbrel 88.3 0 X X X X X X X X X X X X
Grey-tailed Tattler 88.3 0 X X X X X X X X X X X X
Black-tailed Godwit 88.5 0 X X X X X X X X X X X X
Greater Sand Plover (Mongolian) 88.6 1 X X X X X X X X X X X X
Lesser Sand Plover 88.6 1 X X X X X X X X X X X X
Bar-tailed Godwit 88.6 1 X X X X X X X X X X X X
Eastern Curlew 88.6 1 X X X X X X X X X X X X
Asian Dowitcher 88.6 1 X X X X X X X X X X X X
Red Knot 88.6 1 X X X X X X X X X X X X
Great Knot 88.6 1 X X X X X X X X X X X X
Curlew Sandpiper 88.6 1 X X X X X X X X X X X X
Banded Fruit-dove 88.8 0 X X X X X X X X X X X X
Square-tailed Kite 89.2 0 X X X X X X X X X X X X
Boronia verecunda 89.3 0 X X X X X X X X X X X X
Olive Ridley 90.0 1 X X X X X X X X X X X X
Hawksbill Turtle 90.0 1 X X X X X X X X X X X X
Loggerhead Turtle 90.0 1 X X X X X X X X X X X X
Green Turtle 90.0 1 X X X X X X X X X X X X
Arafura File Snake 91.0 0 X X X X X X X X X X X X
Grey Falcon 91.4 1 X X X X X X X X X X X X
Freshwater Crocodile 91.6 0 X X X X X X X X X X X X
Dingo 92.8 0 X X X X X X X X X X X X

56
Optimising management actions for the conservation of threatened species in Kakadu National Park
Table 16. Continued
Persistence target 75 75 75 75 75 75 75 75 75 90 90
Budget cap 50 55 60 65 70 75 80 90 120 120 150
Species Aband threat
Golden Bandicoot 0.1 1 0.83 0.83 0.84 0.84 0.84 0.84 0.85 0.86 0.86 0.72 0.72
Golden-backed Tree-rat 1.4 1 0.93 0.93 0.96 0.96 0.96 0.96 0.97 0.99 1.00 0.83 0.83
Brush-tailed Rabbit-rat 2.6 1 0.97 0.97 0.97 0.97 1.00 1.00 1.00 1.00 1.00 1.00 1.00
Northern Hopping-mouse 6.9 1 0.74 0.79 0.76 0.76 0.80 0.80 0.86 0.83 0.89 0.73 0.73
Northern Quoll 26.9 1 1.00 1.00 1.00 1.00 1.00 1.00 1.00 1.00 1.00 1.00 1.00
Northern Brush-tailed
Phascogale31.1 1 1.00 1.00 1.00 1.00 1.00 1.00 1.00 1.00 1.00 1.00 1.00
Water Mouse 31.4 1 0.43 0.43 0.46 0.47 0.32 0.43 0.43 0.47 0.54 0.39 0.42
Black-footed Tree-rat 36.5 1 1.00 1.00 1.00 1.00 1.00 1.00 1.00 1.00 1.00 1.00 1.00
Spectacled Hare-wallaby 37.5 0 0.63 0.63 0.66 0.71 0.87 0.91 0.91 0.98 1.00 0.93 0.99
Pale Field-rat 38.7 1 1.00 1.00 1.00 1.00 1.00 1.00 1.00 1.00 1.00 1.00 1.00
Dienia montana 45.0 1 0.59 0.59 0.59 0.59 0.11 0.64 0.64 0.64 0.70 0.47 0.47
Nabarlek 46.4 1 0.78 0.80 1.00 1.00 0.79 0.78 0.80 1.00 1.00 0.81 0.82
Arnhem Land Skink 49.1 1 0.48 0.73 0.99 0.99 0.67 0.48 0.73 0.99 1.00 0.67 0.68
Monochoria hastata 50.0 1 1.00 1.00 1.00 1.00 1.00 1.00 1.00 1.00 1.00 1.00 1.00
Northern Brushtail Possum 50.2 0 1.00 1.00 1.00 1.00 1.00 1.00 1.00 1.00 1.00 1.00 1.00
Northern Brown Bandicoot 52.0 0 1.00 1.00 1.00 1.00 1.00 1.00 1.00 1.00 1.00 1.00 1.00
Largetooth Sawfish 52.1 1 0.45 0.45 0.45 1.00 0.45 0.45 0.45 1.00 1.00 0.94 0.94
Yellow-snouted Gecko 52.5 1 1.00 1.00 1.00 1.00 1.00 1.00 1.00 1.00 1.00 1.00 1.00
Fawn Antechinus 53.8 1 1.00 1.00 1.00 1.00 1.00 1.00 1.00 1.00 1.00 1.00 1.00
Ghost Bat 54.6 0 1.00 1.00 1.00 1.00 1.00 1.00 1.00 1.00 1.00 1.00 1.00
Leichhardt’s Grasshopper 55.6 0 1.00 1.00 1.00 1.00 1.00 1.00 1.00 1.00 1.00 1.00 1.00
King Brown Snake 56.7 0 0.63 0.63 0.63 0.63 1.00 1.00 1.00 1.00 1.00 0.56 0.56
Dwarf Sawfish 57.1 1 0.14 0.14 0.14 1.00 0.14 0.14 0.14 1.00 1.00 0.76 0.76
Western Chestnut Mouse 57.8 0 1.00 1.00 1.00 1.00 1.00 1.00 1.00 1.00 1.00 1.00 1.00
Arnhem Rock-rat 57.8 1 1.00 1.00 1.00 1.00 1.00 1.00 1.00 1.00 1.00 1.00 1.00
Plains Death Adder 59.1 1 1.00 1.00 1.00 1.00 1.00 1.00 1.00 1.00 1.00 1.00 1.00
Partridge Pigeon 59.3 1 1.00 1.00 1.00 1.00 1.00 1.00 1.00 1.00 1.00 1.00 1.00
Northern Leaf-nosed Bat 60.0 1 0.74 0.97 0.82 0.82 0.74 0.74 0.97 0.82 1.00 0.53 0.53
Gouldian Finch 60.8 1 1.00 1.00 1.00 1.00 1.00 1.00 1.00 1.00 1.00 1.00 1.00
White-throated Grass-wren 60.9 1 1.00 1.00 1.00 1.00 1.00 1.00 1.00 1.00 1.00 1.00 1.00
Mitchell’s Water Monitor 61.4 1 1.00 1.00 1.00 1.00 1.00 1.00 1.00 1.00 1.00 0.94 1.00
Yellow-spotted Monitor 62.0 1 1.00 1.00 1.00 1.00 1.00 1.00 1.00 1.00 1.00 1.00 1.00
Arnhem Leaf-nosed Bat 62.5 1 1.00 1.00 1.00 1.00 1.00 1.00 1.00 1.00 1.00 1.00 1.00
Bare-rumped Sheath-tailed Bat 63.0 1 0.13 0.13 0.13 0.13 1.00 1.00 1.00 1.00 1.00 0.83 0.83
Merten’s Water Monitor 63.8 1 1.00 1.00 1.00 1.00 1.00 1.00 1.00 1.00 1.00 0.60 0.66
Kakadu Pebble-Mouse 63.9 0 1.00 1.00 1.00 1.00 1.00 1.00 1.00 1.00 1.00 1.00 1.00
Hibbertia pancerea 65.0 1 1.00 1.00 1.00 1.00 1.00 1.00 1.00 1.00 1.00 1.00 1.00
Hibbertia tricornis 65.0 1 1.00 1.00 1.00 1.00 1.00 1.00 1.00 1.00 1.00 1.00 1.00
Jacksonia divisa 65.0 1 1.00 1.00 1.00 1.00 1.00 1.00 1.00 1.00 1.00 1.00 1.00
Northern Nailtail Wallaby 65.3 0 1.00 1.00 1.00 1.00 1.00 1.00 1.00 1.00 1.00 1.00 1.00
Smooth Kakadu-shrimp 66.0 0 0.00 0.76 0.76 0.76 0.76 0.00 0.76 0.76 1.00 0.52 0.52
Narrow Sawfish 66.2 0 0.30 0.30 0.30 1.00 0.30 0.30 0.30 1.00 1.00 0.82 0.82
Yellow Chat (Alligator R.) 67.7 1 1.00 1.00 1.00 1.00 1.00 1.00 1.00 1.00 1.00 1.00 1.00
Acacia equisetifolia 68.0 1 1.00 1.00 1.00 1.00 1.00 1.00 1.00 1.00 1.00 1.00 1.00

57
Persistence target 75 75 75 75 75 75 75 75 75 90 90
Budget cap 50 55 60 65 70 75 80 90 120 120 150
Arnhem Sheath-tailed Bat 68.8 0 1.00 1.00 1.00 1.00 1.00 1.00 1.00 1.00 1.00 1.00 1.00
Flock Bronzewing 68.9 0 1.00 1.00 1.00 1.00 1.00 1.00 1.00 1.00 1.00 1.00 1.00
Hibbertia brennanii 70.0 1 1.00 1.00 1.00 1.00 1.00 1.00 1.00 1.00 1.00 1.00 1.00
Northern Ridge-tailed Monitor 70.0 0 1.00 1.00 1.00 1.00 1.00 1.00 1.00 1.00 1.00 1.00 1.00
Melaleuca stipitata 70.0 0 1.00 1.00 1.00 1.00 1.00 1.00 1.00 1.00 1.00 1.00 1.00
Northern River Shark 71.1 1 1.00 1.00 1.00 1.00 1.00 1.00 1.00 1.00 1.00 0.93 0.93
Black Wallaroo 71.5 0 1.00 1.00 1.00 1.00 1.00 1.00 1.00 1.00 1.00 0.99 1.00
Emu 71.8 0 1.00 1.00 1.00 1.00 1.00 1.00 1.00 1.00 1.00 1.00 1.00
Speartooth Shark 72.4 1 1.00 1.00 1.00 1.00 1.00 1.00 1.00 1.00 1.00 1.00 1.00
Orange Leaf-nosed Bat 72.7 0 1.00 1.00 1.00 1.00 1.00 1.00 1.00 1.00 1.00 0.66 0.66
Masked Owl (northern) 73.1 1 1.00 1.00 1.00 1.00 1.00 1.00 1.00 1.00 1.00 1.00 1.00
Bolbitis quoyana 73.8 1 0.69 0.69 0.69 0.69 1.00 1.00 1.00 1.00 1.00 0.83 0.83
Common Blue-tongued Lizard 73.8 0 1.00 1.00 1.00 1.00 1.00 1.00 1.00 1.00 1.00 1.00 1.00
Utricularia dunstaniae 74.0 1 1.00 1.00 1.00 1.00 1.00 1.00 1.00 1.00 1.00 1.00 1.00
Hibbertia sp. South Magela 74.2 1 1.00 1.00 1.00 1.00 1.00 1.00 1.00 1.00 1.00 1.00 1.00
Frlilneck Lizard 74.7 0 1.00 1.00 1.00 1.00 1.00 1.00 1.00 1.00 1.00 1.00 1.00
Australian Reed-warbler 75.0 0 X X X X X X X X X 1.00 1.00
Barramundi 77.2 0 X X X X X X X X X 1.00 1.00
Freckled Duck 77.5 0 X X X X X X X X X 0.17 0.26
Star Finch 77.5 0 X X X X X X X X X 1.00 1.00
Caldesia acanthocarpa 77.5 0 X X X X X X X X X 1.00 1.00
Chameleon Dragon 78.0 0 X X X X X X X X X 1.00 1.00
Humped Kakadu-shrimp 78.0 0 X X X X X X X X X 0.82 0.82
Magela Shrimp 78.0 0 X X X X X X X X X 0.82 0.82
Yellow-rumped Mannikin 78.0 0 X X X X X X X X X 1.00 1.00
Pictorella Mannikin 78.0 0 X X X X X X X X X 1.00 1.00
Mangrove Monitor 78.2 0 X X X X X X X X X 1.00 1.00
Hooded Parrot 78.2 0 X X X X X X X X X 1.00 1.00
Centralian Blue-tongued Lizard 78.3 0 X X X X X X X X X 1.00 1.00
Australian Painted Snipe 79.0 1 X X X X X X X X X 1.00 1.00
Echidna 79.4 0 X X X X X X X X X 1.00 1.00
Oenpelli Python 80.0 1 X X X X X X X X X 1.00 1.00
Crested Shrike-tit (northern) 80.0 1 X X X X X X X X X 1.00 1.00
Pale-vented Bush-hen 80.0 0 X X X X X X X X X 0.72 0.72
Hibbertia guttata 80.0 0 X X X X X X X X X 1.00 1.00
Nymphoides subacuta 80.0 0 X X X X X X X X X 1.00 1.00
Hibiscus brennanii 81.3 1 X X X X X X X X X 1.00 1.00
Lithomyrtus linariifolia 81.3 1 X X X X X X X X X 1.00 1.00
Eastern Grass Owl 81.5 0 X X X X X X X X X 1.00 1.00
Antilopine Wallaroo 82.4 0 X X X X X X X X X 1.00 1.00
Letter-winged Kite 82.9 0 X X X X X X X X X 1.00 1.00
Pentapetes phoenicea 83.8 0 X X X X X X X X X 1.00 1.00
Chestnut-quilled Rock-pigeon 83.8 0 X X X X X X X X X 1.00 1.00
Red Goshawk 84.0 1 X X X X X X X X X 1.00 1.00
Australian Bustard 84.2 0 X X X X X X X X X 1.00 1.00
Magpie Goose 84.7 0 X X X X X X X X X 1.00 1.00
Flatback Turtle 85.0 1 X X X X X X X X X 1.00 1.00

58
Optimising management actions for the conservation of threatened species in Kakadu National Park
Persistence target 75 75 75 75 75 75 75 75 75 90 90
Budget cap 50 55 60 65 70 75 80 90 120 120 150
Omegandra kanisii 85.0 0 X X X X X X X X X 1.00 1.00
Cycas armstrongii 85.1 1 X X X X X X X X X 1.00 1.00
Drummondita calida 85.6 0 X X X X X X X X X 1.00 1.00
Bush Stone-curlew 85.9 0 X X X X X X X X X 1.00 1.00
Calytrix inopinata 86.2 0 X X X X X X X X X 1.00 1.00
Calytrix rupestris 86.2 0 X X X X X X X X X 1.00 1.00
Calytrix surdiviperana 86.2 0 X X X X X X X X X 1.00 1.00
Crotalaria quinquefolia 86.3 0 X X X X X X X X X 1.00 1.00
Callitris intratropica 86.5 0 X X X X X X X X X 1.00 1.00
Dipteracanthus bracteatus 86.7 0 X X X X X X X X X 1.00 1.00
Ruddy Turnstone 86.8 0 X X X X X X X X X 0.53 0.53
Pig-nosed Turtle 87.9 0 X X X X X X X X X 1.00 1.00
Freycinetia excelsa 88.1 1 X X X X X X X X X 1.00 1.00
Grey Plover 88.3 0 X X X X X X X X X 0.18 0.18
Whimbrel 88.3 0 X X X X X X X X X 0.18 0.18
Grey-tailed Tattler 88.3 0 X X X X X X X X X 0.18 0.18
Black-tailed Godwit 88.5 0 X X X X X X X X X 0.00 0.00
Greater Sand Plover (Mongolian) 88.6 1 X X X X X X X X X 0.00 0.00
Lesser Sand Plover 88.6 1 X X X X X X X X X 0.00 0.00
Bar-tailed Godwit 88.6 1 X X X X X X X X X 0.00 0.00
Eastern Curlew 88.6 1 X X X X X X X X X 0.00 0.00
Asian Dowitcher 88.6 1 X X X X X X X X X 0.00 0.00
Red Knot 88.6 1 X X X X X X X X X 0.00 0.00
Great Knot 88.6 1 X X X X X X X X X 0.00 0.00
Curlew Sandpiper 88.6 1 X X X X X X X X X 0.00 0.00
Banded Fruit-dove 88.8 0 X X X X X X X X X 1.00 1.00
Square-tailed Kite 89.2 0 X X X X X X X X X 1.00 1.00
Boronia verecunda 89.3 0 X X X X X X X X X 1.00 1.00
Olive Ridley 90.0 1 X X X X X X X X X X X
Hawksbill Turtle 90.0 1 X X X X X X X X X X X
Loggerhead Turtle 90.0 1 X X X X X X X X X X X
Green Turtle 90.0 1 X X X X X X X X X X X
Arafura File Snake 91.0 0 X X X X X X X X X X X
Grey Falcon 91.4 1 X X X X X X X X X X X
Freshwater Crocodile 91.6 0 X X X X X X X X X X X
Dingo 92.8 0 X X X X X X X X X X X
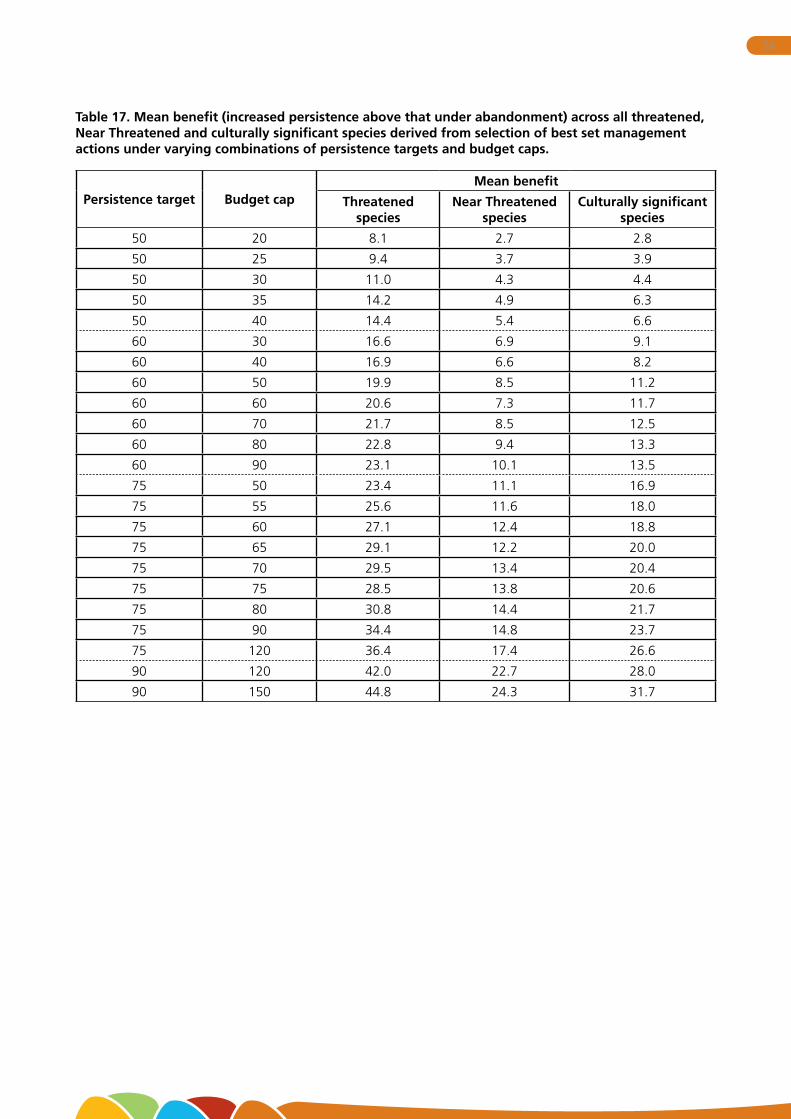
59
Table 17. Mean benefit (increased persistence above that under abandonment) across all threatened, Near Threatened and culturally significant species derived from selection of best set management actions under varying combinations of persistence targets and budget caps.
Persistence target Budget capMean benefit
Threatened species
Near Threatened species
Culturally significant species
50 20 8.1 2.7 2.8
50 25 9.4 3.7 3.9
50 30 11.0 4.3 4.4
50 35 14.2 4.9 6.3
50 40 14.4 5.4 6.6
60 30 16.6 6.9 9.1
60 40 16.9 6.6 8.2
60 50 19.9 8.5 11.2
60 60 20.6 7.3 11.7
60 70 21.7 8.5 12.5
60 80 22.8 9.4 13.3
60 90 23.1 10.1 13.5
75 50 23.4 11.1 16.9
75 55 25.6 11.6 18.0
75 60 27.1 12.4 18.8
75 65 29.1 12.2 20.0
75 70 29.5 13.4 20.4
75 75 28.5 13.8 20.6
75 80 30.8 14.4 21.7
75 90 34.4 14.8 23.7
75 120 36.4 17.4 26.6
90 120 42.0 22.7 28.0
90 150 44.8 24.3 31.7
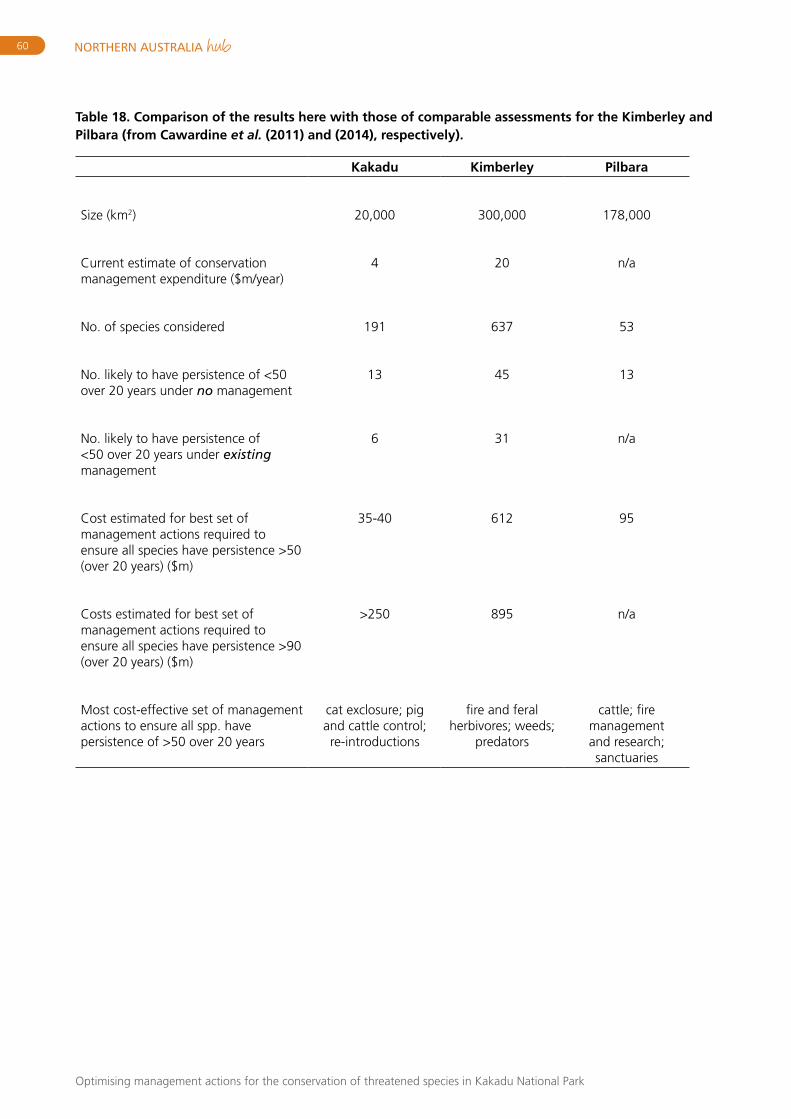
60
Optimising management actions for the conservation of threatened species in Kakadu National Park
Table 18. Comparison of the results here with those of comparable assessments for the Kimberley and Pilbara (from Cawardine et al. (2011) and (2014), respectively).
Kakadu Kimberley Pilbara
Size (km2) 20,000 300,000 178,000
Current estimate of conservation management expenditure ($m/year)
4 20 n/a
No. of species considered 191 637 53
No. likely to have persistence of <50 over 20 years under no management
13 45 13
No. likely to have persistence of <50 over 20 years under existing management
6 31 n/a
Cost estimated for best set of management actions required to ensure all species have persistence >50 (over 20 years) ($m)
35-40 612 95
Costs estimated for best set of management actions required to ensure all species have persistence >90 (over 20 years) ($m)
>250 895 n/a
Most cost-effective set of management actions to ensure all spp. have persistence of >50 over 20 years
cat exclosure; pig and cattle control; re-introductions
fire and feral herbivores; weeds;
predators
cattle; fire management and research; sanctuaries

61
Figure 1. Estimated mean likelihood of persistence in Kakadu for threatened species under current management, summarised by taxonomic group.
Figure 2. Estimated mean likelihood of persistence in Kakadu for threatened species under no management (abandonment), summarised by taxonomic group.

62
Optimising management actions for the conservation of threatened species in Kakadu National Park
Figure 3. Modelled (quadratic) distribution of the number of species failing to meet persistence thresholds (‘failures’) for best set combinations of candidate management actions under varying combinations of persistence thresholds (‘persist_target’) and budget caps (‘cost_thresh’). Black circles indicate points derived from the run Marxan scenarios; the colour codes represent the number of species that do not meet persistence targets.
Figure 4. Modelled (linear) distribution of the number of species failing to meet persistence thresholds (‘failures’) for best set combinations of candidate management actions under varying combinations of persistence thresholds (‘persist_target’) and budget caps (‘cost_thresh’). Black circles indicate points derived from the run Marxan scenarios; the colour codes represent the number of species that do not meet persistence targets.

63
Figure 5. Mean benefits across threatened, Near Threatened and culturally significant species accruing from best set selections under varying persistence targets and budget caps.
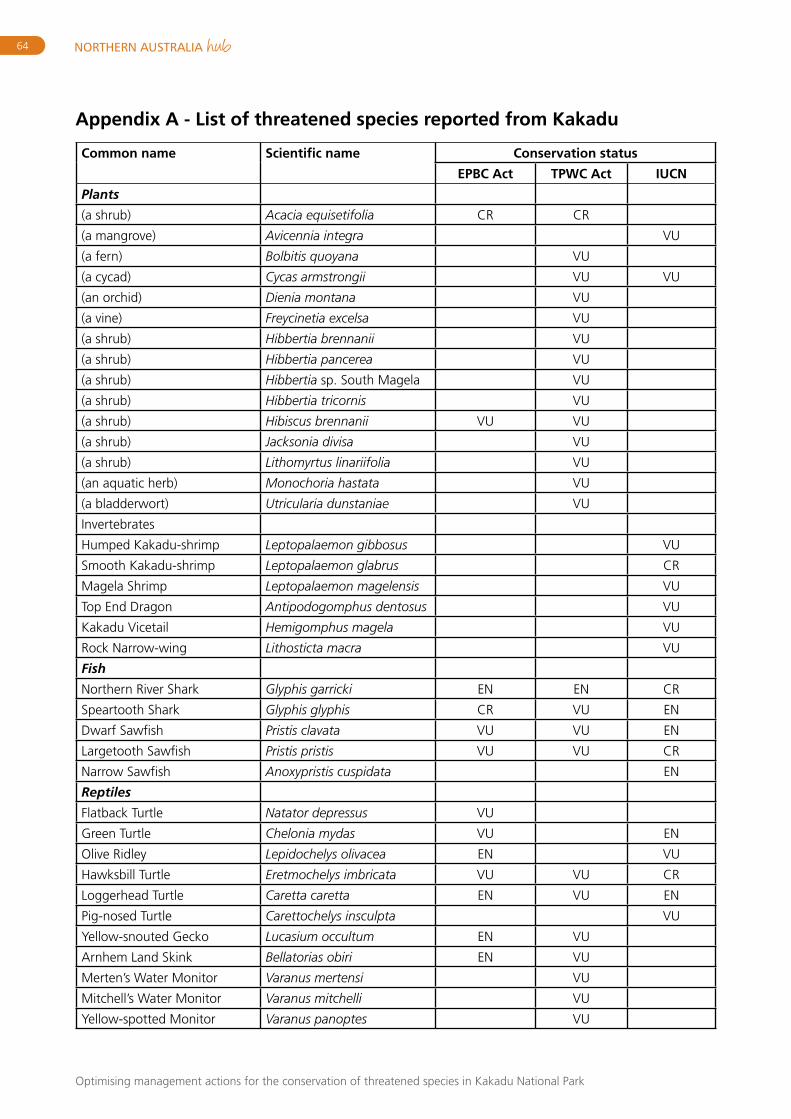
64
Optimising management actions for the conservation of threatened species in Kakadu National Park
Appendix A - List of threatened species reported from Kakadu
Common name Scientific name Conservation status
EPBC Act TPWC Act IUCN
Plants
(a shrub) Acacia equisetifolia CR CR
(a mangrove) Avicennia integra VU
(a fern) Bolbitis quoyana VU
(a cycad) Cycas armstrongii VU VU
(an orchid) Dienia montana VU
(a vine) Freycinetia excelsa VU
(a shrub) Hibbertia brennanii VU
(a shrub) Hibbertia pancerea VU
(a shrub) Hibbertia sp. South Magela VU
(a shrub) Hibbertia tricornis VU
(a shrub) Hibiscus brennanii VU VU
(a shrub) Jacksonia divisa VU
(a shrub) Lithomyrtus linariifolia VU
(an aquatic herb) Monochoria hastata VU
(a bladderwort) Utricularia dunstaniae VU
Invertebrates
Humped Kakadu-shrimp Leptopalaemon gibbosus VU
Smooth Kakadu-shrimp Leptopalaemon glabrus CR
Magela Shrimp Leptopalaemon magelensis VU
Top End Dragon Antipodogomphus dentosus VU
Kakadu Vicetail Hemigomphus magela VU
Rock Narrow-wing Lithosticta macra VU
Fish
Northern River Shark Glyphis garricki EN EN CR
Speartooth Shark Glyphis glyphis CR VU EN
Dwarf Sawfish Pristis clavata VU VU EN
Largetooth Sawfish Pristis pristis VU VU CR
Narrow Sawfish Anoxypristis cuspidata EN
Reptiles
Flatback Turtle Natator depressus VU
Green Turtle Chelonia mydas VU EN
Olive Ridley Lepidochelys olivacea EN VU
Hawksbill Turtle Eretmochelys imbricata VU VU CR
Loggerhead Turtle Caretta caretta EN VU EN
Pig-nosed Turtle Carettochelys insculpta VU
Yellow-snouted Gecko Lucasium occultum EN VU
Arnhem Land Skink Bellatorias obiri EN VU
Merten’s Water Monitor Varanus mertensi VU
Mitchell’s Water Monitor Varanus mitchelli VU
Yellow-spotted Monitor Varanus panoptes VU

65
Common name Scientific name Conservation status
EPBC Act TPWC Act IUCN
Plains Death Adder Acanthophis hawkei EN VU
Oenpelli Python Morelia oenpelliensis VU
Birds
Partridge Pigeon Geophaps smithii VU1 VU VU
Red Goshawk Erythrotriorchis radiatus VU VU
Grey Falcon Falco hypoleucos VU VU
Greater Sand Plover (Mongolian)
Charadrius leschenaultii leschenaultii
VU
Lesser Sand Plover Charadrius mongolus VU
Australian Painted Snipe Rostratula australis EN VU EN
Bar-tailed Godwit Limosa lapponica baueri VU
Eastern Curlew Numenius madagascariensis VU VU
Asian Dowitcher Limnodromus semipalmatus VU
Red Knot Calidris canutus VU
Great Knot Calidris tenuirostris VU VU
Curlew Sandpiper Calidris ferruginea VU
Masked Owl (northern) Tyto novaehollandiae kimberli
VU VU
White-throated Grass-wren Amytornis woodwardi VU VU
Yellow Chat (Alligator R.) Epthianura crocea tunneyi EN EN
Crested Shrike-tit (northern) Falcunculus frontatus whitei VU
Gouldian Finch Erythrura gouldiae EN VU
Mammals
Northern Quoll Dasyurus hallucatus EN CR EN
Northern Brush-tailed Phascogale
Phascogale pirata VU EN VU
Fawn Antechinus Antechinus bellus EN
Golden Bandicoot Isoodon auratus VU EN VU
Nabarlek Petrogale concinna VU
Ghost Bat Macroderma gigas VU
Arnhem Leaf-nosed Bat Hipposideros inornatus VU VU
Northern Leaf-nosed Bat Hipposideros stenotis VU
Bare-rumped Sheath-tailed Bat
Saccolaimus saccolaimus nudicluniatus
CR
Brush-tailed Rabbit-rat Conilurus penicillatus VU EN
Black-footed Tree-rat Mesembriomys gouldii VU
Golden-backed Tree-rat Mesembriomys macrurus VU CR
Northern Hopping-mouse Notomys aquilo VU VU EN
Kakadu Pebble-Mouse Pseudomys calabyi VU
Arnhem Rock-rat Zyzomys maini VU VU
Water Mouse Xeromys myoides VU VU
Pale Field-rat Rattus tunneyi VU
Dugong Dugong dugon VU
Dingo Canis lupus dingo VU
Notes: 1 as eastern subspecies G. s. smithii

66
Optimising management actions for the conservation of threatened species in Kakadu National Park
Appendix B - Species reported from Kakadu and listed as Near Threatened under the Northern Territory’s Parks and Wildlife Conservation Act
Common name Scientific name
Plants
Acacia proiantha
Acacia rigescens
Arytera bifoliolata
Atalaya salicifolia
Boronia grandisepala subsp. acanthophida
Boronia laxa
Boronia prolixa
Boronia rupicola
Boronia suberosa
Boronia verecunda
Boronia xanthastrum
Borya jabirabela
Bursaria incana
Caldesia acanthocarpa
Calytrix inopinata
Calytrix rupestris
Calytrix surdiviperana
Citrus gracilis
Crotalaria quinquefolia
Desmodium rhytidophyllum
Dichapetalum timoriense
Dipteracanthus bracteatus
Drummondita calida
Dubouzetia australiensis
Emmenosperma cunninghamii
Eucalyptus koolpinensis
Fatoua villosa
Gleichenia dicarpa
Gossypium cunninghamii
Heterostemma magnificum
Hibbertia auriculiflora subsp. auriculiflora
Hibbertia extrorsa
Hibbertia guttata
Hibbertia solanifolia
Hibbertia sp. Mount Howship
Hibiscus inimicus
Hibiscus symonii
Hildegardia australiensis
Histiopteris incisa

67
Common name Scientific name
Micraira compacta
Micraira viscidula
Microlepia speluncae
Neobyrnesia suberosa
Nephrolepis acutifolia
Nymphoides planosperma
Nymphoides subacuta
Omegandra kanisii
Pentapetes phoenicea
Psychotria loniceroides
Scleria sp. Jabiru
Sonneratia lanceolata
Stylidium notabile
Tephrosia humifusa
Terminalia sp. Black Point
Ternstroemia cherryi
Tiliacora australiana
Triodia contorta
Triodia uniaristata
Utricularia cheiranthos
Utricularia hamiltonii
Utricularia holtzei
Utricularia rhododactylos
Utricularia subulata
Vallisneria triptera
Ximenia americana
Invertebrates
Leichhardt’s Grasshopper Petasida ephippigera
Reptiles
Chameleon Dragon Chelosania brunnea
Mangrove Monitor Varanus indicus
Northern Ridge-tailed Monitor Varanus primordius
King Brown Snake Pseudechis australis
Birds
Freckled Duck Stictonetta naevosa
Flock Bronzewing Phaps histrionica
Letter-winged Kite Elanus scriptus
Square-tailed Kite Lophoictinia isura
Pale-vented Bush-hen Amaurornis moluccana
Australian Bustard Ardeotis australis
Bush Stone-curlew Burhinus grallarius
Grey Plover Pluvialis squatarola
Black-tailed Godwit Limosa limosa
Whimbrel Numenius phaeopus

68
Optimising management actions for the conservation of threatened species in Kakadu National Park
Common name Scientific name
Grey-tailed Tattler Tringa brevipes
Ruddy Turnstone Arenaria interpres
Hooded Parrot Psephotus dissimilis
Eastern Grass Owl Tyto longimembris
Buff-sided Robin Poecilodryas cerviniventris
Australian Reed-warbler Acrocephala australis
Star Finch Noechmia ruficauda
Yellow-rumped Mannikin Lonchura flaviprymna
Pictorella Mannikin Heteromunia pectoralis
Emu Dromaius novaehollandiae
Chestnut-quilled Rock-pigeon Petrophassa rufipennis
Banded Fruit-dove Ptilonopus cinctus
White-lined Honeyeater Meliphaga albilineata
Mammals
Northern Brown Bandicoot Isoodon macrourus
Northern Brushtail Possum Trichosurus vulpecula arnhemensis
Spectacled Hare-wallaby Lagorchestes conspicillatus
Northern Nailtail Wallaby Onychogalea unguifera
Arnhem Sheath-tailed Bat Taphozous kapalgensis
Western Chestnut Mouse Pseudomys nanus
Orange Leaf-nosed Bat Rhinonicteris aurantia

69
Appendix C - List of culturally significant species included in this assessment
Common name Scientific name
Plants
Allosyncarpia ternata
Northern Cypress Pine Callitris intratropica
Fish
Barramundi Lates calcarifer
Reptiles
Saltwater Crocodile Crocodylus porosus
Freshwater Crocodile Crocodylus johnsoni
Frillneck Lizard Chlamydosaurus kingii
Centralian Blue-tongued Lizard Tiliqua multifasciata
Common Blue-tongued Lizard Tiliqua scincoides
Arafura File Snake Acrochordus arafurae
Birds
Magpie Goose Anseranas semipalmata
Mammals
Echidna Tachyglossus aculeatus
Antilopine Wallaroo Macropus antilopinus
Black Wallaroo Macropus bernardus

70
Optimising management actions for the conservation of threatened species in Kakadu National Park
Appendix D - Experts contributing to assessments and the groups to which they contributed
(P=plants, I=invertebrates, F=fish, R=reptiles, B=birds, M=mammals).
Expert groups no. of species
Michael Braby I 1
Andrew Burbidge BM 25
Ian Cowie P 83
Ron Firth BM 13
Alaric Fisher IRBM 72
Anke Frank M 8
Stephen Garnett IFRB 77
Michael Hammer F 6
Brydie Hill FRBM 58
Chris Humphrey I 7
Michelle Ibbett IFRBM 80
Peter Kyne F 6
Sarah Legge BM 45
Damian Milne M 6
Ian Radford BM 22
Jeremy Russell-Smith P 46
Simon Ward RBM 66
Dion Wedd FRBM 45
Steve Winderlich PIFRBM 70
John Woinarski PIFRBM 190
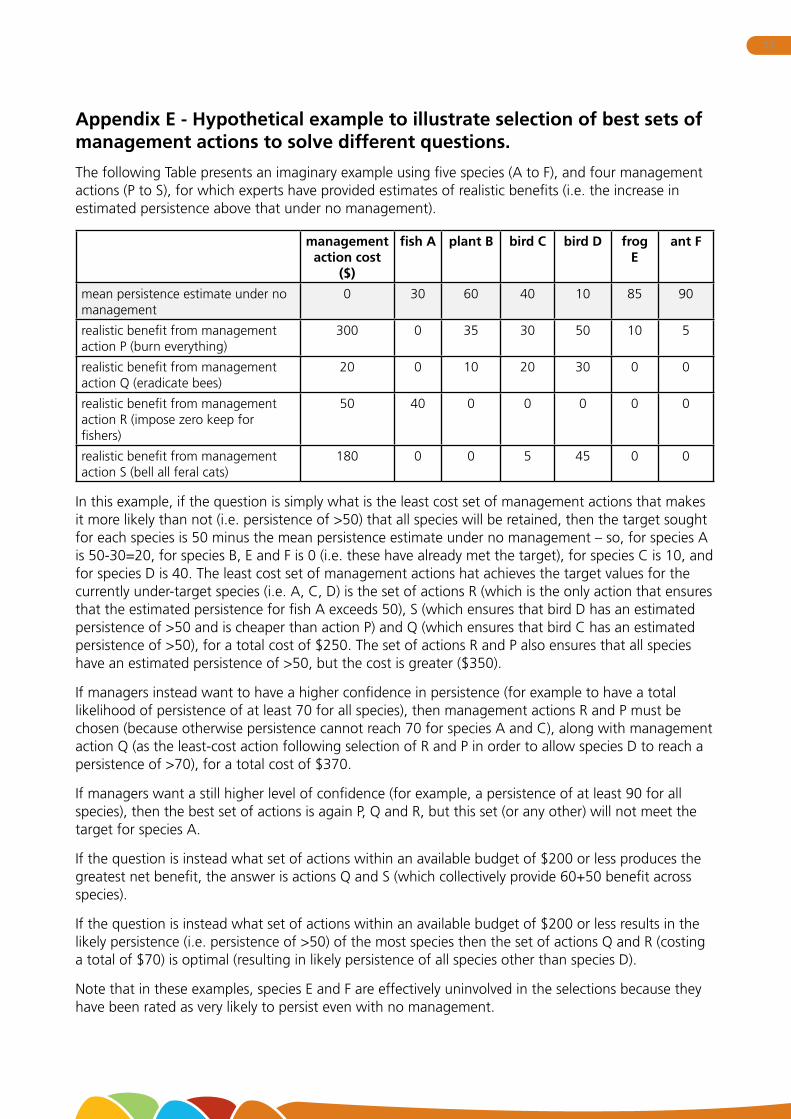
71
Appendix E - Hypothetical example to illustrate selection of best sets of management actions to solve different questions.
The following Table presents an imaginary example using five species (A to F), and four management actions (P to S), for which experts have provided estimates of realistic benefits (i.e. the increase in estimated persistence above that under no management).
management action cost
($)
fish A plant B bird C bird D frog E
ant F
mean persistence estimate under no management
0 30 60 40 10 85 90
realistic benefit from management action P (burn everything)
300 0 35 30 50 10 5
realistic benefit from management action Q (eradicate bees)
20 0 10 20 30 0 0
realistic benefit from management action R (impose zero keep for fishers)
50 40 0 0 0 0 0
realistic benefit from management action S (bell all feral cats)
180 0 0 5 45 0 0
In this example, if the question is simply what is the least cost set of management actions that makes it more likely than not (i.e. persistence of >50) that all species will be retained, then the target sought for each species is 50 minus the mean persistence estimate under no management – so, for species A is 50-30=20, for species B, E and F is 0 (i.e. these have already met the target), for species C is 10, and for species D is 40. The least cost set of management actions hat achieves the target values for the currently under-target species (i.e. A, C, D) is the set of actions R (which is the only action that ensures that the estimated persistence for fish A exceeds 50), S (which ensures that bird D has an estimated persistence of >50 and is cheaper than action P) and Q (which ensures that bird C has an estimated persistence of >50), for a total cost of $250. The set of actions R and P also ensures that all species have an estimated persistence of >50, but the cost is greater ($350).
If managers instead want to have a higher confidence in persistence (for example to have a total likelihood of persistence of at least 70 for all species), then management actions R and P must be chosen (because otherwise persistence cannot reach 70 for species A and C), along with management action Q (as the least-cost action following selection of R and P in order to allow species D to reach a persistence of >70), for a total cost of $370.
If managers want a still higher level of confidence (for example, a persistence of at least 90 for all species), then the best set of actions is again P, Q and R, but this set (or any other) will not meet the target for species A.
If the question is instead what set of actions within an available budget of $200 or less produces the greatest net benefit, the answer is actions Q and S (which collectively provide 60+50 benefit across species).
If the question is instead what set of actions within an available budget of $200 or less results in the likely persistence (i.e. persistence of >50) of the most species then the set of actions Q and R (costing a total of $70) is optimal (resulting in likely persistence of all species other than species D).
Note that in these examples, species E and F are effectively uninvolved in the selections because they have been rated as very likely to persist even with no management.

72
Optimising management actions for the conservation of threatened species in Kakadu National Park
In running Marxan, the following settings were used: 25 repeat runs per scenario, simulated annealing, with two-step iterative improvement, adaptive annealing (initial temperature -1, cooling factor 6), threshold enabled (i.e. cap on budget), with penalty factor A=14 and penalty factor B=1. Species were assigned a ‘species penalty factor’ equivalent to their summed value (taxonomic, ecological, cultural, threatened etc.) – hence, given choices, the algorithm will particularly seek to ensure that species with higher value will achieve their targets.
There is a notable difference between this exercise and that of a reserve selection algorithm: the benefit scores may not be strictly additive across different management actions – indeed it would be nonsensical if they sum to >100 (as is the case for species D if management actions P, Q, R and S were combined). This issue probably has no general solution – in reality, in some cases, the combined application of two disparate management actions may provide more benefit than the sum benefit of each action operating alone; whereas in other cases the combined application may result in substantially less benefit than the sum of each action operating alone. Here, we attempt to minimise the problem by excluding from some analyses management actions that are likely to overlap other management actions (e.g. cat control and cat fencing) to leave in consideration only a set of relatively independent candidate management actions.

