optimization of a microfluidic assay for the detection … · downbload optimization of a...
TRANSCRIPT

Downbload
Optimization of a microfluidic assay for the detection of
free prostate cancer specific antigen
Miguel Ângelo Freitas Ribeiro Gaspar Reis
Thesis to obtain the Master of Science Degree in
Biotechnology
Supervisor(s): Prof João Pedro Estrela Rodrigues Conde
Dr. Narayanan Srinivasan Madaboosi
Examination Committee
Chairperson: Prof. Luís Joaquim Pina da Fonseca
Supervisor: Prof. João Pedro Estrela Rodrigues Conde
Members of the Committee: Dr. Pedro Carlos de Barros Fernandes
November 2014

i
Abstract
The elevated number of false positives in prostate cancer (PCa) tests have demonstratedthe need to design a multiplex assay capable of crossing information from various PCabiomarkers in order to provide a more reliable diagnosis. A miniaturized microfluidicELISA was optimized in order to detect clinically relevant concentrations (1-4 ng mL−1)of free prostate specific antigen (f-PSA). A microfluidic device comprised of microchan-nels was microfabricated with polydimethyl siloxane (PDMS) through soft lithographyand sealed to a glass slide. The ELISA parameters such as molecules concentration,incubation time, flow rate and blocking methodology were optimized. The detection ofconcentrations in the ng mL−1 range were reached using fluorescence, chemiluminesceand colorimetry methods. Microscope imaging parameters for all three detection meth-ods were optimized. Colorimetry detection was also measured by amorphous silicon(a-Si:H) p-i-n photodiodes. Calibration curves based on the detection of f-PSA spikedsolutions was constructed. Detection limits were calculated for all the three detectionmethodologies.
Keywords
ELISA, Microfluidics, Prostate cancer, PSA, Biomarkers, Photodiodes
ii
Resumo
O elevado número de falsos positivos em testes de cancro da próstata (PCa) têm demon-strado a necessidade de criar um ensaio multiplex capaz de cruzar informação de váriosbiomarcadores do cancro da próstata, ao ponto de fornecer um diagnóstico mais fid-edígno. Um ELISA miniaturizado foi otimizado a fim de detectar concentrações clini-camente relevantes (1-4 ng mL−1) de free prostate specific antigen (f-PSA). Um dispos-itivo microfluidico composto de microcanais foi microfabricado com dimetil polisilox-ano (PDMS), por meio de litografia e selado a uma lâmina de vidro. Os parâmetrosdo ELISA, como a concentração de moléculas, o tempo de incubação, taxa de fluxoe metodologia de bloqueio foram optimizados. Foram detetadas concentrações na or-dem do ng mL−1 com os métodos de fluorescência, quimioluminescência e colorimetria.Parâmetros de imagem do microscópio para todos os três métodos de detecção foramotimizados. Deteção da colorimetria também foi efectuada em fotodíodos de silícioamorfo hidrogenado (a-Si: H) p-i-n. As curvas de calibração foram construidas combase na deteção de soluções com f-PSA. Os limites de detecção foram calculados paratodos as três metodologias de deteção.
Palavras-chave
ELISA, microfluídica, cancro da próstata, PSA, Biomarcadores, Fotodíodos
Acknowledgements
I would like to thank Professor João Pedro Conde for the opportunity to work in hisgroup at INESC-MN and the direction and guidance throughout the project. To my co-supervisor, Dr. Narayanan Srinivasan with whom I shared a project and a laboratoryand whom I thank for all the availability and guidance throughout my work. I alsothank Dr. Virginia Chu for the support. To Ruben Soares for all discussions andcompany throughout the the laboratory work. Engineers Virginia Soares, FernandoSilva and José Bernardo for training and assistance during the microfabrication processesin the cleanroom. To all my colleagues with whom I shared my daily life and endlessdiscussions. I would still like to thank Eunice Paisana for helping me with the correctionof the written work.
Finally I would like to thank my parents and my brother and my sister who alwaysbelieved in me and never stopped supporting me throughout my academic career.
Agradecimentos
Gostaria de agradecer ao Professor João Pedro Conde pela oportunidade de poder tra-balhar no seu grupo no INESC-MN e pela orientação e acompanhamento durante todoo projecto. Ao meu co-orientador, Dr. Narayanan Srinivasan com quem partilhei umprojecto e um laboratorio e a quem agradeço toda a disponibilidade e orientação du-rante todo o meu trabalho. Agradeço também á Dr. Virginia Chu o apoio demonstrado.Ao Ruben Soares por todas as discussões e apoio. Aos engenheiros Virgínia Soares,Fernando Silva e José Bernardo por a formação e ajuda durante os processos de micro-fabricação na sala limpa. A todos os meus colegas de trabalho com quem partilhei omeu dia a dia e infindáveis discussões. Gostaria ainda de agradecer á Eunice Paisanapela ajuda na correção do trabalho escrito.
Por último gostaria de agradecer aos meus pais e irmãos que sempre acreditaram emmim e nunca deixaram de me apoiar durante todo o meu percurso académico.
iii

Contents
Abstract i
Resumo ii
Acknowledgements iii
Agradecimentos iii
List of Figures vii
List of Tables x
Abbreviations xi
Motivation xiii
1 Introduction 11.1 Clinical Diagnosis . . . . . . . . . . . . . . . . . . . . . . . . . . . . . . . . 1
1.1.1 Point of Care (PoC) analysis . . . . . . . . . . . . . . . . . . . . . 11.1.2 Lab-on-chip (LoC) . . . . . . . . . . . . . . . . . . . . . . . . . . . 2
1.2 Prostate cancer (PCa) . . . . . . . . . . . . . . . . . . . . . . . . . . . . . 41.2.1 PCa biomarkers . . . . . . . . . . . . . . . . . . . . . . . . . . . . 41.2.2 Prostate Specific Antigen . . . . . . . . . . . . . . . . . . . . . . . 51.2.3 PSA antibodies . . . . . . . . . . . . . . . . . . . . . . . . . . . . . 6
1.3 ELISA . . . . . . . . . . . . . . . . . . . . . . . . . . . . . . . . . . . . . . 71.3.1 ELISA methodologies . . . . . . . . . . . . . . . . . . . . . . . . . 71.3.2 ELISA assays . . . . . . . . . . . . . . . . . . . . . . . . . . . . . . 81.3.3 Detection . . . . . . . . . . . . . . . . . . . . . . . . . . . . . . . . 91.3.4 Disadvantages . . . . . . . . . . . . . . . . . . . . . . . . . . . . . . 10
1.4 Microfluidics . . . . . . . . . . . . . . . . . . . . . . . . . . . . . . . . . . 111.4.1 Microfluidic advantages . . . . . . . . . . . . . . . . . . . . . . . . 111.4.2 Physical Principals . . . . . . . . . . . . . . . . . . . . . . . . . . . 121.4.3 Polydimethylsiloxane . . . . . . . . . . . . . . . . . . . . . . . . . . 131.4.4 Control of surface chemistry . . . . . . . . . . . . . . . . . . . . . . 14
1.5 Detection Limits . . . . . . . . . . . . . . . . . . . . . . . . . . . . . . . . 14
iv

Contents v
2 Materials & Methods 172.1 Materials . . . . . . . . . . . . . . . . . . . . . . . . . . . . . . . . . . . . 17
2.1.1 Microfabrication . . . . . . . . . . . . . . . . . . . . . . . . . . . . 172.1.2 Microfluidics . . . . . . . . . . . . . . . . . . . . . . . . . . . . . . 182.1.3 Immunotechnology . . . . . . . . . . . . . . . . . . . . . . . . . . . 18
2.1.3.1 Antibodies & antigens . . . . . . . . . . . . . . . . . . . . 182.1.3.2 Chemicals & other molecules . . . . . . . . . . . . . . . . 18
2.1.4 Detection . . . . . . . . . . . . . . . . . . . . . . . . . . . . . . . . 192.1.5 Instruments & equipment . . . . . . . . . . . . . . . . . . . . . . . 192.1.6 Software . . . . . . . . . . . . . . . . . . . . . . . . . . . . . . . . . 19
2.2 Methods . . . . . . . . . . . . . . . . . . . . . . . . . . . . . . . . . . . . . 192.2.1 Microfabrication . . . . . . . . . . . . . . . . . . . . . . . . . . . . 202.2.2 Microfluidics . . . . . . . . . . . . . . . . . . . . . . . . . . . . . . 242.2.3 Immunotechnology . . . . . . . . . . . . . . . . . . . . . . . . . . . 262.2.4 Detection . . . . . . . . . . . . . . . . . . . . . . . . . . . . . . . . 272.2.5 Image Acquisition Analysis . . . . . . . . . . . . . . . . . . . . . . 28
3 Results 313.1 Surface adsorption . . . . . . . . . . . . . . . . . . . . . . . . . . . . . . . 32
3.1.1 Glass vs PDMS . . . . . . . . . . . . . . . . . . . . . . . . . . . . . 323.1.2 Capture Antibody Concentration . . . . . . . . . . . . . . . . . . . 333.1.3 Incubation time and flow rate . . . . . . . . . . . . . . . . . . . . . 34
3.2 Blocking Methodology . . . . . . . . . . . . . . . . . . . . . . . . . . . . . 353.2.1 Blocking molecule of choice . . . . . . . . . . . . . . . . . . . . . . 353.2.2 Blocking parameters . . . . . . . . . . . . . . . . . . . . . . . . . . 38
3.3 Washing conditions and PSA antibodies’ controls . . . . . . . . . . . . . . 403.3.1 Washing conditions . . . . . . . . . . . . . . . . . . . . . . . . . . . 403.3.2 PSA antibodies’ controls . . . . . . . . . . . . . . . . . . . . . . . . 41
3.4 Microscopy fluorescence data acquisition . . . . . . . . . . . . . . . . . . . 413.5 Colorimetry detection optimization . . . . . . . . . . . . . . . . . . . . . . 433.6 Spotting Assays . . . . . . . . . . . . . . . . . . . . . . . . . . . . . . . . . 43
3.6.1 Spotting Concentration Curves . . . . . . . . . . . . . . . . . . . . 443.6.2 Antibody surface density . . . . . . . . . . . . . . . . . . . . . . . 453.6.3 Fluorescence signal per molecule . . . . . . . . . . . . . . . . . . . 46
3.7 Detection calibration curves . . . . . . . . . . . . . . . . . . . . . . . . . . 473.7.1 Fluorescence curve . . . . . . . . . . . . . . . . . . . . . . . . . . . 483.7.2 Chemiluminescence curve . . . . . . . . . . . . . . . . . . . . . . . 493.7.3 Colorimetry curve . . . . . . . . . . . . . . . . . . . . . . . . . . . 493.7.4 Limits of detection . . . . . . . . . . . . . . . . . . . . . . . . . . . 50
3.8 Integration with photodiodes . . . . . . . . . . . . . . . . . . . . . . . . . 52
4 Discussion and Conclusions 544.1 Discussion . . . . . . . . . . . . . . . . . . . . . . . . . . . . . . . . . . . . 54
4.1.1 Optimization steps . . . . . . . . . . . . . . . . . . . . . . . . . . . 544.1.2 Spotting experiments . . . . . . . . . . . . . . . . . . . . . . . . . 584.1.3 Detection Calibration Curves . . . . . . . . . . . . . . . . . . . . . 58

Contents vi
4.2 Conclusions . . . . . . . . . . . . . . . . . . . . . . . . . . . . . . . . . . . 60
Bibliography 63

List of Figures
1.1 (A) Microelectrode array device (adapted from F); (B) Digital microflu-idic device (Adapted from G); (C) microfluidic platform (adapted from[1, 2]) . . . . . . . . . . . . . . . . . . . . . . . . . . . . . . . . . . . . . . 2
1.2 (a) Direct ELISA, with antigen coated on surface (purple) and enzyme-coupled (yellow) antibody (orange) bound on top; (b) Indirect ELISA,with antigen coated on surface (purple), specific non-conjugated antibody(orange) bound to the antigen and enzyme-coupled (yellow) antibody(red) bound to the specific antibody. . . . . . . . . . . . . . . . . . . . . 8
1.3 Microscopy photograph taken of a microfluidic channel patterned witha HRP labelled antibody. The photo was taken while running luminolthough the channel at a 5 µl min−1 flow rate. . . . . . . . . . . . . . . . . 10
2.1 Schematic representation of the Aluminium mask microfabrication steps. . 212.2 Oxidation effect over the chemistry of PDMS surface. . . . . . . . . . . . 232.3 Representation of the assembled PDMS & glass device with adaptors
inside the inlet and outlet holes. . . . . . . . . . . . . . . . . . . . . . . . 232.4 Schematic representation of the PMMA mold for PDMS fabrication. . . . 242.5 Photo of the fabricated device to hold unsealed PDMS and glass together. 252.6 Photograph of the assembled PDMS & glass device with adaptors inside
the inlet and outlet holes over a black PMMA plate. . . . . . . . . . . . . 252.7 Schematic representation of the sandwich ELISA set up using f-PSA,
f-PSA specific antibodies and BSA for blocking step. This set up is as-sembles inside the microfluidic channel onto a glass surface. . . . . . . . . 26
2.8 Representation of the sections measured during image analysis. . . . . . . 29
3.1 Fluorescence intensity results measured in the fluorescence microscopy forincubated IgG-FITC both on devices with glass and PDMS as substrate. . 32
3.2 Fluorescence curve for FITC labelled monoclonal mouse IgG (blue) andfor unlabelled mouse monoclonal IgG + BSA-FITC (red). . . . . . . . . . 33
3.3 Fluorescence signal for the incubation of 100 µg mL−1 of IgG-FITC in 4experiments varying the antibody solution incubation time. . . . . . . . . 34
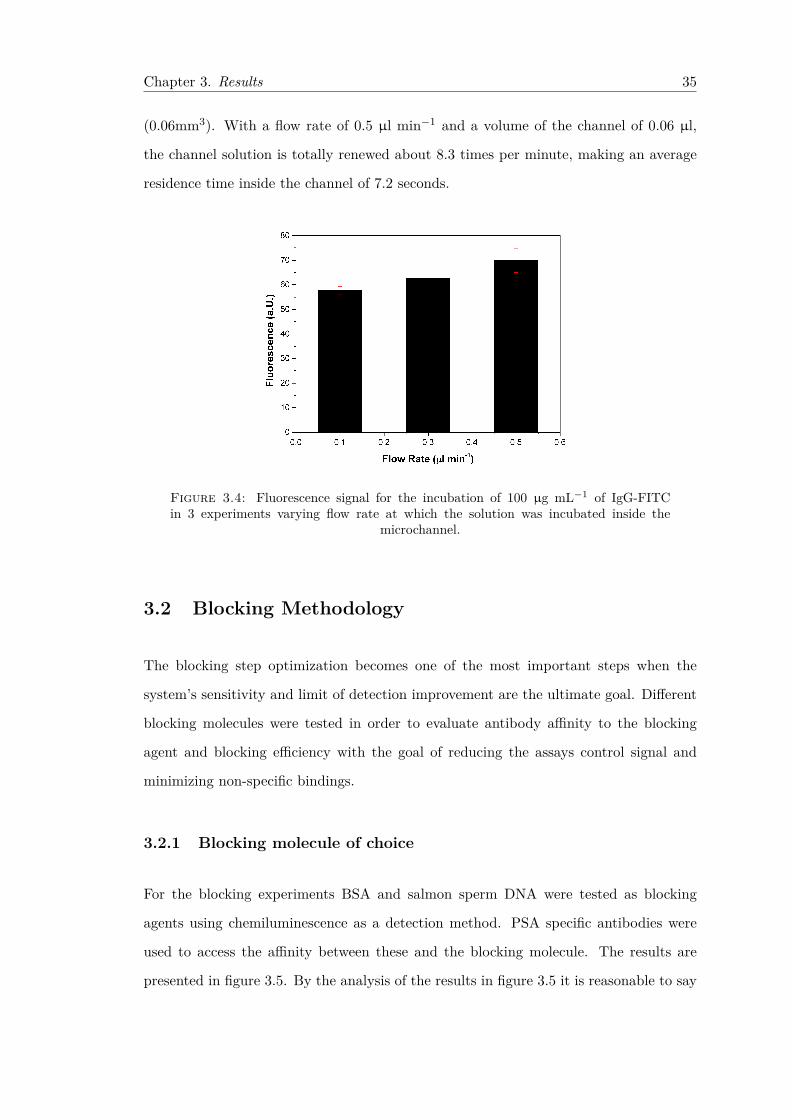
3.4 Fluorescence signal for the incubation of 100 µg mL−1 of IgG-FITC in 3experiments varying flow rate at which the solution was incubated insidethe microchannel. . . . . . . . . . . . . . . . . . . . . . . . . . . . . . . . . 35
3.5 Chemiluminescence signal for 4 different conditions in a sandwich assaywith PSA specific antibodies. (note: SSDNA stands for salmon spermDNA) . . . . . . . . . . . . . . . . . . . . . . . . . . . . . . . . . . . . . . 36
3.6 Set of controls experiments for the sandwich chemiluminescence assay. . . 37
vii
List of Figures viii
3.7 Testing different BSA incubation conditions and casein blocking efficiency.A mixed solution with 50 % BSA at 4% and 50 % Casein at 200 µg mL−1
was also tested as blocking solution. . . . . . . . . . . . . . . . . . . . . . 383.8 BSA incubation time experiment. Constant concentration of BSA (4 %)
was incubated for 3 different time periods and IgG-FITC flown afterwardsfor detection. . . . . . . . . . . . . . . . . . . . . . . . . . . . . . . . . . . 39
3.9 Testing different BSA incubation conditions with goat-IgG - blocking -αgoat - IgG-FITC assay. . . . . . . . . . . . . . . . . . . . . . . . . . . . 39
3.10 Washing conditions tested on the final washing after capture-blocking-detector incubation. . . . . . . . . . . . . . . . . . . . . . . . . . . . . . . 40
3.11 Control experiments for the PSA antibodies. . . . . . . . . . . . . . . . . 413.12 Comparison between a control (A) and an overexposed (B) image of a
microchannel incubated with FITC labelled antibodies. . . . . . . . . . . 423.13 Microscopy fluorescence data acquisition. The data for the three curves
was acquired at fixed gamma (0.6). Within each curve gain was constant(1, 2 and 3) and exposure was varied from 0.1 to 3 seconds. . . . . . . . 42
3.14 Measurements of TMB product along the microchannel. Inlet side- 2mmaway from inlet; middle - 5mm away from inlet; outlet side 2 mm awayfrom the outlet. . . . . . . . . . . . . . . . . . . . . . . . . . . . . . . . . 43
3.15 Fluorescence curves for the 3 spotting experiments. Antibody-FITC con-centration used versus Fluorescence signal. . . . . . . . . . . . . . . . . . . 45
3.16 Graphic presents the antibody surface density for each spot measuredversus the antibody concentration used. The inset graph shows the areameasured in each spot. The red like is the monolayer theoretical threshold. 45
3.17 Spot experiment images. A - Spot from the third experiment (antibodydiluted in PBS 5 % glycerol). B - Spot from the second experiment(antibody diluted in PBS). . . . . . . . . . . . . . . . . . . . . . . . . . . 46
3.18 Antibody-FITC surface density vs fluorescence signal per molecule. A -Spots from the first (black) and second (red) experiment. B - Spot fromthe third experiment. . . . . . . . . . . . . . . . . . . . . . . . . . . . . . . 47
3.19 Fluorescence calibration curve using a full sandwich fPSA assay with flu-orescence detection method. A linear fit curve was calculated for lowconcentrations (≤ 50 ng mL−1). The dotted line is just an eye guideline. . 48
3.20 Chemiluminescence calibration curve using a full sandwich fPSA assaywith HRP labelled detector antibody and luminol as detection substrate.A linear fit curve was calculated for low concentrations (≤ 50 ng mL−1).The dotted line is just an eye guideline. . . . . . . . . . . . . . . . . . . . 49
3.21 Colorimetry calibration curve using a full sandwich fPSA assay with HRPlabelled detector antibody and TMB as detection substrate. Signal detec-tion was measured through a microscope. A linear fit curve was calculatedfor low concentrations (≤ 50 ng mL−1). The dotted line is just an eyeguideline. . . . . . . . . . . . . . . . . . . . . . . . . . . . . . . . . . . . . 50
3.22 Colorimetry calibration curve using a full sandwich fPSA assay with HRPlabelled detector antibody and TMB as detection substrate. Signal detec-tion was measured through PD’s connected to a picoammeter. A linear fitcurve was calculated for low concentrations (≤ 50 ng mL−1). The dottedline is just an eye guideline. . . . . . . . . . . . . . . . . . . . . . . . . . . 51

List of Figures ix
3.23 Assembly of PCB with wirebonded photodiodes with a microchannelaligned on top of the PD’s. A - Microfluidic device on top of the PD’s; B- PD’s microscopy photograph; C - Microchannel with TMB precipitatemicroscopy photograph. . . . . . . . . . . . . . . . . . . . . . . . . . . . . 52

List of Tables
2.1 List of materials used for the fabrication of the devices involved in theproject. . . . . . . . . . . . . . . . . . . . . . . . . . . . . . . . . . . . . . 17
2.2 List of materials used during the performance of the experiments. . . . . . 182.3 List of Antibodies & antigens used and their specifics. . . . . . . . . . . . 182.4 List of chemicals and other molecules used in the experiments. . . . . . . 192.5 List of substrates for the enzymatic assays. . . . . . . . . . . . . . . . . . 192.6 List of all the equipments used for the fabrication of devices, performance
of the experiments and data acquisition. . . . . . . . . . . . . . . . . . . . 202.7 List of software used for handling equipment, data acquisition and data
analysis. . . . . . . . . . . . . . . . . . . . . . . . . . . . . . . . . . . . . . 212.8 Parameters used for the imaging of each detection methodology. . . . . . 28
3.1 Calculated values for LoB, LoD and LoQ for the three detection methods.Colorimetry assay was measured both in microscope (M) and photodiodes(PD). . . . . . . . . . . . . . . . . . . . . . . . . . . . . . . . . . . . . . . 51
x

Abbreviations
a-Si:H Hydrogenated amorphous Silicon
BPH Bening Prostatic Hyperplasia
BSA Bovine Serum Albumin
CaSR Calcium Sensing Receptor
EPCA Early Prostate Cancer Antigen
ELISA Enzyme Linked ImmunoSorbant Assay
FITC Fluorescein IsoThioCyanate
fPSA free Prostate Specific Antigen
emt-PSA equimolar total Prostate Specific Antigen
GPI GlycosylPhosphatidylInositol
HRP Horseradish Peroxidase
LoC Lab on Chip
LoB Limit of Blank
LoD Limit of Detection
LoQ Limit of Quatitation
MEMS MicroElectroMechanical Systems
PD PhotoDiode
PoC Point of Care
PDMS PolyDiMethylSiloxane
PMMA Poly Methyl MethAcrylate
PAP Prostate Acid Phosphatase
PCa Prostate Cancer
PSA Prostate Specific Antigen
xi

Abbreviations xii
PSA-ACT Prostate Specific Antigen - AntiChymoTrypsin
PSMA Prostate Specific Membrane Antigen
PSCA Prostate Stem Cell Antigen
SSDNA Salmon Sperm DeoxyriboNucleic Acid
SAM Self Assembly Monolayer
SD Standard Deviation
TMB 3,3’,5,5’- Tetramethylbenzidine

Motivation xiii
Motivation
Microfluidics is a multidisciplinary field which has gained perceivable notability in the
recent years due to the advantages it provides over standard methodologies for the
execution of laboratorial tasks in a microscale.
Prostate cancer is the second most prevalent form of cancer globally. On top of this,
the screening test is controversial due to the high number of false positives. There is a
need for the development of a multiplex test involving several PCa biomarkers in order
to validate the screenings results, reducing the false positives ratio and improving early
detection of this cancer form.
With this in mind, this work attempted at an optimization of an assay for the detection
of prostate cancer biomarkers in a microfluidic device, trying to simplify and reduce
costs on the top bench task involved by miniaturizing the process.
The present work is divided into four chapters. In the introduction, a theoretical ap-
proaches is presented along with the state-of-the art. Materials and methods present
all the methodologies and materials used during the experimental procedures. The re-
sults obtained from the experimental work are presented and analyzed. Discussion of the
results is in the last chapter along with the conclusions of the work and future prospects.

xiv

Chapter 1
Introduction
1.1 Clinical Diagnosis
1.1.1 Point of Care (PoC) analysis
Point of care analysis is presented now-a-days as the most valuable method for patient
testing due to the advantages it conveys over the standard laboratory testing. PoC
testing has already gained a considerable percentage of the in vitro diagnostics market
however this is due to the large diabetes monitoring chains in it. Outside the diabetes
market, the use of PoC devices for diagnostic purposes is a bit more controversial par-
tially due to sensitivity and reliability issues [3, 4].
The main concept behind PoC is to have the patient tested on the spot returning the
results instantly which allows for immediate course of action to be taken by the diagnostic
entity. This brings up many doubts about the quality and reliability of the results
presented by such test due to user handling variations [3, 5]. Alongside with the difficulty
of integration of all laboratory procedures into a single device, PoC devices development
still presents many other challenges. Fluid handling tasks such as fluid delivery, mixing,
and separation of analyte from the sample mix are simple tasks to handle in a laboratory
which need to be integrated into such device. The aim is to develop a fully integrated and
1

Chapter 1. Introduction 2
automated miniaturized system able to perform samples analysis with high sensitivity
and accuracy on a single portable platform [6, 7].
In the last few years microfluidic platforms have demonstrated to be efficient in integrat-
ing different modules for sample processing, leading towards a fully automated analysis
system. Microfluidics also show other useful characteristics for developing PoC devices
such as reduced production costs and high sensitivity as well as accuracy [3, 6]. Dig-
ital microfluidics, multiphase flow systems and multielectrode arrays are a few other
platforms that may provide the tools needed for PoC diagnostics [6, 8].
Digital Microfluidics (DMF), for instance, is an interesting technology since it eliminates
the need for external pneumatic controls and valves in order to control reagent and sam-
ple flows. DMF concept is to manipulate sample volumes the size of a droplet. These
droplets are driven over a micropatterned plate which uses an electrowetting mechanism
based on the surface energy changes due to applied potential. This allows for differ-
ent steps to be programmed and executed orderly, making the manipulation sequence
similar to the bench-top procedure using micro litre volumes, higher automation and
considerably less time [9, 10].
Figure 1.1: (A) Microelectrode array device (adapted from F); (B) Digital microfluidicdevice (Adapted from G); (C) microfluidic platform (adapted from [1, 2])
1.1.2 Lab-on-chip (LoC)
In light of all these new technology, comes forward a new concept named Lab-on-chip.
In this concept is embedded the idea of developing a miniaturized laboratory on a
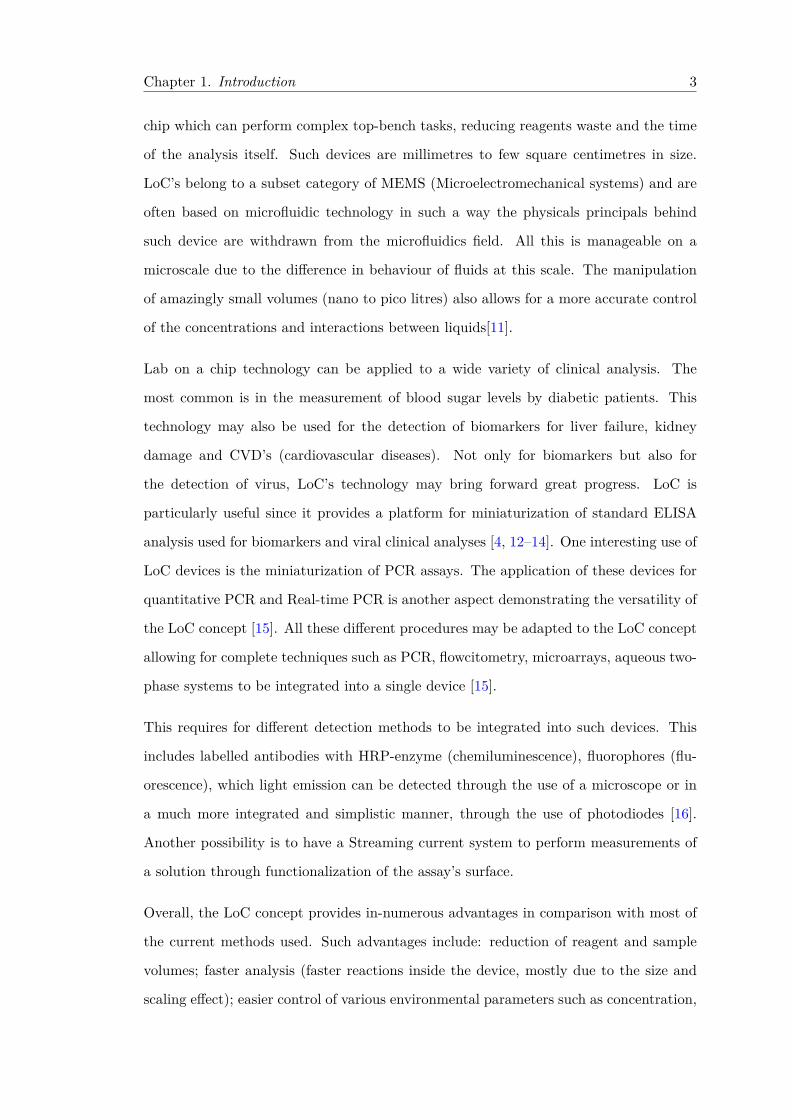
Chapter 1. Introduction 3
chip which can perform complex top-bench tasks, reducing reagents waste and the time
of the analysis itself. Such devices are millimetres to few square centimetres in size.
LoC’s belong to a subset category of MEMS (Microelectromechanical systems) and are
often based on microfluidic technology in such a way the physicals principals behind
such device are withdrawn from the microfluidics field. All this is manageable on a
microscale due to the difference in behaviour of fluids at this scale. The manipulation
of amazingly small volumes (nano to pico litres) also allows for a more accurate control
of the concentrations and interactions between liquids[11].
Lab on a chip technology can be applied to a wide variety of clinical analysis. The
most common is in the measurement of blood sugar levels by diabetic patients. This
technology may also be used for the detection of biomarkers for liver failure, kidney
damage and CVD’s (cardiovascular diseases). Not only for biomarkers but also for
the detection of virus, LoC’s technology may bring forward great progress. LoC is
particularly useful since it provides a platform for miniaturization of standard ELISA
analysis used for biomarkers and viral clinical analyses [4, 12–14]. One interesting use of
LoC devices is the miniaturization of PCR assays. The application of these devices for
quantitative PCR and Real-time PCR is another aspect demonstrating the versatility of
the LoC concept [15]. All these different procedures may be adapted to the LoC concept
allowing for complete techniques such as PCR, flowcitometry, microarrays, aqueous two-
phase systems to be integrated into a single device [15].
This requires for different detection methods to be integrated into such devices. This
includes labelled antibodies with HRP-enzyme (chemiluminescence), fluorophores (flu-
orescence), which light emission can be detected through the use of a microscope or in
a much more integrated and simplistic manner, through the use of photodiodes [16].
Another possibility is to have a Streaming current system to perform measurements of
a solution through functionalization of the assay’s surface.
Overall, the LoC concept provides in-numerous advantages in comparison with most of
the current methods used. Such advantages include: reduction of reagent and sample
volumes; faster analysis (faster reactions inside the device, mostly due to the size and
scaling effect); easier control of various environmental parameters such as concentration,

Chapter 1. Introduction 4
temperature and chemical reactions time; portability; automation; higher throughputs;
lower fabrication costs.
However some disadvantages also arise, these being: the experimental conditions may
not always scale down in a positive manner leading to further complications; signal-
to-noise ratios; lack of accuracy in microfabrication in comparison with bigger scale
engineering [17, 18].
1.2 Prostate cancer (PCa)
Prostate cancer is now-a-days one of the leading causes of cancer related deaths in
men, particularly in the western countries, being the most prevalent form of sickness in
Europe. WHO statistics register about 200 000 new cases of prostate cancer every year.
The prostate tumour grows penetrating peripheral tissues (perineural invasion) such as
lymphatic channels and nodes. The lymphatic nodes are the most likely tissue to host
the first metastases. [19, 20] After the metastases spread into the blood stream, one of
the first targets are the bone structure, forming osteocleorotic metastases [21].
1.2.1 PCa biomarkers
A significant variety of biomarkers are known for PCa, although each one with different
characteristics and different reliabilities, presenting different pieces of information about
PCa. From proteins to mRNA and also metabolites concentrations such as calcium may
be measured for obtaining information on tumour development.
Prostate stem cell antigen (PSCA), for instance, is a GPI-anchored cell surface
protein found in blood that depicts with a reasonable degree of accuracy the progression
of PCa (PSCA-1). High expression of this protein is observed in about 90% of prostate
cancer patients. As for PSCA-2 it is known to have a Jekyll and Hyde molecule behavior
and is known to be presented in high values in cases of bladder and pancreatic cancer
[22–24].

Chapter 1. Introduction 5
Prostate specific membrane antigen (PSMA) is another PCa biomarker found in
tissue, serum and cells. PSMA is a zinc metalloenzyme residing in membranes facing the
extracellular space. It is thought to be one of the most upregulated proteins in prostate
tissue, going up has far as 12-fold when compared to noncancerous patients. However
it has been reported increased expression also in other tissues such as the brain, liver
and kidneys, therefore requiring calibration strategies when taking into account PSMA
concentration in a clinical analysis [25].
Prostatic acid phosphatase (PAP) is another serum enzyme which upregulation car-
ries indication of prostate cancer although it is not a very reliable analysis. A variation
in Calcium concentration is also known to be an indicator of a disturbance in the home-
ostasis. A direct correlation between the increase in calcium concentration and the
development of a prostate tumor may be established. These changes in the concentra-
tion are due to the change in the expression of a calcium sensing receptor (CaSR) which
affects the calcium intake [26].
Many other biomarkers possess relevance in the diagnosis and prognosis of PCa. Some
of these are EPCA (Early prostate cancer antigen), GOLPH2 (Golgi phosphoprotein 2)
and even sarcosine [27]. Nevertheless, a consensus on values for diagnostic purposes does
not exist yet among the scientific community on these biomarkers. There is one though
which has awakened some interested in the last few years. This is prostate-specific
antigen.
1.2.2 Prostate Specific Antigen
One of the most prominent PCa biomarkers is PSA (Prostate-specific antigen), used
particularly for early diagnosis and also for monitoring the progression of the tumour,
also known as kallikrein-3 (KLK3) is a glycoprotein enzyme from the kallikrein-related
peptidase family, secreted by the epithelial cells of the prostate gland. PSA may allow
the detection of PCa as much as 5 years before symptoms start. Although this molecule
is intended to dissolve cervical mucus facilitating the sperm entrance in the uterus,
small quantities of it roam in the circulatory serum. Since this protein has a proteolitic

Chapter 1. Introduction 6
function, the biggest percentage in the serum is a complexed form of PSA bound to
another protein, most commonly α1-antichymotrypsin (PSA-ACT) or α2-macroglobulin
(PSA-A2M). This is because of the proteolitic activity of this protein requires a silencing
protein to be coupled to PSA in order to inhibit its activity.
Nevertheless, a non complexed form of PSA exists in the blood current in a small
percentage being designated free PSA (fPSA). The ratio between the two different forms
helps distinguishing between a possible PCa or BPH (Benign Prostatic Hyperplasia)
diagnosis. Also the ratio may change in a significant way just so that information
concerning the evolution of a tumour may be extrapolated. In healthy men PSA is
present in very small amounts in the serum whereas in the case of prostate disorders the
values are more elevates.
Keeping in mind that every man has different basal PSA values, some calibration of
these values is required in order for a relevant reading of values. This is where the ratio
between the fPSA and PSA-ACT comes in. The total amount of PSA in the serum
(both fPSA and PSA-ACT) is designated by tPSA (total PSA) [19, 20, 28].
Thinking in a multiplex approache for the analysis of various molecules in the same
assay, another prostate molecule comes into play. Kallikrein-2 is also a prostate specific
serine protease similar to PSA. The similarities go as far as having similar epitopes which
generate cross-reactivity with PSA antibodies. This molecule has shown to be highly
expressed in poorly differentiated cancer cells. Also it has shown to be related to PSA
activity since it is involved in the process of converting the percursor form of PSA to
active PSA. This can become a relevant molecule for the differentiation between PCa
and BPH [29].
1.2.3 PSA antibodies
The use of PSA antibodies in ELISA testing is the standard in clinical laboratories tests,
therefore it becomes important to define the quality and relevance of the antibodies
chosen. For fPSA and PSA-ACT, anti-fPSA and anti-PSA-ACT antibodies respectively
are used for measuring these molecules concentrations. In terms of measuring the overall

Chapter 1. Introduction 7
amount of both forms of PSA a standard anti-tPSA antibody has proven to be inefficient
by presenting different affinities for the two different PSA forms. It would happen that
anti-tPSA antibody would have more affinity to the complexed form since it is present is
a higher concentration. This led to the development of equimolar total PSA (emt-PSA).
This antibody maintains the same affinity for fPSA and PSA-ACT independently of the
concentration of each one avoiding an over or underestimation. This way PSA ratio can
now be measured more efficiently [30]. Using the emt-PSA antibody we have a capture
system for two different molecules (the fPSA and PSA-ACT) which affinities are not
affected by the targets’ concentration therefore allowing for a correct measurement of
both in a single assay.
1.3 ELISA
The enzyme-linked immunosorbent assay (ELISA) is a technique which makes use of
antibodies to detect the presence of target molecules in different types of samples. This
technique uses the principals of immunology to capture the molecules of interest. Signal
detection in ELISA is usually done through some form of quantification of light emission
from the reaction mixture. Even though the assay has been adapted several times to be-
come more reliable and profitable the general methodology has remained unaltered since
its implementation in the early seventies. ELISA is nowadays the standard diagnostic
tool in terms of metabolite quantification in liquid samples. This also makes ELISA a
good quality-control check for further tools developed by the medical research industry.
1.3.1 ELISA methodologies
Two different strategies are used when planning an ELISA test. An ELISA signal comes
from a source of light coupled to the detector antibody. This detector antibody may
be a primary antibody or secondary antibody depending on the chains of events of the
ELISA strategy. In a direct ELISA the detector antibody (the antibody coupled with
a light emitting enzyme) is linked directly to the antigen (target molecule).This usually

Chapter 1. Introduction 8
only allows for one antibody to link to the antigen which may translate into a weak
signal depending on the concentration of the antigen.
There is however another strategy called indirect ELISA in which the enzyme-coupled
antibody is not specific for the antigen of interest. These antibodies are called secondary
antibodies and their specificity is to mouse antibodies. In this strategy the primary
antibody (specific to the antigen) is not coupled to any enzyme and simply binds to
the antigen. After this first incubation, step the secondary antibody is added to the
mixture and binds to the primary antibody. This allows for the binding of more than
one secondary antibody to the primary antibody, therefore increasing the signal. The
indirect assay carries some advantages over the direct approach, these being the larger
number of binding sites for the coupled antibody (which amplifies the signal), and the
availability of an enzyme-coupled antibody for assays with different antigens, since the
secondary antibody binds to whichever mouse cloned antibody that may be used.
Figure 1.2: (a) Direct ELISA, with antigen coated on surface (purple) and enzyme-coupled (yellow) antibody (orange) bound on top; (b) Indirect ELISA, with antigencoated on surface (purple), specific non-conjugated antibody (orange) bound to theantigen and enzyme-coupled (yellow) antibody (red) bound to the specific antibody.
1.3.2 ELISA assays
Sandwich ELISA is one the most common ways to use ELISA. In this methodology, a
surface is coated with a capture antibody for the antigen of interest. Then, the remaining
free surface is block usually with bovine serum albumin (BSA) or salmon sperm DNA
(SSDNA) and only after this step, the testing sample is run on this functionalized
surface. Finally, the detection antibody (an enzyme-coupled antibody specific for a
different epitope of the antibody) is added, binding to the antigen already trapped in
the primary antibody. A washing step is always required after each incubation step.

Chapter 1. Introduction 9
The signal measured in the detection step is directly proportional to the concentration
of the antigen in the tested sample.
A different way to do an ELISA is by performing a competitive assay. The strategy for
measuring concentration is different in both. Unlike the sandwich assays, in a competi-
tive assay, the signal read in the detection step is inversely proportional to the concen-
tration of the antigen. In this assay the surface is coated with a solution of the antigen
followed by a blocking step. After this, a previous mixture of a known concentration of
enzyme-coupled antibody and the testing sampled is ran in the surface functionalized
with the antigen, and the remaining free antibody in the mixed solution will bind to this
surface bound antigen, whilst the antibodies which bound to the free antigen will be
washed away. Therefore the bigger the antigen concentration in the sample, the fewer
antibody molecules will be left free to bind to the surface bound antigen, depicting an
inverse correlation.
1.3.3 Detection
For ELISA, light emitting enzymes used are coupled to antibodies in order to detect
this light for quantification. This includes fluorescence, chemiluminescence and colori-
metric assays, which require the use of appropriate enzyme labels and the corresponding
substrate for the detection system. Horseradish peroxidase (HRP) is one of the most
commonly used enzyme and uses luminol as substrate for the production of a light emit-
ting product (figure 3). Other substrates may be used with HRP, such as TMB (3, 3’, 5,
5’-tetramethylbenzidine) and also other enzymes such as alkaline phosphatase (AP) can
be used as a detection system instead of HRP. Recently the use of quantum dots (QD’s)
conjugated antibodies, instead of enzyme-coupled antibodies in a standard ELISA pro-
tocol. However this variation in the detection system is just a different method applied
over a systematic protocol, ending up in similar results. Quantum dots are nanocrystals
capable of emitting light in different wavelength depending on its size. These are new
approaches to the detection systems integrated in ELISA. [31, 32]

Chapter 1. Introduction 10
Figure 1.3: Microscopy photograph taken of a microfluidic channel patterned with aHRP labelled antibody. The photo was taken while running luminol though the channel
at a 5 µl min−1 flow rate.
1.3.4 Disadvantages
Every detection system has its own strengths and weaknesses. HRP for instance is
less expensive than AP, although it is also incompatible with sodium azide, a com-
mon preservative present in antibodies commercial buffer, used to prevent microbial
contamination. Furthermore the presence of metals in solution is also known to affect
peroxidases activity. AP has its own issues as well. Much like HRP, alkaline phosphatase
is also inactivated by some conditions and metabolites. Chelating agents, acidic pH and
inorganic phosphates are some of the factors which affect AP functioning [31].
As it is clear, drawbacks are present in different steps of any ELISA protocol and these
drawbacks have been the driving force for the optimization of this technique, coming up
with new approaches to overcome these disadvantages. One of the most concerning dis-
advantages of the ELISA is the amount of wasted reagent per run, and the considerable
amount of time necessary in comparison with some more recent methods. More recently,
new approaches have emerged, to define a whole concept of the ELISA, and optimize
this technique in order to make it more gainful. Microfluidics is the new approach which
is redefining the ELISA assay making it more inexpensive and less time consuming.
Chapter 1. Introduction 11
1.4 Microfluidics
Microfluidics is a multidisciplinary field of engineering science which integrates biol-
ogy, nanotechnology, chemistry and biotechnology into one field to develop a working
miniaturized platform. Microfluidics brings forward the concept of miniaturization and
integration, optimized in a way to make the best of scale reduction advantages. Im-
provement in the behaviour, control precision and manipulation of small volumes are
perks of this approach making a bold statement in the sample analysis industry. Some of
these advantages go hand-in-hand with the methodologies defined for LoC devices and
it is therefore the base for the development of such devices. Other advantages of this
system are small sample and reagent consumption, reduced size of the overall apparatus,
low energy consumption and the difference in the physical behaviour of solution at a
sub-millimetre scale.
1.4.1 Microfluidic advantages
The fact that a microfluidic device handles samples in miniaturized scale brings forth
differences in the behaviour of fluids, but also specific advantages which the microscale
superimposes on the macroscale devices, besides the benefits already mentioned in the
LoC section. High throughput screening is one of the benefits of using Microfluidics
platforms to perform chemical or biological reactions. This is because Microfluidics
provides the integration of all sample manipulation steps into one small area of device,
allowing for the parallel duplication of the same steps, delivering a greater number
of results in less time and with less reagents consumption. The easy manipulation of
the device design and Microfabrication steps are also great advantages. The need to
experiment with different designs in science research may sometimes delay the progress
of said research.
Microfluidics devices are mostly fabricated through the use of molds, which carry the de-
sign of the device and stamp this design onto polymers as polydimethylsiloxane (PDMS).

Chapter 1. Introduction 12
This way, the manipulation of the design of new microfluidic devices is almost solely de-
pendent on the time consumed on the fabrication of a new mold because this same mold
maybe be used several times to stamp silicon based polymers.
Another improvement provided by microfluidics is the possibility to perform an assay
using only passive diffusion, removing the need for automated systems which require a
power source. This makes the fabrication process even more practical and less expensive.
The fact that you have no actuation in a device makes it more reliable in the long term
since the mechanical wear and tear are of less concern. Again, since there is no movement
of physical components, it becomes easier to have reproducible results, making it again
a more reliable way to perform a given task. All of these advantages aligned with
the simplicity of a device with no moving parts make the mass production extremely
inexpensive when compared to more complex devices.
A number of different actuation components have already been implemented into mi-
crofluidic devices. This is the field of MicroElectroMechanical Systems (MEMS). This
field devises microdevices ranging from 1µm to 100µm in size. Some examples of this
actuation structures are microvalves, micropumps and micromixers. These structures
may be piezoelectrically, electromagnetically or even electrostatically actuated. Never-
theless the design of these structures has evolved in order not to rely on active actuators
but instead use the passive diffusion driving force to actuate these structures. This is
called passive actuation and allows for MEMS components to move without an external
power source.
1.4.2 Physical Principals
The miniaturized system is based on the same reactional principals of the macroscale
reactions however, because of the reduction in the design scale, these principals have
different effects on the reagents. This is true for physical principals such as capillary dif-
fusion, adsorption, liquid surface tension and velocity of the reaction. In the macroscale,
capillary diffusion may not play an important role due to the larger volumes dealt with.
However in the microscale, the capillary forces weight an enormous relevance and can

Chapter 1. Introduction 13
be used to manipulate liquid flow without the need for external pressure application.
This importance is partially due to the liquid surface tension forces which also become
more relevant in the microscale. Liquid surface tension has a similar scaling effect when
miniaturized and surface forces become relevant for the manipulation of a microfluidic
system. In the case of surface tension, it may hamper the miscibility of some solutions, or
it may be helpful as in the case of digital microfluidics (DMF), a droplet based applica-
tion of microfluidics, providing support for standalone droplets manipulation. Molecule
diffusion in small volumes also becomes more relevant, since chemical and biochemical
reactions are very fast and in macroscale diffusion coefficient is often limiting the assay
velocity. Since microfluidics deals with smaller volumes, the diffusion coefficient limita-
tion does not limit the reaction’s velocity because molecules do not have to diffuse into
such a greater volume allowing for a much faster assay.
All of these differences relate to the exponent of the dimension. Linear dimensions
decrease slower than area or volume dimensions because of the smaller exponent. In the
same way, negative exponent dimensions decrease even slower with a linear decrease.
1.4.3 Polydimethylsiloxane
The PDMS is a silicon-based organic polymer. It possesses many relevant qualities
which justify its common use as substrate in microfluidic structures. It is optically
clear, inert, non-toxic, allows for gas exchanges and non-flammable and has flexible
surface chemistry, low permeability to water and low electrical conductivity. It is also
widely used in caulking, lubricating oils, heat-resistant tiles and for the fabrication of
contact lenses. PDMS has the chemical formula presented in (1), where n is the number
of the monomer repetitions. [33]
CH3[Si(CH3)2O]nSi(CH3)3
(1.1)

Chapter 1. Introduction 14
PDMS can be fabricated by soft-lithography. This technique consists of replicating
structures through the use of elastomeric stamps, molds and photomasks. This way it
provides a fast and inexpensive method for replication and prototyping. The method-
ology is based on the stamping of an elastomer with a master mold and allows for the
design of features down to 20 µm in size. It also allows for the PDMS stamping to
be performed in a laboratory ambient eliminating the need to work inside a cleanroom
[33, 34].
Other polymers are used in the microfluidic industry depending on specific charac-
teristic required for microfabricated devices. Some examples of choice in polymers
are: polyurethane, polycarbonate, polymethyl methacrylate (PMMA), polystyrene and
polyethyleneterephthalate glycol (PETG) [33].
1.4.4 Control of surface chemistry
Due to the –O-Si(CH3)2 groups, PDMS possess a hydrophobic surface. This hydropho-
bicity is reversed when the surface is oxidized. The oxidation of the PDMS surface is
one of the necessary steps in the sealing process. This oxidation can be done by UV
radiation and exposes the silanol functional groups which can be used for sealing or
functionalization of the PDMS structure. This oxidized effect lasts about 30 minutes
when the oxidized surface is left in contact with air. Besides sealing, the oxidized silanol
groups allow for the functionalization of this surface with a range of molecules such as
polyethylene glycol (PEG). PEG is commonly used to functionalize the PDMS surface
creating a higher order of aggregates providing an adhesion layer for other biomolecules.
This methodology is embedded in the concept of self-assembly monolayers (SAM) in
which molecules assemble non-covalently to a reactive solid surface [33, 34].
1.5 Detection Limits
When developing new structures or methods for quantification of a specific substance
detection limits are important to be defined.
Chapter 1. Introduction 15
For the development of a new analytical method, validation and figuring of the detection
limits and system sensitivity are required by the regulatory agencies worldwide. There
are differences in the methods used for the calculation of different detection limits. These
detection limits include various parameters such as the limit of blank (LoB), limit of
detection (LoD), limit of quatitation (LoQ) and instrument detection limit (IDL) and
method detection limit (MDL). For new techniques to be accepted by the regulatory
organism such as Food and Drug Administration (FDA), European Medicines Agency
(EMA) and United States Pharmacopoeia (USP) some rules need to be followed in cal-
culating these parameters. Even when describing the same parameter, some differences
are depicted between definitions of a certain limit and even calculation methodologies for
each of the different agencies. Furthermore there is often a need for calibration experi-
ments to be performed by a varied number of people, in different laboratories in different
time periods. This guarantees the values from each said parameters are calculated derive
from the most significant spread of data.
Three of the most commonly used detection limits were calculated for this project: LoB,
LoD and LoQ. The LoB can be defined as the highest apparent signal found on replicates
of a blank sample (no analyte). LoD is the lowest quantity of analyte capable of being
reliably distinguished from the LoB and at which detection is feasible. LoQ is defined
as the lowest concentration at which the analyte can be reliably detected and quantified
[35].

16

Chapter 2
Materials & Methods
2.1 Materials
This chapter lists the materials used in this project as well as the source and supplier.The
materials are divided by the methodologies in which they were used.
2.1.1 Microfabrication
List of materials used during the aluminium mask, mold and PDMS soft lithography
microfabrication.
Table 2.1: List of materials used for the fabrication of the devices involved in theproject.
Material SourceGlass -Polydimethylsiloxane Sigma-Aldrich, PTPropylene glycol monomethylether acetate (PGMEA) Sigma-Aldrich, PTPoly(methyl methacrylate) (PMMA) Local (Acrylic Supply Store) check nameSilicon wafer LG Siltron inc, KRSU-8 2015 (MicroChem Corp.???) Chimie Tech Services, FRLabx 170 Bershire, engineering clean, UK
17
Chapter 2. Materials & Methods 18
2.1.2 Microfluidics
In this section are listed the materials used during the performance of the experiments
using the microfluidic device to perform miniaturized immunological assays.
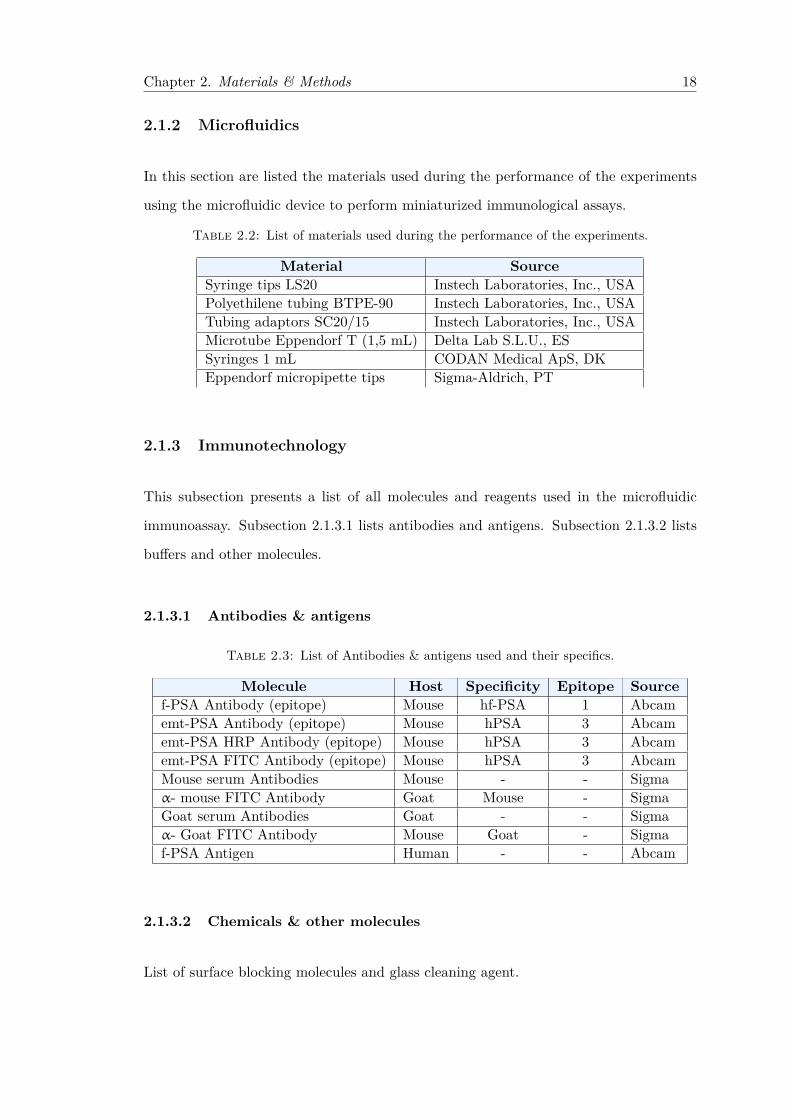
Table 2.2: List of materials used during the performance of the experiments.
Material SourceSyringe tips LS20 Instech Laboratories, Inc., USAPolyethilene tubing BTPE-90 Instech Laboratories, Inc., USATubing adaptors SC20/15 Instech Laboratories, Inc., USAMicrotube Eppendorf T (1,5 mL) Delta Lab S.L.U., ESSyringes 1 mL CODAN Medical ApS, DKEppendorf micropipette tips Sigma-Aldrich, PT
2.1.3 Immunotechnology
This subsection presents a list of all molecules and reagents used in the microfluidic
immunoassay. Subsection 2.1.3.1 lists antibodies and antigens. Subsection 2.1.3.2 lists
buffers and other molecules.
2.1.3.1 Antibodies & antigens
Table 2.3: List of Antibodies & antigens used and their specifics.
Molecule Host Specificity Epitope Sourcef-PSA Antibody (epitope) Mouse hf-PSA 1 Abcamemt-PSA Antibody (epitope) Mouse hPSA 3 Abcamemt-PSA HRP Antibody (epitope) Mouse hPSA 3 Abcamemt-PSA FITC Antibody (epitope) Mouse hPSA 3 AbcamMouse serum Antibodies Mouse - - Sigmaα- mouse FITC Antibody Goat Mouse - SigmaGoat serum Antibodies Goat - - Sigmaα- Goat FITC Antibody Mouse Goat - Sigmaf-PSA Antigen Human - - Abcam
2.1.3.2 Chemicals & other molecules
List of surface blocking molecules and glass cleaning agent.

Chapter 2. Materials & Methods 19
Table 2.4: List of chemicals and other molecules used in the experiments.
Chemicals & other molecules Host SourceBovine Serum Albumin (BSA) Bovine Sigma-Aldrich, PTSalmon Sperm DNA Salmon Provided by IST LabCasein Bovine Sigma-Aldrich, PTIsopropyl alcohol (IPA) - Sigma-Aldrich, PT
2.1.4 Detection
Substrate used for the detection in enzymatic assays, chemiluminescent and colorimetric
assays. These substrate were flown in the microchannel after the incubation of the
sandwich ELISA molecules and were degraded by the HRP enzyme coupled to the
detector antibody producing light (in the case of luminol) or a light absorbant product
which precipitates inside the channel (as it happends to the TMB).
Table 2.5: List of substrates for the enzymatic assays.
Substrate SourceSuperSignal West Femto (luminol) Thermo Scientific, UK3,3’,5,5’-Tetramethylbenzidine (TMB) Sigma-Aldrich, PT
2.1.5 Instruments & equipment
In this subsection are listed every equipment used from the microfabrication process to
the final signal acquisition step.
2.1.6 Software
List of software used to develop and devices and control the devices from fabrication to
detection. The list is presented in table 2.7 along with the developer of each software.
2.2 Methods
This chapter describes the methodologies used in the fabrication of the devices developed
for the immunoassays, as well as the protocols used for the execution of the experiments,

Chapter 2. Materials & Methods 20
Table 2.6: List of all the equipments used for the fabrication of devices, performanceof the experiments and data acquisition.
Equipment SourceSyringe Pump NE-300 New Era Pump Systems, Inc, USALeica DM LM Leica Microsystems, DEDFC300 FX Leica Microsystems, DEUV-H 254 Light technologies LTD, UKUVO-Cleaner 144AX-220 Jelight Company inc, USAWS-650MZ Spin Coater Laurell Technologies Corporation, UKNordiko 7000 Broad Ion Beam Milling system Nordiko Technical Services Ltd , UKDisco DAD 321 Giorgio Technology, USAReax 2000 Vortex Mixer Heidolph, ESEppendorf Research Plus Micropipettes Sigma-Aldrich, PTNanoPlotter NpC2.1 GeSim, DEMilling Machine Fabricated at Inesc-MNVaccum compartment Belart products, USALabnet Tabletop Mini-Centrifuge Sigma-Aldrich, PTUltrasonic Analogue SRH Bath Thermo Fisher Scientific Inc,USALaminar Flow BSC - EN 165 Faster, ITDigital Hotplate SD160 Stuart, UKIncubator INB 200 Memmert, EUAlpha-step 200 Tencor instruments, FRa-Si:H Photodiodes Fabricated at Inesc-MNAmScope OlympusHighlight 3100 OlympusKeithley 237 High Voltage Source Measure Unit Keithley, USA
data acquisition and data analysis. Section 2.2.1 covers the microfabrication steps from
the aluminium mask exposure to the sealing of the PDMS onto the glass substrate.
Section 2.2.2 describes the protocols and standardized parameters for the assay’s ex-
ecution. Section 2.2.3 presents diagrams of the immunotechnology set up devised for
the project. Section 2.2.4 describes the steps and parameters executed for each of the
different detection methods. Section 2.2.5 covers the analysis of the acquired data.
2.2.1 Microfabrication
1. Microfabrication Steps
This includes aluminiummask and negative SU-8 mold fabrication, soft-lithography
and baking on the PDMS and the sealing of the stamped PDMS onto a clean glass
substrate.

Chapter 2. Materials & Methods 21
Table 2.7: List of software used for handling equipment, data acquisition and dataanalysis.
Software DeveloperDXF Mask Converter software Developed at Inesc-MNAutoCad Autodesk, IncImageJ NIHPaintShop Pro CorelLeica Acquisition Software Leica Camera AGOrigin 8 Origin LabMS Excel Microsoft CorporationMach2 CNC control ArtSoft CNC software companyStreaming current software Developed at Inesc-MN (Pedro Novo)Photodiode Acquisition Software Developed at Inesc-MN (Pedro Novo)
(a) Aluminium mask
A glass slide was cleaned in alconox for 10 minutes over a sonicator in a hot
bath. It was then rinsed with IPA and left again on the sonicator for another
10 minutes this time with water. In the end it was rinsed with IPA and dried.
The following steps are outlined in figure 2.1. A 1500 Å layer of aluminium
was deposited on top of the cleaned glass (figure 2. 1 b) by a Nordiko 7000
Broad Ion Beam Milling system inside a clean room, and following this a
positive photoresist was lay on top of the aluminium (figure 2.1 c). The
glass slide was then put under the DWL where it was exposed with the mask
design previously made on AutoCAD (figure 2.1 d) and converted by DXF
Mask Converter. The glass sample was then incubated with “POSITIVE
PHOTORESIST DEVELOPER” to develop the exposed photoresist (figure
2.1 e), following aluminium development and finally photoresist removal (fig.
2.1 f).
Figure 2.1: Schematic representation of the Aluminium mask microfabrication steps.

Chapter 2. Materials & Methods 22
(b) SU-8 Mold
The negative mold used in the soft-lithography step was fabricated with neg-
ative photoresist hardened on a clean silicon wafer. The silicon wafer was
cleaned by rubbing with acetone and then following the same protocol as for
the previous glass slide cleaning. Negative photoresist SU-8 2015 was spilled
onto the cleaned wafer and a spin coater was used to convey the photoresist
with the necessary 20 µm height. The spin coater protocol used was input in
the spinner as follows:
• 500 rpm, 10 seconds (100rpm/s)
• 1700 rpm, 34 seconds (300rpm/s)
The wafer with photoresist is then soft baked for 4 minutes at 95oC and is then
exposed to UV light for 33 seconds through the mask previously fabricated.
This step conferred the design onto the photoresist. The photoresist is then
developed on PGMEA for 2 minutes, cleaned with IPA and then hard baked
for 10 minutes at a temperature of 150oC.
(c) Soft-Lithography
For the PDMS device fabrication, a mixture of 1:10 of curing agent and
PDMS respectively was degassed in a vacuum compartment for 30 minutes.
The previously fabricated SU-8 mold was fixed inside a petri dish and after
degassing the PDMS was poured inside the same petri dish and taken inside
an oven at 70oC for 1h30m. The cured PDMS was cut and peeled off the
petri dish bearing the original microfluidic design carved 20 µm deep. The
PDMS was then punched with a syringe tip LS20 (1 mm Ø, outside diameter)
in the inlets and outlets of the design in order to connect the channel to the
top surface of the PDMS.
(d) Sealing
The sealing between the PDMS and glass was performed by oxidizing both
halves and pressing them together. UVO oxidation can be used to alter the
surface chemistry, adding silanol (SiOH) groups to the surface has shown in
Figure 2.2. This was done by taking a new clean glass slide (following the

Chapter 2. Materials & Methods 23
same cleaning protocol as for the mask glass slide) and the freshly peeled
PDMS and inserting them both in a UVO-cleaner for 11 minutes (6 minutes
of oxidation + 5 minutes for fumes exhaustion). Immediately after opening
the UVO-cleaner both halves were brought together (PDMS stamped surface
against glass) and left under pressure for 24 hours.
Figure 2.2: Oxidation effect over the chemistry of PDMS surface.
(e) Experimental Assembly
In the experimental set up, a 1 mL syringe was assembled to a polyethilene
tubing BTPE-90 by a LS20 syringe tip. At the other end of the tubing
a SC20/15 adaptor was attached. Through this adaptor the experimental
solutions used were PUSHED in and the adaptor inserted inside the inlet
hole previously punched on the PDMS device. A similar set up, only holding
a small portion of tubing and an adaptor was connect to the outlet hole of the
microfluidic channel to help the solution out of the microchannel. A graphic
representation of the set up is shown in Figure 2.3.
Figure 2.3: Representation of the assembled PDMS & glass device with adaptorsinside the inlet and outlet holes.
(f) PMMA devices fabrication
PMMA devices were fabricated to serve as PDMS molding and for holding
PMDS and glass structures together when sealing was not performed. Several
plates (has seen in figure 2.4) had to be milled using a milling machine. The
design was done in AutoCad and then converted to CNC format to be loaded

Chapter 2. Materials & Methods 24
into the milling software (Mach2 CNC control).
The PMDS molding structure is presented in figure 2.4 and is composed of 3
plates. A bottom plate which holds the SU-8 microfabricated molds with the
channels structure. The middle plate which defines the PDMS hight. The top
plate which seals the top and possesses 1 mm Ø (diameter) holes, aligned with
the inlets and outlets designed on the SU-8 mold, in which SC20/15 adaptors
were inserted leaving holes on the PMDS going from the top to the bottom in
order to let solutions being inserted inside the channels. Supplement 5 mm Ø
holes were made on the sides in order to hold the 3 plates together with screws.
Figure 2.4: Schematic representation of the PMMA mold for PDMS fabrication.
The device for holding unsealed PDMS and glass together possesses only
2 plates, bottom and top, milled in a box-like shape capable of holding the
PDMS fabricated in the previous device against a 0,7 mm width glass (Figure
2.5).
2.2.2 Microfluidics
1. Microfluidic Steps
(a) Set-Up
The syringe connected to the assembled experimental device is pumped by

Chapter 2. Materials & Methods 25
Figure 2.5: Photo of the fabricated device to hold unsealed PDMS and glass together.
a syringe pump at defined flow rates for a restrict amount of time, both de-
pending on the solution used and experimental goal. Between the pumping
of different solutions into the microchannel, the adaptor needs to be changed
and the tip of the tubing cut off up to the point wetted by the previously
solution. This prevents contamination of solutions in the eppendorfs and un-
wanted molecule reactions outside the microchannel.
Figure 2.6: Photograph of the assembled PDMS & glass device with adaptors insidethe inlet and outlet holes over a black PMMA plate.
(b) Experiment Standard Conditions (incubation time, flow rate and washing)
Incubation for the molecules was set at 10 minutes and a flow rate of 0,5 µl
min−1. For BSA, the incubation time was set at 5 minutes due to the relative
high concentration used (4% BSA). The washing steps were performed with

Chapter 2. Materials & Methods 26
PBS 10mM (also used for molecules dilution) and a 5 µl min−1 flow rate was
used for 1 minute.
Capture antibody (f-PSA specific antibody) was incubated under constant
flow on the channel at 0.5 µl min−1 for 10 minutes. After every incubation
step a 1 minute washing step was performed. Followed the BSA incubation
step and then the analyte spiked solution of f-PSA. Finally the detector la-
belled antibody (FITC or HRP) was incubated and a final wash performed.
In the case of HRP labelled antibody a detection solution (luminol or TMB)
was incubated during imaging.
2.2.3 Immunotechnology
1. Immunotechnology
(a) Diagram
The schematic approach used for the miniaturized ELISA is shown in figure
2.7. In this molecular set up capture antibody for free PSA is incubated
and the free space is filled with BSA (smaller molecule - 66.5 kDa) in order
to block the adsorption of the detector antibody to the surface. The free
PSA is then incubated and binds to the capture antibody and in the final
step detector antibody is incubated and binds to the free PSA bound to the
capture antibody.
Figure 2.7: Schematic representation of the sandwich ELISA set up using f-PSA,f-PSA specific antibodies and BSA for blocking step. This set up is assembles inside
the microfluidic channel onto a glass surface.
Chapter 2. Materials & Methods 27
(b) Methodology
An miniaturized ELISA was the approach chosen to be performed in a mi-
crofluidic device for the detection of f-PSA molecules. However incubation
conditions were optimized for the scaling of the experiment with the goal of
reduced assay time and reducing the volume of reagents and samples neces-
sary.
2.2.4 Detection
1. Detection methods
(a) Fluorescence
Fluorescence detection was performed using IgG labelled with FITCmolecules.
After incubation and adsorption of the labelled IgG the channel was ex-
posed with a fluorescence light (100 Watts) under the microscope and imaged
through a fluorophore filter with an illumination path between 450-490 nm
and a observation path of 515 nm.
(b) Chemiluminescence
Chemiluminescence detection is based on an enzymatic degradation step by
the HRP-enzyme (Horseradish Peroxidase) of a substrate (luminol) which
emits a blue light during the enzymatic reaction. HRP-labelled IgG was
incubated in the microchannel and after incubation and final washing, the
whole experimental set-up was moved to the microscope side and the device
was put under the microscope still attached to the syringe which now carried
luminol to be run on the same microchannel in which the HRP-IgG was
incubated. The microscope was then cover with a black cloak which prevented
the outside light reaching the device and in total darkness the luminol was
flown in the channel at 0,5 µl min−1 for all the duration of the imaging step.
(c) Colorimetry
As for the chemiluminescence detection, colorimetry also makes use of the
HRP enzymatic activity to degrade a substrate. Only in this case the sub-
strate does not glow. Instead it deposits on the microfluidic channel blocking

Chapter 2. Materials & Methods 28
the transmittance of the microscope white light. The experimental set up
was moved to the microscope side and TMB was run. Since the enzymatic
reaction product deposits on the channel, time of TMB incubation become
relevant. TMB was run for 2 minutes at 0,5 µl min−1.
(d) Photodiodes
For the acquisition of a signal with photodiodes, one of the previous methods
would be chosen and same conditions as used for the microscope would be
emulated on a PCB wire-bonded to the photodiodes.
2.2.5 Image Acquisition Analysis
1. Acquisition Parameters
(a) Exposure, Gain, Gamma
Table 2.8 shows the values of exposure, gain and gamma used for each one of
the detection techniques imaged under the microscope. For colorimetry how-
ever the microscope white light was set to maximum power with the condenser
fully open. For both fluorescence and chemiluminescence the microscope il-
lumination was turn off.
Table 2.8: Parameters used for the imaging of each detection methodology.
Detection Exposure Gain GammaFluorescence 1 second 1 0,6
Chemiluminescence 10 seconds 10 0,6Colorimetry 500 µseconds 1 0,6
(b) ImageJ Analysis
The images acquired were analysed in terms of signal intensity through the use
of ImageJ. In each picture equal sections were selected inside the microchannel
and three other equal sections were selected outside the channel to be used
as background. The signal from the background sections was subtracted to

Chapter 2. Materials & Methods 29
the corresponding signal of the channels sections as shown in figure 2.8 and
an average and standard deviation of the channel signal was calculated.
Figure 2.8: Representation of the sections measured during image analysis.

30

Chapter 3
Results
In order to optimize the microfluidic assay, different aspects were taken into consider-
ation. Firstly, molecule surface adsorption was tested on two different surfaces: glass
and PDMS. Molecule incubation parameters such as incubation time, molecules con-
centration and flow rate of incubation were tested. Reductions in reagents, total assay
time, increase in the limit of detection and the sensitivity of the system were the main
concerns in the selection of the final values used for each parameter. Blocking methodol-
ogy was selected after experimentation with different blocking molecules and interaction
between the system molecules was also tested in an effort to reduce the unspecific signal
of the assay. All the protocols used for the optimization experiments possess a final
detection step which often made use of a fluorophore for light emission. A fluorescence
microscope was used for the capture of fluorescence signal. The acquisition parameters
of the microscope were investigated in order to determine the relationship between gain,
gamma, exposure and signal. The relation between the number of molecules on the sur-
face and the signal intensity was assessed by performing a series of spotting assays with
different antibody concentrations. Calibrations curves were made for three detection
methodologies (fluorescence, chemiluminescence and colorimetry). Finally the device
was integrated with an a-Si:H (Amorphous silicon) photodiodes for the acquisition of
transmittance from the colorimetric assay.
31

Chapter 3. Results 32
3.1 Surface adsorption
3.1.1 Glass vs PDMS
Glass and PDMS were both tested as substrates for molecule incubation. Even though
the devices channel (walls and top) were made from PDMS, the bottom of the channel
(which is sealed after the soft-lithography step) can be sealed with either substrates.
Both substrates were oxidized during the sealing process. The oxidization of the surfaces
changes its properties as described in section 2.2.1 - Microfabrication.
Therefore, mouse IgG-FITC was incubated under the same conditions in both devices
and the results measured in a fluorescence microscope - Figure 3.1.
Figure 3.1: Fluorescence intensity results measured in the fluorescence microscopyfor incubated IgG-FITC both on devices with glass and PDMS as substrate.
Through the observation of figure 3.1 it is reasonable to say that there is little difference
in antibody adsorption to either substrate since the fluorescence signals and standard
deviations of both assays are similar.

Chapter 3. Results 33
3.1.2 Capture Antibody Concentration
The most suitable capture antibody concentration for the assay in terms of antigen
capture efficiency and reagent saving was accessed by constructing two different calibra-
tion curves. First curve consisted of incubating a monoclonal mouse antibody conju-
gated with FITC inside the microfluidic channel in different concentrations plus a final
washing step to remove unbound molecules. Fluorescence signal was determined from
pictures taken in a fluorescence microscope. For the second curve monoclonal mouse
antibody unlabelled was incubated in in different concentrations followed by incubation
of BSA conjugated with FITC. Results are presented in figure 3.2. FITC molecular
weight is approximately 390 daltons. Even though each labelled antibody as 3 to 6
FITC molecules the extra molecular weight is negligible when compared to the anti-
body (150kDa). Therefore FITC molecular weight was not taken into account in the
concentration calculation.
Figure 3.2: Fluorescence curve for FITC labelled monoclonal mouse IgG (blue) andfor unlabelled mouse monoclonal IgG + BSA-FITC (red).
There is an increase in fluorescence signal when increasing the concentration of IgG-
FITC - blue curve from figure 3.2 - reaching a plateau around 100 µg mL−1. This same
trend is confirmed by the second curve in which BSA-FITC (constante concentration)
is incubated after the channel is coated with unlabelled IgG (varying concentration) -

Chapter 3. Results 34
red curve. Because of the IgG incubation, the channel has less free space for the BSA-
FITC to adsorb making the fluorescence signal decrease with the increase in the IgG
concentration used. This decrease in signal also reaches a constant value around 100 µg
mL−1.
3.1.3 Incubation time and flow rate
Various incubation times and flow rates were tested for the antibodies in order to mini-
mize the assay time and still ensure a reasonable surface coverage of the microchannel.
Figure 3.3: Fluorescence signal for the incubation of 100 µg mL−1 of IgG-FITC in 4experiments varying the antibody solution incubation time.
Just as for the antibody concentration, incubation time also seems to show a plateau
after 10 minutes of incubation. The incubation time for the antibodies incubation was
then set at 10 minutes.
For the flow rate, the results are shown in figure 3.4. Flow rate of incubation should
ideally be as low as possible in order to save reagent and at the same time not to disrupt
the system (by removing molecules from the channel surface). Nevertheless, during the
incubation, antibodies bind to the surface lowering the flowing solution concentration of
antibody. Therefore the flow rate should be high enough to ensure constant renovation of
molecules and keep the flowing solution concentration close to the initial concentration.
Knowing the dimension of the channel (20x300x10000 µm), the volume was calculated
Chapter 3. Results 35
(0.06mm3). With a flow rate of 0.5 µl min−1 and a volume of the channel of 0.06 µl,
the channel solution is totally renewed about 8.3 times per minute, making an average
residence time inside the channel of 7.2 seconds.
Figure 3.4: Fluorescence signal for the incubation of 100 µg mL−1 of IgG-FITCin 3 experiments varying flow rate at which the solution was incubated inside the
microchannel.
3.2 Blocking Methodology
The blocking step optimization becomes one of the most important steps when the
system’s sensitivity and limit of detection improvement are the ultimate goal. Different
blocking molecules were tested in order to evaluate antibody affinity to the blocking
agent and blocking efficiency with the goal of reducing the assays control signal and
minimizing non-specific bindings.
3.2.1 Blocking molecule of choice
For the blocking experiments BSA and salmon sperm DNA were tested as blocking
agents using chemiluminescence as a detection method. PSA specific antibodies were
used to access the affinity between these and the blocking molecule. The results are
presented in figure 3.5. By the analysis of the results in figure 3.5 it is reasonable to say

Chapter 3. Results 36
the emt-PSA antibody either possess a very low binding affinity to both blocking agent,
or the blocking of the surface was not completely assured by the blocking molecules.
SSDNA (salmon sperm DNA) and BSA seem to show a similar blocking efficiency, with
BSA showing a lower signal for the experiment with f-PSA antigen. This may reflect a
better blocking efficiency or lower affinity of the antibody to the BSA when compared
to the SSDNA.
Figure 3.5: Chemiluminescence signal for 4 different conditions in a sandwich assaywith PSA specific antibodies. (note: SSDNA stands for salmon sperm DNA)
A set of control experiments was performed in order to validate the signals acquired for
the blocking experiments. All the molecules were incubated in a microchannel individ-
ually and their chemiluminescence signal measured as proof of concept for the blocking
experiments - Figure 3.6.
The emt-PSA HRP incubation presents a high signal just has expected since there was
no blocking of the surface and all the labelled HRP antibody molecules bound to the
surface leaving the channel covered with HRP. The BSA and SSDNA covered channel
showed almost no signal at all since there was no HRP present of the channel for the
substrate (luminol) degradation.
Flowing detector antibody in the BSA blocked channel showed a higher signal then
the SSDNA blocked channel. However the difference is no bigger than the standard
deviation for the BSA blocked channel ( 1 a.U.).

Chapter 3. Results 37
Figure 3.6: Set of controls experiments for the sandwich chemiluminescence assay.
All in all there a similar efficiency in the blocking with both methods however small
differences are worth notice. Since the SSDNA presents a higher signal for the sandwich
experiment with 1 µg mL−1 of f-PSA than when blocked with BSA (Figure 4.5) and
at the same time, presents a lower signal when only blocking agent and detector are
incubated (Figure 3.6) we can assume some kind of capture antibody-SSDNA interaction.
A reduction in the blocking efficiency is ruled out since the capture-blocking-detector
experiment (black and red columns-Figure 3.5) show the same blocking efficiency for both
methods. Therefore weak interactions between antigen or detector antibody with the
SSDNA may be the cause for this slightly higher signal in the full sandwich experiment.
This interaction between SSDNA and the other systems proteins could be confirmed with
a electrophoretic mobility shift assay. If there is interaction between these molecules a
reduced mobility should be observed in the SSDNA migration through the gel.
Casein was also tested as a blocking agent along with different concentration of BSA and
a 50-50 mixture of 2 % BSA and 100 µg mL−1 of casein - Figure 3.7. The experiment
comprised only two incubation steps. A blocking step with the different solutions and
the incubation of detector antibody (IgG-FITC) followed by a final washing with PBS
to remove unbound molecules. A reduction in signal is observed with the increase in
the concentration of BSA although this is accompanied by an increase in the standard
deviation. Casein alone showed a much lower blocking efficiency when compared to BSA.

Chapter 3. Results 38
The mixture between the two blocking agents presents a blocking efficiency similar to the
BSA assays although still less efficient than 4 % BSA alone. The interaction between
both proteins (casein and BSA) may not favour the binding of either to the channel
surface.
Figure 3.7: Testing different BSA incubation conditions and casein blocking efficiency.A mixed solution with 50 % BSA at 4% and 50 % Casein at 200 µg mL−1 was also
tested as blocking solution.
3.2.2 Blocking parameters
Taking into account the results from the blocking experiments BSA was chosen as the
blocking methodology. Therefore incubation time was optimized to try to reduce the
total assay time - Figure 3.8. The assay consisted of 2 incubation steps. Blocking step
varying incubation time and running detector antibody (IgG-FITC) followed by a final
washing with PBS to remove unbound molecules.
From figure 3.8 it can be seen that 5 minutes of incubation time seems to show the most
efficiency of the 3 assays. The difference between 1 minute incubation and 3 minutes
incubation is negligible do to the high standard deviation presented by the 3 minute
assay. The 5 minute incubation however presents a distinct indication of better blocking
than the remaining 2 assays. 5 minutes incubation was chosen for standard time of
incubation for the 4 % BSA solution.
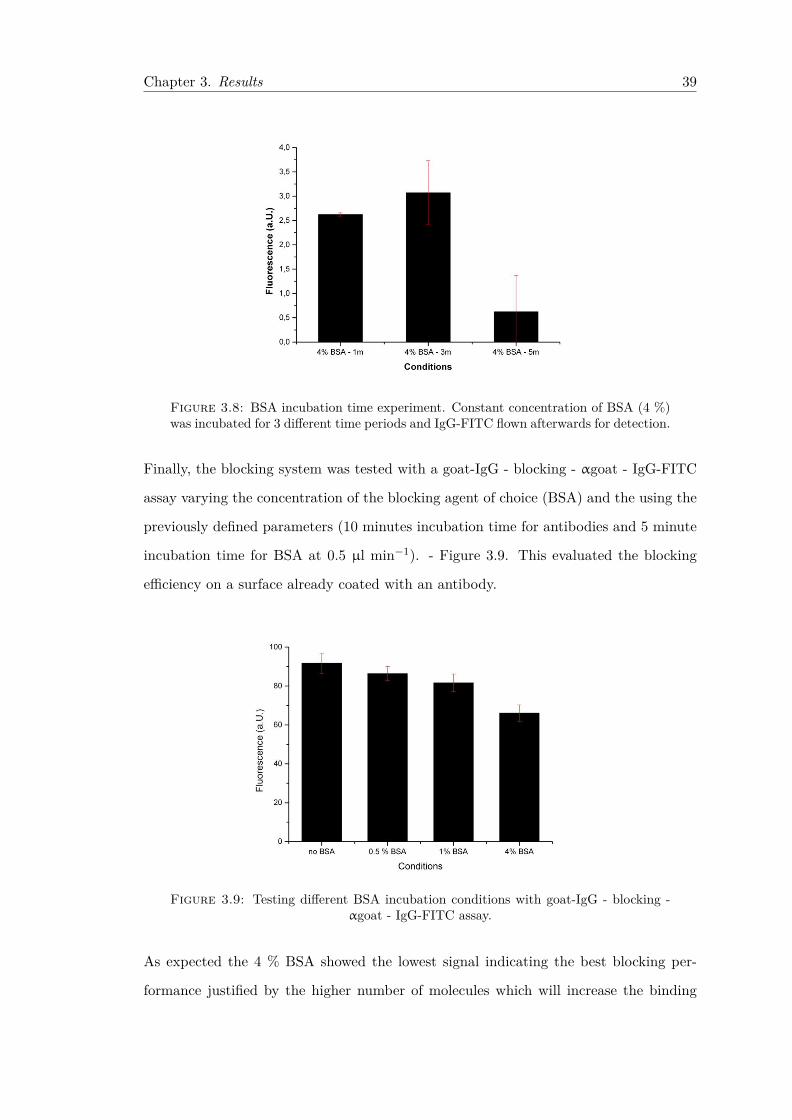
Chapter 3. Results 39
Figure 3.8: BSA incubation time experiment. Constant concentration of BSA (4 %)was incubated for 3 different time periods and IgG-FITC flown afterwards for detection.
Finally, the blocking system was tested with a goat-IgG - blocking - αgoat - IgG-FITC
assay varying the concentration of the blocking agent of choice (BSA) and the using the
previously defined parameters (10 minutes incubation time for antibodies and 5 minute
incubation time for BSA at 0.5 µl min−1). - Figure 3.9. This evaluated the blocking
efficiency on a surface already coated with an antibody.
Figure 3.9: Testing different BSA incubation conditions with goat-IgG - blocking -αgoat - IgG-FITC assay.
As expected the 4 % BSA showed the lowest signal indicating the best blocking per-
formance justified by the higher number of molecules which will increase the binding
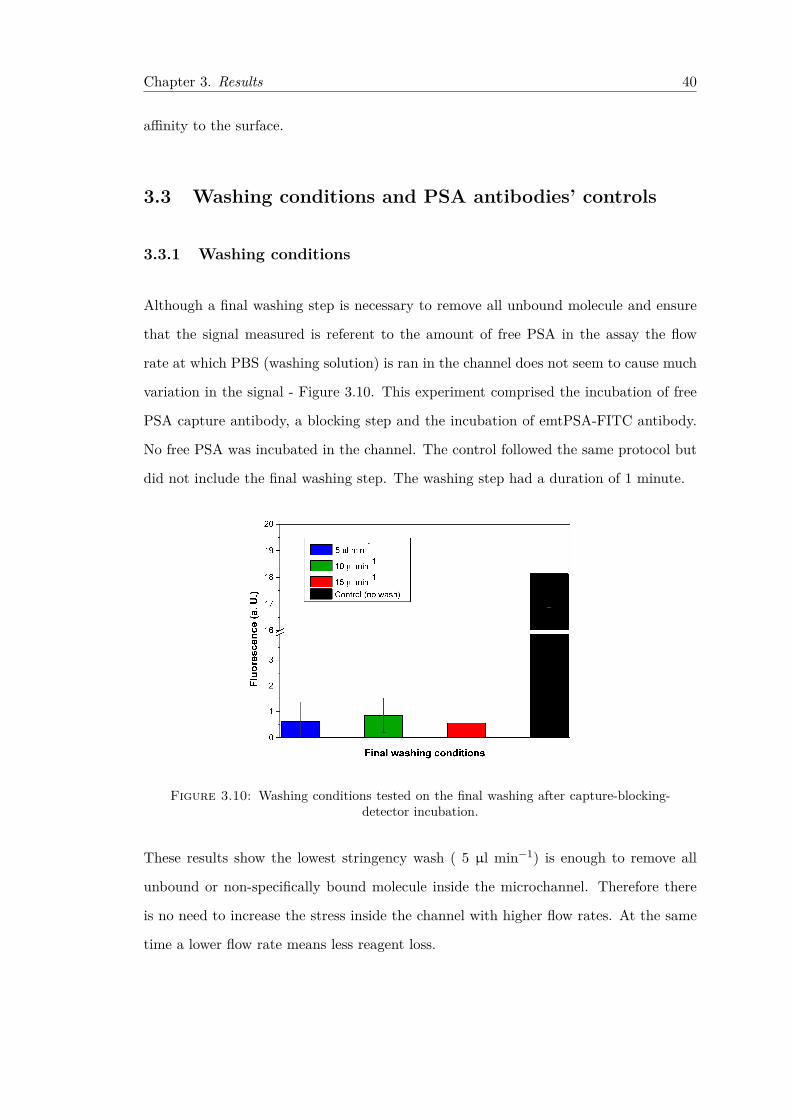
Chapter 3. Results 40
affinity to the surface.
3.3 Washing conditions and PSA antibodies’ controls
3.3.1 Washing conditions
Although a final washing step is necessary to remove all unbound molecule and ensure
that the signal measured is referent to the amount of free PSA in the assay the flow
rate at which PBS (washing solution) is ran in the channel does not seem to cause much
variation in the signal - Figure 3.10. This experiment comprised the incubation of free
PSA capture antibody, a blocking step and the incubation of emtPSA-FITC antibody.
No free PSA was incubated in the channel. The control followed the same protocol but
did not include the final washing step. The washing step had a duration of 1 minute.
Figure 3.10: Washing conditions tested on the final washing after capture-blocking-detector incubation.
These results show the lowest stringency wash ( 5 µl min−1) is enough to remove all
unbound or non-specifically bound molecule inside the microchannel. Therefore there
is no need to increase the stress inside the channel with higher flow rates. At the same
time a lower flow rate means less reagent loss.

Chapter 3. Results 41
3.3.2 PSA antibodies’ controls
Another important aspect of an optimization is to have a set of controls for the antibodies
used in the system established. These controls ensure that the molecules used are
working as predicted and help to uncover any unspecific interactions that may arise from
the combination of different molecules on the system. Results for the PSA Antibody
controls are presented in figure 3.11. The antibodies were incubated individually in each
experiment and in different combinations to allowed for a complete system study. A
washing step was performed at the end of each experiment before luminol was ran in
the channel for the detection under the microscope. The previously defined values for
the molecules incubation time, flow rate and concentration were used.
Figure 3.11: Control experiments for the PSA antibodies.
3.4 Microscopy fluorescence data acquisition
For fluorescence experiments image acquisition parameters must be defined to optimize
the signal read (Figure 3.13). FITC molecules have a decay ratio of fluorescence asso-
ciated with said molecules exposure to excitation fluorescence light. The purpose is to
increase the signal per molecule ratio as much as possible keeping the bleaching of the
FITC molecules at minimum. With gain there is an introduction of digital distortion to
the image in order to increase the overall fluorescence measured in the image acquired.

Chapter 3. Results 42
It is also important to have in mind that to much signal amplification may result in
over exposure and loss of signal quality. In figure 3.12 it is clear section B imaging
was acquired with the wrong parameters. There is a clear cut off on the Z axis of the
values because they reached the maximum value allowed in the bit system (255). This
makes it impossible to distinguish the signal variation and more importantly, caps the
concentration measurements at a value lowered then our actual detection range.
Figure 3.12: Comparison between a control (A) and an overexposed (B) image of amicrochannel incubated with FITC labelled antibodies.
There is also a possibility of finding a constant to calibrate signals acquired with different
exposition conditions. A set of pictures were taken of the same microchannel at different
acquisition conditions for the construction of the graph in figure 3.13. This depicts the
relationship between the acquisition variables and the signal captured.
Figure 3.13: Microscopy fluorescence data acquisition. The data for the three curveswas acquired at fixed gamma (0.6). Within each curve gain was constant (1, 2 and 3)
and exposure was varied from 0.1 to 3 seconds.

Chapter 3. Results 43
3.5 Colorimetry detection optimization
Colorimetry assay required further optimization due to the intra-experimental variations
of the absolute values of absorbance. The TMB used was a Blotting Substrate Solu-
tion from western blot assay. Unlike the ELISA TMB solution this western blot TMB
develops a permanent, insoluble dark blue reaction product which precipitates inside
the microchannel. This precipitation leads to a difference in signal depending on the
channel area measured. This variation in signal along the channel is shown in Figure
3.14. Measurements were taken in three different areas of the channel during a period
of 7 minutes in order to evaluate signal variation. The measured values were normalized
to the absorbance value measured from an empty PDMS microchannel.
Figure 3.14: Measurements of TMB product along the microchannel. Inlet side- 2mmaway from inlet; middle - 5mm away from inlet; outlet side 2 mm away from the outlet.
3.6 Spotting Assays
Microfluidics devices have shown in recent year to be capable of providing a cheaper,
faster and portable system for the performance of miniaturized immunoassay. These
devices are developed with the goal of fabricating a PoC device for the analysis of
various metabolites performing all the top-bench tasks bearing the same reliability in a
single portable chip. For the purpose of multiplexing, spotting has been used in order
to provide the microfluidic system with selective areas for different metabolites in an

Chapter 3. Results 44
immunoassay context. However spotting can also be used has a tool for the study of
antibody behaviour on different substrates providing information for the analysis of flow
incubated molecules on a microchannel.
With spotting assay is easy to know the total amount of antibody on the channel surface
due to the possibility of handling the amount of droplets spotted, knowing that each
droplet has a volume of 0,56 picoLiter. This allows for the calculation of antibody total
amount, surface density and signal per molecule. In this section the results for 3 spotting
assays are analysed and discussed.
3.6.1 Spotting Concentration Curves
Pictures of all spots were taken and fluorescence signal was measured. The fluorescence
signal correlates to the concentration of antibody on each spots. Therefore a curve of
antibody-FITC concentration versus fluorescence signal was drawn. Keeping in mind
the signal measured is bit-dependent and ranges from 0 to 255, the variation in the
acquisition parameters (namely exposure) as referred previously was necessary to ensure
the images acquired would output a reasonable value for analysis avoiding overexposure
of the signal. Over exposure would deviate the results, as this would mean loss of
sensitivity in the higher concentrations. However, the variation is restricted to inter-
experimental assays so that the values in each experiment are comparable and fit to a
curve as seen in figure 3.15. Spotting experiments 1 and 2 results were acquired with
0.2 seconds of exposure. Experiment 3 was imaged with 1 second of exposure.
Although there is an inter-experimental exposure difference in this data, is it important
to see that the data follows the same trend varying the slope of the increments. This
is due to the difference in exposures. By comparing the signal for the 100 µg mL−1 we
can easily understand that with a 1 second exposure the results for 500 µg mL−1 spots
in the first and second assay would have suffered overexposure.

Chapter 3. Results 45
Figure 3.15: Fluorescence curves for the 3 spotting experiments. Antibody-FITCconcentration used versus Fluorescence signal.
3.6.2 Antibody surface density
The area of each spot was measured and the density of antibody on the spot calculated.
The difference in spot size makes it impossible to have a linear relationship between the
molecules density and the antibody concentration used. This can be observed in picture
3.16. The inset bar graph has represented every spot’s size.
Figure 3.16: Graphic presents the antibody surface density for each spot measuredversus the antibody concentration used. The inset graph shows the area measured in
each spot. The red like is the monolayer theoretical threshold.
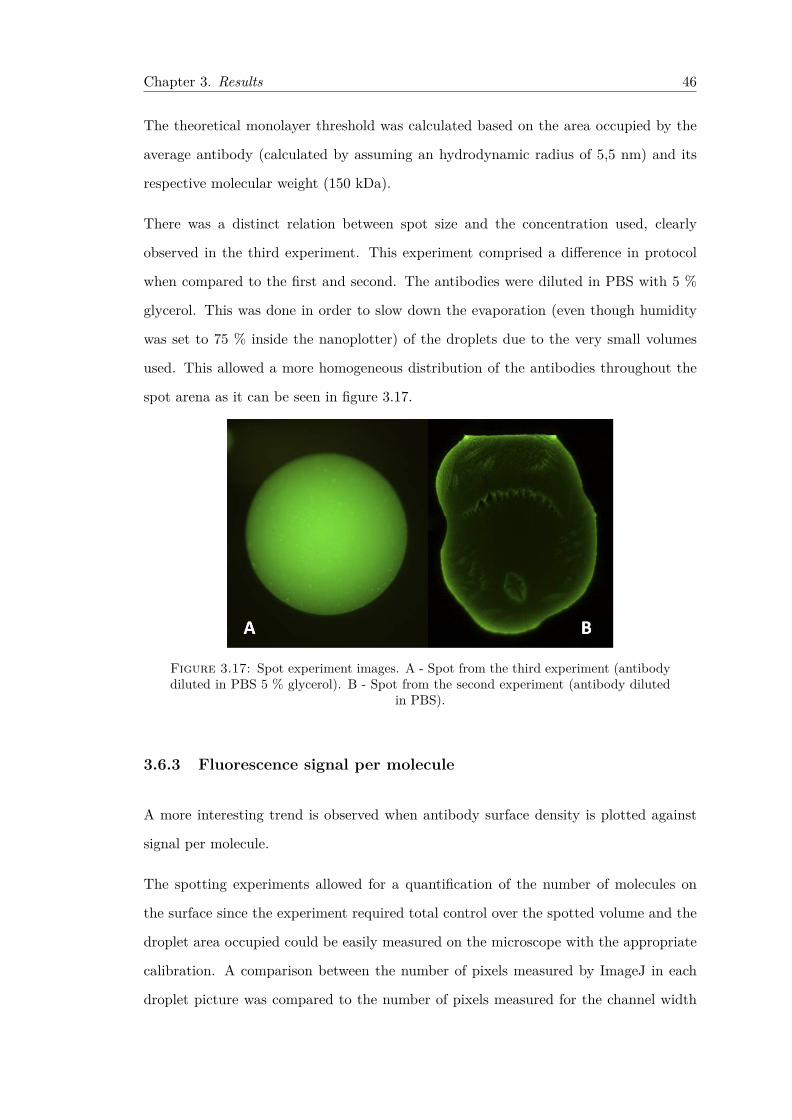
Chapter 3. Results 46
The theoretical monolayer threshold was calculated based on the area occupied by the
average antibody (calculated by assuming an hydrodynamic radius of 5,5 nm) and its
respective molecular weight (150 kDa).
There was a distinct relation between spot size and the concentration used, clearly
observed in the third experiment. This experiment comprised a difference in protocol
when compared to the first and second. The antibodies were diluted in PBS with 5 %
glycerol. This was done in order to slow down the evaporation (even though humidity
was set to 75 % inside the nanoplotter) of the droplets due to the very small volumes
used. This allowed a more homogeneous distribution of the antibodies throughout the
spot arena as it can be seen in figure 3.17.
Figure 3.17: Spot experiment images. A - Spot from the third experiment (antibodydiluted in PBS 5 % glycerol). B - Spot from the second experiment (antibody diluted
in PBS).
3.6.3 Fluorescence signal per molecule
A more interesting trend is observed when antibody surface density is plotted against
signal per molecule.
The spotting experiments allowed for a quantification of the number of molecules on
the surface since the experiment required total control over the spotted volume and the
droplet area occupied could be easily measured on the microscope with the appropriate
calibration. A comparison between the number of pixels measured by ImageJ in each
droplet picture was compared to the number of pixels measured for the channel width
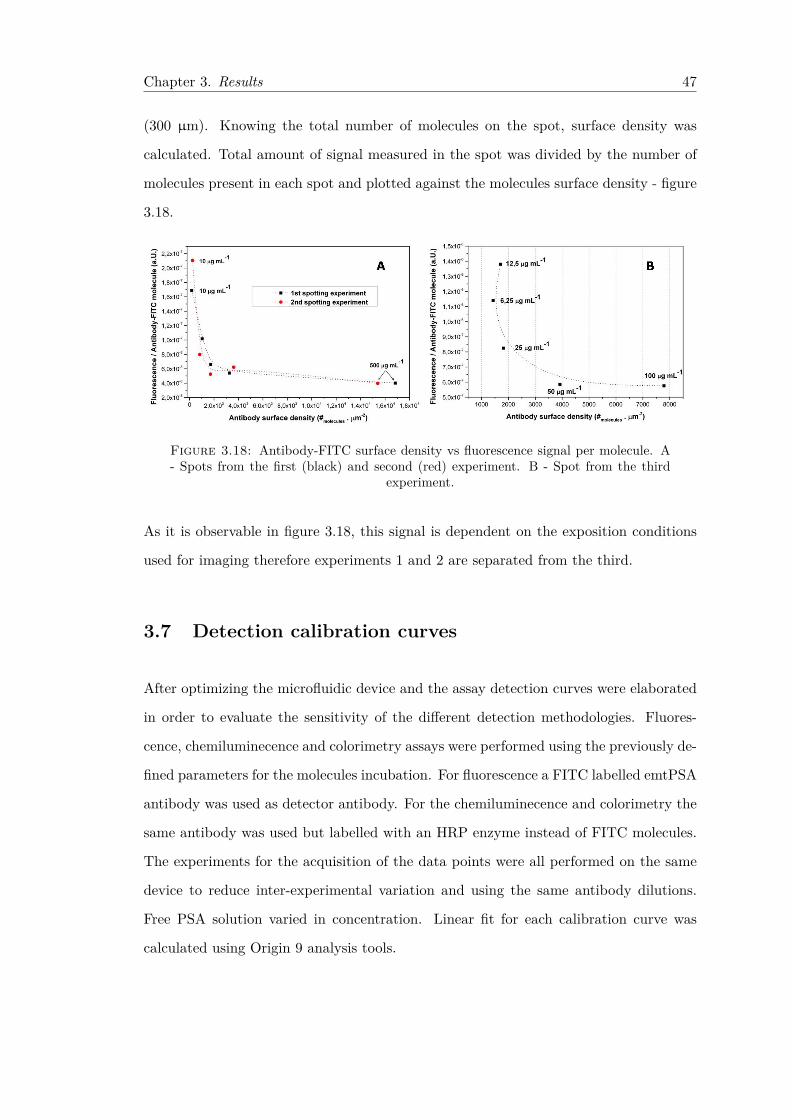
Chapter 3. Results 47
(300 µm). Knowing the total number of molecules on the spot, surface density was
calculated. Total amount of signal measured in the spot was divided by the number of
molecules present in each spot and plotted against the molecules surface density - figure
3.18.
Figure 3.18: Antibody-FITC surface density vs fluorescence signal per molecule. A- Spots from the first (black) and second (red) experiment. B - Spot from the third
experiment.
As it is observable in figure 3.18, this signal is dependent on the exposition conditions
used for imaging therefore experiments 1 and 2 are separated from the third.
3.7 Detection calibration curves
After optimizing the microfluidic device and the assay detection curves were elaborated
in order to evaluate the sensitivity of the different detection methodologies. Fluores-
cence, chemiluminecence and colorimetry assays were performed using the previously de-
fined parameters for the molecules incubation. For fluorescence a FITC labelled emtPSA
antibody was used as detector antibody. For the chemiluminecence and colorimetry the
same antibody was used but labelled with an HRP enzyme instead of FITC molecules.
The experiments for the acquisition of the data points were all performed on the same
device to reduce inter-experimental variation and using the same antibody dilutions.
Free PSA solution varied in concentration. Linear fit for each calibration curve was
calculated using Origin 9 analysis tools.

Chapter 3. Results 48
3.7.1 Fluorescence curve
For the elaboration of this curve, three different areas of the channel were measured and
a mean and standard deviation calculated for each concentration point. Full graphic
presented is in figure 3.19 in a graphic.
Figure 3.19: Fluorescence calibration curve using a full sandwich fPSA assay withfluorescence detection method. A linear fit curve was calculated for low concentrations
(≤ 50 ng mL−1). The dotted line is just an eye guideline.
Having in mind the goal of defining an LoD and LoQ for our system decreasing values
of concentration were tested until there was no clear difference between the control
(no analyte) and the lowest concentration tested. The linear fit, even though with a
low R2, provide us the slope of for the low concentrations. For this goal only analyte
concentrations under 50 ng mL−1 were consider for the linear fit calculation. The reason
for this is because the systems signal to concentration response is not linear due to signal
saturation and also do to the modifications made on the signal by manipulations of the
imaging parameters (gains, exposition, gamma). For this reason, a polynomial fit would
be the most appropriate for the graphic’s characterization. However for a polynomial
fit, a larger range of concentrations would need to be measured and included. Since the
goal is access LoB’s, LoD’s and LoQ’s, focus was made on the lowest concentrations and
a linear fit adjusted to these.

Chapter 3. Results 49
3.7.2 Chemiluminescence curve
The chemiluminescence curve was projected with the same conditions used for the fluo-
rescence. Three images were taken from the channel and mean and standard deviation
calculates.
Figure 3.20: Chemiluminescence calibration curve using a full sandwich fPSA assaywith HRP labelled detector antibody and luminol as detection substrate. A linear fitcurve was calculated for low concentrations (≤ 50 ng mL−1). The dotted line is just
an eye guideline.
The same protocol used for the fluorescence analysis was applied to the chemilumi-
nescence results. Preliminary experiment lead to the belief that even though chemi-
luminescence was an accurate method, it did not possess enough sensitivity for the
concentrations of interest (1-10 ng mL−1). Higher concentrations were then measured
however the experiment for 100 ng mL−1 failed and the result was treated as an outlier
due to the fact that in the imaging process there was no signal.
3.7.3 Colorimetry curve
The colorimetry curve was measured in two different devices. In the microscope, just
as the fluorescence and chemiluminescence assays, and using the bottom light source at
maximum intensity and fully open condenser, pictures were taken of the transmission

Chapter 3. Results 50
plus a control (clear channel) in order to calculate the absorbance of the TMB reaction
product. Results presented in figure 3.21.
Figure 3.21: Colorimetry calibration curve using a full sandwich fPSA assay withHRP labelled detector antibody and TMB as detection substrate. Signal detection wasmeasured through a microscope. A linear fit curve was calculated for low concentrations
(≤ 50 ng mL−1). The dotted line is just an eye guideline.
After all the measurements, transmission results were converted to absorbance by nor-
malization with the maximum signal captured through a clear channel. This maximum
signal would correspond to the absorbance minimum. Assuming this, all other acquired
measurements (including the blank) were subtracted to this maximum signal value.
This difference between the two represents the amount of signal absorbed by the TMB
precipitate on the channel.
The colorimetry assay was also measured in a-Si:H photodiodes. The microfluidic de-
vice was aligned on top of a PCB wirebonded to the PD’s. This PCB plugged to a
picoammeter for current measurements. On top of this assembly, a light source is placed
directly on top of the photodiodes, and the amount of light transmitted through each
microfluidic channel to the PD is measured in current density - Figure 3.21.
3.7.4 Limits of detection
After linear fit was performed, line parameters and standard deviations were used for the
calculation of the LoB (limit of blank), LoD (limit of detection), LoQ (limit of quality).

Chapter 3. Results 51
Figure 3.22: Colorimetry calibration curve using a full sandwich fPSA assay withHRP labelled detector antibody and TMB as detection substrate. Signal detection wasmeasured through PD’s connected to a picoammeter. A linear fit curve was calculated
for low concentrations (≤ 50 ng mL−1). The dotted line is just an eye guideline.
The formulas used for the calculation of all three parameters are listed below:
• LoB = Meanblank + 1.645 * (SDblank)
• LoD = ((3.3 * SDblank) - intercept) / slope
• LoQ = ((10 * SDblank) - intercept) / slope
Following the previous formulas, these parameters were calculated for the three detection
methodologies and results are presented in table 3.1.
Table 3.1: Calculated values for LoB, LoD and LoQ for the three detection methods.Colorimetry assay was measured both in microscope (M) and photodiodes (PD).
ParametersLoB (measument units) LoD (ng mL−1) LoQ (ng mL−1)
Fluorescence 5.31 2.30 15.32Chemiluminescence 1.38 2.44 13.81Colorimetry (M) 5.41 0.10 3.10Colorimetry (PD) -0.421 0.062 0.187
All values used for these calculation came from the results used to build figures 3.19,
3.20, 3.21 and 3.22 and formulas in 3.7.4. Nevertheless all the data for each calibration

Chapter 3. Results 52
curve was performed on the same day and on the same device. Inter-day and inter-device
experiments should be performed in order to assess more reliable detection limits.
3.8 Integration with photodiodes
For the integration of the microfluidic device with photodiodes, a PCB was milled in
order to allowed for the microfluidic device to slide in and minimize the distance between
the photodiodes (already attached in a pocket previously made on the PCB) and the
microchannel area to be measured.
Figure 3.23: Assembly of PCB with wirebonded photodiodes with a microchannelaligned on top of the PD’s. A - Microfluidic device on top of the PD’s; B - PD’s mi-croscopy photograph; C - Microchannel with TMB precipitate microscopy photograph.
The previous figure shows the assembly required to make measurements of microfluidic
assays on PDs. These PDs are 100 x 100 µm in size, while the microchannel has a
300 µm width, ensuring that all of the diode gets covered by the microchannel. This
is particularly important for the colorimetry detection, since no light should reach the
PD without going through the microchannel to ensure the absorbance ratio of the TMB
precipitate is taken into account.

53

Chapter 4
Discussion and Conclusions
4.1 Discussion
4.1.1 Optimization steps
Glass was chosen as the substrate of choice for the following reasons: the antibodies
presented roughly the same adsorption efficiency as in PDMS (the other possibility as
substrate); it provided an easy to slide base for the integration of the device with a
detection platform. This allows the assay to be performed in the same substrate which
will directly slide and align with the PD’s for integrated detection.
The capture antibody concentration was tested having in mind two goals: full surface
coverage and minimum concentration required to do so. The results presented in figure
3.2 show the fluorescence signal for increasing concentration of IgG on the channel
surface. A reverse experiment is also plotted in which channel was first covered with
unlabelled IgG and then BSA-FITC was flown. Around 100 µg mL−1, the fluorescence
signal reaches a plateau. This is proof that the surface gets saturated and molecules are
no longer able to adsorb ending up being washed out of the channel. Therefore 100 µg
mL−1 of antibody was defined as the standard concentration for the capture antibody
incubation solution. The presence of such a high fluorescence signal in the BSA-FITC
experiment even after full surface coverage by IgG is due to the fact that BSA (66.5 kDa)
54

Chapter 4. Discussion and Conclusions 55
is several times smaller then IgG (150 kDa) and fills the spaces left between antibodies
on the surface. This is ideal as it provides a full coverage of the surface.
Incubation time for antibodies was set at 10 minutes since this time frame presented a
similar fluorescence signal to the 15 minutes incubation experiment. However the aim
is to reduce time and reagent.
The flow rates were tested and the highest (0.5 µL min−1) was chosen since it presented
the highest signal after 10 minutes of incubation of IgG-FITC. Higher speed were not
tested since the goal was to cause the least disturbance on the system. The flow rates
tested aimed at refreshing the antibody concentration inside the channel as the molecules
start to adsorb to the channel surface. At 0.5 µL min−1 the whole microchannel volume is
refreshed every 8.3 seconds. This means that over the course of 10 minutes of incubation
the channel will be filled with a solution of 100 µg mL−1 of antibody about 72 times.
BSA and SSDNA presented similar efficiencies in terms of blocking. However in the tar-
get specific experiment (figure 3.5 - blue and green) BSA demonstrated a slightly better
efficiency. This difference may be due to a better blocking efficiency of the BSA, or the
SSDNA demonstrating some unspecific interactions to antibodies due to intermolecular
forces: ionic interaction; hydrogen bonding; hydrophobic interactions. This leads to the
use of BSA as blocking agent.
A set of control experiments is presented for the blocking methodology as a proof of con-
cept for the blocking in the developed assay - figure 3.6. The emtPSA-HRP experiment
obviously presented the highest signal since it did not have any molecules restricting the
adsorption to the channel surface. The BSA and SSDNA channels were not incubated
with any detection molecule and as such they only presented background equivalent
signal. Running the detector after the two blocking molecules proved the efficiency of
the blocking methods, as seen in the huge signal reduction when compared to the non
blocked channel.
Further ahead in the project came the need to test a different blocking agent - casein
- due to its reputation as a excellent blocking agent. However the results on figure

Chapter 4. Discussion and Conclusions 56
3.7 show that 4 % BSA alone is a better channel blocker than any other methodology,
including a 50-50 % mixture of 200 µg mL−1 and 4 % BSA.
The blocking solution incubation time was also assessed as shown in figure 3.8. The
5 minute incubation experiment presents the lowest signal therefore it was the chosen
time for the BSA incubation in the sandwich assay. Other incubation time frames could
have been tested but the 0.7 a. U. signal is practically equivalent to background noise,
therefore there is no need to increase the assay time further.
The need for a blocking agent and its effect on a fully covered surface was tested - Figure
3.9 - with various BSA concentrations. The results clearly indicate there is a great need
to block the surface with a smaller molecule even after full surface coverage by a capture
antibody.
The washing solution flow rate was tested to evaluate its efficiency. Results show no
relevant difference between the three flow rates tested. Because of this, the lowest flow
rate was chosen as the standard washing speed as there is less reagent waste and less
stringency applied to the system.
PSA antibodies control experiments - figure 3.11 - were made to ensure the reliability
of the system’s output. This is a proof of concept for our sandwich system. The con-
trols demonstrated a good reliability of the system. The incubation of capture antibody
demonstrated no signal at all since there was no HRP inside the channel. The incu-
bation of the emtPSA-HRP directly on the surface exhibited a very high signal since
the channel was fully covered with HRP labelled antibody. The blocking of the surface
with BSA previously to the incubation of the detector antibody proved to be efficient
minimizing the binding of the detector antibody in the channel. Incubating capture
antibody followed by detector, without a blocking step, demonstrated the importance
of the blocking step by showing a higher signal than the experiment with blocking step
in between the antibodies incubation. This also proves the surface was already occu-
pied with the capture antibody, and the amount of free space for the detector antibody
to bind was reduced since the signal is much lower than the experiment in which the
detector was incubated on the empty channel.

Chapter 4. Discussion and Conclusions 57
The data acquisition experiments - figure 3.13 - allowed to conscientiously choose the
best parameters in order to have the highest signal possible without capping our concen-
tration limit or bleaching the fluorescence signal. The conditions chosen were 1 second
of exposure, 1 gain and 0.6 of gamma. By having no gain amplification in the signal,
introduction of unwanted signal distortion is avoided.
Colorimetry detection method required one extra step in the optimization process. The
parameters for TMB flow and also region on the channel measure introduce variation
to the final signal acquired. Therefore these were optimize in order to have the most
sensitivity to the concentrations of interest (1 to 4 ng mL−1). TMB was flown in the
channel and signal measured in 3 different areas from 30 seconds to 7 minutes of in-
cubation: The inlet side measured was located 2 mm away from the inlet; the middle
section was 5 mm away from inlet and outlet; the outlet side was 2 mm away from the
outlet. Results in figure 3.14 clearly depict a difference in the absorbance value acquired
between the 3 locations. Since the substrate is enzymatically converted as soon as it
enters the channel, this affects the concentration of the substrate solution that will reach
the channel areas further away from the inlet and at the same time leads to an increased
accumulation of product from the reaction near the inlet of the channel. Therefore it
becomes important to define the exact location of the microchannel to measure as well
as the time of incubation and flow rate whilst the TMB incubation. It is necessary
to guarantee that each time TMB is flow, the same amount of substrate reaches the
defined measurement area during the same amount of time. Ideally, the absorbance
signal should be as high as possible to increase assay sensitivity. However since there is
a tendency for the formation of aggregates near the holes (due to the disruption of small
PDMS pieces from the punched hole) a safe distance of 2 mm was established in order
to avoid interference from said aggregates formation. There seems to be a saturation of
the absorbance after 3 minutes of TMB incubation at 10 µl min−1. Just so these were
the TMB incubation parameters established for the colorimetry substrate incubation.

Chapter 4. Discussion and Conclusions 58
4.1.2 Spotting experiments
Spotting assay comprised two goals. First, to prove the possibility of having a single
channel covered with different capture antibodies in clearly defined areas. Also the
concentration calibration performed allowed for the characterization of the molecules
distribution on the adsorbed surface.
Even though figure 3.16 inset graph shows there is a greater homogeneity in spots size,
in the first and second experiment when compared to the third, the antibody adsorption
to the channel was not as homogeneous - figure 3.17. This is most likely due to the
evaporation time. The third experiment solutions possess 5 % glycerol which prevent
the fast evaporation of the molecules allowing for a more homogeneous adsorption to
the surface.
In all three spotting experiments there is a clear tendency to have a diminished value of
fluorescence per molecule when the amount of molecules on the surface (antibody surface
density) increases. This is probably due to the fact that molecules packed together will
end up muffing the neighbour molecules signal. It would be useful to predict the signal
per molecule and use this value to calculate the surface density of molecules in the sand-
wich assay through the detected fluorescence signal. However an absolute fluorescence
value for a single antibody-FITC can not be defined since this muffing effect will alter
the signal detected depending on the same physical magnitude trying to be measured
- antibody surface density. Nevertheless for the calculation of a single antibody-FITC
signal, having in mind the muffling effect, the use of the lowest concentration possible
would be the most correct since there are fewer molecules in the system interfering with
the emitted fluorescence.
4.1.3 Detection Calibration Curves
The calibrations curves were used to try and define the limits of detection of the system
as well as the system’s sensitivity.

Chapter 4. Discussion and Conclusions 59
In table 3.1 the detection limits calculated for all three detection methods using the
microscope are presented. Chemiluminescence presents the highest values for LoD and
LoQ, however it presents a low LoB. LoB is not comparable since this is value is presented
in a.U. and imaging methodologies differ for the three methodologies. This detection
method seems to need the implementation of an amplification methodology that would
greatly increase the signals detected. Using a biotin-streptavidin amplification system,
this technique could easily become sensitive enough for the measurement of the concen-
trations of interest (1-4 ng mL−1) mostly due to the very low LoB. Fluorescence shows
LoD and LoQ similar to the chemiluminescence detection. Further optimization of this
assay is required mostly to try and decrease the LoB value which would muffle the low
concentration signals.
By the calculated figures colorimetry seems to be the most sensitive method. However
further repetitions of the assay would be necessary to ensure this premise. The standard
deviation for the blank using colorimetry detection was in fact the lowest of the three
methods. Such a low SD values indicate colorimetry is most likely the most reproducible
and reliable detection system.
Colorimetry measured in the microscope presents the highest slope which means that it
possesses the largest signal change per analyte quantity. Slope values cannot be com-
pared between the PD and microscope measurements because of the different magnitudes
measured (current density and a.U. respectively). Nevertheless a high resolution in the
lower concentration values is observable for the colorimetry detection using the PD’s.
This strengthens the idea of colorimetry as the most reliable method. The fact that the
TMB flowing conditions can be adapted to more assertively measure different ranges of
concentrations is also a positive argument in favor of colorimetry. The PD results for
the colorimetry have little relevance in terms of LoD and LoQ calculation due to the
fact that only one measurement was made for each concentration. This measurement
is the result of a mean from the values acquired over a minute after the TMB flow was
stopped. Therefore the standard deviation calculated is associated with the measuring
device error (picoammeter). Another colorimetry curve was measured on the PD but
Chapter 4. Discussion and Conclusions 60
different illumination set ups were used, and therefore these cannot be used for means
and SD calculations.
All in all none of the detection methods was precise enough to reach the predetermined
goal of clinically relevant concentrations for the f-PSA molecule. However colorimetry
seems to show great promise. A possible optimization would be the introduction of an
amplification system which would greatly benefit the chemiluminescence and colorimetry
detections. This indicates that enzymatic assays reveal more sensitive detection than
the fluorescence method. Colorimetry can even benefit from a time based analysis to the
increase in absorbance over time during the TMB incubation. A regression can be fit
into the increasing absorbance values during the TMB incubation. Linear fits of these
regressions with different slops can be translated into concentrations.
The microfluidic device was align on top of the photodiodes by using one of the sides of
the glass against a previously made groove on the PCB. However this only provided the
alignment of one axis, being the second axis align by hand with the help of a magnifying
glass. The integration of the device with the photodiodes can be greatly improved by
developing a simple groove to slide the microfluidic device in and instantly align the
microchannel with the photodiodes.
4.2 Conclusions
Throughout this work it was demonstrated that biomolecules can be adsorbed on PDMS
microchannel with a glass substrate. This allows for an ELISA to be performed in mi-
croscale under 45 minutes with minimum molecule consumption. Molecule incubation
parameters were optimized for the detection of low concentrations of fPSA. Spotting ex-
periments demonstrated the possibility of sectioning a microfluidics device with different
capture antibodies for various PCa biomarkers. This raises the possibility of measuring
different analytes and cross-check results of the different molecules for a more accurate
diagnosis. An aqueous two-phase system could be implemented for proteins extraction.
In an attempt to decrease the assay time, molecules could be premixed with each other
(e.g. capture antibody mixed with BSA) in order to decrease incubation time. The

Chapter 4. Discussion and Conclusions 61
measurements using photodiodes show the sensitivity of this biosensor to the enzymatic
assay. The integration of PD detection eliminates the need for peripheral equipment,
such as the microscope, allowing for the design of a miniature PoC device. All the detec-
tion methods were successfully integrated with the assay. To measure the fluorescence
assay on the PD, a special filter (to cut the excitation light) needs to be deposited over
the PD. This filter adds an extra number of steps to the microfabrication process of the
PD. Chemiluminescence presents a further advantage for the PoC device development
because it does not require a light source to be integrated into the system. A microfluidic
capillary system can be implemented, eliminating the need for external pumps.

62

Bibliography
[1] September 2014. URL http://pubs.rsc.org/en/Content/ArticleLanding/
2012/LC/c2lc20893h.
[2] September 2014. URL http://www.lasx.com/gallery/medical-applications/
micromed-solutions/ativa-micro_web/.
[3] D. Huckle. Point-of-care diagnostics: an advancing sector with nontechnical issues.
Expert Rev Mol Diagn, 8:679–688, 2008.
[4] Desmulliez M.P.Y Mohammed, M. Lab-on-a-chip based immunosensor principles
and technologies for the detection of cardiac biomarkers: a review. Lab Chip, 11:
569–595, 2011.
[5] Kadimisetty K. Faria R. Rusling J.F. Sardesai, N.P. A microfluidic electrochemilu-
minescent device for detecting cancer biomarker proteins. Anal Bioanal Chem, 406:
3831––3838, 2013.
[6] Goryll M Sin L.Y.M. Wong P.K. Chae J. Choi, S. Microfluidic-based biosensors
toward point-of-care detection of nucleic acids and proteins. Microfluid Nanofluid,
10:231––247, 2011.
[7] R. Mariella Jr. Sample preparation: the weak link in microfluidics-based biodetec-
tion. Biomed Microdevices, 10:777––784, 2008.
[8] Sullivan B.D. Mifflin R.L. Esener S.C. Heller M.J. Krishnan, R. Alternating current
electrokinetic separation and detection of dna nanoparticles in high-conductance
solutions. Electrophoresis, 29:1765––1774, 2008.
63

Bibliography 64
[9] Wilson J.A. Oakes S.G. Chiu S. Williams J.C. Pearce, T.M. Integrated microelec-
trode array and microfluidics for temperature clamp of sensory neurons in culture.
Lab Chip, 5:97––101, 2005.
[10] Chamberlain M.D. Barbulovic-Nad I. Wheeler A.R. Bogojevic, D. A digital mi-
crofluidic method for multiplexed cell-based apoptosis assays. Lab Chip, 12:627–
–634, 2012.
[11] Haeberle S. Roth G. von Stettenz F. Zengerle R. Mark, D. Microfluidic lab on
chip platforms: requirements, characteristics and applications. Chem. Soc. Rev.,
39:1153––1182, 2010.
[12] H. Kalish. Application of micro-fluidic devices for biomarker analysis in human
biological fluids, biomedical engineering. Research and Technologies, pages 122–
–135, 2011.
[13] Linder V. Sia S.K. Chin, C.D. Commercialization of microfluidic point-of-care
diagnostic devices. Lab Chip, 2012.
[14] R. Devarajan. Emerging urinary biomarkers in the diagnosis of acute kidney injury.
Expert Opin Med Diagn., 2:387––398, 2008.
[15] Nam Huh Suhyeon Kim Jeong-Woo Choib Jeong-Gun Lee, Kwang Ho Cheong and
Christopher Koa. Microchip-based one step dna extraction and real-time pcr in one
chamber for rapid pathogen identification. Lab Chip, 6:886––895, 2006.
[16] Prazeres D.M.F. Chu V. Conde J.P. Novo, P. Microspot-based elisa in microflu-
idics: chemiluminescence and colorimetry detection using integrated thin-film hy-
drogenated amorphous silicon photodiodes. Lab Chip, 10:777––784, 2011.
[17] González-Guerrero A.B. Dante S. Osmond J. Monge R.-Fernández L.J. Zinoviev
K.E. Domínguez C. Lechuga L. M. Duval, D. Nanophotonic lab-on-a-chip platforms
including novel bimodal interferometers, microfluidics and grating couplers. Lab
Chip, 12:1987––1994, 2012.

Bibliography 65
[18] Didar-T.F. Veres T. Tabrizian M. Foudeh, A.M. Microfluidic designs and techniques
using lab-on-a-chip devices for pathogendetection for point-of-care diagnostics. Lab
Chip, 12:3249––3266, 2012.
[19] V. Jarrige. The need for a lower total psa cut-off value with psa assays calibrated
to the new who standard. 2007.
[20] Radcliffe-C.M. Barrabés S. Ramírez M. Aleixandre R.N. Hoesel-W. Dwek R.A
Rudd1 R.M. Peracaula R. de Llorens R. Tabarés, G. Different glycan structures
in prostate-specific antigen from prostate cancer sera in relation to seminal plasma
psa. Glycobiology, 16:132––145, 2006.
[21] Catto-J.W.F. Ward, M.A. and F.C. Hamdy. Prostate-specificantigen: biology, bio-
chemistry and available commercial assays. Ann.Clin. Biochem., 38:633––651, 2001.
[22] D.J. Heston W.D.W. Keefe. D.S.O., Bacich. Comparativeanalysis of prostate-
specificmembrane antigen (psma) versus a prostate-specific membrane antigen-like
gene. The Prostate, 58:200–210, 2004.
[23] Mucci L.A. Wilson K.M. Kraft P. Penney K.L. Stampfer-M.J. Giovannucci E. Shui,
I.M. Common genetic variation of the calcium sensing receptor and lethal prostate
cancer risk. Cancer Epidemiol Biomarkers Prev., 22:118––126, 2013.
[24] Gu Z. Watabe T. Thomas G. Szigeti K. Davis-E. Wahl M. Nisitani S. Yamashiro
J. Le Beau M.M. Loda M. Witte O.N. Reiter, R.E. Prostate stem cell antigen:
A cell surface marker overexpressedin prostate cancer. Proc. Natl. Acad. Sci., 95:
1735––1740, 1998.
[25] Gu J. Yoshida T. Wu X. Saeki, N. Prostate stem cell antigen: A jekyll and hyde
molecule? Clin Cancer Res, 16:3533–3538, 2010.
[26] Yao X.D. Cao, D.L. Advances in biomarkers for the early diagnosis of prostate
cancer. Chin J Cancer, 29:229–233, 2010.
[27] Judy Gibbs. Selecting the Detection System - Colorimetric, Fluorescent, Lumines-
cent Methods ELISA Technical Bulletin.

Bibliography 66
[28] Tao S. Bova G.S. Liu A.S. Chan D.W. Zhu-H. Zhang H. Li, Y. Detection and verifi-
cation of glycosylation patterns of glycoproteins from clinical specimens using lectin
microarrays and lectin-based immunosorbent assays. Anal. Chem., 83:8509––8516,
2011.
[29] Mikolajczyk SD Partin AW. Rittenhouse HG1, Finlay JA. Human kallikrein 2 (hk2)
and prostate-specific antigen (psa): two closely related, but distinct, kallikreins in
the prostate. Crit Rev Clin Lab Sci, 35:275–368, 1998.
[30] Cooperberg M.R. Cary, K.C. Biomarkers in prostate cancer surveillance and screen-
ing: past, present, and future. Ther Adv Urol, 5:318––329, 2013.
[31] Dosev D. Davies A.E. Gee S.J. Kennedy I.M. Hammock-B.D. Nichkova, M. Quan-
tum dots as reporters in multiplexed immunoassays for biomarkers of exposure to
agrochemicals. Anal Lett., 40:1423––1433, 2007.
[32] Gitlin I. Stroock A.D Whitesides G.M. Ng, J.M.K. Components for integrated
poly(dimethylsiloxane) microfluidic systems. Electrophoresis, 23:3461––3473, 2002.
[33] Kwon K.W. Park M.C. Lee S.H. Kim S.M. Suh-K.Y. Kim, P. Soft lithography for
microfluidics: a review. Biochip Journal, 2:1–11, 2008.
[34] Ho C. Wong, I. Surface molecular property modifications for poly(dimethylsiloxane)
(pdms) based microfluidic devices. Microfluid Nanofluidics, 7:291––306, 2009.
[35] Terry Pry David A Armbruster. Limit of blank, limit of detection and limit of
quantitation. Clin Biochem Rev, 29, 2008.