optimization of photocatalytic removal of … 2012 world congress on advances in civil,...
TRANSCRIPT

The 2012 World Congress on Advances in Civil, Environmental, and Materials Research (ACEM’ 12)Seoul, Korea, August 26-30, 2012
Optimization of photocatalytic removal of phenazopyridine an analgesic drug from water using ceramic coated TiO2
nanoparticles
*Alireza Khataee1) Mehrangiz Fathinia2) Nasrin Nosrati3) Farzaneh Farshbaf4)
1), 2) , 3) , 4) Department of Applied Chemistry, Faculty of Chemistry, University of
Tabriz, Tabriz, Iran +98 411 3393165 IRAN
[email protected]; ([email protected])1)
ABSTRACT The photocatalytic degradation of Phenazopyridine (PhP) in water on
supported TiO2 nanoparticles was carried out in a rectangular flat–plate photoreactor. Optimization of photocatalytic degradation of PhP under UV light irradiation using immobilized TiO2 nanoparticles in a rectangular photoreactor was studied. The effect of operational parameters was investigated and optimized using central composite design (CCD). Predicted values of color removal efficiency were found to be in good agreement with experimental values (R2=0.958 and Adj–R2=0.924). The results of the optimization showed that maximum removal efficiency was achieved at the optimum conditions of: initial drug concentration 10 mg/L, UV light intensity 47 W/m2, flow rate 200 mL/min, reaction time 120 min. According to the achieved results from optimization step in order to justify the effect of flow rate on removal efficiency the residence time distribution (RTD) was studied. The tracer (PhP) pulse injection response studied with UV-Vis measurements and was used to measure RTD curves. The flow pattern inside the photoreactor was revealed by liquid residence time distribution (RTD) curves in each flow rate. 1. Introduction
Waste pharmaceutical disposal procedure involve a number of traditional techniques, such as sewer and incineration (Zyoud, Zaatar, Saadeddin, Cheknane, DaeHoon, Campet and Hilal, 2010). Despite the widespread utilization of these techniques, they do not help remove drugs from contaminated waters. Waste drugs are flow into water through wastewaters or direct disposal of pharmaceutical producers. Such processes could be hazardous and cause important water contamination. Therefore, strategies should be adopted to prevent disposing waste drugs into wastewater before suitable treatment (Hilal, Al-Nour, Zyoud, Helal and Saadeddin, 2010, Huerta-Fontela, Galceran and Ventura, 2011). New techniques are thus needed to completely mineralize drugs disposed in water at large scale. The heterogeneous photocatalytic process

could be the ideal technique to degrade drugs like other organic contaminants. TiO2 is the most widely studied system for such purposes due to its high stability, low cost, high oxidizing power and non-hazardous nature (Khataee and Kasiri, 2010). When the semiconductor, TiO2, is illuminated with λ < 390 nm light, an electron excites out of its energy level and consequently leaves a hole in the valence band. As electrons are promoted from the valence band to the conduction band, they generate electron–hole pairs. These charges can either recombine or participate in different reactions (Khataee,Fathinia and Aber, 2010). Many studies have focused on the chemical pathways or on the degradation kinetics, but there have been few reports based on the design of photocatalytic reactors (Sahle-Demessie,Bekele and Pillai, 2003). Using the rectangular reactor in this work the photocatalytic degradation of PhP is affected by factors such as initial concentration, light intensity, time and the flow rate which can be optimized. Optimization methods obtain better knowledge of the optimal operational parameters in photocatalytic process. Response surface methodology (RSM) is a mathematical and statistical tool to assess the effect of input variables on to an output response (here removal efficiency (RE))(Khataee,Fathinia,Aber and Zarei, 2010). Due to its capability of modeling various input factors to output responses, analyzing the interactions amongst factors, and determining the optimum region of the factors level, it has been widely employed in optimizing and modeling of various photocatalytic processes (Choon Yoong,Nyuk Ling,Yus Aniza,A.T. and Chung Lim, 2012). It is specifically useful for experimental design with more than two factors because RSM lessen the number of experiments and find fitted relationship among variable factors. The variable correlation obtained in equation form was employed to scale up process design (Marques,Vilareal,Alfaia and Ribeiro, 2007). The most commonly selected designs in RSM by researchers are the central composite design (CCD) and the Box–Behnken design. Herein, response surface methodology (RSM) was applied in order to obtain an optimum condition of photocatalytic degradation of PhP from water using a rectangular photoreactor.
In this work TiO2 nanoparticles was employed as an immobilized film due to the advantages of reactors operated with immobilized semiconductors (Fathinia, Khataee, Zarei and Aber, 2010, Sahle-Demessie,Bekele and Pillai, 2003). In photoreactors operated with TiO2 nanoparticles immobilized on the outer surface, the reaction rate is predominantly determined by the light intensity on the surface, the quantum efficiency of the catalyst, the adsorption properties of the reacting components in solution, and mass transfer from the bulk of the fluid to the catalyst surface (Khataee,Fathinia and Aber, 2010). However, little consideration has been given to the use of the RTD in investigating the performances of photoreactors. In the real world of chemical engineering, the manner of the reactors is often very different from that to the ideal reactors (the perfectly mixed, batch, the plug flow tubular and the perfectly mixed continuous tank reactors) (Sahle-Demessie,Bekele and Pillai, 2003). The RTD of a reactor is a distinctive of the mixing that occurs in a chemical reactor. In most studies idealized plug flow or batch reactors are used, where all the flow elements in the reactor have the same residence time. The RTD of a reactor is a characteristic of flow regime

that occurs in the chemical reactor, being one of the most informative characterizations of the reactor (Moreira,Pinto,Mesnier and Leclerc, 2007). The liquid RTD is important for accurate kinetic modeling of the system, and facilitating reactor design to achieve or preserve a desired flow pattern. Also RTD allows for a more thorough comparison between systems with different zones of the reactor and represent a tool in successful process scale–up (Fogler, 1992). Comparison of the measured RTD with that of an ideal reactor allows the process engineer to diagnose the flow pattern and regime of flow in the reactor (Waje,Patel,Thorat and Mujumdar, 2007). Therefore, in this work, we first investigated the effect of operational parameters via RSM in the photocatalytic degradation of PhP at different initial concentrations of PhP, light intensity, time and flow rates in order to optimize the photocatalyrtic degradation process. Meanwhile, the following work aims to justify the optimized conditions of reactor flow rate via RTD analysis in the rectangular photoreactor.
2. Experimental 2.1. Materials PhP (C11H11N5.HCl, molar mass of 249.7 g/mol), is a commonly used analgesic drug in urinary tract treatment and other medical prescriptions. Its structure and characteristics are given in Table 1.
Chemical structure Molecular formula
Mw
)g/mol( maxλ(nm)
CAS number Trade name
C11H11N5.HCl 249.69
436
94-78-0 Pyridium
It was intentionally chosen here, duo to presence of the azo group which made it a stable compound to biodegradation and due to its known shape color which made it a suitable tracer here for RTD studies. PhP was purchased from pharmaceutical company in the tablet form (Iran). The investigated photocatalyst was TiO2 PC–500 (anatase>99%) (Millenium Inorganics, Brussels, Belgium) immobilized on ceramic plates. These characteristics were proved by our SEM and XRD analyses which have been shown in Fig.s 1 and 2.
Fig. 1 X–ray diffraction pattern of TiO2 PC–500
0
100
200
300
400
20 25 30 35 40 45 50 55 60 65 70 75 80 85
2 Theta
Cou
nts

2.2. Immobilization of TiO2 nanoparticles on ceramic plates TiO2 nanoparticles were fixed on the ceramic plates by sol-gel dip-coating
method. Organically modified silica (Ormosil) was used as hydrophobic binder. The immobilization procedure was reported elsewhere (Khataee,Zarei,Fathinia and Jafari, 2011). The main advantage of this kind of films is that: the use of binder removed the need for high temperatures which was provided by furnace; they have good mechanical anchoring due to the chemical bonding, in comparison with films made with the dried mixture of TiO2 and water. Fig. 2 shows the SEM images of the ceramic plate before and after immobilization of TiO2 nanoparticles on it. As shown in this Fig., the entire surface of the ceramic plate has been coated with TiO2 nanoparticles. The coated plates were thoroughly washed with deionized water for the removal of free TiO2 particles.
2.3. Photocatalysis experiments
The experimental set–up is based on a rectangular photocatalytic reactor of workable area 15 × 90 cm2, made out of stainless steel. The wastewater to be treated is falling as a thin film from the top of the chamber onto titanium dioxide nanoparticles immobilized on ceramic plates. The angle of slant was set at 5° to achieve a homogeneous distribution of the liquid. The sample to be treated (2000 mL of drug solution) was stored in a reservoir and was continuously circulated in the system by a peristaltic pump at adjustable flow rate. The reservoir was open to air to insure sufficient oxygenation. The solution in the reservoir was continuously stirred to keep the solution homogeneous. Artificial irradiation was provided by three 30 W UV–C lamp (Philips, the Netherlands) with peak intensity at 254 nm, positioned above the reactor. The lamps were turned on at the beginning of each experiment. The distance between the solution and the UV source was adjusted according to the experimental conditions. The radiation intensity was measured with a UV radiometer purchased from Cassy Lab Company (Germany). At different reaction times obtained with experimental design, 2 mL sample were taken and the remaining PhP was determined using a spectrophotometer at λmax= 429 nm and calibration curve. Using this method, the percent of removal efficiency (RE (%)) could be obtained. The RE (%) was expressed as the percentage ratio of removed drug concentration to that of the initial one.
Fig. 2 Scanning electron microscopy image of TiO2 nanoparticles immobilized onto ceramic plates

Fig. 3 The experimental set–up of rectangular photocatalytic reactor
2.4. Analytical procedures
The photocatalytic reactions were monitored by UV–Vis spectrophotometer (WPA lightwave S2000, England) in the range of 200–700 nm. Scanning electron microscopy (SEM) was carried out on a Cambridge SEM Model 360 (S–360, Link eXL–II, California, USA) device after gold–plating of the samples. To determine the crystal phase composition and average crystalline size of immobilized TiO2 nanoparticles sample, X–ray diffraction (XRD) measurements were carried out at room temperature by using Siemens X–ray diffraction D5000, with Cu Kα radiation. The accelerating voltage of 40 kV and emission current of 30 mA was used. The average crystalline size of the samples was calculated according to Debye–Scherrer formula (Yang and Zhu, 2005). It can be observed from Fig. 1 that the peaks in XRD are at 2θ =25.3°, 37.8°, and 48.1°, which corresponded to anatase form TiO2.
2.5. Experimental design
In the present study CCD was employed for optimization of photocatalytic removal process. In order to assess the effect of operating parameters on the photocatalytic removal efficiency of PhP, four main factors were chosen: initial drug concentration (mg/L) (X1), reaction time (min) (X2), UV light intensity (W/m2) (X3) and Flow rate (mL/min) (X4). A total of 31 experiments were employed in this work, including 24=16 cube points, 7 replications at the center point and 8 axial points. Experimental data were analyzed using Minitab 15 software. For statistical calculations, the variables Xi were coded as xi according to the following equation:
XXXx 0i
i δ−
= (1)
where X0 is the value of Xi at the center point and δX presents the step change (Zarei,Niaei,Salari and Khataee, 2010). It should be mentioned that preliminary experiments was performed to determine the extreme values of the variables.

2.6. Experimental conditions for RTD studies To characterize the liquid flow pattern in the photoreactor, the liquid residence
time distribution curves were determined at different flow rates of 50, 100, 150, 200 and 250 mL min–1. For this propose a pulse input of tracer (V=10 mL of C0 = 100 mg L–1 of PhP) at time t = 0 s was loaded to the initial path of the reactor (part A in Fig. 3), with a syringe. The tracer processed during the path of reactor at part (B) of Fig. 3. The samples were taken from the end path of reactor (part C in Fig. 3), at the regular time intervals only in one cycle, until the concentration of the tracer reached to near 0 mg L–1.in each flow rate. Then PhP outlet concentrations, [PhP]out (mg L–1), were measured and plotted as a function of time (see Fig.s 6(a-b)).
3. Results and discussion 3.1. CCD model and residuals analysis
The 4–factor CCD matrix and experimental results attained in the photocatalytic removal runs. The experimental data from the CCD was analyzed using response surface regression and fitted to a second-order polynomial model Eq. (2):
Y=b0 + b1x1 + b2x2 + b3x3 + b4x4 + b12x1x2 + b13x1x3 + b14x1x4 + b23x2x3 + b24x2x4 + b34x3x4 + b11
21x + b22
22x + b33
23x + b44
24x (2)
where Y is the predicted response of removal efficiency. The b0 is the intercept coefficient; bi are the linear coefficients, bii are the quadratic coefficients; bik are the interaction coefficients and xi are coded independent variables. The fitted second-order polynomial equation illustrating the removal efficiency using response surface analysis is given in Eq. (3).
Y=51.7316–5.9264x1+8.2773x2+3.6899x3+1.9234x4–0.6980x1x2+0.5595x1x3+1.1925x1x4+1.1856x2x3–0.0216x2x4–0.3872x3x4–3.1830
21x +1.1487 2
2x +0.5949 23x –1.2979 2
4x (3)
Photocatalytic removal efficiencies (RE (%)) have been predicted by Eq. (3). The Test for significance of the regression model is performed as an ANOVA procedure by calculating the F–ratio, which is the ratio between the regression mean square and the mean square error. The F–ratio, also called the variance ratio, is the ratio of variance due to the effect of a factor (in this case the model) and variance due to the error term. If the model is a good predictor of the experimental results, F–ratio should be greater than the tabulated value of F–distribution for a certain number of degrees of freedom in the model at a level of significance α. F–ratio obtained, 27.18, is clearly greater than the tabulated F (2.352 at 95% significance) confirming the adequacy of the model fits (Noordin,Venkatesh,Sharif,Elting and Abdullah, 2004). The ANOVA analysis also shows the Lack-of-Fit (LoF) of the test results, which can be used to investigate the model sufficiency. The F-value for lack of fit is greater than the tabulated F (2.352 at 95% significance) so it is not significant. Since the model have shown lack of fit to be insignificant, the response surfaces plot (Figs. 2

and 3) were sufficiently explained by equation, Eq. (3) (Marques,Vilareal,Alfaia and Ribeiro, 2007).
Additionally, checks need to be made in order to determine whether the model actually describes the experimental data. The checks performed here include determining the various coefficient of determination, R2. These R2 coefficients have values between 0 and 1. According to results achieved from ANOVA, Eq. (3) has a coefficient of determination (R2) of 0.958 (Noordin,Venkatesh,Sharif,Elting and Abdullah, 2004, Ribeiro,Afonso,Vila-Real,Alfaia and Ferreira, 2010). The coefficient of determination (R2) obtained for the above quadratic equation indicates that 95.82% of variation in removal efficiency can be explained by independent variables of initial PhP concentration (mg/L) (X1), reaction time (min) (X2), intensity (W/m2) (X3) and flow rate (mL/min) (X4). The p-value of (p ≤ 0.05) for any factor in the ANOVA test indicates a significant effect of the corresponding variable on the response. Regression analysis of the experimental data shows that the all of the operational parameters had significant linear effects on removal efficiency. This was evident from the p-value obtained from the regression analysis (Marques, Vilareal, Alfaia and Ribeiro, 2007). Just Initial concentration of PhP was found to have the negative linear effect of −5.9264 on removal efficiency. The insignificant terms can be removed from the RSM model. Finally the reduced and best fitted model for removal efficiency (RE (%)), developed from the regression procedure and supported by ANOVA is shown in coded form in Eq. (4).
Y=51.7316–5.9264x1+8.2773x2+3.6899x3+1.9234x4–3.1830 2
1x –1.2979 24x (4)
In addition to the above, the adequacy of the model is also investigated by the
examination of residuals (Ribeiro,Afonso,Vila-Real,Alfaia and Ferreira, 2010). The residuals, which are the difference between the respective, observe responses and the predicted responses are examined using the normal probability plots of the residuals and the plots of the residuals versus the predicted response. If the model is adequate, the points on the normal probability plots of the residuals should form a straight line. On the other hand the plots of the residuals versus the predicted response should be randomly scattered, that is, they should contain no obvious patterns (Noordin,Venkatesh,Sharif,Elting and Abdullah, 2004). The observed residuals are plotted against the expected values, given by a normal distribution (see Fig. 4). Styles observed in Fig. 4, reveal reasonably well–behaved residuals. Based on this plot, the residuals appear to be randomly scattered.

Fig. 4 Residual plots for photocatalytic removal efficiency of PhP.
3.2. Effect of variables as response surface and counter plots 3.2.1. Investigating the effect of UV light intensity
Fig. 5a demonstrate the effect of UV light intensity and reaction time on photocatalytic removal efficiency (RE (%)) for initial drug concentration of 15 mg/L and flow rate of 150 mL/min. As it is obvious from Fig. 5a, removal efficiency increased with increasing UV light intensity and reaction time. The reason of this observation is thought to the fact that UV light intensity determines the extent of light absorption by the photocatalyst to form electron–hole pairs which results in the overall pollutant conversion. In other words, higher light intensity provides higher energy for more TiO2 nanoparticles to produce electron–hole pairs (Fathinia, Khataee, Zarei and Aber, 2010, Khataee, Zarei, Fathinia and Jafari, 2011).
Fig. 5a The response surface and contour plots of photocatalytic removal
efficiency RE(%) as the function of reaction time (min) and UV light intensity (W/m2)
3.2.2. Investigating the effect of initial drug concentration
To study the effect of initial drug concentration on photocatalytic removal efficiency, the experiments were carried out with initial drug concentration varying from 5 to 25 mg/L at constant flow rate (150 mL/min) and UV light intensity (29 W/m2). The results were displayed in Fig. 5b. This Fig. shows that the photocatalytic removal efficiency decreases with an increase in the initial amount of PhP. This may be attributed to several factors. At high drug concentration, more and more molecules of the drug get adsorbed on the surface of the

photocatalyst. However, the formation of •OH and •O2– on the catalyst surface
remains constant for a given light intensity, catalyst amount and duration of irradiation. Hence, the available hydroxyl radicals are inadequate for the degradation of the drug at higher concentrations (Zarei,Khataee,Ordikhani-Seyedlar and Fathinia, 2010). Consequently, the degradation efficiency of the drug decreases as the concentration increases (Hilal,Al-Nour,Zyoud,Helal and Saadeddin, 2010).
Fig. 5b The response surface and contour plots of photocatalytic removal
efficiency RE(%) as a function of initial drug concentration (mg/L) and reaction time (min)
3.2.3. Investigating the effect of flow rate via RTD studies
Fig. 5c shows the response surface and contour plots of photocatalytic removal efficiency as a function of flow rate and reaction time. An improvement in photocatalytic removal efficiency with increasing flow rate has been observed. So in order to analyze the effects of liquid flow rates on RE (%) and characterize the liquid flow pattern profoundly, sets of the experimental measurements in the photoreactor without recirculation have been carried out to obtain hydrodynamic parameters under the different flow rates via RTD studies.
Fig. 5c The response surface and contour plots of photocatalytic removal
efficiency RE(%) as a function of flow rate (mL/min) and reaction time (min)
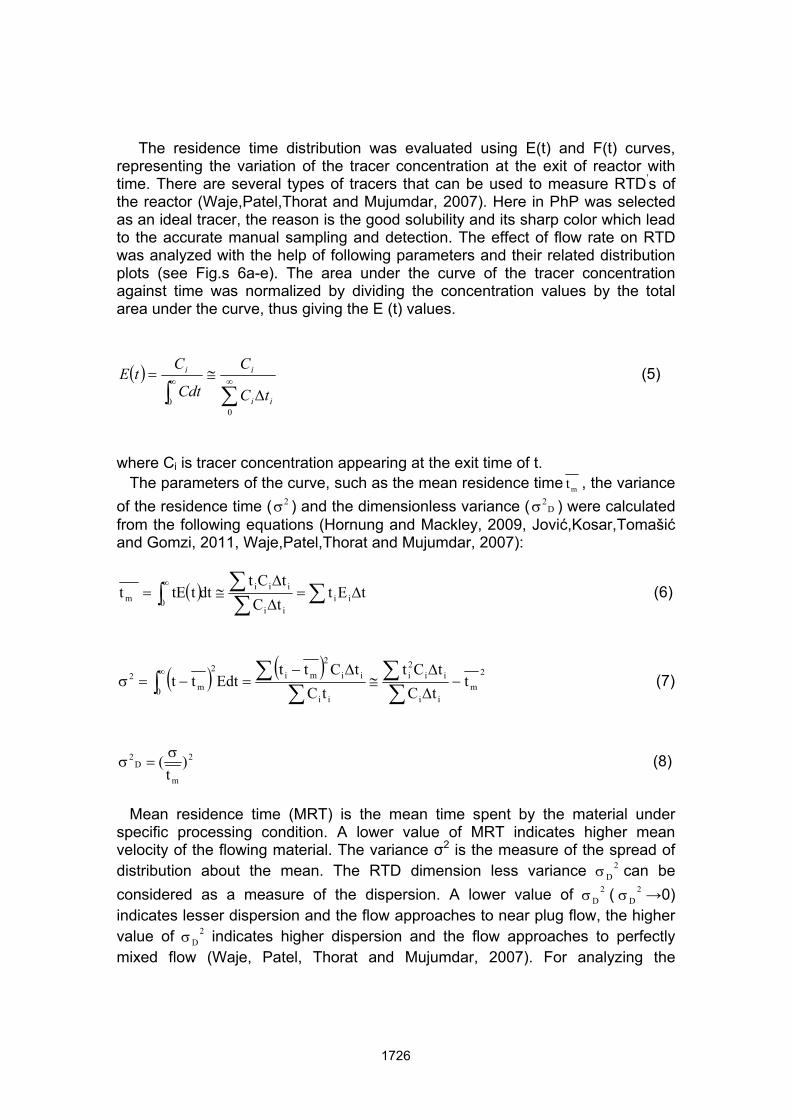
The residence time distribution was evaluated using E(t) and F(t) curves, representing the variation of the tracer concentration at the exit of reactor with time. There are several types of tracers that can be used to measure RTD’s of the reactor (Waje,Patel,Thorat and Mujumdar, 2007). Here in PhP was selected as an ideal tracer, the reason is the good solubility and its sharp color which lead to the accurate manual sampling and detection. The effect of flow rate on RTD was analyzed with the help of following parameters and their related distribution plots (see Fig.s 6a-e). The area under the curve of the tracer concentration against time was normalized by dividing the concentration values by the total area under the curve, thus giving the E (t) values.
( )∑∫∞∞
∆≅=
00 ii
ii
tC
C
Cdt
CtE (5)
where Ci is tracer concentration appearing at the exit time of t.
The parameters of the curve, such as the mean residence time mt , the variance of the residence time ( 2σ ) and the dimensionless variance ( D
2σ ) were calculated from the following equations (Hornung and Mackley, 2009, Jović,Kosar,Tomašić and Gomzi, 2011, Waje,Patel,Thorat and Mujumdar, 2007):
( ) ∑∑∑∫ ∆=
∆
∆≅=
∞tEt
tCtCt
dtttEt iiii
iii
0m (6)
( ) ( ) 2
mii
ii2i
ii
ii
2
mi2
0 m2 t
tCtCt
tCtCtt
Edttt −∆
∆≅
∆−=−=σ
∑∑
∑∑∫
∞ (7)
2
m
D2 )
t( σ=σ (8)
Mean residence time (MRT) is the mean time spent by the material under
specific processing condition. A lower value of MRT indicates higher mean velocity of the flowing material. The variance σ2 is the measure of the spread of distribution about the mean. The RTD dimension less variance 2
Dσ can be considered as a measure of the dispersion. A lower value of 2
Dσ ( 2Dσ →0)
indicates lesser dispersion and the flow approaches to near plug flow, the higher value of 2
Dσ indicates higher dispersion and the flow approaches to perfectly mixed flow (Waje, Patel, Thorat and Mujumdar, 2007). For analyzing the

performances of the non-ideal reactors it is usual to report RTD data either directly, or in relation with flow models. There are two types of models that may fit the experimental data of the residence time distribution of tracer flowing through a continuous system. These models are the multi-parameter models and the one-parameter models (Martin, 2000, Puaux,Bozga and Ainser, 2000). The multi-parameter models can be represented by the finite stage model whereas the one-parameter models can make use of the axial dispersion model and tanks-in-series model (Gavrilescu and Tudose, 1999, Kumar,Ganjyal,Jones and Hanna, 2008). To characterize quantitatively the RTD in the photoreactor the single parameter models were chosen in this work: the tanks-in-series model, where the real circulation loop is replaced by a series of consecutive, equal volume ideally stirred tank reactors, Neq, resulting in the same longitudinal mixing effect. The degree of mixing is characterized by the number of (Neq) and could be calculated according to equation (9), the larger the numbers of (Neq), the more the device approaches plug flow (Sahle-Demessie,Bekele and Pillai, 2003, van Houwelingen,van der Merwe,Wales,Heydenrych and Nicol, 2009, Waje, Patel, Thorat and Mujumdar, 2007). A lower value of Neq signifies that fewer tanks are able to fit the distribution, hence there is comparatively more mixing and the device approaches to mixed flow (Kumar,Ganjyal,Jones and Hanna, 2006).
2
2
eqNστ
= (9)
The variations in these four parameters ( mt , σ2, 2Dσ and Neq) due to the
change in operating conditions give rise to various degrees of mixing and differences in the corresponding flow patterns. In the present study, all RTD computations were conducted in MATLAB 6.5 (MathWorks, Natick, MA). In order to more closely investigate the effect of flow rate on the RTD performance all the RTD distribution curves are plotted vs. time data for each of the five rates on separate graphs as shown in Fig. 6(a-e). Each curve represents the complete set of data obtained by varying flow rate. The RTD results (see Fig.s 6(a-e)) reveals that in lower flow rates the flow pattern inside the photoreactor is an imperfect mixed flow regime and short-circuiting is present depending on the inlet flow rate. It is evident in the flow rate of 50 mL/min as there is an irregular peaks on the C(t) and E(t) curves.

Fig.6(a-e) Typical RTD curves at different flow rates of (a) 50; (b) 100; (c) 150; (d)
200 and (e) 250 mL/min
There is also a substantial tailing effect of the curve at the flow rate of 50 mL/min, with tracer concentrations still being measured at the residence time of 300 (s). These effects demonstrate that stagnant volumes are present resulting in dead-spaces and short-circuiting within the photoreactor in the low flow rates (Nauman and Buffham, 1983). A study by Alkhaddar et al (Alkhaddar, Higgins, Phipps and Andoh, 2001) presented a mathematical model incorporating bypass flow and stagnant zones. This was confirmed by an experimental investigation evaluating the bypass flows and stagnant zones for different flow rates. From Fig. 6(a-e), it could be observed that residence time distribution is different for different flow rates. The increase in flow rate results in decrease of mean residence time in the reactor. Generally MRT is the most common parameter of concern and is indicative of the average transient time of processing material.
0 50 100 150 200 250 3000
2
4
6
8
10
Time (s)
Con
cent
ratio
n (m
g/L)
0 50 100 150 200 250 3000
0.02
0.04
0.06
Time (s)
E(t)
(1/s
)
0 50 100 150 200 250 3000
0.5
1
1.5
2
Time (s)
tE(t)
0 50 100 150 200 250 3000
1
2
3
Time (s)
(t-tm
)2 E(t)
0 50 100 150 200 250 3000
2
4
6
8
10
Time (s)
Con
cent
ratio
n (m
g/L)
0 50 100 150 200 250 3000
0.002
0.004
0.006
0.008
0.01
Time (s)
E(t)
(1/s
)
0 50 100 150 200 250 3000
0.5
1
1.5
Time (s)
tE(t)
0 50 100 150 200 250 3000
10
20
30
Time (s)
(t-tm
)2 E(t)
0 50 100 150 200 250 3000
2
4
6
8
10
Time (s)
Con
cent
ratio
n (m
g/L)
0 50 100 150 200 250 3000
0.005
0.01
0.015
Time (s)
E(t)
(1/s
)
0 50 100 150 200 250 3000
0.5
1
1.5
2
2.5
Time (s)
tE(t)
0 50 100 150 200 250 3000
5
10
15
Time (s)
(t-tm
)2 E(t)
0 50 100 150 200 250 3000
2
4
6
8
10
Time (s)
Con
cent
ratio
n (m
g/L)
0 50 100 150 200 250 3000
0.005
0.01
0.015
0.02
Time (s)
E(t)
(1/s
)
0 50 100 150 200 250 3000
0.5
1
1.5
2
Time (s)
tE(t)
0 50 100 150 200 250 3000
5
10
15
Time (s)
(t-tm
)2 E(t)
0 50 100 150 200 250 3000
2
4
6
8
10
Time (s)C
once
ntra
tion
(mg/
L)
0 50 100 150 200 250 3000
0.01
0.02
0.03
0.04
Time (s)
E(t)
(1/s
)
0 50 100 150 200 250 3000
0.5
1
1.5
2
2.5
Time (s)
tE(t)
0 50 100 150 200 250 3000
1
2
3
4
Time (s)
(t-tm
)2 E(t)

The MRT changed with increasing flow rate. The value of MRT (or the area under the curve of tE(t) vs. time) was calculated with MATLAB according to Eq.(6), and the values of 176.45, 132.42, 105.22, 58.27 and 36 (s) was attained for flow rates of 50, 100, 150, 200 and 250 ml/min respectively. From these results it could be achieved that the tracer exits the reactor much quicker with increasing liquid flow rate and vice versa, the tailing effect become more pronounced at lower liquid flow rates. The response curves at higher liquid flow rates are became closer to plug flow than at lower liquid flow rates which will be justified by the value of ( 2
Dσ ). In the present study, the value of variance (or the area under the curve of (t- mt )2 E(t) vs. time was calculated with MATLAB according to Eq. (7). The values of 2
Dσ was calculated according to Eq. (8) and the following results 0.104, 0.066, 0.058, 0.0450 and 0.035 was attained for flow rates of 50, 100, 150, 200 and 250 ml/min respectively. From these results it could be achieved that by increasing the flow rate from 50-250 mL/min the value of 2
Dσ decreased from 0.104 to 0.035 indicating that by increasing the flow rate the flow regime inside the photoreactor approaches from mixed flow to plug flow (see Fig. 7).
Fig. 7 The Effect of flow rate on (a) the value of dimension less Neq and (b)
dimension less variance In continue this was confirmed by the number of tank in series (Neq) in
different flow rates. The Neq number was calculated according to Eq. (9) and was 9.53, 15, 17.09, 22.19 and 28.52 for flow rates of 50, 100, 150, 200 and 250 respectively. The achieved results reveal that the number of Neq was increased by increasing flow rates (see Fig. 7), on the other hand by increasing the number of Neq according to the value 2
Dσ , the flow regime inside the photoreactor approaches to plug flow (see Fig. 7).
In this work the relationship between the RE(%) and the flow rates was studied with RTD parameters ( mt , σ2, 2
Dσ and Neq). This shows that the RE(%) increased while the flow rates increased from 50-200 mL/min as the number of Neq increased from 9.53-22.19 and the flow regime approaches from mixed flow to plug flow. This supports RTD conversion theory, as maximum conversion will be achieved as the mixing regime approaches plug-flow mixing (Fogler, 1992,
50 100 150 200 2505
10
15
20
25
30
Flow rate (mL/min)
Num
ber o
f Neq
50 100 150 200 2500.02
0.04
0.06
0.08
0.1
0.12
Flow rate (mL/min)
Dim
ensi
on le
ss v
aria
nce

Nauman and Buffham, 1983). On the other hand also by further increase of flow rate from 150-250 mL/min, the number of Neq was increased and the flow regime become more closer to plug flow, but the achieved RE(%) from RSM optimization step revealed that the optimum flow rate in the photoreactor was 150 mL/min and further increase of flow rate would not lead to higher RE(%). The presumed reason is that when the drug solution flow rate is increased up to the optimum value (200 mL/min), the turbulence in the system is enhanced. It may lead to decompose more and more adsorbed drug molecules on the surface of TiO2 thus photocatalytic removal efficiency increases. The higher removal efficiencies at the optimum flow rate of 200 mL/min were also attributed to the increase in the mass transfer coefficient. The finding is in agreement with literature reports where higher flow rates would result in higher photocatalytic efficiency (Dijkstra, Panneman, Winkelman, Kelly and Beenackers, 2002, Mehrotra, Yablonsky and Ray, 2005, Mozia,Tomaszewska and Morawski, 2007). As an instance, K. Mehrotra et al. (Mehrotra,Yablonsky and Ray, 2005) explained the effect of circulation flow rates on photocatalytic degradation rate of benzoic acid. They found that if the external mass transfer resistance existed, the reaction rate would depend on the circulation flow rate, particularly when circulation flow rate was low. The external mass transfer resistance can be reduced to a minimum by increasing mixing of fluid through stirring or increasing the circulating flow rate of the reaction medium (Sahle-Demessie,Bekele and Pillai, 2003). So it could be concluded in flow rate of 200 mL/min the mass transfer coefficient was reached to its maximum level so by the further increase of flow rate the RE(%) was constant. Studies were made on the flow rate property through the photoreactor using the RTD technique and its effects on the RE(%) of PhP as a model pollutant for the first time. It was shown that the hydrodynamic characteristics affected the RE(%) performance. It is concluded that the flow characteristics are an important factor to be considered in photoracors design. RTD analysis is a very important concept to characterize mixing and flow behavior inside a reactor, and to know whether the reactor is approaching any of an ideal reactor: plug flow reactor or mixed flow reactor and in which of them the removal efficiency is maximum. Also, RTD analysis helps to model the real reactor as a combination of ideal reactors. In addition, RTD data can also be used to analyze any non-idealities like channeling, by passing, and short circuiting present in a reactor (Jović,Kosar,Tomašić and Gomzi, 2011, Moreira,Pinto,Mesnier and Leclerc, 2007, van Houwelingen,van der Merwe,Wales,Heydenrych and Nicol, 2009). By analyzing the RTD data with appropriate models such as on parameters model (the tank in series model here), the results give the model parameters. This eventually can be used to scale up or to design a reactor which could be operated in optimum flow rate to obtain higher removal efficiency (Alkhaddar,Higgins,Phipps and Andoh, 2001, Martin, 2000). Conclusions
The photocatalytic treatment of a textile drug, PhP, from aqueous solution in a rectangular photocatalytic reactor was optimized. Effect of operational parameters on the removal efficiency of PhP was evaluated by the response

surface and contour plots. The optimum values of initial drug concentration, UV light intensity, flow rate and reaction time were 10 mg/L, 47 W/m2, 200 mL/min, 120 min, respectively. The achieved optimum value of flow rate have been characterized and justified through RTD studies. This study showed how the RTD in a rectangular photoreactor is affected by the flow rate. The resulting mean residence time and dimensionless variance were obtained and compared based on entrance flow rate conditions. For defining the performances of the photoreactor in each flow rate, the RTD data were analyzed in relation with tanks-in-series flow model. The number of tank in series was increased from 9.53 to 22.19 by increasing flow rate from 50 to 200 mL/min. The decrease in the value of dimension less variance were used as a measure of the approach to plug flow in which the RE(%) of the PhP was higher.
Acknowledgement
The authors thank the University of Tabriz, Iran for financial and other supports.
References Alkhaddar, R. M., Higgins, P. R., Phipps, D. A. and Andoh, R. Y. G. (2001), “Residence time distribution of a model hydrodynamic vortex separator“, Urban Water, 3, 17-24. Choon Yoong, C., Nyuk Ling, C., Yus Aniza, Y., A.T., Rosnita and Chung Lim, L. (2012), “Optimization of total phenolic content extracted from Garcinia mangostana Linn. hull using response surface methodology versus artificial neural network“, Ind. Crop. Prod., 40, 247-253. Dijkstra, M. F. J., Panneman, H. J., Winkelman, J. G. M., Kelly, J. J. and Beenackers, A. A. C. M. (2002), “Modeling the photocatalytic degradation of formic acid in a reactor with immobilized catalyst“, Chem. Eng. Sci., 57, 4895-4907. Fathinia, M., Khataee, A. R., Zarei, M. and Aber, S. (2010), “Comparative photocatalytic degradation of two dyes on immobilized TiO2 nanoparticles: Effect of dye molecular structure and response surface approach“, J. Molecul. Catal. A-Chem., 333, 73-84. Fogler, S.H. (1992), “Elements of Chemical Reaction Engineering“, Prentice–Hall International, New Jersey. Gavrilescu, M. and Tudose, R. Z. (1999), “Residence time distribution of the liquid phase in a concentric-tube airlift reactor“, Chem. Eng. Process-Process Intens., 38, 225-238. Hilal, H. S., Al-Nour, G. Y. M., Zyoud, A., Helal, M. H. and Saadeddin, I. (2010), “Pristine and supported ZnO-based catalysts for phenazopyridine degradation with direct solar light“, Solid State Sci., 12, 578-586. Hornung, C. H. and Mackley, M. R. (2009), “The measurement and characterisation of residence time distributions for laminar liquid flow in plastic microcapillary arrays“, Chem. Eng. Sci., 64, 3889-3902. Huerta-Fontela, M., Galceran, M. T. and Ventura, F. (2011), “Occurrence and removal of pharmaceuticals and hormones through drinking water treatment“, Water Res., 45, 1432-1442.

Jović, F., Kosar, V., Tomašić, V. and Gomzi, Z. (2011), “Non-ideal flow in an annular photocatalytic reactor“, Chem. Eng. Res. Des., In Press. Khataee, A. R., Fathinia, M. and Aber, S. (2010), “Kinetic modeling of liquid phase photocatalysis on supported TiO2 nanoparticles in a rectangular flat-plate photoreactor“, Ind. Eng. Chem. Res., 49, 12358-12364. Khataee, A. R., Fathinia, M., Aber, S. and Zarei, M. (2010), “Optimization of photocatalytic treatment of dye solution on supported TiO2 nanoparticles by central composite design: Intermediates identification“, J. Hazard. Mater., 181, 886-897. Khataee, A. R. and Kasiri, M. B. (2010), “Photocatalytic degradation of organic dyes in the presence of nanostructured titanium dioxide: Influence of the chemical structure of dyes“, J. Molecul. Catal. A-Chem., 328, 8-26. Khataee, A. R., Zarei, M., Fathinia, M. and Jafari, M. Khobnasab. (2011), “Photocatalytic degradation of an anthraquinone dye on immobilized TiO2 nanoparticles in a rectangular reactor: Destruction pathway and response surface approach“, Desalination, 268, 126-133. Kumar, A., Ganjyal, G. M., Jones, D. D. and Hanna, M. A. (2006), “Digital image processing for measurement of residence time distribution in a laboratory extruder“, J. Food Eng., 75, 237-244. Kumar, A., Ganjyal, G. M., Jones, D. D. and Hanna, M. A. (2008), “Modeling residence time distribution in a twin-screw extruder as a series of ideal steady-state flow reactors“, J. Food Eng., 84, 441-448. Marques, J., Vilareal, H., Alfaia, A. and Ribeiro, M. (2007), “Modelling of the high pressure–temperature effects on naringin hydrolysis based on response surface methodology“, Food Chem., 105, 504-510. Martin, A. D. (2000), “Interpretation of residence time distribution data“, Chem. Eng. Sci., 55, 5907-5917. Mehrotra, K., Yablonsky, G. S. and Ray, A. K. (2005), “Macro kinetic studies for photocatalytic degradation of benzoic acid in immobilized systems“, Chemosphere, 60, 1427-1436. Moreira, R. M., Pinto, A. M. F., Mesnier, R. and Leclerc, J. P. (2007), “Influence of inlet positions on the flow behavior inside a photoreactor using radiotracers and colored tracer investigations“, Appl. Radiat. Isotopes, 65, 419-427. Mozia, S., Tomaszewska, M. and Morawski, A. W. (2007), “Photodegradation of azo dye Acid Red 18 in a quartz labyrinth flow reactor with immobilized TiO2 bed“, Dyes Pigments, 75, 60-66. Nauman, E. B. and Buffham, B. A. (1983), “Mixing in continuous flow systems“, John Wiley & Sons, New York. Noordin, M. Y., Venkatesh, V. C., Sharif, S., Elting, S. and Abdullah, A. (2004), “Application of response surface methodology in describing the performance of coated carbide tools when turning AISI 1045 steel“, J. Mater. Process. Technol., 145, 46-58. Puaux, J. P., Bozga, G. and Ainser, A. (2000), “Residence time distribution in a corotating twin-screw extruder“, Chem. Eng. Sci., 55, 1641-1651. Ribeiro, M. H. L., Afonso, C., Vila-Real, H. J., Alfaia, A. J. and Ferreira, L. (2010), “Contribution of response surface methodology to the modeling of naringin

hydrolysis by naringinase Ca-alginate beads under high pressure“, LWT Food Sci. Technol., 43, 482-487. Sahle-Demessie, E., Bekele, S. and Pillai, U. R. (2003), “Residence time distribution of fluids in stirred annular photoreactor“, Catal. Today, 88, 61-72. van Houwelingen, A., van der Merwe, W., Wales, N., Heydenrych, M. and Nicol, W. (2009), “The effect of hydrodynamic multiplicity on liquid phase trickle flow axial dispersion“, Chem. Eng. Res. Des., 87, 677-683. Waje, S. S., Patel, A. K., Thorat, B. N. and Mujumdar, A. S. (2007), “Study of Residence Time Distribution in a Pilot-Scale Screw Conveyor Dryer“, Dry. Technol., 25, 249-259. Yang, M. and Zhu, J. J. (2005), “Synthesis and characterizations of nanoribbons and monodispersed nanocrystals of CuBr“, Mater. Res. Bull., 40, 265-270. Zarei, M., Khataee, A. R., Ordikhani-Seyedlar, R. and Fathinia, M. (2010), “Photoelectro-Fenton combined with photocatalytic process for degradation of an azo dye using supported TiO2 nanoparticles and carbon nanotube cathode: Neural network modeling“, Electrochim. Acta, 55, 7259-7265. Zarei, M., Niaei, A., Salari, D. and Khataee, A. R. (2010), “Application of response surface methodology for optimization of peroxi-coagulation of textile dye solution using carbon nanotube–PTFE cathode“, J. Hazard. Mater., 173, 544-551. Zyoud, A. H., Zaatar, N., Saadeddin, I., Cheknane, A., DaeHoon, P., Campet, G. and Hilal, H. S. (2010), “CdS-sensitized TiO2 in phenazopyridine photo-degradation: Catalyst efficiency, stability and feasibility assessment“, J. Hazard. Mater., 173, 318-325.