optimization of scr control technology for reduced …
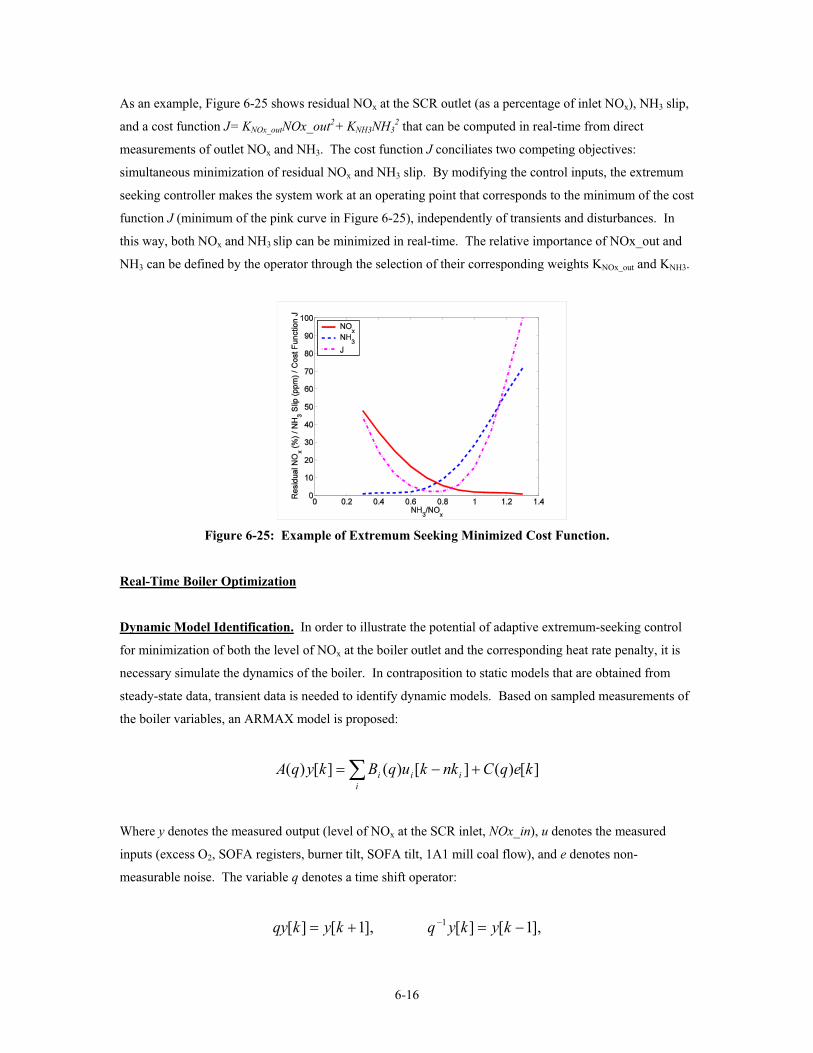
TRANSCRIPT

OPTIMIZATION OF SCR CONTROLTECHNOLOGY FOR REDUCED NOx
EMISSIONS IMPROVED PERFORMANCEAND REDUCED OPERATING EXPENSES
FINAL REPORT 09-09 APRIL 2009
NEW YORK STATE ENERGY RESEARCH AND
DEVELOPMENT AUTHORITY
The New York State Energy Research and Development Authority (NYSERDA) is a public benefit corporation created in 1975 by the New York State Legislature
NYSERDA derives its revenues from an annual assessment levied against sales by New Yorkrsquos electric and gas utilities from public benefit charges paid by New York rate payers from voluntary annual contributions by the New York Power Authority and the Long Island Power Authority and from limited corporate funds
NYSERDA works with businesses schools and municipalities to identify existing technologies and equipment to reduce their energy costs Its responsibilities include
bull Conducting a multifaceted energy and environmental research and development program to meetNew York Statersquos diverse economic needs
bull The New York Energy $martSM program provides energy efficiency services including thosedirected at the low-income sector research and development and environmental protection activities
bull Making energy more affordable for residential and low-income households
bull Helping industries schools hospitals municipalities not-for-profits and the residential sectorimplement energy-efficiency measures NYSERDA research projects help the Statersquos businessesand municipalities with their energy and environmental problems
bull Providing objective credible and useful energy analysis and planning to guide decisions made bymajor energy stakeholders in the private and public sectors
bull Since 1990 NYSERDA has developed and brought into use successful innovative energy-efficientand environmentally beneficial products processes and services
bull Managing the Western New York Nuclear Service Center at West Valley including overseeingthe Statersquos interests and share of costs at the West Valley Demonstration Project a federalStateradioactive waste clean-up effort and managing wastes and maintaining facilities at the shut-downState-Licensed Disposal Area
bull Coordinating the Statersquos activities on energy emergencies and nuclear regulatory matters andmonitoring low-level radioactive waste generation and management in the State
bull Financing energy-related projects reducing costs for ratepayers
For more information contact the Communications unit NYSERDA 17 Columbia Circle Albany New York 12203-6399 toll-free 1-866-NYSERDA locally (518) 862-1090 ext 3250 or on the web at wwwnyserdaorg
STATE OF NEW YORK ENERGY RESEARCH AND DEVELOPMENT AUTHORITY David A Paterson Governor Vincent A DeIorio Esq Chairman
Francis J Murray Jr President and Cheir Executive Officer
OPTIMIZATION OF SCR CONTROL TECHNOLOGY FOR
REDUCED NOx EMISSIONS IMPROVED PERFORMANCE
AND REDUCED OPERATING EXPENSES
Final Report
Prepared for the NEW YORK STATE
ENERGY RESEARCH AND DEVELOPMENT AUTHORITY
Albany NY wwwnyserdaorg
Barry Liebowitz Senior Project Manager
Prepared by ENERGY RESEARCH CENTER
Bethlehem PA
Carlos E Romero Project Manager
with
Eugenio Schuster Fengqi Si Zheng Yao
NYSERDA NYSERDA 10083 April 2009 Report 09-09
NOTICE
This report was prepared by the Energy Research Center in the course of performing work contracted for
and sponsored by the New York State Energy Research and Development Authority and AES Cayuga
(hereafter the ldquoSponsorsrdquo) The opinions expressed in this report do not necessarily reflect those of the
Sponsors or the State of New York and reference to any specific product service process or method does
not constitute an implied or expressed recommendation or endorsement of it Further the Sponsors and the
State of New York make no warranties or representations expressed or implied as to the fitness for
particular purpose or merchantability of any product apparatus or service or the usefulness completeness
or accuracy of any process methods or other information contained described disclosed or referred to in
this report The Sponsors the State of New York and the contractor make no representation that the use of
any product apparatus process method or other information will not infringe privately owned rights and
will assume no liability for any loss injury or damage resulting from or occurring in connection with the
use of information contained described disclosed or referred to in this report
ABSTRACT
A feasibility project was performed at Cayuga Unit 1 with funding from the New York State Energy
Research and Development Authority and AES Cayuga to develop an optimization methodology and
demonstrate the combined optimal operation of boiler selective catalytic reduction (SCR) system and
back-end air preheater (APH) Cayuga Unit 1 is a 560 MW unit equipped with a low-NOx firing system
and an anhydrous ammonia (NH3) SCR reduction system for NOx emissions control The boiler and low-
NOx system control settings and SCR and APH operating conditions were tested in a parametric test
program Information from a Breen Energy Solutions ammonium bisulfate (ABS) probe was included for
monitoring ammonium salts formation in real-time and as a constraint to the SCR optimization The
parametric test data were used as the basis for the optimization that consisted of an approach which
incorporates accurate on-line support vector regression modeling for adaptive learning and genetic
algorithms for implementation of the multi-objective optimization Upgrades to the SCR control scheme
were proposed using a multi-loop control with proportional-integral-derivative (PID) control tuning and
extremum seeking The results indicate that optimal operating conditions can be achieved for a coordinated
boilerSCRAPH operation that exhibits minimal NH3 consumption maximum SCR performance and
optimal net unit heat rate This optimized operation also results in minimal impact on fly ash unburned
carbon content and mitigates ABS formation and complies with other operational and environmental
constraints The optimal conditions resulted in reduced NH3 usage of the order of 25 percent optimal heat
rate improvement of approximately 55 BtukWh with improved APH fouling management and estimated
annual cost savings of the order of $748000
Keywords NOx Emissions SCR Optimization Control Upgrades
iii
TABLE OF CONTENTS
Section Page
SUMMARY S-1
1 INTRODUCTION1-1
2 UNIT DESCRIPTION2-1
3 ABS MONITORING3-1
4 PARAMETRIC FIELD TESTS 4-1
5 DATA ANALYSIS RESULTS AND DISCUSSION 5-1 DATA ANALYSIS RESULTS5-1 MODELING RESULTS 5-15 OPTIMIZATION RESULTS5-16
6 UPGRADED SCR CONTROL STRATEGY 6-1 UPGRADED SCRAPH CONTROL SCHEME6-1
SCR Control6-1 Air Preheater Control 6-7 Integrated SCRAPH Control6-11
NON-MODEL-BASED OPTIMAL ADAPTIVE CONTROL6-14 Extremum Seeking6-14 Real-Time Boiler Optimization6-16
7 EVALUATION OF BENEFITS 7-1
8 CONCLUSIONS AND RECOMMENDATIONS 8-1
9 REFERENCES9-1
APPENDIX A CALCULATIONS OF THE EFFECT OF BOILER OPERATING CONDITIONS ON UNIT THERMAL PERFORMANCE FROM TEST DATA A-1
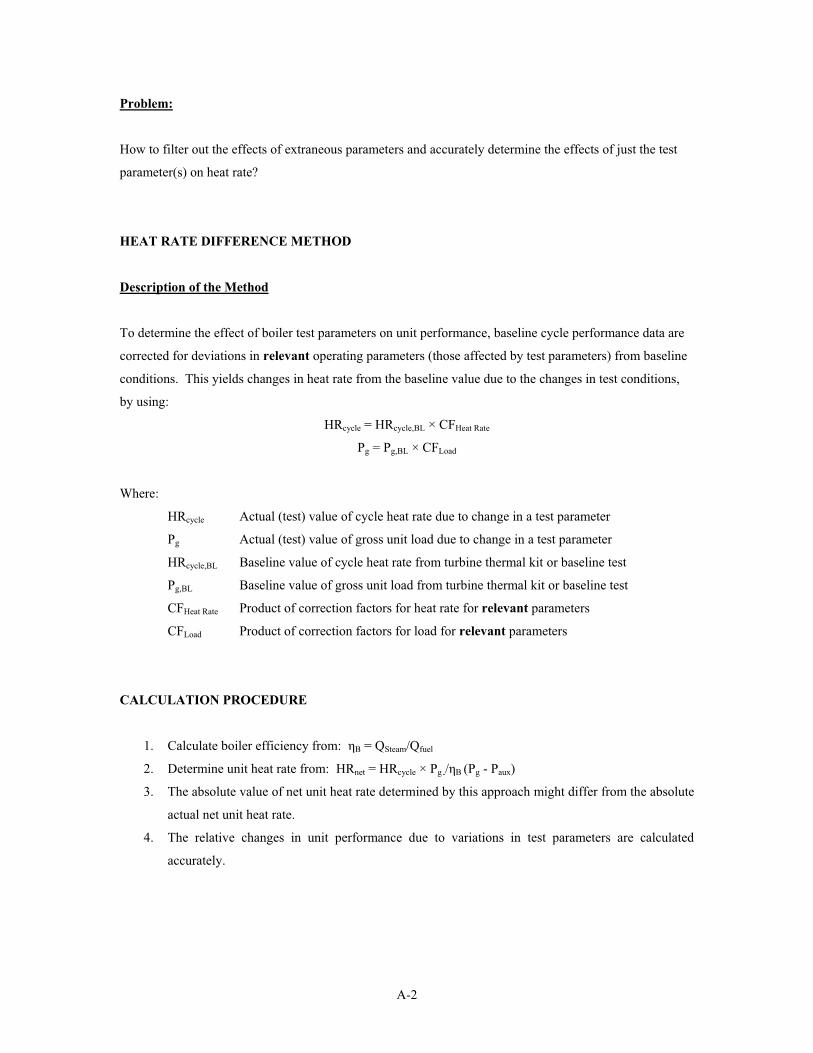
BACKGROUNDA-1 HEAT RATE DIFFERENCE METHODA-2
Description of the Method A-2 CALCULATION PROCEDUREA-2 RELEVANT OPERATING PARAMETERSA-3
Cycle Operating Parameters in Group 1 A-3 Cycle Operating Parameters in Group 2 A-3
NUMERICAL EXAMPLE A-3 RESULTS A-5
APPENDIX B CAYUGA UNIT 1 TEST MATRIX B-1
APPENDIX C FUNDAMENTALS OF EXTREMUM SEEKING C-1
v
FIGURES
Figure Page
2-1 Cayuga Unit 1 ndash Boiler Configuration 2-1 3-1 Representation of APH Temperature Controller Performance3-2 3-2 Performance of the APH Temperature Controller3-3 3-3 Performance of Ammonia Injection Controller3-3 5-1 Contour Plots of O2 and NOx Concentration at the SCR Inlet 5-2 5-2 Impact of Boiler Excess O2 on Unit Heat Rate Penalty 5-2 5-3 Impact of Boiler Excess O2 on ABS Formation Temperature5-3 5-4 Impact of SOFA Registers on NH3 Flow Requirement5-4 5-5 Impact of SOFA Registers on ABS Deposition Depth5-4 5-6 Impact of SOFA Registers on SCR Removal Efficiency 5-5 5-7 Impact of SOFA Registers on Unit Heat Rate Penalty5-5 5-8 Impact of 1A1-Mill Coal Flow Rate on SCR Inlet NOx Emissions 5-6 5-9 Impact of Economizer Bypass Damper on SCR Gas Inlet Temperature5-8 5-10 Impact of Economizer Bypass Damper on SCR Removal Efficiency5-8 5-11 Impact of Ammonia Flow on ABS Formation Temperature and Deposition5-9 5-12 Impact of NSR on ABS Formation Temperature and Ammonia in Ash 5-10 5-13 Impact of APH Bypass Damper Position on ABS Deposition Depth 5-11 5-14 Impact of APH Bypass Damper Position on APH Flue Gas Exit Temperature 5-11 5-15 Impact of APH Bypass Damper Position on Unit Heat Rate Penalty 5-12 5-16 Results of Sootblowing Tests5-13 5-17 Proposed Sootblowing Schedule 5-13 5-18 Modified AOSVR NOx Emissions Model Prediction Results5-16 5-19 Trained AOSVR Model Results for Boiler Heat Rate Penalty5-17 5-20 Lowest NH3 Flow Rate vs SCR Inlet NOx 5-18 5-21 GA Optimization Results for Boiler Outlet NOx ndash (a) Initialization Dataset
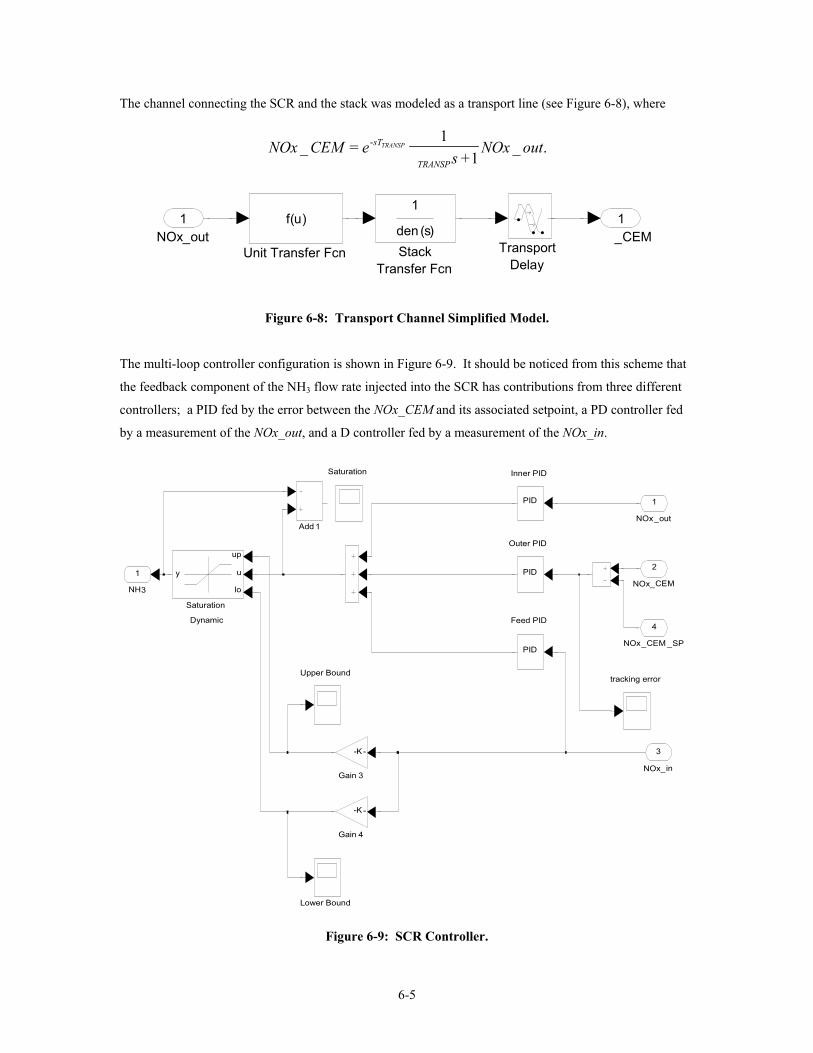
(b) 1st Generation (c) 15th Generation (d) 30th Generation 5-20 5-22 GA Optimization Solutions for the Total Cost Function5-21 5-23 Cost Components as a Function of Boiler Outlet NOx5-22 6-1 System Configuration Used for the Control Strategy Upgrade 6-1 6-2 SCR Manufacturerrsquos Typical Control Architecture6-2 6-3 SCR Control Architecture Based on the CEM NOx Input6-2 6-4 Multi-Loop SCR Control Architecture Based on CEM NOx SCR Inlet NOx and
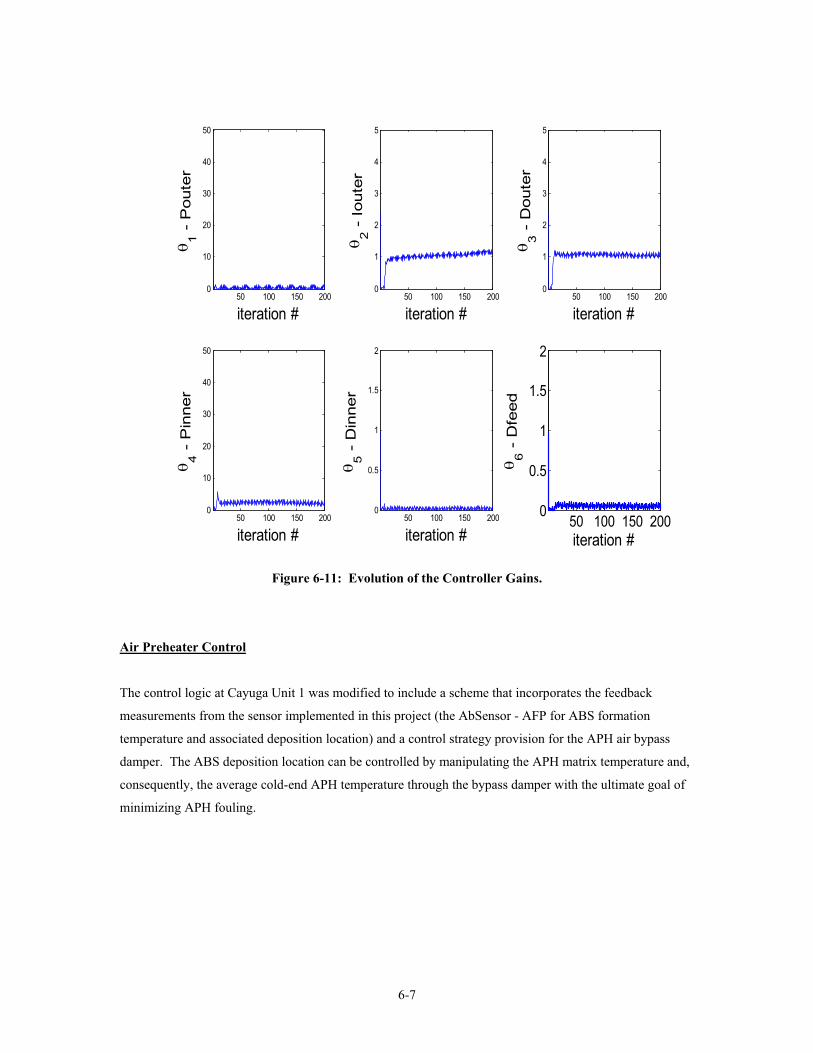
SCR Outlet NOx 6-3 6-5 SIMULINK SCR Control Configuration 6-3 6-6 Simplified SCR Model6-4 6-7 SCR Efficiency as a Function of NH3NOx_in Ratio 6-4 6-8 Transport Channel Simplified Model6-5 6-9 SCR Controller6-5 6-10 Evolution of the Cost Function 6-6 6-11 Evolution of the Controller Gains 6-7 6-12 Illustration of the Time Response of the Optimized Multi-Loop Scheme 6-8 6-13 APH Control Configuration 6-8 6-14 SIMULINK APH Control Configuration6-9 6-15 Simplified APH Model 6-9 6-16 ABS Formation Temperature as a Function of NH3NOx_in 6-10 6-17 ABS Formation Temperature Simplified Model 6-10 6-18 APH Deposition Depth Controller 6-10 6-19 Coordinated SCR and APH PID-Based Control 6-11 6-20 SIMULINK Coordinated SCR and APH PID-Based Control6-12 6-21 Modification of NOx_CEM Setpoint6-12 6-22 Effect of Modification of NOx_CEM Setpoint6-13
vi
FIGURES (continued)
Figure Page
6-23 Two-Loop Adaptive Control Strategy with Extremum Seeking 6-14 6-24 Extremum Seeking Approach 6-15 6-25 Example of Extremum Seeking Minimized Cost Function6-16 6-26 Simplified Boiler Dynamic Model 6-17 6-27 Cost Function of O2 when SOFA = 0 Burner Tilt = -4 degrees SOFA tilt = 1 degree
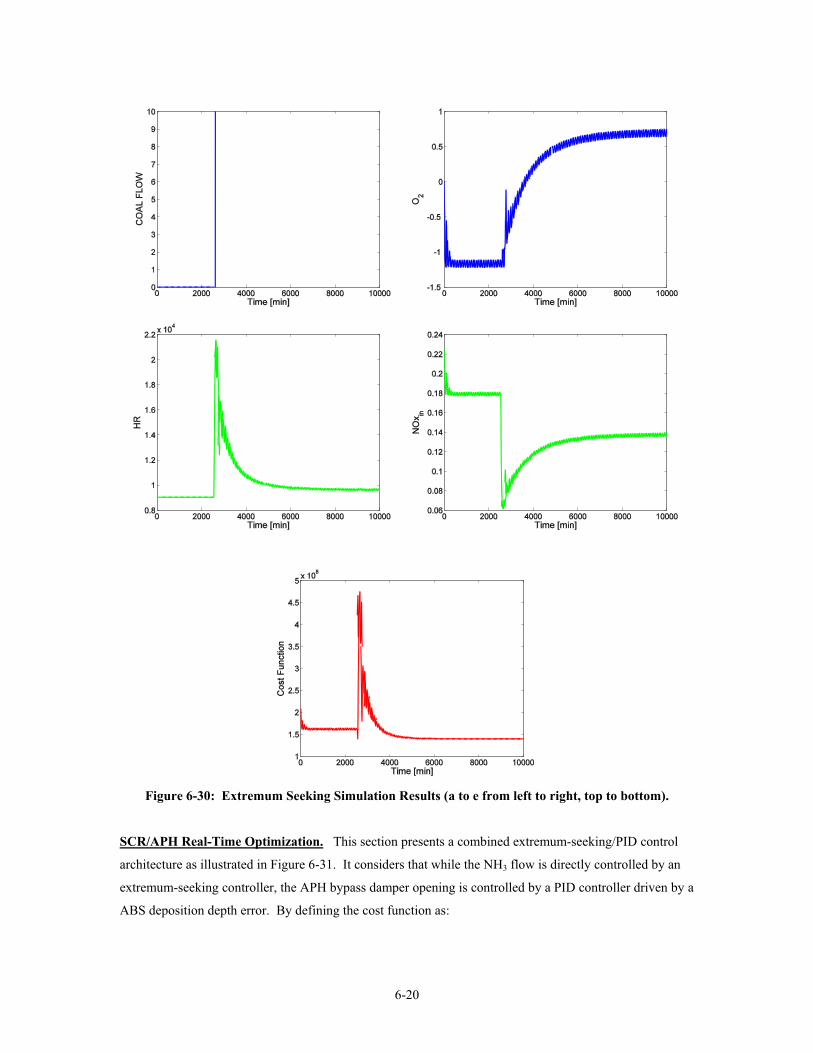
and 1A1 Coal Flow = 15 tonhr6-18 6-28 SIMULINK Extremum Seeking Boiler Control Configuration 6-19 6-29 Extremum Seeking Implementation for Excess O2 Optimal Modulation6-19 6-30 Extremum Seeking Simulation Results (a to e from left to right top to bottom)6-20 6-31 SIMULINK Extremum Seeking SCRAPH Control Configuration6-21 6-32 Extremum Seeking Implementation for NH3 Optimal Modulation6-22 6-33 Extremum Seeking Simulation Results 6-23
vii
TABLES
Table Page
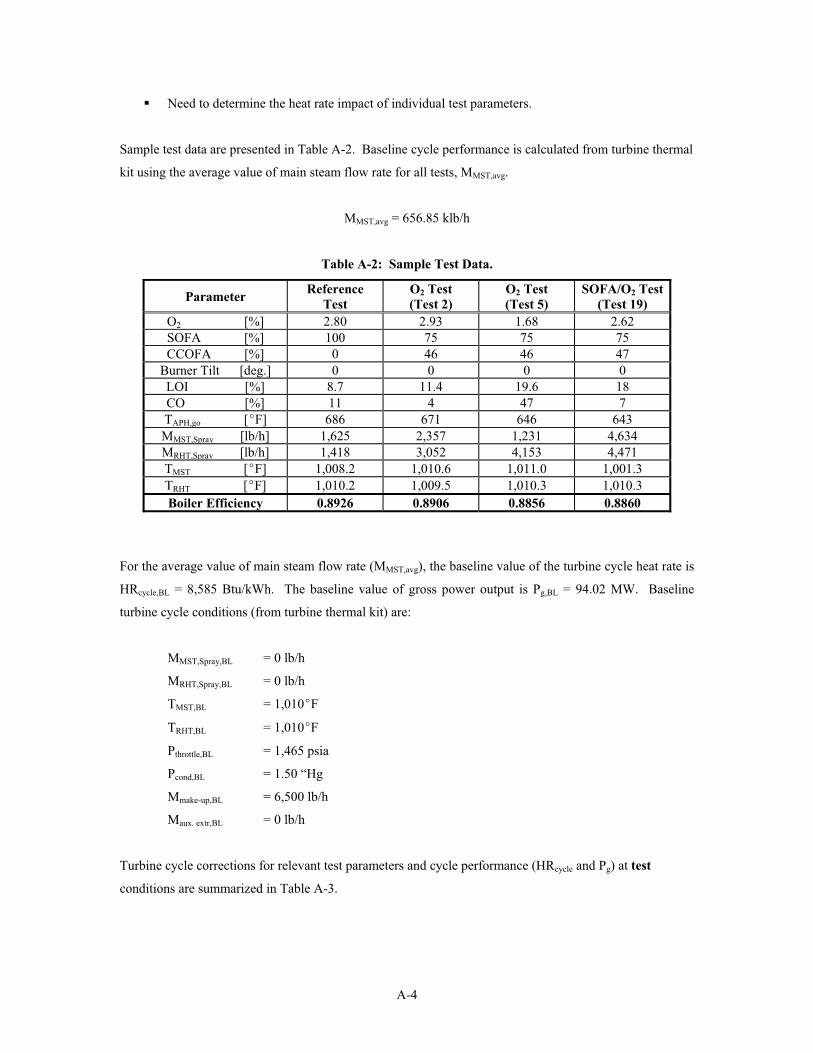
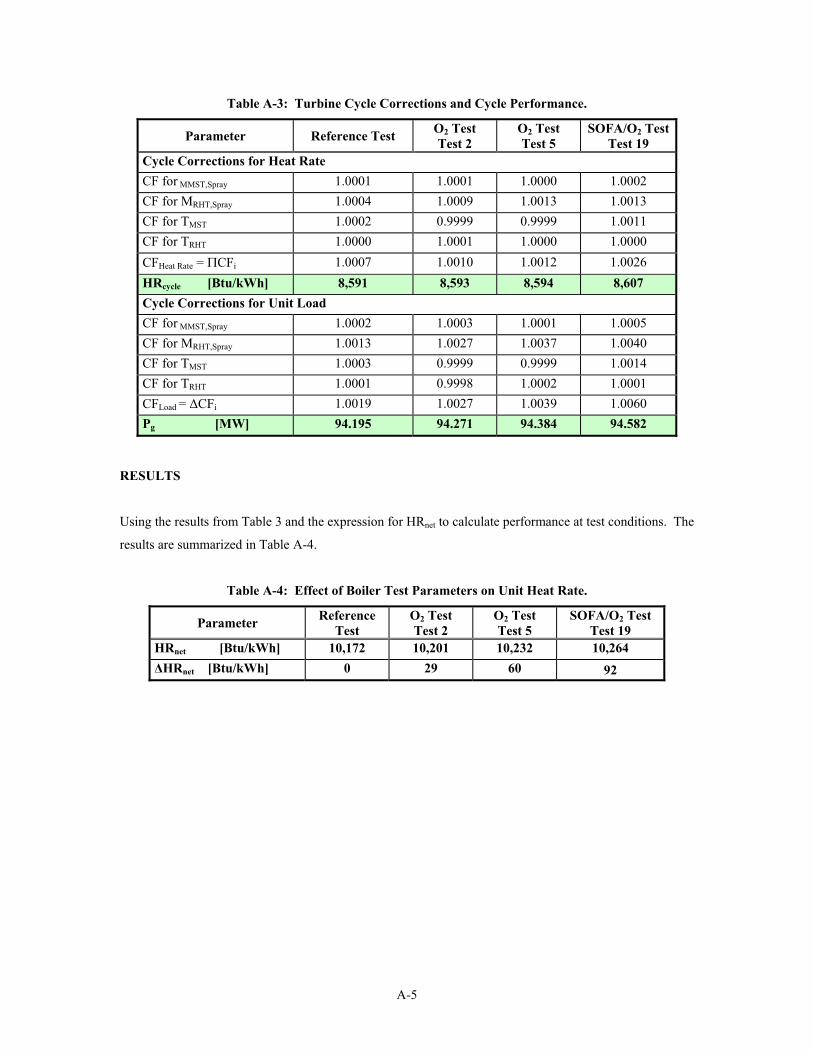
4-1 List of Testing Parameters and Their Limits 4-2 5-1 Mercury Emissions Estimates for Different Boiler Operation Conditions5-14 A-1 Parametric Test Data A-1 A-2 Sample Test Data A-4 A-3 Turbine Cycle Corrections and Cycle Performance A-5 A-4 Effect of Boiler Test Parameters on Unit Heat Rate A-5 B-1 Cayuga Unit 1 Test Matrix B-2
viii
LIST OF ABBREVIATIONS
aT SOFA Tilt aBT Burner Tilt e Fly Ash Unburned Carbon adepth ABS Deposition Depth Limit 7B Boiler Efficiency 7SCR SCR efficiency TSCR SCR time constant TTRANSP Transport channel time constant ABS Ammonium Bisulfate AFP Anti-Fouling Probe AI Artificial Intelligence AOSVR Accurate On-Line Support Vector Regression APH Air Preheater BL Baseline C CostCSCR SCR controller transfer function CSCROUT SCR outer-loop controller transfer function CSCRIN SCR inner-loop controller transfer function CSCRFEED SCR feedforward controller transfer function CCOFA Closed-Couple Overfire Air CE Combustion Engineering CF Correction Factor CFS Concentric Firing System CO Carbon Monoxide dABS ABS Deposition Depth D(x) Depth function D Damper Opening DAPH Air Preheater Bypass Damper Position DCS Distributed Control System ERC Energy Research Center ESP Electrostatic Precipitator E(x) APH-SCR coordinator f Functionf(x) SCR feedforward gain Fcoal Coal Flow to 1A1-Mill FGD Flue Gas Desulphurization GSCR SCR transfer function GA Genetic Algorithm GTRANSP Transport channel transfer function GAPH1 APH transfer function relating Tform and NH3NOxGAPH2 APH transfer function relating TAPH and damper HR Net Unit Heat Rate IS In-Service J Extremum-seeking cost function KD Extremum-seeking D weight factor KNOx in Extremum-seeking NOx_in weight factor KNOx out Extremum-seeking NOx_out weight factor KNOx CEM Extremum-seeking NOx_CEM weight factor KNH3 Extremum-seeking NH3 weight factor KHR Extremum-seeking HR weight factor Kz SCR gain
ix
KPOUT Outer-loop proportional gain KIOUT Outer-loop integral gain KDOUT Outer-loop derivative gain KPIN Inner-loop proportional gain KDIN Inner-loop derivative gain KDFEED Feedforward derivative gain KAPH CAPH APH controller transfer function KPOUT Outer-loop proportional gain LOI Loss on Ignition LNCFS Low-NOx Concentric Firing System Maux extr Auxiliary Extraction Flow Rate Mmake-up Make-Up Flow Rate MMST Main Steam Flow Rate MMSTSpray Main Steam Attemperating Spray Flow Rate MRHT Spray Hot Reheat Attemperating Spray Flow Rate MAE Mean Absolute Error NPGA Niched Pareto Genetic Algorithm NH3 Ammonia NN Neural Network NOx Nitrogen Oxides NOx_in NOx at the SCR inlet NOx_out NOx at the SCR outlet NOx_CEM NOx at the CEM NOx_CEM_setpoint Setpoint for NOx at the CEM NSR Normalized Stoichiometric Ratio NYSERDA New York State Energy Research and Development Authority OS Out-of-Service O2 Oxygen OampM Operational and Maintenance OFA Overfire Air OLE Object Linking and Embedding OPC OLE for Process Control Pcond Condenser Back Pressure Pthrottle Throttle Pressure Pg Unit Generation or Load Paux Auxiliary Power PID Proportional-Integral-Derivative Controller PLC Programmable Logic Controller q Heat Rate Penalty Qfuel Fuel Heat Rate Qsteam Steam Heat Rate SCR Selected Catalytic Reduction SIP State Implemented Plan SOFA Separated Overfire Air TAPH APH temperature TAPHgo Air Preheater Gas Outlet Temperature Tform ABS formation temperature TMST Main Steam Temperature THRT Hot Reheat Temperature TSCR SCR time delay TTRANSP Transport channel time delay
x
LIST OF UNITS
ABS Deposition Depth Ft Coal Flow Rate th Condenser Pressure In Hg Cost $h Dust Loading lbNft3
Excess Oxygen Fly Ash LOI Heat Rate Btuhr NH3 Slip ppmv
NH3 Flow Rate lbh NH3 in Ash Mgkg (ppmw) NOx lbMBtu RegisterDamper Position Residence Time sec SCR Efficiency Stack Opacity Steam Cycle Flow Rate lbh Steam Spray Flows lbhr Temperatures oF Throttle Pressure psia Tilts Degree Time Delay sec Unit Heat Rate BtukWh Unit Load MW Volume ft3
xi
SUMMARY
A study funded by the New York State Energy Research and Development Authority (NYSERDA) and
AES Cayuga was performed to investigate the feasibility of developing an optimization methodology and
demonstrate the benefit of operating in an optimal mode that achieve maximum boiler NOx emissions
reductions maximum selected catalytic reduction (SCR) system performance minimal unit heat rate
penalties and lower cost of operation at Cayuga Unit 1 Cayuga Unit 1 is a 150 MWnet unit equipped with
a low-NOx firing system and an anhydrous ammonia (NH3)-based SCR system Process optimization is a
cost-effective approach to improve the cost of NOx compliance at coal-fired boilers while meeting other
operational and environmental constraints In boilers equipped with SCRs this is a classic multi-objective
optimization problem to balance boiler thermal performance NOx emissions the cost of reagent and air
preheater (APH) maintenance costs The specific objectives of this study included
bull Provide upgraded instrumentation and control capabilities of ammonium bisulfate
(ABS) fouling at the APH
bull Develop a methodology for a combined boiler combustionSCRAPH optimization
bull Perform field testing at Cayuga Unit 1 and modeling and data analysis to support the
demonstration of a combined optimization
bull Develop upgraded control strategy for minimum boiler NOx emissions optimal SCR
operation minimal NH3 consumption optimal APH operation and minimal overall
cost of operation
Long-term operation of a SCR system at optimal conditions should
bull Improve reagent utilization
bull Minimize catalyst deterioration and reduce operational and maintenance (OampM)
costs
bull Operate at tighter stack NOx levels with minimal standard deviation
bull Maintain SCR constraints such as design NH3 slip and SO2-to-SO3 conversion
bull Minimize SCR impact on balance of plant equipment such as ABS formation and
unit heat rate
The following conclusions and recommendations were achieved from the results of this study
bull SCR tuning is an important aspect that should be considered when optimizing the
operation of SCR systems This involves the adjustment of the SCR injection grid
S-1
for uniform reagent treatment However at Cayuga Unit 1 the as-found conditions
and NH3 injection tuning capability rendered this step unnecessary
bull A Breen Energyrsquos AbSensor ndash Anti-Fouling Probe (AFP) was installed at one of the
APH inlets at Cayuga Unit 1 for on-line monitoring of ABS and real-time
determination of the ABS deposition axial location in the APH This probe was
found very reliable and an excellent tool to be used in an upgraded optimal SCR
system operation
bull Parametric field tests were performed at Cayuga Unit 1 From these tests it was
found that economizer excess O2 the top two separated overfire air (SOFA) register
openings burner tilt SOFA tilt the coal flow to the top pulverizer (1A1-Mill) and
the NH3NOx ratio all have an impact on SCR inlet NOx NH3 requirement for a
target stack NOx emissions level SCR NOx removal efficiency net unit heat rate and
ABS deposition Lower flue gas temperatures were found to improve SCR
performance hence manipulation of the economizer bypass damper was found
ineffective to improve SCR performance at full load It was found that increasing
the NH3 flow rate in excess of 130 lbhr increases the likelihood of exceeding a 275
ft threshold distance from the APH cold-end for ABS deposition Within this 275
ft distance ABS removal by sootblowing is greatly enhanced
bull Sootblowing tests were performed to investigate the impact of different sootblowing
routines on the operation of the SCR system and associated NOx reduction and NH3consumption It is recommended a sootblowing schedule that introduces activation
of wall blowers (Model IR) at the waterwalls every 10 min alternating blowers from
each ring (A B and C) and retractable blowers (Model IK) every shift as well as
cleaning of the SCR once a shift and of the APH three times per shift
bull Artificial intelligence techniques were used to model the test data and provide a tool
for mathematical optimization A modified accurate on-line support vector
regression (AOSVR) was implemented on the parametric test data to build artificial
intelligence-based functional relationships between the boiler outlet or SCR inlet
NOx level and heat rate penalty The prediction performance of proposed AOSVR
model was adequate Genetic algorithms (GAs) were used to solve the constrained
multi-objective optimization problem with success An optimal solution is
recommended for the lowest cost of compliance which corresponds to the following
control setting Economizer excess O2 = 32 average SOFA register opening =
51 (both top- and mid-SOFA registers open equally) average burner tilt angle = -8
degrees average SOFA tilt angle = +6 degrees top 1A1-Mill coal flow rate = 6
tonhr APH bypass damper = 0 opens (completely shut) and an NH3 injection rate
= 125 lbhr The optimal NH3 injection rate represents a reduction in NH3 flow rate
S-2
from baseline conditions of approximately 22 percent The combination of optimal
settings should result in NOx emissions at the boiler outlet of 0188 lbMBtu while
limiting ABS deposition to at less than 25 ft from the APH cold-end and producing
fly ash unburned carbon below 4 percent at a differential cost of $412hr This is
the lowest combined (heat rate penalty ndash and NH3-related) cost of operation as
compared to a highest cost of close to $20000hr The savings in net unit heat rate
from operation at optimal boiler and APH conditions equate to 54 BtukWh as 06
from the baseline net unit heat rate
bull A multi-loop control upgrade was proposed to enhance the boilerSCRAPH control
strategy The multi-loop control approach was complemented with a systematic
method for optimal tuning of proportionalndashintegralndashderivative (PID) control gainsThe SCR control logic that was in use at Cayuga Unit 1 was partially modified to
include a scheme that incorporates the feedback measurements implemented in this
project (viz real-time ABS monitoring and deposition tracking) The control system
upgrade includes a control strategy provision for the APH bypass damper by
controlling the average cold-end APH temperature to minimize APH
foulingplugging Additionally simple dynamic models for the boiler SCR system
and APH system were identified from the data and proposed to provide coordination
of both the SCR and APH control systems to enhance the overall performance of the
system This coordination approach led to the definition of tradeoffs resolved using
extremum-seeking control techniques
bull For future work two extremum-seeking loops are proposed for real-time
optimization at Cayuga Unit 1 The first non-model-based adaptive extremum-
seeking controller is proposed to regulate the boiler inputs (O2 SOFA register
opening burner tilt SOFA tilt top mill coal flow) to minimize both NOx at the SCR
inlet and the boiler heat rate penalty Non-model-based controllers learn from
dynamic operating data of the process This compares to model-based controllers
that utilize dynamic models to obtain mathematical conditions between the controller
design parameters and tuning rates The second non-model-based adaptive
extremum-seeking controller is proposed to regulate the NH3 flow to the SCR system
and the APH bypass damper opening in order to optimally control in real-time and in
a coordinated fashion both the NOx at the stack and ABS deposition within the
APH Based on the results obtained during this project the proposed approach has
the potential for further reducing stack NOx emissions unit heat rate NH3 usage and
provide savings from reduced APH washing frequency
bull Based on the results of this study it is indicated that modifying the combined
operation of the boiler and SCR system can result in savings in reagent usage heat
S-3
rate improvements and corresponding OampM costs Estimates were run to calculate
the economic benefits of an optimal operation In addition other indirect benefits
would result from these improvements These include catalyst life extension
reduction in APH cleaning frequency and costs associated with the loss of unit
availability Other added benefits not considered in the evaluation of benefits
include savings due to optimal sootblowing system operation reduction in fly ash
NH3 contamination and reduction of sulfur related problems such as sulfuric acid
corrosion and stack visible plume The estimated annual cost savings for Cayuga
Unit 1 due to optimized operation of the boilerSCRAPH system is on the order of
$748000 The estimates do not consider that it might be practical for utilities to
ldquoover-controlrdquo NOx to sell allowances into the NOx allowance market
The results of this analysis are based on a single limited data set However these results indicate that there
is a significant potential to optimize the combined operation of boiler combustion SCR system and APH to
achieve reduced operating costs
S-4
Section 1
INTRODUCTION
Responding to environmental regulations mandated by the EPArsquos State Implementation Plan (SIP) Call
Rule the US power industry has embraced application of the Selective Catalytic Reduction (SCR)
technology for nitrogen oxide (NOx) emission control This has resulted in 191 SCR installations on US
utility boilers by 2004 representing approximately 150 GW of coal-fired capacity SCR is considered a
ldquomaturerdquo technology which has been extensively applied in Europe and Japan since 1986 SCR systems
rely on the chemical reduction of NOx with ammonia (NH3) over the surface of a catalyst A theoretical
one-to-one NH3NOx molar ratio would result in conversion of these reactants to environmentally benign
molecular nitrogen and water vapor There is a good deal of care devoted by the equipment supplier to the
design and initial operational setup of SCR systems which is dictated by the particular application and
related to boiler configuration and type coal and fly ash composition and target NOx emission level or
NOx removal efficiency Other constraints that influence SCR design specifications include catalyst life
ammonia (NH3) slip SO2-to-SO3 conversion and maximum pressure drop across the SCR reactor
Once the SCR system is retrofitted to a boiler however continuous efficient long-term operation of the
SCR system requires the appropriate interaction between the flue gas reagent and catalyst which really
indicates how integral the SCR reactor is to the combustion process it serves As described in an article in
the journal POWER ldquowhile it may be down there success of a SCR has everything to do with what is
happening upstreamrdquo This is accentuated by the situation with the NOx SIP Call requirements which
provide incentive for operating SCR process equipment to deliver greater than the typical 75-85
European performance levels Many US utilitiesrsquo NOx strategic plans are based on SCR performance at
key units with 90+ NOx removal and control of NH3 slip at 2 ppm Consistently achieving those targets
(at the lowest available reagent consumption levels) over the 5-month period of the Ozone Season or over
the length of the year to meet generating system NOx caps is affected by normal changes in the boiler and
associated firing system which distort process conditions from assumed design targets Additionally SCR
process instrumentation and controls and reagent delivering systems suffer from inherent deficiencies
particularly under a variety of operational regimes (ie low-loads varying load ramp rates fluctuating coal
sources) which result in deviations from optimal SCR operation and consequently increased operational
and maintenance (OampM) costs and deteriorated catalyst life
Optimal cost-effective operation of the SCR system is mainly affected by changes to the flue gas
conditions the amount of NOx generated in the furnace and the NH3NOx preparation and use in the
catalyst bed Most operators of SCR systems recognize these effects and try to modify combustion in the
furnace for lower inlet NOx to the SCR system as well as periodically tune the SCR unit for best reagent
utilization and minimal OampM costs The SCR tuning targets provide relatively uniform NOx temperature
1-1
and flue gas flow conditions at the reagent point of injection at the SCR reactor inlet and maintain uniform
distributions of NOx and ammonia slip at the outlet of the SCR reactor Typical target ranges for the
variables of interest are inlet temperature distribution plusmn 30degF from the mean inlet flow distribution plusmn 15
percent from the mean and NH3NOx molar ratio plusmn 5 percent from the mean
In addition to periodical tuning of the SCR system optimization of the combined furnace combustionSCR
systemboiler back-end is of significant importance to obtain the maximum NOx reduction benefit from the
post-combustion emissions control system at the lowest OampM cost on a consistent basis Optimization of
combined boiler and SCR operation requires consideration of all operating parameters that impact the
combustion side SCR performance and the air preheater (APH) The SCR post-combustion NOx control
technology is usually retrofit on boilers equipped with low-NOx firing systems and on high-dust high-
temperature configurations with the SCR system located in front of the APH and the dust collection
equipment SCR systems designed and operated to achieve high NOx reduction efficiencies of over 90
are challenged to perform at the optimal level while achieving less than 2 ppm of NH3 slip resulting in
over-feeding of NH3 with associated operating cost penalties The price of NH3 has more than doubled in
recent years (currently at approximately $500ton NH3) Additionally in coal-fired boilers high NH3 slip
has an adverse impact on cold-end equipment located downstream of the SCR reactor The concerns
include ammonium bisulfate (ABS) deposition and plugging and corrosion potential of APHs Controlling
and mitigating APH fouling is imperative in coal-fired boilers since it precludes continued operation of the
unit requiring forced shutdowns for APH cleaning with the associated loss in unit availability and
financial penalty
The challenge of the SCR control technology is to achieve cost-effective high levels of NOx emissions
performance while constraining its detrimental impact at the boiler back-end An integrated approach for
the optimization of the combustion and post-combustion systems including the APH offers an alternative
to meet this challenge Such an approach should consider in a coordinated fashion the optimal operation
of the boiler firing system SCR reactor (including the reagent injection system) APH and net unit thermal
performance To investigate the feasibility of developing an optimization methodology and demonstrate
the benefit of operating in an optimal mode that achieves maximum boiler NOx emissions reductions
maximum SCR system performance minimal unit heat rate penalty and lower cost of operation a study
was conducted by the Energy Research Center under funding from the New York State Energy Research
and Development Authority (NYSERDA) and AES Cayuga The specific objectives of this study include
Provide upgraded instrumentation and control capabilities of ABS fouling at the APH
Develop a methodology for a combined boiler combustionSCRAPH optimization
Perform field testing at Cayuga Unit 1 and data analysis and modeling to support the
demonstration of a combined optimization
1-2
Develop upgraded control strategies for minimum boiler NOx emissions optimal SCR operation
minimal NH3 consumption optimal APH operation and minimal overall cost of operation
This report contains a description of the test unit used for this project instrumentation retrofit to monitor
ABS formation in the APH and a summary of the parametric tests data analysis results control system
upgrade as well as an evaluation of the benefits of this optimization and conclusions and
recommendations obtained from this project
1-3
Section 2
UNIT DESCRIPTION
This project was performed at AESrsquos Cayuga Station Unit 1 Cayuga Unit 1 is a 150 MWnet single-reheat
tangentially-fired Combustion Engineering (CE) boiler equipped with a low-NOx concentric firing system
(LNCFS) level III The LNCFS-III system consists of four elevations of burners arranged in four corners
(see Figure 2-1) Four pulverizers (1A1 1B2 1A3 and 1B4 from top to bottom) supply coal to the burner
system one mill per elevation Cayuga Station typically fires Northern Appalachian coal however
blending with lower quality fuels is common at this station The windbox compartment at each corner is
composed of fuel air registers (coaxial with the burner nozzle) auxiliary air registers and concentric fire
system (CFS) air registers that are used to divert combustion secondary air at an offset with respect to the
burner centerline In addition to the secondary air ports the LNCFS-III arrangement at Cayuga Unit 1
incorporates overfire (OFA) in two set of registers two closed coupled overfire air (CCOFA) registers and
a separated OFA (SOFA) compartment with three registers All the burner buckets and CCOFAs are
connected to tilt in unison for controlling of steam temperatures The SOFA compartments are also tiltable
for combustion staging Cayuga Unit 1 is equipped with two Ljungstrom type rotating APHs These APHs
are equipped with air bypass capabilities for average cold-end temperature control and acid dewpoint
mitigation at the APH cold-end The Cayuga Unit 1 APHs are equipped with rake type sootblowers which
can reach and remove deposits from the cold-end approximately 275 ft into the cold-end baskets The rest
of the boiler back-end configuration includes an electrostatic precipitator (ESP) for particulate removal and
a flue gas desulphurization unit (FGD)
SCR APH ESP FGD STACK
TOP SOFA
MID SOFA
BOT SOFA
CCOFA
CCOFA
1A1 COAL AIR
CFSAUX AIR
1B2 COAL AIR
CFSAUX AIR
1A3 COAL AIR
CFSAUX AIR
1B4 COAL AIR
AUX AIR
Figure 2-1 Cayuga Unit 1 ndash Boiler Configuration
2-1
Combustion control at Cayuga Unit 1 is based on the typical parallel airfuel control scheme An excess air
or percent oxygen (O2) trim control loop is available in the combustion control system The excess O2 bias
is applied at Cayuga Unit 1 on-manual operation by the boiler operators to balance furnace outlet or SCR
inlet NOx emissions and fly ash unburned carbon (or loss on ignition LOI) A bias is an adjustment
applied to a controllable parameter to elimate the deviation in the value of the parameter with respect to a
prescribed set point Due to fly ash sale and landfilling restrictions fly ash LOI at Cayuga is maintained at
below 4 percent Periodical samples of fly ash are taken throughout the day at Cayuga Unit 1 and analyzed
on-site for LOI Boiler excess O2 is adjusted accorderling to maintain the fly ash below the required
threshold Steam temperatures are controlled by attemperating sprays burner tilts and sootblowing
Design steam temperatures are 1000degF for both main steam and hot reheat steam temperatures
Cayuga Unit 1 is equipped with a 2-layer anhydrous NH3-based SCR system with a TiO2V2O5WO3formulation and total catalyst volume of 5890 ft3 for additional NOx control Design requirements for the
SCR system at Cayuga Unit 1 included 90 NOx reduction based on an inlet NOx emission rate for the
specified coals of 042 lbMBtu and an NH3 slip of less than 2 ppm at actual excess O2 Other design
considerations include an operating SCR temperature in the range between 608 and 700degF with a normal
operating temperature at full unit load of 627degF limited sulfur dioxide (SO2) to sulfur trioxide (SO3)
oxidation of less than 1 and dust loading of 000037 lbNft3 (normal ft3 or a standard temperature of
68oF and standard pressure of 1 atm) with a catalyst pitch of 02 in The SCR reactor houses the catalyst in
a downflow orientation and it is equipped with economizer bypass for SCR inlet temperature control at low
load operation The economizer bypass dampers allow hotter flue gas from the middle of the primary
superheater to mix with the economizer outlet gas to maintain a minimum catalyst inlet temperature of
608degF Additional dampers are provided for SCR reactor isolation and flow modulation SCR cleaning is
achieved with six air-based retractable sootblowers The anhydrous NH3 system includes a evaporationair
dilution skid and injection grid Ammonia concentration in the ammoniaair mixture is maintained at
approximately 5 Ammonia injection and mixing with the flue gas is achieved with an injection pipe
manifold that traverses the flue gas and two sets of static mixers SCR gas side instrumentation includes
NOx analyzers at the inlet and outlet of the reactor and a zirconium dioxide O2 analyzers Ammonia
injection control is performed using a combined feedforward and feedback control scheme In this scheme
the unit distributed control system (DCS) calculates the total NOx in the flue gas at the SCR inlet This
determines the feedforward portion of the injection signal to the NH3 flow control valve The DCS is also
allowed to trim the NH3 injection rate based on the feedback from the NOx analyzer located at the SCR
outlet and to maintain a constant NOx removal efficiency across the SCR A value of 90 NOx removal is
used for NH3 trimming
2-2
Section 3
ABS MONITORING
As part of this project Cayuga Unit 1 was retrofit with instrumentation for monitoring of ABS An ABS
monitoring sensor manufactured by Breen Energy Inc was installed at one of the APH inlets of Cayuga
Unit 1 The intention was to use one single sensor as indication of the fouling condition of both rotating
preheaters The Breen Energyrsquos AbSensor - Anti-Fouling Probe (AFP) is a probe that measures the
conduction of electrical current across the probersquos tip that results from condensed hydrated ammonium
bisulfate below its dewpoint The instrument reports both the ABS formation or condensation and
evaporation temperature via object linking and embedding (OLE) for process control (OPC) The detection
process consists of cooling the initially hot detector tip by controlled application of cooling air The
presence of a condensed ABS liquid phase is determined by the change in electrical resistancecurrent
between the probersquos electrodes Following detection of condensate the cooling air stream is removed and
the probe is allowed to return to the flue gas temperature As the probe heats the change in electrical
resistance is measured again to detect the liquid evaporation temperature of the deposit The ABS
monitoring capability also included programmable logic controllable (PLC) hardware integrated APH
model and temperature controller and NH3 injection controller The NH3 injection controller can provide
closed loop control to the SCR reagent injection process by estimating the mismatch between a unit NOx
emissions setpoint and the actual stack NOx indication to produce a NH3 bias that is applied to the DCS
programmed SCR NH3 flow vs unit load curve More description of the NH3 injection controller will be
provided in the Upgraded SCR Control Strategy Section
The Breenrsquos APH temperature controller includes an APH heat transfer calculation and a control scheme
that provides a bias to the plant DCSrsquo APH cold-end average temperature (the average of APH flue gas out
and APH air inlet temperatures) setpoint This setpoint has traditionally been used to control for the impact
of sulfuric acid dewpoint deposition The APH heat transfer calculation is based on a comprehensive
metalgas matrix model developed by Lehigh University which provides real time information on the
maximum APH metal temperature as a function of the axial distance from the APH cold-end The input
parameters used by the first-principle APH heat transfer calculation include flue gas and air inlet
temperatures and gas and air flow rates This information and the measured AbSensor evaporation
temperature are used by the APH temperature control scheme to estimate a potential ABS condensation
depth from the APH cold-end (the intersection of these two temperatures) The controller is then
manipulated to maintain an operational condensation depth within a setpoint ABS deposition depth that
represents the cleanable range of the sootblowers located (only) at the APH cold-end In case the actual
condensation depth is found to penetrate beyond the allowed condensation depth setpoint an APH cold-end
average temperature bias is introduced by the controller to the DCS This bias results in a manipulation of
the APH air bypass damper which changes the internal APH heat transfer patterns and modifies the APH
3-1
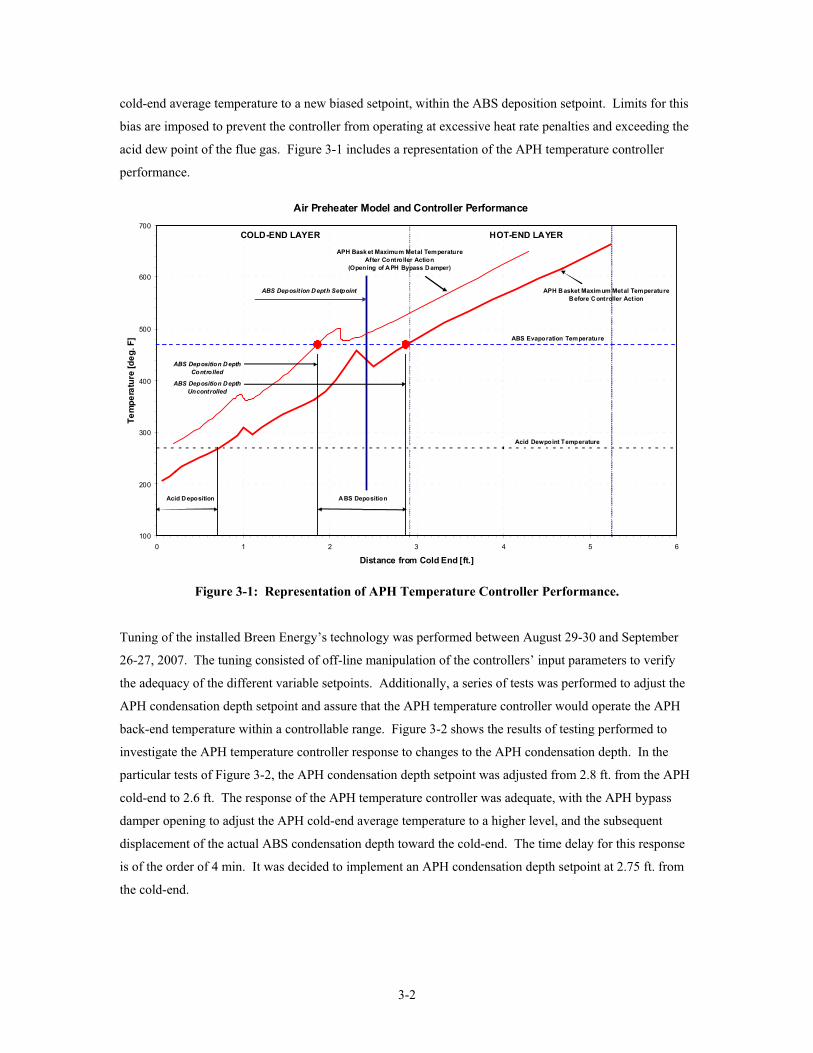
cold-end average temperature to a new biased setpoint within the ABS deposition setpoint Limits for this
bias are imposed to prevent the controller from operating at excessive heat rate penalties and exceeding the
acid dew point of the flue gas Figure 3-1 includes a representation of the APH temperature controller
performance
Tem
pera
ture
[deg
F]
700
600
500
400
300
200
100 0 1 2 3 4 5 6
Distance from Cold End [ft]
COLD-END LAYER HOT-END LAYER
ABS Deposition Acid D eposition
APH Basket Maximum Metal Temperature B efore C ontroller Action
ABS Evaporation Temperature
Acid Dewpoint Temperature
ABS Dep osition D ept h Setpoint
ABS Dep ositio n D epth Controlled
APH Bask et Maximum Metal Temperature After Controller Action
(Opening of APH Bypass Damper)
ABS Deposition D epth Un controlled
Air Preheater Model and Controller Performance
Figure 3-1 Representation of AP H Temperature Controller Performance
Tuning of the installed Breen Energyrsquos technology was performed between August 29-30 and September
26-27 2007 The tuning consisted of off-line manipulation of the controllersrsquo input parameters to verify
the adequacy of the different variable setpoints Additionally a series of tests was performed to adjust the
APH condensation depth setpoint and assure that the APH temperature controller would operate the APH
back-end temperature within a controllable range Figure 3-2 shows the results of testing performed to
investigate the APH temperature controller response to changes to the APH condensation depth In the
particular tests of Figure 3-2 the APH condensation depth setpoint was adjusted from 28 ft from the APH
cold-end to 26 ft The response of the APH temperature controller was adequate with the APH bypass
damper opening to adjust the APH cold-end average temperature to a higher level and the subsequent
displacement of the actual ABS condensation depth toward the cold-end The time delay for this response
is of the order of 4 min It was decided to implement an APH condensation depth setpoint at 275 ft from
the cold-end
3-2
200
220
APH C old-End Average Temperature
APH Bypass D amper Position
APH Co ndensatio n Depth
APH Con den sation Depth Setpo int
300
295
APH
Reci
rcua
ltion
Dam
per P
ositi
on [
] 290 180
285 160
280 140
Flue
Gas
Tem
pera
ture
[deg
F]
Con
dens
atio
n D
epth
[ft]
275 120
100
80
60
40
20
270
265
260
255
250
245
0 240 103336 104800 110224 111648 113112 114536 120000 121424 122848 124312
Figure 3-2 Performance of the APH Temperature Controller
Figure 3-3 shows results of testing performed to investigate the NH3 flow injection controller response to
changes in SCR inlet NOx In the particular tests of Figure 3-3 a boiler outlet NOx decrease was followed
by a corresponding decrease in reagent flow rate to compensate for the lower inlet NOx emissions and
maintain the stack NOx setpoint at a pre-determined value of 0095 lbMBtu The average stack NOx
emission level for this period was 0093 plusmn 0003 lbMBtu The drastic changes in NH3 flow in Figure 3-3
are most likely due to the delays associated with the NH3 controller
0200
0245 150
0240
0235
0230
0225
0220
0215
0210
0205
SCR Inlet NOx Ammonia Flow Bias
Stack NOx Setpoint = 0095 lbMbtu Average SCR Efficiency = 713
145
140
135
130
125
120
115
110
105
100
95
Am
mon
ia F
low
[lb
hr]
SCR
Inle
t NO
x [lb
MB
tu]
0195 90 103336 104800 110224 111648 113112 114536 120000 121424 122848 124312
Figure 3-3 Performance of Ammonia Injection Controller
3-3
Section 4
PARAMETRIC FIELD TESTS
Parametric field tests were performed at Cayuga Unit 1 Due to unit availability and station scheduling
these tests were performed during the weeks of November 26 December 3 and 10 2007 and January 14
2008 Testing was conducted by two ERC engineers with support from the station Testing was performed
at three unit loads 150 (full load) 100 and 75 MW while firing a baseline coal (as much as possible) The
load level of 75 MW is the minimum operating load for Cayuga Unit 1 The objective of these tests was to
obtain enough data under controlled conditions for characterizing the impact of boiler and low-NOx firing
system control settings sootblowing and SCR system and APH on SCR and APH performance boiler
outlet NOx (SCR inlet NOx) NH3 injection requirement unit heat rate and ABS formation Additionally
the parametric tests investigated the impact of SCR system operation APH bypass damper and sootblowing
scheduling on these same parameters of interest Test results were also used to build a database to be used
for artificial intelligence (AI) modeling and to obtain the best combinations of boiler firing system SCR
and APH operational settings for SCR system optimal control strategy and upgrades This report
concentrates on the results achieved at full load since that Cayuga Unit 1 is a base-loaded unit and it stays
most of the time at full load
Previous to the field tests a test plan was developed in collaboration with AES Cayuga engineers The
plan was reviewed and approved by the station The first planned step consisted of a survey of the boiler
and low-NOx and SCR system to determine baseline (as-found) conditions and control settings Also the
first step included performing an extended test at baseline settings Baseline settings are those as-found
settings commonly used by the operators The second planned step consisted of combustion and SCR
tuning For this tuning a permanently installed gas sampling grid and a portable gas analyzer was used to
sample the flue at the economizer exit or SCR inlet location The purpose of this tuning is typically to
perform adjustments to the boiler low-NOx firing system and NH3 injection to achieve balanced
combustion conditions at the boiler convective pass before the SCR inlet as well as balanced SCR
performance
Additionally a series of parametric tests was planned in which one or two boilerlow-NOx system
parameter was tested at a time while all other operating parameters were held constant The parameters
used for testing and their available operating ranges are included in Table 4-1 Additional testing was
performed to characterize the impact of CCOFA registers different pulverizers out-of-service (OS)
configurations the SCR economizer bypass dampers and boiler sootblowing
Six to seven tests were scheduled per day including a baseline test at the beginning of each day followed
by a series of parametric tests The duration of each test was dictated by the requirements of collecting a
4-1
Table 4-1 List of Testing Parameters and Their Limits
No Symbol Variable description Unit Upper limit Lower limit 1 O2 Excess O2 40 25
2 SOFA Average top SOFA Opening 100 0
3 aST SOFA Tilt Deg 25 -15
4 aBT Burner Tilt Deg 15 -15
5 Fcoal Coal flow rate of top mill th 19 0 (OFF) 6 NH3 Ammonia flow rate lbh 250 0
7 DAPH APH bypass damper position 100 0
sufficient quantity of fly ash sample and sufficient steady-state data Steadiness of data was recognized
after changes in control settings and the associated transient that occurs after the upset by flat trending in
emissions NH3 consumption steam temperatures and attemperation and flue gas temperatures at the boiler
back-end Economizer excess O2 was measured at the economizer outlet and was used as an indication of
the amount of excess air fed to the boiler the average of the top and middle SOFA register openings was
used as an indication of combustion staging The average burner and SOFA tilt angles and the coal flow
rate to the top 1A1-Mill were included in the parametric list to fully characterize the relationship between
boiler control settings and boiler outlet or SCR inlet NOx and unit thermal performance The NH3 flow rate
was measured at the SCR injection point and together with the APH bypass damper position was used to
characterize parametric relationships for the SCR and APH respectively Coal and fly ash was sampled
daily and for each test run respectively and analyzed off-line Fly ash samples were collected from the
first row of ESP hoppers and combined into a composite sample and analyzed for unburned carbon or loss
on ignition (LOI) For fly ash sample collection ESP tests hoppers were evacuated as part of their
operational cycle and put on bypass to accumulate samples for each corresponding test run
Average data on SCR inlet and outlet NOx and SCR NOx removal efficiency (defined as the normalized
NOx reduction across the SCR with respect to the inlet NOx) main steam and hot reheat steam
temperatures attemperating flow rates boiler flue gas and air temperatures were acquired from the plant
OSI soft PI data acquisition system for each test point ABS formation temperature was measured at the
APH inlet as indicated by the Breenrsquos probe and its signal incorporated into the OSI soft PI system
Indication of net unit heat rate deviation or penalty for each test point or combination of test parameters
with respect to baseline conditions was estimated from a heat and mass balance model of the unit A
description of the procedure used to estimate the heat rate difference with respect to baseline conditions is
include in Appendix A Sootblowing tests were performed to characterize the impact of different groups of
sootblowers on the parameters of interest For these tests activation of selected group of blowers was
carried out at steady boiler low-NOx firing system and SCR system control settings
4-2
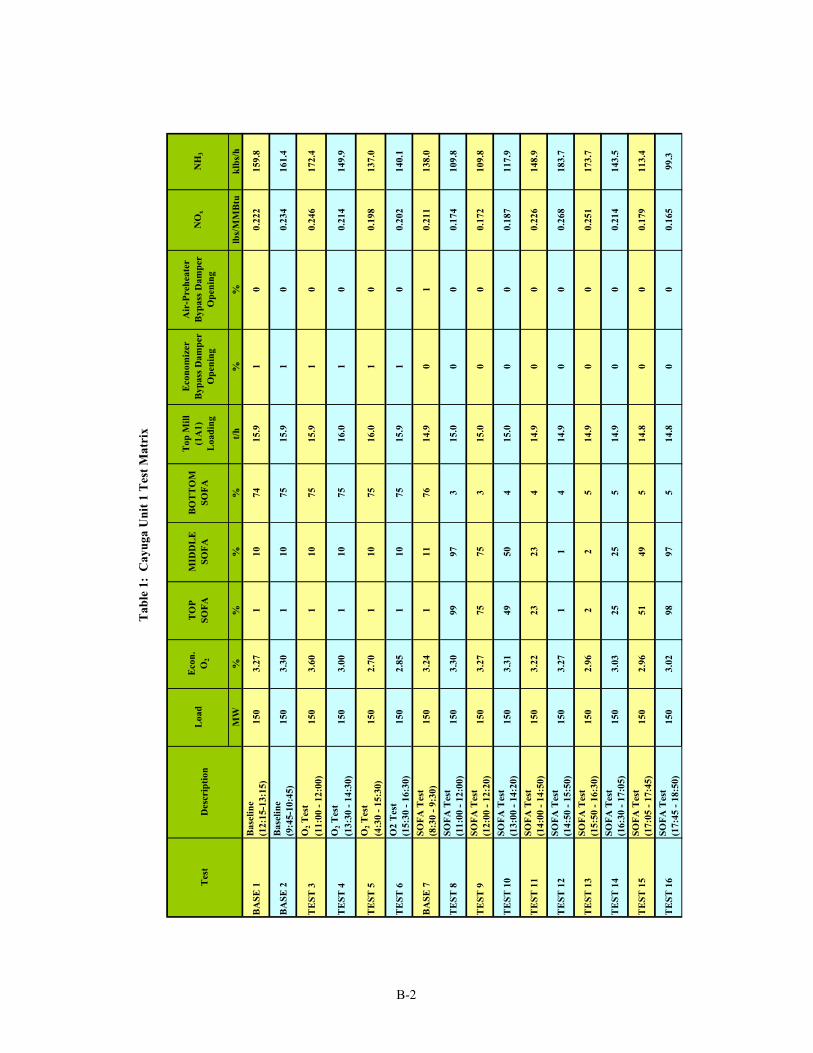
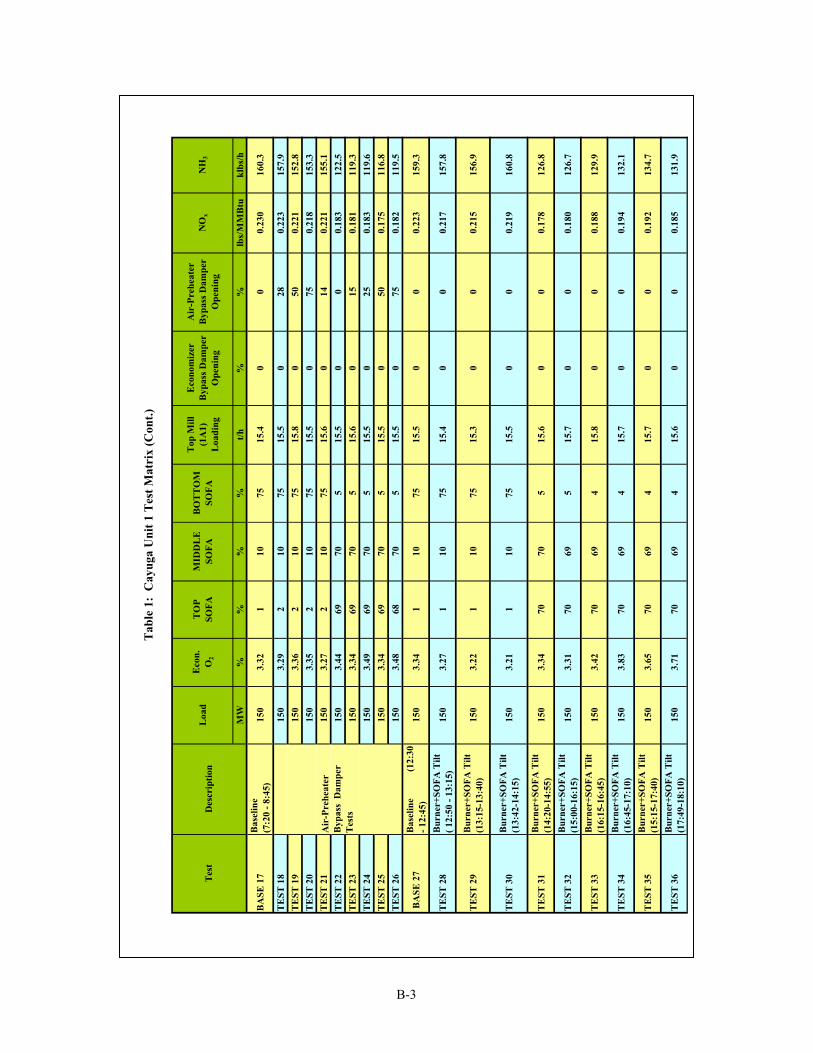
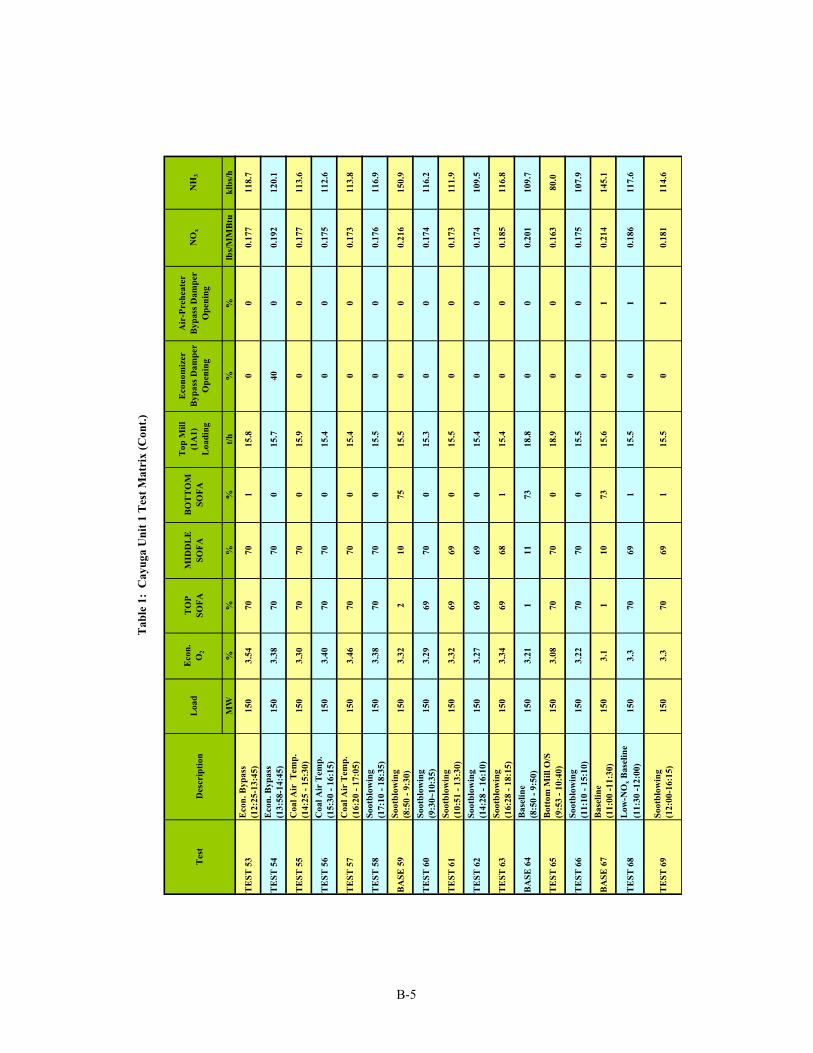
Table B-2 in Appendix B contains the matrix of the field tests that were performed at Cayuga Unit 1
Table B-2 describes the particular conditions of the parameters of interest A total of 102 tests were
performed These tests involved manipulation of combustion and the low-NOx firing system the SCR
system the APH and sootblowing The maximum level of manipulation of each particular parameter was
determined in conjunction with the plant staff in terms of having enough data to characterize the effect of
each parameter on the variables of interest (ie NH3 consumption SCR NOx reduction efficiency unit heat
rate etc) and in accordance with the unit operational and environmental constraints (ie minimum
windbox pressure maximum allowable ABS penetration depth maximum stack opacity maximum fly ash
LOI level etc)
4-3
Section 5
DATA ANALYSIS RESULTS AND DISCUSSION
DATA ANALYSIS RESULTS
Before performing any parametric field tests sampling of the flue gas was performed A permanently
installed 8 x 4 gas sampling grid and a portable gas analyzer was set up to sample the flue at the SCR inlet
location The purpose of this sampling is to determine the level of NOx stratification in the input flue gas to
the SCR and injected NH3 stratification at the SCR inlet Guided by the results of this activity
adjustments to the boiler and low-NOx firing system are typically planned (ie corner-to-corner
combustion balancing) to achieve balanced combustion conditions at the boiler convective pass before the
SCR inlet Additionally signs of NH3 stratification are corrected by adjustment to the NH3 injection
valves However this was not an option at Cayuga Unit 1 since no modulation valves are available for
localized NH3 flow manipulation Figure 5-1 shows a contour plot of the measured excess O2 and NOx
concentration at the SCR inlet The most important data NOx emissions (corrected to 30 O2) indicate
that the range of NOx concentration is from 297 to 313 ppm at 3 O2 This is approximately a 52
deviation of the mean which is within recommended flue gas stratification for SCR applications No
further action was taken on manipulating combustion for homogenizing the flue gas at the SCR inlet
Figure 5-1 Contour Plots of O2 and NOx Concentration at the SCR Inlet
Data obtained from the parametric field tests were reduced and analyzed to determine trending
relationships between independent or controllable parameters and the boiler SCR and APH dependent
parameters The independent parameters investigated for the boiler included excess O2 SOFA settings
5-1
burner and SOFA tilt positions and the coal flow rate to the top 1A1-Mill The dependent parameters
included boiler outlet or SCR inlet NOx emissions rate the NH3 flow requirement to achieve 0095 lbMBtu
NOx at the stack the SCR NOx removal efficiency (calculated as the normalized NOx reduction across the
SCR with respect to the inlet NOx level) the SCR inlet gas temperature and APH gas outlet gas
temperature the main and hot reheat steam temperature and attemperating spray flows the ABS formation
temperature and condensation depth in the APH fly ash LOI and the calculated heat rate deviation or
penalty
From the data analysis it was estimated that the impact of excess O2 on boiler NOx emissions level is
approximately a 0055 lbMBtu drop per percent reduction in excess O2 This translates in a reduction in
NH3 flow requirement of approximately 41 lbhr of NH3 to maintain the stack NOx constraint of 0095
lbMBtu at the stack Excess O2 was also found to modestly increase SCR removal efficiency for the
particular SCR system at Cayuga Unit 1 This impact on SCR efficiency correlated to the inverse
relationship between excess O2 and flue gas flow rate and SCR residence time The impact of excess O2 in
flue gas temperature was found to be of approximately -8degF O2 at the SCR inlet and insignificant at the
APH outlet Excess O2 increase was found to increase steam temperatures and the attemperating spray
requirement if the steam temperatures exceed the design values by approximately +15degF O2 Fly ash
LOI increases almost a percent per reduction of a percent point in excess O2 The impact of O2 on these
performance parameters results in a parabolic trend with respect to boiler heat rate penalty resulting in a
minimum in heat rate at approximately 315 (see Figure 5-2) The reduction in excess O2 for boiler
emissions reduction also helps reduce ABS formation temperature by approximately 125degF per percent
reduction in O2 (see Figure 5-3) The ABS probe evaporation temperature was used as the best indication
of ABS formation temperature based on the experience of Breen Energy Opacity was noticed to increase
by only 07 for the range of O2 used in the excess air tests (25-40 O2)
The impact of the overfire air registers on the variables of interest was found to be of first order The
CCOFA and SOFA registers were manipulated at different opening levels and vertical biases It was found
that the effect of CCOFAs and the lower elevation SOFA register on boiler NOx and flue gas and steam
temperatures was of second order The top two elevations of SOFA opened at identical setting were
found to be most effective in reducing boiler outlet NOx Hence these two registers were used in the
SOFA tests Figures 5-4 to 5-7 show some of the results obtained from the data analysis in relation to the
SOFA register openings Figure 5-4 shows the reduction in required NH3 flow to comply with a stack NOxconstraint of 0095 lbMBtu as a function of SOFA register opening The SOFA indication used in the
plots corresponds to the average position of the top two SOFA registers It was found that reductions of the
order of 35 can be achieved from baseline NH3 injection flow rates over the physical range of the SOFA
registers This level of NH3 flow consumption (and SOFA opening) impacts the deposition of ABS and the
location of the ABS deposition depth along the APH axis (see Figure 5-5) The goal is to keep the ABS
5-2
Cayuga Unit 1 Unit Heat Rate Penalty vs O2
Unit
Hea
t Rat
e Pe
nalty
[Btu
kw
h]
88
86
84
82
80
78
76
74
72
Baseline or Reference Tests
y = 53417x2 - 33 874 x + 611 16 R2 = 07911
250 270 290 310 330 350 370
Excess O2 [] Figure 5-2 Impact of Boiler Excess O2 on Unit Heat Rate Penalty
APH
AB
S F
oulin
g Te
mpe
ratu
re [d
eg F
]
Cayuga Unit 1 APH ABS Fouling Temperature vs O2
470
460
450 y = 12418x + 41182
R2 = 07332 440
430
420 Baseline or Reference Tests
410
400
390
y = 202x + 33714 R
2 = 08767
Fouling Evap Temp
Fouling Formation Temp
380 250 270 290 310 330 350 370
Excess O2 []
Figure 5-3 Impact of Boiler Excess O2 on ABS Formation Temperature
deposition depth closer to the APH cold-end where sootblowers can reach the deposits and clean them An
ABS deposition depth setpoint was set at Cayuga Unit 1 at 275 ft from the APH cold-end Also impacted
by the SOFA registers is the SCR efficiency and net unit heat rate Figures 5-6 and 5-7 show the effect of
OFA opening on SCR NOx reduction efficiency and unit heat rate penalty respectively The negative
impact on SCR efficiency is associated to the changes in flue gas temperature The negative impact on unit
5-3
heat rate is associated to the increase in fly ash LOI and increase in flue gas temperature The impact of
SOFA registers on fly ash LOI was more noticeable at openings in excess of 60 where the LOI increases
up to 6 The impact of SOFA on stack opacity is negligible
Cayuga Unt 1 Ammonia Flow Rate vs OFA
0 10 20 30 40 50 60 70 80 90 100
y = 00092x2 shy 17071x + 17777 R2 = 09971
y = 00096x2 shy 16081x + 17593 R2 = 09594
0
20
40
60
80
100
120
140
160
180
200
Am
mon
ia F
low
Rat
e [lb
hr]
O2=33
O2=30
Poly
B aseline
Am monia Consumption R eduction
Average Top OFAs Register Position []
Figure 5-4 Impact of SOFA Registers on NH3 Flow Requirement
y = -9E-05x2 - 00034x + 27927 R2 = 09977
ABS Deposition Depth (from Cold-End) Setpoint
y = -00112x + 27989 R2 = 09192
O2=30APHA
O2=30APHB
Air
Preh
eate
r AB
S D
epos
ition
Dep
th [f
t]
35
30
25
20
15
10
05
00 0 10 20 30 40 50 60 70 80 90 100
Average Top OFAs Register Position []
Cayuga Unit 1
Air Preheater ABS Deposition Depth vs OFA
Figure 5-5 Impact of SOFA Registers on ABS Deposition Depth
5-4
Cayuga Unt 1 SCR Efficiency vs OFA
950
945
y = 8E-06x2 - 0001x + 09439 R2 = 09732
y = 3E-06x2 - 00007x + 09465 R2 = 09842
0 10 20 30 40 50 60 70 80 90 100Average Top OFAs Register Position []
O2=33
O2=30
SCR Efficiency = [NOxi- NOxo]NOxi
Baseline
SCR
NOx R
emov
al E
ffici
ency
[] 940
935
930
925
920
915
910
905
900
Figure 5-6 Impact of SOFA Registers on SCR Removal Efficiency
0
Cayuga Unt 1 Unit Heat Rate Penalty vs OFA
130
Unit
Heat
Rat
e Pe
nalty
[Btu
kw
h]
120
110
100
90
80
70
60
50
40
30
20
10
0
O2=33
O2=30 y = 04097x + 75131 R2 = 08168
y = 0439x + 69173 R2 = 09395
Baseline
Net Heat Rate Penalty Referred With Respect to Minimal Heat Rate Achieved from Tests
0 10 20 30 40 50 60 70 80 90 10Average Top OFAs Register Position []
Figure 5-7 Impact of SOFA Registers on Unit Heat Rate Penalty
Testing was performed to investigate the effect of biasing coal flow and taking selective mills OS on boiler
outlet NOx emissions It was found that the most significant impact is introduced by the top 1A1
5-5
pulverizer Special effort was devoted to perform systematic tests on the 1A1-Mill by biasing its coal flow
until taking the mill completely off While this was done the other bottom mills were loaded equally
Figure 5-8 shows the relationship between 1A1-Mill coal flow and SCR inlet NOx emissions The
reduction in coal flow from its maximum flow rate of 19 tonhr to the OS condition represents a reduction
in NOx emissions rate of 0048 lbMBtu The corresponding reduction in NH3 flow to maintain the target
NOx emissions at the stack is 27 lbhr For this reason this parameter was included in the optimization list
of parameters however changes in coal quality that would require a higher total coal flow to produce the
same unit load will preclude biasing of the top mill Reduction in coal flow to the top 1A1-Mill has a
modest detrimental impact on SCR NOx removal efficiency No significant impact was found from the top
mill biasing on flue gas temperatures The impact of 1A1-Mill biasing on steam temperatures and
attemperation was very significant representing more than 1oF increase per tonhr of coal flow reduction
This might be due to the change in heat transfer pattern in the furnace leading to an increase in furnace exit
gas temperature (FEGT) Top mill biasing has only a minor impact on ABS deposition and stack opacity
The impact of 1A1-Mill on fly ash LOI is of approximately 05 for the range of fully loaded to OS The
impact of heat rate deviation represents approximately 45 BtukWh per tonhr reduction in coal flow rate
This impact is related to the improvement in combustion in the lower furnace as well as in steam
temperature in excess of design levels
Cayuga Unt 1 SCR Inlet NOx Emissions vs Mill 1A1 Flow Rate
021
020
019
018
017
016
015
014
SCR
Inle
t NO
x Em
issi
ons
Rat
e [lb
MB
tu]
y = 00025x + 01401 R2 = 05524
beta-NOx (SCR in)
Baseline or Reference Tests
0 2 4 6 8 10 12 14 16 18 20
Mill 1A1 Flow Rate [th]
Figure 5-8 Impact of 1A1-Mill Coal Flow Rate on SCR Inlet NOx Emissions
The other additional parameters that were investigated at the boilercombustion side were the burner and
SOFA tilt One technique that results in reduction in boiler NOx emissions in tangentially-fired boilers is
5-6
the enhancement in combustion staging by stretching the fireball by lowering the burner tilts and raising
the overfire air tilts This was implemented in a series of parametric tests that included combination of both
parameters It was found that burner tilt helped reduce NOx emissions with a minimum emissions level
achieved in the range form -5 to -8 deg Improvements in NOx emissions were also found with upward
tilting of the SOFA registers with the most reduction achieved at SOFA tilts between 0 and +6 deg
Moving down the convective pass trending relations and trade-offs were investigated for the SCR and
APH The independent parameters investigated for the SCR included the economizer bypass damper and
the NH3 treatment in the catalyst also indicated by the normalized stoichiometric ratio (NSR) or the molar
ratio of NH3 to NOx The dependent parameters affected by those independent parameters at the SCR
include the SCR inlet gas temperature the SCR performance efficiency and ABS formation temperature
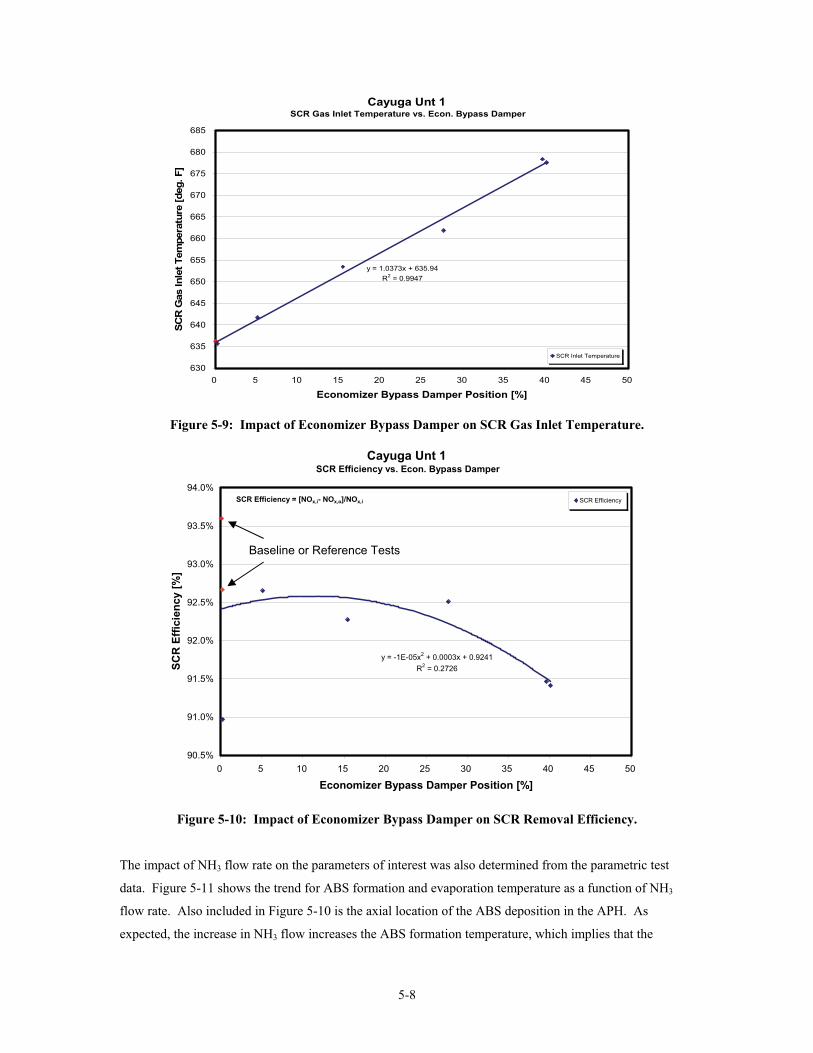
and deposition as applicable Tests that involved manipulation of the economizer bypass dampers were
performed in the range from fully closed to 40 open The economizer bypass damper vs SCR inlet
temperature resulting trend is included in Figure 5-9 As it can see from Figure 5-9 an increase in
economizer bypass damper results in a steep increase in flue gas temperature of about +1degF per percent
opening and at about 40 open the SCR inlet gas temperature approaches the 700degF limit recommended
by the SCR manufacturer However when plotting the opening of the economizer bypass damper vs the
SCR NOx reduction efficiency it was found that the efficiency has an inverse relationship with the
economizer bypass damper opening This indicates that the SCR catalyst formulation is such that works on
the right-hand side of the SCR vs temperature curve reducing NOx conversion efficiency as the catalyst
temperature increases (see Figure 5-10) For this reason this parameter was excluded from the
optimization list of parameters From the economizer bypass damper testing it was also found that the
ABS deposition is not affected by changes in economizer bypass opening
5-7
Cayuga Unt 1 SCR Gas Inlet Temperature vs Econ Bypass Damper
SCR
Gas
Inle
t Tem
pera
ture
[deg
F]
685
680
675
670
665
660
655
650
645
640
635
630
y = 10373x + 63594 R2 = 09947
SCR Inlet Temperature
0 5 10 15 20 25 30 35 40 45 50
Economizer Bypass Damper Position []
Figure 5-9 Impact of Economizer Bypass Damper on SCR Gas Inlet Temperature
Cayuga Unt 1 SCR Efficiency vs Econ Bypass Damper
y = -1E-05x2 + 00003x + 09241 R2 = 02726
905
910
915
920
925
930
935
940
SCR
Effi
cien
cy [
]
SCR Efficiency SCR Efficiency = [NOxi- NOxo]NOxi
Baseline or Reference Tests
0 5 10 15 20 25 30 35 40 45 50
Economizer Bypass Damper Position []
Figure 5-10 Impact of Economizer Bypass Damper on SCR Removal Efficiency
The impact of NH3 flow rate on the parameters of interest was also determined from the parametric test
data Figure 5-11 shows the trend for ABS formation and evaporation temperature as a function of NH3
flow rate Also included in Figure 5-10 is the axial location of the ABS deposition in the APH As
expected the increase in NH3 flow increases the ABS formation temperature which implies that the
5-8
probability of ABS condensing at higher temperatures and consequently penetrating toward the APH hot-
end is higher As shown in Figure 5-11 increasing the NH3 flow rate higher than 110 lbhr results in a
deposition layer that moves beyond a 275 ft mark from the APH cold-end and at NH3 flow rates in
excess of 130 lbhr the likelihood of exceeding the 275 ft threshold for sootblowing removal is greatly
enhanced Obviously these results can be modified by variations in the SO3 concentration in the flue gas
Cayuga Unit 1 Ammonia Injection vs APH ABS Formation and Deposition
500 500
450 450
y = -00204x2 + 66212x - 79839 R2 = 07963
y = -00087x2 + 32555x + 10475 R2 = 0863
ABS Evap Temp ABS Form Temp ABS Dep Depth-A APH ABS Dep Depth-B APH
0 20 40 60 80 100 120 140 160 180 200
Ammonia Flow Rate [lbhr]
AB
S Fo
rmat
ion
and
Evap
orat
ion
Tem
p [d
eg F
]
400
350
300
400
350
300
AB
S D
epos
ition
Dep
th[ft
fro
m A
PH C
old-
End]
250 250
200 200
150 150
100 100
05050
0 000
Figure 5-11 Impact of Ammonia Flow on ABS Formation Temperature and Deposition
Figure 5-12 also shows results of NH3 treatment with respect to ABS formation temperature expressed as
NH3NOx ratio or NSR For the particular SCR at Cayuga Unit 1 the ABS formation temperature tends to
increase with NH3 treatment Similarly the concentration of NH3 in the fly ash increases with NSR
However the NH3 concentration in the ash is relatively small (less than 60 ppmw) for NSR levels as high as
115 This is considered a very low level of NH3 contamination with values larger than 100 ppmw
considered of importance when using the fly ash for concrete applications
5-9
Cayuga Unit 1 ABS Formation Temperature and NH3 in Fly Ash vs NH3NOx Mole Ratio
360
y = 27785x2 - 42593x + 1766 R2 = 06437
y = -15969x2 + 23607x + 15506 R2 = 06902
120
NH3NOx Mole Ratio
40 340
20320
440 120
420 100
400 80
380
AB
S Fo
rmat
ion
Tem
pera
ture
[deg
F]
Am
mon
ia in
Ash
[mg
kg]
60
300 0 080 085 090 095 100 105 110 115
Figure 5-12 Impact of NSR on ABS Formation Temperature and Ammonia in Ash
The independent parameter investigated for the APH was the air bypass damper This parameter is used in
the winter to increase the temperature at the APH cold-end to avoid acid dewpoint condensation A similar
approach works for ABS where the APH air bypass damper can be used to maintain the ABS deposition
location toward the cold-end and outside a previously determined limit of 275 ft where the sootblowers
located at the APH cold-end can reach and clean the ABS deposit Manipulation of the APH air bypass
dampers (one for each rotating APH) has an impact on the APH metal temperatures which helps mitigate
the ABS deposition but also on the gas outlet temperature which detrimentally impact unit heat rate Tests
that involved manipulation of the APH air bypass damper were performed in the range from fully closed to
75 open as allowed by the plant Figures 5-13 to 5-15 show the trends between the APH bypass damper
position vs ABS deposition depth APH gas outlet temperature and resulting unit heat rate penalty In
Figure 5-13 it can be seen that the APH bypass damper is effective in moving ABS formation from inside
the 275 ft threshold to the cold-end However Figure 5-14 shows that this improvement made in ABS
deposition depth is accompanied by a significant increase in APH flue gas outlet temperature of the order
of 50oF for the range of APH damper manipulation from 0 to 75 This increase in stack losses has an
impact on the net unit heat rate of as much as 150 BtukWh (Figure 5-15) This means that it is very
important to control NH3 injection and maintain an optimal performance at the SCR to minimize NH3 slip
which adversely impacts ABS formation When the conditions are such that ABS formation beyond the
established threshold is inevitable manipulation of the APH bypass damper is necessary However this
should be a last resource because the cost associated with the heat rate penalty has to be assessed against
the cost of washing a fouled APH
5-10
APH
AB
S D
epos
ition
Dep
th [f
t]
Cayuga Unt 1 APH ABS Deposition Depth vs APH Bypass Damper
350
300
250
200
150
100
050
000
y = -9E-06x2 - 00171x + 27175 R2 = 09119
y = 00002x2 - 00264x + 28744 R2 = 0879
APH A APH B Poly (APH A) Poly (APH B)
0 10 20 30 40 50 60 70 80 90 100
Air Preheater Bypass Damper Position []
Figure 5-13 Impact of APH Bypass Damper Position on ABS Deposition Depth
APH
Gas
Out
let T
empe
ratu
re [d
eg F
]
Cayuga Unt 1 APH Gas Outlet Temperature vs APH Bypass Damper
360
350
340
330
320
310
300
290
280
y = 00065x2 + 01789x + 29353 R2 = 09836
y = 00048x2 + 03037x + 29987 R2 = 09608
APH A APH B Poly (APH A) Poly (APH B)
0 10 20 30 40 50 60 70 80 90 100
Air Preheater Bypass Damper Position []
Figure 5-14 Impact of APH Bypass Damper Position on APH Flue Gas Exit Temperature
5-11
Cayuga Unt 1 Unit Heat Rate Penalty vs APH Bypass Damper
0
20
40
60
80
100
120
140
160
180
200
Uni
t Hea
t Rat
e Pe
nalty
[BTU
kW
h]
0 10 20 30 40 50 60 70 80
APH Bypass Damper []
Figure 5-15 Impact of APH Bypass Damper Position on Unit Heat Rate Penalty
Additionally sootblowing tests were performed to investigate the impact of different sootblowing routines
on the operation of the SCR system and associated NOx reduction and NH3 consumption Sootblowing
tests were performed with the unit at steady operating conditions These sootblowing tests included
activation of wallblowers (IRs) and retractables in the convective pass (IKs) including the SCR reactor and
the APH It takes approximately 2 minutes to blow individual IRs 8 minutes to blow IKs and of the order
of 20 minutes to blow individual sootblowers at the SCR and APH Cayuga Station burns a range of
bituminous coals that have a potential for high-temperature slagging and fouling which has imposed a
sootblowing schedule that runs continuously However the plant has not optimized its sootblowing
practice and each operator blows soot in hisher own preferred way once all the boiler is cleaned once per
12-hour shift Some areas that are critical such as the APH and the boiler slope area might be cleaned at a
higher frequency
The sootblowing tests performed as part of this project targeted at evaluating the impact of sootblowing
scheduling on SCR related variables while not overlooking the slaggingfouling constraint Figure 5-16
shows results from one of these tests where selective IRs IKs and the SCR and APH were cleaned
sequentially As a consequence of the sootblowing activation the flue gas temperature at the SCR declined
and the SCR reactor was cleaned This led as seen in Figure 5-16 to a drop in ABS formation
temperatures and a reduction in the NH3 flow rate to achieve the prescribed NOx stack limit Based on the
results of these tests a sootblowing schedule is proposed that considers the cleaning constraints of selected
fouling-sensitive areas such as the APH This schedule is included in Figure 5-17 for each shift The
5-12
recommended schedule suggests activation of IR blowers at the waterwalls every 10 min alternating
blowers from each ring (A B and C) as well as cleaning of the SCR once a shift and of the APH three
times per shift
Cayuga Unit 1
480 Dilution skid ammonia flow
240 Fouling formation temp Fouling evap temp
440
220
400
200
Am
mon
ia F
low
[lb
h]
360 180
Sootblowing - IRs IKs SCR APH 320
160
140 280
120 240
100 200 000 100 200 300 400 500 600 700 800 900 1000 1100 1200 1300 1400 1500 1600 1700 1800 1900 2000 2100 2200 2300
Time
AB
S Te
mpe
ratu
re [d
eg F
]
Figure 5-16 Results of Sootblowing Tests
Hour Minute
Wall
0 10
A B
20
C
30 40 50 60 10 20 30 40 50 60 10 20 30 40 50 60 10 20 30 40 50 60 10 20 30 40 50 60 10 20 30 40 50 60
A B C A B C A B C A B C A B C A B C A B C A B C A B C A B C A B C A
5 61 2 3 4
IK 1R 6L 10R 4L 8R 12L
Ecno E2 E4 E1 E3
SCR 6 5 4
APH A B A B
Hour Minute
Wall
10 20
B C
30 40 50 60 10 20 30 40 50 60 10 20 30 40 50 60 10 20 30 40 50 60 10 20 30 40 50 60 10 20 30 40 50 60
A B C A B C A B C A B C A B C A B C A B C A B C A B C A B C A B C
11 127 8 9 10
IK 1L 6R 10L 4R 8L 12R
Ecno E2 E4 E1 E3
SCR 3 2 1
APH A B
Figure 5-17 Proposed Sootblowing Schedule
5-13
As part of this project theoretical estimates were performed to consider the impact of modifications to
boiler SCR and APH control settings on mercury (Hg) emissions at the boiler back-end Mercury is a
toxic pollutant that has a significant impact on human health Coal-fired power plants constitute the largest
source of anthropogenic Hg emissions in the United States There is pending (vacated) federal regulation
and current stringent limits from some states including New York for controlling Hg emissions from coal-
fired boilers Based on a numerical model developed by Lehigh University calculations were performed of
selected modified boiler conditions and their impact on Hg The numerical model includes a gas-phase Hg
chemical kinetic model composed of 92 reversible reactions and 35 species This model is able to simulate
homogeneous Hg oxidation in the boiler flue gas and heterogeneous Hg oxidation by the fly ash Model
results have been validated by bench-scale experimental data from the literature and matched with full-
scale experimental data obtained from field tests at two power generation units
Model Hg emissions results are included in Table 5-1 Table 5-1 includes the residence time used for each
section of the convective pass where flue gas temperature data were available and the corresponding
temperatures at the inlet of each section These sections start at the furnace exit and include the SCR inlet
APH inlet and outlet and the stack A linear temperature profile was used for each reactor A typical
Eastern bituminous coal composition and Hg content was used in the simulations The results included in
Table 5-1 indicate changes in boiler conditions that lead to changes in excess O2 level and fly ash LOI are
not sufficient to cause a significant change in Hg emissions Mercury emissions were expressed in relation
to elemental mercury (Hg0) For both distinct set of operating conditions Hg0 is reduced in the convective
pass to about 79 at the SCR inlet and completely reduced to oxidized mercury (H2+) after crossing the
SCR The model does not include the impact of Hg oxidation on the SCR catalyst
Table 5-1 Mercury Emissions Estimates for Different Boiler Operating Conditions
Location Temperature (degdegF) Residence Time (sec) Hg0 Emissions Excess O2 = 330 Fly Ash LOI = 25 Furnace Outlet 2100 0 125E-09 SCR Inlet 637 17 981E-10 APH Inlet 636 23 945E-11 APH Outlet 295 29 319E-17 Stack 159 34 553E-17 Excess O2 = 285 Fly Ash LOI = 35 FEGT 2080 0 125E-09 SCR Inlet 638 17 999E-10 APH Inlet 636 23 944E-11 APH Outlet 297 29 325E-17 Stack 159 34 309E-17
5-14
MODELING RESULTS
Artificial intelligence (AI) modeling was performed on the data collected in the parametric testing The AI
modeling consisted of neural networks (NNs) and accurate on-line support vector regression (AOSVR)
model development NNs are mathematical algorithms that use interconnecting artificial neurons that
mimic the properties of biological neurons Support vector regression is a data-driven supervised learning
method for classification and regression problems based on statistic learning theory AOSVR posses the
ability of being universal approximators of any multivariate function to any desired degree of accuracy
Belonging to the family of Kernel methods AOSVR transfers the input space to a high dimension feature
space by a nonlinear map thus original nonlinear relationships can be approximated as a linear function
f
f ( ) w x = lt ( ) w x + b
Where ( i yi ) i = 1 2 l and xi E Rm yi E R is the training data set x is the dot product b is the
threshold and w is the weight vector which can be identified under a given regularized risk function NN
and AOSVR both provided comparable model result accuracy However the AOSVR method overcomes
some of the problems of artificial NNs associated with slow training local minima and poor interpretability
of the results Results on the AOSVR modeling are included in this report
AOSVR was used to built artificial intelligence-based functional relationships between the boiler outlet or
SCR inlet NOx level and heat rate penalty (with respect to the design heat rate level) and the first five
parameters included in Table 4-1 (O2 SOFA aST aBT and Fcoal) The AOSVR model was trained with
the database obtained from the parametric tests and adaptively updated with real-time data sets Four
thousand data points were extracted from real-time data at a 1-minute sample rate and used for AOSVR
adapting Figure 5-18 shows a comparison between the on-line data and the predicted model results for
boiler outlet NOx emissions rate The AOSVR showed good convergence and acceptable learning
efficiency AOSVR accurate learning results from its efficient data updating and it is well suited for time-
varying systems The prediction performance of proposed AOSVR models was evaluated using a mean
absolute percentage error (MAE) as validation criterion which is defined as
y - y1 i iMAE = tn
x100 n i=1 yi
Where n is the sample size yi denotes the sample data and yi is the modeling output value The MAE
value for the AOSVR boiler outlet NOx and heat rate penalty was 165 Smaller values of MAE indicate
better model predicting capabilities
5-15
046
040
034
028
022
016
010
Time [min]
NO
x em
issi
ons
[lbM
Btu
] Predicted Values Sampling Data
0 500 1000 1500 2000 2500 3000 3500 4000
Figure 5-18 Modified AOSVR NOx Emissions Model Prediction Results
Figure 5-19 shows AOSVR model trending results for the impact of boiler parameters on heat rate
deviation or penalty The modeling results in Figure 5-19 are consistent with the trending expected from
each of the selected boiler control settings The heat rate penalty vs excess O2 exhibits a second order
trend where increase in heat rate to the left is due to increases in fly ash LOI and to the right due to stack
losses The trending with respect to burner and SOFA tilt angle is related to the enhancement in steam
temperatures due to the changes in radiant heat when the burners are modulated The increased trending in
heat rate penalty with respect to increased coal flow to the top elevation mill and the SOFA register
opening is due to the decrease in particle burnout residence time that occurs when the upper elevation of
burners is in-service (IS) and to the cooling effect to the fireball caused by the SOFA respectively
Modeling results obtained from the AOSVR model were compared with actual plant data obtained during
the parametric tests showing a good degree of accuracy
OPTIMIZATION RESULTS
The functional relationships obtained from the AOSVR modeling were then used to perform a
boilerSCRAPH mathematical optimization Additionally relationships for the lowest required NH3injection flow rate as a function of SCR inlet NOx and for heat rate penalty as a function of the APH air
bypass level were used in the optimization Figure 5-20 shows the plot of minimal NH3 flow rate vs SCR
inlet NOx The minimal NH3 vs SCR inlet NOx curve shows a rapid increase when the SCR inlet NOxlevel exceeds the 026 lbMBtu which is characteristic of the catalyzed NOx reduction process in the SCR
5-16
20
100
160
40
80
120
HR
[Btu
kW
h]SOFA=100
SOFA=50 SOFA=0
0 24 26 28 30 32 34 36 38 40
O2 []
100
O2 =40
20
40
60
80
O2=40
O2=35
O2=32 O2=30
-15 -13 -11 -9 -7 -5 -3 -1
80
60
O2 =30
O2 =35 O2 =32
40[B
tuk
Wh]
HR
[B
tuk
Wh]
HR
20 -15 -10 -5 0 5 10 15 20 25 30
[Deg] [Deg]aST aBT
100 140
O2=35 100
HR
[Btu
kW
h]
O2=40
O2=32
O2=30
12080 O2=40 O2=35
O2=32 O2=30
[B
tuk
Wh]
HR
60
80 40
60
40
20 0 4 8 12 16 20 0 20 40 60 80 100
Fcoal [th] SOFA []
0
1
reactor Maintaining the NH3 injection rate with the same slope as the one exhibited at low NOx levels (lt
026 lbMBtu) would result in violation of the stack NOx emissions constraint An increase in NH3 flow is
required at larger SCR inlet NOx levels This increase in reagent requirement for elevated SCR inlet NOx
levels is what increases the risk of NH3 slip and subsequent formation of ABS in the ducting and
equipment downstream of the SCR
Figure 5-19 Trained AOSVR Model Results for Boiler Heat Rate Penalty
5-17
0
40
80
120
160
200
240
280
010 012 014 016 018 020 022 024 026 028
Lowe
st am
monia
flow
rate
[lbhr
]
SCR Inlet NOx Emission Rate [lbMBtu]
Figure 5-20 Lowest NH3 Flow Rate vs SCR Inlet NOx
The optimization was performed in two steps using genetic algorithms (GAs) GA is a class of stochastic
search optimization technique which derives its behavior from the evolutionary theory of natural selection
In this work the Niched Pareto genetic algorithm (NPGA) was used A Pareto optimal set is a set of
solutions that are non-dominated with respect to each other In the NPGA approach a higher number of
individuals are involved in competition resulting in a higher searching efficiency achieved A solution is
Pareto optimal if it is not dominated by any other solution in the solution space In the GA solution used in
this project a multi-objective optimization (MOO) problem was formulated as
[ f ( ) f ( ) f ( )]min f x( ) = x x x1 2 k
s t g x ( ) 0( ) = 0h x
Where x = [x x x ]T EX is the vector of decision variables in the decision space 1 2 n
nX f R - R i =1 2 k is the objective function and g ( )- and h ( )- are the inequality and equalityi
constraint vectors The MOO problem was defined to find the particular set x EX which satisfies both
constraints and yields the optimum values of all objective functions Since there is rarely a single point that
simultaneously optimizes all object functions a Pareto optimum is defined to look for trade-offs in these
objectives
In the GA implementation of this study a population of candidate solutions was first used based on the
parametric test database This population was then modified (recombined and randomly mutated) to form
new iterative populations from which better fitness or solutions were achieved that fulfill the multishy
5-18
objective optimization problem The GA implementation was done in two steps In the first step a GA
was used to derive a functional relationship between the minimal or optimal boiler heat rate penalty as a
function of target boiler outlet or SCR inlet NOx The constrained multi-objective optimization problem
was defined by
min NO = f (O SOFA a a F )x NO 2 ST BT coalx
min q = fq (O2 SOFA aBT Fcoal ) subject to e emax
O O O2min 2 2max
SOFA SOFA SOFAmin max
a a aSTmin ST STmax
a a aBTmin BT BTmax
F F Fcoalmin coal coalmax
Where fNO ( )- and fq ( )- are the objective functions between the first five boiler operating variables listed x
in Table 4-1 and boiler outlet NOx emissions and heat rate penalty q respectively The optimization was
constrained by fly ash unburned carbon 8 to be below a prescribed maximum of 4 percent and the
operating input parameters to be between minimum and maximum levels representing their operational
upper limit and lower limit as indicated in Table 4-1 Figures 5-21(a) to 5-21(d) show different stages of
the GA optimization for minimum boiler NOx and heat rate penalty The parametric test database is shown
in Figure 5-21(a) A sequence of data generation and best fitness selection is shown in Figures 5-21(b) to
5-21(d) Converged optimal solutions are presented in Figure 5-21(d) after the 30th generation The heat
rate penalty vs SCR inlet NOx trend in Figure 5-21(d) was fitted into a polynomial function to be used in
the second step in the optimization
The second step of the optimization consisted of minimizing an overall cost function that combines the
costs of (1) the heat rate penalty resulting from tuning of the boiler control settings to achieve an optimal
boiler outlet or SCR inlet NOx emissions rate (2) reagent to produce the required SCR NOx reduction
performance and (3) the heat rate penalty to operate the APH within the ABS deposition constraint if
necessary Savings due to avoidance of APH washes was not included in the optimizable cost function
The second step optimization was defined by
min C = k C (NO )+ k C (NH )+ k C (D )total 1 1 x 2 2 3 3 3 APH
subject to dABS adepth
NO ax outlet NOx limit
NO NO NOxmin x x max
NH NH NH3min 3 3 max
D D DAPHmin APH APH max
5-19
Where the total cost C is composed of the fuel cost C due to the boiler heat rate penalty the NH3total 1
treatment cost C2 and the heat rate penalty cost C3 due to the manipulation of the APH bypass damper
( D ) The coefficients k i = 123 were set with a value of 10 The deposition depth limit (dABS) wasAPH i
set lt = 275 ft adepth
160 160
140 140
120 120
H
R [B
tuk
Wh]
HR
[Btu
kW
h]
H
R [B
tuk
Wh]
HR
[Btu
kW
h]
100
80
100
80
60 60
40 40
20 20 016 017 018 019 020 021 022 023 024 025 026 016 017 018 019 020 021 022 023 024 025 026
NOx emissions rate [lbMBtu] NOx emissions rate [lbMBtu] (a) 100 (b)100
9090
80
70
60
50
80
70
60
50
4040
3030
2020 016 017 018 019 020 021 022 016 017 018 019 020 021 022 023
NOx emissions rate [lbMBtu] NOx emissions rate [lbMBtu] (c) (d)
Figure 5-21 GA Optimization Results for Boiler Outlet NOx ndash (a) Initialization Dataset (b) 1st Generation (c) 15th Generation (d ) 30th Generation
The combined boilerSCRAPH cost function was optimized using GAs The following rates were used in
the evaluation of the cost function power generation cost of $002kWh and NH3 cost of $025lb to
convert the objective function to units of dollars per hour Figures 5-22(a) and 5-22(b) show a 3-D map of
all searched solutions provided by the GA expressed as differential costs with respect to baseline heat rate
conditions Also included in these figures are the sets of SCR inlet NOx NH3 injection rate and APH
bypass damper positions that violate the ABS deposition distance constraint and the NOx emissions rate
limit The set of feasible solutions which satisfy both constraints are also shown in Figures 5-22(a) and 5shy
22(b) These solutions were obtained after the 22nd generation of the GA algorithm Figure 5-22(a) shows
on the z-axis that a low NH3 injection rates the stack NOx emissions constraint is violated while at high
NH3 injection rates the ABS deposition constraint is violated Optimal solutions that satisfy both
5-20
constraints are obtained in the NH3 flow rate range between 120 and 195 lbhr The optimal solution for
the lowest cost of compliance corresponds to the following control setting O2 = 32 average SOFA
register opening = 51 (both top- and mid-SOFA registers open equally) average burner tilt angle = -8
degrees average SOFA tilt angle = +6 degrees 1A1-Mill coal flow rate = 6 tonhr APH bypass damper =
0 and an NH3 injection rate = 125 lbhr The optimal NH3 injection rate represents a reduction in NH3
flow rate from baseline conditions of approximately 22 percent The combination of optimal settings will
result in NOx emissions at the boiler outlet of 0188 lbMBtu while complying with ABS deposition at less
than 275 ft and fly ash unburned carbon below 4 percent at a differential cost of $412hr Figure 5-23
shows costs associated with operation at optimal combinations of boiler control settings that result in a
range of boiler outlet NOx emissions levels It can be inferred from Figure 5-23 that operation at the ldquokneerdquo
of the SCR inlet NOx vs heat rate penalty results in the lowest combined cost of operation Operation at
SCR inlet NOx levels at the left of that knee results in a significant added cost due to the contribution from
the boiler heat rate penalty Operation at the right of the knee results in a gradual moderate cost increase
due to additional NH3 consumption until a point is reached (at around 025 lbMBtu) where there is a need
to manipulate the APH bypass damper to control the ABS deposition This results in a steep heat rate
penalty due to increased stack losses As anticipated the optimization model indicates that the total cost of
compliance increases as the ABS deposition distance is tightly set closer to the APH cold-end A
reduction in the ABS deposition depth setpoint below 25 ft would require opening of the APH bypass
damper with the associated heat rate penalty from this component of the cost function
250 250
200 200
C
tota
l [$
hr]
150
100
C
tota
l [$
hr]
150
100
50 50
20
40
60 0
APH bypass Damper [] 0 0
100 200
300
NH3 flow rate [lbhr]
400 500
20
40
60 0
APH bypass Damper [] 0 020
025 030
NOx emissions rate [lbMBtu]
035
Violation of NOx emissions limit constraint
Violation of both constraints
Violation of ABS depth constraint
Both constraints satisfaction
Violation of NOx emissions limit constraint
Violation of both constraints
Violation of ABS depth constraint
Both constraints satisfaction
(a) (b)
Figure 5-22 GA Optimization Solutions for the Total Cost Function
5-21
-50
0
50
100
150
200
250
Ctotal=C1+C2+C3
Fuel Cost C1
APH bypass damper HR penalty cost C 3
C
ost
[$h
r]
NH3 Cost C 2
APH deposition depth set point =25 ft
010 013 016 019 022 025 028
NOx emissions rate [lbMBtu]
Figure 5-23 Cost Components as a Function o f Boiler Outlet NOx
The constraints imposed for the stack outlet NOx emissions level at lt 0095 lbMBtu and for the APH to
maintain the ABS axial deposition location in the APH at 275 ft from the cold-end were found to be
adequate to maintain Cayuga Stationrsquos NOx allowances The location of the ABS setpoint was chosen
based on the known penetration distance of the APH sootblowers which are located at the cold-end side of
the APH Any deposition of sticky ABS deposits on the APH baskets beyond the chosen deposition
setpoint would have a lower probability of being removed by sootblowing increasing the risk of gradual
fouling of the APH and further loss of generation for APH washing From the results of this work it was
determined that two options are available when the ABS deposition distance is beyond the reach of the
sootblowers (exceeds the 275 ft setpoint) viz to lower the NH3 injection rate to the lowest conditioning
permitted to achieve the required outlet NOx level or manipulate the APH air bypass damper to increase the
metal temperatures Opening the APH bypass damper is the least preferred option since it results in heat
rate penalties due to the increase in stack losses associated to higher flue gas temperatures exiting the
boiler
5-22
Section 6
UPGRADED SCR CONTROL STRATEGY
As part of this project modifications to the SCR control logic were studied and proposed aiming at
developing an upgraded control strategy that incorporates feedback measurements and optimization results
The system composed by the boiler SCR system and APH was considered for the upgrade (see illustration
in Figure 6-1) The adopted upgraded control strategy consists in (1) regulating pertinent boiler
conditions (O2 SOFA registers burner tilt SOFA tilt and 1A1 mill coal flow) to minimize NOx at the SCR
inlet and maximize SCR efficiency (2) regulating the NH3 flow to control stack or continuous emissions
monitoring (CEM) NOx and (3) regulating the APH bypass damper to control ABS deposition depth within
the APH Since the ABS deposition depth is also affected by the NH3 flow an approach for integrated
control of SCR and APH is discussed The proposed control scheme includes a dual-loop control strategy
for automatic boiler NH3 flow and APH bypass damper control over the unit load range with the ultimate
goal of minimizing boiler outlet NOx emissions minimizing stack NOx emissions minimizing NH3consumption (maximizing SCR efficiency) and minimizing unit heat rate penalties
Figure 6-1 System Configuration Used for the Control Strategy Upgrade
UPGRADED SCRAPH CONTROL SCHEME
SCR Control
The SCR control system provided by the manufacturer is shown in Figure 6-2 This control scheme is
typical for SCR control in the industry The objective of the feedback control loop is to regulate the
efficiency of the SCR system at a predefined value given by 7SCR The injection of NH3 is dictated by this
feedback loop but also by a feedforward controller which makes the feedforward component of the NH3flow just proportional to NOx_in Although this scheme guarantees a specific efficiency it cannot
guarantee a specific value of CEM NOx
6-1
Figure 6-2 SCR Manufacturerrsquos Typical Control Architecture The term NOxSCR in denotes the NOx level at the SCR inlet (denoted as NOx_in in the text) The term NOxSCR out denotes the NOx level at the SCR outlet (denoted as NOx_out in the text)
By exploiting the availability of the continuous emissions monitoring system it is possible to propose a
different control approach where the ultimate goal is the regulation of the NOx_CEM level at a predefined
value The approach illustrated in Figure 6-3 also combines both feedforward and feedback loops The
variable ldquosrdquo is used to denote the Laplace Transform variable in the system transfer functions
Figure 6-3 SCR Control Architecture Based on the CEM NOx Input The term NOxSCR CEM denotes the NOx level at the CEM (denoted as NOx_CEM in the text) The term NOx SP denotes the setpoint value for NOx_CEM (denoted as NOx_CEM_setpoint in the text)
Although the controller in Figure 6-3 can in principle guarantee a specific level of NOx_CEM the time
delays both in the SCR system and in the transport channel (denoted in pink in both Figures 6-2 and 6-3)
can significantly affect the performance of the control approach Since the NOx signal from the plant CEM
is used to regulate NH3 flow a pure time delay associated with the measurement of this parameter needs
to be dealt with There are several control methods available to deal with time delays in feedback loops
Most of them however require a good knowledge ie a model of the system which is usually not the
case in coal-based power plants For this reason it is proposed a non-model-based approach consisting in a
multi-loop proportionalndashintegralndashderivative (PID) approach combined with optimal tuning Information on
the rate of change of NOx at both the SCR inlet and the SCR outlet is incorporated into the NH3 flow
feedback controller in order to overcome the effect of the time delay and eliminate oscillations present in
both the CEM NOx and NH3 injection In addition not only positive but also negative feedback correction
(bias) of the feedforward loop is allowed with the objective of eliminating the NH3 slip that characterizes
SCR operation due to this control limitation The proposed scheme is shown in Figure 6-4 where the
6-2
outer-loop controller CSCROUT is a PID controller the inner-loop controller CSCRIN is a proportional-
derivative (PD) controller and the feedforward controller CSCRFEED is a pure de rivative (D) controller
1CSCR _ OUT (s) = K POUT + K I OUT + K DOUT s CSCR _ JN (s) = K
s PIN + K DIN s CSCR _ FEED (s) = K DFEED s
Figure 6-4 Multi-Loop SCR Control Architecture Based on CEM NOx SCR Inl et NOx and SCR Outlet NOx
In order to compare the different control approaches and also to optimally tune the controller parameters to
cope with the time delays simulations were carried out using MATLAB SIMULINKreg For that purpose a
simplified model of the SCR system was created A diagram of the SIMULINK closed-loop system is
illustrated in Figure 6-5
NOx_in
NOx_i
Transport
NOx_out NOx_CEM
NH3
NOxIN
eta
NOxOUT NOxCEM
SCR Efficiency
SCR
NOx_in
NH3
NOX_out
eta
NOx _out
n Source
NOx _in NOx_CEM
NOx CEM SP
-Cshy
NH3
Controller
NOx_out
NOx_CEM
NOx_in
NOx _CEM_SP
NH3
Figure 6-5 SIMULINK SCR Control Configuration
6-3
As illustrated in Figure 6-6 the SCR system was modeled as
out = e -sT 1 NOx _ SCR n120591 SCR (NH 3 NOx _ in)NOx _ in
SCR s +1
Where 7SCR(NH3NOx_in) is plotted in Figure 6-7
3
eta 2
NOX_out 1
Transport Delay
Switch
Saturation SCR Transfer Fcn
1
den (s) Ratio Gain
-K-NOx out
u(1)(1-u(2))
Fcn eta 3
f(u)
Fcn eta 2
f(u)
Fcn eta 1
f(u)
FF Gain
-K- Divide
Constant eta
-C-
Add NH3
Add
NH3 2
NOx_in 1
ratio
Figure 6-6 Simplified SCR Model
0 02 04 06 08 1 12 14 16 04
05
06
07
08
09
1
7
NH3NOxin [molesmoles]
SCR Efficiency
Figure 6-7 SCR Efficiency as a Function of NH3NOx_in Ratio
6-4
The channel connecting the SCR and the stack was modeled as a transport line (see Figure 6-8) where
- 1sTTRANSPNOx _ CEM = e NOx _ out s +1TRANSP
_CEM 1f(u)
den (s)
1
NOx_out 1
Transport Unit Transfer Fcn Stack Delay Transfer Fcn
Figure 6-8 Transport Channel Simplified Model
The multi-loop controller configuration is shown in Figure 6-9 It should be noticed from this scheme that
the feedback component of the NH3 flow rate injected into the SCR has contributions from three different
controllers a PID fed by the error between the NOx_CEM and its associated setpoint a PD controller fed
by a measurement of the NOx_out and a D controller fed by a measurement of the NOx_in
Saturation Inner PID
NH3
1
tracking error Upper Bound
Saturation
Dynamic
up
u
lo
y
Outer PID
PID
PID
Gain 4
-K -
Gain 3
-K -
Feed PID
PID
Add 1
NOx_CEM _
4
NOx_in
3
NOx_CEM
2
NOx_out
1
SP
Lower Bound
Figure 6-9 SCR Controller
6-5
An extremum seeking optimization (see details below) was also carried out to optimally tune the gains of
the controllers in the equation corresponding to Figure 6-4 The objective is to tune the controller gains in
order to minimize the tracking error Thus we define the to-be-minimized cost function as
1t
J = int[NOx _ CEM (t) - NOx _ CEM _ setpoint (t ) ]2 dt2 t0
Figure 6-10 shows the evolution of the cost function as a function of the extremum-seeking iteration
number The evolution of the to-be-optimized parameters e1=KPOUT e2=KIOUT e3=KDOUT e4=KPIN
e5=KDIN and e6=KDFEED is shown in Figure 6-11 The optimization was stopped after 200 iterations
because no significant further improvement of the cost function value was achieved The chosen
simulation parameters were TSCR=30s TSCR=10s TTRANSP=60s TTRANSP=20s The resulting optimal gains
were KPOUT =13182 KIOUT =11563 KDOUT=10564 KPIN=29020 KDIN=00170 and KDFEED=00572
To demonstrate the performance of the SCR controller Figure 6-12(d) shows the time response of the SCR
multi-loop system when NOx_in changes as illustrated in Figure 6-12(a) The feedback component for the
NH3 injection is showed in Figure 6-12(b) In Figure 6-12(c) it can be seen that SCR efficiency was not
kept constant because the ultimate goal is the regulation of NOx_CEM at the desired setpoint Figure 6shy
12(d) shows that the controller successfully regulates the NOx emissions level at the stack rejecting
changes in NOx_in
0 50 100 150 200-35
-34
-33
-32
-31
-30
J [d
B]
Cost function evolution
iteration Figure 6-10 Evolution of the Cost Function
6-6
10 1
0 0 0 50 100 150 200 50 100 150 200 50 100 150 200
iteration iteration iteration
50 2
40
50 5 5
1
40 4 4
e
Dou
t er
-
3
ee
4 -
Pin
ner
1 -
Pou
ter
e
Din
ner
-
e
5 -
Iou
ter
2
30 3 3
20 2 2
05
1
15
2
0 50 100 150 20050 100 150 200 e
6 -
Dfe
ed50 100 150 200
15
1
05
30
20
10
0 0
iteration iteration iteration
Figure 6-11 Evolution of the Controller Gains
Air Preheater Control
The control logic at Cayuga Unit 1 was modified to include a scheme that incorporates the feedback
measurements from the sensor implemented in this project (the AbSensor - AFP for ABS formation
temperature and associated deposition location) and a control strategy provision for the APH air bypass
damper The ABS deposition location can be controlled by manipulating the APH matrix temperature and
consequently the average cold-end APH temperature through the bypass damper with the ultimate goal of
minimizing APH fouling
6-7
018
019
02
021
022
023 N
Ox
IN
-30
-20
-10
0
10
20
30
NH
3 Fl
ow R
ate
0 05 1 15 2 0 05 1 15 2 Time [s] Time [s] x 104 x 104
(a) (b)
094 018
09
0 05 1 15 2 x 10⁴
006
008
01
NOx CEM NOx CEM Setpoint
0 02 04 06 08 1 12 14 16 18 2 Time [s]
016
092 014
012 N
Ox
CE
M
7
088 004
002
086 0
Time [s] x 104
(c) (d)
Figure 6-12 Illustration of the Time Response of the Optimized Multi-Loop Scheme
Figure 6-13 illustrates the APH control configuration The deposition depth can be estimated through the
function D(x) from the ABS formation temperature which is also function of the NH3NOx ratio and the
APH temperature The PID control KAPHCAPH regulates the deposition depth to a desired setpoint
Figure 6-13 APH Control Configuration
6-8
In order to simulate the APH closed-loop system performance simulations were carried out using
MATLAB SIMULINKreg For that purpose a simplified model of the APH system was created The
SIMULINK closed-loop system is illustrated in Figure 6-14
damper
damper DepositDepth
ratio
Deposit Depth SP
-C-
Deposit Depth
APH Controller
depth
depth _SP
damper
APH
ratio
damper
depth
Figure 6-14 SIMULINK APH Control Configuration
The simplified model for the APH dynamics is shown in Figure 6-15 The ABS deposition depth is
determined by both the ABS formation temperature and the APH metal temperature The APH response to
the bypass damper manipulation is modeled as a simple first-order transfer function GAPH2(s)=1(s+1) The
response of the formation temperature to the NH3NOx_in ratio is modeled as a first-order transfer function
GAPH1(s)=1(2s+1) in series with the nonlinear function in Figure 6-16 Only the section of the curve in
Figure 6-16 from 05 to 15 NSR is realistic and was used in the modeling This specific function is
modeled within the APH ABS block as illustrated in Figure 6-17 The APH controller has a PID structure
as shown in Figure 6-18
depth 1
Gain -K-
APH ABS
In1 Out1
APH
1 s+1
ABS Transfer Fcn
1 2s+1
damper 2
ratio 1
Transfer Fcn
Figure 6-15 Simplified APH Model
6-9
ABS Temperature
0 05 1 15 2 25 0
1
2
3
4
5
6
7
8
NH3NOxin [molesmoles]
Figure 6-16 ABS Formation Temperature as a Function of NH3NOx_in
Out 1 1
Switch
Fcn2
f(u)
Fcn1
f(u)
Fcn 6
f(u)
Fcn 5
f(u)
Fcn 4
f(u)
Fcn 3
f(u)
Constant 2
-C-
Constant 1
50
ratio 1
Figure 6-17 ABS Formation Temperature Simplified Model
PI
damper 1PID
depth _SP 2
depth 1
Figure 6-18 APH Deposition Depth Controller
6-10
Integrated SCRAPH Control
ABS deposition depth can be controlled not only by regulating the APH bypass damper but also by
modulating the NH3NOx_in ratio For a given NOx_in a decrease in NH3 injection would result in a
decrease in NH3NOx_in and in turn in the ABS formation temperature Therefore a decrease in NH3
injection could prevent opening of the APH bypass damper and its associated heat rate penalty However a
decrease in NH3 injection would result in an increase in NOx_CEM There is then a tradeoff between the
NOx emissions level at the stack and the heat rate penalty due to the opening of the APH bypass damper If
a small increase of NOx_CEM is tolerated it can help control the ABS deposition depth by reducing the
NH3 flow rate in lieu of opening the bypass damper Figure 6-19 shows an ad hoc coordinated SCR and
APH control scheme where the block E(x) modifies the setpoint for NOx_CEM as a function of the APH
bypass damper opening which is directly proportional to the APH heat rate penalty
Figure 6-19 Coordinated SCR and APH PID-Based Control
A MATLAB SIMULINKreg version of the coordinated scheme is presented in Figure 6-20 It should be
noticed that the SCR and APH control schemes are identical to those introduced in Figures 6-5 and 6-14
The ldquoCoordinatorrdquo block is the only addition to the control architecture This coordinator shown in more
detail in Figure 6-21 will not modify the setpoint for NOx_CEM as long as the APH bypass damper
opening is smaller than a predefined threshold When the APH bypass damper opening exceeds this
threshold the NOx_CEM setpoint is modified proportionally to the APH bypass opening
6-11
NOx_CEM NOx_in
NOxCEM NOx_in Source
damper
Transport
NOx_out NOx_CEM
damper
NH3
NOxIN
DepositDepth
eta
NOxOUT
SCR Efficiency
SCR Controller
NOx_out
NOx_CEM
NOx_in
NOx_CEM_SP
NH3
SCR
NOx_in
NH3
NOX_out
eta
ratio
NOx_out NOx_in
NOx_CEM_SP
-Cshy
NH3
-C-
Deposit Depth
Coordinator
damper Delta_SP
depth
depth_SP damper
APH
ratio
damper depth
APH Controller Deposit Depth SP
Figure 6-20 SIMULINK Coordinated SCR and APH PID-Based Control
Delta _SP 1
Switch
PID Controller
PID
Gain
-K-
0
Abs
|u| damper
1
Constant
Figure 6-21 Modification of NOx_CEM Setpoint
Figure 6-22 shows the effect of controlling the APH deposition depth via manipulation of the NH3 injection
by changing the setpoint for NOx_CEM The case with the NOx_in changes shown in Figure 6-22(a) is
considered The blue lines in Figure 6-22 illustrate the case where no coordination is present In this case
the ABS deposition depth is exclusively controlled by the APH bypass damper Note from Figure 6-22(b)
that the NOx_CEM is successfully regulated to the unmodified setpoint shown in Figure 6-22(d) However
it is necessary in this case to inject a considerable amount of NH3 (see Figure 6-22(f)) This amount of
reagent will require also a considerable opening of the APH damper (see Figure 6-22(e)) to successfully
regulate the ABS deposition depth to a desired fixed setpoint value (see Figure 6-22(c)) The green lines in
6-12
03
031
032
21
80
015
011
028 01
027 009
APH damper NOx CEM SP Mixed
0 500 1000 1500 2000 2500 3000 3500 4000 4500 5000 0 500 1000 1500 2000 2500 3000 3500 4000 4500 5000 Time [s] Time [s]
(a) (b)
3 015
NO
x IN
014
013
NO
x C
EM
SE
TPO
INT
NO
x C
EM
NH
3 Fl
ow R
ate
012
029
APH damper NOx CEM SP Mixed
20 500 1000 1500 2000 2500 3000 3500 4000 4500 5000
APH damper NOx CEM SP Mixed
009 0 500 1000 1500 2000 2500 3000 3500 4000 4500 5000
29 014
28
27
Dep
ositi
on D
epth
[ft] 013
26
25 012
24
23
22
011
01
Time [s] Time [s]
(c) (d)
300
APH damper NOx CEM SP Mixed
0 500 1000 1500 2000 2500 3000 3500 4000 4500 5000
APH damper NOx CEM SP Mixed
1500 500 1000 1500 2000 2500 3000 3500 4000 4500 5000
70
60
50
40
30
Dam
per O
peni
ng [
]
250
200
20
10
Time [s] Time [s]
(e) (f)
0
Figure 6-22 illustrate the case where the threshold for coordination is zero This means that the setpoint for
NOx_CEM will always be modified proportionally to the APH bypass damper Figure 6-22(d) shows the
modification of the NOx_CEM setpoint to a higher value for which the NH3 injection can be significantly
reduced (see Figure 6-22(f)) and consequently the APH bypass damper opening required to regulate the
APH deposition depth is also significantly reduced (see Figure 6-22(e)) minimizing in this way the APH
heat rate penalty at the expense of a higher level of NOx at the stack Finally the red lines in Figure 6-22
show an intermediate case where the threshold for the coordinator block is set at 40 of the APH bypass
damper opening Once the damper opening exceeds this value the setpoint for NOx_CEM is modified It
should be noticed the slight increase in the setpoint in Figure 6-22(d) that allows reductions of both NH3
injection and APH bypass damper opening if compared to the uncoordinated case (blue lines)
Figure 6-22 Effect of Modification of NOx_CEM Setpoint
6-13
NON-MODEL-BASED OPTIMAL ADAPTIVE CONTROL
In addition to the non-model-based approach presented in the preceding paragraphs and that includes multi-
loop PIDs a non-model-based optimal adaptive control strategy is also introduced for both the boiler and
the SCRAPH systems The proposed control scheme is based on extremum seeking and it includes a dual
loop control strategy illustrated in Figure 6-23 The first non-model-based adaptive controller is proposed
to regulate the boiler inputs (viz excess O2 SOFA registers burner tilt SOFA tilt and 1A1 mill coal flow)
to minimize both NOx emissions at the SCR inlet and the boiler heat rate penalty The second non-modelshy
based adaptive controller is proposed to regulate NH3 flow to the SCR system and the APH bypass damper
opening in order to optimally control in real-time and in a coordinated fashion both the CEM NOx and ABS
deposition within the APH avoiding NH3 slip and minimizing the APH heat rate penalty The
effectiveness of extremum seeking adaptive controllers in keeping the system at an optimal operation point
in the presence of input disturbances and system changes (unit load coal quality firing system maintenance
condition SCR aging etc) was demonstrated through dynamic simulations
Figure 6-23 Two-Loop Adaptive Control Strategy with Extremum Seeking
Extremum Seeking
Extremum seeking control (Ariyur 200 Ariyur 2003) a popular tool in control applications in the 1940shy
50s has seen a resurgence in popularity as a real time optimization tool in different fields of engineering
In addition to being an optimization method extremum seeking is a method of adaptive control usable
both for tuning set points in regulationoptimization problems and for tuning parameters of control laws It
is a non-model based method of adaptive control and as such it solves in a rigorous and practical way
6-14
some of the same problems as neural networks and other intelligent control techniques Aerospace and
propulsion problems (Binetti 2002) combustion instabilities (Schneider 2000 Banaszuk 2004) flow
control (Wang 2000) compressor rotating stall (Wang 2000) automotive problems (anti-lock braking
engine mapping) bioreactors (Wang 1999) and charged particle accelerators (Schuster 2004) are among
its applications Extremum seeking is applicable in situations where there is a nonlinearity in the control
problem and the nonlinearity has a local minimum or a maximum The nonlinearity may be in the plant as
a physical nonlinearity possibly manifesting itself through an equilibrium map Hence extremum seeking
can be used for tuning a setpoint to achieve an optimal value of the output The parameter space can be
multivariable The discrete-time implementation (Choi 2002) is depicted in Figure 6-24 where z denotes
the Z-transform variable The high-pass filter is designed as 0 lt h lt 1 and the modulation frequency m is
selected such that m=a7 0lt|a| lt 1 and a is rational Without loss of generality the static nonlinear block
J(e) is assumed to have a minimum J at e=e The extremum seeking procedure guarantees that the
estimation of e denoted as e in Figure 6-24 will converge to e minimizing J
( )eJ
e J
hz z + -1
1--z y
Xf
( )( )kJ e( )ke
( )ke ( )k ( )kX
Low-Pass High-Passa ( ) sin(mk -cent)sin mk Filter Filter Figure 6-24 Extremum Seeking Approach
The purpose of the extremum seeking optimization algorithm illustrated in Figure 6-24 is to use the
gradient information of the static map J(8) to drive 8 to 8 so that the cost functional J(8) is driven to its
minimum J The variable e denotes the estimate of the unknown optimal parameter 8 provided by the
extremum seeking algorithm The probing signal a sin(Ot) with a gt 0 added to the estimate e and fed
into the plant helps to get a measure of the gradient information of the map J(8) The high-pass filter
preserves only the perturbation in the cost functional J caused by the perturbation in the 8 parameter
introduced by the probing signal The demodulator picks the component of the filtered perturbed cost
functional X with the same frequency O a s t h e p robing signal The resulting signal 120576 which can be
seen as proportional to the gradient of the map J(8) is used by the pure-integrator low-pass filter to update
the 8 parameter in order to drive the cost functional J closer to its minimum
6-15
As an example Figure 6-25 shows residual NOx at the SCR outlet (as a percentage of inlet NOx) NH3 slip
and a cost function J= KNOx_outNOx_out2+ KNH3NH32 that can be computed in real-time from direct
measurements of outlet NOx and NH3 The cost function J conciliates two competing objectives
simultaneous minimization of residual NOx and NH3 slip By modifying the control inputs the extremum
seeking controller makes the system work at an operating point that corresponds to the minimum of the cost
function J (minimum of the pink curve in Figure 6-25) independently of transients and disturbances In
this way both NOx and NH3 slip can be minimized in real-time The relative importance of NOx_out and
NH3 can be defined by the operator through the selection of their corresponding weights KNOx_out and KNH3
Figure 6-25 Example of Extremum Seeking Minimized Cost Function
Real-Time Boiler Optimization
Dynamic Model Identification In order to illustrate the potential of adaptive extremum-seeking control
for minimization of both the level of NOx at the boiler outlet and the corresponding heat rate penalty it is
necessary simulate the dynamics of the boiler In contraposition to static models that are obtained from
steady-state data transient data is needed to identify dynamic models Based on sampled measurements of
the boiler variables an ARMAX model is proposed
A(q) y[k] = tB (q)u [k - nk ] + C(q)e[k]i i i i
Where y denotes the measured output (level of NOx at the SCR inlet NOx_in) u denotes the measured
inputs (excess O2 SOFA registers burner tilt SOFA tilt 1A1 mill coal flow) and e denotes non-
measurable noise The variable q denotes a time shift operator
qy[k] = y[k +1] q -1 y[k] = y[k -1]
6-16
where k denotes the sampling time The polynomial A(q) has order na the polynomials Bi(q) has order nbi
for i=1hellip5 and C(q) has order nc The variable nki denotes the delay order for each of the inputs i The
coefficients of these polynomials are obtained by solving the following minimization problem
min( y [k] - y[k])2
AB Ci
where y[k] denotes the model-predicted output and y[k] the real output obtained from direct measurement
The identified discrete-time dynamic model was converted to the continuous-time domain using a ldquotutsimrdquo
transformation The resulting continuous-time dynamic model is written in terms of transfer functions in
the Laplace domain and implemented in MATLAB SIMULINKreg as shown in Figure 6-26
1 O2_num (s) O2_den (s) O2
2 SOFA_num (s) SOFA_den (s) SOFA
3 BurnerTilt _num (s)
4
5
NOXin _avg
-C-
MATLAB Fcn
MATLAB Function
1 NOx_in BurnerTilt _den (s) Burner _Tilt
SOFATilt _num (s) 2 HR
SOFATilt _den (s) SOFA_Tilt
CoalFlow _num (s) CoalFlow _den (s) Coal _Flow
Figure 6-26 Simplified Boiler Dynamic Model
Extremum Seeking Controller From the parametric tests carried out during the project the parametric
testing it is possible to infer the dependence of NOx_in and HR on excess O2 level By defining the
following cost function
J = K NOx _ in2 + K HR2 NOx _ in HR
where HR represents boiler heat rate penalty This cost function is shown in Figure 6-27 where it can
noticed that there exists an optimal value of O2 for which a minimum is achieved By careful selection of
6-17
the coefficients KNOx and KHR different weights can be assigned to the competing objectives NOx_in and
HR
894
892
89
888
J 886
884
882
88
2 25 3 35 4 O2
Figure 6-27 Cost Function of O2 when SOFA = 0 Burner Tilt = -4 degrees SOFA Tilt = 1 degree and 1A1 Coal Flow = 15 tonhr
Given that static optimization will fall short in dealing with real-time changes in the cost function
extremum seeking allows real-time optimization by reacting to any change and keeping the system at an
optimal operation point Figure 6-28 shows a proposed extremum-seeking boiler control configuration
The value of the cost function J is fed into the extremum seeking block shown in Figure 6-29 where the
real-time optimization is carried out to modify the value of O2 in order to drive the value of the cost
function J to its minimum Only the variable O2 is controlled in this example It is worth mentioning that
extremum seeking can handle multi-input systems An example to illustrate the performance of the non-
model-based adaptive extremum seeking controller is shown in Figure 6-30 where the time evolutions of
NOx_in and heat rate penalty predicted by the identified dynamic model are used to compute the cost
function J In this case a step perturbation of magnitude 10 tonhr for the 1A1coal flow is introduced at
t=2500 min (Figure 6-30a) The level of SOFA registers and burner and SOFA tilt are kept constant
during the simulation Before the coal flow step the extremum seeking introduces a modification to the O2
level (Figure 6-30b) in order to drive the system to the point where the cost function is minimized (Figure
6-30e) After the coal flow step the extremum seeking reacts by modifying the O2 level (Figure 6-30) in
order to recover to a cost function minimum It should be noticed that not only the minimizing values of O2are different but also the cost function minimum values also differ Figures 6-30c and 6-30d show how the
NOx and heat rate penalty values are changed by the extremum seeking controller The potential of
extremum seeking resides on its capability of computing the optimal value in real-time without the aid of a
model
6-18
O2
SOFA
BURNER _TILT
SOFA_TILT
COAL _FLOW
NOx_in
J
HR
Step
SOFA_TILT
SOFA
O2
NOx_in
J
HR
JO2
Cost Function
NOXin
HR J
Constant 2
0
Constant 1
0
Constant
0
COAL _FLOW
Boiler
O2 SOFA Burner_Tilt SOFA_Tilt Coal_Flow
NOx_in
HR
BURNER _TILT
Extremum Seeking
Figure 6-28 SIMULINK Extremum Seeking Boiler Control Configuration
O2 1
X_est_pos X_est
Terminator
Sine Wave
Saturation 1
Saturation
Product
Perturbation
Jf
Integrator
1 s
Int _input
HPF
num _hpf (s)
den _hpf (s)
Gain 2
-K-
Gain 1
a
Demod
Add 2 Add 1 Abs
|u|
J 1
Figure 6-29 Extremum Seeking Implementation for Excess O 2 Optimal Modulation
6-19
Figure 6-30 Extremum Seeking Simulation Results (a to e from left to right top to bottom)
SCRAPH Real-Time Optimization This section presents a combined extremum-seekingPID control
architecture as illustrated in Figure 6-31 It considers that while the NH3 flow is directly controlled by an
extremum-seeking controller the APH bypass damper opening is controlled by a PID controller driven by a
ABS deposition depth error By defining the cost function as
6-20
2 2 2J = K NOx _ CEM + K NH 3 + K D NOx _ CEM NH 3 D
the extremum-seeking controller (shown in Figure 6-32) regulates NH3 flow in order to minimize
NOx_CEM NH3 flow and the APH bypass damper opening (D) Introduction of the APH bypass damper
term in the cost function is a step forward in the efforts to coordinate the SCR and APH control loops The
user-defined weigh factors KNOx KNH3 and KD regulates the tradeoff between NOx_CEM minimization and
NH3 - D minimization
Figure 6-31 SIMULINK Extremum Seeking SCRAPH Control Configuration
6-21
Figure 6-32 Extremum Seeking Implementation for NH3 Optimal Modulation
Simulation results for the controllers introduced in Figures 6-31 and 6-32 are included in Figure 6-33 The
level of NOx at the SCR inlet is varied as shown in Figure 6-33(a) While the ABS deposition depth
(Figure 6-33(f)) is regulated by the PID at a fixed setpoint (25 ft) the level of CEM NOx (Figure 6-33(e))
has the freedom to fluctuate in order to minimize the cost function J shown in Figure 6-33(b) The
minimizing variable is the NH3 flow rate shown in Figure 6-33(d) The APH bypass damper opening
shown in Figure 6-33(c) is kept at a relatively closed level
6-22
(a) (b)
(c) (d)
(e) (f)
Figure 6-33 Extremum Seeking Simulation Results
6-23
Section 7
EVALUATION OF BENEFITS
Based on the results of this project an evaluation was performed to assess the benefit of modifying the
combined operation of the boiler SCR system and APH for savings in fuel and SCR reagent As part of
this project a new ABS fouling probe was retrofit to Cayuga Unit 1 This technology includes control
capabilities to implement a new upgraded control strategy Findings from this project have been made
available to Cayuga Station in terms of the adequacy of flue gas conditions to the SCR trending
relationships between boiler control settings and the parameters of interest (such as reduced NOx emissions
levels SCR performance unit heat rate deviations or penalties and ABS formation and deposition in the
APH) and sootblowing characterization and improved schedule Recommendations were made to Cayuga
Station regarding modified control settings for optimal boiler and combustion conditions as well for
operation of the NH3 injection system and APH air bypass damper control This section presents results of
a simplified evaluation of the cost benefit from implementing these results It should be mentioned that
other indirect benefits would result from the implementation and improvements introduced by this study
These include reduction in fly ash NH3 contamination and reduction of sulfur related problems such as
sulfuric acid corrosion and stack visible plume
This section provides gross annual estimates associated with the benefit of implementing project results at
Cayuga Unit 1 for an optimized operation of the boilerSCRAPH system These savings include only
those savings related to reduction in reagent usage catalyst life extension unit thermal performance or fuel
cost and frequency and savings in APH wash A capacity factor of 090 is used in the calculations
Reduced Ammonia Usage These savings total approximately $69000 The savings comes from an
approximate 22 percent reduction in NH3 usage due to modification in boiler and SCR control settings that
result in reduced NOx treatment levels and improved SCR performance efficiency The NH3 usage savings
is calculated as the product of the following items
1 Anhydrous NH3 usage reduction (160 ndash 125 = 35 lbhr)
2 Number of hours for year-round compliance (7884 hrs)
3 Ammonia cost ($500ton)
4 Conversion factor (1 ton2000 lb)
Reduced Catalyst Replacement Frequency These savings total approximately $45000 The savings
comes from the increase in catalyst lifetime that is assumed that result from the better utilization of the
SCR reaction process It is assumed that over the course of 5 years this will result in at least one decreased
catalyst replacement event The savings is equal to the product of the following items
7-1
1 Catalyst requirement for SCR system (37 ft3MW)
2 Catalyst cost ($155ft3 for honeycomb type catalyst)
3 Portion of catalyst saved by reducing replacement frequency (frac14)
4 Number of decreased replacement events over the course of catalyst replacement
cycle (15 years)
Savings in Fuel These savings total approximately $151000 The savings come from an estimated
operation at minimal unit heat rate from manipulation of boiler control settings to avoid penalization from
increased unburned carbon in the fly ash stack losses due to increased excess air and controllable losses
due to off-design steam temperatures and from minimal manipulation of the APH to prevent ABS
deposition This savings is the sum of combustion-related heat rate penalties and APH-related heat rate
penalties
1 Cost of fuel ($002kWh or $222MBtu)
2 Number of hours for year-round operation (7884 hrs)
3 Estimated combustion and APH-related heat rate penalties avoidance (54 BtukWh or 060
from estimated baseline heat rate)
Savings in Air Preheater Cleaning These savings total approximately $483000 The savings comes
from an estimated reduction in excess NH3 slip and consequently prevention of APH plugging that would
have required unit shut down for water washing of the heater Since implementation of the ABS fouling
probe and associate controls the frequency of APH wash at Cayuga Unit 1 has been reduced from
approximately 4 per year (since start of SCR operation) to 1 so far in 2008 This savings is the sum of the
cost of the washing services and the lost of unit availability
1 Two-day outage to manipulate unit load and water-wash and dry the APH ($258000
it includes 3 washes)
2 Cost of APH water wash services ($225000 it includes 3 washes $5000 labor cost
(3 repairmen at 2-12 hr shifts) $68000 water treatment cost (170000 gallons
treated at $040gallon) $2000 miscellaneous costs)
In summary the estimated annual cost savings for Cayuga Unit due to optimized instrumentation
optimized operation of the boilerSCRAPH system and upgraded control is of the order of $748000 This
estimated savings do not include other savings that may result from this type of optimization such as
improvements to the sootblowing operation The estimates do not also consider that it might be practical
for Cayuga to ldquoover-controlrdquo NOx to sell allowances into the NOx allowance market without compromising
a side-effect-free operation of the SCR system
7-2
Section 8
CONCLUSIONS AND RECOMMENDATIONS
A study funded by the New York State Energy Research and Development Authority (NYSERDA) and
AES Cayuga was performed to investigate the feasibility of developing an optimization methodology and
demonstrate the benefit of operating in an optimal mode that achieve maximum boiler NOx emissions
reductions maximum selected catalytic reduction (SCR) system performance minimal unit heat rate
penalties and lower cost of operation at Cayuga Unit 1 Cayuga Unit 1 is a 150 MWnet unit equipped with
a low-NOx firing system and an anhydrous ammonia (NH3)-based SCR system Process optimization is a
cost-effective approach to improve the cost of NOx compliance at coal-fired boilers while meeting other
operational and environmental constraints In boilers equipped with SCRs this is a classic multi-objective
optimization problem to balance boiler thermal performance NOx emissions the cost of reagent and air
preheater (APH) maintenance costs The specific objectives of this study included
bull Provide upgraded instrumentation and control capabilities of ammonium bisulfate
(ABS) fouling at the APH
bull Develop a methodology for a combined boiler combustionSCRAPH optimization
bull Perform field testing at Cayuga Unit 1 and modeling and data analysis to support the
demonstration of a combined optimization
bull Develop upgraded control strategy for minimum boiler NOx emissions optimal SCR
operation minimal NH3 consumption optimal APH operation and minimal overall
cost of operation
Long-term operation of a SCR system at optimal conditions should
bull Improve reagent utilization
bull Minimize catalyst deterioration and reduce operational and maintenance (OampM)
costs
bull Operate at tighter stack NOx levels with minimal standard deviation
bull Maintain SCR constraints such as design NH3 slip and SO2-to-SO3 conversion
bull Minimize SCR impact on balance of plant equipment such as ABS formation and
unit heat rate
The following conclusions and recommendations were achieved from the results of this study
bull SCR tuning is an important aspect that should be considered when optimizing the
operation of SCR systems This involves the adjustment of the SCR injection grid
8-1
for uniform reagent treatment However at Cayuga Unit 1 the as-found conditions
and NH3 injection tuning capability rendered this step unnecessary
bull A Breen Energyrsquos AbSensor ndash Anti-Fouling Probe (AFP) was installed at one of the
APH inlets at Cayuga Unit 1 for on-line monitoring of ABS and real-time
determination of the ABS deposition axial location in the APH This probe was
found very reliable and an excellent tool to be used in an upgraded optimal SCR
system operation
bull Parametric field tests were performed at Cayuga Unit 1 From these tests it was
found that economizer excess O2 the top two separated overfire air (SOFA) register
openings burner tilt SOFA tilt the coal flow to the top pulverizer (1A1-Mill) and
the NH3NOx ratio all have an impact on SCR inlet NOx NH3 requirement for a
target stack NOx emissions level SCR NOx removal efficiency net unit heat rate and
ABS deposition Lower flue gas temperatures were found to improve SCR
performance hence manipulation of the economizer bypass damper was found
ineffective to improve SCR performance at full load It was found that increasing
the NH3 flow rate in excess of 130 lbhr increases the likelihood of exceeding a 275
ft threshold distance from the APH cold-end for ABS deposition Within this 275
ft distance ABS removal by sootblowing is greatly enhanced
bull Sootblowing tests were performed to investigate the impact of different sootblowing
routines on the operation of the SCR system and associated NOx reduction and NH3consumption It is recommended a sootblowing schedule that introduces activation
of wall blowers (Model IR) at the waterwalls every 10 minutes alternating blowers
from each ring (A B and C) and retractable blowers (Model IK) every shift as well
as cleaning of the SCR once a shift and of the APH three times per shift
bull Artificial intelligence techniques were used to model the test data and provide a tool
for mathematical optimization A modified accurate on-line support vector
regression (AOSVR) was implemented on the parametric test data to built artificial
intelligence-based functional relationships between the boiler outlet or SCR inlet
NOx level and heat rate penalty The prediction performance of proposed AOSVR
model was adequate Genetic algorithms (GAs) were used to solve the constrained
multi-objective optimization problem with success An optimal solution is
recommended for the lowest cost of compliance which corresponds to the following
control setting Economizer excess O2 = 32 average SOFA register opening =
51 (both top- and mid-SOFA registers open equally) average burner tilt angle = -8
degrees average SOFA tilt angle = +6 degrees top 1A1-Mill coal flow rate = 6
tonhr APH bypass damper = 0 open (completely shut) and an NH3 injection rate =
125 lbhr The optimal NH3 injection rate represents a reduction in NH3 flow rate
8-2
from baseline conditions of approximately 22 percent The combination of optimal
settings should result in NOx emissions at the boiler outlet of 0188 lbMBtu while
limiting ABS deposition to at less than 25 ft from the APH cold-end and producing
fly ash unburned carbon below 4 percent at a differential cost of $412hr This is
the lowest combined (heat rate penalty ndash and NH3-related) cost of operation as
compared to a highest cost of close to $20000hr The savings in net unit heat rate
from operation at optimal boiler and APH conditions equate to 54 BtukWh as 06
from the baseline net unit heat rate
bull A multi-loop control upgrade was proposed to enhance the boilerSCRAPH control
strategy The multi-loop control approach was complemented with a systematic
method for optimal tuning of proportionalndashintegralndashderivative (PID) control gainsThe SCR control logic that was in use at Cayuga Unit 1 was partially modified to
include a scheme that incorporates the feedback measurements implemented in this
project (viz real-time ABS monitoring and deposition tracking) The control system
upgrade includes a control strategy provision for the APH bypass damper by
controlling the average cold-end APH temperature to minimize APH
foulingplugging Additionally simple dynamic models for the boiler SCR system
and APH system were identified from the data and proposed to provide coordination
of both the SCR and APH control systems to enhance the overall performance of the
system This coordination approach led to the definition of tradeoffs resolved using
extremum-seeking control techniques
bull For future work two extremum-seeking loops are proposed for real-time
optimization at Cayuga Unit 1 The first non-model-based adaptive extremum-
seeking controller is proposed to regulate the boiler inputs (O2 SOFA register
opening burner tilt SOFA tilt top mill coal flow) to minimize both NOx at the SCR
inlet and the boiler heat rate penalty Non-model-based controllers learn from
dynamic operating data of the process This compares to model-based controllers
that utilize dynamic models to obtain mathematical conditions between the controller
design parameters and tuning rates The second non-model-based adaptive
extremum-seeking controller is proposed to regulate the NH3 flow to the SCR system
and the APH bypass damper opening in order to optimally control in real-time and in
a coordinated fashion both the NOx at the stack and ABS deposition within the
APH Based on the results obtained during this project the proposed approach has
the potential for further reducing stack NOx emissions unit heat rate NH3 usage and
provide savings from reduced APH washing frequency
bull Based on the results of this study it is indicated that modifying the combined
operation of the boiler and SCR system can result in savings in reagent usage heat
8-3
rate improvements and corresponding OampM costs Estimates were run to calculate
the economic benefits of an optimal operation In addition other indirect benefits
would result from these improvements These include catalyst life extension
reduction in APH cleaning frequency and costs associated with the loss of unit
availability Other added benefits not considered in the evaluation of benefits
include savings due to optimal sootblowing system operation reduction in fly ash
NH3 contamination and reduction of sulfur related problems such as sulfuric acid
corrosion and stack visible plume The estimated annual cost savings for Cayuga
Unit 1 due to optimized operation of the boilerSCRAPH system is of the order of
$748000 The estimates do not consider that it might be practical for utilities to
ldquoover-controlrdquo NOx to sell allowances into the NOx allowance market
The results of this analysis are based on a single limited data set However these results indicate that there
is a significant potential to optimize the combined operation of boiler combustion SCR system and APH to
achieve reduced operating costs
8-4
Section 9
REFERENCES
Ariyur K and Krstic M Slope Seeking and Application to Compressor Instability Control 2002 IEEE
Conference on Decision and Control Las Vegas Nevada pp 3690ndash3697 Dec 2002
Ariyur K and Krstic M Real-Time Optimization by Extremum Seeking Feedback Wiley 2003
Banaszuk A Ariyur K Krstic M Jacobson CA An Adaptive Algorithm for Control of Combustion
Instabilityrdquo Automatica 40 (2004) 1965 ndash 1972
Binetti P Ariyur K Krstic M Bernelli F Control of Formation Flight Via Extremum Seeking 2002
American Control Conference Anchorage Alaska pp 2848ndash2853 May 2002
Choi J-Y Krstic M Ariyur K and Lee JS Extremum Seeking Control for Discrete-time Systems
IEEE Transactions on Automatic Control vol 47 no 2 pp 318-323 2002
Jones C Consider SCR an Integral Part of the Combustion Process Power December 1993
Breen Energy Solutions AbSensor ndash AFP Condensable Anti-Fouling Probe Manual 2008
Eskenazi D Sarunac N and DrsquoAgostini M Userrsquos Guide for the HEATRT Code ERC Report 93-500shy
1-1 January 1993
Matlab ndash the Language of Technical Computing The Math Works Inc 1997
Power Test Code PTC 61 The American Society of Mechanical Engineers New York 1985
Romero C Li Y and Bilirgen H Using Boiler Operating Conditions for Mercury Emissions Control A
Feasibility Study ERC Report 04-400-11-14 August 2004
Sarunac N and Levy E RPHMT ndash Air Preheater Metal Temperature Code EPRI Report RP16812153
1989
Schneider G Ariyur K Krstic M Tuning of a Combustion Controller by Extremum Seeking A
Simulation Study Conf on Decision and Control Sydney Australia pp5219ndash5223 Dec 2000
9-1
Schuster E Morinaga E Allen CK and Krstic M Optimal Beam Matching in Particle Accelerators
via Extremum Seeking Submitted to the 44th IEEE Conference on Decision and Control Seville Spain
12-15 December 2004
Smola AJ Schoumllkopf B A Tutorial on Support Vector Regression Statistics and Computing 2004
14(4)199-222
Srinivas N Deb K Multiobjective Optimization Using Nondominated Sorting in Genetic Algorithms
Evolutionary Computation 1994 2(3)221-248
Wang H-H Krstic M and Bastin G Optimizing Bioreactors by Extremum Seeking International
Journal of Adaptive Control and Signal Processing vol 13 pp 651ndash659 1999
Wang H-H Yeung S Krstic M Experimental Application of Extremum Seeking on an Axial-Flow
Compressor IEEE Trans on Control Systems Technology vol 8 pp 300ndash309 2000
9-2
APPENDIX A
CALCULATION OF THE EFFECT OF BOILER
OPERATING CONDITIONS ON UNIT THERMAL PERFORMANCE FROM TEST DATA
BACKGROUND
In parametric field tests (combustion optimization boiler tuning boiler performance tests) the
effect of each parameter is typically investigated one at a time (excess O2 level damper position
mill bias burner tilt angle etc)
In addition to the parameter being tested other operating parameters unrelated to the test such as
condenser pressure make-up flow cycle extractions coal quality slagging and fouling vary
during the test
Changes in operating parameters unrelated to the test can mask the effect of the test parameter
Parametric test data summarized in Table A-1 show variations occurring in typical parametric tests
Table A-1 Parametric Test Data
Parameter Test 1 Test 2 Test 5 Test 19
Baseline O2 Test O2 Test SOFAO2 Test Pg [MW] 94516 94092 94391 93873
Paux [MW] 5066 5102 4869 5060
O2 [] 280 293 168 262
SOFA [] 100 75 75 75CCOFA [] 0 46 46 47
Burner Tilt [deg] 0 0 0 0
LOI [] 87 114 196 18
CO [] 11 4 47 7
TAPHgo [degF] 686 671 646 643
MMSTSpray [lbh] 1625 2357 1231 4634 MRHTSpray [lbh] 1418 3052 4153 4471
TMST [degF] 10082 10106 10110 10013
TRHT [degF] 10102 10095 10103 10103
Pcond [rdquoHg] 152 154 149 158Pthrottle [psia] 1468 1463 1472 1458
Mmake-up [lbh] 0 3000 4000 6000
Mauxextr [lbh] 0 1000 1500 2500
Note See definition of terms in the List of Abbreviations
A-1
Problem
How to filter out the effects of extraneous parameters and accurately determine the effects of just the test
parameter(s) on heat rate
HEAT RATE DIFFERENCE METHOD
Description of the Method
To determine the effect of boiler test parameters on unit performance baseline cycle performance data are
corrected for deviations in relevant operating parameters (those affected by test parameters) from baseline
conditions This yields changes in heat rate from the baseline value due to the changes in test conditions
by using
HRcycle = HRcycleBL times CFHeat Rate Pg = PgBL times CFLoad
Where
HRcycle Actual (test) value of cycle heat rate due to change in a test parameter
Pg Actual (test) value of gross unit load due to change in a test parameter
HRcycleBL Baseline value of cycle heat rate from turbine thermal kit or baseline test
PgBL Baseline value of gross unit load from turbine thermal kit or baseline test
CFHeat Rate Product of correction factors for heat rate for relevant parameters
CFLoad Product of correction factors for load for relevant parameters
CALCULATION PROCEDURE
1 Calculate boiler efficiency from TB = QSteamQfuel
2 Determine unit heat rate from HRnet = HRcycle times Pg TB (Pg - Paux)
3 The absolute value of net unit heat rate determined by this approach might differ from the absolute
actual net unit heat rate
4 The relative changes in unit performance due to variations in test parameters are calculated
accurately
A-2
RELEVANT OPERATING PARAMETERS
The ASME PTC 61 code defines Group 1 and 2 corrections for cycle heat rate and gross unit load
Cycle Operating Parameters in Group 1
Top Terminal Temperature Difference
Extraction Line Pressure Drop
Desuperheat Spray
Reheat Spray
Auxiliary Extraction Steam Flow
Condenser Make-Up
Extraction Flow to the Feedwater Pump Turbine
Cycle Operating Parameters in Group 2
Throttle Pressure
Throttle Temperature
Hot Reheat Temperature
Reheater Pressure Drop
Exhaust Pressure (Condenser Back Pressure)
Correction factors are calculated only for those cycle parameters that are affected by the changes in test
parameters Variations in other parameters not related to the test are disregarded In particular only the
desuperheat and reheat sprays throttle and hot reheat steam temperatures and auxiliary steam extraction
flow for preheating air entering an APH are affected by changes in test parameters in a combustion
optimization test
NUMERICAL EXAMPLE
A series a combustion optimization tests is conducted at full load conditions where parameters
such as excess oxygen level SOFA and CCOFA damper settings and burner tilt angle are
parametrically varied one at the time
The station does not use a secondary air heater (steam or glycol coils) for inlet air preheating
Auxiliary extraction from cold reheat is used for supplying heat to the tank farm and for building
heat
A-3
Need to determine the heat rate impact of individual test parameters
Sample test data are presented in Table A-2 Baseline cycle performance is calculated from turbine thermal
kit using the average value of main steam flow rate for all tests MMSTavg
MMSTavg = 65685 klbh
Table A-2 Sample Test Data
Parameter Reference Test
O2 Test (Test 2)
O2 Test (Test 5)
SOFAO2 Test (Test 19)
O2 [] 280 293 168 262 SOFA [] 100 75 75 75CCOFA [] 0 46 46 47 Burner Tilt [deg] 0 0 0 0 LOI [] 87 114 196 18 CO [] 11 4 47 7 TAPHgo [degF] 686 671 646 643 MMSTSpray [lbh] 1625 2357 1231 4634 MRHTSpray [lbh] 1418 3052 4153 4471 TMST [degF] 10082 10106 10110 10013 TRHT [degF] 10102 10095 10103 10103 Boiler Efficiency 08926 08906 08856 08860
For the average value of main steam flow rate (MMSTavg) the baseline value of the turbine cycle heat rate is
HRcycleBL = 8585 BtukWh The baseline value of gross power output is PgBL = 9402 MW Baseline
turbine cycle conditions (from turbine thermal kit) are
MMSTSprayBL = 0 lbh
MRHTSprayBL = 0 lbh
TMSTBL = 1010degF
TRHTBL = 1010degF
PthrottleBL = 1465 psia
PcondBL = 150 ldquoHg
Mmake-upBL = 6500 lbh
Maux extrBL = 0 lbh
Turbine cycle corrections for relevant test parameters and cycle performance (HRcycle and Pg) at test
conditions are summarized in Table A-3
A-4
Table A-3 Turbine Cycle Corrections and Cycle Performance
Parameter Reference Test O2 Test Test 2
O2 Test Test 5
SOFAO2 Test Test 19
Cycle Corrections for Heat Rate CF for MMSTSpray 10001 10001 10000 10002
CF for MRHTSpray 10004 10009 10013 10013
CF for TMST 10002 09999 09999 10011
CF for TRHT 10000 10001 10000 10000
CFHeat Rate = ICFi 10007 10010 10012 10026
HRcycle [BtukWh] 8591 8593 8594 8607 Cycle Corrections for Unit Load CF for MMSTSpray 10002 10003 10001 10005
CF for MRHTSpray 10013 10027 10037 10040
CF for TMST 10003 09999 09999 10014 CF for TRHT 10001 09998 10002 10001
CFLoad = ΔCFi 10019 10027 10039 10060
Pg [MW] 94195 94271 94384 94582
RESULTS
Using the results from Table 3 and the expression for HRnet to calculate performance at test conditions The
results are summarized in Table A-4
Table A-4 Effect of Boiler Test Parameters on Unit Heat Rate
Parameter Reference Test
O2 Test Test 2
O2 Test Test 5
SOFAO2 Test Test 19
HRnet [BtukWh] 10172 10201 10232 10264 AHRnet [BtukWh] 0 29 60 92
A-5
APPENDIX B
CAYUGA UNIT 1 TEST MATRIX
B-1
Tab
le 1
C
ayug
a U
nit 1
Tes
t Mat
rix
Tes
t D
escr
iptio
n L
oad
Eco
nO
2 T
OP
SOFA
M
IDD
LE
SOFA
B
OT
TO
MSO
FA
Top
Mill
(1A
1)L
oadi
ng
Eco
nom
izer
B
ypas
s Dam
per
Ope
ning
Air
-Pre
heat
erB
ypas
s Dam
per
Ope
ning
N
Ox
NH
3
MW
th
lb
sM
MB
tu
klbs
h
BA
SE 1
B
asel
ine
(12
15-1
315
) 15
0 3
271
1074
159
10
022
2 15
98
BA
SE 2
B
asel
ine
(94
5-10
45)
15
0 3
301
1075
159
10
023
4 16
14
TE
ST 3
O
2 Tes
t(1
100
- 12
00)
15
0 3
601
1075
159
10
024
6 17
24
TE
ST 4
O
2 Tes
t(1
330
- 14
30)
15
0 3
001
1075
160
10
021
4 14
99
TE
ST 5
O
2 Tes
t(4
30
- 15
30)
150
270
110
7516
01
00
198
137
0
TE
ST 6
O
2 T
est
(15
30 -
163
0)
150
285
110
7515
91
00
202
140
1
BA
SE 7
SO
FA T
est
(83
0 - 9
30)
15
0 3
241
1176
149
01
021
1 13
80
TE
ST 8
SO
FA T
est
(11
00 -
120
0)
150
330
9997
315
00
00
174
109
8
TE
ST 9
SO
FA T
est
(12
00 -
122
0)
150
327
7575
315
00
00
172
109
8
TE
ST 1
0 SO
FA T
est
(13
00 -
142
0)
150
331
4950
415
00
00
187
117
9
TE
ST 1
1 SO
FA T
est
(14
00 -
145
0)
150
322
2323
414
90
00
226
148
9
TE
ST 1
2 SO
FA T
est
(14
50 -
155
0)
150
327
11
414
90
00
268
183
7
TE
ST 1
3 SO
FA T
est
(15
50 -
163
0)
150
296
22
514
90
00
251
173
7
TE
ST 1
4 SO
FA T
est
(16
30 -
170
5)
150
303
2525
514
90
00
214
143
5
TE
ST 1
5 SO
FA T
est
(17
05 -
174
5)
150
296
5149
514
80
00
179
113
4
TE
ST 1
6 SO
FA T
est
(17
45 -
185
0)
150
302
9897
514
80
00
165
993
B-2
Tab
le 1
C
ayug
a U
nit 1
Tes
t Mat
rix
(Con
t)
Tes
t D
escr
iptio
n L
oad
Eco
nO
2 T
OP
SOFA
M
IDD
LE
SOFA
B
OT
TO
MSO
FA
Top
Mill
(1A
1)L
oadi
ng
Eco
nom
izer
B
ypas
s Dam
per
Ope
ning
Air
-Pre
heat
erB
ypas
s Dam
per
Ope
ning
N
Ox
NH
3
MW
th
lb
sM
MB
tu
klbs
h
BA
SE 1
7 B
asel
ine
(72
0 - 8
45)
15
0 3
321
1075
154
00
023
0 16
03
TE
ST 1
8
Air
-Pre
heat
erB
ypas
s D
ampe
r T
ests
150
329
2
10
75
155
0
28
022
3 15
79
TE
ST 1
9 15
0 3
36
2 10
75
15
8
0 50
0
221
152
8 T
EST
20
150
335
2
10
75
155
0
75
021
8 15
33
TE
ST 2
1 15
0 3
27
2 10
75
15
6
0 14
0
221
155
1 T
EST
22
150
344
69
70
5
155
0
0 0
183
122
5 T
EST
23
150
334
69
70
5
156
0
15
018
1 11
93
TE
ST 2
4 15
0 3
49
69
70
5 15
5
0 25
0
183
119
6 T
EST
25
150
334
69
70
5
155
0
50
017
5 11
68
TE
ST 2
6 15
0 3
48
68
70
5 15
5
0 75
0
182
119
5
BA
SE 2
7 B
asel
ine
(12
30
- 12
45)
150
334
110
7515
50
00
223
159
3
TE
ST 2
8 B
urne
r+SO
FA T
ilt( 1
250
- 13
15)
15
0 3
271
1075
154
00
021
7 15
78
TE
ST 2
9 B
urne
r+SO
FA T
ilt(1
315
-13
40)
150
322
110
7515
30
00
215
156
9
TE
ST 3
0 B
urne
r+SO
FA T
ilt(1
342
-14
15)
150
321
110
7515
50
00
219
160
8
TE
ST 3
1 B
urne
r+SO
FA T
ilt(1
420
-14
55)
150
334
7070
515
60
00
178
126
8
TE
ST 3
2 B
urne
r+SO
FA T
ilt(1
500
-16
15)
150
331
7069
515
70
00
180
126
7
TE
ST 3
3 B
urne
r+SO
FA T
ilt(1
615
-16
45)
150
342
7069
415
80
00
188
129
9
TE
ST 3
4 B
urne
r+SO
FA T
ilt(1
645
-17
10)
150
383
7069
415
70
00
194
132
1
TE
ST 3
5 B
urne
r+SO
FA T
ilt(1
515
-17
40)
150
365
7069
415
70
00
192
134
7
TE
ST 3
6 B
urne
r+SO
FA T
ilt(1
749
-18
10)
150
371
7069
415
60
00
185
131
9
B-3
Tab
le 1
C
ayug
a U
nit 1
Tes
t Mat
rix
(Con
t)
Tes
t D
escr
iptio
n L
oad
Eco
nO
2 T
OP
SOFA
M
IDD
LE
SOFA
B
OT
TO
MSO
FA
Top
Mill
(1A
1)L
oadi
ng
Eco
nom
izer
B
ypas
s Dam
per
Ope
ning
Air
-Pre
heat
erB
ypas
s Dam
per
Ope
ning
N
Ox
NH
3
MW
th
lb
sM
MB
tu
klbs
h
BA
SE 3
7 B
asel
ine
(11
00 -
114
5)
150
328
19
7415
90
00
214
157
5
TE
ST 3
8 B
urne
r+SO
FA T
ilt(1
145
-12
15)
150
336
19
7315
90
00
215
156
8
TE
ST 3
9 B
urne
r+SO
FA T
ilt(1
215
-12
45)
150
351
6970
115
90
00
194
135
0
TE
ST 4
0 B
urne
r+SO
FA T
ilt(1
245
-12
53)
150
387
6970
115
80
00
213
143
7
TE
ST 4
1 B
urne
r+SO
FA T
ilt(1
350
-14
15)
150
355
6970
115
80
00
180
120
5
TE
ST 4
2 B
urne
r+SO
FA T
ilt(1
415
-15
10)
150
359
6970
115
90
00
193
137
8
TE
ST 4
3 B
urne
r+SO
FA T
ilt(1
510
-15
55)
150
350
6970
115
60
00
180
121
6
TE
ST 4
4 B
urne
r+SO
FA T
ilt(1
558
-16
50)
150
356
6970
116
10
00
182
124
5
TE
ST 4
5 M
ill B
ias
(21
30 -
223
0)
150
333
6971
110
10
00
168
107
6
TE
ST 4
6 M
ill B
ias
(23
30 -
240
0)
150
428
6971
20
20
00
141
715
BA
SE 4
7 B
asel
ine
(83
5 -9
30)
15
0 3
522
1174
162
00
021
2 14
81
TE
ST 4
8 L
ow-N
Ox B
asel
ine
(93
0 - 1
000
) 15
0 3
5869
691
160
00
018
4 12
88
TE
ST 4
9 E
con
Byp
ass
(10
00 -
103
0)
150
351
6969
115
95
00
182
123
6
TE
ST 5
0 E
con
Byp
ass
(10
30 -
110
0)
150
361
7070
115
915
00
188
125
7
TE
ST 5
1 E
con
Byp
ass
(11
00-1
130
) 15
0 3
5770
701
158
280
018
9 12
23
TE
ST 5
2 E
con
Byp
ass
(11
50 -1
220
) 15
0 3
5670
701
163
400
020
2 12
84
B-4
Tab
le 1
C
ayug
a U
nit 1
Tes
t Mat
rix
(Con
t)
Tes
t D
escr
iptio
n L
oad
Eco
nO
2
TO
PSO
FA
MID
DL
ESO
FA
BO
TT
OM
SOFA
Top
Mill
(1A
1)L
oadi
ng
Eco
nom
izer
B
ypas
s Dam
per
Ope
ning
Air
-Pre
heat
erB
ypas
s Dam
per
Ope
ning
N
Ox
NH
3
MW
th
lb
sM
MB
tu
klbs
h
TE
ST 5
3 E
con
Byp
ass
(12
25-1
345
) 15
0 3
5470
701
158
00
017
7 11
87
TE
ST 5
4 E
con
Byp
ass
(13
58-1
445
) 15
0 3
3870
700
157
400
019
2 12
01
TE
ST 5
5 C
oal A
ir T
emp
(14
25 -
153
0)
150
330
7070
015
90
00
177
113
6
TE
ST 5
6 C
oal A
ir T
emp
(15
30 -
161
5)
150
340
7070
015
40
00
175
112
6
TE
ST 5
7 C
oal A
ir T
emp
(16
20 -
170
5)
150
346
7070
015
40
00
173
113
8
TE
ST 5
8 So
otbl
owin
g(1
710
- 18
35)
15
0 3
3870
700
155
00
017
6 11
69
BA
SE 5
9 So
otbl
owin
g(8
50
- 93
0)
150
332
210
7515
50
00
216
150
9
TE
ST 6
0 So
otbl
owin
g(9
30~
103
5)
150
329
6970
015
30
00
174
116
2
TE
ST 6
1 So
otbl
owin
g(1
051
- 13
30)
15
0 3
3269
690
155
00
017
3 11
19
TE
ST 6
2 So
otbl
owin
g(1
428
- 16
10)
15
0 3
2769
690
154
00
017
4 10
95
TE
ST 6
3 So
otbl
owin
g(1
628
- 18
15)
15
0 3
3469
681
154
00
018
5 11
68
BA
SE 6
4 B
asel
ine
(85
0 - 9
50)
15
0 3
211
1173
188
00
020
1 10
97
TE
ST 6
5 B
otto
m M
ill O
S(9
53
- 10
40)
150
308
7070
018
90
00
163
800
TE
ST 6
6 So
otbl
owin
g(1
110
- 15
10)
15
0 3
2270
700
155
00
017
5 10
79
BA
SE 6
7 B
asel
ine
(11
00 -1
130
) 15
0 3
11
1073
156
01
021
4 14
51
TE
ST 6
8 L
ow-N
Ox B
asel
ine
(11
30 -1
200
) 15
0 3
370
691
155
01
018
6 11
76
TE
ST 6
9 So
otbl
owin
g(1
200
-16
15)
150
33
7069
115
50
10
181
114
6
B-5
Tab
le 1
C
ayug
a U
nit 1
Tes
t Mat
rix
(Con
t)
Tes
t D
escr
iptio
n L
oad
Eco
nO
2 T
OP
SOFA
M
IDD
LE
SOFA
B
OT
TO
MSO
FA
Top
Mill
(1A
1)L
oadi
ng
Eco
nom
izer
B
ypas
s Dam
per
Ope
ning
Air
-Pre
heat
erB
ypas
s Dam
per
Ope
ning
N
Ox
NH
3
MW
th
lb
sM
MB
tu
klbs
h
BA
SE 7
0 B
asel
ine
(81
5 - 8
30)
15
0 3
41
1173
159
00
020
5 13
04
TE
ST 7
1 L
ow-N
Ox
Bas
elin
e(8
00-
900
) 15
0 3
370
691
159
00
017
5 10
74
TE
ST 7
2 M
ill B
ias+
O2
(19
45-1
000
) 15
0 3
270
691
121
00
016
4 10
15
TE
ST 7
3 M
ill B
ias+
O2
(10
40-1
055
) 15
0 3
070
691
118
00
016
0 95
7
TE
ST 7
4 M
ill B
ias+
O2
(11
45-1
200
) 15
0 3
070
691
90
00
015
6 92
3
TE
ST 7
5 M
ill B
ias+
O2
(12
00-1
300
) 15
0 3
370
691
89
00
016
2 96
5
TE
ST 7
6 M
ill B
ias+
O2
(13
00-1
400
) 15
0 3
470
701
64
00
016
0 96
2
TE
ST 7
7 M
ill B
ias+
O2
(14
00-1
500
) 15
0 3
170
701
64
00
015
7 92
8
TE
ST 7
8 So
otbl
owin
g(1
610
-18
30)
150
33
7070
115
70
00
178
110
9
BA
SE 7
9 B
asel
ine
(74
5 shy8
00)
150
31
111
7516
20
00
216
144
8
TE
ST 8
0 So
otbl
owin
g(8
10-
132
0)
150
33
7069
016
20
00
182
115
4
BA
SE 8
1 B
asel
ine
(22
30-2
400
) 10
0 4
292
250
109
3343
025
8 16
31
TE
ST 8
2 O
2 +SO
FA(0
00
- 10
0)
100
435
2425
010
933
490
259
152
5
TE
ST 8
3 O
2 +SO
FA(1
00
- 14
5)
100
416
2525
010
733
450
255
146
6
TE
ST 8
4 O
2 +SO
FA(1
45
- 24
5)
100
431
11
010
532
480
258
163
7
TE
ST 8
5 O
2 +SO
FA(2
45
- 40
0)
100
442
11
00
432
580
258
126
1
TE
ST 8
6 O
2 +SO
FA(4
00
- 50
0)
100
440
2425
00
432
580
258
108
8
B-6
Tab
le 1
C
ayug
a U
nit 1
Tes
t Mat
rix
(Con
t)
Tes
t D
escr
iptio
n L
oad
Eco
nO
2
TO
PSO
FA
MID
DL
ESO
FA
BO
TT
OM
SOFA
Top
Mill
(1A
1)L
oadi
ng
Eco
nom
izer
B
ypas
s Dam
per
Ope
ning
Air
-Pre
heat
erB
ypas
s Dam
per
Ope
ning
N
Ox
NH
3
MW
th
lb
sM
MB
tu
klbs
h
TE
ST 8
7 O
2 +SO
FA(2
215
-23
15)
100
440
4949
00
233
520
259
929
TE
ST 8
8 O
2 +SO
FA(2
315
- 24
00)
10
0 4
1049
490
02
3452
025
3 91
2
TE
ST 8
9 O
2 +SO
FA(0
00
- 03
0)
100
413
4949
00
349
500
253
912
TE
ST 9
0 O
2 +SO
FA(0
30
- 13
0)
100
411
4949
00
325
530
254
914
TE
ST 9
1 O
2 +SO
FA(1
30
- 23
0)
100
446
1414
10
433
500
259
103
7
TE
ST 9
2 O
2 +SO
FA(2
30
- 33
0)
100
449
10
10
433
470
260
111
3
BA
SE 9
3 B
asel
ine
(23
30 -
234
5)
75
546
12
00
110
00
027
5 14
27
TE
ST 9
4 O
2 +SO
FA(0
00
- 04
5)
75
526
55
00
310
01
027
1 14
17
TE
ST 9
5 O
2 +SO
FA(1
25
- 21
0)
755
2211
100
03
100
10
271
139
9
TE
ST 9
6 O
2 +SO
FA(2
30
- 31
5)
755
2714
150
03
100
10
272
136
3
TE
ST 9
7 O
2 +SO
FA(3
40
- 42
5)
755
2215
150
03
100
10
272
132
5
BA
SE 9
8 B
asel
ine
(22
45 -
235
0)
75
585
11
00
010
00
027
9 13
93
TE
ST 9
9 O
2 +SO
FA(0
030
- 2
15)
75
507
22
00
010
00
026
7 14
91
TE
ST 1
00
O2 +
SOFA
(30
4 - 3
45)
75
515
1615
00
010
00
026
7 14
14
TE
ST 1
01
O2 +
SOFA
(40
0 - 4
25)
75
514
2019
00
010
00
026
8 13
91
TE
ST 1
02
O 2 +
SOFA
(42
6 - 5
10)
75
531
2425
00
010
00
027
0 14
11
B-7
For information on other NYSERDA reports contact
New York State Energy Research and Development Authority
17 Columbia Circle Albany New York 12203-6399
toll free 1 (866) NYSERDA local (518) 862-1090
fax (518) 862-1091
infonyserdaorg wwwnyserdaorg
OPTIMIZATION OF SCR CONTROL TECHNOLOGY FOR REDUCED NOx
EMISSIONS IMPROVED PERFORMANCE AND REDUCED OPERATING EXPENSES
FINAL REPORT 09-09
STATE OF NEW YORKDAVID A PATERSON GOVERNOR
NEW YORK STATE ENERGY RESEARCH AND DEVELOPMENT AUTHORITYVINCENT A DEIORIO ESQ CHAIRMANFRANCIS J MURRAY JR PRESIDENT AND CHIEF EXECUTIVE OFFICER
- Structure Bookmarks
-

The New York State Energy Research and Development Authority (NYSERDA) is a public benefit corporation created in 1975 by the New York State Legislature
NYSERDA derives its revenues from an annual assessment levied against sales by New Yorkrsquos electric and gas utilities from public benefit charges paid by New York rate payers from voluntary annual contributions by the New York Power Authority and the Long Island Power Authority and from limited corporate funds
NYSERDA works with businesses schools and municipalities to identify existing technologies and equipment to reduce their energy costs Its responsibilities include
bull Conducting a multifaceted energy and environmental research and development program to meetNew York Statersquos diverse economic needs
bull The New York Energy $martSM program provides energy efficiency services including thosedirected at the low-income sector research and development and environmental protection activities
bull Making energy more affordable for residential and low-income households
bull Helping industries schools hospitals municipalities not-for-profits and the residential sectorimplement energy-efficiency measures NYSERDA research projects help the Statersquos businessesand municipalities with their energy and environmental problems
bull Providing objective credible and useful energy analysis and planning to guide decisions made bymajor energy stakeholders in the private and public sectors
bull Since 1990 NYSERDA has developed and brought into use successful innovative energy-efficientand environmentally beneficial products processes and services
bull Managing the Western New York Nuclear Service Center at West Valley including overseeingthe Statersquos interests and share of costs at the West Valley Demonstration Project a federalStateradioactive waste clean-up effort and managing wastes and maintaining facilities at the shut-downState-Licensed Disposal Area
bull Coordinating the Statersquos activities on energy emergencies and nuclear regulatory matters andmonitoring low-level radioactive waste generation and management in the State
bull Financing energy-related projects reducing costs for ratepayers
For more information contact the Communications unit NYSERDA 17 Columbia Circle Albany New York 12203-6399 toll-free 1-866-NYSERDA locally (518) 862-1090 ext 3250 or on the web at wwwnyserdaorg
STATE OF NEW YORK ENERGY RESEARCH AND DEVELOPMENT AUTHORITY David A Paterson Governor Vincent A DeIorio Esq Chairman
Francis J Murray Jr President and Cheir Executive Officer
OPTIMIZATION OF SCR CONTROL TECHNOLOGY FOR
REDUCED NOx EMISSIONS IMPROVED PERFORMANCE
AND REDUCED OPERATING EXPENSES
Final Report
Prepared for the NEW YORK STATE
ENERGY RESEARCH AND DEVELOPMENT AUTHORITY
Albany NY wwwnyserdaorg
Barry Liebowitz Senior Project Manager
Prepared by ENERGY RESEARCH CENTER
Bethlehem PA
Carlos E Romero Project Manager
with
Eugenio Schuster Fengqi Si Zheng Yao
NYSERDA NYSERDA 10083 April 2009 Report 09-09
NOTICE
This report was prepared by the Energy Research Center in the course of performing work contracted for
and sponsored by the New York State Energy Research and Development Authority and AES Cayuga
(hereafter the ldquoSponsorsrdquo) The opinions expressed in this report do not necessarily reflect those of the
Sponsors or the State of New York and reference to any specific product service process or method does
not constitute an implied or expressed recommendation or endorsement of it Further the Sponsors and the
State of New York make no warranties or representations expressed or implied as to the fitness for
particular purpose or merchantability of any product apparatus or service or the usefulness completeness
or accuracy of any process methods or other information contained described disclosed or referred to in
this report The Sponsors the State of New York and the contractor make no representation that the use of
any product apparatus process method or other information will not infringe privately owned rights and
will assume no liability for any loss injury or damage resulting from or occurring in connection with the
use of information contained described disclosed or referred to in this report
ABSTRACT
A feasibility project was performed at Cayuga Unit 1 with funding from the New York State Energy
Research and Development Authority and AES Cayuga to develop an optimization methodology and
demonstrate the combined optimal operation of boiler selective catalytic reduction (SCR) system and
back-end air preheater (APH) Cayuga Unit 1 is a 560 MW unit equipped with a low-NOx firing system
and an anhydrous ammonia (NH3) SCR reduction system for NOx emissions control The boiler and low-
NOx system control settings and SCR and APH operating conditions were tested in a parametric test
program Information from a Breen Energy Solutions ammonium bisulfate (ABS) probe was included for
monitoring ammonium salts formation in real-time and as a constraint to the SCR optimization The
parametric test data were used as the basis for the optimization that consisted of an approach which
incorporates accurate on-line support vector regression modeling for adaptive learning and genetic
algorithms for implementation of the multi-objective optimization Upgrades to the SCR control scheme
were proposed using a multi-loop control with proportional-integral-derivative (PID) control tuning and
extremum seeking The results indicate that optimal operating conditions can be achieved for a coordinated
boilerSCRAPH operation that exhibits minimal NH3 consumption maximum SCR performance and
optimal net unit heat rate This optimized operation also results in minimal impact on fly ash unburned
carbon content and mitigates ABS formation and complies with other operational and environmental
constraints The optimal conditions resulted in reduced NH3 usage of the order of 25 percent optimal heat
rate improvement of approximately 55 BtukWh with improved APH fouling management and estimated
annual cost savings of the order of $748000
Keywords NOx Emissions SCR Optimization Control Upgrades
iii
TABLE OF CONTENTS
Section Page
SUMMARY S-1
1 INTRODUCTION1-1
2 UNIT DESCRIPTION2-1
3 ABS MONITORING3-1
4 PARAMETRIC FIELD TESTS 4-1
5 DATA ANALYSIS RESULTS AND DISCUSSION 5-1 DATA ANALYSIS RESULTS5-1 MODELING RESULTS 5-15 OPTIMIZATION RESULTS5-16
6 UPGRADED SCR CONTROL STRATEGY 6-1 UPGRADED SCRAPH CONTROL SCHEME6-1
SCR Control6-1 Air Preheater Control 6-7 Integrated SCRAPH Control6-11
NON-MODEL-BASED OPTIMAL ADAPTIVE CONTROL6-14 Extremum Seeking6-14 Real-Time Boiler Optimization6-16
7 EVALUATION OF BENEFITS 7-1
8 CONCLUSIONS AND RECOMMENDATIONS 8-1
9 REFERENCES9-1
APPENDIX A CALCULATIONS OF THE EFFECT OF BOILER OPERATING CONDITIONS ON UNIT THERMAL PERFORMANCE FROM TEST DATA A-1
BACKGROUNDA-1 HEAT RATE DIFFERENCE METHODA-2
Description of the Method A-2 CALCULATION PROCEDUREA-2 RELEVANT OPERATING PARAMETERSA-3
Cycle Operating Parameters in Group 1 A-3 Cycle Operating Parameters in Group 2 A-3
NUMERICAL EXAMPLE A-3 RESULTS A-5
APPENDIX B CAYUGA UNIT 1 TEST MATRIX B-1
APPENDIX C FUNDAMENTALS OF EXTREMUM SEEKING C-1
v
FIGURES
Figure Page
2-1 Cayuga Unit 1 ndash Boiler Configuration 2-1 3-1 Representation of APH Temperature Controller Performance3-2 3-2 Performance of the APH Temperature Controller3-3 3-3 Performance of Ammonia Injection Controller3-3 5-1 Contour Plots of O2 and NOx Concentration at the SCR Inlet 5-2 5-2 Impact of Boiler Excess O2 on Unit Heat Rate Penalty 5-2 5-3 Impact of Boiler Excess O2 on ABS Formation Temperature5-3 5-4 Impact of SOFA Registers on NH3 Flow Requirement5-4 5-5 Impact of SOFA Registers on ABS Deposition Depth5-4 5-6 Impact of SOFA Registers on SCR Removal Efficiency 5-5 5-7 Impact of SOFA Registers on Unit Heat Rate Penalty5-5 5-8 Impact of 1A1-Mill Coal Flow Rate on SCR Inlet NOx Emissions 5-6 5-9 Impact of Economizer Bypass Damper on SCR Gas Inlet Temperature5-8 5-10 Impact of Economizer Bypass Damper on SCR Removal Efficiency5-8 5-11 Impact of Ammonia Flow on ABS Formation Temperature and Deposition5-9 5-12 Impact of NSR on ABS Formation Temperature and Ammonia in Ash 5-10 5-13 Impact of APH Bypass Damper Position on ABS Deposition Depth 5-11 5-14 Impact of APH Bypass Damper Position on APH Flue Gas Exit Temperature 5-11 5-15 Impact of APH Bypass Damper Position on Unit Heat Rate Penalty 5-12 5-16 Results of Sootblowing Tests5-13 5-17 Proposed Sootblowing Schedule 5-13 5-18 Modified AOSVR NOx Emissions Model Prediction Results5-16 5-19 Trained AOSVR Model Results for Boiler Heat Rate Penalty5-17 5-20 Lowest NH3 Flow Rate vs SCR Inlet NOx 5-18 5-21 GA Optimization Results for Boiler Outlet NOx ndash (a) Initialization Dataset
(b) 1st Generation (c) 15th Generation (d) 30th Generation 5-20 5-22 GA Optimization Solutions for the Total Cost Function5-21 5-23 Cost Components as a Function of Boiler Outlet NOx5-22 6-1 System Configuration Used for the Control Strategy Upgrade 6-1 6-2 SCR Manufacturerrsquos Typical Control Architecture6-2 6-3 SCR Control Architecture Based on the CEM NOx Input6-2 6-4 Multi-Loop SCR Control Architecture Based on CEM NOx SCR Inlet NOx and
SCR Outlet NOx 6-3 6-5 SIMULINK SCR Control Configuration 6-3 6-6 Simplified SCR Model6-4 6-7 SCR Efficiency as a Function of NH3NOx_in Ratio 6-4 6-8 Transport Channel Simplified Model6-5 6-9 SCR Controller6-5 6-10 Evolution of the Cost Function 6-6 6-11 Evolution of the Controller Gains 6-7 6-12 Illustration of the Time Response of the Optimized Multi-Loop Scheme 6-8 6-13 APH Control Configuration 6-8 6-14 SIMULINK APH Control Configuration6-9 6-15 Simplified APH Model 6-9 6-16 ABS Formation Temperature as a Function of NH3NOx_in 6-10 6-17 ABS Formation Temperature Simplified Model 6-10 6-18 APH Deposition Depth Controller 6-10 6-19 Coordinated SCR and APH PID-Based Control 6-11 6-20 SIMULINK Coordinated SCR and APH PID-Based Control6-12 6-21 Modification of NOx_CEM Setpoint6-12 6-22 Effect of Modification of NOx_CEM Setpoint6-13
vi
FIGURES (continued)
Figure Page
6-23 Two-Loop Adaptive Control Strategy with Extremum Seeking 6-14 6-24 Extremum Seeking Approach 6-15 6-25 Example of Extremum Seeking Minimized Cost Function6-16 6-26 Simplified Boiler Dynamic Model 6-17 6-27 Cost Function of O2 when SOFA = 0 Burner Tilt = -4 degrees SOFA tilt = 1 degree
and 1A1 Coal Flow = 15 tonhr6-18 6-28 SIMULINK Extremum Seeking Boiler Control Configuration 6-19 6-29 Extremum Seeking Implementation for Excess O2 Optimal Modulation6-19 6-30 Extremum Seeking Simulation Results (a to e from left to right top to bottom)6-20 6-31 SIMULINK Extremum Seeking SCRAPH Control Configuration6-21 6-32 Extremum Seeking Implementation for NH3 Optimal Modulation6-22 6-33 Extremum Seeking Simulation Results 6-23
vii
TABLES
Table Page
4-1 List of Testing Parameters and Their Limits 4-2 5-1 Mercury Emissions Estimates for Different Boiler Operation Conditions5-14 A-1 Parametric Test Data A-1 A-2 Sample Test Data A-4 A-3 Turbine Cycle Corrections and Cycle Performance A-5 A-4 Effect of Boiler Test Parameters on Unit Heat Rate A-5 B-1 Cayuga Unit 1 Test Matrix B-2
viii
LIST OF ABBREVIATIONS
aT SOFA Tilt aBT Burner Tilt e Fly Ash Unburned Carbon adepth ABS Deposition Depth Limit 7B Boiler Efficiency 7SCR SCR efficiency TSCR SCR time constant TTRANSP Transport channel time constant ABS Ammonium Bisulfate AFP Anti-Fouling Probe AI Artificial Intelligence AOSVR Accurate On-Line Support Vector Regression APH Air Preheater BL Baseline C CostCSCR SCR controller transfer function CSCROUT SCR outer-loop controller transfer function CSCRIN SCR inner-loop controller transfer function CSCRFEED SCR feedforward controller transfer function CCOFA Closed-Couple Overfire Air CE Combustion Engineering CF Correction Factor CFS Concentric Firing System CO Carbon Monoxide dABS ABS Deposition Depth D(x) Depth function D Damper Opening DAPH Air Preheater Bypass Damper Position DCS Distributed Control System ERC Energy Research Center ESP Electrostatic Precipitator E(x) APH-SCR coordinator f Functionf(x) SCR feedforward gain Fcoal Coal Flow to 1A1-Mill FGD Flue Gas Desulphurization GSCR SCR transfer function GA Genetic Algorithm GTRANSP Transport channel transfer function GAPH1 APH transfer function relating Tform and NH3NOxGAPH2 APH transfer function relating TAPH and damper HR Net Unit Heat Rate IS In-Service J Extremum-seeking cost function KD Extremum-seeking D weight factor KNOx in Extremum-seeking NOx_in weight factor KNOx out Extremum-seeking NOx_out weight factor KNOx CEM Extremum-seeking NOx_CEM weight factor KNH3 Extremum-seeking NH3 weight factor KHR Extremum-seeking HR weight factor Kz SCR gain
ix
KPOUT Outer-loop proportional gain KIOUT Outer-loop integral gain KDOUT Outer-loop derivative gain KPIN Inner-loop proportional gain KDIN Inner-loop derivative gain KDFEED Feedforward derivative gain KAPH CAPH APH controller transfer function KPOUT Outer-loop proportional gain LOI Loss on Ignition LNCFS Low-NOx Concentric Firing System Maux extr Auxiliary Extraction Flow Rate Mmake-up Make-Up Flow Rate MMST Main Steam Flow Rate MMSTSpray Main Steam Attemperating Spray Flow Rate MRHT Spray Hot Reheat Attemperating Spray Flow Rate MAE Mean Absolute Error NPGA Niched Pareto Genetic Algorithm NH3 Ammonia NN Neural Network NOx Nitrogen Oxides NOx_in NOx at the SCR inlet NOx_out NOx at the SCR outlet NOx_CEM NOx at the CEM NOx_CEM_setpoint Setpoint for NOx at the CEM NSR Normalized Stoichiometric Ratio NYSERDA New York State Energy Research and Development Authority OS Out-of-Service O2 Oxygen OampM Operational and Maintenance OFA Overfire Air OLE Object Linking and Embedding OPC OLE for Process Control Pcond Condenser Back Pressure Pthrottle Throttle Pressure Pg Unit Generation or Load Paux Auxiliary Power PID Proportional-Integral-Derivative Controller PLC Programmable Logic Controller q Heat Rate Penalty Qfuel Fuel Heat Rate Qsteam Steam Heat Rate SCR Selected Catalytic Reduction SIP State Implemented Plan SOFA Separated Overfire Air TAPH APH temperature TAPHgo Air Preheater Gas Outlet Temperature Tform ABS formation temperature TMST Main Steam Temperature THRT Hot Reheat Temperature TSCR SCR time delay TTRANSP Transport channel time delay
x
LIST OF UNITS
ABS Deposition Depth Ft Coal Flow Rate th Condenser Pressure In Hg Cost $h Dust Loading lbNft3
Excess Oxygen Fly Ash LOI Heat Rate Btuhr NH3 Slip ppmv
NH3 Flow Rate lbh NH3 in Ash Mgkg (ppmw) NOx lbMBtu RegisterDamper Position Residence Time sec SCR Efficiency Stack Opacity Steam Cycle Flow Rate lbh Steam Spray Flows lbhr Temperatures oF Throttle Pressure psia Tilts Degree Time Delay sec Unit Heat Rate BtukWh Unit Load MW Volume ft3
xi
SUMMARY
A study funded by the New York State Energy Research and Development Authority (NYSERDA) and
AES Cayuga was performed to investigate the feasibility of developing an optimization methodology and
demonstrate the benefit of operating in an optimal mode that achieve maximum boiler NOx emissions
reductions maximum selected catalytic reduction (SCR) system performance minimal unit heat rate
penalties and lower cost of operation at Cayuga Unit 1 Cayuga Unit 1 is a 150 MWnet unit equipped with
a low-NOx firing system and an anhydrous ammonia (NH3)-based SCR system Process optimization is a
cost-effective approach to improve the cost of NOx compliance at coal-fired boilers while meeting other
operational and environmental constraints In boilers equipped with SCRs this is a classic multi-objective
optimization problem to balance boiler thermal performance NOx emissions the cost of reagent and air
preheater (APH) maintenance costs The specific objectives of this study included
bull Provide upgraded instrumentation and control capabilities of ammonium bisulfate
(ABS) fouling at the APH
bull Develop a methodology for a combined boiler combustionSCRAPH optimization
bull Perform field testing at Cayuga Unit 1 and modeling and data analysis to support the
demonstration of a combined optimization
bull Develop upgraded control strategy for minimum boiler NOx emissions optimal SCR
operation minimal NH3 consumption optimal APH operation and minimal overall
cost of operation
Long-term operation of a SCR system at optimal conditions should
bull Improve reagent utilization
bull Minimize catalyst deterioration and reduce operational and maintenance (OampM)
costs
bull Operate at tighter stack NOx levels with minimal standard deviation
bull Maintain SCR constraints such as design NH3 slip and SO2-to-SO3 conversion
bull Minimize SCR impact on balance of plant equipment such as ABS formation and
unit heat rate
The following conclusions and recommendations were achieved from the results of this study
bull SCR tuning is an important aspect that should be considered when optimizing the
operation of SCR systems This involves the adjustment of the SCR injection grid
S-1
for uniform reagent treatment However at Cayuga Unit 1 the as-found conditions
and NH3 injection tuning capability rendered this step unnecessary
bull A Breen Energyrsquos AbSensor ndash Anti-Fouling Probe (AFP) was installed at one of the
APH inlets at Cayuga Unit 1 for on-line monitoring of ABS and real-time
determination of the ABS deposition axial location in the APH This probe was
found very reliable and an excellent tool to be used in an upgraded optimal SCR
system operation
bull Parametric field tests were performed at Cayuga Unit 1 From these tests it was
found that economizer excess O2 the top two separated overfire air (SOFA) register
openings burner tilt SOFA tilt the coal flow to the top pulverizer (1A1-Mill) and
the NH3NOx ratio all have an impact on SCR inlet NOx NH3 requirement for a
target stack NOx emissions level SCR NOx removal efficiency net unit heat rate and
ABS deposition Lower flue gas temperatures were found to improve SCR
performance hence manipulation of the economizer bypass damper was found
ineffective to improve SCR performance at full load It was found that increasing
the NH3 flow rate in excess of 130 lbhr increases the likelihood of exceeding a 275
ft threshold distance from the APH cold-end for ABS deposition Within this 275
ft distance ABS removal by sootblowing is greatly enhanced
bull Sootblowing tests were performed to investigate the impact of different sootblowing
routines on the operation of the SCR system and associated NOx reduction and NH3consumption It is recommended a sootblowing schedule that introduces activation
of wall blowers (Model IR) at the waterwalls every 10 min alternating blowers from
each ring (A B and C) and retractable blowers (Model IK) every shift as well as
cleaning of the SCR once a shift and of the APH three times per shift
bull Artificial intelligence techniques were used to model the test data and provide a tool
for mathematical optimization A modified accurate on-line support vector
regression (AOSVR) was implemented on the parametric test data to build artificial
intelligence-based functional relationships between the boiler outlet or SCR inlet
NOx level and heat rate penalty The prediction performance of proposed AOSVR
model was adequate Genetic algorithms (GAs) were used to solve the constrained
multi-objective optimization problem with success An optimal solution is
recommended for the lowest cost of compliance which corresponds to the following
control setting Economizer excess O2 = 32 average SOFA register opening =
51 (both top- and mid-SOFA registers open equally) average burner tilt angle = -8
degrees average SOFA tilt angle = +6 degrees top 1A1-Mill coal flow rate = 6
tonhr APH bypass damper = 0 opens (completely shut) and an NH3 injection rate
= 125 lbhr The optimal NH3 injection rate represents a reduction in NH3 flow rate
S-2
from baseline conditions of approximately 22 percent The combination of optimal
settings should result in NOx emissions at the boiler outlet of 0188 lbMBtu while
limiting ABS deposition to at less than 25 ft from the APH cold-end and producing
fly ash unburned carbon below 4 percent at a differential cost of $412hr This is
the lowest combined (heat rate penalty ndash and NH3-related) cost of operation as
compared to a highest cost of close to $20000hr The savings in net unit heat rate
from operation at optimal boiler and APH conditions equate to 54 BtukWh as 06
from the baseline net unit heat rate
bull A multi-loop control upgrade was proposed to enhance the boilerSCRAPH control
strategy The multi-loop control approach was complemented with a systematic
method for optimal tuning of proportionalndashintegralndashderivative (PID) control gainsThe SCR control logic that was in use at Cayuga Unit 1 was partially modified to
include a scheme that incorporates the feedback measurements implemented in this
project (viz real-time ABS monitoring and deposition tracking) The control system
upgrade includes a control strategy provision for the APH bypass damper by
controlling the average cold-end APH temperature to minimize APH
foulingplugging Additionally simple dynamic models for the boiler SCR system
and APH system were identified from the data and proposed to provide coordination
of both the SCR and APH control systems to enhance the overall performance of the
system This coordination approach led to the definition of tradeoffs resolved using
extremum-seeking control techniques
bull For future work two extremum-seeking loops are proposed for real-time
optimization at Cayuga Unit 1 The first non-model-based adaptive extremum-
seeking controller is proposed to regulate the boiler inputs (O2 SOFA register
opening burner tilt SOFA tilt top mill coal flow) to minimize both NOx at the SCR
inlet and the boiler heat rate penalty Non-model-based controllers learn from
dynamic operating data of the process This compares to model-based controllers
that utilize dynamic models to obtain mathematical conditions between the controller
design parameters and tuning rates The second non-model-based adaptive
extremum-seeking controller is proposed to regulate the NH3 flow to the SCR system
and the APH bypass damper opening in order to optimally control in real-time and in
a coordinated fashion both the NOx at the stack and ABS deposition within the
APH Based on the results obtained during this project the proposed approach has
the potential for further reducing stack NOx emissions unit heat rate NH3 usage and
provide savings from reduced APH washing frequency
bull Based on the results of this study it is indicated that modifying the combined
operation of the boiler and SCR system can result in savings in reagent usage heat
S-3
rate improvements and corresponding OampM costs Estimates were run to calculate
the economic benefits of an optimal operation In addition other indirect benefits
would result from these improvements These include catalyst life extension
reduction in APH cleaning frequency and costs associated with the loss of unit
availability Other added benefits not considered in the evaluation of benefits
include savings due to optimal sootblowing system operation reduction in fly ash
NH3 contamination and reduction of sulfur related problems such as sulfuric acid
corrosion and stack visible plume The estimated annual cost savings for Cayuga
Unit 1 due to optimized operation of the boilerSCRAPH system is on the order of
$748000 The estimates do not consider that it might be practical for utilities to
ldquoover-controlrdquo NOx to sell allowances into the NOx allowance market
The results of this analysis are based on a single limited data set However these results indicate that there
is a significant potential to optimize the combined operation of boiler combustion SCR system and APH to
achieve reduced operating costs
S-4
Section 1
INTRODUCTION
Responding to environmental regulations mandated by the EPArsquos State Implementation Plan (SIP) Call
Rule the US power industry has embraced application of the Selective Catalytic Reduction (SCR)
technology for nitrogen oxide (NOx) emission control This has resulted in 191 SCR installations on US
utility boilers by 2004 representing approximately 150 GW of coal-fired capacity SCR is considered a
ldquomaturerdquo technology which has been extensively applied in Europe and Japan since 1986 SCR systems
rely on the chemical reduction of NOx with ammonia (NH3) over the surface of a catalyst A theoretical
one-to-one NH3NOx molar ratio would result in conversion of these reactants to environmentally benign
molecular nitrogen and water vapor There is a good deal of care devoted by the equipment supplier to the
design and initial operational setup of SCR systems which is dictated by the particular application and
related to boiler configuration and type coal and fly ash composition and target NOx emission level or
NOx removal efficiency Other constraints that influence SCR design specifications include catalyst life
ammonia (NH3) slip SO2-to-SO3 conversion and maximum pressure drop across the SCR reactor
Once the SCR system is retrofitted to a boiler however continuous efficient long-term operation of the
SCR system requires the appropriate interaction between the flue gas reagent and catalyst which really
indicates how integral the SCR reactor is to the combustion process it serves As described in an article in
the journal POWER ldquowhile it may be down there success of a SCR has everything to do with what is
happening upstreamrdquo This is accentuated by the situation with the NOx SIP Call requirements which
provide incentive for operating SCR process equipment to deliver greater than the typical 75-85
European performance levels Many US utilitiesrsquo NOx strategic plans are based on SCR performance at
key units with 90+ NOx removal and control of NH3 slip at 2 ppm Consistently achieving those targets
(at the lowest available reagent consumption levels) over the 5-month period of the Ozone Season or over
the length of the year to meet generating system NOx caps is affected by normal changes in the boiler and
associated firing system which distort process conditions from assumed design targets Additionally SCR
process instrumentation and controls and reagent delivering systems suffer from inherent deficiencies
particularly under a variety of operational regimes (ie low-loads varying load ramp rates fluctuating coal
sources) which result in deviations from optimal SCR operation and consequently increased operational
and maintenance (OampM) costs and deteriorated catalyst life
Optimal cost-effective operation of the SCR system is mainly affected by changes to the flue gas
conditions the amount of NOx generated in the furnace and the NH3NOx preparation and use in the
catalyst bed Most operators of SCR systems recognize these effects and try to modify combustion in the
furnace for lower inlet NOx to the SCR system as well as periodically tune the SCR unit for best reagent
utilization and minimal OampM costs The SCR tuning targets provide relatively uniform NOx temperature
1-1
and flue gas flow conditions at the reagent point of injection at the SCR reactor inlet and maintain uniform
distributions of NOx and ammonia slip at the outlet of the SCR reactor Typical target ranges for the
variables of interest are inlet temperature distribution plusmn 30degF from the mean inlet flow distribution plusmn 15
percent from the mean and NH3NOx molar ratio plusmn 5 percent from the mean
In addition to periodical tuning of the SCR system optimization of the combined furnace combustionSCR
systemboiler back-end is of significant importance to obtain the maximum NOx reduction benefit from the
post-combustion emissions control system at the lowest OampM cost on a consistent basis Optimization of
combined boiler and SCR operation requires consideration of all operating parameters that impact the
combustion side SCR performance and the air preheater (APH) The SCR post-combustion NOx control
technology is usually retrofit on boilers equipped with low-NOx firing systems and on high-dust high-
temperature configurations with the SCR system located in front of the APH and the dust collection
equipment SCR systems designed and operated to achieve high NOx reduction efficiencies of over 90
are challenged to perform at the optimal level while achieving less than 2 ppm of NH3 slip resulting in
over-feeding of NH3 with associated operating cost penalties The price of NH3 has more than doubled in
recent years (currently at approximately $500ton NH3) Additionally in coal-fired boilers high NH3 slip
has an adverse impact on cold-end equipment located downstream of the SCR reactor The concerns
include ammonium bisulfate (ABS) deposition and plugging and corrosion potential of APHs Controlling
and mitigating APH fouling is imperative in coal-fired boilers since it precludes continued operation of the
unit requiring forced shutdowns for APH cleaning with the associated loss in unit availability and
financial penalty
The challenge of the SCR control technology is to achieve cost-effective high levels of NOx emissions
performance while constraining its detrimental impact at the boiler back-end An integrated approach for
the optimization of the combustion and post-combustion systems including the APH offers an alternative
to meet this challenge Such an approach should consider in a coordinated fashion the optimal operation
of the boiler firing system SCR reactor (including the reagent injection system) APH and net unit thermal
performance To investigate the feasibility of developing an optimization methodology and demonstrate
the benefit of operating in an optimal mode that achieves maximum boiler NOx emissions reductions
maximum SCR system performance minimal unit heat rate penalty and lower cost of operation a study
was conducted by the Energy Research Center under funding from the New York State Energy Research
and Development Authority (NYSERDA) and AES Cayuga The specific objectives of this study include
Provide upgraded instrumentation and control capabilities of ABS fouling at the APH
Develop a methodology for a combined boiler combustionSCRAPH optimization
Perform field testing at Cayuga Unit 1 and data analysis and modeling to support the
demonstration of a combined optimization
1-2
Develop upgraded control strategies for minimum boiler NOx emissions optimal SCR operation
minimal NH3 consumption optimal APH operation and minimal overall cost of operation
This report contains a description of the test unit used for this project instrumentation retrofit to monitor
ABS formation in the APH and a summary of the parametric tests data analysis results control system
upgrade as well as an evaluation of the benefits of this optimization and conclusions and
recommendations obtained from this project
1-3
Section 2
UNIT DESCRIPTION
This project was performed at AESrsquos Cayuga Station Unit 1 Cayuga Unit 1 is a 150 MWnet single-reheat
tangentially-fired Combustion Engineering (CE) boiler equipped with a low-NOx concentric firing system
(LNCFS) level III The LNCFS-III system consists of four elevations of burners arranged in four corners
(see Figure 2-1) Four pulverizers (1A1 1B2 1A3 and 1B4 from top to bottom) supply coal to the burner
system one mill per elevation Cayuga Station typically fires Northern Appalachian coal however
blending with lower quality fuels is common at this station The windbox compartment at each corner is
composed of fuel air registers (coaxial with the burner nozzle) auxiliary air registers and concentric fire
system (CFS) air registers that are used to divert combustion secondary air at an offset with respect to the
burner centerline In addition to the secondary air ports the LNCFS-III arrangement at Cayuga Unit 1
incorporates overfire (OFA) in two set of registers two closed coupled overfire air (CCOFA) registers and
a separated OFA (SOFA) compartment with three registers All the burner buckets and CCOFAs are
connected to tilt in unison for controlling of steam temperatures The SOFA compartments are also tiltable
for combustion staging Cayuga Unit 1 is equipped with two Ljungstrom type rotating APHs These APHs
are equipped with air bypass capabilities for average cold-end temperature control and acid dewpoint
mitigation at the APH cold-end The Cayuga Unit 1 APHs are equipped with rake type sootblowers which
can reach and remove deposits from the cold-end approximately 275 ft into the cold-end baskets The rest
of the boiler back-end configuration includes an electrostatic precipitator (ESP) for particulate removal and
a flue gas desulphurization unit (FGD)
SCR APH ESP FGD STACK
TOP SOFA
MID SOFA
BOT SOFA
CCOFA
CCOFA
1A1 COAL AIR
CFSAUX AIR
1B2 COAL AIR
CFSAUX AIR
1A3 COAL AIR
CFSAUX AIR
1B4 COAL AIR
AUX AIR
Figure 2-1 Cayuga Unit 1 ndash Boiler Configuration
2-1
Combustion control at Cayuga Unit 1 is based on the typical parallel airfuel control scheme An excess air
or percent oxygen (O2) trim control loop is available in the combustion control system The excess O2 bias
is applied at Cayuga Unit 1 on-manual operation by the boiler operators to balance furnace outlet or SCR
inlet NOx emissions and fly ash unburned carbon (or loss on ignition LOI) A bias is an adjustment
applied to a controllable parameter to elimate the deviation in the value of the parameter with respect to a
prescribed set point Due to fly ash sale and landfilling restrictions fly ash LOI at Cayuga is maintained at
below 4 percent Periodical samples of fly ash are taken throughout the day at Cayuga Unit 1 and analyzed
on-site for LOI Boiler excess O2 is adjusted accorderling to maintain the fly ash below the required
threshold Steam temperatures are controlled by attemperating sprays burner tilts and sootblowing
Design steam temperatures are 1000degF for both main steam and hot reheat steam temperatures
Cayuga Unit 1 is equipped with a 2-layer anhydrous NH3-based SCR system with a TiO2V2O5WO3formulation and total catalyst volume of 5890 ft3 for additional NOx control Design requirements for the
SCR system at Cayuga Unit 1 included 90 NOx reduction based on an inlet NOx emission rate for the
specified coals of 042 lbMBtu and an NH3 slip of less than 2 ppm at actual excess O2 Other design
considerations include an operating SCR temperature in the range between 608 and 700degF with a normal
operating temperature at full unit load of 627degF limited sulfur dioxide (SO2) to sulfur trioxide (SO3)
oxidation of less than 1 and dust loading of 000037 lbNft3 (normal ft3 or a standard temperature of
68oF and standard pressure of 1 atm) with a catalyst pitch of 02 in The SCR reactor houses the catalyst in
a downflow orientation and it is equipped with economizer bypass for SCR inlet temperature control at low
load operation The economizer bypass dampers allow hotter flue gas from the middle of the primary
superheater to mix with the economizer outlet gas to maintain a minimum catalyst inlet temperature of
608degF Additional dampers are provided for SCR reactor isolation and flow modulation SCR cleaning is
achieved with six air-based retractable sootblowers The anhydrous NH3 system includes a evaporationair
dilution skid and injection grid Ammonia concentration in the ammoniaair mixture is maintained at
approximately 5 Ammonia injection and mixing with the flue gas is achieved with an injection pipe
manifold that traverses the flue gas and two sets of static mixers SCR gas side instrumentation includes
NOx analyzers at the inlet and outlet of the reactor and a zirconium dioxide O2 analyzers Ammonia
injection control is performed using a combined feedforward and feedback control scheme In this scheme
the unit distributed control system (DCS) calculates the total NOx in the flue gas at the SCR inlet This
determines the feedforward portion of the injection signal to the NH3 flow control valve The DCS is also
allowed to trim the NH3 injection rate based on the feedback from the NOx analyzer located at the SCR
outlet and to maintain a constant NOx removal efficiency across the SCR A value of 90 NOx removal is
used for NH3 trimming
2-2
Section 3
ABS MONITORING
As part of this project Cayuga Unit 1 was retrofit with instrumentation for monitoring of ABS An ABS
monitoring sensor manufactured by Breen Energy Inc was installed at one of the APH inlets of Cayuga
Unit 1 The intention was to use one single sensor as indication of the fouling condition of both rotating
preheaters The Breen Energyrsquos AbSensor - Anti-Fouling Probe (AFP) is a probe that measures the
conduction of electrical current across the probersquos tip that results from condensed hydrated ammonium
bisulfate below its dewpoint The instrument reports both the ABS formation or condensation and
evaporation temperature via object linking and embedding (OLE) for process control (OPC) The detection
process consists of cooling the initially hot detector tip by controlled application of cooling air The
presence of a condensed ABS liquid phase is determined by the change in electrical resistancecurrent
between the probersquos electrodes Following detection of condensate the cooling air stream is removed and
the probe is allowed to return to the flue gas temperature As the probe heats the change in electrical
resistance is measured again to detect the liquid evaporation temperature of the deposit The ABS
monitoring capability also included programmable logic controllable (PLC) hardware integrated APH
model and temperature controller and NH3 injection controller The NH3 injection controller can provide
closed loop control to the SCR reagent injection process by estimating the mismatch between a unit NOx
emissions setpoint and the actual stack NOx indication to produce a NH3 bias that is applied to the DCS
programmed SCR NH3 flow vs unit load curve More description of the NH3 injection controller will be
provided in the Upgraded SCR Control Strategy Section
The Breenrsquos APH temperature controller includes an APH heat transfer calculation and a control scheme
that provides a bias to the plant DCSrsquo APH cold-end average temperature (the average of APH flue gas out
and APH air inlet temperatures) setpoint This setpoint has traditionally been used to control for the impact
of sulfuric acid dewpoint deposition The APH heat transfer calculation is based on a comprehensive
metalgas matrix model developed by Lehigh University which provides real time information on the
maximum APH metal temperature as a function of the axial distance from the APH cold-end The input
parameters used by the first-principle APH heat transfer calculation include flue gas and air inlet
temperatures and gas and air flow rates This information and the measured AbSensor evaporation
temperature are used by the APH temperature control scheme to estimate a potential ABS condensation
depth from the APH cold-end (the intersection of these two temperatures) The controller is then
manipulated to maintain an operational condensation depth within a setpoint ABS deposition depth that
represents the cleanable range of the sootblowers located (only) at the APH cold-end In case the actual
condensation depth is found to penetrate beyond the allowed condensation depth setpoint an APH cold-end
average temperature bias is introduced by the controller to the DCS This bias results in a manipulation of
the APH air bypass damper which changes the internal APH heat transfer patterns and modifies the APH
3-1
cold-end average temperature to a new biased setpoint within the ABS deposition setpoint Limits for this
bias are imposed to prevent the controller from operating at excessive heat rate penalties and exceeding the
acid dew point of the flue gas Figure 3-1 includes a representation of the APH temperature controller
performance
Tem
pera
ture
[deg
F]
700
600
500
400
300
200
100 0 1 2 3 4 5 6
Distance from Cold End [ft]
COLD-END LAYER HOT-END LAYER
ABS Deposition Acid D eposition
APH Basket Maximum Metal Temperature B efore C ontroller Action
ABS Evaporation Temperature
Acid Dewpoint Temperature
ABS Dep osition D ept h Setpoint
ABS Dep ositio n D epth Controlled
APH Bask et Maximum Metal Temperature After Controller Action
(Opening of APH Bypass Damper)
ABS Deposition D epth Un controlled
Air Preheater Model and Controller Performance
Figure 3-1 Representation of AP H Temperature Controller Performance
Tuning of the installed Breen Energyrsquos technology was performed between August 29-30 and September
26-27 2007 The tuning consisted of off-line manipulation of the controllersrsquo input parameters to verify
the adequacy of the different variable setpoints Additionally a series of tests was performed to adjust the
APH condensation depth setpoint and assure that the APH temperature controller would operate the APH
back-end temperature within a controllable range Figure 3-2 shows the results of testing performed to
investigate the APH temperature controller response to changes to the APH condensation depth In the
particular tests of Figure 3-2 the APH condensation depth setpoint was adjusted from 28 ft from the APH
cold-end to 26 ft The response of the APH temperature controller was adequate with the APH bypass
damper opening to adjust the APH cold-end average temperature to a higher level and the subsequent
displacement of the actual ABS condensation depth toward the cold-end The time delay for this response
is of the order of 4 min It was decided to implement an APH condensation depth setpoint at 275 ft from
the cold-end
3-2
200
220
APH C old-End Average Temperature
APH Bypass D amper Position
APH Co ndensatio n Depth
APH Con den sation Depth Setpo int
300
295
APH
Reci
rcua
ltion
Dam
per P
ositi
on [
] 290 180
285 160
280 140
Flue
Gas
Tem
pera
ture
[deg
F]
Con
dens
atio
n D
epth
[ft]
275 120
100
80
60
40
20
270
265
260
255
250
245
0 240 103336 104800 110224 111648 113112 114536 120000 121424 122848 124312
Figure 3-2 Performance of the APH Temperature Controller
Figure 3-3 shows results of testing performed to investigate the NH3 flow injection controller response to
changes in SCR inlet NOx In the particular tests of Figure 3-3 a boiler outlet NOx decrease was followed
by a corresponding decrease in reagent flow rate to compensate for the lower inlet NOx emissions and
maintain the stack NOx setpoint at a pre-determined value of 0095 lbMBtu The average stack NOx
emission level for this period was 0093 plusmn 0003 lbMBtu The drastic changes in NH3 flow in Figure 3-3
are most likely due to the delays associated with the NH3 controller
0200
0245 150
0240
0235
0230
0225
0220
0215
0210
0205
SCR Inlet NOx Ammonia Flow Bias
Stack NOx Setpoint = 0095 lbMbtu Average SCR Efficiency = 713
145
140
135
130
125
120
115
110
105
100
95
Am
mon
ia F
low
[lb
hr]
SCR
Inle
t NO
x [lb
MB
tu]
0195 90 103336 104800 110224 111648 113112 114536 120000 121424 122848 124312
Figure 3-3 Performance of Ammonia Injection Controller
3-3
Section 4
PARAMETRIC FIELD TESTS
Parametric field tests were performed at Cayuga Unit 1 Due to unit availability and station scheduling
these tests were performed during the weeks of November 26 December 3 and 10 2007 and January 14
2008 Testing was conducted by two ERC engineers with support from the station Testing was performed
at three unit loads 150 (full load) 100 and 75 MW while firing a baseline coal (as much as possible) The
load level of 75 MW is the minimum operating load for Cayuga Unit 1 The objective of these tests was to
obtain enough data under controlled conditions for characterizing the impact of boiler and low-NOx firing
system control settings sootblowing and SCR system and APH on SCR and APH performance boiler
outlet NOx (SCR inlet NOx) NH3 injection requirement unit heat rate and ABS formation Additionally
the parametric tests investigated the impact of SCR system operation APH bypass damper and sootblowing
scheduling on these same parameters of interest Test results were also used to build a database to be used
for artificial intelligence (AI) modeling and to obtain the best combinations of boiler firing system SCR
and APH operational settings for SCR system optimal control strategy and upgrades This report
concentrates on the results achieved at full load since that Cayuga Unit 1 is a base-loaded unit and it stays
most of the time at full load
Previous to the field tests a test plan was developed in collaboration with AES Cayuga engineers The
plan was reviewed and approved by the station The first planned step consisted of a survey of the boiler
and low-NOx and SCR system to determine baseline (as-found) conditions and control settings Also the
first step included performing an extended test at baseline settings Baseline settings are those as-found
settings commonly used by the operators The second planned step consisted of combustion and SCR
tuning For this tuning a permanently installed gas sampling grid and a portable gas analyzer was used to
sample the flue at the economizer exit or SCR inlet location The purpose of this tuning is typically to
perform adjustments to the boiler low-NOx firing system and NH3 injection to achieve balanced
combustion conditions at the boiler convective pass before the SCR inlet as well as balanced SCR
performance
Additionally a series of parametric tests was planned in which one or two boilerlow-NOx system
parameter was tested at a time while all other operating parameters were held constant The parameters
used for testing and their available operating ranges are included in Table 4-1 Additional testing was
performed to characterize the impact of CCOFA registers different pulverizers out-of-service (OS)
configurations the SCR economizer bypass dampers and boiler sootblowing
Six to seven tests were scheduled per day including a baseline test at the beginning of each day followed
by a series of parametric tests The duration of each test was dictated by the requirements of collecting a
4-1
Table 4-1 List of Testing Parameters and Their Limits
No Symbol Variable description Unit Upper limit Lower limit 1 O2 Excess O2 40 25
2 SOFA Average top SOFA Opening 100 0
3 aST SOFA Tilt Deg 25 -15
4 aBT Burner Tilt Deg 15 -15
5 Fcoal Coal flow rate of top mill th 19 0 (OFF) 6 NH3 Ammonia flow rate lbh 250 0
7 DAPH APH bypass damper position 100 0
sufficient quantity of fly ash sample and sufficient steady-state data Steadiness of data was recognized
after changes in control settings and the associated transient that occurs after the upset by flat trending in
emissions NH3 consumption steam temperatures and attemperation and flue gas temperatures at the boiler
back-end Economizer excess O2 was measured at the economizer outlet and was used as an indication of
the amount of excess air fed to the boiler the average of the top and middle SOFA register openings was
used as an indication of combustion staging The average burner and SOFA tilt angles and the coal flow
rate to the top 1A1-Mill were included in the parametric list to fully characterize the relationship between
boiler control settings and boiler outlet or SCR inlet NOx and unit thermal performance The NH3 flow rate
was measured at the SCR injection point and together with the APH bypass damper position was used to
characterize parametric relationships for the SCR and APH respectively Coal and fly ash was sampled
daily and for each test run respectively and analyzed off-line Fly ash samples were collected from the
first row of ESP hoppers and combined into a composite sample and analyzed for unburned carbon or loss
on ignition (LOI) For fly ash sample collection ESP tests hoppers were evacuated as part of their
operational cycle and put on bypass to accumulate samples for each corresponding test run
Average data on SCR inlet and outlet NOx and SCR NOx removal efficiency (defined as the normalized
NOx reduction across the SCR with respect to the inlet NOx) main steam and hot reheat steam
temperatures attemperating flow rates boiler flue gas and air temperatures were acquired from the plant
OSI soft PI data acquisition system for each test point ABS formation temperature was measured at the
APH inlet as indicated by the Breenrsquos probe and its signal incorporated into the OSI soft PI system
Indication of net unit heat rate deviation or penalty for each test point or combination of test parameters
with respect to baseline conditions was estimated from a heat and mass balance model of the unit A
description of the procedure used to estimate the heat rate difference with respect to baseline conditions is
include in Appendix A Sootblowing tests were performed to characterize the impact of different groups of
sootblowers on the parameters of interest For these tests activation of selected group of blowers was
carried out at steady boiler low-NOx firing system and SCR system control settings
4-2
Table B-2 in Appendix B contains the matrix of the field tests that were performed at Cayuga Unit 1
Table B-2 describes the particular conditions of the parameters of interest A total of 102 tests were
performed These tests involved manipulation of combustion and the low-NOx firing system the SCR
system the APH and sootblowing The maximum level of manipulation of each particular parameter was
determined in conjunction with the plant staff in terms of having enough data to characterize the effect of
each parameter on the variables of interest (ie NH3 consumption SCR NOx reduction efficiency unit heat
rate etc) and in accordance with the unit operational and environmental constraints (ie minimum
windbox pressure maximum allowable ABS penetration depth maximum stack opacity maximum fly ash
LOI level etc)
4-3
Section 5
DATA ANALYSIS RESULTS AND DISCUSSION
DATA ANALYSIS RESULTS
Before performing any parametric field tests sampling of the flue gas was performed A permanently
installed 8 x 4 gas sampling grid and a portable gas analyzer was set up to sample the flue at the SCR inlet
location The purpose of this sampling is to determine the level of NOx stratification in the input flue gas to
the SCR and injected NH3 stratification at the SCR inlet Guided by the results of this activity
adjustments to the boiler and low-NOx firing system are typically planned (ie corner-to-corner
combustion balancing) to achieve balanced combustion conditions at the boiler convective pass before the
SCR inlet Additionally signs of NH3 stratification are corrected by adjustment to the NH3 injection
valves However this was not an option at Cayuga Unit 1 since no modulation valves are available for
localized NH3 flow manipulation Figure 5-1 shows a contour plot of the measured excess O2 and NOx
concentration at the SCR inlet The most important data NOx emissions (corrected to 30 O2) indicate
that the range of NOx concentration is from 297 to 313 ppm at 3 O2 This is approximately a 52
deviation of the mean which is within recommended flue gas stratification for SCR applications No
further action was taken on manipulating combustion for homogenizing the flue gas at the SCR inlet
Figure 5-1 Contour Plots of O2 and NOx Concentration at the SCR Inlet
Data obtained from the parametric field tests were reduced and analyzed to determine trending
relationships between independent or controllable parameters and the boiler SCR and APH dependent
parameters The independent parameters investigated for the boiler included excess O2 SOFA settings
5-1
burner and SOFA tilt positions and the coal flow rate to the top 1A1-Mill The dependent parameters
included boiler outlet or SCR inlet NOx emissions rate the NH3 flow requirement to achieve 0095 lbMBtu
NOx at the stack the SCR NOx removal efficiency (calculated as the normalized NOx reduction across the
SCR with respect to the inlet NOx level) the SCR inlet gas temperature and APH gas outlet gas
temperature the main and hot reheat steam temperature and attemperating spray flows the ABS formation
temperature and condensation depth in the APH fly ash LOI and the calculated heat rate deviation or
penalty
From the data analysis it was estimated that the impact of excess O2 on boiler NOx emissions level is
approximately a 0055 lbMBtu drop per percent reduction in excess O2 This translates in a reduction in
NH3 flow requirement of approximately 41 lbhr of NH3 to maintain the stack NOx constraint of 0095
lbMBtu at the stack Excess O2 was also found to modestly increase SCR removal efficiency for the
particular SCR system at Cayuga Unit 1 This impact on SCR efficiency correlated to the inverse
relationship between excess O2 and flue gas flow rate and SCR residence time The impact of excess O2 in
flue gas temperature was found to be of approximately -8degF O2 at the SCR inlet and insignificant at the
APH outlet Excess O2 increase was found to increase steam temperatures and the attemperating spray
requirement if the steam temperatures exceed the design values by approximately +15degF O2 Fly ash
LOI increases almost a percent per reduction of a percent point in excess O2 The impact of O2 on these
performance parameters results in a parabolic trend with respect to boiler heat rate penalty resulting in a
minimum in heat rate at approximately 315 (see Figure 5-2) The reduction in excess O2 for boiler
emissions reduction also helps reduce ABS formation temperature by approximately 125degF per percent
reduction in O2 (see Figure 5-3) The ABS probe evaporation temperature was used as the best indication
of ABS formation temperature based on the experience of Breen Energy Opacity was noticed to increase
by only 07 for the range of O2 used in the excess air tests (25-40 O2)
The impact of the overfire air registers on the variables of interest was found to be of first order The
CCOFA and SOFA registers were manipulated at different opening levels and vertical biases It was found
that the effect of CCOFAs and the lower elevation SOFA register on boiler NOx and flue gas and steam
temperatures was of second order The top two elevations of SOFA opened at identical setting were
found to be most effective in reducing boiler outlet NOx Hence these two registers were used in the
SOFA tests Figures 5-4 to 5-7 show some of the results obtained from the data analysis in relation to the
SOFA register openings Figure 5-4 shows the reduction in required NH3 flow to comply with a stack NOxconstraint of 0095 lbMBtu as a function of SOFA register opening The SOFA indication used in the
plots corresponds to the average position of the top two SOFA registers It was found that reductions of the
order of 35 can be achieved from baseline NH3 injection flow rates over the physical range of the SOFA
registers This level of NH3 flow consumption (and SOFA opening) impacts the deposition of ABS and the
location of the ABS deposition depth along the APH axis (see Figure 5-5) The goal is to keep the ABS
5-2
Cayuga Unit 1 Unit Heat Rate Penalty vs O2
Unit
Hea
t Rat
e Pe
nalty
[Btu
kw
h]
88
86
84
82
80
78
76
74
72
Baseline or Reference Tests
y = 53417x2 - 33 874 x + 611 16 R2 = 07911
250 270 290 310 330 350 370
Excess O2 [] Figure 5-2 Impact of Boiler Excess O2 on Unit Heat Rate Penalty
APH
AB
S F
oulin
g Te
mpe
ratu
re [d
eg F
]
Cayuga Unit 1 APH ABS Fouling Temperature vs O2
470
460
450 y = 12418x + 41182
R2 = 07332 440
430
420 Baseline or Reference Tests
410
400
390
y = 202x + 33714 R
2 = 08767
Fouling Evap Temp
Fouling Formation Temp
380 250 270 290 310 330 350 370
Excess O2 []
Figure 5-3 Impact of Boiler Excess O2 on ABS Formation Temperature
deposition depth closer to the APH cold-end where sootblowers can reach the deposits and clean them An
ABS deposition depth setpoint was set at Cayuga Unit 1 at 275 ft from the APH cold-end Also impacted
by the SOFA registers is the SCR efficiency and net unit heat rate Figures 5-6 and 5-7 show the effect of
OFA opening on SCR NOx reduction efficiency and unit heat rate penalty respectively The negative
impact on SCR efficiency is associated to the changes in flue gas temperature The negative impact on unit
5-3
heat rate is associated to the increase in fly ash LOI and increase in flue gas temperature The impact of
SOFA registers on fly ash LOI was more noticeable at openings in excess of 60 where the LOI increases
up to 6 The impact of SOFA on stack opacity is negligible
Cayuga Unt 1 Ammonia Flow Rate vs OFA
0 10 20 30 40 50 60 70 80 90 100
y = 00092x2 shy 17071x + 17777 R2 = 09971
y = 00096x2 shy 16081x + 17593 R2 = 09594
0
20
40
60
80
100
120
140
160
180
200
Am
mon
ia F
low
Rat
e [lb
hr]
O2=33
O2=30
Poly
B aseline
Am monia Consumption R eduction
Average Top OFAs Register Position []
Figure 5-4 Impact of SOFA Registers on NH3 Flow Requirement
y = -9E-05x2 - 00034x + 27927 R2 = 09977
ABS Deposition Depth (from Cold-End) Setpoint
y = -00112x + 27989 R2 = 09192
O2=30APHA
O2=30APHB
Air
Preh
eate
r AB
S D
epos
ition
Dep
th [f
t]
35
30
25
20
15
10
05
00 0 10 20 30 40 50 60 70 80 90 100
Average Top OFAs Register Position []
Cayuga Unit 1
Air Preheater ABS Deposition Depth vs OFA
Figure 5-5 Impact of SOFA Registers on ABS Deposition Depth
5-4
Cayuga Unt 1 SCR Efficiency vs OFA
950
945
y = 8E-06x2 - 0001x + 09439 R2 = 09732
y = 3E-06x2 - 00007x + 09465 R2 = 09842
0 10 20 30 40 50 60 70 80 90 100Average Top OFAs Register Position []
O2=33
O2=30
SCR Efficiency = [NOxi- NOxo]NOxi
Baseline
SCR
NOx R
emov
al E
ffici
ency
[] 940
935
930
925
920
915
910
905
900
Figure 5-6 Impact of SOFA Registers on SCR Removal Efficiency
0
Cayuga Unt 1 Unit Heat Rate Penalty vs OFA
130
Unit
Heat
Rat
e Pe
nalty
[Btu
kw
h]
120
110
100
90
80
70
60
50
40
30
20
10
0
O2=33
O2=30 y = 04097x + 75131 R2 = 08168
y = 0439x + 69173 R2 = 09395
Baseline
Net Heat Rate Penalty Referred With Respect to Minimal Heat Rate Achieved from Tests
0 10 20 30 40 50 60 70 80 90 10Average Top OFAs Register Position []
Figure 5-7 Impact of SOFA Registers on Unit Heat Rate Penalty
Testing was performed to investigate the effect of biasing coal flow and taking selective mills OS on boiler
outlet NOx emissions It was found that the most significant impact is introduced by the top 1A1
5-5
pulverizer Special effort was devoted to perform systematic tests on the 1A1-Mill by biasing its coal flow
until taking the mill completely off While this was done the other bottom mills were loaded equally
Figure 5-8 shows the relationship between 1A1-Mill coal flow and SCR inlet NOx emissions The
reduction in coal flow from its maximum flow rate of 19 tonhr to the OS condition represents a reduction
in NOx emissions rate of 0048 lbMBtu The corresponding reduction in NH3 flow to maintain the target
NOx emissions at the stack is 27 lbhr For this reason this parameter was included in the optimization list
of parameters however changes in coal quality that would require a higher total coal flow to produce the
same unit load will preclude biasing of the top mill Reduction in coal flow to the top 1A1-Mill has a
modest detrimental impact on SCR NOx removal efficiency No significant impact was found from the top
mill biasing on flue gas temperatures The impact of 1A1-Mill biasing on steam temperatures and
attemperation was very significant representing more than 1oF increase per tonhr of coal flow reduction
This might be due to the change in heat transfer pattern in the furnace leading to an increase in furnace exit
gas temperature (FEGT) Top mill biasing has only a minor impact on ABS deposition and stack opacity
The impact of 1A1-Mill on fly ash LOI is of approximately 05 for the range of fully loaded to OS The
impact of heat rate deviation represents approximately 45 BtukWh per tonhr reduction in coal flow rate
This impact is related to the improvement in combustion in the lower furnace as well as in steam
temperature in excess of design levels
Cayuga Unt 1 SCR Inlet NOx Emissions vs Mill 1A1 Flow Rate
021
020
019
018
017
016
015
014
SCR
Inle
t NO
x Em
issi
ons
Rat
e [lb
MB
tu]
y = 00025x + 01401 R2 = 05524
beta-NOx (SCR in)
Baseline or Reference Tests
0 2 4 6 8 10 12 14 16 18 20
Mill 1A1 Flow Rate [th]
Figure 5-8 Impact of 1A1-Mill Coal Flow Rate on SCR Inlet NOx Emissions
The other additional parameters that were investigated at the boilercombustion side were the burner and
SOFA tilt One technique that results in reduction in boiler NOx emissions in tangentially-fired boilers is
5-6
the enhancement in combustion staging by stretching the fireball by lowering the burner tilts and raising
the overfire air tilts This was implemented in a series of parametric tests that included combination of both
parameters It was found that burner tilt helped reduce NOx emissions with a minimum emissions level
achieved in the range form -5 to -8 deg Improvements in NOx emissions were also found with upward
tilting of the SOFA registers with the most reduction achieved at SOFA tilts between 0 and +6 deg
Moving down the convective pass trending relations and trade-offs were investigated for the SCR and
APH The independent parameters investigated for the SCR included the economizer bypass damper and
the NH3 treatment in the catalyst also indicated by the normalized stoichiometric ratio (NSR) or the molar
ratio of NH3 to NOx The dependent parameters affected by those independent parameters at the SCR
include the SCR inlet gas temperature the SCR performance efficiency and ABS formation temperature
and deposition as applicable Tests that involved manipulation of the economizer bypass dampers were
performed in the range from fully closed to 40 open The economizer bypass damper vs SCR inlet
temperature resulting trend is included in Figure 5-9 As it can see from Figure 5-9 an increase in
economizer bypass damper results in a steep increase in flue gas temperature of about +1degF per percent
opening and at about 40 open the SCR inlet gas temperature approaches the 700degF limit recommended
by the SCR manufacturer However when plotting the opening of the economizer bypass damper vs the
SCR NOx reduction efficiency it was found that the efficiency has an inverse relationship with the
economizer bypass damper opening This indicates that the SCR catalyst formulation is such that works on
the right-hand side of the SCR vs temperature curve reducing NOx conversion efficiency as the catalyst
temperature increases (see Figure 5-10) For this reason this parameter was excluded from the
optimization list of parameters From the economizer bypass damper testing it was also found that the
ABS deposition is not affected by changes in economizer bypass opening
5-7
Cayuga Unt 1 SCR Gas Inlet Temperature vs Econ Bypass Damper
SCR
Gas
Inle
t Tem
pera
ture
[deg
F]
685
680
675
670
665
660
655
650
645
640
635
630
y = 10373x + 63594 R2 = 09947
SCR Inlet Temperature
0 5 10 15 20 25 30 35 40 45 50
Economizer Bypass Damper Position []
Figure 5-9 Impact of Economizer Bypass Damper on SCR Gas Inlet Temperature
Cayuga Unt 1 SCR Efficiency vs Econ Bypass Damper
y = -1E-05x2 + 00003x + 09241 R2 = 02726
905
910
915
920
925
930
935
940
SCR
Effi
cien
cy [
]
SCR Efficiency SCR Efficiency = [NOxi- NOxo]NOxi
Baseline or Reference Tests
0 5 10 15 20 25 30 35 40 45 50
Economizer Bypass Damper Position []
Figure 5-10 Impact of Economizer Bypass Damper on SCR Removal Efficiency
The impact of NH3 flow rate on the parameters of interest was also determined from the parametric test
data Figure 5-11 shows the trend for ABS formation and evaporation temperature as a function of NH3
flow rate Also included in Figure 5-10 is the axial location of the ABS deposition in the APH As
expected the increase in NH3 flow increases the ABS formation temperature which implies that the
5-8
probability of ABS condensing at higher temperatures and consequently penetrating toward the APH hot-
end is higher As shown in Figure 5-11 increasing the NH3 flow rate higher than 110 lbhr results in a
deposition layer that moves beyond a 275 ft mark from the APH cold-end and at NH3 flow rates in
excess of 130 lbhr the likelihood of exceeding the 275 ft threshold for sootblowing removal is greatly
enhanced Obviously these results can be modified by variations in the SO3 concentration in the flue gas
Cayuga Unit 1 Ammonia Injection vs APH ABS Formation and Deposition
500 500
450 450
y = -00204x2 + 66212x - 79839 R2 = 07963
y = -00087x2 + 32555x + 10475 R2 = 0863
ABS Evap Temp ABS Form Temp ABS Dep Depth-A APH ABS Dep Depth-B APH
0 20 40 60 80 100 120 140 160 180 200
Ammonia Flow Rate [lbhr]
AB
S Fo
rmat
ion
and
Evap
orat
ion
Tem
p [d
eg F
]
400
350
300
400
350
300
AB
S D
epos
ition
Dep
th[ft
fro
m A
PH C
old-
End]
250 250
200 200
150 150
100 100
05050
0 000
Figure 5-11 Impact of Ammonia Flow on ABS Formation Temperature and Deposition
Figure 5-12 also shows results of NH3 treatment with respect to ABS formation temperature expressed as
NH3NOx ratio or NSR For the particular SCR at Cayuga Unit 1 the ABS formation temperature tends to
increase with NH3 treatment Similarly the concentration of NH3 in the fly ash increases with NSR
However the NH3 concentration in the ash is relatively small (less than 60 ppmw) for NSR levels as high as
115 This is considered a very low level of NH3 contamination with values larger than 100 ppmw
considered of importance when using the fly ash for concrete applications
5-9
Cayuga Unit 1 ABS Formation Temperature and NH3 in Fly Ash vs NH3NOx Mole Ratio
360
y = 27785x2 - 42593x + 1766 R2 = 06437
y = -15969x2 + 23607x + 15506 R2 = 06902
120
NH3NOx Mole Ratio
40 340
20320
440 120
420 100
400 80
380
AB
S Fo
rmat
ion
Tem
pera
ture
[deg
F]
Am
mon
ia in
Ash
[mg
kg]
60
300 0 080 085 090 095 100 105 110 115
Figure 5-12 Impact of NSR on ABS Formation Temperature and Ammonia in Ash
The independent parameter investigated for the APH was the air bypass damper This parameter is used in
the winter to increase the temperature at the APH cold-end to avoid acid dewpoint condensation A similar
approach works for ABS where the APH air bypass damper can be used to maintain the ABS deposition
location toward the cold-end and outside a previously determined limit of 275 ft where the sootblowers
located at the APH cold-end can reach and clean the ABS deposit Manipulation of the APH air bypass
dampers (one for each rotating APH) has an impact on the APH metal temperatures which helps mitigate
the ABS deposition but also on the gas outlet temperature which detrimentally impact unit heat rate Tests
that involved manipulation of the APH air bypass damper were performed in the range from fully closed to
75 open as allowed by the plant Figures 5-13 to 5-15 show the trends between the APH bypass damper
position vs ABS deposition depth APH gas outlet temperature and resulting unit heat rate penalty In
Figure 5-13 it can be seen that the APH bypass damper is effective in moving ABS formation from inside
the 275 ft threshold to the cold-end However Figure 5-14 shows that this improvement made in ABS
deposition depth is accompanied by a significant increase in APH flue gas outlet temperature of the order
of 50oF for the range of APH damper manipulation from 0 to 75 This increase in stack losses has an
impact on the net unit heat rate of as much as 150 BtukWh (Figure 5-15) This means that it is very
important to control NH3 injection and maintain an optimal performance at the SCR to minimize NH3 slip
which adversely impacts ABS formation When the conditions are such that ABS formation beyond the
established threshold is inevitable manipulation of the APH bypass damper is necessary However this
should be a last resource because the cost associated with the heat rate penalty has to be assessed against
the cost of washing a fouled APH
5-10
APH
AB
S D
epos
ition
Dep
th [f
t]
Cayuga Unt 1 APH ABS Deposition Depth vs APH Bypass Damper
350
300
250
200
150
100
050
000
y = -9E-06x2 - 00171x + 27175 R2 = 09119
y = 00002x2 - 00264x + 28744 R2 = 0879
APH A APH B Poly (APH A) Poly (APH B)
0 10 20 30 40 50 60 70 80 90 100
Air Preheater Bypass Damper Position []
Figure 5-13 Impact of APH Bypass Damper Position on ABS Deposition Depth
APH
Gas
Out
let T
empe
ratu
re [d
eg F
]
Cayuga Unt 1 APH Gas Outlet Temperature vs APH Bypass Damper
360
350
340
330
320
310
300
290
280
y = 00065x2 + 01789x + 29353 R2 = 09836
y = 00048x2 + 03037x + 29987 R2 = 09608
APH A APH B Poly (APH A) Poly (APH B)
0 10 20 30 40 50 60 70 80 90 100
Air Preheater Bypass Damper Position []
Figure 5-14 Impact of APH Bypass Damper Position on APH Flue Gas Exit Temperature
5-11
Cayuga Unt 1 Unit Heat Rate Penalty vs APH Bypass Damper
0
20
40
60
80
100
120
140
160
180
200
Uni
t Hea
t Rat
e Pe
nalty
[BTU
kW
h]
0 10 20 30 40 50 60 70 80
APH Bypass Damper []
Figure 5-15 Impact of APH Bypass Damper Position on Unit Heat Rate Penalty
Additionally sootblowing tests were performed to investigate the impact of different sootblowing routines
on the operation of the SCR system and associated NOx reduction and NH3 consumption Sootblowing
tests were performed with the unit at steady operating conditions These sootblowing tests included
activation of wallblowers (IRs) and retractables in the convective pass (IKs) including the SCR reactor and
the APH It takes approximately 2 minutes to blow individual IRs 8 minutes to blow IKs and of the order
of 20 minutes to blow individual sootblowers at the SCR and APH Cayuga Station burns a range of
bituminous coals that have a potential for high-temperature slagging and fouling which has imposed a
sootblowing schedule that runs continuously However the plant has not optimized its sootblowing
practice and each operator blows soot in hisher own preferred way once all the boiler is cleaned once per
12-hour shift Some areas that are critical such as the APH and the boiler slope area might be cleaned at a
higher frequency
The sootblowing tests performed as part of this project targeted at evaluating the impact of sootblowing
scheduling on SCR related variables while not overlooking the slaggingfouling constraint Figure 5-16
shows results from one of these tests where selective IRs IKs and the SCR and APH were cleaned
sequentially As a consequence of the sootblowing activation the flue gas temperature at the SCR declined
and the SCR reactor was cleaned This led as seen in Figure 5-16 to a drop in ABS formation
temperatures and a reduction in the NH3 flow rate to achieve the prescribed NOx stack limit Based on the
results of these tests a sootblowing schedule is proposed that considers the cleaning constraints of selected
fouling-sensitive areas such as the APH This schedule is included in Figure 5-17 for each shift The
5-12
recommended schedule suggests activation of IR blowers at the waterwalls every 10 min alternating
blowers from each ring (A B and C) as well as cleaning of the SCR once a shift and of the APH three
times per shift
Cayuga Unit 1
480 Dilution skid ammonia flow
240 Fouling formation temp Fouling evap temp
440
220
400
200
Am
mon
ia F
low
[lb
h]
360 180
Sootblowing - IRs IKs SCR APH 320
160
140 280
120 240
100 200 000 100 200 300 400 500 600 700 800 900 1000 1100 1200 1300 1400 1500 1600 1700 1800 1900 2000 2100 2200 2300
Time
AB
S Te
mpe
ratu
re [d
eg F
]
Figure 5-16 Results of Sootblowing Tests
Hour Minute
Wall
0 10
A B
20
C
30 40 50 60 10 20 30 40 50 60 10 20 30 40 50 60 10 20 30 40 50 60 10 20 30 40 50 60 10 20 30 40 50 60
A B C A B C A B C A B C A B C A B C A B C A B C A B C A B C A B C A
5 61 2 3 4
IK 1R 6L 10R 4L 8R 12L
Ecno E2 E4 E1 E3
SCR 6 5 4
APH A B A B
Hour Minute
Wall
10 20
B C
30 40 50 60 10 20 30 40 50 60 10 20 30 40 50 60 10 20 30 40 50 60 10 20 30 40 50 60 10 20 30 40 50 60
A B C A B C A B C A B C A B C A B C A B C A B C A B C A B C A B C
11 127 8 9 10
IK 1L 6R 10L 4R 8L 12R
Ecno E2 E4 E1 E3
SCR 3 2 1
APH A B
Figure 5-17 Proposed Sootblowing Schedule
5-13
As part of this project theoretical estimates were performed to consider the impact of modifications to
boiler SCR and APH control settings on mercury (Hg) emissions at the boiler back-end Mercury is a
toxic pollutant that has a significant impact on human health Coal-fired power plants constitute the largest
source of anthropogenic Hg emissions in the United States There is pending (vacated) federal regulation
and current stringent limits from some states including New York for controlling Hg emissions from coal-
fired boilers Based on a numerical model developed by Lehigh University calculations were performed of
selected modified boiler conditions and their impact on Hg The numerical model includes a gas-phase Hg
chemical kinetic model composed of 92 reversible reactions and 35 species This model is able to simulate
homogeneous Hg oxidation in the boiler flue gas and heterogeneous Hg oxidation by the fly ash Model
results have been validated by bench-scale experimental data from the literature and matched with full-
scale experimental data obtained from field tests at two power generation units
Model Hg emissions results are included in Table 5-1 Table 5-1 includes the residence time used for each
section of the convective pass where flue gas temperature data were available and the corresponding
temperatures at the inlet of each section These sections start at the furnace exit and include the SCR inlet
APH inlet and outlet and the stack A linear temperature profile was used for each reactor A typical
Eastern bituminous coal composition and Hg content was used in the simulations The results included in
Table 5-1 indicate changes in boiler conditions that lead to changes in excess O2 level and fly ash LOI are
not sufficient to cause a significant change in Hg emissions Mercury emissions were expressed in relation
to elemental mercury (Hg0) For both distinct set of operating conditions Hg0 is reduced in the convective
pass to about 79 at the SCR inlet and completely reduced to oxidized mercury (H2+) after crossing the
SCR The model does not include the impact of Hg oxidation on the SCR catalyst
Table 5-1 Mercury Emissions Estimates for Different Boiler Operating Conditions
Location Temperature (degdegF) Residence Time (sec) Hg0 Emissions Excess O2 = 330 Fly Ash LOI = 25 Furnace Outlet 2100 0 125E-09 SCR Inlet 637 17 981E-10 APH Inlet 636 23 945E-11 APH Outlet 295 29 319E-17 Stack 159 34 553E-17 Excess O2 = 285 Fly Ash LOI = 35 FEGT 2080 0 125E-09 SCR Inlet 638 17 999E-10 APH Inlet 636 23 944E-11 APH Outlet 297 29 325E-17 Stack 159 34 309E-17
5-14
MODELING RESULTS
Artificial intelligence (AI) modeling was performed on the data collected in the parametric testing The AI
modeling consisted of neural networks (NNs) and accurate on-line support vector regression (AOSVR)
model development NNs are mathematical algorithms that use interconnecting artificial neurons that
mimic the properties of biological neurons Support vector regression is a data-driven supervised learning
method for classification and regression problems based on statistic learning theory AOSVR posses the
ability of being universal approximators of any multivariate function to any desired degree of accuracy
Belonging to the family of Kernel methods AOSVR transfers the input space to a high dimension feature
space by a nonlinear map thus original nonlinear relationships can be approximated as a linear function
f
f ( ) w x = lt ( ) w x + b
Where ( i yi ) i = 1 2 l and xi E Rm yi E R is the training data set x is the dot product b is the
threshold and w is the weight vector which can be identified under a given regularized risk function NN
and AOSVR both provided comparable model result accuracy However the AOSVR method overcomes
some of the problems of artificial NNs associated with slow training local minima and poor interpretability
of the results Results on the AOSVR modeling are included in this report
AOSVR was used to built artificial intelligence-based functional relationships between the boiler outlet or
SCR inlet NOx level and heat rate penalty (with respect to the design heat rate level) and the first five
parameters included in Table 4-1 (O2 SOFA aST aBT and Fcoal) The AOSVR model was trained with
the database obtained from the parametric tests and adaptively updated with real-time data sets Four
thousand data points were extracted from real-time data at a 1-minute sample rate and used for AOSVR
adapting Figure 5-18 shows a comparison between the on-line data and the predicted model results for
boiler outlet NOx emissions rate The AOSVR showed good convergence and acceptable learning
efficiency AOSVR accurate learning results from its efficient data updating and it is well suited for time-
varying systems The prediction performance of proposed AOSVR models was evaluated using a mean
absolute percentage error (MAE) as validation criterion which is defined as
y - y1 i iMAE = tn
x100 n i=1 yi
Where n is the sample size yi denotes the sample data and yi is the modeling output value The MAE
value for the AOSVR boiler outlet NOx and heat rate penalty was 165 Smaller values of MAE indicate
better model predicting capabilities
5-15
046
040
034
028
022
016
010
Time [min]
NO
x em
issi
ons
[lbM
Btu
] Predicted Values Sampling Data
0 500 1000 1500 2000 2500 3000 3500 4000
Figure 5-18 Modified AOSVR NOx Emissions Model Prediction Results
Figure 5-19 shows AOSVR model trending results for the impact of boiler parameters on heat rate
deviation or penalty The modeling results in Figure 5-19 are consistent with the trending expected from
each of the selected boiler control settings The heat rate penalty vs excess O2 exhibits a second order
trend where increase in heat rate to the left is due to increases in fly ash LOI and to the right due to stack
losses The trending with respect to burner and SOFA tilt angle is related to the enhancement in steam
temperatures due to the changes in radiant heat when the burners are modulated The increased trending in
heat rate penalty with respect to increased coal flow to the top elevation mill and the SOFA register
opening is due to the decrease in particle burnout residence time that occurs when the upper elevation of
burners is in-service (IS) and to the cooling effect to the fireball caused by the SOFA respectively
Modeling results obtained from the AOSVR model were compared with actual plant data obtained during
the parametric tests showing a good degree of accuracy
OPTIMIZATION RESULTS
The functional relationships obtained from the AOSVR modeling were then used to perform a
boilerSCRAPH mathematical optimization Additionally relationships for the lowest required NH3injection flow rate as a function of SCR inlet NOx and for heat rate penalty as a function of the APH air
bypass level were used in the optimization Figure 5-20 shows the plot of minimal NH3 flow rate vs SCR
inlet NOx The minimal NH3 vs SCR inlet NOx curve shows a rapid increase when the SCR inlet NOxlevel exceeds the 026 lbMBtu which is characteristic of the catalyzed NOx reduction process in the SCR
5-16
20
100
160
40
80
120
HR
[Btu
kW
h]SOFA=100
SOFA=50 SOFA=0
0 24 26 28 30 32 34 36 38 40
O2 []
100
O2 =40
20
40
60
80
O2=40
O2=35
O2=32 O2=30
-15 -13 -11 -9 -7 -5 -3 -1
80
60
O2 =30
O2 =35 O2 =32
40[B
tuk
Wh]
HR
[B
tuk
Wh]
HR
20 -15 -10 -5 0 5 10 15 20 25 30
[Deg] [Deg]aST aBT
100 140
O2=35 100
HR
[Btu
kW
h]
O2=40
O2=32
O2=30
12080 O2=40 O2=35
O2=32 O2=30
[B
tuk
Wh]
HR
60
80 40
60
40
20 0 4 8 12 16 20 0 20 40 60 80 100
Fcoal [th] SOFA []
0
1
reactor Maintaining the NH3 injection rate with the same slope as the one exhibited at low NOx levels (lt
026 lbMBtu) would result in violation of the stack NOx emissions constraint An increase in NH3 flow is
required at larger SCR inlet NOx levels This increase in reagent requirement for elevated SCR inlet NOx
levels is what increases the risk of NH3 slip and subsequent formation of ABS in the ducting and
equipment downstream of the SCR
Figure 5-19 Trained AOSVR Model Results for Boiler Heat Rate Penalty
5-17
0
40
80
120
160
200
240
280
010 012 014 016 018 020 022 024 026 028
Lowe
st am
monia
flow
rate
[lbhr
]
SCR Inlet NOx Emission Rate [lbMBtu]
Figure 5-20 Lowest NH3 Flow Rate vs SCR Inlet NOx
The optimization was performed in two steps using genetic algorithms (GAs) GA is a class of stochastic
search optimization technique which derives its behavior from the evolutionary theory of natural selection
In this work the Niched Pareto genetic algorithm (NPGA) was used A Pareto optimal set is a set of
solutions that are non-dominated with respect to each other In the NPGA approach a higher number of
individuals are involved in competition resulting in a higher searching efficiency achieved A solution is
Pareto optimal if it is not dominated by any other solution in the solution space In the GA solution used in
this project a multi-objective optimization (MOO) problem was formulated as
[ f ( ) f ( ) f ( )]min f x( ) = x x x1 2 k
s t g x ( ) 0( ) = 0h x
Where x = [x x x ]T EX is the vector of decision variables in the decision space 1 2 n
nX f R - R i =1 2 k is the objective function and g ( )- and h ( )- are the inequality and equalityi
constraint vectors The MOO problem was defined to find the particular set x EX which satisfies both
constraints and yields the optimum values of all objective functions Since there is rarely a single point that
simultaneously optimizes all object functions a Pareto optimum is defined to look for trade-offs in these
objectives
In the GA implementation of this study a population of candidate solutions was first used based on the
parametric test database This population was then modified (recombined and randomly mutated) to form
new iterative populations from which better fitness or solutions were achieved that fulfill the multishy
5-18
objective optimization problem The GA implementation was done in two steps In the first step a GA
was used to derive a functional relationship between the minimal or optimal boiler heat rate penalty as a
function of target boiler outlet or SCR inlet NOx The constrained multi-objective optimization problem
was defined by
min NO = f (O SOFA a a F )x NO 2 ST BT coalx
min q = fq (O2 SOFA aBT Fcoal ) subject to e emax
O O O2min 2 2max
SOFA SOFA SOFAmin max
a a aSTmin ST STmax
a a aBTmin BT BTmax
F F Fcoalmin coal coalmax
Where fNO ( )- and fq ( )- are the objective functions between the first five boiler operating variables listed x
in Table 4-1 and boiler outlet NOx emissions and heat rate penalty q respectively The optimization was
constrained by fly ash unburned carbon 8 to be below a prescribed maximum of 4 percent and the
operating input parameters to be between minimum and maximum levels representing their operational
upper limit and lower limit as indicated in Table 4-1 Figures 5-21(a) to 5-21(d) show different stages of
the GA optimization for minimum boiler NOx and heat rate penalty The parametric test database is shown
in Figure 5-21(a) A sequence of data generation and best fitness selection is shown in Figures 5-21(b) to
5-21(d) Converged optimal solutions are presented in Figure 5-21(d) after the 30th generation The heat
rate penalty vs SCR inlet NOx trend in Figure 5-21(d) was fitted into a polynomial function to be used in
the second step in the optimization
The second step of the optimization consisted of minimizing an overall cost function that combines the
costs of (1) the heat rate penalty resulting from tuning of the boiler control settings to achieve an optimal
boiler outlet or SCR inlet NOx emissions rate (2) reagent to produce the required SCR NOx reduction
performance and (3) the heat rate penalty to operate the APH within the ABS deposition constraint if
necessary Savings due to avoidance of APH washes was not included in the optimizable cost function
The second step optimization was defined by
min C = k C (NO )+ k C (NH )+ k C (D )total 1 1 x 2 2 3 3 3 APH
subject to dABS adepth
NO ax outlet NOx limit
NO NO NOxmin x x max
NH NH NH3min 3 3 max
D D DAPHmin APH APH max
5-19
Where the total cost C is composed of the fuel cost C due to the boiler heat rate penalty the NH3total 1
treatment cost C2 and the heat rate penalty cost C3 due to the manipulation of the APH bypass damper
( D ) The coefficients k i = 123 were set with a value of 10 The deposition depth limit (dABS) wasAPH i
set lt = 275 ft adepth
160 160
140 140
120 120
H
R [B
tuk
Wh]
HR
[Btu
kW
h]
H
R [B
tuk
Wh]
HR
[Btu
kW
h]
100
80
100
80
60 60
40 40
20 20 016 017 018 019 020 021 022 023 024 025 026 016 017 018 019 020 021 022 023 024 025 026
NOx emissions rate [lbMBtu] NOx emissions rate [lbMBtu] (a) 100 (b)100
9090
80
70
60
50
80
70
60
50
4040
3030
2020 016 017 018 019 020 021 022 016 017 018 019 020 021 022 023
NOx emissions rate [lbMBtu] NOx emissions rate [lbMBtu] (c) (d)
Figure 5-21 GA Optimization Results for Boiler Outlet NOx ndash (a) Initialization Dataset (b) 1st Generation (c) 15th Generation (d ) 30th Generation
The combined boilerSCRAPH cost function was optimized using GAs The following rates were used in
the evaluation of the cost function power generation cost of $002kWh and NH3 cost of $025lb to
convert the objective function to units of dollars per hour Figures 5-22(a) and 5-22(b) show a 3-D map of
all searched solutions provided by the GA expressed as differential costs with respect to baseline heat rate
conditions Also included in these figures are the sets of SCR inlet NOx NH3 injection rate and APH
bypass damper positions that violate the ABS deposition distance constraint and the NOx emissions rate
limit The set of feasible solutions which satisfy both constraints are also shown in Figures 5-22(a) and 5shy
22(b) These solutions were obtained after the 22nd generation of the GA algorithm Figure 5-22(a) shows
on the z-axis that a low NH3 injection rates the stack NOx emissions constraint is violated while at high
NH3 injection rates the ABS deposition constraint is violated Optimal solutions that satisfy both
5-20
constraints are obtained in the NH3 flow rate range between 120 and 195 lbhr The optimal solution for
the lowest cost of compliance corresponds to the following control setting O2 = 32 average SOFA
register opening = 51 (both top- and mid-SOFA registers open equally) average burner tilt angle = -8
degrees average SOFA tilt angle = +6 degrees 1A1-Mill coal flow rate = 6 tonhr APH bypass damper =
0 and an NH3 injection rate = 125 lbhr The optimal NH3 injection rate represents a reduction in NH3
flow rate from baseline conditions of approximately 22 percent The combination of optimal settings will
result in NOx emissions at the boiler outlet of 0188 lbMBtu while complying with ABS deposition at less
than 275 ft and fly ash unburned carbon below 4 percent at a differential cost of $412hr Figure 5-23
shows costs associated with operation at optimal combinations of boiler control settings that result in a
range of boiler outlet NOx emissions levels It can be inferred from Figure 5-23 that operation at the ldquokneerdquo
of the SCR inlet NOx vs heat rate penalty results in the lowest combined cost of operation Operation at
SCR inlet NOx levels at the left of that knee results in a significant added cost due to the contribution from
the boiler heat rate penalty Operation at the right of the knee results in a gradual moderate cost increase
due to additional NH3 consumption until a point is reached (at around 025 lbMBtu) where there is a need
to manipulate the APH bypass damper to control the ABS deposition This results in a steep heat rate
penalty due to increased stack losses As anticipated the optimization model indicates that the total cost of
compliance increases as the ABS deposition distance is tightly set closer to the APH cold-end A
reduction in the ABS deposition depth setpoint below 25 ft would require opening of the APH bypass
damper with the associated heat rate penalty from this component of the cost function
250 250
200 200
C
tota
l [$
hr]
150
100
C
tota
l [$
hr]
150
100
50 50
20
40
60 0
APH bypass Damper [] 0 0
100 200
300
NH3 flow rate [lbhr]
400 500
20
40
60 0
APH bypass Damper [] 0 020
025 030
NOx emissions rate [lbMBtu]
035
Violation of NOx emissions limit constraint
Violation of both constraints
Violation of ABS depth constraint
Both constraints satisfaction
Violation of NOx emissions limit constraint
Violation of both constraints
Violation of ABS depth constraint
Both constraints satisfaction
(a) (b)
Figure 5-22 GA Optimization Solutions for the Total Cost Function
5-21
-50
0
50
100
150
200
250
Ctotal=C1+C2+C3
Fuel Cost C1
APH bypass damper HR penalty cost C 3
C
ost
[$h
r]
NH3 Cost C 2
APH deposition depth set point =25 ft
010 013 016 019 022 025 028
NOx emissions rate [lbMBtu]
Figure 5-23 Cost Components as a Function o f Boiler Outlet NOx
The constraints imposed for the stack outlet NOx emissions level at lt 0095 lbMBtu and for the APH to
maintain the ABS axial deposition location in the APH at 275 ft from the cold-end were found to be
adequate to maintain Cayuga Stationrsquos NOx allowances The location of the ABS setpoint was chosen
based on the known penetration distance of the APH sootblowers which are located at the cold-end side of
the APH Any deposition of sticky ABS deposits on the APH baskets beyond the chosen deposition
setpoint would have a lower probability of being removed by sootblowing increasing the risk of gradual
fouling of the APH and further loss of generation for APH washing From the results of this work it was
determined that two options are available when the ABS deposition distance is beyond the reach of the
sootblowers (exceeds the 275 ft setpoint) viz to lower the NH3 injection rate to the lowest conditioning
permitted to achieve the required outlet NOx level or manipulate the APH air bypass damper to increase the
metal temperatures Opening the APH bypass damper is the least preferred option since it results in heat
rate penalties due to the increase in stack losses associated to higher flue gas temperatures exiting the
boiler
5-22
Section 6
UPGRADED SCR CONTROL STRATEGY
As part of this project modifications to the SCR control logic were studied and proposed aiming at
developing an upgraded control strategy that incorporates feedback measurements and optimization results
The system composed by the boiler SCR system and APH was considered for the upgrade (see illustration
in Figure 6-1) The adopted upgraded control strategy consists in (1) regulating pertinent boiler
conditions (O2 SOFA registers burner tilt SOFA tilt and 1A1 mill coal flow) to minimize NOx at the SCR
inlet and maximize SCR efficiency (2) regulating the NH3 flow to control stack or continuous emissions
monitoring (CEM) NOx and (3) regulating the APH bypass damper to control ABS deposition depth within
the APH Since the ABS deposition depth is also affected by the NH3 flow an approach for integrated
control of SCR and APH is discussed The proposed control scheme includes a dual-loop control strategy
for automatic boiler NH3 flow and APH bypass damper control over the unit load range with the ultimate
goal of minimizing boiler outlet NOx emissions minimizing stack NOx emissions minimizing NH3consumption (maximizing SCR efficiency) and minimizing unit heat rate penalties
Figure 6-1 System Configuration Used for the Control Strategy Upgrade
UPGRADED SCRAPH CONTROL SCHEME
SCR Control
The SCR control system provided by the manufacturer is shown in Figure 6-2 This control scheme is
typical for SCR control in the industry The objective of the feedback control loop is to regulate the
efficiency of the SCR system at a predefined value given by 7SCR The injection of NH3 is dictated by this
feedback loop but also by a feedforward controller which makes the feedforward component of the NH3flow just proportional to NOx_in Although this scheme guarantees a specific efficiency it cannot
guarantee a specific value of CEM NOx
6-1
Figure 6-2 SCR Manufacturerrsquos Typical Control Architecture The term NOxSCR in denotes the NOx level at the SCR inlet (denoted as NOx_in in the text) The term NOxSCR out denotes the NOx level at the SCR outlet (denoted as NOx_out in the text)
By exploiting the availability of the continuous emissions monitoring system it is possible to propose a
different control approach where the ultimate goal is the regulation of the NOx_CEM level at a predefined
value The approach illustrated in Figure 6-3 also combines both feedforward and feedback loops The
variable ldquosrdquo is used to denote the Laplace Transform variable in the system transfer functions
Figure 6-3 SCR Control Architecture Based on the CEM NOx Input The term NOxSCR CEM denotes the NOx level at the CEM (denoted as NOx_CEM in the text) The term NOx SP denotes the setpoint value for NOx_CEM (denoted as NOx_CEM_setpoint in the text)
Although the controller in Figure 6-3 can in principle guarantee a specific level of NOx_CEM the time
delays both in the SCR system and in the transport channel (denoted in pink in both Figures 6-2 and 6-3)
can significantly affect the performance of the control approach Since the NOx signal from the plant CEM
is used to regulate NH3 flow a pure time delay associated with the measurement of this parameter needs
to be dealt with There are several control methods available to deal with time delays in feedback loops
Most of them however require a good knowledge ie a model of the system which is usually not the
case in coal-based power plants For this reason it is proposed a non-model-based approach consisting in a
multi-loop proportionalndashintegralndashderivative (PID) approach combined with optimal tuning Information on
the rate of change of NOx at both the SCR inlet and the SCR outlet is incorporated into the NH3 flow
feedback controller in order to overcome the effect of the time delay and eliminate oscillations present in
both the CEM NOx and NH3 injection In addition not only positive but also negative feedback correction
(bias) of the feedforward loop is allowed with the objective of eliminating the NH3 slip that characterizes
SCR operation due to this control limitation The proposed scheme is shown in Figure 6-4 where the
6-2
outer-loop controller CSCROUT is a PID controller the inner-loop controller CSCRIN is a proportional-
derivative (PD) controller and the feedforward controller CSCRFEED is a pure de rivative (D) controller
1CSCR _ OUT (s) = K POUT + K I OUT + K DOUT s CSCR _ JN (s) = K
s PIN + K DIN s CSCR _ FEED (s) = K DFEED s
Figure 6-4 Multi-Loop SCR Control Architecture Based on CEM NOx SCR Inl et NOx and SCR Outlet NOx
In order to compare the different control approaches and also to optimally tune the controller parameters to
cope with the time delays simulations were carried out using MATLAB SIMULINKreg For that purpose a
simplified model of the SCR system was created A diagram of the SIMULINK closed-loop system is
illustrated in Figure 6-5
NOx_in
NOx_i
Transport
NOx_out NOx_CEM
NH3
NOxIN
eta
NOxOUT NOxCEM
SCR Efficiency
SCR
NOx_in
NH3
NOX_out
eta
NOx _out
n Source
NOx _in NOx_CEM
NOx CEM SP
-Cshy
NH3
Controller
NOx_out
NOx_CEM
NOx_in
NOx _CEM_SP
NH3
Figure 6-5 SIMULINK SCR Control Configuration
6-3
As illustrated in Figure 6-6 the SCR system was modeled as
out = e -sT 1 NOx _ SCR n120591 SCR (NH 3 NOx _ in)NOx _ in
SCR s +1
Where 7SCR(NH3NOx_in) is plotted in Figure 6-7
3
eta 2
NOX_out 1
Transport Delay
Switch
Saturation SCR Transfer Fcn
1
den (s) Ratio Gain
-K-NOx out
u(1)(1-u(2))
Fcn eta 3
f(u)
Fcn eta 2
f(u)
Fcn eta 1
f(u)
FF Gain
-K- Divide
Constant eta
-C-
Add NH3
Add
NH3 2
NOx_in 1
ratio
Figure 6-6 Simplified SCR Model
0 02 04 06 08 1 12 14 16 04
05
06
07
08
09
1
7
NH3NOxin [molesmoles]
SCR Efficiency
Figure 6-7 SCR Efficiency as a Function of NH3NOx_in Ratio
6-4
The channel connecting the SCR and the stack was modeled as a transport line (see Figure 6-8) where
- 1sTTRANSPNOx _ CEM = e NOx _ out s +1TRANSP
_CEM 1f(u)
den (s)
1
NOx_out 1
Transport Unit Transfer Fcn Stack Delay Transfer Fcn
Figure 6-8 Transport Channel Simplified Model
The multi-loop controller configuration is shown in Figure 6-9 It should be noticed from this scheme that
the feedback component of the NH3 flow rate injected into the SCR has contributions from three different
controllers a PID fed by the error between the NOx_CEM and its associated setpoint a PD controller fed
by a measurement of the NOx_out and a D controller fed by a measurement of the NOx_in
Saturation Inner PID
NH3
1
tracking error Upper Bound
Saturation
Dynamic
up
u
lo
y
Outer PID
PID
PID
Gain 4
-K -
Gain 3
-K -
Feed PID
PID
Add 1
NOx_CEM _
4
NOx_in
3
NOx_CEM
2
NOx_out
1
SP
Lower Bound
Figure 6-9 SCR Controller
6-5
An extremum seeking optimization (see details below) was also carried out to optimally tune the gains of
the controllers in the equation corresponding to Figure 6-4 The objective is to tune the controller gains in
order to minimize the tracking error Thus we define the to-be-minimized cost function as
1t
J = int[NOx _ CEM (t) - NOx _ CEM _ setpoint (t ) ]2 dt2 t0
Figure 6-10 shows the evolution of the cost function as a function of the extremum-seeking iteration
number The evolution of the to-be-optimized parameters e1=KPOUT e2=KIOUT e3=KDOUT e4=KPIN
e5=KDIN and e6=KDFEED is shown in Figure 6-11 The optimization was stopped after 200 iterations
because no significant further improvement of the cost function value was achieved The chosen
simulation parameters were TSCR=30s TSCR=10s TTRANSP=60s TTRANSP=20s The resulting optimal gains
were KPOUT =13182 KIOUT =11563 KDOUT=10564 KPIN=29020 KDIN=00170 and KDFEED=00572
To demonstrate the performance of the SCR controller Figure 6-12(d) shows the time response of the SCR
multi-loop system when NOx_in changes as illustrated in Figure 6-12(a) The feedback component for the
NH3 injection is showed in Figure 6-12(b) In Figure 6-12(c) it can be seen that SCR efficiency was not
kept constant because the ultimate goal is the regulation of NOx_CEM at the desired setpoint Figure 6shy
12(d) shows that the controller successfully regulates the NOx emissions level at the stack rejecting
changes in NOx_in
0 50 100 150 200-35
-34
-33
-32
-31
-30
J [d
B]
Cost function evolution
iteration Figure 6-10 Evolution of the Cost Function
6-6
10 1
0 0 0 50 100 150 200 50 100 150 200 50 100 150 200
iteration iteration iteration
50 2
40
50 5 5
1
40 4 4
e
Dou
t er
-
3
ee
4 -
Pin
ner
1 -
Pou
ter
e
Din
ner
-
e
5 -
Iou
ter
2
30 3 3
20 2 2
05
1
15
2
0 50 100 150 20050 100 150 200 e
6 -
Dfe
ed50 100 150 200
15
1
05
30
20
10
0 0
iteration iteration iteration
Figure 6-11 Evolution of the Controller Gains
Air Preheater Control
The control logic at Cayuga Unit 1 was modified to include a scheme that incorporates the feedback
measurements from the sensor implemented in this project (the AbSensor - AFP for ABS formation
temperature and associated deposition location) and a control strategy provision for the APH air bypass
damper The ABS deposition location can be controlled by manipulating the APH matrix temperature and
consequently the average cold-end APH temperature through the bypass damper with the ultimate goal of
minimizing APH fouling
6-7
018
019
02
021
022
023 N
Ox
IN
-30
-20
-10
0
10
20
30
NH
3 Fl
ow R
ate
0 05 1 15 2 0 05 1 15 2 Time [s] Time [s] x 104 x 104
(a) (b)
094 018
09
0 05 1 15 2 x 10⁴
006
008
01
NOx CEM NOx CEM Setpoint
0 02 04 06 08 1 12 14 16 18 2 Time [s]
016
092 014
012 N
Ox
CE
M
7
088 004
002
086 0
Time [s] x 104
(c) (d)
Figure 6-12 Illustration of the Time Response of the Optimized Multi-Loop Scheme
Figure 6-13 illustrates the APH control configuration The deposition depth can be estimated through the
function D(x) from the ABS formation temperature which is also function of the NH3NOx ratio and the
APH temperature The PID control KAPHCAPH regulates the deposition depth to a desired setpoint
Figure 6-13 APH Control Configuration
6-8
In order to simulate the APH closed-loop system performance simulations were carried out using
MATLAB SIMULINKreg For that purpose a simplified model of the APH system was created The
SIMULINK closed-loop system is illustrated in Figure 6-14
damper
damper DepositDepth
ratio
Deposit Depth SP
-C-
Deposit Depth
APH Controller
depth
depth _SP
damper
APH
ratio
damper
depth
Figure 6-14 SIMULINK APH Control Configuration
The simplified model for the APH dynamics is shown in Figure 6-15 The ABS deposition depth is
determined by both the ABS formation temperature and the APH metal temperature The APH response to
the bypass damper manipulation is modeled as a simple first-order transfer function GAPH2(s)=1(s+1) The
response of the formation temperature to the NH3NOx_in ratio is modeled as a first-order transfer function
GAPH1(s)=1(2s+1) in series with the nonlinear function in Figure 6-16 Only the section of the curve in
Figure 6-16 from 05 to 15 NSR is realistic and was used in the modeling This specific function is
modeled within the APH ABS block as illustrated in Figure 6-17 The APH controller has a PID structure
as shown in Figure 6-18
depth 1
Gain -K-
APH ABS
In1 Out1
APH
1 s+1
ABS Transfer Fcn
1 2s+1
damper 2
ratio 1
Transfer Fcn
Figure 6-15 Simplified APH Model
6-9
ABS Temperature
0 05 1 15 2 25 0
1
2
3
4
5
6
7
8
NH3NOxin [molesmoles]
Figure 6-16 ABS Formation Temperature as a Function of NH3NOx_in
Out 1 1
Switch
Fcn2
f(u)
Fcn1
f(u)
Fcn 6
f(u)
Fcn 5
f(u)
Fcn 4
f(u)
Fcn 3
f(u)
Constant 2
-C-
Constant 1
50
ratio 1
Figure 6-17 ABS Formation Temperature Simplified Model
PI
damper 1PID
depth _SP 2
depth 1
Figure 6-18 APH Deposition Depth Controller
6-10
Integrated SCRAPH Control
ABS deposition depth can be controlled not only by regulating the APH bypass damper but also by
modulating the NH3NOx_in ratio For a given NOx_in a decrease in NH3 injection would result in a
decrease in NH3NOx_in and in turn in the ABS formation temperature Therefore a decrease in NH3
injection could prevent opening of the APH bypass damper and its associated heat rate penalty However a
decrease in NH3 injection would result in an increase in NOx_CEM There is then a tradeoff between the
NOx emissions level at the stack and the heat rate penalty due to the opening of the APH bypass damper If
a small increase of NOx_CEM is tolerated it can help control the ABS deposition depth by reducing the
NH3 flow rate in lieu of opening the bypass damper Figure 6-19 shows an ad hoc coordinated SCR and
APH control scheme where the block E(x) modifies the setpoint for NOx_CEM as a function of the APH
bypass damper opening which is directly proportional to the APH heat rate penalty
Figure 6-19 Coordinated SCR and APH PID-Based Control
A MATLAB SIMULINKreg version of the coordinated scheme is presented in Figure 6-20 It should be
noticed that the SCR and APH control schemes are identical to those introduced in Figures 6-5 and 6-14
The ldquoCoordinatorrdquo block is the only addition to the control architecture This coordinator shown in more
detail in Figure 6-21 will not modify the setpoint for NOx_CEM as long as the APH bypass damper
opening is smaller than a predefined threshold When the APH bypass damper opening exceeds this
threshold the NOx_CEM setpoint is modified proportionally to the APH bypass opening
6-11
NOx_CEM NOx_in
NOxCEM NOx_in Source
damper
Transport
NOx_out NOx_CEM
damper
NH3
NOxIN
DepositDepth
eta
NOxOUT
SCR Efficiency
SCR Controller
NOx_out
NOx_CEM
NOx_in
NOx_CEM_SP
NH3
SCR
NOx_in
NH3
NOX_out
eta
ratio
NOx_out NOx_in
NOx_CEM_SP
-Cshy
NH3
-C-
Deposit Depth
Coordinator
damper Delta_SP
depth
depth_SP damper
APH
ratio
damper depth
APH Controller Deposit Depth SP
Figure 6-20 SIMULINK Coordinated SCR and APH PID-Based Control
Delta _SP 1
Switch
PID Controller
PID
Gain
-K-
0
Abs
|u| damper
1
Constant
Figure 6-21 Modification of NOx_CEM Setpoint
Figure 6-22 shows the effect of controlling the APH deposition depth via manipulation of the NH3 injection
by changing the setpoint for NOx_CEM The case with the NOx_in changes shown in Figure 6-22(a) is
considered The blue lines in Figure 6-22 illustrate the case where no coordination is present In this case
the ABS deposition depth is exclusively controlled by the APH bypass damper Note from Figure 6-22(b)
that the NOx_CEM is successfully regulated to the unmodified setpoint shown in Figure 6-22(d) However
it is necessary in this case to inject a considerable amount of NH3 (see Figure 6-22(f)) This amount of
reagent will require also a considerable opening of the APH damper (see Figure 6-22(e)) to successfully
regulate the ABS deposition depth to a desired fixed setpoint value (see Figure 6-22(c)) The green lines in
6-12
03
031
032
21
80
015
011
028 01
027 009
APH damper NOx CEM SP Mixed
0 500 1000 1500 2000 2500 3000 3500 4000 4500 5000 0 500 1000 1500 2000 2500 3000 3500 4000 4500 5000 Time [s] Time [s]
(a) (b)
3 015
NO
x IN
014
013
NO
x C
EM
SE
TPO
INT
NO
x C
EM
NH
3 Fl
ow R
ate
012
029
APH damper NOx CEM SP Mixed
20 500 1000 1500 2000 2500 3000 3500 4000 4500 5000
APH damper NOx CEM SP Mixed
009 0 500 1000 1500 2000 2500 3000 3500 4000 4500 5000
29 014
28
27
Dep
ositi
on D
epth
[ft] 013
26
25 012
24
23
22
011
01
Time [s] Time [s]
(c) (d)
300
APH damper NOx CEM SP Mixed
0 500 1000 1500 2000 2500 3000 3500 4000 4500 5000
APH damper NOx CEM SP Mixed
1500 500 1000 1500 2000 2500 3000 3500 4000 4500 5000
70
60
50
40
30
Dam
per O
peni
ng [
]
250
200
20
10
Time [s] Time [s]
(e) (f)
0
Figure 6-22 illustrate the case where the threshold for coordination is zero This means that the setpoint for
NOx_CEM will always be modified proportionally to the APH bypass damper Figure 6-22(d) shows the
modification of the NOx_CEM setpoint to a higher value for which the NH3 injection can be significantly
reduced (see Figure 6-22(f)) and consequently the APH bypass damper opening required to regulate the
APH deposition depth is also significantly reduced (see Figure 6-22(e)) minimizing in this way the APH
heat rate penalty at the expense of a higher level of NOx at the stack Finally the red lines in Figure 6-22
show an intermediate case where the threshold for the coordinator block is set at 40 of the APH bypass
damper opening Once the damper opening exceeds this value the setpoint for NOx_CEM is modified It
should be noticed the slight increase in the setpoint in Figure 6-22(d) that allows reductions of both NH3
injection and APH bypass damper opening if compared to the uncoordinated case (blue lines)
Figure 6-22 Effect of Modification of NOx_CEM Setpoint
6-13
NON-MODEL-BASED OPTIMAL ADAPTIVE CONTROL
In addition to the non-model-based approach presented in the preceding paragraphs and that includes multi-
loop PIDs a non-model-based optimal adaptive control strategy is also introduced for both the boiler and
the SCRAPH systems The proposed control scheme is based on extremum seeking and it includes a dual
loop control strategy illustrated in Figure 6-23 The first non-model-based adaptive controller is proposed
to regulate the boiler inputs (viz excess O2 SOFA registers burner tilt SOFA tilt and 1A1 mill coal flow)
to minimize both NOx emissions at the SCR inlet and the boiler heat rate penalty The second non-modelshy
based adaptive controller is proposed to regulate NH3 flow to the SCR system and the APH bypass damper
opening in order to optimally control in real-time and in a coordinated fashion both the CEM NOx and ABS
deposition within the APH avoiding NH3 slip and minimizing the APH heat rate penalty The
effectiveness of extremum seeking adaptive controllers in keeping the system at an optimal operation point
in the presence of input disturbances and system changes (unit load coal quality firing system maintenance
condition SCR aging etc) was demonstrated through dynamic simulations
Figure 6-23 Two-Loop Adaptive Control Strategy with Extremum Seeking
Extremum Seeking
Extremum seeking control (Ariyur 200 Ariyur 2003) a popular tool in control applications in the 1940shy
50s has seen a resurgence in popularity as a real time optimization tool in different fields of engineering
In addition to being an optimization method extremum seeking is a method of adaptive control usable
both for tuning set points in regulationoptimization problems and for tuning parameters of control laws It
is a non-model based method of adaptive control and as such it solves in a rigorous and practical way
6-14
some of the same problems as neural networks and other intelligent control techniques Aerospace and
propulsion problems (Binetti 2002) combustion instabilities (Schneider 2000 Banaszuk 2004) flow
control (Wang 2000) compressor rotating stall (Wang 2000) automotive problems (anti-lock braking
engine mapping) bioreactors (Wang 1999) and charged particle accelerators (Schuster 2004) are among
its applications Extremum seeking is applicable in situations where there is a nonlinearity in the control
problem and the nonlinearity has a local minimum or a maximum The nonlinearity may be in the plant as
a physical nonlinearity possibly manifesting itself through an equilibrium map Hence extremum seeking
can be used for tuning a setpoint to achieve an optimal value of the output The parameter space can be
multivariable The discrete-time implementation (Choi 2002) is depicted in Figure 6-24 where z denotes
the Z-transform variable The high-pass filter is designed as 0 lt h lt 1 and the modulation frequency m is
selected such that m=a7 0lt|a| lt 1 and a is rational Without loss of generality the static nonlinear block
J(e) is assumed to have a minimum J at e=e The extremum seeking procedure guarantees that the
estimation of e denoted as e in Figure 6-24 will converge to e minimizing J
( )eJ
e J
hz z + -1
1--z y
Xf
( )( )kJ e( )ke
( )ke ( )k ( )kX
Low-Pass High-Passa ( ) sin(mk -cent)sin mk Filter Filter Figure 6-24 Extremum Seeking Approach
The purpose of the extremum seeking optimization algorithm illustrated in Figure 6-24 is to use the
gradient information of the static map J(8) to drive 8 to 8 so that the cost functional J(8) is driven to its
minimum J The variable e denotes the estimate of the unknown optimal parameter 8 provided by the
extremum seeking algorithm The probing signal a sin(Ot) with a gt 0 added to the estimate e and fed
into the plant helps to get a measure of the gradient information of the map J(8) The high-pass filter
preserves only the perturbation in the cost functional J caused by the perturbation in the 8 parameter
introduced by the probing signal The demodulator picks the component of the filtered perturbed cost
functional X with the same frequency O a s t h e p robing signal The resulting signal 120576 which can be
seen as proportional to the gradient of the map J(8) is used by the pure-integrator low-pass filter to update
the 8 parameter in order to drive the cost functional J closer to its minimum
6-15
As an example Figure 6-25 shows residual NOx at the SCR outlet (as a percentage of inlet NOx) NH3 slip
and a cost function J= KNOx_outNOx_out2+ KNH3NH32 that can be computed in real-time from direct
measurements of outlet NOx and NH3 The cost function J conciliates two competing objectives
simultaneous minimization of residual NOx and NH3 slip By modifying the control inputs the extremum
seeking controller makes the system work at an operating point that corresponds to the minimum of the cost
function J (minimum of the pink curve in Figure 6-25) independently of transients and disturbances In
this way both NOx and NH3 slip can be minimized in real-time The relative importance of NOx_out and
NH3 can be defined by the operator through the selection of their corresponding weights KNOx_out and KNH3
Figure 6-25 Example of Extremum Seeking Minimized Cost Function
Real-Time Boiler Optimization
Dynamic Model Identification In order to illustrate the potential of adaptive extremum-seeking control
for minimization of both the level of NOx at the boiler outlet and the corresponding heat rate penalty it is
necessary simulate the dynamics of the boiler In contraposition to static models that are obtained from
steady-state data transient data is needed to identify dynamic models Based on sampled measurements of
the boiler variables an ARMAX model is proposed
A(q) y[k] = tB (q)u [k - nk ] + C(q)e[k]i i i i
Where y denotes the measured output (level of NOx at the SCR inlet NOx_in) u denotes the measured
inputs (excess O2 SOFA registers burner tilt SOFA tilt 1A1 mill coal flow) and e denotes non-
measurable noise The variable q denotes a time shift operator
qy[k] = y[k +1] q -1 y[k] = y[k -1]
6-16
where k denotes the sampling time The polynomial A(q) has order na the polynomials Bi(q) has order nbi
for i=1hellip5 and C(q) has order nc The variable nki denotes the delay order for each of the inputs i The
coefficients of these polynomials are obtained by solving the following minimization problem
min( y [k] - y[k])2
AB Ci
where y[k] denotes the model-predicted output and y[k] the real output obtained from direct measurement
The identified discrete-time dynamic model was converted to the continuous-time domain using a ldquotutsimrdquo
transformation The resulting continuous-time dynamic model is written in terms of transfer functions in
the Laplace domain and implemented in MATLAB SIMULINKreg as shown in Figure 6-26
1 O2_num (s) O2_den (s) O2
2 SOFA_num (s) SOFA_den (s) SOFA
3 BurnerTilt _num (s)
4
5
NOXin _avg
-C-
MATLAB Fcn
MATLAB Function
1 NOx_in BurnerTilt _den (s) Burner _Tilt
SOFATilt _num (s) 2 HR
SOFATilt _den (s) SOFA_Tilt
CoalFlow _num (s) CoalFlow _den (s) Coal _Flow
Figure 6-26 Simplified Boiler Dynamic Model
Extremum Seeking Controller From the parametric tests carried out during the project the parametric
testing it is possible to infer the dependence of NOx_in and HR on excess O2 level By defining the
following cost function
J = K NOx _ in2 + K HR2 NOx _ in HR
where HR represents boiler heat rate penalty This cost function is shown in Figure 6-27 where it can
noticed that there exists an optimal value of O2 for which a minimum is achieved By careful selection of
6-17
the coefficients KNOx and KHR different weights can be assigned to the competing objectives NOx_in and
HR
894
892
89
888
J 886
884
882
88
2 25 3 35 4 O2
Figure 6-27 Cost Function of O2 when SOFA = 0 Burner Tilt = -4 degrees SOFA Tilt = 1 degree and 1A1 Coal Flow = 15 tonhr
Given that static optimization will fall short in dealing with real-time changes in the cost function
extremum seeking allows real-time optimization by reacting to any change and keeping the system at an
optimal operation point Figure 6-28 shows a proposed extremum-seeking boiler control configuration
The value of the cost function J is fed into the extremum seeking block shown in Figure 6-29 where the
real-time optimization is carried out to modify the value of O2 in order to drive the value of the cost
function J to its minimum Only the variable O2 is controlled in this example It is worth mentioning that
extremum seeking can handle multi-input systems An example to illustrate the performance of the non-
model-based adaptive extremum seeking controller is shown in Figure 6-30 where the time evolutions of
NOx_in and heat rate penalty predicted by the identified dynamic model are used to compute the cost
function J In this case a step perturbation of magnitude 10 tonhr for the 1A1coal flow is introduced at
t=2500 min (Figure 6-30a) The level of SOFA registers and burner and SOFA tilt are kept constant
during the simulation Before the coal flow step the extremum seeking introduces a modification to the O2
level (Figure 6-30b) in order to drive the system to the point where the cost function is minimized (Figure
6-30e) After the coal flow step the extremum seeking reacts by modifying the O2 level (Figure 6-30) in
order to recover to a cost function minimum It should be noticed that not only the minimizing values of O2are different but also the cost function minimum values also differ Figures 6-30c and 6-30d show how the
NOx and heat rate penalty values are changed by the extremum seeking controller The potential of
extremum seeking resides on its capability of computing the optimal value in real-time without the aid of a
model
6-18
O2
SOFA
BURNER _TILT
SOFA_TILT
COAL _FLOW
NOx_in
J
HR
Step
SOFA_TILT
SOFA
O2
NOx_in
J
HR
JO2
Cost Function
NOXin
HR J
Constant 2
0
Constant 1
0
Constant
0
COAL _FLOW
Boiler
O2 SOFA Burner_Tilt SOFA_Tilt Coal_Flow
NOx_in
HR
BURNER _TILT
Extremum Seeking
Figure 6-28 SIMULINK Extremum Seeking Boiler Control Configuration
O2 1
X_est_pos X_est
Terminator
Sine Wave
Saturation 1
Saturation
Product
Perturbation
Jf
Integrator
1 s
Int _input
HPF
num _hpf (s)
den _hpf (s)
Gain 2
-K-
Gain 1
a
Demod
Add 2 Add 1 Abs
|u|
J 1
Figure 6-29 Extremum Seeking Implementation for Excess O 2 Optimal Modulation
6-19
Figure 6-30 Extremum Seeking Simulation Results (a to e from left to right top to bottom)
SCRAPH Real-Time Optimization This section presents a combined extremum-seekingPID control
architecture as illustrated in Figure 6-31 It considers that while the NH3 flow is directly controlled by an
extremum-seeking controller the APH bypass damper opening is controlled by a PID controller driven by a
ABS deposition depth error By defining the cost function as
6-20
2 2 2J = K NOx _ CEM + K NH 3 + K D NOx _ CEM NH 3 D
the extremum-seeking controller (shown in Figure 6-32) regulates NH3 flow in order to minimize
NOx_CEM NH3 flow and the APH bypass damper opening (D) Introduction of the APH bypass damper
term in the cost function is a step forward in the efforts to coordinate the SCR and APH control loops The
user-defined weigh factors KNOx KNH3 and KD regulates the tradeoff between NOx_CEM minimization and
NH3 - D minimization
Figure 6-31 SIMULINK Extremum Seeking SCRAPH Control Configuration
6-21
Figure 6-32 Extremum Seeking Implementation for NH3 Optimal Modulation
Simulation results for the controllers introduced in Figures 6-31 and 6-32 are included in Figure 6-33 The
level of NOx at the SCR inlet is varied as shown in Figure 6-33(a) While the ABS deposition depth
(Figure 6-33(f)) is regulated by the PID at a fixed setpoint (25 ft) the level of CEM NOx (Figure 6-33(e))
has the freedom to fluctuate in order to minimize the cost function J shown in Figure 6-33(b) The
minimizing variable is the NH3 flow rate shown in Figure 6-33(d) The APH bypass damper opening
shown in Figure 6-33(c) is kept at a relatively closed level
6-22
(a) (b)
(c) (d)
(e) (f)
Figure 6-33 Extremum Seeking Simulation Results
6-23
Section 7
EVALUATION OF BENEFITS
Based on the results of this project an evaluation was performed to assess the benefit of modifying the
combined operation of the boiler SCR system and APH for savings in fuel and SCR reagent As part of
this project a new ABS fouling probe was retrofit to Cayuga Unit 1 This technology includes control
capabilities to implement a new upgraded control strategy Findings from this project have been made
available to Cayuga Station in terms of the adequacy of flue gas conditions to the SCR trending
relationships between boiler control settings and the parameters of interest (such as reduced NOx emissions
levels SCR performance unit heat rate deviations or penalties and ABS formation and deposition in the
APH) and sootblowing characterization and improved schedule Recommendations were made to Cayuga
Station regarding modified control settings for optimal boiler and combustion conditions as well for
operation of the NH3 injection system and APH air bypass damper control This section presents results of
a simplified evaluation of the cost benefit from implementing these results It should be mentioned that
other indirect benefits would result from the implementation and improvements introduced by this study
These include reduction in fly ash NH3 contamination and reduction of sulfur related problems such as
sulfuric acid corrosion and stack visible plume
This section provides gross annual estimates associated with the benefit of implementing project results at
Cayuga Unit 1 for an optimized operation of the boilerSCRAPH system These savings include only
those savings related to reduction in reagent usage catalyst life extension unit thermal performance or fuel
cost and frequency and savings in APH wash A capacity factor of 090 is used in the calculations
Reduced Ammonia Usage These savings total approximately $69000 The savings comes from an
approximate 22 percent reduction in NH3 usage due to modification in boiler and SCR control settings that
result in reduced NOx treatment levels and improved SCR performance efficiency The NH3 usage savings
is calculated as the product of the following items
1 Anhydrous NH3 usage reduction (160 ndash 125 = 35 lbhr)
2 Number of hours for year-round compliance (7884 hrs)
3 Ammonia cost ($500ton)
4 Conversion factor (1 ton2000 lb)
Reduced Catalyst Replacement Frequency These savings total approximately $45000 The savings
comes from the increase in catalyst lifetime that is assumed that result from the better utilization of the
SCR reaction process It is assumed that over the course of 5 years this will result in at least one decreased
catalyst replacement event The savings is equal to the product of the following items
7-1
1 Catalyst requirement for SCR system (37 ft3MW)
2 Catalyst cost ($155ft3 for honeycomb type catalyst)
3 Portion of catalyst saved by reducing replacement frequency (frac14)
4 Number of decreased replacement events over the course of catalyst replacement
cycle (15 years)
Savings in Fuel These savings total approximately $151000 The savings come from an estimated
operation at minimal unit heat rate from manipulation of boiler control settings to avoid penalization from
increased unburned carbon in the fly ash stack losses due to increased excess air and controllable losses
due to off-design steam temperatures and from minimal manipulation of the APH to prevent ABS
deposition This savings is the sum of combustion-related heat rate penalties and APH-related heat rate
penalties
1 Cost of fuel ($002kWh or $222MBtu)
2 Number of hours for year-round operation (7884 hrs)
3 Estimated combustion and APH-related heat rate penalties avoidance (54 BtukWh or 060
from estimated baseline heat rate)
Savings in Air Preheater Cleaning These savings total approximately $483000 The savings comes
from an estimated reduction in excess NH3 slip and consequently prevention of APH plugging that would
have required unit shut down for water washing of the heater Since implementation of the ABS fouling
probe and associate controls the frequency of APH wash at Cayuga Unit 1 has been reduced from
approximately 4 per year (since start of SCR operation) to 1 so far in 2008 This savings is the sum of the
cost of the washing services and the lost of unit availability
1 Two-day outage to manipulate unit load and water-wash and dry the APH ($258000
it includes 3 washes)
2 Cost of APH water wash services ($225000 it includes 3 washes $5000 labor cost
(3 repairmen at 2-12 hr shifts) $68000 water treatment cost (170000 gallons
treated at $040gallon) $2000 miscellaneous costs)
In summary the estimated annual cost savings for Cayuga Unit due to optimized instrumentation
optimized operation of the boilerSCRAPH system and upgraded control is of the order of $748000 This
estimated savings do not include other savings that may result from this type of optimization such as
improvements to the sootblowing operation The estimates do not also consider that it might be practical
for Cayuga to ldquoover-controlrdquo NOx to sell allowances into the NOx allowance market without compromising
a side-effect-free operation of the SCR system
7-2
Section 8
CONCLUSIONS AND RECOMMENDATIONS
A study funded by the New York State Energy Research and Development Authority (NYSERDA) and
AES Cayuga was performed to investigate the feasibility of developing an optimization methodology and
demonstrate the benefit of operating in an optimal mode that achieve maximum boiler NOx emissions
reductions maximum selected catalytic reduction (SCR) system performance minimal unit heat rate
penalties and lower cost of operation at Cayuga Unit 1 Cayuga Unit 1 is a 150 MWnet unit equipped with
a low-NOx firing system and an anhydrous ammonia (NH3)-based SCR system Process optimization is a
cost-effective approach to improve the cost of NOx compliance at coal-fired boilers while meeting other
operational and environmental constraints In boilers equipped with SCRs this is a classic multi-objective
optimization problem to balance boiler thermal performance NOx emissions the cost of reagent and air
preheater (APH) maintenance costs The specific objectives of this study included
bull Provide upgraded instrumentation and control capabilities of ammonium bisulfate
(ABS) fouling at the APH
bull Develop a methodology for a combined boiler combustionSCRAPH optimization
bull Perform field testing at Cayuga Unit 1 and modeling and data analysis to support the
demonstration of a combined optimization
bull Develop upgraded control strategy for minimum boiler NOx emissions optimal SCR
operation minimal NH3 consumption optimal APH operation and minimal overall
cost of operation
Long-term operation of a SCR system at optimal conditions should
bull Improve reagent utilization
bull Minimize catalyst deterioration and reduce operational and maintenance (OampM)
costs
bull Operate at tighter stack NOx levels with minimal standard deviation
bull Maintain SCR constraints such as design NH3 slip and SO2-to-SO3 conversion
bull Minimize SCR impact on balance of plant equipment such as ABS formation and
unit heat rate
The following conclusions and recommendations were achieved from the results of this study
bull SCR tuning is an important aspect that should be considered when optimizing the
operation of SCR systems This involves the adjustment of the SCR injection grid
8-1
for uniform reagent treatment However at Cayuga Unit 1 the as-found conditions
and NH3 injection tuning capability rendered this step unnecessary
bull A Breen Energyrsquos AbSensor ndash Anti-Fouling Probe (AFP) was installed at one of the
APH inlets at Cayuga Unit 1 for on-line monitoring of ABS and real-time
determination of the ABS deposition axial location in the APH This probe was
found very reliable and an excellent tool to be used in an upgraded optimal SCR
system operation
bull Parametric field tests were performed at Cayuga Unit 1 From these tests it was
found that economizer excess O2 the top two separated overfire air (SOFA) register
openings burner tilt SOFA tilt the coal flow to the top pulverizer (1A1-Mill) and
the NH3NOx ratio all have an impact on SCR inlet NOx NH3 requirement for a
target stack NOx emissions level SCR NOx removal efficiency net unit heat rate and
ABS deposition Lower flue gas temperatures were found to improve SCR
performance hence manipulation of the economizer bypass damper was found
ineffective to improve SCR performance at full load It was found that increasing
the NH3 flow rate in excess of 130 lbhr increases the likelihood of exceeding a 275
ft threshold distance from the APH cold-end for ABS deposition Within this 275
ft distance ABS removal by sootblowing is greatly enhanced
bull Sootblowing tests were performed to investigate the impact of different sootblowing
routines on the operation of the SCR system and associated NOx reduction and NH3consumption It is recommended a sootblowing schedule that introduces activation
of wall blowers (Model IR) at the waterwalls every 10 minutes alternating blowers
from each ring (A B and C) and retractable blowers (Model IK) every shift as well
as cleaning of the SCR once a shift and of the APH three times per shift
bull Artificial intelligence techniques were used to model the test data and provide a tool
for mathematical optimization A modified accurate on-line support vector
regression (AOSVR) was implemented on the parametric test data to built artificial
intelligence-based functional relationships between the boiler outlet or SCR inlet
NOx level and heat rate penalty The prediction performance of proposed AOSVR
model was adequate Genetic algorithms (GAs) were used to solve the constrained
multi-objective optimization problem with success An optimal solution is
recommended for the lowest cost of compliance which corresponds to the following
control setting Economizer excess O2 = 32 average SOFA register opening =
51 (both top- and mid-SOFA registers open equally) average burner tilt angle = -8
degrees average SOFA tilt angle = +6 degrees top 1A1-Mill coal flow rate = 6
tonhr APH bypass damper = 0 open (completely shut) and an NH3 injection rate =
125 lbhr The optimal NH3 injection rate represents a reduction in NH3 flow rate
8-2
from baseline conditions of approximately 22 percent The combination of optimal
settings should result in NOx emissions at the boiler outlet of 0188 lbMBtu while
limiting ABS deposition to at less than 25 ft from the APH cold-end and producing
fly ash unburned carbon below 4 percent at a differential cost of $412hr This is
the lowest combined (heat rate penalty ndash and NH3-related) cost of operation as
compared to a highest cost of close to $20000hr The savings in net unit heat rate
from operation at optimal boiler and APH conditions equate to 54 BtukWh as 06
from the baseline net unit heat rate
bull A multi-loop control upgrade was proposed to enhance the boilerSCRAPH control
strategy The multi-loop control approach was complemented with a systematic
method for optimal tuning of proportionalndashintegralndashderivative (PID) control gainsThe SCR control logic that was in use at Cayuga Unit 1 was partially modified to
include a scheme that incorporates the feedback measurements implemented in this
project (viz real-time ABS monitoring and deposition tracking) The control system
upgrade includes a control strategy provision for the APH bypass damper by
controlling the average cold-end APH temperature to minimize APH
foulingplugging Additionally simple dynamic models for the boiler SCR system
and APH system were identified from the data and proposed to provide coordination
of both the SCR and APH control systems to enhance the overall performance of the
system This coordination approach led to the definition of tradeoffs resolved using
extremum-seeking control techniques
bull For future work two extremum-seeking loops are proposed for real-time
optimization at Cayuga Unit 1 The first non-model-based adaptive extremum-
seeking controller is proposed to regulate the boiler inputs (O2 SOFA register
opening burner tilt SOFA tilt top mill coal flow) to minimize both NOx at the SCR
inlet and the boiler heat rate penalty Non-model-based controllers learn from
dynamic operating data of the process This compares to model-based controllers
that utilize dynamic models to obtain mathematical conditions between the controller
design parameters and tuning rates The second non-model-based adaptive
extremum-seeking controller is proposed to regulate the NH3 flow to the SCR system
and the APH bypass damper opening in order to optimally control in real-time and in
a coordinated fashion both the NOx at the stack and ABS deposition within the
APH Based on the results obtained during this project the proposed approach has
the potential for further reducing stack NOx emissions unit heat rate NH3 usage and
provide savings from reduced APH washing frequency
bull Based on the results of this study it is indicated that modifying the combined
operation of the boiler and SCR system can result in savings in reagent usage heat
8-3
rate improvements and corresponding OampM costs Estimates were run to calculate
the economic benefits of an optimal operation In addition other indirect benefits
would result from these improvements These include catalyst life extension
reduction in APH cleaning frequency and costs associated with the loss of unit
availability Other added benefits not considered in the evaluation of benefits
include savings due to optimal sootblowing system operation reduction in fly ash
NH3 contamination and reduction of sulfur related problems such as sulfuric acid
corrosion and stack visible plume The estimated annual cost savings for Cayuga
Unit 1 due to optimized operation of the boilerSCRAPH system is of the order of
$748000 The estimates do not consider that it might be practical for utilities to
ldquoover-controlrdquo NOx to sell allowances into the NOx allowance market
The results of this analysis are based on a single limited data set However these results indicate that there
is a significant potential to optimize the combined operation of boiler combustion SCR system and APH to
achieve reduced operating costs
8-4
Section 9
REFERENCES
Ariyur K and Krstic M Slope Seeking and Application to Compressor Instability Control 2002 IEEE
Conference on Decision and Control Las Vegas Nevada pp 3690ndash3697 Dec 2002
Ariyur K and Krstic M Real-Time Optimization by Extremum Seeking Feedback Wiley 2003
Banaszuk A Ariyur K Krstic M Jacobson CA An Adaptive Algorithm for Control of Combustion
Instabilityrdquo Automatica 40 (2004) 1965 ndash 1972
Binetti P Ariyur K Krstic M Bernelli F Control of Formation Flight Via Extremum Seeking 2002
American Control Conference Anchorage Alaska pp 2848ndash2853 May 2002
Choi J-Y Krstic M Ariyur K and Lee JS Extremum Seeking Control for Discrete-time Systems
IEEE Transactions on Automatic Control vol 47 no 2 pp 318-323 2002
Jones C Consider SCR an Integral Part of the Combustion Process Power December 1993
Breen Energy Solutions AbSensor ndash AFP Condensable Anti-Fouling Probe Manual 2008
Eskenazi D Sarunac N and DrsquoAgostini M Userrsquos Guide for the HEATRT Code ERC Report 93-500shy
1-1 January 1993
Matlab ndash the Language of Technical Computing The Math Works Inc 1997
Power Test Code PTC 61 The American Society of Mechanical Engineers New York 1985
Romero C Li Y and Bilirgen H Using Boiler Operating Conditions for Mercury Emissions Control A
Feasibility Study ERC Report 04-400-11-14 August 2004
Sarunac N and Levy E RPHMT ndash Air Preheater Metal Temperature Code EPRI Report RP16812153
1989
Schneider G Ariyur K Krstic M Tuning of a Combustion Controller by Extremum Seeking A
Simulation Study Conf on Decision and Control Sydney Australia pp5219ndash5223 Dec 2000
9-1
Schuster E Morinaga E Allen CK and Krstic M Optimal Beam Matching in Particle Accelerators
via Extremum Seeking Submitted to the 44th IEEE Conference on Decision and Control Seville Spain
12-15 December 2004
Smola AJ Schoumllkopf B A Tutorial on Support Vector Regression Statistics and Computing 2004
14(4)199-222
Srinivas N Deb K Multiobjective Optimization Using Nondominated Sorting in Genetic Algorithms
Evolutionary Computation 1994 2(3)221-248
Wang H-H Krstic M and Bastin G Optimizing Bioreactors by Extremum Seeking International
Journal of Adaptive Control and Signal Processing vol 13 pp 651ndash659 1999
Wang H-H Yeung S Krstic M Experimental Application of Extremum Seeking on an Axial-Flow
Compressor IEEE Trans on Control Systems Technology vol 8 pp 300ndash309 2000
9-2
APPENDIX A
CALCULATION OF THE EFFECT OF BOILER
OPERATING CONDITIONS ON UNIT THERMAL PERFORMANCE FROM TEST DATA
BACKGROUND
In parametric field tests (combustion optimization boiler tuning boiler performance tests) the
effect of each parameter is typically investigated one at a time (excess O2 level damper position
mill bias burner tilt angle etc)
In addition to the parameter being tested other operating parameters unrelated to the test such as
condenser pressure make-up flow cycle extractions coal quality slagging and fouling vary
during the test
Changes in operating parameters unrelated to the test can mask the effect of the test parameter
Parametric test data summarized in Table A-1 show variations occurring in typical parametric tests
Table A-1 Parametric Test Data
Parameter Test 1 Test 2 Test 5 Test 19
Baseline O2 Test O2 Test SOFAO2 Test Pg [MW] 94516 94092 94391 93873
Paux [MW] 5066 5102 4869 5060
O2 [] 280 293 168 262
SOFA [] 100 75 75 75CCOFA [] 0 46 46 47
Burner Tilt [deg] 0 0 0 0
LOI [] 87 114 196 18
CO [] 11 4 47 7
TAPHgo [degF] 686 671 646 643
MMSTSpray [lbh] 1625 2357 1231 4634 MRHTSpray [lbh] 1418 3052 4153 4471
TMST [degF] 10082 10106 10110 10013
TRHT [degF] 10102 10095 10103 10103
Pcond [rdquoHg] 152 154 149 158Pthrottle [psia] 1468 1463 1472 1458
Mmake-up [lbh] 0 3000 4000 6000
Mauxextr [lbh] 0 1000 1500 2500
Note See definition of terms in the List of Abbreviations
A-1
Problem
How to filter out the effects of extraneous parameters and accurately determine the effects of just the test
parameter(s) on heat rate
HEAT RATE DIFFERENCE METHOD
Description of the Method
To determine the effect of boiler test parameters on unit performance baseline cycle performance data are
corrected for deviations in relevant operating parameters (those affected by test parameters) from baseline
conditions This yields changes in heat rate from the baseline value due to the changes in test conditions
by using
HRcycle = HRcycleBL times CFHeat Rate Pg = PgBL times CFLoad
Where
HRcycle Actual (test) value of cycle heat rate due to change in a test parameter
Pg Actual (test) value of gross unit load due to change in a test parameter
HRcycleBL Baseline value of cycle heat rate from turbine thermal kit or baseline test
PgBL Baseline value of gross unit load from turbine thermal kit or baseline test
CFHeat Rate Product of correction factors for heat rate for relevant parameters
CFLoad Product of correction factors for load for relevant parameters
CALCULATION PROCEDURE
1 Calculate boiler efficiency from TB = QSteamQfuel
2 Determine unit heat rate from HRnet = HRcycle times Pg TB (Pg - Paux)
3 The absolute value of net unit heat rate determined by this approach might differ from the absolute
actual net unit heat rate
4 The relative changes in unit performance due to variations in test parameters are calculated
accurately
A-2
RELEVANT OPERATING PARAMETERS
The ASME PTC 61 code defines Group 1 and 2 corrections for cycle heat rate and gross unit load
Cycle Operating Parameters in Group 1
Top Terminal Temperature Difference
Extraction Line Pressure Drop
Desuperheat Spray
Reheat Spray
Auxiliary Extraction Steam Flow
Condenser Make-Up
Extraction Flow to the Feedwater Pump Turbine
Cycle Operating Parameters in Group 2
Throttle Pressure
Throttle Temperature
Hot Reheat Temperature
Reheater Pressure Drop
Exhaust Pressure (Condenser Back Pressure)
Correction factors are calculated only for those cycle parameters that are affected by the changes in test
parameters Variations in other parameters not related to the test are disregarded In particular only the
desuperheat and reheat sprays throttle and hot reheat steam temperatures and auxiliary steam extraction
flow for preheating air entering an APH are affected by changes in test parameters in a combustion
optimization test
NUMERICAL EXAMPLE
A series a combustion optimization tests is conducted at full load conditions where parameters
such as excess oxygen level SOFA and CCOFA damper settings and burner tilt angle are
parametrically varied one at the time
The station does not use a secondary air heater (steam or glycol coils) for inlet air preheating
Auxiliary extraction from cold reheat is used for supplying heat to the tank farm and for building
heat
A-3
Need to determine the heat rate impact of individual test parameters
Sample test data are presented in Table A-2 Baseline cycle performance is calculated from turbine thermal
kit using the average value of main steam flow rate for all tests MMSTavg
MMSTavg = 65685 klbh
Table A-2 Sample Test Data
Parameter Reference Test
O2 Test (Test 2)
O2 Test (Test 5)
SOFAO2 Test (Test 19)
O2 [] 280 293 168 262 SOFA [] 100 75 75 75CCOFA [] 0 46 46 47 Burner Tilt [deg] 0 0 0 0 LOI [] 87 114 196 18 CO [] 11 4 47 7 TAPHgo [degF] 686 671 646 643 MMSTSpray [lbh] 1625 2357 1231 4634 MRHTSpray [lbh] 1418 3052 4153 4471 TMST [degF] 10082 10106 10110 10013 TRHT [degF] 10102 10095 10103 10103 Boiler Efficiency 08926 08906 08856 08860
For the average value of main steam flow rate (MMSTavg) the baseline value of the turbine cycle heat rate is
HRcycleBL = 8585 BtukWh The baseline value of gross power output is PgBL = 9402 MW Baseline
turbine cycle conditions (from turbine thermal kit) are
MMSTSprayBL = 0 lbh
MRHTSprayBL = 0 lbh
TMSTBL = 1010degF
TRHTBL = 1010degF
PthrottleBL = 1465 psia
PcondBL = 150 ldquoHg
Mmake-upBL = 6500 lbh
Maux extrBL = 0 lbh
Turbine cycle corrections for relevant test parameters and cycle performance (HRcycle and Pg) at test
conditions are summarized in Table A-3
A-4
Table A-3 Turbine Cycle Corrections and Cycle Performance
Parameter Reference Test O2 Test Test 2
O2 Test Test 5
SOFAO2 Test Test 19
Cycle Corrections for Heat Rate CF for MMSTSpray 10001 10001 10000 10002
CF for MRHTSpray 10004 10009 10013 10013
CF for TMST 10002 09999 09999 10011
CF for TRHT 10000 10001 10000 10000
CFHeat Rate = ICFi 10007 10010 10012 10026
HRcycle [BtukWh] 8591 8593 8594 8607 Cycle Corrections for Unit Load CF for MMSTSpray 10002 10003 10001 10005
CF for MRHTSpray 10013 10027 10037 10040
CF for TMST 10003 09999 09999 10014 CF for TRHT 10001 09998 10002 10001
CFLoad = ΔCFi 10019 10027 10039 10060
Pg [MW] 94195 94271 94384 94582
RESULTS
Using the results from Table 3 and the expression for HRnet to calculate performance at test conditions The
results are summarized in Table A-4
Table A-4 Effect of Boiler Test Parameters on Unit Heat Rate
Parameter Reference Test
O2 Test Test 2
O2 Test Test 5
SOFAO2 Test Test 19
HRnet [BtukWh] 10172 10201 10232 10264 AHRnet [BtukWh] 0 29 60 92
A-5
APPENDIX B
CAYUGA UNIT 1 TEST MATRIX
B-1
Tab
le 1
C
ayug
a U
nit 1
Tes
t Mat
rix
Tes
t D
escr
iptio
n L
oad
Eco
nO
2 T
OP
SOFA
M
IDD
LE
SOFA
B
OT
TO
MSO
FA
Top
Mill
(1A
1)L
oadi
ng
Eco
nom
izer
B
ypas
s Dam
per
Ope
ning
Air
-Pre
heat
erB
ypas
s Dam
per
Ope
ning
N
Ox
NH
3
MW
th
lb
sM
MB
tu
klbs
h
BA
SE 1
B
asel
ine
(12
15-1
315
) 15
0 3
271
1074
159
10
022
2 15
98
BA
SE 2
B
asel
ine
(94
5-10
45)
15
0 3
301
1075
159
10
023
4 16
14
TE
ST 3
O
2 Tes
t(1
100
- 12
00)
15
0 3
601
1075
159
10
024
6 17
24
TE
ST 4
O
2 Tes
t(1
330
- 14
30)
15
0 3
001
1075
160
10
021
4 14
99
TE
ST 5
O
2 Tes
t(4
30
- 15
30)
150
270
110
7516
01
00
198
137
0
TE
ST 6
O
2 T
est
(15
30 -
163
0)
150
285
110
7515
91
00
202
140
1
BA
SE 7
SO
FA T
est
(83
0 - 9
30)
15
0 3
241
1176
149
01
021
1 13
80
TE
ST 8
SO
FA T
est
(11
00 -
120
0)
150
330
9997
315
00
00
174
109
8
TE
ST 9
SO
FA T
est
(12
00 -
122
0)
150
327
7575
315
00
00
172
109
8
TE
ST 1
0 SO
FA T
est
(13
00 -
142
0)
150
331
4950
415
00
00
187
117
9
TE
ST 1
1 SO
FA T
est
(14
00 -
145
0)
150
322
2323
414
90
00
226
148
9
TE
ST 1
2 SO
FA T
est
(14
50 -
155
0)
150
327
11
414
90
00
268
183
7
TE
ST 1
3 SO
FA T
est
(15
50 -
163
0)
150
296
22
514
90
00
251
173
7
TE
ST 1
4 SO
FA T
est
(16
30 -
170
5)
150
303
2525
514
90
00
214
143
5
TE
ST 1
5 SO
FA T
est
(17
05 -
174
5)
150
296
5149
514
80
00
179
113
4
TE
ST 1
6 SO
FA T
est
(17
45 -
185
0)
150
302
9897
514
80
00
165
993
B-2
Tab
le 1
C
ayug
a U
nit 1
Tes
t Mat
rix
(Con
t)
Tes
t D
escr
iptio
n L
oad
Eco
nO
2 T
OP
SOFA
M
IDD
LE
SOFA
B
OT
TO
MSO
FA
Top
Mill
(1A
1)L
oadi
ng
Eco
nom
izer
B
ypas
s Dam
per
Ope
ning
Air
-Pre
heat
erB
ypas
s Dam
per
Ope
ning
N
Ox
NH
3
MW
th
lb
sM
MB
tu
klbs
h
BA
SE 1
7 B
asel
ine
(72
0 - 8
45)
15
0 3
321
1075
154
00
023
0 16
03
TE
ST 1
8
Air
-Pre
heat
erB
ypas
s D
ampe
r T
ests
150
329
2
10
75
155
0
28
022
3 15
79
TE
ST 1
9 15
0 3
36
2 10
75
15
8
0 50
0
221
152
8 T
EST
20
150
335
2
10
75
155
0
75
021
8 15
33
TE
ST 2
1 15
0 3
27
2 10
75
15
6
0 14
0
221
155
1 T
EST
22
150
344
69
70
5
155
0
0 0
183
122
5 T
EST
23
150
334
69
70
5
156
0
15
018
1 11
93
TE
ST 2
4 15
0 3
49
69
70
5 15
5
0 25
0
183
119
6 T
EST
25
150
334
69
70
5
155
0
50
017
5 11
68
TE
ST 2
6 15
0 3
48
68
70
5 15
5
0 75
0
182
119
5
BA
SE 2
7 B
asel
ine
(12
30
- 12
45)
150
334
110
7515
50
00
223
159
3
TE
ST 2
8 B
urne
r+SO
FA T
ilt( 1
250
- 13
15)
15
0 3
271
1075
154
00
021
7 15
78
TE
ST 2
9 B
urne
r+SO
FA T
ilt(1
315
-13
40)
150
322
110
7515
30
00
215
156
9
TE
ST 3
0 B
urne
r+SO
FA T
ilt(1
342
-14
15)
150
321
110
7515
50
00
219
160
8
TE
ST 3
1 B
urne
r+SO
FA T
ilt(1
420
-14
55)
150
334
7070
515
60
00
178
126
8
TE
ST 3
2 B
urne
r+SO
FA T
ilt(1
500
-16
15)
150
331
7069
515
70
00
180
126
7
TE
ST 3
3 B
urne
r+SO
FA T
ilt(1
615
-16
45)
150
342
7069
415
80
00
188
129
9
TE
ST 3
4 B
urne
r+SO
FA T
ilt(1
645
-17
10)
150
383
7069
415
70
00
194
132
1
TE
ST 3
5 B
urne
r+SO
FA T
ilt(1
515
-17
40)
150
365
7069
415
70
00
192
134
7
TE
ST 3
6 B
urne
r+SO
FA T
ilt(1
749
-18
10)
150
371
7069
415
60
00
185
131
9
B-3
Tab
le 1
C
ayug
a U
nit 1
Tes
t Mat
rix
(Con
t)
Tes
t D
escr
iptio
n L
oad
Eco
nO
2 T
OP
SOFA
M
IDD
LE
SOFA
B
OT
TO
MSO
FA
Top
Mill
(1A
1)L
oadi
ng
Eco
nom
izer
B
ypas
s Dam
per
Ope
ning
Air
-Pre
heat
erB
ypas
s Dam
per
Ope
ning
N
Ox
NH
3
MW
th
lb
sM
MB
tu
klbs
h
BA
SE 3
7 B
asel
ine
(11
00 -
114
5)
150
328
19
7415
90
00
214
157
5
TE
ST 3
8 B
urne
r+SO
FA T
ilt(1
145
-12
15)
150
336
19
7315
90
00
215
156
8
TE
ST 3
9 B
urne
r+SO
FA T
ilt(1
215
-12
45)
150
351
6970
115
90
00
194
135
0
TE
ST 4
0 B
urne
r+SO
FA T
ilt(1
245
-12
53)
150
387
6970
115
80
00
213
143
7
TE
ST 4
1 B
urne
r+SO
FA T
ilt(1
350
-14
15)
150
355
6970
115
80
00
180
120
5
TE
ST 4
2 B
urne
r+SO
FA T
ilt(1
415
-15
10)
150
359
6970
115
90
00
193
137
8
TE
ST 4
3 B
urne
r+SO
FA T
ilt(1
510
-15
55)
150
350
6970
115
60
00
180
121
6
TE
ST 4
4 B
urne
r+SO
FA T
ilt(1
558
-16
50)
150
356
6970
116
10
00
182
124
5
TE
ST 4
5 M
ill B
ias
(21
30 -
223
0)
150
333
6971
110
10
00
168
107
6
TE
ST 4
6 M
ill B
ias
(23
30 -
240
0)
150
428
6971
20
20
00
141
715
BA
SE 4
7 B
asel
ine
(83
5 -9
30)
15
0 3
522
1174
162
00
021
2 14
81
TE
ST 4
8 L
ow-N
Ox B
asel
ine
(93
0 - 1
000
) 15
0 3
5869
691
160
00
018
4 12
88
TE
ST 4
9 E
con
Byp
ass
(10
00 -
103
0)
150
351
6969
115
95
00
182
123
6
TE
ST 5
0 E
con
Byp
ass
(10
30 -
110
0)
150
361
7070
115
915
00
188
125
7
TE
ST 5
1 E
con
Byp
ass
(11
00-1
130
) 15
0 3
5770
701
158
280
018
9 12
23
TE
ST 5
2 E
con
Byp
ass
(11
50 -1
220
) 15
0 3
5670
701
163
400
020
2 12
84
B-4
Tab
le 1
C
ayug
a U
nit 1
Tes
t Mat
rix
(Con
t)
Tes
t D
escr
iptio
n L
oad
Eco
nO
2
TO
PSO
FA
MID
DL
ESO
FA
BO
TT
OM
SOFA
Top
Mill
(1A
1)L
oadi
ng
Eco
nom
izer
B
ypas
s Dam
per
Ope
ning
Air
-Pre
heat
erB
ypas
s Dam
per
Ope
ning
N
Ox
NH
3
MW
th
lb
sM
MB
tu
klbs
h
TE
ST 5
3 E
con
Byp
ass
(12
25-1
345
) 15
0 3
5470
701
158
00
017
7 11
87
TE
ST 5
4 E
con
Byp
ass
(13
58-1
445
) 15
0 3
3870
700
157
400
019
2 12
01
TE
ST 5
5 C
oal A
ir T
emp
(14
25 -
153
0)
150
330
7070
015
90
00
177
113
6
TE
ST 5
6 C
oal A
ir T
emp
(15
30 -
161
5)
150
340
7070
015
40
00
175
112
6
TE
ST 5
7 C
oal A
ir T
emp
(16
20 -
170
5)
150
346
7070
015
40
00
173
113
8
TE
ST 5
8 So
otbl
owin
g(1
710
- 18
35)
15
0 3
3870
700
155
00
017
6 11
69
BA
SE 5
9 So
otbl
owin
g(8
50
- 93
0)
150
332
210
7515
50
00
216
150
9
TE
ST 6
0 So
otbl
owin
g(9
30~
103
5)
150
329
6970
015
30
00
174
116
2
TE
ST 6
1 So
otbl
owin
g(1
051
- 13
30)
15
0 3
3269
690
155
00
017
3 11
19
TE
ST 6
2 So
otbl
owin
g(1
428
- 16
10)
15
0 3
2769
690
154
00
017
4 10
95
TE
ST 6
3 So
otbl
owin
g(1
628
- 18
15)
15
0 3
3469
681
154
00
018
5 11
68
BA
SE 6
4 B
asel
ine
(85
0 - 9
50)
15
0 3
211
1173
188
00
020
1 10
97
TE
ST 6
5 B
otto
m M
ill O
S(9
53
- 10
40)
150
308
7070
018
90
00
163
800
TE
ST 6
6 So
otbl
owin
g(1
110
- 15
10)
15
0 3
2270
700
155
00
017
5 10
79
BA
SE 6
7 B
asel
ine
(11
00 -1
130
) 15
0 3
11
1073
156
01
021
4 14
51
TE
ST 6
8 L
ow-N
Ox B
asel
ine
(11
30 -1
200
) 15
0 3
370
691
155
01
018
6 11
76
TE
ST 6
9 So
otbl
owin
g(1
200
-16
15)
150
33
7069
115
50
10
181
114
6
B-5
Tab
le 1
C
ayug
a U
nit 1
Tes
t Mat
rix
(Con
t)
Tes
t D
escr
iptio
n L
oad
Eco
nO
2 T
OP
SOFA
M
IDD
LE
SOFA
B
OT
TO
MSO
FA
Top
Mill
(1A
1)L
oadi
ng
Eco
nom
izer
B
ypas
s Dam
per
Ope
ning
Air
-Pre
heat
erB
ypas
s Dam
per
Ope
ning
N
Ox
NH
3
MW
th
lb
sM
MB
tu
klbs
h
BA
SE 7
0 B
asel
ine
(81
5 - 8
30)
15
0 3
41
1173
159
00
020
5 13
04
TE
ST 7
1 L
ow-N
Ox
Bas
elin
e(8
00-
900
) 15
0 3
370
691
159
00
017
5 10
74
TE
ST 7
2 M
ill B
ias+
O2
(19
45-1
000
) 15
0 3
270
691
121
00
016
4 10
15
TE
ST 7
3 M
ill B
ias+
O2
(10
40-1
055
) 15
0 3
070
691
118
00
016
0 95
7
TE
ST 7
4 M
ill B
ias+
O2
(11
45-1
200
) 15
0 3
070
691
90
00
015
6 92
3
TE
ST 7
5 M
ill B
ias+
O2
(12
00-1
300
) 15
0 3
370
691
89
00
016
2 96
5
TE
ST 7
6 M
ill B
ias+
O2
(13
00-1
400
) 15
0 3
470
701
64
00
016
0 96
2
TE
ST 7
7 M
ill B
ias+
O2
(14
00-1
500
) 15
0 3
170
701
64
00
015
7 92
8
TE
ST 7
8 So
otbl
owin
g(1
610
-18
30)
150
33
7070
115
70
00
178
110
9
BA
SE 7
9 B
asel
ine
(74
5 shy8
00)
150
31
111
7516
20
00
216
144
8
TE
ST 8
0 So
otbl
owin
g(8
10-
132
0)
150
33
7069
016
20
00
182
115
4
BA
SE 8
1 B
asel
ine
(22
30-2
400
) 10
0 4
292
250
109
3343
025
8 16
31
TE
ST 8
2 O
2 +SO
FA(0
00
- 10
0)
100
435
2425
010
933
490
259
152
5
TE
ST 8
3 O
2 +SO
FA(1
00
- 14
5)
100
416
2525
010
733
450
255
146
6
TE
ST 8
4 O
2 +SO
FA(1
45
- 24
5)
100
431
11
010
532
480
258
163
7
TE
ST 8
5 O
2 +SO
FA(2
45
- 40
0)
100
442
11
00
432
580
258
126
1
TE
ST 8
6 O
2 +SO
FA(4
00
- 50
0)
100
440
2425
00
432
580
258
108
8
B-6
Tab
le 1
C
ayug
a U
nit 1
Tes
t Mat
rix
(Con
t)
Tes
t D
escr
iptio
n L
oad
Eco
nO
2
TO
PSO
FA
MID
DL
ESO
FA
BO
TT
OM
SOFA
Top
Mill
(1A
1)L
oadi
ng
Eco
nom
izer
B
ypas
s Dam
per
Ope
ning
Air
-Pre
heat
erB
ypas
s Dam
per
Ope
ning
N
Ox
NH
3
MW
th
lb
sM
MB
tu
klbs
h
TE
ST 8
7 O
2 +SO
FA(2
215
-23
15)
100
440
4949
00
233
520
259
929
TE
ST 8
8 O
2 +SO
FA(2
315
- 24
00)
10
0 4
1049
490
02
3452
025
3 91
2
TE
ST 8
9 O
2 +SO
FA(0
00
- 03
0)
100
413
4949
00
349
500
253
912
TE
ST 9
0 O
2 +SO
FA(0
30
- 13
0)
100
411
4949
00
325
530
254
914
TE
ST 9
1 O
2 +SO
FA(1
30
- 23
0)
100
446
1414
10
433
500
259
103
7
TE
ST 9
2 O
2 +SO
FA(2
30
- 33
0)
100
449
10
10
433
470
260
111
3
BA
SE 9
3 B
asel
ine
(23
30 -
234
5)
75
546
12
00
110
00
027
5 14
27
TE
ST 9
4 O
2 +SO
FA(0
00
- 04
5)
75
526
55
00
310
01
027
1 14
17
TE
ST 9
5 O
2 +SO
FA(1
25
- 21
0)
755
2211
100
03
100
10
271
139
9
TE
ST 9
6 O
2 +SO
FA(2
30
- 31
5)
755
2714
150
03
100
10
272
136
3
TE
ST 9
7 O
2 +SO
FA(3
40
- 42
5)
755
2215
150
03
100
10
272
132
5
BA
SE 9
8 B
asel
ine
(22
45 -
235
0)
75
585
11
00
010
00
027
9 13
93
TE
ST 9
9 O
2 +SO
FA(0
030
- 2
15)
75
507
22
00
010
00
026
7 14
91
TE
ST 1
00
O2 +
SOFA
(30
4 - 3
45)
75
515
1615
00
010
00
026
7 14
14
TE
ST 1
01
O2 +
SOFA
(40
0 - 4
25)
75
514
2019
00
010
00
026
8 13
91
TE
ST 1
02
O 2 +
SOFA
(42
6 - 5
10)
75
531
2425
00
010
00
027
0 14
11
B-7
For information on other NYSERDA reports contact
New York State Energy Research and Development Authority
17 Columbia Circle Albany New York 12203-6399
toll free 1 (866) NYSERDA local (518) 862-1090
fax (518) 862-1091
infonyserdaorg wwwnyserdaorg
OPTIMIZATION OF SCR CONTROL TECHNOLOGY FOR REDUCED NOx
EMISSIONS IMPROVED PERFORMANCE AND REDUCED OPERATING EXPENSES
FINAL REPORT 09-09
STATE OF NEW YORKDAVID A PATERSON GOVERNOR
NEW YORK STATE ENERGY RESEARCH AND DEVELOPMENT AUTHORITYVINCENT A DEIORIO ESQ CHAIRMANFRANCIS J MURRAY JR PRESIDENT AND CHIEF EXECUTIVE OFFICER
- Structure Bookmarks
-