optimizing coded 16-apsk for aeronautical …perrins/pubs/c/2017itc.pdfspectral efficiency in...
TRANSCRIPT

OPTIMIZING CODED 16-APSKFOR AERONAUTICAL TELEMETRY
Michael Rice, Chad JosephsonDepartment of Electrical & Computer Engineering
Brigham Young UniversityProvo, Utah, USA
[email protected], [email protected]
Erik PerrinsElectrical Engineering & Computer Science Department
University of KansasLawrence, Kansas, USA
ABSTRACT
This paper investigates the application of 16-APSK modulation to aeronautical mobile telemetry.The peak-to-average power ratio vs. code rate tradeoff is mapped to an optimization problem in-volving spectral efficiency and the constellation parameters. The optimization results produce atheoretically optimum solution that is 3.95 times more spectrally efficient as uncoded SOQPSK-TG. When implementation losses and the available IRIG 106 LDPC code rates are factored in, theadvantage drops to 3.20 times the spectral efficiency of SOQPSK-TG.
INTRODUCTION
In the wake of recent spectral reallocations, such as the AWS-3 auctions that reallocated 1755 –1780 MHz and 2155–2180 MHz from US Government use to commercial wireless services [1],spectral efficiency in aeronautical mobile telemetry (AMT) has become an even more importanttopic. One of the efforts to increase spectral efficiency has been an investigation of the applica-tion of non-binary linear modulations in the AMT environment. But linear modulations achieveimproved spectral efficiency (relative to SOQPSK-TG) at the expense of amplitude variations,quantified by the peak-to-average power ratio (PAPR). Whereas SOQPSK has a PAPR of 0 dB,band-limited linear modulations have a PAPR greater than 0 dB. This necessitates lowering the
1

16 APSKmodulator
LDPCencoder
AWGNchannel
matched filter
computebit LLRs
LDPCdecoder
code rate R parametersa, g, q
T/M bits T/M bits
Figure 1: A block diagram an LDPC-coded 16-APSK system for aeronautical telemetry.
operating point of the RF power amplifier to accommodate the amplitude variations without distor-tion. Lowering the operating point reduces the available transmit power which, in turn, reduces thelink margin or transmitter-to-receiver distance. This loss can be recovered using an error correctingcode. But error correcting codes increase the bandwidth and therefor reduce the spectral efficiencygains. It might be that the code rate required to compensate for reduced RF power produces asystem whose spectral efficiency is not appreciably better than that of uncoded SOQPSK-TG!
Motivated by the good properties of the APSK family of modulations adopted by the digital videobroadcast, system 2 (DVB-S2) satellite standard [2], Shaw and Rice [3] explored the use of 16-and 32-APSK with turbo codes in the AMT. The results showed that 16-APSK with rate-4/5 turbocodes is able to achieve spectral efficiency approximately 3 times that of uncoded SOQPSK-TG.
Here the performance of 16-APSK with the LDPC codes defined in Appendix R of IRIG 106-15[4] is explored. The impact of pulse shape and constellation parameters on PAPR is quantifiedand used to describe the PAPR vs. code rate trade-off. This trade-off is recast to an optimizationproblem involving spectral efficiency and the constellation parameters. The optimization is usedto identify the 16-APSK parameters that maximize the theoretically optimum code. The solutionis a set of modulation and code parameters that is 3.95 times more spectrally efficient than un-coded SOQPSK-TG. When implementation losses and the limited IRIG 106 LDPC code rates arefactored in, the advantage drops to 3.20 times the spectral efficiency of SOQPSK-TG.
PROBLEM FORMULATION
The block diagram of the system under consideration is shown in Figure 1. Telemetry bits areencoded using an LDPC encoder with rate 0 < R < 1. The coded bits are used to modulatea carrier using 16-APSK. The complex-valued lowpass equivalent of the 16-APSK modulatedcarrier is
s(t) =∑k
akp(t− kTs) (1)
where ak ∈ C is the k-th symbol which is one of the constellation points in the set C shown inFigure 2, p(t) is a unit-energy version of the square-root raised-cosine pulse shape [5] with excessbandwidth 0 < α ≤ 1, and Ts is the symbol time.
The received signal is r(t) = s(t) + w(t) where w(t) is the additive thermal noise modeled as
2

11001110
1111 1101
0100
0000
10001010
0010
0110
0111
0011
1011 1001
0001
0101
Figure 2: The 16-APSK constellation with the DVB-S2 bit-to-symbol mappings.
a complex-valued normal random process whose in-phase and quadrature components are real-valued wide-sense stationary normal random processes with zero mean and power spectral densityN0 W/Hz [6]. The received signal is matched filtered and sampled at the optimum sampling in-stants (perfect synchronization is assumed). The log-likelihood ratios (LLRs) are computed foreach of the four bits corresponding to each symbol. The log-likelihood ratios form the inputs tothe LDPC decoder. The LDPC decoder outputs are estimates of the input bits. The bit error rate ismeasured by the difference between the bits at the LDPC encoder input and the bits at the LDPCdecoder output.
The block diagram shows the four parameters to be optimized in this paper.
MAJOR FACTORS INVOLVED IN THE OPTIMZATION
A. CONSTELLATION PROPERTIES
The 16-APSK constellation shown in Figure 2 comprises four points on a circle of radius r1 andtwelve points on a circle of radius r2, with r2 > r1. The points on the outer circle are offset bythe angle θ as shown. The constellation is parameterized by γ = r2/r1 and θ. For example, theDVB-S2 standard defines γ = 3.15, 2.85, 2.75, 2.70, 2.60, and 2.57, all with θ = 0, for R = 2/3,3/4, 4/5, 5/6, 8/9, and 9/10, respectively, for 16-APSK [2].
3

1 + ↵
2Ts
1 � ↵
2Ts�1 � ↵
2Ts�1 + ↵
2Ts
BW =1 + ↵
Ts
|P (f)|2
f
Figure 3: The frequency-domain representation of the SRRC pulse shape.
The average energy of the constellation is
Eavg =1
16
15∑m=0
|cm|2 =r21 + 3r22
4=
1 + 3γ2
4r21, (2)
where c0, . . . , c15 are the 16 complex-valued points in the constellation C.
B. PULSE SHAPE PROPERTIES
The square-root raised-cosine (SRRC) pulse shape ideally provides absolute bandlimiting withoutproducing intersymbol interference [5]. The spectrum of the SRRC pulse shape is illustrated inFigure 3. Observe that the RF bandwidth is defined by the two-sided bandwidth of |P (f)|2 and isparameterized by α, called the “rolloff factor” or “excess bandwidth.” The RF bandwidth may beexpressed in terms of code rate and the input (information) bit rate:
BW =1 + α
4R× bit rate. (3)
C. PEAK-TO-AVERAGE POWER RATIO
The power in s(t) given by (1) is proportional to |s(t)|2. The peak power proportional to maxt |s(t)|2and the mean (or average) power is E{|s(t)|2} where the expectation is over both the symbol se-quence and time. The peak-to-average power ratio (PAPR) is the ratio of the two:
PAPR =maxt |s(t)|2E{|s(t)|2} . (4)
PAPR is important for RF power amplifier design. RF power amplifier efficiency (measured byratio of RF output power to DC input power) is maximized when the RF power amplifier oper-
4

Figure 4: The phase trajectory (quadrature component vs. in-phase component) for 16-APSK (γ = 2.75,θ = 0) and the SRRC pulse shape with α = 0.5.
ates in full saturation. Operating in full saturation imposes amplitude distortion on the transmittedwaveform. This distortion causes unwanted sidelobes (called “spectral regrowth”) in the spectrumof modulated carriers with amplitude variations. For this reason, waveforms with no amplitudevariations, or PAPR = 1 (0 dB), such as PCM/FM, SOQPSK-TG, and ARTM CPM [4] have beenpreferred in aeronautical telemetry. When a waveform with PAPR > 1 is used, the RF power am-plifier must operate in its “linear region” which necessarily reduces both the peak and the averageoutput power. The reduction in average output power is usually called output back-off (OBO).Here, we assume the required OBO is the PAPR. Under this assumption, PAPR is a direct measureof the required OBO.
There are two contributors to PAPR [7]. The first contributor is the arrangement of constellationpoints. If all the constellation points are on a circle (such as BPSK and QPSK) then the constella-tion’s contribution to the PAPR is zero. Otherwise, the arrangement of points contributes to PAPR.The second contributor is the waveform variation due to the pulse shape. This is illustrated bythe phase trajectory (quadrature component vs. in-phase component) of 16-APSK with the SRRCpulse shape with α = 0.5 illustrated in Figure 4. The distance from the origin to any point on thephase trajectory represents |s(t)|. If |s(t)| were a constant, the phase trajectory would be a circle.Clearly, this is not the case. Note that the peak values of |s(t)| occur in the “overshoot” associatedwith the constellation points on the outer circle.
The PAPR is a complicated function of the pulse shape parameter α and the constellation param-eters γ and θ. We first explore PAPR as a function of α. Figure 5 shows a plot of PAPR for fivedifferent 16-ary constellations: the traditional square 16-QAM constellation, the unconstrainedoptimum (minimum probability of error) constellation, the constrained optimum (minimum prob-ability of error) constellation where the points are constrained to a regular grid, the 16-APSKconstellation with γ = 2.75 and θ = 0, and 16-PSK [5]. To compute the PAPR, a discrete-timeversion of (1) was generated at a sample rate equivalent to 10 samples/symbol. Because the PAPR
5

0.1 0.2 0.3 0.4 0.5 0.6 0.7 0.8 0.9 13
3.5
4
4.5
5
5.5
6
6.5
7
7.5
16 QAM
U-Opt. 16
C-OPt. 16
16 APSK
16 PSK
Figure 5: PAPR (dB) vs. SRRC roll-off α for a number of different 16-ary constellations.
depends on the symbol sequence, the symbol sequence corresponding to four repetitions of thelength-32,767 PN sequence (sometimes called the “PN15” sequence because 215 = 32,768) wasused as a bit sequence representative of an encrypted telemetry data bit sequence. The resultsshow that the traditional square 16-QAM constellation has the highest PAPR, followed by the un-constrained and constrained optimum constellations. The PAPR of 16-APSK is about 1.5 dB lessthan that of 16-QAM. Because the 16-PSK constellations positions all the constellation points ona circle, 16-PSK has the lowest PAPR, but it also has the worst bit error probability and thereforerequires a lower code rate than the other options.
For all constellations, PAPR is quite high for α < 0.4. This demonstrates that even though smallα decreases the occupied bandwidth [see Equation (3)], the bandwidth reduction is achieved at thecost of increased PAPR. The optimum (in the sense of minimum PAPR) α is 0.4 < α < 0.5.
For α = 0.5 PAPR for 16-APSK as a function of γ and θ may now be explored. The results areshown in Figure 6. The plot shows that PAPR is a strong function of γ but only weakly dependenton θ.
D. CODE RATE
As explained in the Problem Formulation, a rate-R code, for 0 < R < 1, produces 1/R coded bitsfor each input (information) bit. If the input (information) bit interval is Tb seconds, then the codedbit interval is Tc = RTb. Because 16-APSK uses four bits per symbol (see the bit-to-symbol labels
6

3
15
3.5
4
PA
PR
(dB
)
10
4
3
4.5
52
0 1
3.4
3.6
3.8
4
4.2
4.4
Figure 6: Peak-to-average power ratio (PAPR) for 16-APSK as a function of γ and θ.
in Figure 2), the symbol time in Equation (1) is Ts = 4Tc. The resulting bandwidth expansion isinversely proportional to the code rate as indicated in Equation (3).
When attempting to optimize a coded system, the performance of 16-APSK for an arbitrary coderate is of interest. One might envision designing a large number of LDPC codes, each with adifferent code rate, and simulating the performance of each one for all interesting (γ, θ)-variants of16-APSK. Unfortunately, the bit error rate performance of coded systems is notoriously difficultto simulate. In light of this difficulty, we resort to concepts from information theory to bound theperformance of coded 16-APSK.
Let x ∈ C be a constellation point and let y = x + n be the corresponding matched filter output.Given the assumptions for w(t) outlined in the Problem Formulation, n is a complex-valued circu-larly symmetric normal random variable with zero mean and variance 2σ2 [i.e., the real part of n(in-phase component) and the imaginary part of n (quadrature component) have the same varianceσ2]. Consequently, y is conditionally normal with density function
f(y|x) = 1
2πσ2exp
{− 1
2σ2|y − x|2
}. (5)
For notational purposes below, we write y = yR + jyI and x = a+ jb, and express the conditionaldensity function (5) as the joint density
f(yR, yI |x) =1
2πσ2exp
{− 1
2σ2
[(yR − a)2 + (yI − b)2
]}. (6)
The symmetric information rate between x and y is the mutual information [8] between x and y
7

assuming a uniform distribution on x (i.e., the constellation points are equally likely):
I(x; y) =1
16
15∑m=0
∫ ∞−∞
∫ ∞−∞
f(yR, yI |cm) log2
{f(yR, yI |cm)
1/16∑15
m′=0 f(yR, yI |cm′)
}dyRdyI . (7)
The units for I(x; y) are bits/symbol. For example, because 16-APSK uses four bits per symbol,using a rate-1/2 code with 16-APSK results in 2 bits/symbol, a rate-3/4 code results in 3 bits/symbol,and so on.
The symmetric information rate is an upper bound on the number bits/symbol for which it ispossible to achieve reliable communications [8]. The corresponding code rate is I(x; y)/4. Thus,the interpretation of these results is that is possible to achieve reliable (error-free) bit error rateperformance with coded 16-APSK as long as the code rate R < I(x; y)/4.
An example illustrates the concept. The symmetric information rate (7) for 16-APSK with γ =2.75 and θ = 0 is plotted1 in Figure 7. I(x; y) = 1 bit/symbol at Eb/N0 = 0 dB. This means thatreliable communication can be achieved at Eb/N0 = 0 dB using a code with R < 1/4. Similarly,I(x; y) = 2 bits/symbol at Eb/N0 = 2 dB which means reliable communications can be achievedat Eb/N0 = 2 dB using a code with R < 1/2; and I(x; y) = 3 bits/symbol at Eb/N0 = 4.55 dBwhich means reliable communications can be achieved at Eb/N0 = 4.55 dB using a code withR < 3/4. Note that as Eb/N0 increases, the symmetric information rate approaches 4 bits/symbol,which means at these high values of Eb/N0, a high rate code (R→ 1) may be used.
A closely related concept is the maximum code rate for a non-zero probability of error. Therelationship between the decoder output bit error probability p, the code rate R and the signal-to-noise ratio is given by [9]
R =I(x; y)
1−H2(p), (9)
where H2(p) is the entropy of a binary random variable and is given by [8]
H2(p) = p log2(p) + (1− p) log2(1− p). (10)
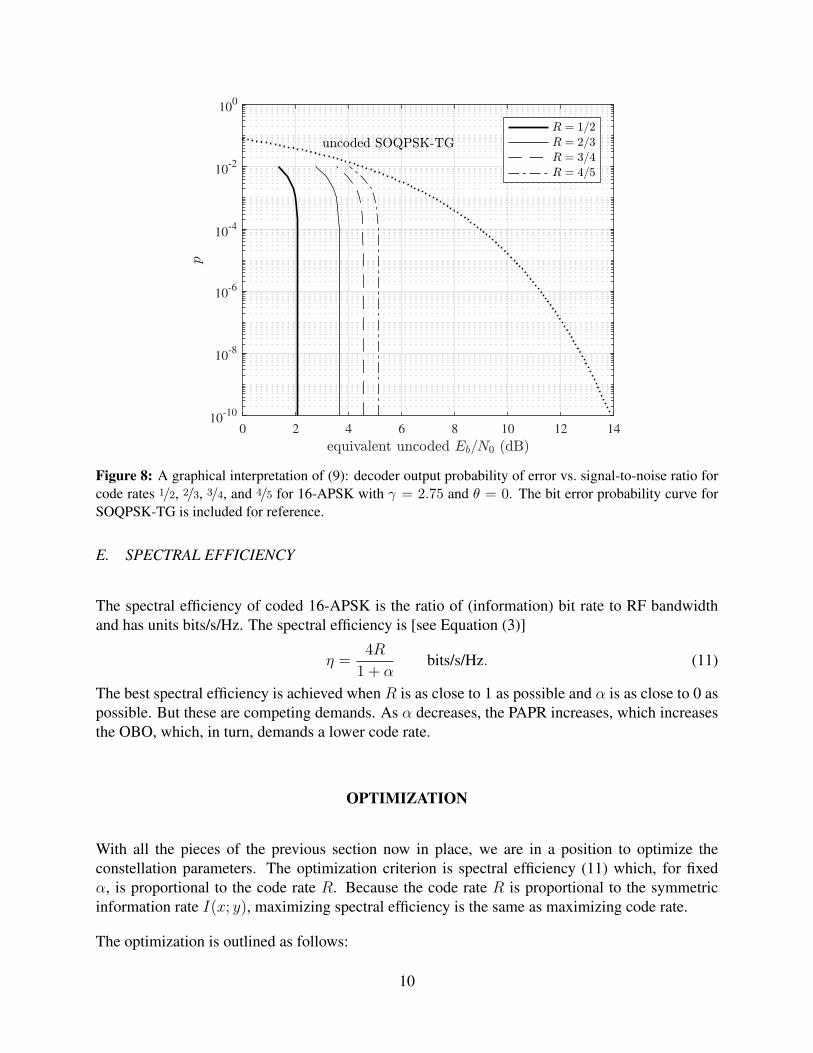
For fixed code rate, (9) relates the decoder output probability of error to the signal-to-noise ratioEb/N0 for a given constellation. This relationship is plotted in Figure 8 for 16-APSK with γ = 2.75and θ = 0 for code rates 1/2, 2/3, 3/4, and 4/5. (These rates were selected because Appendix R of
1Here we have followed the convention of expressing the symmetric information rate in terms of the equivalentuncoded signal-to-noise ratioEb/N0. (Eb is the uncoded bit energy andN0 is the power spectral density of the inphaseand quadrature components of the noise.) Because the modulation is 16-APSK, we have Eavg = 4Ec, where Ec isthe coded-bit energy, and Ec = REb. Consequently, Eavg/N0 is the over-the-air signal-to-noise ratio at which thesynchronizers must operate and Eb/N0 is the signal-to-noise ratio for the uncoded bits (and without the correspondingbandwidth expansion). The relationship between σ2 in (7) and the equivalent uncoded signal-to-noise ratio Eb/N0 is
σ2 =Eavg
8R
(Eb
N0
) , (8)
where Eavg is given by (2) and R = I(x; y)/4.
8

-2 0 2 4 6 8 10 12 14
0
0.5
1
1.5
2
2.5
3
3.5
4
4.5
Figure 7: The symmetric information rate (7) vs. Eb/N0 for 16-APSK with γ = 2.75 and θ = 0.
IRIG 106-15 [4] defines codes of rates 1/2, 2/3, and 4/5.) The bit error probability vs. Eb/N0 curvefor uncoded SOQPSK-TG is included for reference.
The interpretation is that the code curves define a theoretical boundary. A realizable system mustoperate to the right of its corresponding curve. For example, when using this version of 16-APSKwith a rate-4/5 code, the equivalent Eb/N0 must be greater than 4.55 dB to achieve p < 10−6. IfEb/N0 > 1.55 dB cannot be achieved, then either a higher p must be tolerated, or a lower coderate must be used. The bit error probably curve for uncoded SOQPSK-TG, calculated from theanalytical expression [10, Equation (15)], is also included for reference. The number of deciBelsseparating the uncoded SOQPSK-TG curve and one of the code curves upper bounds the codinggain associated with the code and corresponding constellation. It should be pointed out that codesused in practice have coding gains less than those predicted here.
The curves in Figure 8 are consistent with the symmetric information rate of Figure 7. For exam-ple, the R = 1/2 curve in Figure 8 asymptotically approaches p = 0 slightly above Eb/N0 = 2dB. Because R = 1/2 corresponds to I(x; y) = 2 bits/symbol, the curve in Figure 7 crosses 2bits/symbol just above Eb/N0 = 2 dB as well. Similarly, the R = 3/4 curve in Figure 8 asymptoti-cally approaches p = 0 at Eb/N0 = 4.55 dB and the curve in Figure 7 crosses 3 bits/symbol at thesame value of Eb/N0.
9
0 2 4 6 8 10 12 1410
-10
10-8
10-6
10-4
10-2
100
Figure 8: A graphical interpretation of (9): decoder output probability of error vs. signal-to-noise ratio forcode rates 1/2, 2/3, 3/4, and 4/5 for 16-APSK with γ = 2.75 and θ = 0. The bit error probability curve forSOQPSK-TG is included for reference.
E. SPECTRAL EFFICIENCY
The spectral efficiency of coded 16-APSK is the ratio of (information) bit rate to RF bandwidthand has units bits/s/Hz. The spectral efficiency is [see Equation (3)]
η =4R
1 + αbits/s/Hz. (11)
The best spectral efficiency is achieved when R is as close to 1 as possible and α is as close to 0 aspossible. But these are competing demands. As α decreases, the PAPR increases, which increasesthe OBO, which, in turn, demands a lower code rate.
OPTIMIZATION
With all the pieces of the previous section now in place, we are in a position to optimize theconstellation parameters. The optimization criterion is spectral efficiency (11) which, for fixedα, is proportional to the code rate R. Because the code rate R is proportional to the symmetricinformation rate I(x; y), maximizing spectral efficiency is the same as maximizing code rate.
The optimization is outlined as follows:
10

1. Select a reference operating point, (Eb/N0)∗. The operating point is defined by the desired
probability of bit error p. The goal is “error-free” performance, which is open to someinterpretation. In the example that follows, we choose p∗ = 10−10 as the definition of “errorfree” (p = 10−10 corresponds to 1 error every 17 minutes for a 10 Mbit/s link or 1 errorevery 83 minutes for a 2 Mbit/s link). For uncoded SOQPSK-TG, p = 10−10 requires (seeFigure 8) [(
Eb
N0
)∗]dB
= 13.9 dB. (12)
2. The 16-APSK operating point is determined by the OBO, which we equate to the PAPR.Thus, for a given (γ, θ) pair, the corresponding PAPR(γ, θ) defines the 16-APSK operatingpoint as [
Eb
N0
(γ, θ)
]dB
=
[(Eb
N0
)∗]dB−[
PAPR(γ, θ)]
dB(13)
3. The symmetric information rate corresponding to the 16-APSK constellation defined by the(γ, θ) pair at Eb/N0 given by (13) is calculated from (7) using a plot similar to Figure 7.
4. The (γ, θ) pair that maximizes I(x; y) defines the optimum constellation.
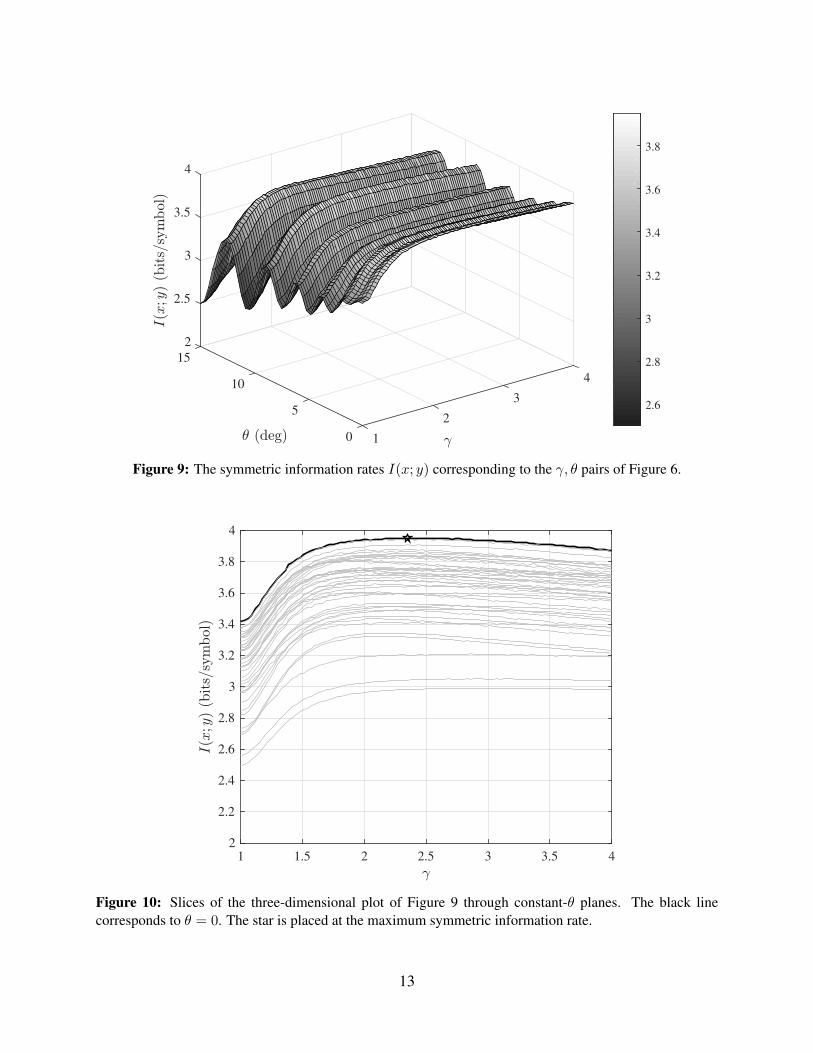
We demonstrate the optimization using α = 0.5. The symmetric information rate for (γ, θ) pairsof Figure 6 are shown in Figures 9 and 10. Figure 9 shows the three-dimensional plot of I(x; y) vs.(γ, θ). The plot displays “horizontal” peaks suggesting that like the PAPR, I(x; y) is more stronglydependent on γ than θ. This motivates exploring slices of I(x; y) along lines of constant θ. Theresults are shown in Figure 10. The slice corresponding to θ = 0 (the black line in Figure 10)is the maximum symmetric information rate for all values of γ. The maximum along the θ = 0curve is at γopt = 2.3477, Iopt(x; y) = 3.9512 bits/symbol, which corresponds to a code rate ofRopt = 0.9878.
The optimization procedure may be modified to account for implementation loss. The two im-plementation losses considered here are those for SOQPSK-TG detection and decoding for theAR4JA LDPC codes.
1. The implementation loss for SOQPSK-TG may be estimated by comparing the BER curveon page 11 of the data sheet [11] with the analytical curve for SOQPSK-TG, see for exam-ple Equation (15) of [10]. This comparison yields the SOQPSK-TG implementation lossLSOQPSK = 1 dB.
2. The implementation loss for the length-4096 AR4JA LDPC codes [4, Appendix R] is ob-tained by comparing the theoretical optima of Figure 8 with the simulation results presentedin Figure 7 of [12]. The curves for the length-4096 AR4JA LDPC codes in Figure 7 of [12]are about 1.5 dB to the right of theoretical bounds in Figure 8 for the R = 1/2, 2/3, 4/5. As-suming the same difference for the R = 3/4 code, we can set the implementation loss for theLDPC decoder at LLDPC = 1.5 dB.
11

LSOQPSK moves the operating point to the right and LLDPC moves the operating point to the left.Incorporating these losses into the optimization procedure alters the operating point in step 2 asfollows: [
Eb
N0
(γ, θ)
]dB
=
[(Eb
N0
)∗]dB−[
PAPR(γ, θ)]
dB+ LSOQPSK − LLDPC. (14)
The results corresponding to using (14) in place of (13) are shown in Figures 11 and 12. Thebehavior is identical to that for the ideal case with no implementation loss, except the rates areslightly lower. Figure 12 shows the slices Figure 11 along planes of constant θ. The slice cor-responding to θ = 0 (shown in black) produces the optimum symmetric information rate. Themaximum, shown by the star, occurs at γ = 2.3477 (the same as for the unconstrained case) and isIopt(x; y) = 3.9253 bits/symbol (or a code rate of Ropt = 0.9813).
The optimization results are summarized by the spectral efficiency plot in Figure 13. (Figure 14 isa zoomed-in view.) The spectral efficiencies for the unconstrained optimization with and withoutimplementation losses are 2.6342 and 2.6169, respectively. The optimum points correspond tocode rates of 0.9878 (no implementation loss) and 0.9813 (with implementation loss).
Also included for reference are the results corresponding to the seven DVB-S2 constellation vari-ants. For the parameters used here, the optimum constellation and code pair identified by theoptimization routine is slightly better than the best DVB-S2 option.
Because these rates do not correspond to one the AR4JA LDPC code rates in IRIG 106-15, thehighest rate not greater than the unconstrained rate must be used. The spectral efficiency corre-sponding to these points is also plotted in the figures. But when mapped to the available AR4JALDPC code rates, all options achieve the same spectral efficiency, but the optimum code/constellationpair has a slight link margin advantage.
Finally, the operating point for SOQPSK-TG is shown for reference. The −50 dBc bandwidth forSOQPSK-TG was used to compute its spectral efficiency. The results show that LCPC-coded 16-APSK is capable of achieving spectral efficiencies a factor of 3.95 times (unconstrained with noimplementation loss), 3.93 times (unconstrained with implemented loss), and 3.20 times (AR4JArate constrained with implementation loss) the spectral efficiency of uncoded SOQPSK-TG.
CONCLUSIONS
The 16-APSK modulation together LDPC code rates presents the system designer with a peak-to-average power ratio vs. code rate trade-off. This trade-off was recast to an optimization probleminvolving spectral efficiency and the constellation parameters. The optimum 16-APSK, parame-terized by the (γ, θ) pair, was identified using the optimization developed in this paper. The un-constrained optimization result is 3.95 times more spectrally efficient than uncoded SOQPSK-TG.When implementation losses and the limited number of IRIG 106 LDPC code rates are factoredin, the advantage drops to 3.20 times the spectral efficiency of SOQPSK-TG.
12
2
15
2.5
4
3
10
3.5
3
4
52
0 1
2.6
2.8
3
3.2
3.4
3.6
3.8
Figure 9: The symmetric information rates I(x; y) corresponding to the γ, θ pairs of Figure 6.
1 1.5 2 2.5 3 3.5 4
2
2.2
2.4
2.6
2.8
3
3.2
3.4
3.6
3.8
4
Figure 10: Slices of the three-dimensional plot of Figure 9 through constant-θ planes. The black linecorresponds to θ = 0. The star is placed at the maximum symmetric information rate.
13

2
15
2.5
4
3
10
3.5
3
4
52
0 1
2.6
2.8
3
3.2
3.4
3.6
3.8
Figure 11: The symmetric information rates I(x; y) corresponding to the γ, θ pairs of Figure 6 and includingimplementation losses LSOQPSK = 1 dB and LLDPC = 1.5 dB (cf. Figure 9).
1 1.5 2 2.5 3 3.5 4
2
2.2
2.4
2.6
2.8
3
3.2
3.4
3.6
3.8
4
Figure 12: Slices of the three-dimensional plot of Figure 11 through constant-θ planes and including im-plementation losses LSOQPSK = −1 dB and LLDPC = −1.5 dB (cf. Figure 10). The black line correspondsto θ = 0.
14

-2 0 2 4 6 8 10 12 14 16
0
0.5
1
1.5
2
2.5
3
3.5
4
Figure 13: Spectral efficiency η SOQPSK-TG, optimum 16-APSK, and the DVB-S2 options correspondingto a target bit error probability of Pb = 10−10 (cf. Figure 14).
9 9.2 9.4 9.6 9.8 10
2
2.1
2.2
2.3
2.4
2.5
2.6
2.7
2.8
Figure 14: A close-up view of the spectral efficiency plot of Figure 13.
15

ACKNOWLEDGEMENTS
This project is managed by the Test Resource Management Center (TRMC) and funded throughSpectrum Access R&D Program via Picatinny Arsenal under Contract No. W15QKN-15-9-1004.The Executing Agent and Program Manager work out of the AFTC.
REFERENCES
[1] Federal Communications Commission, “Auction 97: Advanced Wireless Services (AWS-3).”Available at http://wireless.fcc.gov/auctions/default.htm?job=auction summary&id=97.
[2] ETSI EN 302 207 v1.1.2, “Digital video broadcasting (DVB): Second generation framingstructure, channel coding and modulation systems for broadcasting, interactive services, newgathering and other broadband satellite applications,” June 2006.
[3] C. Shaw and M. Rice, “Turbo-coded APSK for aeronautical telemetry,” IEEE Aerospace andElectronic Systems Magazine, pp. 37–43, April 2010.
[4] Secretariat, Range Commanders Council, White Sands Missile Range, New Mex-ico, IRIG Standard 106-15: Telemetry Standards, 2015. (Available on-line athttp://www.irig106.org/docs/106-15).
[5] M. Rice, Digital Communications: A Discrete-Time Approach. Upper Saddle River, NJ:Pearson Prentice-Hall, 2009.
[6] J. Proakis and M. Salehi, Digital Communications. New York, NY: McGraw-Hill, fifth ed.,2008.
[7] F. Mahmood, E. Perrins, and L. Liu, “Comprehensive energy analysis and modeling of wire-less handset transceiver systems,” 2017. Under review IEEE Transactions on Green Commu-nications and Networking.
[8] T. Cover and J. Thomas, Elements of Information Theory. Hoboken, NJ: John Wiley & Sons,second ed., 2006.
[9] T. Moon, Error Correction Coding: Mathematical Methods and Algorithms. Hoboken, NJ:John Wiley & Sons, 2005.
[10] E. Perrins, “FEC systems for aeronautical telemetry,” IEEE Transactions on Aerospace andElectronic Systems, vol. 49, pp. 2340–2352, October 2013.
[11] Quasonix, “3rd Generation Rack-Mount RDMSTM Telemetry Receiver.” Data sheet. Avail-able at http://www.quasonix.com/sites/default/files/qsx rackmount thirdgen rdms datasheet 0.pdf.
[12] J. Hamkins, “Performance of low-density parity-check coded modulation,” in Proceedings ofthe IEEE Aerospace Conference, (Big Sky, MT), 6–13 March 2010.
16