optimizing the californian power system according to the
TRANSCRIPT
Kais Siala (a), Ejeong Baik (b), Matthias Huber (c), Thomas Hamacher (a), Sally Benson (b)
(a) Technical University of Munich
(b) Stanford University
(c) ifo Center for Energy, Climate and Exhaustible Resources,
Munich
37th International Energy Workshop
Gothenburg, 20/06/2018
Optimizing the Californian Power System according to the Renewable PortfolioStandards for 2030 and beyond
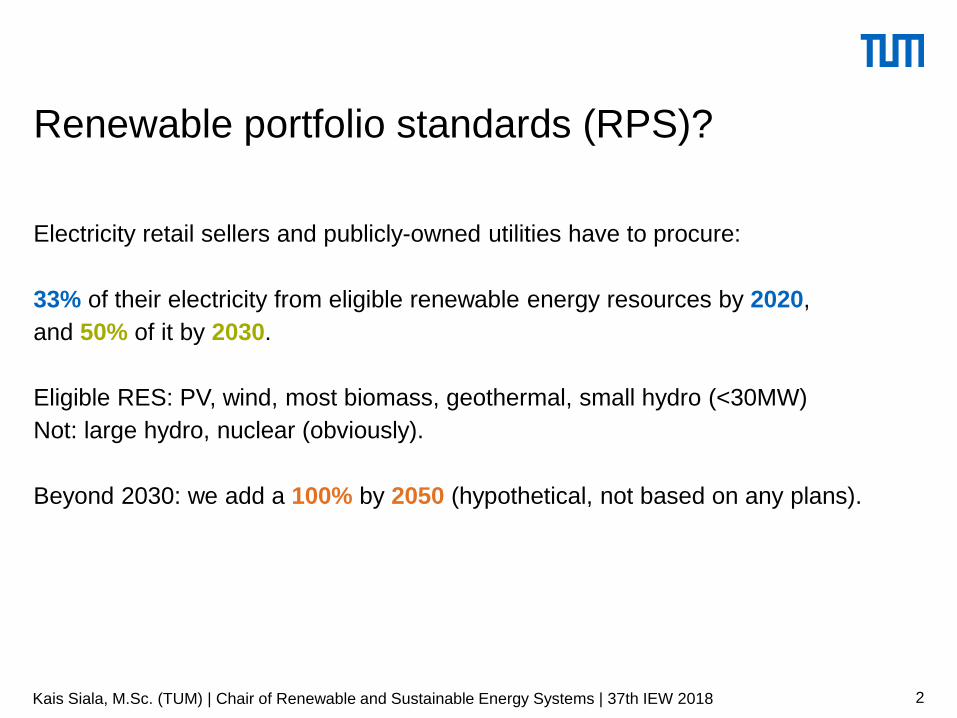
Electricity retail sellers and publicly-owned utilities have to procure:
33% of their electricity from eligible renewable energy resources by 2020,
and 50% of it by 2030.
Eligible RES: PV, wind, most biomass, geothermal, small hydro (<30MW)
Not: large hydro, nuclear (obviously).
Beyond 2030: we add a 100% by 2050 (hypothetical, not based on any plans).
2Kais Siala, M.Sc. (TUM) | Chair of Renewable and Sustainable Energy Systems | 37th IEW 2018
Renewable portfolio standards (RPS)?
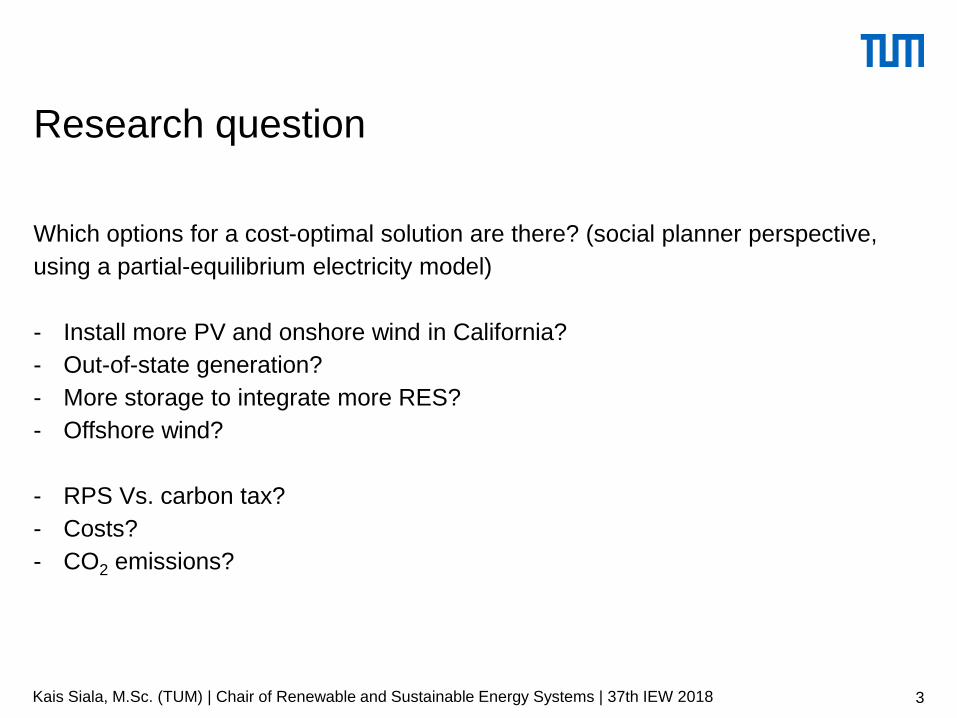
Which options for a cost-optimal solution are there? (social planner perspective,
using a partial-equilibrium electricity model)
- Install more PV and onshore wind in California?
- Out-of-state generation?
- More storage to integrate more RES?
- Offshore wind?
- RPS Vs. carbon tax?
- Costs?
- CO2 emissions?
3Kais Siala, M.Sc. (TUM) | Chair of Renewable and Sustainable Energy Systems | 37th IEW 2018
Research question
4Kais Siala, M.Sc. (TUM) | Chair of Renewable and Sustainable Energy Systems | 37th IEW 2018
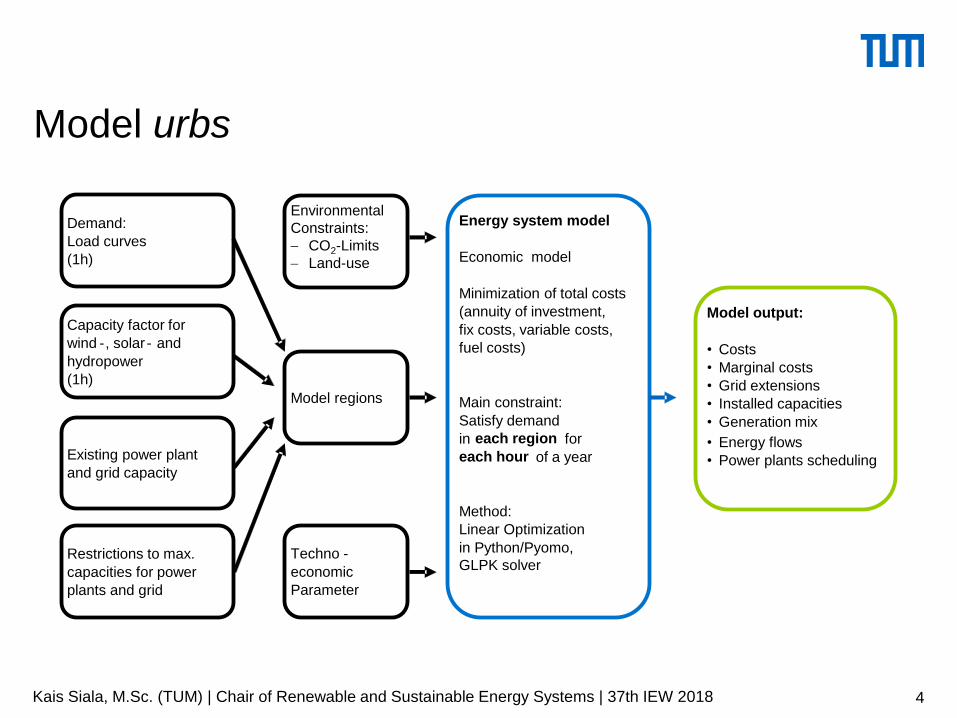
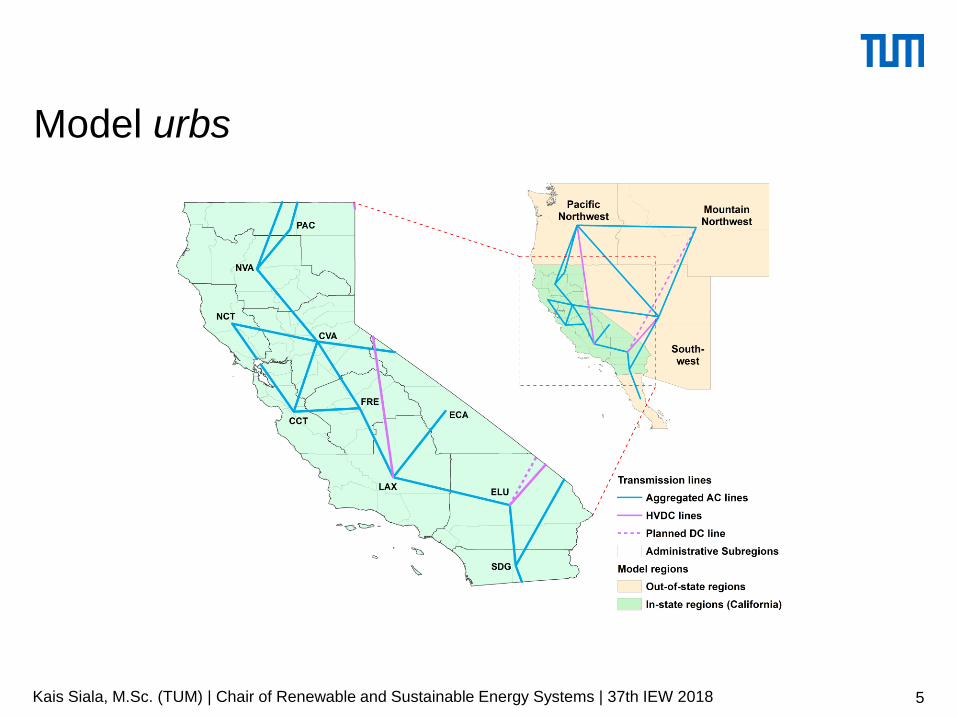
Model urbs
Source: Schaber 2010
Techno -
economic
Parameter
Demand:
Load curves
(1h)
Capacity factor for
wind -, solar - and
hydropower
(1h)
Existing power plant
and grid capacity
Restrictions to max.
capacities for power
plants and grid
Energy system model
Economic model
Minimization of total costs
(annuity of investment,
fix costs, variable costs,
fuel costs)
Main constraint:
Satisfy demand
in each region for
each hour of a year
Method:
Linear Optimization
in Python/Pyomo,
GLPK solver
Model regions
Environmental
Constraints:
CO2-Limits
Land-use
Model output:
• Costs
• Marginal costs
• Grid extensions
• Installed capacities
• Generation mix
• Energy flows
• Power plants scheduling
5Kais Siala, M.Sc. (TUM) | Chair of Renewable and Sustainable Energy Systems | 37th IEW 2018
Model urbs
6Kais Siala, M.Sc. (TUM) | Chair of Renewable and Sustainable Energy Systems | 37th IEW 2018
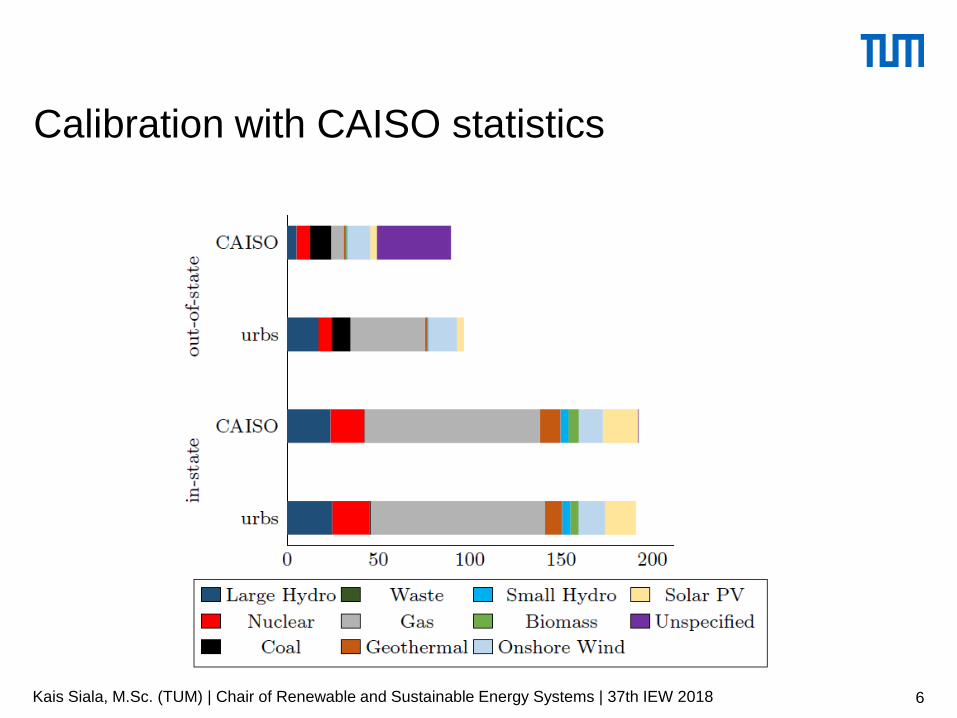
Calibration with CAISO statistics

7Kais Siala, M.Sc. (TUM) | Chair of Renewable and Sustainable Energy Systems | 37th IEW 2018
Optimal technology mix 2016-2050

8Kais Siala, M.Sc. (TUM) | Chair of Renewable and Sustainable Energy Systems | 37th IEW 2018
Sensitivity to battery costs
9Kais Siala, M.Sc. (TUM) | Chair of Renewable and Sustainable Energy Systems | 37th IEW 2018
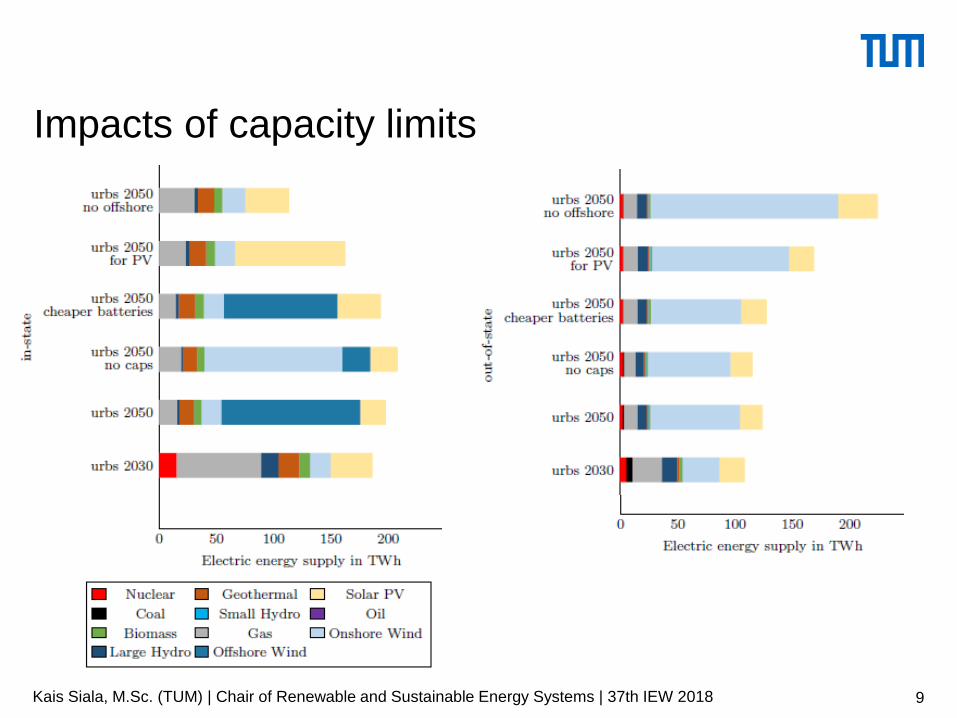
Impacts of capacity limits

10Kais Siala, M.Sc. (TUM) | Chair of Renewable and Sustainable Energy Systems | 37th IEW 2018
50% RPS Vs. carbon tax

11Kais Siala, M.Sc. (TUM) | Chair of Renewable and Sustainable Energy Systems | 37th IEW 2018
CO2 emissions
12Kais Siala, M.Sc. (TUM) | Chair of Renewable and Sustainable Energy Systems | 37th IEW 2018
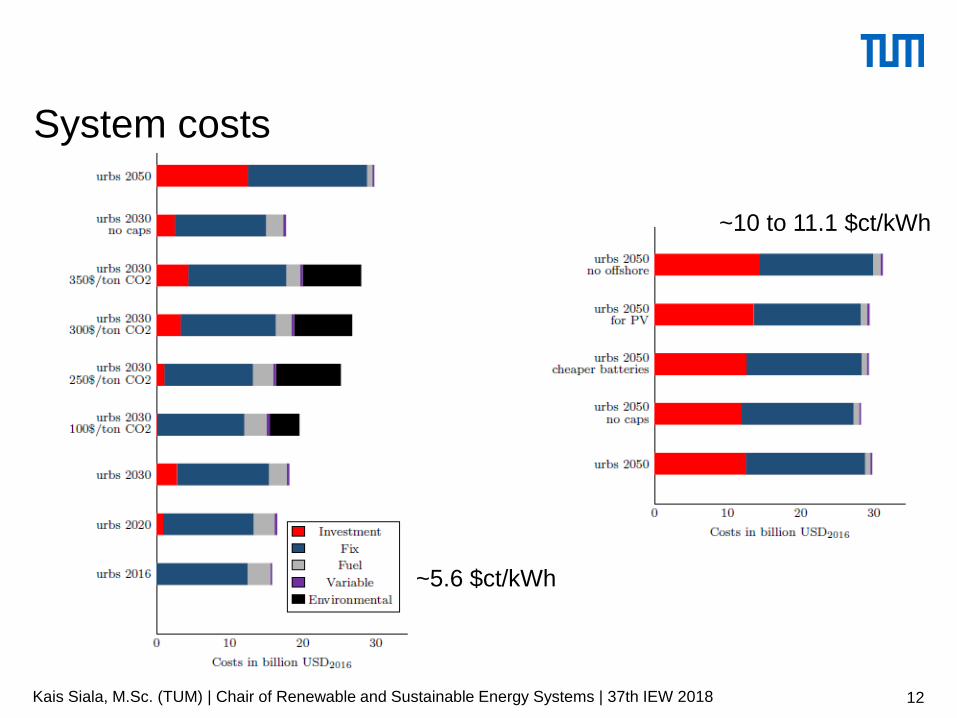
System costs
~10 to 11.1 $ct/kWh
~5.6 $ct/kWh

California is on track to achieve its 2020 targets.
Between 2016 and 2030, California has to install around 11.5 GW of PV and 1.3 GW of
onshore wind in-state, and will rely on additional 11.5 GW of out-of-state PV and 6 GW of
onshore wind from Wyoming. The system costs will increase by 15% compared to 2016.
Beyond 2030, floating offshore wind parks could play a major role. Otherwise: more in-state
onshore wind parks, or even more out-of-state generation. System costs double.
Whereas the carbon tax needs to be very high to achieve the 50% RPS goal (~300$/ton
CO2), it could lead to less carbon emissions and higher in-state power generation. The
power mix features a higher share of large hydro and nuclear energy, and less coal imports
from out-of-state regions.
The importance of battery storage correlates with the installed PV capacity.
13Kais Siala, M.Sc. (TUM) | Chair of Renewable and Sustainable Energy Systems | 37th IEW 2018
Conclusions

Annex
14Kais Siala, M. Sc. (TUM) | Chair of Renewable and Sustainable Energy Systems
15Kais Siala, M.Sc. (TUM) | Chair of Renewable and Sustainable Energy Systems | 37th IEW 2018
Scenarios
urbs 2016 : This corresponds to the state of the electricity system by the end of
2016. No expansion is allowed.
urbs 2020 : Same as 2016, with an updated list of power plants and storage
capacities. Planned power plants are included as minimum expansion targets,
whereas the only coal power plant in California and the rarely used geothermal
power plants (i.e. with a capacity factor lower than 40%) are decommissioned. Two
constraints are enforced: the RPS at 33% and a battery mandate at 1.325 GW. The
expansion of gas power plants and batteries is allowed in-state without a constraint.
The implementation of solar PV and wind are constrained to reflect land use
limitations and developing timeline of projects. Solar PV cannot expand more than
50% from the previous time step, and onshore wind cannot expand more than 25%.
Only solar PV and onshore wind are allowed to expand out-of-state, with no limit.
We assume average investment and fix costs for the period 2017-2020.

16Kais Siala, M.Sc. (TUM) | Chair of Renewable and Sustainable Energy Systems | 37th IEW 2018
Scenarios
urbs 2030 : Building on the development of 2020, we further update the capacities
of power plants and storage. Units that reached the end of their lifetime are retired,
and capacities that were recommended in the expansion planning of the previous
period are added. Two constraints are enforced: the RPS at 50% and a battery
mandate at 1.325 GW.We assume
average investment and fix costs for the period 2021-2030.
urbs 2050 : Same as 2030, with an updated list of power plants and storage
capacities. Two constraints are enforced: the RPS at 100% and a battery mandate
at 1.325 GW. We assume average investment and fix costs for the period 2031-
2050.