optogenetično praćenje električne aktivnosti neurona
TRANSCRIPT
Optogenetično praćenje električne aktivnosti neuronaprimjenom fluorescentnih voltažnih senzora
Trepotec, Željka
Master's thesis / Diplomski rad
2015
Degree Grantor / Ustanova koja je dodijelila akademski / stručni stupanj: University of Zagreb, Faculty of Science / Sveučilište u Zagrebu, Prirodoslovno-matematički fakultet
Permanent link / Trajna poveznica: https://urn.nsk.hr/urn:nbn:hr:217:509850
Rights / Prava: In copyright
Download date / Datum preuzimanja: 2022-02-22
Repository / Repozitorij:
Repository of Faculty of Science - University of Zagreb

Sveučilište u Zagrebu
Prirodoslovno – matematički fakultet
Biološki odsjek
Željka Trepotec
Optogenetic monitoring of neuronal electrical activity using
fluorescent protein – based voltage sensors
Master thesis
conducted at the Institute of Complex Systems (ICS-8), Forschungszentrum Jülich
Zagreb, 2015.

Ovaj rad je izrađen u Forschungszentrum Jülich, Njemačka, u laboratoriju na Institutu kompleksnih
sustava - bioelektronika, pod vodstvom dr.sc. Vanesse Maybeck. Rad je predan na ocjenu Biološkom
odsjeku Prirodoslovno-matematičkog fakulteta Sveučilišta u Zagrebu radi stjecanja zvanja magistar
molekularne biologije.

TEMELJNA DOKUMENTACIJSKA KARTICA
Sveučilište u Zagrebu
Prirodoslovno – matematički fakultet
Biološki odsjek Diplomski rad
OPTOGENETIčKO PRAdENJE ELEKTRIčNE AKTIVNOSTI NEURONA PRIMJENOM
FLUORESCENTNIH VOLTAŽNIH SENZORA
Željka Trepotec
Rooseveltov trg 6, 10000 Zagreb, Hrvatska
(94 stranice, 39 slika, 7 tablica, 78 literaturnih navoda, jezik izvornika: engleski)
Rad je pohranjen u Središnjoj biološkoj knjižnici.
Ključne riječi: akcijski potencijal, elektrofiziologija, AAV transdukcija, molekularno kloniranje, patch-
clamp, fluorimetrija
Voditelji: doc.dr.sc. Ivana Ivančid – Bade i dr.sc. Vanessa Maybeck
Ocjenitelji: doc.dr.sc. Ivana Ivančid – Bade, izv.prof.dr.sc. Dijana Škorid, doc.dr.sc. Duje Lisičid
Rad prihvaden: 05/02/2015
Unatoč dosadašnjim postignudima u neuroznanosti, pitanja koja motiviraju znanstvenike o
procesiranju informacija u neuronima još uvijek ostaju nerazjašnjena. Iako je proučavanje
pojedinačnih neurona olakšano in vitro istraživanjima, ono iziskuje upotrebu neinvazivnih metoda
visoke prostorne i vremenske rezolucije. Takva istraživanja omogudena su uvođenjem optogenetike
kao novi eksperimentalni alat u neurofiziologiji. U ovom radu opisana je primjena genetički
kodiranih fluorescentnih voltažnih senzora kao neinvazivno optogenetičko oruđe za bilježenje
elektrofizioloških signala u podražljivim stanicama. U neurone korteksa uneseni su rekombinantni
plazmidi hSyn_ArcLight i hSyn_Butterfly transdukcijom adeno – asociranim virusnim vektorima.
Nakon ekspresije u neuronima, proteini su evaluirani elektrofiziološkim eksperimentima;
električnom stimulacijom uz optičko bilježenje promjene fluorescencije. Time je dokazano da je
ArcLight-A242 pogodno oruđe za bilježenje i detekciju pojedinačnih akcijskih potencijala. Iako bez
značaja prema ovom istraživanju (zbog ograničenosti uređaja), Butterfly bi trebao biti još pouzdanije
oruđe za detekciju, pa čak i promjena u potencijalu ispod praga okidanja. Uz ove rezultate,
pretpostavka je da je optogenetika, obogadena za ove dvije komponente, korak bliže neinvazivnom
bilježenju električne aktivnosti neurona.

BASIC DOCUMENTATION CARD
University of Zagreb
Faculty of Science
Department of Biology Master Thesis
OPTOGENETIC MONITORING OF NEUONAL ELECTRICAL ACTIVITY USING PROTEIN –
BASED VOLTAGE SENSORS
Željka Trepotec
Rooseveltov trg 6, 10000 Zagreb, Croatia
(94 pages, 39 figures, 7 tables, 78 references, original in: English)
Thesis deposited in the Central Biological Library.
Keywords: action potentials, electrophysiology, AAV transduction, molecular cloning, patch-clamp,
Fluorometry
Supervisors: Dr. Ivana Ivančid – Bade, Asst. Prof. and Dr. Vanessa Maybeck
Reviewers: Dr.sc. Ivana Ivančid – Bade, Asst. Prof.; Dr.sc. Dijana Škorid, Assoc. Prof.; Dr.sc. Duje Lisičid,
Asst. Prof.
Thesis accepted: 05/02/2015.
Despite all the recent achievements in the neuroscience, the questions that have motivated
scientists about the information processing in individual neurons still remain unanswered. Studying
neuronal behaviour in vitro facilitates the availability of a single neuron investigation, but requires
non-invasiveness with high spatial and temporal resolution. Expansion of the neurophysiologic
recording toolbox with the optogenetic stimulation has enabled such recordings. The included work
shows the usage of genetically encoded voltage-sensitive fluorescent proteins as a non-invasive
optogenetic tool for recording electrophysiological signals in electrogenic cells. The cortical neurons
have been transduced with the new constructs, hSyn_ArcLight and hSyn_Butterfly by recombinant
adeno-associated viral vectors. These novel constructs, specifically expressed in the neuronal cells,
have been evaluated by electrophysiological experiments with electrical stimulations recorded
optically. It has been shown that ArcLight A-242 is a valuable tool for recording and detection of
single action potentials. Although not successful so far (due to the available equipment), Butterfly
should be an even more reliable tool for the detection of even sub-threshold potential changes.
Going forward, it might be assumed that the optogenetic toolbox, enriched by those two
components, is a step closer to non-invasive, optical monitoring of neural electrical activity.

5
Contents
Abbreviations .............................................................................................................................................. 7
1. INTRODUCTION ................................................................................................................................... 9
1.1. Cell anatomy and achieving directionality .................................................................................. 9
1.1.1. Network signalling ............................................................................................................. 11
1.2. Neural electric activity .............................................................................................................. 12
1.2.1. Ionic gradients ................................................................................................................... 15
1.2.2. Theoretical background .................................................................................................... 16
1.3. Voltage ...................................................................................................................................... 20
1.3.1. Voltage sensors ................................................................................................................. 20
1.3.2. Action potential ................................................................................................................. 22
1.4. Voltage sensitive fluorescent proteins ...................................................................................... 27
1.4.1. History of VSFP development ............................................................................................ 27
1.4.2. ArcLight A242 .................................................................................................................... 32
1.4.3. Butterfly 1.2 ...................................................................................................................... 34
1.5. Adeno – associated viral vectors ............................................................................................... 35
1.5.1. The structure ..................................................................................................................... 35
1.5.2. Serotypes and native tropisms .......................................................................................... 36
1.5.3. Life cycle ............................................................................................................................ 36
1.5.4. Recombinant AAVs ............................................................................................................ 38
1.6. Aim of the study ........................................................................................................................ 39
2. MATERIALS AND METHODS .............................................................................................................. 40
2.1. Cell culture ................................................................................................................................ 40
2.1.1. Embryonic rat cortical neurons ......................................................................................... 40
2.1.2. HEK293 cell line ................................................................................................................. 41
2.1.3. Escherichia coli bacteria culture ........................................................................................ 42
2.2. Molecular cloning – construction of the plasmids .................................................................... 43
2.2.1. psc_hSyn1_ArcLight .......................................................................................................... 43
2.2.2. pSub_hSyn1_Butterfly ....................................................................................................... 46
2.3. Recombinant DNA insertion ...................................................................................................... 48
2.3.1. Chemical transfection ....................................................................................................... 48

6
2.3.2. Electroporation ................................................................................................................. 49
2.3.3. AAV transduction .............................................................................................................. 50
2.4. The electrophysiology measuring setup: Voltage-clamp fluorometry technique...................... 51
2.4.1. Optics ................................................................................................................................ 51
2.4.2. Electronics ......................................................................................................................... 53
2.4.3. Data analysis ..................................................................................................................... 55
2.5. Live cell imaging setup .............................................................................................................. 56
3. RESULTS ............................................................................................................................................ 57
3.1. Molecular overview of the constructs ....................................................................................... 57
3.1.1. psc_hSyn_ArcLight construct .................................................................................................. 58
3.1.2. pSub_hSyn_Butterfly construct............................................................................................... 61
3.2. Transfection/transduction rates and viability ........................................................................... 63
3.2.1. FuGene transfection .......................................................................................................... 63
3.2.2. AAV transduction .............................................................................................................. 64
3.3. Electrophysiological results ....................................................................................................... 69
3.3.1. Voltage - clamp fluorometry ............................................................................................. 69
3.3.2. Local KCl stimulation ......................................................................................................... 72
3.4. Imaging in real time .................................................................................................................. 75
4. DISCUSSION ...................................................................................................................................... 78
4.1. Transfection/transduction rates and viability ........................................................................... 79
4.2. Electrophysiology results .......................................................................................................... 79
4.3. Imaging in real time .................................................................................................................. 81
5. CONCLUSION..................................................................................................................................... 82
6. BIBLIOGRAPHY .................................................................................................................................. 83
7. APPENDIX .......................................................................................................................................... 87
7.1. List of Tables ............................................................................................................................. 87
7.2. List of Figures ............................................................................................................................ 87
7.3. Protocols ................................................................................................................................... 89
7.3.1. Standard V-C protocol ....................................................................................................... 89
7.3.2. Stimulation V-C protocol ................................................................................................... 90
8. ACKNOWLEDGEMENTS ..................................................................................................................... 91
9. CURRICULUM VITAE .......................................................................................................................... 93

Abbreviations
A Alanine
Å Angstrom
AAV Adeno-Associated Viral Vectors
aqGFP Aequorea victoria Green Fluorescent protein
a.u. arbitrary units
C Cytosine
C Capacitance
cin Intracellular concentration of ions
Ci-VSP Ciona intestinalis voltage sensor protein
HCMV Human cytomegalovirus
Cout Extracellular concentration of ions
CT Computerised tomography
D Aspartic acid
DMEM Dulbecco’s Minimal Essential Media
DPT Days post-transfection / post-transduction
ds double-stranded
E-18 Embryonic day 18
ECM Extracellular matrix
EDTA Ethylenediaminetetraacetic acid
EPSP Excitatory PostSynaptic membrane Potential
FBS Fetal Bovine Serum
FRET Förster resonance energy transfer
FRET Förster resonance energy transfer
G Guanine
GBSS Gey’s Balanced Salt Solution
GEVI Genetically encoded voltage indicators
GFP Green fluorescent protein
GFP Green Fluorescent Protein
HBSS Hank’s Balanced Salt Solution
HEK Human Embryonic Kidney
HEPES 4-(2-hydroxyethyl)-1-piperazineethanesulfonic acid
hSyn1 human Synapsin
ITR Inverted Terminal Repeat
k x1000
kb kilobase pairs
LB Luria Broth
MOI Multiplicity Of Infection
MRI Magnetic Resonance Imaging

N.A. Numerical Aperture
NB Neurobasal medium
PCR Polymerase Chain Reaction
PDL Poly–D-Lysine
PET Positron emission tomography
PIP2 Phosphatidilinositol (4,5) - bisphosphate
PIP3 Phosphatidilinositol (3,4,5) - trisphosphate
PLL Poly–L-Lysine
R Resistance
rAAV recombinant Adeno-Associated Viral Vectors
Rm Membrane resistance
ROI Region Of Interest
RT Room temperature
sc self-complementary
SE Standard Error
SNR Signal - to - Noise Ratio
SOC Super Optimal broth with Catabolite repression medium
ss single-stranded
SV40 Simian virus 40
TTL Transistor-Transistor-Logic
UV Ultraviolet
V Voltage
V-C Voltage-clamp
vp/cell virus particle per cell
VSFP Voltage Sensitive Fluorescent Protein
YFP Yellow Fluorescent Protein
Ω Ohm

INTRODUCTION
9
1. INTRODUCTION
1.1. Cell anatomy and achieving directionality
When there is a question about the definition of life, one can take a stand from variety of
perspectives – scientific, philosophical, or even religious; but the fact they all have in common is that the
cells are the major players in the game called life. Cells, as a very first product of evolution 3,5 billion
years ago [1], rightly have been called a “fundamental unit of life”. In the eras that followed, under the
forces of the evolutionary change, they developed from primitive, prokaryotic cells that lack membrane
bound organelles to sophisticated, eukaryotic cells. Their defining characteristic is organelle-rich
membrane-bounded machinery that provides advantage by separation of functional compartments.
Eukaryotic cells can dwell as unicellular organisms (single cell heterotrophic eukaryotes that belong to
any of the major lineages of protists) or can be hierarchically embedded in multicellular organisms.
Depending on the cell determination and niches where they dwell, every subtype is partially responsible
for general homeostasis of the organism.
Due to the vast complexity of thought processes and control actions that the neural system can
perform [2], it is not surprising that neurons, as a basic unit of the information conducting system, have
sensitive mechanisms of activation, regulation and signal propagation (briefly described in 1.3.2).
Despite distinct morphological regions, there is a certain functional anatomy they all follow in order to
achieve their specific function (Figure 1.1). As every eukaryotic cell, they contain the nucleus and other
organelles necessary for cellular function in the cell body, aka soma. The thin, multiple branched
appendages of a neuron, dendrites, are the region where electrochemical signals from other neurons
are received. In order to increase the receptive surface area of a neuron, they branch in an iterative
form. The key fibre for signal transmission, the axon, extends from the soma, generally opposite the
dendrites. The axon ends with the terminals that transmit the electrochemical signal across the gap
between cells, the synapse. There, one neuron forms a connection with another one and conveys
information through the process of synaptic transmission [3].

INTRODUCTION
10
Figure 1.1 The structure of a typical neuron.
The cortical neuron consists of a cell body (or soma) with branching dendrites (signal receivers), and an axon (signal output). The axon is insulated by Schwann’s cell-produced myelin. Unmyelinated points are the nodes of ranvier. After the myelinated region, the axon terminal releases chemical transmitters into the synapse.
(Figure originally published in [4])
Inside, the axon is filled with a viscous intracellular fluid called axoplasm, so the actual conductor of the
action potential is the membrane of the axon [5]. The axon may be insulated by the supporting,
Schwann’s cells in the peripheral nervous system or oligodendrocytes in the central nervous system [6].
As it is described later, in 1.2.2, in uninsulated axons there is an impact of membrane leakage on the
propagation of the signals. The main component in glial membranes is sphingomyelin (or ceramide
phosphorylcholine), the complex lipid in which fatty acids are linked via amide bonds to a long-chain
base or sphingoid [7]. Since the lipid serves as an excellent electrical insulator, it speeds the rate of the
electrical impulse transmission along the axon, decreasing ion flow through the membrane about 5000-
fold [2]. In the myelinated axon, what was empirically confirmed, the rate of an impulse propagation (in
m) is six times the diameter of the axon (in µm). It is known as the “Hursh factor” [8]. Thus, the largest
axons in the mammalian nervous system are approximately 20 µm in diameter, and their conduction
rate is approximately 120 ms-1, whereas the thin myelinated axons of about 1 µm in diameter have
conduction rates of approximately 5 to 10 ms-1 [9]. Between myelin sheath cells along the axon there
are small, uninsulated junctions, called the node of Ranvier. At these 2 to 3 micrometres long gaps,
where there is no myelin cover, ions still can flow through the axon membrane [10]. There, the density

INTRODUCTION
11
of voltage sensitive Na+ channels is very high (10,000 µm-2), in comparison to the internodal membrane
where it is very low (20 µm-2) [11]. Therefore, action potentials occur only at the nodes, while the
electrical potential propagates from the both sides of the myelin; through the surrounding extracellular
fluid as well as through the axoplasm, causing the impulse to jump and excite one node after another.
This mechanism, called saltatory conduction, greatly increases the velocity of nerve signal transmission,
as it affords excellent insulation, and reduces the metabolic energy required for re-establishing ion
concentrations [2]. Additionally, specific membrane resistance (Rm) at the node is estimated to be only
50 Ωcm2, what reduces the time constant and enables the nodal membrane to charge and discharge
quickly [11].
1.1.1. Network signalling
All neurological processes are dependent on complex cell-cell interactions among single neurons as
well as their networks. They can be categorised according to variety of features which are important
determinants of the particular function. Along with the cardiomyocytes, skeletal myocytes and
electrocytes, they are grouped as electrogenic cells; they share a property of electrical conductivity and
morphology that can be equated with an electrical conductor.
Within the structural variation that depends on the niche and functionality that neurons cover,
they can be categorised into three descriptive cell types [11]. Bipolar neurons have two extensions on
opposite sides, an axon and a dendrite, and typically communicate with other cells in the nervous
system through chemical signalling. They are exclusively involved in sensory transmission like retinal or
olfactory neurons. In pseudo-unipolar sensory neurons only one neurite extends and branches from
the cell body, so that both sides of the cell function as a single axon. Embryonically, they originate as
bipolar neurons. Their specific structure is suitable for transducing sensory signals of physical stimulus
(e.g. temperature, pain, light, sound). Multipolar neurons are the most common type and constitute the
majority of neurons in the central nervous system. They have one axon and numerous dendrites in order
to integrate a great deal of information from other neurons. [10, 11] (Figure 1.2).

INTRODUCTION
12
Figure 1.2 Three types of neuron morphology
Bipolar and pseudo-unipolar neurons are involved in sensory transmission directed to specific cells, while motor neurons constitute the majority of neurons in the brain. They have one long axon and many dendrites, what gives them possibility to make many contacts and receive plenty of information with multiple cells at once.
(Figure adapted from [12])
As the basic unit of neuronal information, there is an action potential. It is an event in which the
membrane electrical activity is affected by the rapid rise and fall of the potential (1.3.2). The signal
propagation plays the key role in the cell to cell communication.
1.2. Neural electric activity
The cell membrane and membrane potential
As the old adage “Good fences make good neighbours” makes clear, boundaries can be very
influential. On the cell level, the identity and individuality that each cell possesses is conditioned by the
plasma membrane, an essential boundary between the extracellular environment and the cytosol [5].
Although it defines the cell border and has an impact on cell stability and shape, the membrane is
characterised as a dynamic, fluid structure with freely movable components within the membrane
plane. Biomembranes, according to the order and fluidity, are classified as smetic liquid crystals; they
Axon terminals
Direction
of the
impulse
Dendrites

INTRODUCTION
13
have a lower degree of order than crystalline solids, but a higher degree than liquids, due to the parallel
alignment of elongated phospholipid molecules [13].
As a universal component that constitutes 50% of the membrane mass, there is a phospholipid
bilayer. Amphipathic phospholipids have two main parts: a polar, hydrophilic head (phosphate group)
and two hydrophobic non-polar hydrocarbon tails (usually fatty acids). The bilayer is formed in a way
that the hydrophobic tails are sandwiched between the hydrophilic phosphate heads, with the heads
facing the aqueous environment of the cytosol and extracellular fluid. For the membrane composition it
was widely accepted that lipids and proteins were randomly distributed, according to the Singer-
Nicolson fluid mosaic model [14]. However, from attempts to explain how lipids could selectively direct
proteins to different surfaces [15] it is assumed that the membrane lipids are organised into
microdomains or rafts [16], which serve as anchorage points for specific signalling molecules [13, 17].
Despite phospholipids being the most prevalent component in the membrane, the most
important functional characteristics are conferred by the protein composition. The quantity of proteins
present is highly variable - from 20% to 75% of the mass [2, 13], depending on the cell type and
subcellular location. The proteins, based on their structure, associate with the membranes in different
ways (Figure 1.3). There are several ways for proteins to interact with the membrane. Proteins that are
localised and confined to either the cytosolic or exoplasmic side are peripheral proteins, and they are
usually bound to the membrane indirectly, through electrostatic interactions and hydrogen bonding
with the hydrophilic domain of integral proteins [18]. The other group of proteins, the amphitropic
proteins, are attached to the membrane via covalent bonds to a lipid anchor by a mechanism involving
post-translational modifications of these proteins [19], so the polypeptide chain does not enter the
membrane itself. Features of the amphipathic proteins enable them to integrate into the hydrophobic
moiety of the biomembranes. These transmembrane proteins consist of three domains and span
through the phospholipid bilayer. The cytosolic and exoplasmic domains are hydrophilic and therefore
interact with the aqueous solution, while hydrophobic domain is embedded in the lipid core of the
membrane [13]. The way in which protein is associated with the lipid bilayer reflects the function of the
protein. Indeed, the only proteins that can serve as transit conduits through the plasma membrane are
transmembrane proteins.

INTRODUCTION
14
Figure 1.3 Scheme of the cell membrane and its components.
The cell membrane is a semipermeable lipid bilayer that consists of hydrophobic fatty acids (orange lines) sandwiched between the hydrophilic phosphate heads (red dots) faced towards the cytosolic and extracellular side. It has variety of incorporated or attached proteins (blue forms), glycolipids (green dots) and carbohydrates (dark blue forms).
(Figure originally published in [20])
There are two major classes of transmembrane proteins that move substances into or out of the
cell: channels and carriers. Carriers undergo a series of conformational changes in order to actively
perform the transfer across the membrane, while channels form a hydrophilic pore across the lipid
bilayer through which specific solutes can freely pass to the other side of the membrane [2]. According
to the transport efficiency, channels have an advantage over carriers; the rate of transport is several
orders of magnitude greater than the fastest rate of transport mediated by carrier proteins [5]. Besides,
their other advantage is in rapid flux down the electrochemical gradient across the lipid bilayer. Also,
channels are non-saturating; the rate does not approach a maximum at high substrate concentration
[18]. Unlike carriers, ion channels are passive; they do not require a source of energy for their
functionality. Thereby, the force that drives the ion through the channel is an electro–chemical gradient;
the combination of the ion concentration gradient and electrical transmembrane potential [21].
Ion–selective channels, proteins specific for inorganic ion transport, first have been recognised
in neurons [22]. Nowadays, they are known to be present in all eukaryotic biomembranes. Together
with ion pumps, like Na+K+ATPase, they regulate the plasma membrane’s permeability to specific ions.
INTRODUCTION
15
The resulting cytosolic ion concentrations are responsible for the membrane potential [18], what is
described later in chapter 1.2.1.
One kind of ion channels is the ligand–gated channels. Allosteric transition in the protein that
opens or closes the channel is dependent on extracellular or intracellular ligand binding. To this group
belong most of the neurotransmitter receptors, like serotonin or glutamate receptors [23]. They provide
the transport of the chemical signals between bipolar neurons, as mentioned in 1.1.1.
An alternative type of ion channel is the voltage gated channel. In voltage-gated ion channels,
opening or closing the channel is conditioned by the change in transmembrane electrical potential (Vm).
If it is assumed that the resting potential across the membrane is about -60mV, considering the
thickness of the membrane of 6 nm, the voltage drop is very steep and the potential gradient of -60 mV
works out to 105 Vcm-1 [13].
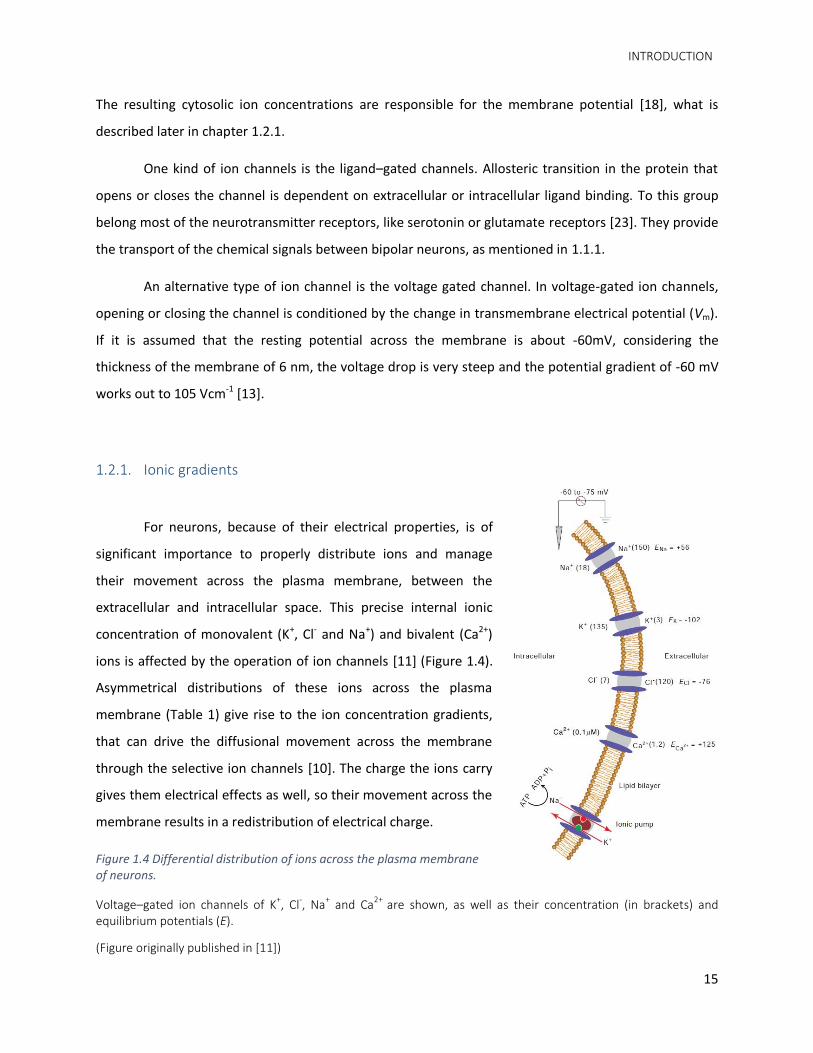
1.2.1. Ionic gradients
For neurons, because of their electrical properties, is of
significant importance to properly distribute ions and manage
their movement across the plasma membrane, between the
extracellular and intracellular space. This precise internal ionic
concentration of monovalent (K+, Cl- and Na+) and bivalent (Ca2+)
ions is affected by the operation of ion channels [11] (Figure 1.4).
Asymmetrical distributions of these ions across the plasma
membrane (Table 1) give rise to the ion concentration gradients,
that can drive the diffusional movement across the membrane
through the selective ion channels [10]. The charge the ions carry
gives them electrical effects as well, so their movement across the
membrane results in a redistribution of electrical charge.
Figure 1.4 Differential distribution of ions across the plasma membrane of neurons.
Voltage–gated ion channels of K+, Cl-, Na+ and Ca2+ are shown, as well as their concentration (in brackets) and equilibrium potentials (E).
(Figure originally published in [11])

INTRODUCTION
16
Table 1. Major ionic components of intra and extracellular fluids and their equilibrium potential.
Despite their different role and compartmentalisation, the intracellular and extracellular fluid diverse in the
composition as well. Except for the difference in sodium and potassium ion concentration that are important for
keeping the balance of the negative membrane potential, the low intracellular calcium concentration compared to
extracellular enables its role as the second messenger. Higher amount of charged macromolecules in intracellular
fluid is critical for osmoregulation inside the cell. To emphasize the chemical power of the electrolyte in a fluid, the
ion concentrations are given in miliequivalent per liter (10-3 mole divided by valence) [24]. The equilibrium
potential for some ions are left out due to their little contribution to the resting membrane potential.
Table originally published in [24].
Ion Intracellular concentration
(mEq/L)
Extracellular
concentration (mEq/L)
Equilibrium potential
(mV)
Na+ 15 140 70
K+ 135 4 -94
Ca2+ 2x10⁻⁴ 4 132
Mg2+ 40 2
Cl- 4 120 -90
HCO3- 10 24
HPO42- 20 4
SO42- 4 1
Proteins-, Amino
acids-, Urea, etc.
152 1
1.2.2. Theoretical background
The condition in which the electrochemical gradient (also called the diffusion potential) of a species is at
equilibrium across and through the membrane is described by the Nernst equation. The Nernst
potential, however, is determined by the ratio of the concentrations of that specific ion on the two sides
of the membrane [2, 21]. In a physiological application, it is used to calculate the potential of an ion of
charge z across the membrane:
𝐸 =−𝑅𝑇
𝑧𝐹𝑙𝑜𝑔10
𝑐𝑖𝑛
𝑐𝑜𝑢𝑡 Equation 1

INTRODUCTION
17
where E is the membrane potential (V), R the ideal gas constant (J K-1mol-1), T thermodynamic
temperature (K), z the ion valence, F Faraday’s constant (C mol-1), 𝑐𝑖𝑛 the intracellular concentration of
ions (moles l-1) and finally, 𝑐𝑜𝑢𝑡 the extracellular concentration of the particular ion (moles l-1).
Expanding the Nernst equation to include the contribution of the most relevant ionic species
across the membrane, one arrives at what is termed the Goldman–Hodgkin–Katz equation. It describes
the ionic flux carried by ionic species across the cell membrane at the steady state potential, including
the relative permeability of the membrane for each of those ions (K+, Na+, Cl-):
𝑉𝑚𝑅𝑇
𝐹𝑙𝑛
𝑝𝐾 𝐾+ 𝑜 + 𝑝𝑁𝑎 𝑁𝑎+ 𝑜 + 𝑝𝐶𝑙 𝐶𝑙− 𝑖
𝑝𝐾 𝐾+ 𝑖 + 𝑝𝑁𝑎 𝑁𝑎+ 𝑖 + 𝑝𝐶𝑙 𝐶𝑙− 𝑜
Equation 2
where, along already listed measurements and units (𝐸=−𝑅𝑇
𝑧𝐹𝑙𝑜𝑔10
𝑐𝑖𝑛
𝑐𝑜𝑢𝑡
Equation 1above), 𝑝𝑖𝑜𝑛 represents the membrane permeability for that specific ion (ms-1).
It is assumed that the relative contribution of each ion is determined by its concentration
difference across the membrane and the relative permeability of the membrane to the each type of ion.
As described in 1.2, ions can pass from one side of the membrane to the other by specific
transmembrane proteins; either freely gated through the channels down their electrochemical gradient
or actively by carriers. Voltage-gated channels open and close in response to membrane potential. At
the resting potential, voltage-gated ion channels are in deactivated state (closed) and no ions move
through them. For the three ionic species with greatest impact on membrane potential, K+, Na+ and Cl- at
20˚C the equation is:
𝑉𝑚 =58.2 𝑙𝑜𝑔10 {(1⋅20+0.04⋅440+0.45⋅40)
(1⋅400+0.04⋅50+0.45⋅560)}= −62 mV Equation 3
This result suggests that the membrane should have resting membrane potential at -62 mV [11].
Excitable membranes can be compared to capacitors due to their possibility to store energy in
the form of electrochemical gradient that can be discharged to transmit electrical signals [24]. Described
in the terms of electronics, the pores form a conductive branch in parallel with the capacitive lipid
bilayer (Figure 1.5) [24].

INTRODUCTION
18
Figure 1.5 Schematic view of plasma membrane in 3D, with salient Na+ and K+ voltage-gated ion channels (a) and analogous electrical circuit (b).
The plasma membrane has properties similar to an electrical circuit with a capacitive branch (CM), sodium and potassium selective ion channels with conductive branches (gNa and gK) as well as their equilibrium membrane potential that corresponds to an electromotive force (ENa and EK).
(Figure originally published in [24])
A membrane containing ion channels can also be represented as a resistor, whereby the resistance
decreases with more channels that are open. To predict current flow during the channel opening, Ohm’s
law is used. According to it, the electromotive force or voltage (V) and current (I) are directly related to
each other by resistance (R): [25]
𝐼 =𝑉
𝑅 Equation 4
To calculate the electric current and accompanying voltage along neurites, particularly dendrites that
receive synaptic inputs, one uses the mathematical model named “classic cable theory”. It is actually a
set of assumptions and results related to the propagation and interaction of electrical signal in spatially
expanded neurons. It has been developed over the last decade because the dendrites’ distal synapses
are out of reach of traditional electrophysiological studies using electrodes at the soma. It assumes that
the extracellular space around the membrane acts as a perfect resistor, ignoring the unknown impact of
its other electrical properties such as capacitive effect, diffusion etc. [26]. Essentially, the axons and

INTRODUCTION
19
dendrites are assumed to be cylinders with capacitance Cm due to the electrostatic forces acting through
the lipid bilayer and resistance rm due to the axoplasm’s resistance to movement of electrical charge,
combined in parallel (Figure 1.6). Written in mathematical terms, the equation would look like this:
𝐼𝑚 =(𝑉𝑚− 𝑉𝑟𝑒𝑠𝑡 )
𝑟𝑚 Equation 5
Figure 1.6 Cable theory's simplified view of a neuronal fiber as an electric circuit.
Uniform cylinder represents a segment of axon or dendrite. The upper side looks towards the extracellular fluid and in the cylinder is the cytoplasm. Compartments are spatially adjacent to each other and coupled through a linear resistance form. Signals decay over space and time in a mathematically understood fashion.
(Figure originally published in [27])
The cable properties of neurons determine the spread of action potentials along the axons
(Figure 1.6). The premise for cable theory is that the dendrites have properties of a leaky electrical
cable, such as low electrical resistivity of the axoplasm and high resistivity of the membrane. However,
one of the key features of the membrane, which despite high resistivity cannot completely block the
leakage of the current, is accounting for signal decay. These parameters are important in determination
of the current flow because they direct the flow of the current across the membrane rather than down
the axis of the dendrite. Additionally, the cable diameter has impact on the current flow as well; the
signal spreads farther in a thick dendrite, resulting in more current flow towards the soma. During the
signal transmission, the transmembrane voltage falls off exponentially with distance. Furthermore, the
branches in the dendritic tree increase attenuation of the voltage signals. An important addition to the
theory is to include the time component. Namely, the frequency of the signal affects its transmission. If
there is a low-frequency of the depolarisation of excitatory postsynaptic membrane potential (EPSP),
they are lost to membrane capacitance and there is less voltage change along the dendrite. As the

INTRODUCTION
20
dendrites act as low-pass filters, they let more slowly changing signals pass, compared to rapidly
changing one [28]. Thus, the accumulation of the low-frequency signals, as a passive event, enables
sufficient membrane depolarisation to reach above the threshold and initiate an action potential (Figure
1.7).
Figure 1.7 A model of the EPSP conductance
Once the EPSP response hits the threshold, the action potential will occur.
(Figure originally published in [29])
1.3. Voltage
1.3.1. Voltage sensors
In excitable cells, the most astonishing property of ion channels is their sensitivity to small
changes in membrane potential. As a functional condition for the cell is underlying in dynamic
equilibrium, the same can be perceived for ion concentration from both sides of the membrane. Due to
the great difference in the ion concentration across the plasma membrane, the electric potentials differ
as well. Their sudden change has an impact in achieving the signal generation and propagation. Thus,
the ion channels need to be able to selectively block or allow ion flow.

INTRODUCTION
21
Voltage sensitive proteins have linked a sensor domain (Figure 1.8) whose task it is to detect certain
conditions like voltage or pH changes to their other functional domains [21]. The S4 sensor domain is
responsible for detecting small gating current at the beginning and end of any small depolarisation. The
exact biophysical mechanism is still under investigation, and there is still no consensus model, but a
huge advance happened with elucidation of finer structural information at atomic level of the voltage-
gated potassium channel in 2003, courtesy of the MacKinnon laboratory [30].
Figure 1.8 Model of a voltage-gate potassium channel subunit in the plasma membrane.
Six transmembrane segments, S1-S6 (cylinders), of which S3 is divided into two helices, S3a and S3b (blue) are positioned in between the plasma membrane (horizontal lines). The S4 segment (red) is situated among S3 and S5 segment.
(Figure adapted from [30])
In the primary sequence of S4, there are positively charged amino acids on every third place; it
exhibits a homologous pattern of positive charge distribution of 83% [31]. Projected into secondary
structure, an Arg-containing α-helical conformation is assumed. These crucial amino acids are arranged
in the same planar direction [13]. In the lipid bilayer, they are stabilised with negatively charged amino
acids originating from the other domains of the transmembrane ion channel. Arginine actually maintains
the structure by electrostatic interactions in a manner that inside negative transmembrane potential
exerts a pull on positively charged Arg side chains in S4. When the membrane is depolarised and
negative potential is reduced, the inward pull is lessened for 5Å [32] (Figure 1.9). Thus, the N-terminus
of S4 screws outwards for a 60° turn, to the extracellular side through a short hydrophobic gating pore.
This results in displacement of 5Å [13, 18]. This conformational change leads to physical opening and
closing of the ion channel.

INTRODUCTION
22
Figure 1.9 Conventional model of voltage sensor movement during depolarisation.
Four subunits are shown in order to expose the gating pore. Voltage changes move the N-terminal extracellular portion of the S4 segment (red) through a hydrophobic gating pore, opening or closing the permeation pathway.
(Figure adapted from [30])
1.3.2. Action potential
The discovery and understanding of electricity itself has helped a number of notable scientists to
contemplate about the nature of nerve communication – the flow of an action potential. During the
second century A.D. in ancient Greece, the cradle of science, the great physician Claudius Galen
prospered that “humors” flowed from the brain to the muscle [11], what indicates that even then
people were intrigued with informational pathways in human bodies. With improvement in
experimental techniques, scientists, including Luigi Galvani, Emil Du Bois-Reymond, Hermann von
Helmholtz and many others, examined this idea [11]. Hodgkin and Huxley however, gave the final proof
– recording of the action potential, which signified the start of modern electrophysiology, in the early
1950s [13]. Their work not only forms the basis of the classical electrophysiology that has been in use for
more than 50 years, but also gave us a theoretical framework for many properties that have since been
verified [33]. Using an electrode placed inside a giant squid axon they were able to record the shape of
the action potential and determine the nature of the ion flows, as well as measure transmembrane
potential of about -60 mV under resting conditions [34]. The original photo from their experiments
(Figure 1.10) shows when an impulse of action potential passes the measured part of the membrane,
the internal electrode measures +35 mV compared to the external electrode because the membrane
potential is reversed. Shortly after (1,5 ms), the membrane has returned beneath its resting potential,

INTRODUCTION
23
and afterwards (1-2 ms) the normal resting potential is re-established [13]. For their work, they were
awarded the Nobel Prize in Physiology or Medicine in 1963 [10].
Figure 1.10 Action potential recording between inside and outside of a giant squid axon.
Time marker at the bottom indicates 500 cyc./s. The vertical scale on the top indicates the potential of the internal electrode in millivolts. As the zero potential, the seawater outside was being taken.
(Figure originally published in [35])
In the normal, resting stage, preceding the action potential, the membrane is polarised to
around -60 mV [13]. A local change in membrane polarity or a local depolarisation which is insufficient
to pass the threshold potential causes a subthreshold potential. When there is enough accumulation of
depolarisation, a rapid rise in the membrane potential above the threshold, an action potential is
initiated. The principle of generating an action potential is so called “all-or-none principle” since they
occur fully or do not occur at all. Just as quickly as the potential is generated, it drops (repolarisation)
and overshoots reaching the more negative potential values than when resting, called hyperpolarisation.
Finally, it returns towards resting potential. Starting at the axon hillock with a sufficiently strong
depolarisation, an action potential is generated reaching the peak where the second phase of potential
drop (repolarisation) starts; reaching the more negative membrane potential then in the resting stage
(hyperpolarisation) and returning towards resting potential (Figure 1.11) [2].

INTRODUCTION
24
Due to the voltage-gated sensory properties of sodium channels described in previous chapter
(1.3.1), they detect small depolarisations in transmembrane voltage. Triggering this sensor promotes
their opening through a conformational change and the membrane suddenly becomes permeable to
sodium ions, allowing them to diffuse inside the membrane [36]. Inflow of positively charged sodium
ions raises the potential rapidly. If the depolarisation is below the threshold value (at about -45 mV), the
outward potassium current overwhelms the inward sodium current and the membrane repolarises back
to its normal resting potential. This state is called sub-threshold depolarisation. In contrast, if the
threshold value is reached, the inward sodium current increases more than the outward potassium,
which leads to higher Vm increase. That in turn causes more sodium channels to open and even higher
Vm and as such, the action potential is termed an “all-or-nothing” response; once threshold is reached,
the full action potential is always generated. With this, the initial phase called depolarisation, where
there is sudden change in potential from -60 mV to +40mV, starts. This positive feedback continues until
the sodium channels are fully open, sodium permeability is maximised and Vm is close to the sodium
equilibrium voltage, ENa [37]. Then, there is the peak of the action potential. Near the peak of the action
potential, calcium channels begin to be activated [38]. Calcium currents are the largest during the falling
phase, when channels have been opened. This reflects powerful and rapid coupling of calcium entry to
the activation of large conductance calcium-activated-potassium channels, what will have large impact
in the hyperpolarisation phase [38].
A return towards the resting membrane potential happens in the repolarisation stage. In a very
short period of time (1 ms) after opening, the sodium channels switch to a conformation that no longer
allows Na+ to pass, because of their inherent properties, although the membrane is still depolarised [37].
The other set of voltage-gated ion channels that participate in repolarisation are potassium channels.
The required time for reaching the threshold to open the channels is the time when Na+ flows into the
cell and increases the membrane potential. Afterwards, potassium channels open and increase the
membrane permeability for K+ ions. K+ ions outflow from the neurons bring the membrane potential
towards EK. These changes cause a quick drop of Vm and thus, membrane repolarisation [37].
Unusually high membrane permeability for K+ ions even after the repolarisation stage leads to
the next stage, called hyperpolarisation. This is caused by slow inactivation of K+ ion channels, as well as
their further opening due to the Ca2+ influx during the action potential [34], as mentioned above. This
can result in an undershoot of the resting membrane potential, generating after-hyperpolarisation [37].
Transiently hyperpolarised membrane recovers over about 10 ms [38]. During this relative refractory

INTRODUCTION
25
period during which the neurons are unable to generate an action potential, ions are redistributed until
the membrane potential reaches -70 mV. This is the mechanism of recuperation of ion channels and an
initiation of the second action potential is inhibited. In the absolute refractory period, though, a second
action potential cannot be initiated due to the Na+ channels inactivity and lasts the entire duration of
the action potential.
Figure 1.11 Schematic of a neuronal action potential.
If the stimulus reaches the threshold value (for example -55 mV), voltage gated sodium channels change conformation so the membrane becomes permeable to Na+ ions. Inflow of Na+ raises the potential to +40 mV (depolarisation). Repolarisation occurs when sodium channels rapidly close and potassium channels open. Their rapid outflow re-establishes the normal resting membrane potential (-70 mV). Slow inactivation of potassium channels causes hyperpolarisation. After a few milliseconds of relative refractory period, the membrane returns to resting potential.
(Figure originally published in [39])
Under physiological conditions, propagation of the action potential is unidirectional, ensured by
the absolute refractory period mentioned above. The flow of current is spread out in both directions
along the axon, but only an unfired part can respond with an action potential. The reason for this is
inactivation of Na+ channels in the part where action potential already happened and the local current
circuit that is primarily outward flowing K+ ions that repolarise the membrane [10].
INTRODUCTION
26
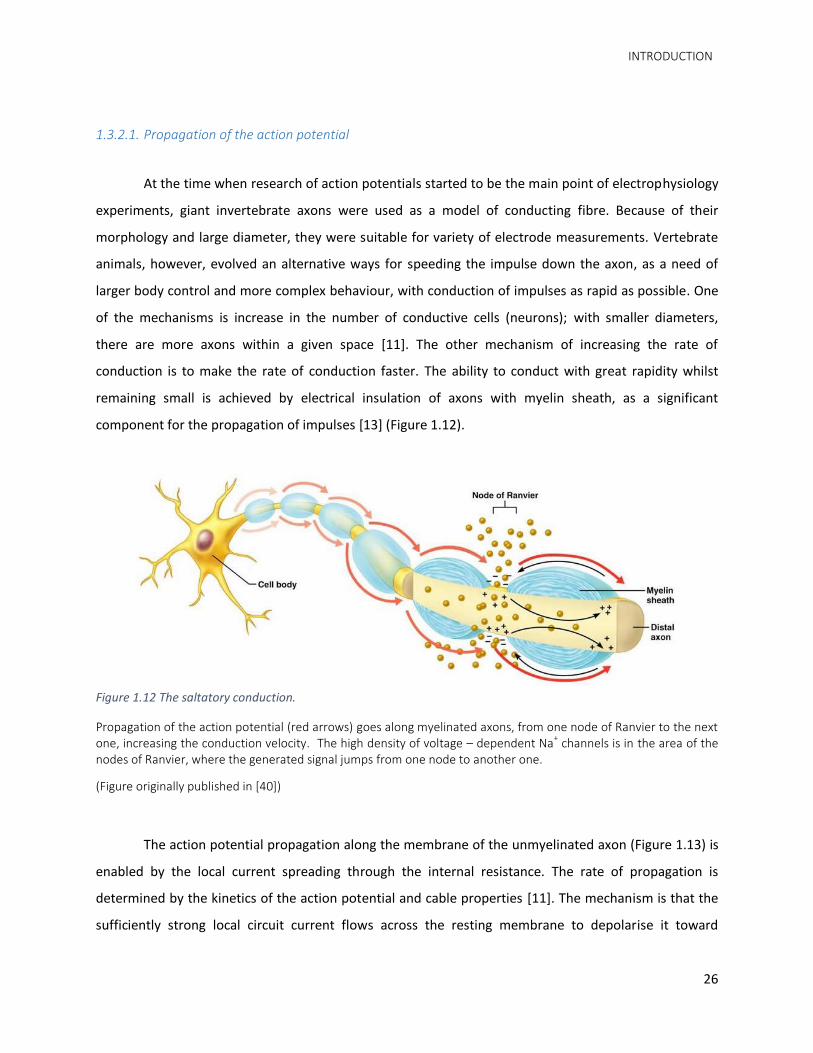
1.3.2.1. Propagation of the action potential
At the time when research of action potentials started to be the main point of electrophysiology
experiments, giant invertebrate axons were used as a model of conducting fibre. Because of their
morphology and large diameter, they were suitable for variety of electrode measurements. Vertebrate
animals, however, evolved an alternative ways for speeding the impulse down the axon, as a need of
larger body control and more complex behaviour, with conduction of impulses as rapid as possible. One
of the mechanisms is increase in the number of conductive cells (neurons); with smaller diameters,
there are more axons within a given space [11]. The other mechanism of increasing the rate of
conduction is to make the rate of conduction faster. The ability to conduct with great rapidity whilst
remaining small is achieved by electrical insulation of axons with myelin sheath, as a significant
component for the propagation of impulses [13] (Figure 1.12).
Figure 1.12 The saltatory conduction.
Propagation of the action potential (red arrows) goes along myelinated axons, from one node of Ranvier to the next one, increasing the conduction velocity. The high density of voltage – dependent Na+ channels is in the area of the nodes of Ranvier, where the generated signal jumps from one node to another one.
(Figure originally published in [40])
The action potential propagation along the membrane of the unmyelinated axon (Figure 1.13) is
enabled by the local current spreading through the internal resistance. The rate of propagation is
determined by the kinetics of the action potential and cable properties [11]. The mechanism is that the
sufficiently strong local circuit current flows across the resting membrane to depolarise it toward
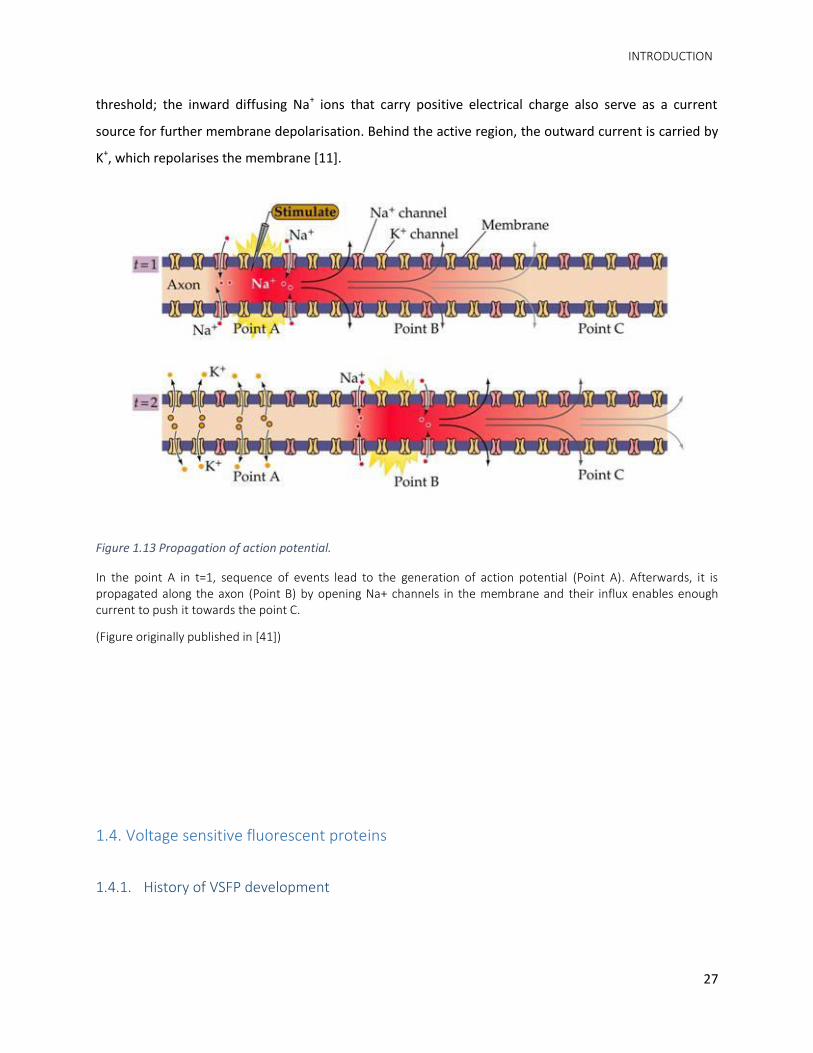
INTRODUCTION
27
threshold; the inward diffusing Na+ ions that carry positive electrical charge also serve as a current
source for further membrane depolarisation. Behind the active region, the outward current is carried by
K+, which repolarises the membrane [11].
Figure 1.13 Propagation of action potential.
In the point A in t=1, sequence of events lead to the generation of action potential (Point A). Afterwards, it is propagated along the axon (Point B) by opening Na+ channels in the membrane and their influx enables enough current to push it towards the point C.
(Figure originally published in [41])
1.4. Voltage sensitive fluorescent proteins
1.4.1. History of VSFP development

INTRODUCTION
28
Establishment of transient coherent electrical activity across the cortex, recruited from neuronal
assemblies, forms the backbone of the whole palette of complex lifelong brain activities such as
perception, learning and memory, sensory and motor reflexes loops, determined mental states etc. [42].
Unravelling the secrets of exact neuronal behaviour on the single cell level as well as its effect on the
neuronal network, contributes to the indistinct puzzle of how the brain functions. Therefore, it is not
surprising that trials examining neurophysiological recording have been represented for decades.
Recording electrical activity from the brain was performed first as a whole organ study, with silver dish
electrodes attached to the scalp. Measured electrical currents, or brain waves, recorded from the
cerebral cortex by the electroencephalography method are used for evaluating abnormalities of the
central nervous system [43]. Further, a range of different stimulation (electroconvulsive therapy),
recording (magnetic resonance imaging (MRI)) and imaging (computed tomography, positron emission
tomography) techniques were developed [44]. Most of these methods gather only structural
information about the brain. In a case with hemodynamic methods (MRI), where blood flow is studied,
lack of temporal and spatial resolution provide restricted data only. In fact, these listed methods,
applicable in vivo on whole organ studies, rely on the same role of synchronised population activity,
which correlate with behaviour and mental state.
In parallel, curiosity for neurophysiology research on a lower, cellular scale, has led to the
development of plenty of in vitro methods. Due to the limitations in electrode number and size, poor
spatial coverage, indistinguishable location of signal generation and invasiveness, there was a need for
the expansion of the neurophysiologic recording toolbox. In order to do that, during the past 20 years
optical imaging of neurons in vitro, as well as in vivo were developed. Among these methods, intrinsic
optical approaches enabled a simpler execution and observation of the experiments. Besides, they have
multiple advantages over the electric means: they do not require application of an exogenous agent for
the stimulation, nor are they subject to neural interface issues and thus. They are also less harmful for
the biological samples. The spatial resolution is provided by the optical limitations of the
camera/microscope used for the measurements. These experiments were achieved with a less invasive
method; calcium-sensitive and voltage-sensitive (or potentiometric) dyes.
The voltage-sensitive dyes are small organic lipophilic molecules that contain a pair of
hydrocarbon chains acting as membrane anchors and a hydrophilic group that links the chromophore to
the membrane. After delivery, dyes integrate into the lipophilic part of the plasma membrane. It
provides spatial and temporal resolution sufficient to optically record changes in the membrane
INTRODUCTION
29
potential by changes in fluorescence. The electrochemical mechanism lies in the induced charge
redistribution in the dipole chromophore transferred from the cell membrane upon depolarisation [46].
Their size and ability to enter through all cell membranes, has the advantage that they are easy to use.
However, that also means that lack of specific targeting makes them unsuitable for monitoring specific
cell populations. Their functionality and stability in the membranes that they offered for in vitro
experiments was not applicable for in vivo research on brain tissues. Procedures for the dye delivery
involve invasive craniotomy and usage of organic solvents for increasing chemical stability. Besides that,
issues that limit their usage are also cytotoxicity, high optical noise and with it, loss of valuable signal, as
well as indistinguishable signals origin [46]. Further investigation in the domain of the enhancing the
optical methods developed in parallel with the expansion of the molecular biology, such that this
function could be implemented with proteins. Thus, the need for more accurate and specific
measurements has led to development of genetic voltage sensors. They are analogous to voltage
sensitive dyes but offer the possibility to target specific cell populations on a genetic basis. Based on
molecular fusion of a GFP-related fluorescent reporter protein and a voltage sensor domain, a newly
created protein family of genetically engineered fluorescent voltage reporters was generated.
1.4.1.1. Ciona intestinalis VSP
Entering the 21st century, bioinformatics tools were developed and improved, as well as the
variety of experimental methods in molecular biology. Comparative genomics analyses, enabled by fast
and reliable sequencing, unravel the evolutionary secrets. To understand the evolutionary relationships
of the proteins, they should be classified to structural families to facilitate the comparison of their
domains. The domains often form the independent functional units that are actually conserved parts of
the protein’s tertiary structure. As a main theme within the scope of our interest there is the existence
of a family of voltage-sensing phosphatases that are represented in a variety of species. This protein
family is made up of two protein domains: a voltage-sensing domain and a phosphatase domain. One of
the first organisms in which human transmembrane phosphatase homologues were found is Ciona
intestinalis, an ascidian from the Chordata phylum. Ancestral prototype genes for neuronal signalling
and voltage gated cation channels in Ciona are represented in only a minimal set, while in vertebrates
there is palette of diversity. Structural characteristics of members of the voltage-gated ion channel
superfamily are, primarily, six transmembrane domains divided into two main functional domains: the
sensor and the pore. The same structural pattern is discovered in Ciona intestinalis transmembrane

INTRODUCTION
30
proteins (Figure 1.14) and thus this novel protein got a descriptive name – C. intestinalis voltage sensor
containing phosphatase (Ci-VSP) [47]. Interestingly, although it belongs to the voltage dependent family
of proteins, it is the only member that is not functioning as an ion channel; just as a phosphatase [48].
Figure 1.14 Structures of a voltage-gated ion channel and Ci-VSP.
Ci-VSP shares similarity with voltage-gated ion channels by possessing a voltage-sensing domain (green box), but it does not have a pore for the ion flux. Its cytoplasmic region has significant homology to PTEN phosphatase (pink circles).
(Figure adapted from [49])
Voltage sensing domain (S4) is located on the N terminus and the pore (S5, S6) on the C
terminus. Phosphatase activity specificity of these proteins lays on the C terminus: it contains highly
conserved active site motif C-(x)5-R specific for the tyrosine phosphatase protein superfamily. This may
imply their role as a combination of voltage sensors and phosphatases included in cell signalling and ion
channels [18].
After discovering structural patterns, there was a question how, if at all, these two functional
domains depend on each other. The fact that most of the membrane proteins involved in signalling have
at least one phospholipid binding domain [18], suggested that the mechanism (Figure 1.15) by which
domains are allosterically coupled is through the activation of the enzyme phosphatase. It is supposed
that the change in the membrane potential is sensed by the Ci-VSP S4 transmembrane domain, causing
its conformational change and further, activation of the phosphatase domain.

INTRODUCTION
31
Figure 1.15 Schematic mechanism of Ci-VSP action.
In the resting state (left), VSP (dark blue) and the CX5R phosphatase linker (light blue) are both inactive. A change in potential (right) shifts S4, activating the phosphatase, probably by moving it closer to substrate bound PIP3. Activation of CX5R locally increases the concentration of PIP2 and released phosphate opens nearby K+ channels.
(Figure adapted from [47])
The new genetic voltage sensors are named voltage-sensitive fluorescent proteins (VSFP). They
function in a way that the conformational change of the voltage sensor in response to membrane
potential changes the fluorescence of the reporter protein. This new, non-invasive optogenetic tool is
valuable for recording electrophysiological signals in electrogenic cells and provides reliable detection of
single action potentials in individual neurons, as well as in neuronal networks simultaneously [42, 50-
53]. Before their brief description, since the voltage-sensitive part is already described, it is necessary to
introduce the part about the fluorescent proteins.
The green fluorescent protein (GFP) is the famous chemiluminiscent protein from Aequorea
Victoria jellyfish, which initial discovery was rewarded by Nobel Prize in Chemistry 2008. Its emission
peak is in the green portion of the visible spectrum, at 509 nm. Due to its wide usage as a reporter of
expression, many new variants have been designed by introducing the mutations. This way, a broad
spectrum of emission colours was produced (Figure 1.16). A few of those specific variants, as a
fluorescent part of VSFP, are denoted here. As a monomeric variant of the yellow fluorescent protein
(YFP), there is a Citrine that has been demonstrated to be more resistant to photobleaching than other
YFP derivatives. Besides this, another one to single out as the far-red spectrum variant is mKate. From
the derivatives spectrum of GFP, an enhanced ratiometric super ecliptic pHluorin will be described
(1.4.2) as a part of VSFP.

INTRODUCTION
32
Figure 1.16 Chromophore structural motifs of GFP variants
In order to shift the emission spectrum and to improve folding, the variants of GFP have been designed by site-directed mutagenesis.
(Figure originally published in [54])
1.4.2. ArcLight A242
Great advantages in further development and improvement of VSFPs were brought by results of
the experiment done on Ci-VSP. Interestingly, by cDNA transfer by injection into Xenopus oocytes [47], it
has been experimentally proven that Ci-VSP transmembrane domains (S1-S4) can perform as a voltage
sensor with or without the C-terminus phosphatase domain. This defined a small independent subunit
that could be fused to other functional domains in order to achieve enhanced properties of existing
VSFPs.
During 2013, by using the benefits of genetic engineering, the desirable characteristics of Ci-
VSP’s voltage-sensing domain were coupled with a novel mutant fluorescent protein, super ecliptic
pHluorin A227D, into a novel monochromatic voltage indicator called ArcLight (Figure 1.17). This
fluorescent protein is a derivative of wild type aqGFP that carries several mutations; the most
important, a critical point mutation on the 680th position in the DNA, where the nucleotide Cytosine was
replaced with Adenosine. This change caused substitution in amino acid sequence between Alanine (A)

INTRODUCTION
33
and Aspartic acid (D) on the 227th position. In addition, with respect to the parental aqGFP,
pH/fluorescence intensity of super ecliptic pHluorin A227D is basic-shifted. Luckily, the critical mutation
does not alter the level of protein expression at the cellular membrane. [50]. The other mutations
simplify the excitation spectra to a single peak at 490 nm wavelength, provide production of more stable
fluorescent protein and increase the response magnitude [50]. The emission spectra reaches the highest
value at 509 nm [55].
Compared to the previous variants of VSFPs, the improved variant of ArcLight, indicated as
A242, displays larger changes (ca 5x) in fluorescence intensity in response to voltage changes. Thus, in
response to +100mV depolarisation, fluorescent intensity decreases by up to +35%. One of the
explanations for the fluorescence response of ArcLight-A242 may be a result of the A227D structural
modification on the β-barrel of the super ecliptic pHluorin, which loosening allows fluorophore
quenching. Concomitantly, the super ecliptic pHluorin may associate/disassociate with the plasma
membrane upon a voltage change. The position of the voltage-sensing S4 domain during the resting
state may allow dimerization of the two neighbouring super ecliptic pHluorins. Upon depolarisation, the
movement of the S4 domain would disrupt dimerization and produce monomers, which then show
reduced fluorescence. Also, movements that depend on the depolarisation may reversibly alter
association of the super ecliptic pHluorin with the plasma membrane [56]. Nevertheless, the response
kinetics still leaves a place for significant improvement. The slow component of the synaptic response is
in a range up to 10 ms, while the fastest response of ArcLight is achieved within 50 ms [57].
Figure 1.17 Scheme of ArcLight-A242 VSFP
ArcLight A242 VSFP contains Ciona intestinalis voltage – sensing domain (S1–S4 grey cylinders) crossing the plasma membrane. On the N-terminus, there is fused fluorescent protein probe named super ecliptic pHluorin A227D.
(Figure adapted from [42])

INTRODUCTION
34
1.4.3. Butterfly 1.2
Since the VSFP have the potential for further functional customisation and optimisation,
recently, a new probe named Butterfly 1.2, was introduced by the T. Knöpfel laboratory. [58]. It is
created in a way that the voltage sensor domain of Ci-VSP is sandwiched between a mCitrine/mKate2
Förster resonance energy transfer (FRET) pair (Figure 1.18). The S4 transmembrane segment of the Ci-
VSP is linked to the mCitrine donor, and the S1 domain to the mKate2 acceptor. The monomeric yellow
fluorescent protein is the more intense variant of YFP. It reaches its maximum excitation at 514 nm, and
emission at 529 nm [55]. Consequently, the emission from mCitrine donor directly excites the mKate2
acceptor, which achieves maximum emission at 633 nm [59]. This data imply that the novel probe
exhibits a decrease in mCitrine (donor) and increase in mKate2 (acceptor) fluorescence emission as
voltage–dependent FRET upon membrane depolarisation. The mCitrine/mKate2 FRET pair was chosen
because it offers a larger Förster radius (5.8 vs 5.4 nm) [42] than previously used pairs, which means that
the distance at which energy transfer is 50% efficient is larger [42]. Besides that, the red-shifted mKate2
spectrum has an advantage for avoiding green–blue tissue autofluorescence overlap.
Figure 1.18 Scheme of Butterfly 1.2 VSFP
Similar to ArcLight, Butterfly 1.2 contains Ciona intestinalis voltage – sensing domain (S1–S4 grey cylinders). However, it is fused betwwen a FRET donor mCitrine (yellow barrel) on the C-terminus and acceptor mKate2 (red barrel) on the N-terminus.
(Figure adapted from [42])
With enhanced sensitivity features, it became the first genetically enhanced voltage indicator
(GEVI) sufficient to report spontaneous neuronal activity in addition to initiated signal propagation [58].

INTRODUCTION
35
The primary idea was to report subthreshold voltage fluctuations in targeted neurons, but besides that,
it also enables optical recordings at high spatial resolution. It activates at more negative potentials than
the previous VSFP variants, so the FRET response covers -140 to +60 mV of the voltage range [42].
According to the literature, it achieves maximal voltage sensitivity of 22% of ratiometric fluorescence
per 100 mV and a response time of a fast component for single cell synaptic responses of 2 – 8 ms, and
10 – 90 ms for the slow component. In addition to all other features, it shows superior targeting to the
plasma membrane and hence reduced optical noise (high signal–to–noise ratio), making it one of the
best genetic tools for recording neuronal response [42].
1.5. Adeno – associated viral vectors
Adeno-associated virus (AAV) is one of the smallest single-stranded animal viruses with a non-
enveloped capsid (22 nm). It belongs to the Parvoviridae family, which are Group II viruses according to
the Baltimore classification [60]. Due to its inability to replicate and assemble viral particles in the
absence of helpervirus (Adenovirus or Herpes simplex virus) it is often referred to as Dependovirus genus
[61]. Nowadays, they are greatly used as a tool for gene transfer in vivo, as well as in vitro, due to their
advantages over other vectors. They are ideal vectors for cell transduction in the CNS because of their
non-pathogenicity, ability to infect non-dividing cells, significantly longer expression compared to other
transduction vectors, little to no immunogenicity and lack of cytotoxicity [62].
1.5.1. The structure
AAV has a linear single-stranded DNA (ssDNA) genome, either positive or negative sensed, of
approximately 4,7 kb enclosed with characteristic multipalindromic sequences termed inverted terminal
repeats, ITR [60]. These 145 bp long palindromic repeats can fold on themselves via Watson-Crick base
pairing into a hairpin shape [63]. They are positioned at each end of the viral genome and have multiple
roles: they are required for efficient multiplication of the genome, for its integration into the cell, as well
as rescue from it, and contribute to self-priming that allows primase-independent synthesis of the
second DNA strand [64].
Two viral genes in the open reading frames (ORFs) that AAVs carry are rep and cap, encoding
packaging and structural proteins. The four overlapping rep genes encode for regulatory proteins Rep78,
INTRODUCTION
36
Rep68, Rep52 and Rep40, which are required in genome replication. All of them possess helicase
activity, bind ATP and regulate the transcription from promoters [63]. The capsid proteins VP1, VP2 and
VP3 are the products of cap gene expression [63]. Exactly 60 protein subunits interact together to form
a capsid of an icosahedral symmetry in a ratio of 1:1:10.
1.5.2. Serotypes and native tropisms
Despite their common properties including genome size and organisation, numerous AAV
serotypes have been identified with variable tropism. Naturally occurring AAV serotypes (1-9) primarily
differ in surface properties of the capsid, which determinates tissue specificity. The overall level of
amino-acid identity in their capsid protein is nearly 45% [65], but the serotype variability is not evenly
distributed in the arrangement of individual proteins in the capsid shell. This variability in the serotype,
which affects the difference in expression levels and duration of expression, is considered to be caused
by variable domains that are displayed on the surface [65]. Thereby, they use different receptors and
entry pathways to introduce their genome into cells.
Due to the variety of serotypes, AAVs have different transduction efficiency in different cell
types. In the mouse brain, AAV1 and 5 are capable of transducing both neuronal and glial cells, while
AAV2, 7, 8 and 9 appear to transduce neurons specifically [62]. However, concretely for the cortex
region, AAV6 is among the highest rank of serotypes due to its ability to drive transgene expression [61].
Besides tropism, the kinetics of expression varies greatly between serotypes. AAV7 and 9 have the
fastest onset of expression and AAV3 and 4 the slowest [65]. According to the experimental system, the
region of the brain (for in vivo studies) or cell type (for in vitro studies), an appropriate serotype of AAVs
has to be chosen to provide sustainable expression.
1.5.3. Life cycle
Infection with AAV is initiated when viral capsid proteins bind to cell proteins that serve as its
receptors on the host cell plasma membrane [5]. AAV2 attachment to the cell membrane is currently the
only serotype with a fully understood mechanism of AAV virion entry [63]. Broad tropism that AAV2
shows can partially be explained by usage of heparan sulphate proteoglycans as docking sites [66]. After
entry into the cell, trafficking of AAV particles towards the nucleus involves receptor-mediated

INTRODUCTION
37
endocytosis via the formation of clathrin-coated vesicles. Instead of being transferred from endosomes
to lysosomes, as in the normal endocytic pathway, the virus escapes from the endosome. The viral
capsid fuses with endosome membrane and releases the internalised virions into the cytosol [5, 63]. Due
to their small size, they can access the nucleus through the nuclear pore complex [63]. In the nucleus,
viruses can enter a latent state in the lysogenic cycle or an active state in the lytic cycle. The lytic cycle is
established when there are helper viruses as well, like adenovirus or herpes simplex virus, while in
lysogenic cycle this is not the case. Then, latency is ensured by preferential integration of the virus
genome into a region of roughly 2 kb on the long arm of human chromosome 19 [67]. After the AAV
gene expression is activated, AAV-Rap mediated excision of the virus DNA from the host cell
chromosome is followed by replication and packaging. Cell lysis is induced and helper viruses and the
newly assembled virions are released (Figure 1.19).
Figure 1.19 AAV life cycle.
Initiation of AAV infection in parallel with helper virus presence starts with capsid binding to the host cell membrane receptors. Afterwards, the genome is replicated and expressed, and new viruses packed and released. In the absence of helper viruses, AAV can establish latency by integrating into chromosome 19. Upon adenoviral superinfection, the AAV viral genome can further replicate.
(Figure originally published in [68])

INTRODUCTION
38
1.5.4. Recombinant AAVs
The defective replication and non-pathogenic nature of wild-type AAV triggered the rapid
development of recombinant AAVs (rAAV) as gene delivery vectors derived from AAV. They are single
stranded vectors able to deliver genes to both dividing and non-dividing cells. In these vectors, the rep
and cap genes are replaced with a gene-expression cassette flanked by ITRs (cis-plasmid), whereas the
replication proteins and those required for replication are supplied by helper viruses in trans [60]. rAAV
particles are generated by transfecting producer cells with cis-plasmid and a separate construct
expressing in trans the viral rep and cap genes.
As in wild-type, rAAVs’ limitation is small packaging size. Without loss of infectivity, only 4,7 kb
[69] can be inserted into ss genomic AAV DNA (Figure 1.20). Because the rate–limiting step involves de
novo synthesis of a second strand on the single-stranded genomic AAV DNA [70], the expression onset is
delayed. The uncoiling of double helix DNA, thus, may be circumvented by the use of self-
complementary (scAAV) vectors (Figure 1.20). Due to a mutation in one of the ITRs, the sense and
antisense chains cannot dissociate. Therefore, although the size of the cassette is reduced by half (to 2,4
kb), onset of expression is improved, as well as increased expression levels [69].
Figure 1.20 Comparison between conventional ssAAV and scAAV vectors
In the wild type, ssAAV vector, the coding and complementary sequences are on separate strands. In scAAV vectors, both sequences of the cassette are present on each strand of the genome. The blue and red line represent coding and complementary sequence of the transgene cassette, and black respresents the bacterial genomic backbone.
(Figure originally published in [71])

INTRODUCTION
39
There are several ways to encapsulate rAAV plasmids. Their genome can be packaged with the
capsid derived from wild-type; most commonly AAV2 because the mechanism of infection through
heparan sulphate proteoglycan receptors is known [63]. Besides that, it can be pseudo typed with
capsids from other serotypes or with genetically altered capsids, which increases the number of possible
serotypes [69].
1.6. Aim of the study
The “gold standard” for investigating neuronal signalling is electrophysiology, the discipline
founded on electrode usage in in vivo (living animals), as well as in in vitro (cell-culture) samples. The
direct recording of the electrical activity and therefore, high signal-to-noise ratio is the main strength of
the method. However, for the electrical access to the nervous system there is a necessity of physical
contact with the investigated sample. Since it is a robust, cell-damaging method, it has been challenged
by a new generation of optical probes. These probes are being developed in parallel with the new forms
of microscopy, allowing measurements and control of neuronal signals with spatial resolution and
genetic specificity. This way, there is no need for direct physical contact with the sample since the light
travels through it and hereof, does not interfere with neuronal function.
The specific aims of the study:
Design of the novel probes at DNA level by manipulating with their plasmid sequences
o The final constructs consisted of hSyn; neuron-specific promoter before the coding
sequence for the VSFP, flanked by two ITR, incorporated into plasmids which support
rAAV packaging
Recombinant AAV production
Transduction of the rat cortical neurons by rAAVs and determination of its efficiency by
fluorescent cells counting
Determination of the optimal titer concentration and therefore optimisation of the transduction
protocol
Electrophysiology experiments on fluorescent neurons to validate VSFP functionality

MATERIALS AND METHODS
40
2. MATERIALS AND METHODS
2.1. Cell culture
For the purpose of optogenetic experiments, two kinds of cultured cells were used as a model
system. As the main cell type, we used primary neuronal cells that were directly prepared from a rat
embryonic brain tissue. Besides those, the Human Embryonic Kidney (HEK293) cell lines served as an
easily maintained culture for the fast control experiments. E.coli bacteria culture was obtained for
recombinant DNA manipulation in order to produce plasmids. Prior to production of construct
containing AAVs, we aimed to insert the foreign DNA containing the genes for voltage sensitive
fluorescent proteins into cells using a chemical transfection reagent and an electroporation method
(2.3).
2.1.1. Embryonic rat cortical neurons
Primary cortical neurons were obtained from pregnant Wistar rats at gestation day 18 under
sterile conditions by laboratory technicians. All animals were sacrificed according to Landesumweltamt
für Natur Umwelt und Verbraucherschutz Nordrhein-Westfalen §4 & 6 TierschG and §2 TierSchVerV on
the protection of animals used for scientific purposes. Rat embryo brains have been dissected and
stored in 1.5 ml Hank’s Balanced Salt Solution (HBSS-, without Ca2+ and Mg2+, containing 0.035% sodium
bicarbonate, 1 mM pyruvate, 10 mM 4-(2-hydroxyethyl)-1-piperazineethanesulfonic acid (HEPES buffer;
Sigma-Aldrich) and 20 mM glucose 7.4 pH; Sigma-Aldrich) on ice. Isolated cortices without dura have
been transferred to 7 ml HBSS- in a 15 ml Falcon tube on ice. Afterwards the cells were mechanically
dissociated with a silanised, fire polished glass pipette, two volumes of HBSS+ (with Ca2+ and Mg2+),
0.035% sodium bicarbonate, 1 mM pyruvate, 10 mM 4-(2-hydroxyethyl)-1-piperazineethanesulfonic acid
(HEPES buffer; Sigma-Aldrich) and 20 mM glucose 7.4 pH have been added. The cells were allowed to
settle down for 3 min on ice. The top half of the preparation has been transferred to a clean tube and
centrifuged at 200 g for 3 min. HBSS has been aspirated and the pellet resuspended in 1 ml
supplemented Neurobasal® Medium 1x (NB) (Table 2). For providing live dead staining, the marker for
dead cells, trypan blue (the standard volume of 25 µl) was diluted 1:2 in NB media. After adding 1
volume of cell suspension, the final mixture was 1:2:1 for trypan:NB:cell suspension. Live, non-coloured

MATERIALS AND METHODS
41
cells were counted in a cytometer (Neubauer chamber) and diluted to the appropriate plating
concentrations in NB. For the purposes of our experiments, the cells were plated onto sterilised 15 mm
in diameter glass coverslips in 12-well plates. The coverslips have been coated with the mixture of poly-
D-lysine (PDL) : Extracellular matrix (ECM) : Gey’s Balanced Salt Solution (GBSS) at 1:1:100 and left for 1
h at room temperature (RT). Additionally, they have been washed with 0,5 ml GBSS. After distribution to
substrates, the cells, in the final concentration of 50k or 75k have been left for 10 min at RT and then
transferred to a 37˚C, 5% CO2, humidified incubator. After 1-4 hours, NB was aspirated completely and
replaced with fresh supplemented NB. Half of the media was replaced with fresh, warm NB media twice
per week.
Table 2. Neurobasal medium (NB) contents
Substance Contribution Company
NB medium 98.65% / 5 ml Gibco® by Life Technologies, USA
B-27 supplement 1% / 50 µl Gibco® by Life Technologies, USA
L-Glutamine 0.25% / 12,5 µl Gibco® by Life Technologies, UK
Gentamicin 0.1% / 5 µl Sigma-Aldrich, Germany
2.1.2. HEK293 cell line
Human Embryonic Kidney 293 (HEK293) cells are a well-established, cell line derived from
human embryonic kidney cells grown in tissue culture. They serve as a mammalian expression tool for
recombinant proteins due to their capability of carrying out the post-translational folding processes to
generate functional proteins. Their wide usage in electrophysiological studies has been based on their
quick and easy reproduction cycles (approximately once per day), good survival after transfection, high
efficiency of transfection and functional protein expression, as well as their morphology and cell size
appropriate for patch-clamp experiments.
The listed attributes of the HEK293 cell line facilitate the selection of an expression system for
validation of the new protein construct. The cells were maintained in Dulbecco’s Modified Eagle Media
(DMEM) + Glutamax (Gibco® by Life Technologies) supplemented with 10% fetal bovine serum (FBS) and
penicillin/streptomycin, in T-25 tissue culture flasks, incubated at 37˚C with 5% CO2 in a humidified
incubator. The confluent culture was washed with 1 ml pre-warmed trypsin EDTA (0.0025%
MATERIALS AND METHODS
42
concentration) and then aspirated. Adherent cells were detached from the flask by adding a new portion
of 1 ml pre-warmed trypsin for an incubation time of 5 min at 37˚C. Afterwards, trypsin inactivation was
done by adding 5 ml of freshly prepared media to the cell-trypsin mixture. The complete flask contents
were transferred to a tube and spun for 5 min at 1200 rpm in a centrifuge. The liquid supernatant was
completely aspirated, and the cell pellet was resuspended with 1 ml of pre-warmed media by pipetting
up and down. 8x10⁴ cells were plated in a new T-25 flask in a final volume of 5 ml. Onto poly-L-lysine
(PLL) coated glass coverslips 400 cells were plated. These cells were transfected with the new protein
constructs (2.3.1). The cells were investigated by patch-clamp experiments 4 days post transfection
(DPT4).
2.1.3. Escherichia coli bacteria culture
E. coli cells, as the most common model organism used for experiments in molecular biology,
were used for a variety of DNA manipulations. The chemically competent One Shot® TOP10F´ strain
(Invitrogen™ by Life Technologies™), with the addition of an F’ episome, provide high-efficiency cloning
and plasmid propagation.
For the purpose of plasmid amplification, the following transformation procedure was
performed. For each transformation reaction, one vial of One Shot® TOP10F´ was placed on ice. To
transform, 1 µg of plasmid DNA was added directly to the competent cells and mixed by tapping gently.
The mixture was incubated on ice for 30 min, followed by 30 s incubation in the 42˚C water bath. Then,
the vials were placed on ice. 250 µl of rich, pre-warmed Super Optimal broth with Catabolite repression
(SOC) medium was added in each vial. The vials were placed at 37˚C for 1 hour at 225 rpm in a shaker-
incubator (Eppendorf Thermomixer® comfort). From each transformation vial, a volume of 10 µl to 50 µl
was spread on labelled Luria Broth (LB) agar plates containing Ampicillin antibiotic (Sigma-Aldrich) for
selection of positively transformed cells, or directly into liquid LB medium containing Ampicillin. The
plates were incubated at 37˚C overnight. Afterwards, the plasmid extraction was done depending upon
the inoculated volume of liquid LB medium with Mini, Midi or Maxi prep plasmid extraction kits by
Qiagen.
MATERIALS AND METHODS
43
2.2. Molecular cloning – construction of the plasmids
In order to create enhanced DNA constructs of the GEVIs, the VSFPs were cloned behind the
strong constitutive human cytomegalovirus (HCMV) or neuron specific human synapsin-1 (hsyn1)
promoters. Consequently, varieties of strategies were used. This chapter describes them briefly.
All DNA constructs were produced in One Shot® TOP10F´ E.coli strain (Invitrogen™),
transforming them following the manufacturer’s protocol. The positive clones were verified first by test-
reaction with restriction enzymes. The cut DNA fragments have been separated by their size by the
process of gel electrophoresis. The 1% gels were made of agarose (Sigma-Aldrich®) dissolved in 1x
Tris/Acetate/EDTA (TAE) buffer. Before polymerisation, after the diluted agarose was poured into the
chamber, a fluorescent nucleic acid stain (GelRed™, Biotium) was added in ratio 1:10000. The
electrophoresis was performed at standard voltage conditions (8 V/cm). DNA fragments were visualised
with an ultraviolet (UV) transilluminator. In the downstream procedures, the desired DNA fragments at
proper position on the gel have been cut, diluted, and purified by GenElute™ Gel Extraction Kit (Sigma-
Aldrich®), according to the manufacturer’s protocol. The isolated plasmid DNA was resuspended in
MilliQ water to a final concentration of 0.5 – 1.4 μg/μl and stored at -20˚C. Subsequently, they were
verified by sequencing (Eurofins MWG Operon, Ebersberg, Germany).
2.2.1. psc_hSyn1_ArcLight
The psc_hSyn1_ArcLight plasmid was created by insertion of the coding sequence of ArcLight
from the plasmid ArcLight-A242 (plasmid 36857, Addgene) into psc_hSyn1 plasmid (a gift from the
Baumann Lab, Forschungszentrum Jülich GmbH). ArcLight was cut out of ArcLight-A242 using the
restriction endonucleases HindIII/EcoRI (Thermo Scientific) in R buffer (Thermo Scientific). The same
procedure was applied for the psc_hSyn1 plasmid, with exception of using SacI/EcoRI restriction
enzymes in BamHI buffer (Thermo Scientific). The reactions were performed for 1h at 37˚C at 300 rpm in
a microtube shaking incubator (Eppendorf Thermomixer® comfort). Fragments were separated by
agarose gel electrophoresis, cut, and extracted by GenElute™ Gel Extraction Kit (Sigma-Aldrich®).
Afterwards, purified ArcLight fragment was added to an extra sequence coding for introduced
restriction sites, SacI on the 5’ end and EcoRI on the 3’ end by polymerase chain reaction (PCR) (Table 3)
using KOD Hot Start Polymerase. In order to create an optimal Kozak consensus sequence in 5’-forward
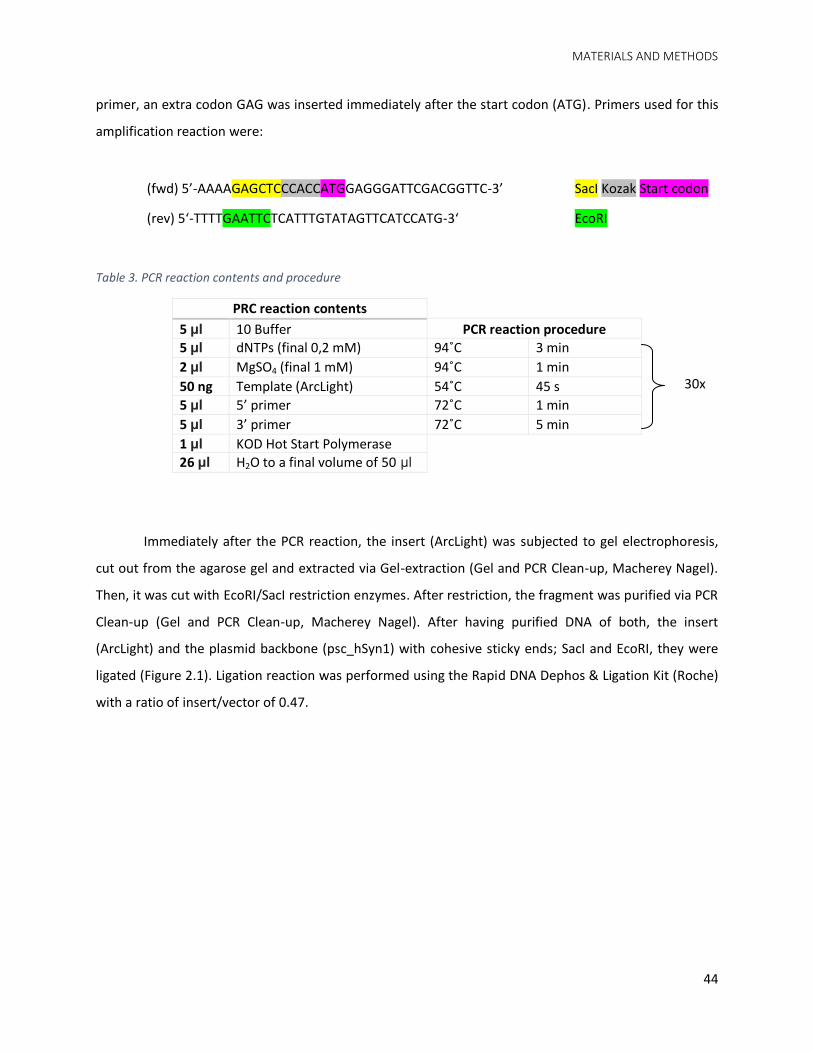
MATERIALS AND METHODS
44
primer, an extra codon GAG was inserted immediately after the start codon (ATG). Primers used for this
amplification reaction were:
(fwd) 5’-AAAAGAGCTCCCACCATGGAGGGATTCGACGGTTC-3’ SacI Kozak Start codon
(rev) 5‘-TTTTGAATTCTCATTTGTATAGTTCATCCATG-3‘ EcoRI
Table 3. PCR reaction contents and procedure
PRC reaction contents
5 μl 10 Buffer PCR reaction procedure
5 μl dNTPs (final 0,2 mM) 94˚C 3 min
2 μl MgSO4 (final 1 mM) 94˚C 1 min
50 ng Template (ArcLight) 54˚C 45 s
5 μl 5’ primer 72˚C 1 min
5 μl 3’ primer 72˚C 5 min
1 μl KOD Hot Start Polymerase
26 μl H2O to a final volume of 50 μl
Immediately after the PCR reaction, the insert (ArcLight) was subjected to gel electrophoresis,
cut out from the agarose gel and extracted via Gel-extraction (Gel and PCR Clean-up, Macherey Nagel).
Then, it was cut with EcoRI/SacI restriction enzymes. After restriction, the fragment was purified via PCR
Clean-up (Gel and PCR Clean-up, Macherey Nagel). After having purified DNA of both, the insert
(ArcLight) and the plasmid backbone (psc_hSyn1) with cohesive sticky ends; SacI and EcoRI, they were
ligated (Figure 2.1). Ligation reaction was performed using the Rapid DNA Dephos & Ligation Kit (Roche)
with a ratio of insert/vector of 0.47.
30x

MATERIALS AND METHODS
45
Figure 2.1. Molecular cloning scheme of psc_hSyn1_ArcLight plasmid
Psc_hSyn_ArcLight plasmid was produced in a way that psc_hSyn plasmid was opened with SacI/EcoRI restriction enzymes. From the ArcLight-A242 plasmid, the ArcLight coding sequence was first multiplied by PCR with designed primers that introduced new restriction sites: SacI and EcoRI. Afterwards, this sequence, cut by SacI/EcoRI was ligated into open psc_hSyn plasmid.

MATERIALS AND METHODS
46
2.2.2. pSub_hSyn1_Butterfly
In order to create the pSub_hSyn1_Butterfly plasmid, the coding region of the Butterfly VSFP
from the pCAG_Butterfly plasmid (a gift from the Knöpfel Lab) was inserted into pSub_hSyn1_eGFP
plasmid backbone (given by ICS4). Butterfly was cut out of the pCAG_Butterfly plasmid by BamHI/XbaI
restriction enzymes (Thermo Scientific). The backbone, in turn, was cut only with BamHI (Thermo
Scientific), aiming to excise the eGFP coding sequence. The reactions were performed for 1h at 37˚C at
300 rpm in microtube shaking incubator. Fragments were separated by agarose gel electrophoresis, cut
and extracted by GenElute™ Gel Extraction Kit (Sigma-Aldrich®).
Due to their overhanging end-incompatibility, a blunt-end cloning strategy was performed
Figure 2.2). In the first reaction, sticky ends on separate fragments were filled with compatible
nucleotides in separate reactions for each fragment by T4 DNA polymerase (Fermentas Inc.) for 10 min
at 37˚C. The vector was dephosphorylated in the same reaction when both blunt-ended fragments were
ligated by the kit Rapid DNA Dephos & Ligation Kit from Roche for 10 min at 17˚C (Figure 2.3).
Figure 2.2 Molecular cloning scheme (1) of pSubc_hSyn1_Butterfly plasmid: blunt end ligation
Psc_hSyn_Butterfly plasmid was produced in a way that pSub_hSyn_EGFP plasmid was cut by BamHI restriction enzyme, which resulted in EGFP excision. Butterfly sequence was cut by BamHI/XbaI from pCAG_Butterfly plasmid. Since the overhanging ends were not cohesive, they had been filled with nucleotides aiming to blunt end production. Finally, the backbone and the insert fragment were ligated in the new plasmid.

MATERIALS AND METHODS
47
Figure 2.3 Molecular cloning scheme (2) of pSubc_hSyn1_Butterfly plasmid: general overview
Psc_hSyn_Butterfly plasmid was produced in a way that pSub_hSyn_EGFP plasmid was cut by BamHI restriction enzyme, which resulted in EGFP excision. Butterfly sequence was cut by BamHI/XbaI from pCAG_Butterfly plasmid. Since the overhanging ends were not cohesive, they had been filled with nucleotides aiming to blunt end production. Finally, the backbone and the insert fragment were ligated in the new plasmid.

MATERIALS AND METHODS
48
2.3. Recombinant DNA insertion
The vectors that were made, consisting of an insert and the plasmid backbone, were inserted
into the target cells (2.1) by three different insertion methods. Recombinant DNA, taken by the recipient
cells, has the purpose to transfer genetic information and afterwards, to express the insert. Hence, the
genetically modified cells will be given new characteristics that can be used for further experiments.
At first, the characterisation of VSFP was provided by inserting the recombinant DNA into the
cells by chemical transfection and electroporation. For these insertion methods sufficient is, besides
reagents and device, only pure DNA, so they are simple and fast to maintain. While the DNA construct
was verified for proper protein production, despite low transfection rate of these methods, the VSP
were afterwards characterised on the cells transduced by rAAVs. According to the previous methods
described, it has certain advantages. Since it does not show cytotoxicity, the transduced cells show
better viability, among the high translation rate.
2.3.1. Chemical transfection
For transfection of the cortical neurons and HEK293 cells, nonliposomal FuGENE® HD
Transfection Reagent (Promega) was used. The transfection parameters, as recommended in the
protocol by the supplier, were optimised for each cell type. The complete protocol is described here.
For the preparation of transfection aliquots for a 12 well plate (see below), 0.75 µl of FuGENE®
Transfection Reagent per well was mixed with NB medium for neurons and HEK293 cells (up to 50 µl) in
the eppi, reducing the contact with plastic (the sides of the tube). The FuGENE® Transfection
Reagent/NB medium mixture was vortexed for 1 s and afterwards, incubated for 5 min at RT. The
maximal recommended rate FuGENE:DNA 3:2 was used; 0.5 µg of DNA per well added to the previously
prepared mixture. The FuGENE® Transfection Reagent/DNA mixture was vortexed for 1 s and incubated
for 15 min at RT. The total volume of prepared mixture per well was 50 µl.
The adherent cortical neurons were plated on the coated coverslips in the final concentration of
50k one week before, and 0.5% of the confluent HEK293 cells on the day of transfection. Before the
procedure of transfection, ¾ of the cell media was removed and stored for later use. Thereafter, 50 µl of
FuGENE® Transfection Reagent/DNA mixture was added drop wise to each well in the plate. The plates
were swirled to ensure equal distribution and placed into the incubator at 37˚C and 5% CO2 for 1 hour.

MATERIALS AND METHODS
49
Afterwards, the mixture was removed completely in order to increase cell survival and viability rate and
to decrease the damage caused by the nonspecific transport of molecules into the cells. Wells were
refilled with ½ of the old, stored media and ½ of the freshly made media.
2.3.2. Electroporation
Electroporation is another method used for recombinant DNA introduction into mammalian
cells. The permeability of the plasma membrane is caused by an externally applied electrical field. Thus,
the following procedure was used.
The supplemented transfection solution (TS) was prepared according to the manufacturer’s
recommendations (Lonza Amaxa™ Rat Neuron Nucleofector). A cuvette was preloaded with 10 µg of
recombinant DNA. The cell suspension of 106 cells was prepared. They were spun down for 2 min at 200
g. Afterwards, the supernatant was removed and the pellet resuspended in 100 µl TS. The cells were
quickly transferred to the transfection cuvette. The cuvette was placed in the electroporator (Lonza
Amaxa™ Nucleofector) and program G-013 “Neurons – Chicken DRG” was applied. For neuronal
recovery, 1 ml of supplemented RPMI (see Table 4) was added to the cuvette. The complete mixture
(cells & RPMI) was transferred to a falcon tube using the Pasteur pipette provided in the kit. Counted
cells were plated 50k per substrate onto the coated coverslips in a 12-well plate. The media was
replaced by NB medium after 1 hour of adhesion.
Table 4. Supplemented RPMI contents
Substance Contribution Company
RPMI medium 98,75% Lonza Amaxa™, Cologne, Germany
L-Glutamine 0,25% Gibco® by Life Technologies, UK
FBS 1% Sigma-Aldrich, Germany
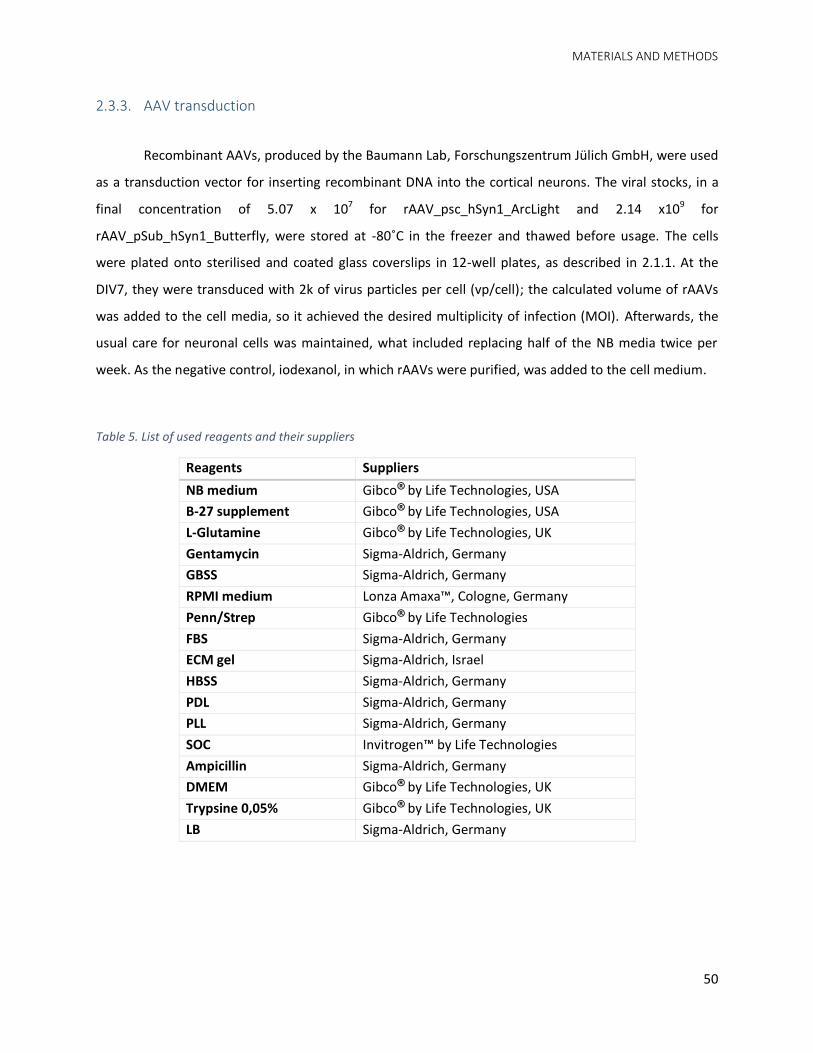
MATERIALS AND METHODS
50
2.3.3. AAV transduction
Recombinant AAVs, produced by the Baumann Lab, Forschungszentrum Jülich GmbH, were used
as a transduction vector for inserting recombinant DNA into the cortical neurons. The viral stocks, in a
final concentration of 5.07 x 10⁷ for rAAV_psc_hSyn1_ArcLight and 2.14 x10⁹ for
rAAV_pSub_hSyn1_Butterfly, were stored at -80˚C in the freezer and thawed before usage. The cells
were plated onto sterilised and coated glass coverslips in 12-well plates, as described in 2.1.1. At the
DIV7, they were transduced with 2k of virus particles per cell (vp/cell); the calculated volume of rAAVs
was added to the cell media, so it achieved the desired multiplicity of infection (MOI). Afterwards, the
usual care for neuronal cells was maintained, what included replacing half of the NB media twice per
week. As the negative control, iodexanol, in which rAAVs were purified, was added to the cell medium.
Table 5. List of used reagents and their suppliers
Reagents Suppliers
NB medium Gibco® by Life Technologies, USA
B-27 supplement Gibco® by Life Technologies, USA
L-Glutamine Gibco® by Life Technologies, UK
Gentamycin Sigma-Aldrich, Germany
GBSS Sigma-Aldrich, Germany
RPMI medium Lonza Amaxa™, Cologne, Germany
Penn/Strep Gibco® by Life Technologies
FBS Sigma-Aldrich, Germany
ECM gel Sigma-Aldrich, Israel
HBSS Sigma-Aldrich, Germany
PDL Sigma-Aldrich, Germany
PLL Sigma-Aldrich, Germany
SOC Invitrogen™ by Life Technologies
Ampicillin Sigma-Aldrich, Germany
DMEM Gibco® by Life Technologies, UK
Trypsine 0,05% Gibco® by Life Technologies, UK
LB Sigma-Aldrich, Germany

MATERIALS AND METHODS
51
2.4. The electrophysiology measuring setup: Voltage-clamp fluorometry technique
In the electrophysiology measurements, with the aim of correlating the changes in membrane
potential and fluorescence intensity in live transgenic cortical neurons, the voltage-clamp fluorometry
was used. This biophysical technique combines simultaneous patch-clamp as an electrical recording and
optical recordings of fluorescence. The following section describes each part separately.
2.4.1. Optics
The core of the system is a Zeiss Axio Scope.A1 upright microscope with HXP 120V mercury arc
lamp and Carl Zeiss 12V 100W Power Supply halogen lamp as a standard and fluorescent light sources.
The microscope is linked to the Andor Zyla sCMOS camera with water-cooling that keeps the camera
temperature at 0˚C for low noise. Objective lenses Achroplan (Zeiss) W 20x/0.5 and W 10x/0.3
(magnification/NA) were used. With the tube lenses of 1,6x and 4x, additional magnification and re-
inversion of the images was obtained.
The primary filtering element is the set of three filters housed in a fluorescence filter cube
(Figure 2.4). For imaging of ArcLight and Calcein, a Zeiss filter set 09 HE was used. It was consisted of
bandpass excitation filter 450-490 nm, a dichroic beam splitter at 510 nm and a longpass emission filter
of 515 nm. Butterfly, in turn, was imaged with a Zeiss filter set 15 HE; a bandpass excitation filter 520/44
nm, a beam splitter at 580 nm and a longpass emission filter of 593 nm (Table 6).
Table 6. The list of filters and accompanying wavelengths
Channel ZEISS filter Excitation filter Beam splitter Emission filter
DIC Epi DIC n.a. n.a. n.a.
Green 09 HE BP 450-490 BS 510 LP 515
Red 15 HE BP 520/44 BS 580 LP 593
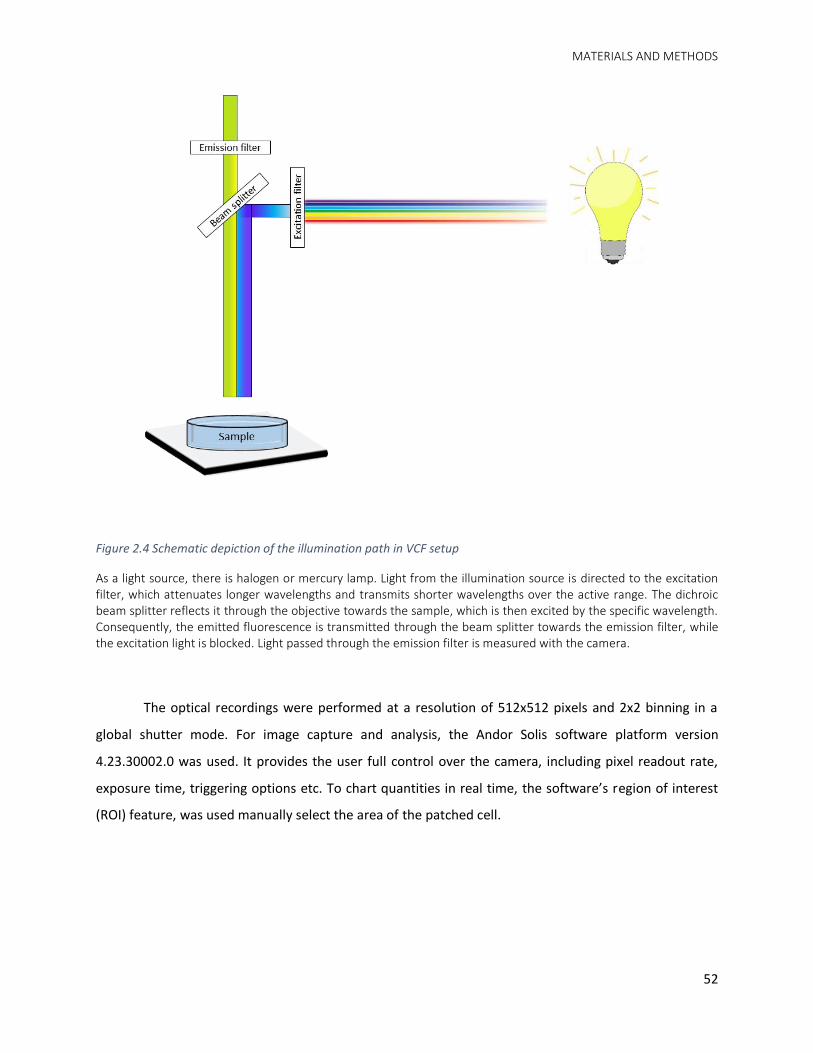
MATERIALS AND METHODS
52
Figure 2.4 Schematic depiction of the illumination path in VCF setup
As a light source, there is halogen or mercury lamp. Light from the illumination source is directed to the excitation filter, which attenuates longer wavelengths and transmits shorter wavelengths over the active range. The dichroic beam splitter reflects it through the objective towards the sample, which is then excited by the specific wavelength. Consequently, the emitted fluorescence is transmitted through the beam splitter towards the emission filter, while the excitation light is blocked. Light passed through the emission filter is measured with the camera.
The optical recordings were performed at a resolution of 512x512 pixels and 2x2 binning in a
global shutter mode. For image capture and analysis, the Andor Solis software platform version
4.23.30002.0 was used. It provides the user full control over the camera, including pixel readout rate,
exposure time, triggering options etc. To chart quantities in real time, the software’s region of interest
(ROI) feature, was used manually select the area of the patched cell.
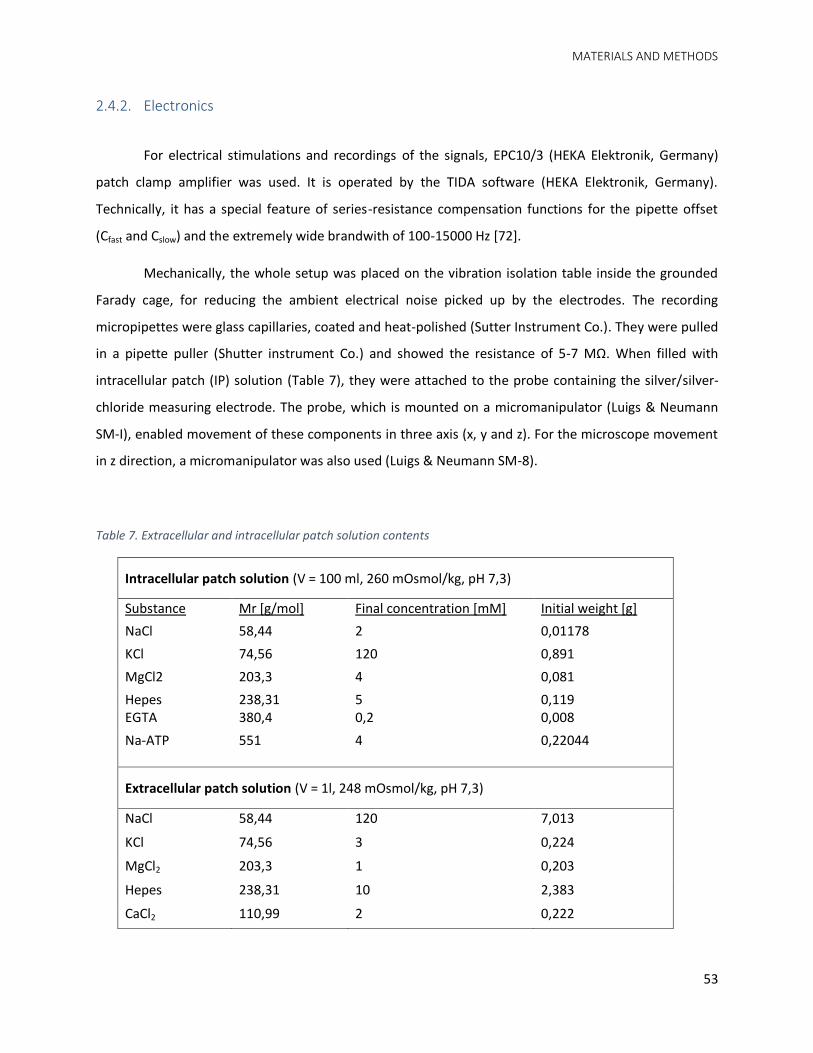
MATERIALS AND METHODS
53
2.4.2. Electronics
For electrical stimulations and recordings of the signals, EPC10/3 (HEKA Elektronik, Germany)
patch clamp amplifier was used. It is operated by the TIDA software (HEKA Elektronik, Germany).
Technically, it has a special feature of series-resistance compensation functions for the pipette offset
(Cfast and Cslow) and the extremely wide brandwith of 100-15000 Hz [72].
Mechanically, the whole setup was placed on the vibration isolation table inside the grounded
Farady cage, for reducing the ambient electrical noise picked up by the electrodes. The recording
micropipettes were glass capillaries, coated and heat-polished (Sutter Instrument Co.). They were pulled
in a pipette puller (Shutter instrument Co.) and showed the resistance of 5-7 MΩ. When filled with
intracellular patch (IP) solution (Table 7), they were attached to the probe containing the silver/silver-
chloride measuring electrode. The probe, which is mounted on a micromanipulator (Luigs & Neumann
SM-I), enabled movement of these components in three axis (x, y and z). For the microscope movement
in z direction, a micromanipulator was also used (Luigs & Neumann SM-8).
Table 7. Extracellular and intracellular patch solution contents
Intracellular patch solution (V = 100 ml, 260 mOsmol/kg, pH 7,3)
Substance Mr [g/mol] Final concentration [mM] Initial weight [g]
NaCl 58,44 2 0,01178
KCl 74,56 120 0,891
MgCl2 203,3 4 0,081
Hepes 238,31 5 0,119 EGTA 380,4 0,2 0,008
Na-ATP 551 4 0,22044
Extracellular patch solution (V = 1l, 248 mOsmol/kg, pH 7,3)
NaCl 58,44 120 7,013
KCl 74,56 3 0,224
MgCl2 203,3 1 0,203
Hepes 238,31 10 2,383
CaCl2 110,99 2 0,222

MATERIALS AND METHODS
54
The cells were electro physiologically examined in the described setup at the earliest DIV14, i.e.
DPT7. The first step in the sample preparation entailed checking the osmolarity of the cell media in the
cryoscopic osmometer (Gonotec Osmomat® 030). In order to prevent osmotic stress for the cells,
extracellular patch (EP) solution with theoretical osmolarity of 248 mOsmol/kg (Table 7), was adjusted
to the NB media level by adding certain amount of D-(+)-Glucose (Sigma-Aldrich). This calculation was
done by the following formula:
𝑚 𝑔𝑙𝑐 𝑔 = 𝑉𝐸𝑃 𝑙 ⋅ 𝑜𝑠𝑚𝑜𝑙𝑎𝑟𝑖𝑡𝑦𝑁𝐵 − 𝑜𝑠𝑚𝑜𝑙𝑎𝑟𝑖𝑡𝑦𝐸𝑃 𝑂𝑠𝑚𝑜𝑙
𝑘𝑔 ⋅ 𝑀𝑟(𝑔𝑙𝑐)
𝑔
𝑚𝑜𝑙 Equation 6
where m(glc) represents the mass of the glucose (glc), V volume and Mr(glc) molecular mass of glucose.
Afterwards, the glass coverslips with the cells were glued to the 35 mm petri dish with vacuum
grease. The dish was filled with adjusted, warm EP solution. The micropipettes were filled with IP
solution. The experiments were performed at RT in the dark, due to the bleaching sensitivity of VSFPs.
After the fluorescent cell was clamped in the whole-cell voltage-clamp (VC) mode, the resting potential
was set at -70 mV. CFAST and CSLOW compensation was set before opening the cell. Afterwards,
compensation of R was done as well. The standardised VC check protocol was used to check the
responsiveness of the cell to the electrical stimulation (7.3.1). Afterwards, the electrical recording, by
TIDA 5.25 software, was triggered directly by the starting signal of optical recording in the Andor Solis
software for the Andor Zyla camera, through the transistor-transistor-logic (TTL) signal.
For simultaneous voltage recordings and current stimulations, two channels in HEKA EPC10
amplifier were used. The stimulation protocol (Figure 2.5; code in 7.3.2), where the membrane potential
was stepped from resting potential to the holding potential by 10 mV increment and then stepped back
to the resting potential, was designed according to the applied exposure time in ms. It included the
initial recording at the resting potential in duration of 10x exposure time, followed by a loop that was
repeated 26 times. Each loop differed from the previous by 10 mV increases in voltage, in duration of 6x
exposure time. Finally, the last step included 10x exposure time long recording at the holding potential.
The designed protocol included a 50 ms pause after every of 26 loops.
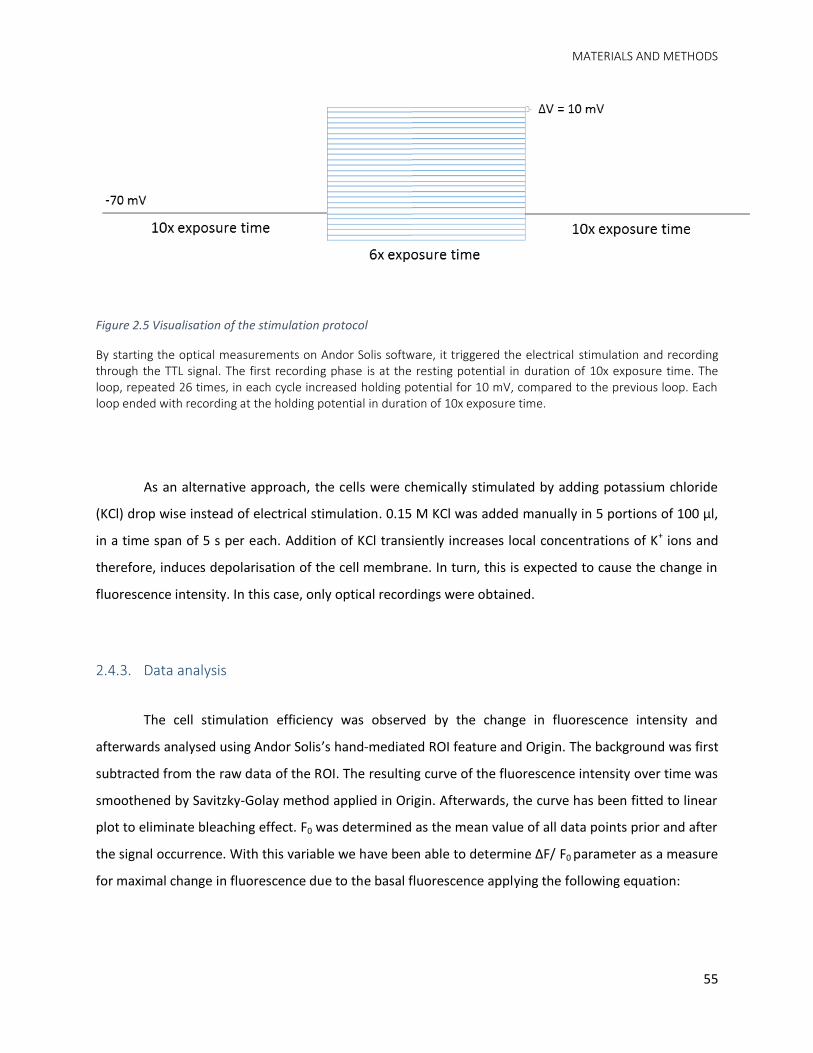
MATERIALS AND METHODS
55
Figure 2.5 Visualisation of the stimulation protocol
By starting the optical measurements on Andor Solis software, it triggered the electrical stimulation and recording through the TTL signal. The first recording phase is at the resting potential in duration of 10x exposure time. The loop, repeated 26 times, in each cycle increased holding potential for 10 mV, compared to the previous loop. Each loop ended with recording at the holding potential in duration of 10x exposure time.
As an alternative approach, the cells were chemically stimulated by adding potassium chloride
(KCl) drop wise instead of electrical stimulation. 0.15 M KCl was added manually in 5 portions of 100 µl,
in a time span of 5 s per each. Addition of KCl transiently increases local concentrations of K+ ions and
therefore, induces depolarisation of the cell membrane. In turn, this is expected to cause the change in
fluorescence intensity. In this case, only optical recordings were obtained.
2.4.3. Data analysis
The cell stimulation efficiency was observed by the change in fluorescence intensity and
afterwards analysed using Andor Solis’s hand-mediated ROI feature and Origin. The background was first
subtracted from the raw data of the ROI. The resulting curve of the fluorescence intensity over time was
smoothened by Savitzky-Golay method applied in Origin. Afterwards, the curve has been fitted to linear
plot to eliminate bleaching effect. F0 was determined as the mean value of all data points prior and after
the signal occurrence. With this variable we have been able to determine ΔF/ F0 parameter as a measure
for maximal change in fluorescence due to the basal fluorescence applying the following equation:

MATERIALS AND METHODS
56
𝛥𝐹
𝐹0=
𝐹𝑚𝑎𝑥 − 𝐹0
𝐹0 Equation 7
Considering this parameter we have been able to calculate another; signal-to-noise ratio (SNR).
The ΔF/ F0 value was divided by standard deviation (SD) of F0:
𝑆𝑁𝑅 =
𝛥𝐹
𝐹0
𝑆𝐷(𝐹0) Equation 8
2.5. Live cell imaging setup
For the observation of the transduced cells (2.3.3) expressing VSFP in real-time, the ZEISS live
cell imaging setup was used. The setup includes an inverted microscope and the camera. The cells on
the transparent substrates, glass coverslips, were placed in the 35 mm petri dish and filled with warm EP
solution. Recordings of the cortical neurons expressing ArcLight A-242 VSFP were performed in the
FITC/AF488 channel. This channel uses filter set 38 HE GFP with the excitation filter BP 450-490,
emission filter BP 500-550, and beam splitter BS495. The light source was set to 100% intensity and the
exposure time was 20 ms. The used magnification was 40x, with the air objective LD Plan-Neofluar with
the numerical aperture 0.65. The collected data were saved as ZEISS .czi files and analysed in Zen
software using a manually set regions of interest (ROI).

RESULTS
57
3. RESULTS
3.1. Molecular overview of the constructs
As a result of the molecular cloning, the desired recombinant DNA molecules were assembled,
aiming for the recombinant protein production. Both of the constructs, ArcLight-A242 and Butterfly 1.2
are coding for VSFP. In order to improve and enhance their properties for the experimental system we
use (primary cortical neurons), they have each been incorporated into a plasmid behind the neuron-
specific hSyn1 promoter.
From the starting idea of making functional VSFP constructs till their performance, we have
been struggling with a variety of issues. The two original plasmids, ArcLight-A242 and pCAG_Butterfly,
have needed a promoter addition/exchange in order to adjust them for our purpose. As a first step,
there was an addition of the HCMV promoter in front of the both VSFP coding sequences and their
incorporation into sc plasmid. HCMV is a strong promoter used to drive the transgene expression in
mammalian cells. Since it is not type-specific, it can equally promote the expression in any kind of cells;
gradually, however, becoming silenced. The new plasmids, psc_HCMV_ArcLight and
psc_HCMV_Butterfly, were constructed in a short time and in relatively easy few steps of standard
restriction enzyme digestion (HindIII/EcoRI for ArcLight and BamHI/EcoRI for Butterfly) and cohesive-end
ligation. Afterwards, they have both been validated in order to produce functional fluorescent proteins
by chemical transfection of HEK293 cells. Since it was so, the rAAV production with these two constructs
seemed a reasonable step for achieving less harmful and more specific insertion of recombinant DNA,
and higher expression rates of the proteins. Hereby, we become acquainted with the issue of the limited
size of the construct suitable to be used for rAAV production. We have been warned by the
collaborators in charge for rAAV production that the observed limitation in the insert size is smaller than
published values (~2 kb). Our vector (sc), in which we have incorporated recombinant DNA, can accept
only 2.4 kb (as mentioned in 1.5.4). Since the size of the HCMV promoter is ~570 kb, and Butterfly is
2053 kb, it was clear that we have been compelled to search for alternative solutions to achieve the viral
production. In such a way, the conceived alternative involved a new design of the construct. Due to the
unsuitability of the self-complimentary vector according to the size of our recombinant DNA insert, we
have decided to exchange it for an ss vector (described in 1.5.4). Into its single-strained genome, 4.7 kb
of the recombinant DNA can be inserted. Since the expression takes longer than for sc vector due to the

RESULTS
58
second strand synthesis, the strong promotor (such as HCMV) that drives the transgene expression
would be desired. However, there is the second issue that remained – lack of expression specificity. To
address that, we have chosen the hSyn1 promoter instead of HCMV. In addition to its smaller size, ~450
kb, which gives us more space for the transgene, it has certain advantages in specificity. This promoter
restricts transgene expression exclusively to neurons, which means that one could be able to distinguish
different cell subpopulations (e.g. neurons and glial cells) by fluorescence and thus, specifically patch
only neurons expressing VSFPs. This way, we enabled rAAV production by overcoming certain packaging
limitations as well as the cell-specific recombinant DNA expression.
3.1.1. psc_hSyn_ArcLight construct
The idea of a new ArcLight construct (Figure 3.1) was to incorporate it into a sc vecor. The sc
vector structurally contains double stranded DNA, bypassing the requirement for the second strand
synthesis. Due to that, the size of the potential recombinant cannot exceed 2.4 kb in between ITRs;
hereby, our ArcLight construct fits perfectly (1.4 kb). In the plasmid, it is positioned behind the hSyn1
promoter that drives neuron-specific expression. Downstream of the ArcLight VSFP sequence, there is a
region of Simian virus 40 PolyA (SV40) that enables the nuclear import of a plasmid by adding a PolyA
tail to the mRNA. Among other functions, it terminates the transcription activity. Due to the rAAV
production, the construct has to be flanked by two 145 nucleotide-long ITRs on 5’ and 3’ end. Since the
ITRs are the “hot spot” of the genome instability, they have to be checked by the restriction enzyme
digestion. As a selection marker for the positive-clone selection during the cloning procedure, inside the
plasmid, there should also be an Ampicillin resistance gene.

RESULTS
59
Figure 3.1 Map of the psc_hSyn_ArcLight plasmid
A plasmid map shows two ITR sites on each end of the construct; the hSyn promoter followed by ArcLight-A242 VSFP sequence and SV40 PolyA site. The plasmid also contains an Ampicillin resistance site as the selection marker. Expressed and inserted into membrane, ArcLight-A242 VSFP is schematically shown on the right.
The ArcLight-A242 VSFP construct was made by adding backbone-compatible restriction sites
(SacI on 5’ end and EcoRI on 3’ end) to the purified ArcLight fragment (cut from ArcLight-A242 plasmid
by the restriction endonucleases HindIII/EcoRI) by PCR, as described in 2.2.1. Since the size of the
ArcLight fragment is 1464 bp (Figure 3.2), it is considered small enough to be packed into the sc AAV
vector. Altogether, including the hSyn1 promoter, the insert reaches ~1900 kb. For this purpose, a
sc_hSyn1 plasmid (a gift from the Baumann lab, Forschungszentrum Jülich GmbH) was used. Ligating
those two components with the sticky-ends (SacI and EcoRI), the final product was made:
pcs_hSyn1_ArcLight. A verification of the ITRs existence and positions in the plasmid was done by the
restriction enzyme digestion using SmaI/SacI and AhdI/EcoRI and analysed by gel-electrophoresis (Figure
3.3).

RESULTS
60
Figure 3.2 ArcLight-A242 fragment evaluation by restriction enzyme digestion and gel-electrophoresis
After cutting the ArcLight fragment out of the ArcLight-A242 plasmid (36857, Addgene), it has been multiplied by PCR in order to add a new restriction site (SacI) that would be compatible with the psc_hSyn1 backbone. Afterwards, the final check of the fragment size (1464 bp) was done using restriction enzyme digestion (SacI/EcoRI) and gel-electrophoresis. This way, the proper fragment could be visualised on the gel, separated from the reaction mixture, extracted and used for further cloning procedures.
Figure 3.3 ITR evaluation by restriction enzyme digestion and gel-electrophoresis for psc_hSyn1_ArcLight
The photo of the gel represents pSub_hSyn_ArcLight clone enzyme restriction in order to prove the presence of ITR on each end of the construct. In the second well there was the SmaI/SacI enzymatic digestion, and in the third AhdI/EcoRI. Cut fragments visible on the gel serve as a proof that ITRs on both ends of the construct are present in the plasmid, since we have gotten the fragments of expected size. (* indicates the well)

RESULTS
61
3.1.2. pSub_hSyn_Butterfly construct
After the blunt-end cloning procedure described in 2.2.2, the final product was the
pSub_hSyn_Butterfly construct (Figure 3.4). The advantages of pSub plasmid as the AAV vector have
influenced our selection of the plasmid. It can accept the foreign DNA that is bigger than 2.4 kb. Because
our Butterfly transgene (~2.1 kb) is reaching the limit in size predicted for sc vector incorporation (up to
2.4 kb), pSub was the more appropriate choice. pSub, as a ss AAV vector is transcriptionally inactive. It
requires the conversion of of ssDNA to double-stranded (ds) template. This synthesis can be either de
novo or the annealing of the plus and minus strands from two separate viral particles coinfecting the
same cell. This process is a rate-limiting step that contributes to the slow onset of transgene expression
after vector delivery; taking at least twice as long as expression from a ds vector (e.g. sc).
Apart from already mentioned hSyn promoter followed by VSFP coding sequence, the other
elements required for the successful expression found their place in the plasmid as well. A region of
Simian virus 40 PolyA (SV40) enables the nuclear import of a plasmid by adding PolyA tail to mRNA.
Besides, it terminates the transcription activity, so it is positioned behind Butterfly coding sequence.
Regarding the rAAV production, the transgene is flanked by two 145 bp ITRs on each end; in front of the
promoter and behind SV40. With the purpose of facilitated selection of the bacterial cells that received
plasmids, there was a sequence coding for the Ampicillin antibiotic resistance. This way, bacterial cells
during the cloning experiments could easily be positively selected by adding Ampicillin in the growth
medium.
The original construct of Butterfly 1.2 VSFP, pCAG_Butterfly 1.2, was a gift from the Knöpfel Lab
(Imperial College London). In this plasmid, the VSFP coding sequence, consisting of mKate2, VSD and
mCitrine domains, was positioned behind a CAG promoter. The VSFP coding domain from this construct
was transferred to get a plasmid with more specificity. The neuron-specific targeting was done on two
levels. On the one hand, there is an incorporation of the neuron-specific hSyn promoter into the pSub
plasmid, on the other hand, the serotype-specific packaging in rAAV6. This serotype confers a higher
neuronal transduction rate than other naturally occurring AAV serotypes. ITRs, prior to the rAAV
production, were checked by enzyme digestion (AhdI, SmaI and HindIII) and gel-electrophoresis (Figure
3.5).

RESULTS
62
Figure 3.4 Map of the pSub_hSyn_Butterfly plasmid
A plasmid map shows two ITR sites on each end of the Butterfly construct, hSyn1 promoter followed by Butterfly VSDP sequence, SV40 PolyA site and an Ampicillin resistance site as the selection marker. Expressed and inserted into membrane, Butterfly VSFP is schematically shown on the right.
Figure 3.5 ITR evaluation by restriction enzyme digestion and gel-electrophoresis for pSub_hSyn1_Butterfly
The photo of the gel represents pSub_hSyn_Butterfly clone enzyme restriction in order to prove the presence of ITRs on each end of the construct. On the left, there is AhdI, and on the right, SmaI/HindIII enzyme digest. All bands are as big as expected, which means that ITRs are on the positions where they should be. (* indicates the well)

RESULTS
63
3.2. Transfection/transduction rates and viability
For successful performance of the electrophysiological experiments, it is necessary to obtain
healthy, genetically modified cells in the culture. Since the further experimental procedure involves cell
by cell examination, it is necessary to have at least few cells per substrate expressing at sufficient levels.
The two methods to achieve the goal were used (transfection and transduction), so their comparison is
mentioned here. In order to determine efficiency of the individual methods for inserting recombinant
DNA into the cells and their survival rate, they have been quantitatively evaluated. The parameter that
was experimentally observed was expression of the fluorescent proteins, an indicator for successful
transfection/transduction. The total number of the fluorescent cells was divided by the number of all
potentially viable cells for each construct and insertion method.
3.2.1. FuGene transfection
As a quick method for genetic modification of the cells (both, HEK293 and cortical neurons),
FuGene chemical transfection was used for the first evaluation of the protein expression. Despite the
good preparation of the primary neuronal cultures and their transfection at DIV7, when they are
supposed to be robust enough to survive the chemical agent, only a few cells per well behaved as
expected. The percentage of the neuronal cells that fulfil the prerequisites as healthy, fluorescent cells
ready to be electrophysiologically measured is 38.38% (n = 99).
With regards to the HEK293 culture, the cell health was improved compared to the same
treatment on the neuronal cells. These results are in accordance with the life cycle of the cells; since
they divide every day, only those who survive the treatment can have an impact on the perpetuation of
transfection. The transfected cells, due to the damage caused by chemical agents, divide slower than
untransfected. Thus, the transfection efficiency is artificially depressed over time and the culture cannot
be kept for a longer period of time. However, the high cellular metabolic rate of quickly dividing HEK
cells enables stronger fluorescence compared to the neuronal cells (Figure 3.6).
ArcLight could be detected in cells expressing from the newly made psc_HCMV_ArcLight plasmid
in both HEK293 cells and neurons. Overall, FuGene chemical transfection performed on HEK cells had an
expression factor of 16.9% (n = 71). The results on the neuronal cells were 38.38% as an expression
factor.

RESULTS
64
Figure 3.6 Transduced HEK293 and cortical neurons
The HEK293 cells and cortical neurons were FuGene transfected with psc_HCMV_ArcLight construct (HEK293 at DIV1, cortical neurons at DIV7). The photos of HEK293 transfected cells were taken at DPT3 and at DPT7 for the neurons, at the highest illumination intensity and 100 ms exposure time. Transfected HEK293 cells, due to the fast metabolism rate, show much higher expression rate and due to it, fluorescence intensity, than transfected cortical neurons.
3.2.2. AAV transduction
Introducing the rAAV transduction serves as the specifically directed method for recombinant
DNA insertion to cortical neurons, due to the AAV6 natural serotype that favours neuronal cells. Thus, it
was expected to notably improve the cell viability, soundness and expression rate. The process of rAAV
packaging of the novel constructs (psc_hSyn1_ArcLight and pSub_hSyn1_Butterfly) into serotype 6 was
done at Baumann lab, Forschungszentrum Jülich GmbH. The procedure of virus packaging in HEK293
cells included co-transfected cells with an expression vector, a helper vector and a rep-cap vector. After
the virus was produced in the cells, the particles were isolated in 40% iodexanol.
The best relation between the cell survival and expression rate was achieved by using between
1.5k and 2.5k virus particles per cell (vp/cell). This was empirically proven by testing various ratios of
vp/cell, where with vp increase the volume of iodexanol is also increased. Since the iodexanol shows
cytotoxicity, it is necessary to balance the ratio of vp that will transduce the specific number of cells,
considering the volume of added iodexanol. The cells were transduced at DIV7, while sufficiently
measurable fluorescence intensity was achieved at DPT7 or more. Since the viruses contain constructs

RESULTS
65
with the neuron-specific hSyn1 promoter, the transduction rates were quantified on the neuronal cells
for every construct.
3.2.2.1. psc_hSyn1_ArcLight
For the ArcLight construct, due to its self-complementary vector, the first expression onset could
be observed already at DPT4. However, for the electrophysiology measurements, the cells were cultured
until the DPT7 or more. Compared to the FuGene transfection rates, the expression factor for AAV
transduction of this construct was higher (Figure 3.7) along while cells stayed healthy and able to form
networks. Quantitatively, 84.31% of all transduced cells showed observable fluorescence. From our
experience, we expect that about 10 – 20% of our cultured cells are glia. Since the ArcLight construct is
driven by hSyn1 promoter, which is neuron-specific, we assume that all fluorescent cells are neurons.
This result implies on the high transduction efficiency directed only towards the neuronal cells, omitting
the supporting glial cells.
As already mentioned, AAV transduction has other advantages besides it is gentler for the cells
than other DNA insertion methods. One of them, that was shown to be important for our experiments,
is serotype tropism. On the Figure 3.7 one can see comparison between FuGene transfected and AAV6
transduced cells with the same construct: psc_hSyn1_ArcLight. Besides the efficiency rate and overall
condition of the cells, there is a difference in the cell type where fluorescence can be observed.
Although driven by neuron-specific hSyn1 promoter, from the photos of FuGene transfected cells it
seems that the expression is not limited only to this cell type. According to the shape of the cell and its
flatness, we can assume that the cell marked with purple arrow belongs to glia.

RESULTS
66
Figure 3.7 Comparison between FuGene transfected and AAV transduced cortical neurons with ArcLight construct
The cortical neurons, transduced with AAVs (4k vp/cell) on the upper photos and FuGene transfected on the lower photos, at DPT7-14. On the left, there are DIC photos and on the right fluorescence. Both fluorescence photos were taken at 100 ms exposure time with maximal intensity of the lamp. As expected, AAV transduced cells that were fluorescent were neurons (red arrow), while with the transfected cells this was not the case. On the fluorescent photo of FuGene transfected cells, there is visible weak fluorescence probably in glia, not only in neurons (purple arrow).
Previous work in the institute supports efficiently different serotypes transduce cortical
neurons. In the work of Lange, primary culture was transduced with a GFP construct behind the HCMV
promoter (that is not restrictive to certain cell type) within naturally occurring serotypes of AAVs. The
cells were immunostained and counted separately according to the cell type. Among all live fluorescent
cells (n=242), the transduction efficiency rate was 97.1% for the neurons. The glial cell transduction was
only 2.9%. Thus, it was shown how AAV serotype 6 has favourable cell specific targeting. [73]

RESULTS
67
Figure 3.8 In vitro transduction of embryonic cortical neurons with rAAV6 serotype
The cortical neurons were transduced with GFP construct driven by HCMV promoter by rAAV6 at DIV7. First photo
shows GFP expression in the cells. On the second there are the same cells but immunostained with αGFP antibody,
while the third contains DNA stain Topro. The last photo shows all those photos merged; both of the fluorescent
cells are neurons.
(Figure adapted from [73])
3.2.2.2. pSub_hSyn1_Butterfly
Since the construct that is expressed in our Butterfly VSFP construct is actually a FRET pair, its
expression can be observed at two different wavelength. As a first option, there is mCitrine as a donor,
which is excitable at 514 nm. Its emission maximum is at 529 nm, which is in the green range. The other
option is observation of the acceptor fluorescence, which is mKate. Its excitation is at 588 nm, and
emission maximum at 633 nm. Considering this, the quantification of the expressing cells, transduced
with AAV6_pSub_hSyn1_Butterfly (2k vp/cell), was made using the both filter ranges. Results of the
expressing cells among the all possibly transduced cells were 70.7% for the mCitrine, and 52.8% for the
mKate fluorescence. Based on the properties of Butterfly 1.2 and camera properties, this difference in
fluorescence for each fluorophore is expected. Since it is a FRET pair, the energy transfer from donor to
acceptor may occur only when the distance between them is small enough. This happens when there is
a conformational change, due to the membrane depolarisation. Thus, the fluorescence decrease in
mCitrine (donor) is expected when the membrane is depolarised, i.e. during the action potential. For the
acceptor, mKate, the fluorescence is expected to increase at the same conditions. To achieve the
sufficient energy transfer towards the acceptor, the donor has to be fully excited in order to emit its
maximal energy. Regarding the camera properties, wavelengths in red spectrum are more difficult to
detect than those green/yellow. More specifically, due to the higher background in the red channel, the

RESULTS
68
contrast is worse. Combining those parameters, it is explainable why there are more fluorescent cells
observing mCitrine rather than mKate.
As mentioned earlier (1.5.4), the expression onset of a single-stranded vector takes more than
twice as long as for the self-complementary vector. Since the Butterfly construct was cloned into such a
vector (pSub_hSyn1), it is expected that the desired expression will be achieved by employing a longer
time period of expression. To check this assertion, photos of the different expressing cells were taken at
time points, spanning from 3 to 17 DPT. On each healthy, fluorescent cell, the ROI was hand-marked as
an area of the plasma membrane, avoiding overexposed nuclei. The exposure time was set to 100 ms at
maximum light intensity. The fluorescence intensity was quantified as the maximal value of the photon
counts for each ROI, subtracted from the background. Afterwards, the statistical analysis has been made
(Figure 3.9). For the cells measured in red channel at DPT3 (n=7, SE=0.71), the maximum value of a.u.
was 1.5. The cells measured at DPT10 (n=3, SE=0.33) have shown the a.u. value 2.33, and in those
measured at DPT17 (n=3, SE=1) it was almost three times as from the first measurement, or 4.3 a.u.
Measuring mCitrine in the green channel, the correlation of incensement in the counts over time is
found to be similar. Thus, for the measurements taken at DPT3 (n=7, SE=1.26) the maximum a.u. value
was 4, at DPT10 (n=3, SE=3.92) 6.33 and finally, at DPT17 it was 16 (n=3, SE=5.61). Besides the
increment trend of counts over time in both fluorophores, it is also shown that the fluorescence
intensity is higher in mCitrine than mKate, as described above. It is shown that the fluorescence
intensity is correlating with DPT due to the slow onset of expression.
Figure 3.9 mCitrine/mKate expression rates
Cortical neurons, transfected with pSub_hSyn_Butterfly, were measured by their fluorescence intensity on both channels of the FRET pair. The applied exposure time was 100 ms at maximum light intensity. For the measurements taken at DPT3 n=7 and for those taken at DPT10 and DPT17 n=3. The numbers above refer to the average mean count value measured for each hand-marked ROI in the plasma membrane at given DPT.
1,5 2,3334,3334
6,334
16
mKate expression rate mCitrine expression rate
DPT3 DPT10 DPT17

RESULTS
69
3.3. Electrophysiological results
Performing electrophysiological experiments on the genetically modified neurons with both
constructs aimed to correlate electrical and optical signals. AAV transduced neurons, due to their
healthiness, were stimulated by patch-clamp in whole-cell mode. In addition, transfected neurons were
stimulated by locally applying KCl solution.
3.3.1. Voltage - clamp fluorometry
In AAV transduced cortical neurons, the patched cells in whole-clamp mode were first checked
for their responsiveness to electric stimulation by the standard V-C protocol (described and attached in
7.3.1). Afterwards, the voltage-clamp stimulation protocol in 26 steps (described and attached in 7.3.1)
was triggered by the start of the optical recording to allow for post hoc analysis (2.4.2). The first action
potentials were formed around the 9th step, which was a depolarisation of 30 mV from the holding
potential of -70 mV. The typical action potential peak lasted for ~10 ms, sometimes even multiple action
potentials occurred during the one voltage step. For the optical measurements the exposure time of 100
ms was used with the maximum light intensity. The optical and electrical recording results are shown for
both, ArcLight-A242 (Figure 3.10) and Butterfly 1.2 VSFP (Figure 3.11). Black traces indicate applied
voltage during the stimulation protocol, and red indicate iteratively measured current in the electrical
recordings. Both variables were coordinated with sequentially extracted time (in s) from the TIDA file.
Four out of 26 representative pulses are shown. The raw data from ROI optical recordings were first
subtracted from the background. The adjusted curve of the fluorescence intensity over time was
smoothened by Savitzky-Golay method applied in Origin. Afterwards, the curve has been fitted to linear
plot and correlated with electrical variables over time.

RESULTS
70
Figure 3.10 Correlated electrical and optical signals for ArcLight-A242 VSFP
The cortical neurons, transduced with rAAV6 psc_hSyn1_ArcLight, were at DPT7/DIV14 stimulated by V-clamp and in
parallel, optically recorded. On the upper graph there are traces of the electrical responses of the cell (red) and
applied voltage (black) from the patch-clamp pipette, while the lower graph shows the time-correlated processed
optical trace (violet).

RESULTS
71
Figure 3.11 Correlated electrical and optical signals for Butterfly 1.2 VSFP
The cortical neurons, transduced with rAAV6 pSub_hSyn1_Buterfly, were at DPT7/DIV14 stimulated by V-clamp and
in parallel, optically recorded. On the upper graph there are traces of the electrical responses of the cell (red) and
applied voltage (black), while the lower graph shows time-correlated processed optical trace (violet).
In order to correlate electrical and optical responses of the cells, simultaneous electrical
stimulations and optical recordings were performed. In 26 voltage steps applied to transduced cells with
one or the other construct, we have been able to achieve membrane depolarisation and to induce few
action potentials. Despite that, according to the readout from the graphs (Figure 3.11) there is no
correlation between the electrical and optical signals (discussed in 4.2). The signal we expect would be
the fluorescence decrease for both proteins at given wavelengths (green filter set for both fuorophores),
correlating with the time when the action potentials actually occurred. Visualised in the processed
graphs, like those above, that would be a downward peak. In our recordings, the optical traces reveal
just noise and bleaching. From the raw data (Pogreška! Izvor reference nije pronađen.), as discussed
below (4.2), the bleaching rate is 9% per 70 s measurement at 100% intensity and 100 ms exposure
time. The optical noise, in turn, is high and caused by the fluctuations around. It becomes larger when

RESULTS
72
the number of detected photon counts is low, therefore causing the drop of SNR. The signal in raw data
terms, if it would be recorded, should be at least 2 SNR to be significant. Therefore, in voltage-clamp
fluorometry measurements for both proteins we have not successfully recorded significant decrease of
fluorescence that one can expect while stimulating action potentials.
3.3.2. Local KCl stimulation
As an alternative method for validating the protein functionality in vitro, the cells expressing
ArcLight A-242 and Butterfly were exposed to increased local concentrations of KCl solution. The cortical
neurons (from Figure 3.12) were chemically transfected by FuGene with pCAG_Butterfly construct. This
construct (a gift from the Knöpfel Lab) was used as a starting point for design of the further Butterfly
variants (2.2.2). The expression was driven by strong CAG promoter, HCMV-enhanced beta-actin
promoter. On the second example, the cortical neurons were also transfected by FuGene, but with
psc_HCMV_ArcLight construct (Figure 3.13). Here, the expression was driven by the strong HCMV
promoter.
The applied 0.15M KCl was added manually in the vicinity of the recorded cell (DIV15/DPT6 for
pCAG_Butterfly and DIV15/DPT5 for psc_HCMV_ArcLight) in a 4 ml plate, in order to transiently increase
the local K+ concentration. Thus, the membrane depolarisation was induced. This way, we have been
able to induce the fluorescence change in the cell membranes which we attribute to chemically
stimulated action potentials.

RESULTS
73
Figure 3.12 The fluorescence change of Butterfly VSFP induced by local KCl application
The cortical neurons were transfected with pCAG_Butterfly construct and optically recorded at DIV15/DPT6. Adding
0.15M KCl solution locally to the cell in 5 portions of 100 µl every 5 s, the fluorescence decrease has been observed
(using the green emission filter for mCitrine fluorescence observation and 200 ms exposure time). This implies
stimulation of action potentials which cause the decrease of fluorescence by 22.6 ± 4.37%.
0.15M KCl

RESULTS
74
Figure 3.13 The fluorescence change of ArcLight-A242 VSFP induced by local KCl application
The cortical neurons were transfected with psc_HCMV_ArcLight construct and optically recorded at DIV15/DPT5.
Adding 0.15M KCl solution locally to the cell in 5 portions of 100 µl every 5 s, the fluorescence decrease has been
observed at 200 ms exposure time. This implies the stimulation of action potentials followed by the decrease of
fluorescence by 11.27 ± 1.51%.
Observing both of the proteins upon membrane depolarisation in the green filter channel, it is
noticeable that their fluorescence intensity changes in the expected direction. The decrease in
fluorescence intensity in both VSFP expressing cortical neurons (Figure 3.12, Figure 3.13), correlates
with the time when 0.15M KCl solution was locally applied towards the measured cell. Since the solution
was injected manually, the time span between adding each portion is not exactly 5 s. In the case of
ArcLight A-242, in total 200 data points from raw data prior and after the peaks (0 - 5 s and 30 - 67 s)
were used to calculate F0. The maximum value, Fmax, is the highest value of the peak. Those values were
used to calculate ΔF/F0. For this measurement, ΔF/F0 is 22.6 ± 4.37% (n = 5). The signal-to-noise ratio
(SNR) was 4.43.
0.15M KCl
RESULTS
75
KCl addition to Butterfly 1.2 expressing cells should cause a local change of the membrane
potential, i.e. reduction of the negative potential. Thus, the Butterfly 1.2 domains undergo
conformational change what further leads to emission of the fluorescent light from both of the FRET
pairs. Depending on the observed wavelength, the output differs. In this case, mCitrine (donor)
fluorescence intensity change was observed, so a decrease of fluorescence is expected. In total 303 data
points from raw data prior and after the peaks (0 – 18 s and 55 – 67 s) were used to calculate F0. ΔF/F0
value in this measurement is 11.27 ± 1.51%. SNR was 1.72.
3.4. Imaging in real time
In order to observe the transduced cells expressing VSFP in real-time, the ZEISS live cell imaging
setup was used. The cortical neurons were transduced with psc_hSyn1_ArcLight AAV6 at the DIV7. At
DPT10, the cells were continuously recorded in the green channel with the filter set of 450 - 490 nm
excitation band, 500 - 550 nm emission band and beam splitter of 495 nm (2.5) every 100 ms exposure.
The cells could be easily distinguished according to their fluorescence (Figure 3.14), while the
illumination source was set to 100% intensity. The experiment was set in a way that there is continuous
recording of fluorescence in duration of 60 s. During this time, there is probability (due to the age of the
cells) that they will spontaneously fire and possibly propagate action potentials. This way, we should be
able to observe the change in fluorescence intensity at the time of spontaneous potential firing, but
there is no stimulation of the same at certain time.
Since the background fluorescence interferes with our cells of interest so they seem dim, it was
necessary to increase the exposure time. With 100 ms of it the cells appeared clearer, intensity of their
fluorescence was higher and thus, they were easier to distinguish from the background. These settings
enabled us optical recordings at the speed of 100 ms frame-rate, or 10 frames per second. Lowering the
exposure time trading-off the contrast between fluorescent cells and the background, we succeeded to
get down to 20 ms. With this settings, the recording speed is higher, but the cells expressing VSFP need
to appear very bright in order to avoid the background interferences. To determine optimal appropriate
exposure time, it is, besides the empirical settings, necessary to include information about the kinetics
of observed proteins. It is recommended to use at least as ½ of their expected response time. In our
case, that totals 25 ms (for 50 ms kinetics) for measuring ArcLight A-242.

RESULTS
76
Figure 3.14 psc_hSyn1_ArcLight transduced cortical neurons
Cortical neurons were transduced with 2k vp/cell psc_hSyn1_ArcLight AAV6 at 7 DIV. On the left, there is a photo of the neurons taken with differential interference contrast. On the right, the same neurons are fluorescing at green channel at 100 ms exposure with 100% illumination source intensity.
On both of the cells shown, the ROI was marked as a fluorescent area in the plasma membrane.
The upper cell was marked as R1, and the lower as R2. Using camera-associated program Zen for
analysis of the signals produced during the recording time (60 s), we have been able to determine the
decrease in the fluorescence for R1 in duration of 0.21 s (Figure 3.15). The post-processing of the raw
data included linearization of the intensity fluorescence curve in order to eliminate bleaching effect. The
amount of change in fluorescence (ΔF/F0) of the signal is -3.54%, where minus indicates decrease
according to the baseline, and SNR is 1.4. The signal occurred at the very end of the recording, at 57.799
s. In parallel, in the coupled neuronal cell there was no significant change in the fluorescence.

RESULTS
77
Figure 3.15 Fluorescence chart of the two transduced neurons expressing ArcLight-A242 VSFP
The traces show mean intensity values over time for ROI. Black trace corresponds to the ROI2 (neuron 2), and the
purple to the ROI1 (neuron1). From 57.799 s to 58.009 s the fluorescent value of ROI1 is lower than baseline.

DISCUSSION
78
4. DISCUSSION
In this work we wanted to introduce new genetic tools for non-invasive monitoring of neuronal
electrical activity and verify them. We used two types of VSFP: ArcLight-A242 and Butterfly 1.2. The
starting point of our work was re-design of the constructs at DNA level, aiming to improve their
expression features. Upon now, researches in the domain of voltage-sensors optogenetics have only
been focused on examination and enhancing functional properties of the proteins by electrophysiology
measurements [45, 50, 52, and 53]. Hereby, we decided to take additional approaches, improving and
specifying the expression in the retrograde manner; manipulating the promoter at first.
In the current scientific research, since the constructs of the ArcLight-A242 and Butterfly 1.2
were designed [42, 57], they have been used as original plasmids ever after. As for the ArcLight-A242
and Butterfly plasmids, this means VSFP sequence has been positioned after HCMV or CAG promoter.
The HCMV promoter is strong, constitutive promoter intended for mammalian cell expression [74]. The
other one, CAG is actually a strong synthetic promoter made by enhancing chicken-β-actin promoter
with HCMV enhancer element [75]. Both of the promoters are not cell type specific; they are used to
drive high levels of gene expression in mammalian vectors. Endeavouring to achieve expression
specificity, i.e. only in neuronal cells, we decided to change used promoters with neuron-specific hSyn. The additional approach of expression control included assembling of rAAV particles containing our
constructs for neuron-specific viral targeting. The viral serotype 6 has shown native tropism towards
neuronal cells [73]. To do so, the new plasmids were briefly designed and composed according to the
needs for afterwards rAAV production.
The psc_hSyn_ArcLight plasmid was produced cutting and multiplying ArcLight fragment by PCR,
adding EcoRI/SacI restriction sites on its ends to specify further ligation reaction. Produced in such a
way, ArcLight fragment was a perfect cohesive fit for the backbone plasmid psc_hSyn1 that already
contained rAAV necessary compounds like ITRs, SV40 etc., by SacI/EcoRI cohesive end ligation.
The Butterfly fragement was inserted into pSub plasmid, due to the remark from the
collaborators that it exceeds the experimental limit in size for sc vector incorporation. Because the
Butterfly fragment and Sub plasmid do not have the common restriction sites, a blunt-end ligation had
to be accomplished. Although generally very inefficient, we have successfully selected the new construct
pSub_hSyn1_Butterfly in right orientation.

DISCUSSION
79
4.1. Transfection/transduction rates and viability
To achieve quick and easy verification of plasmid expression, the HEK293 cells and neurons have
been chemically transfected. Even if it is not lipid-maintained, the harmfulness to the cell membranes
was apparent. Compared to the fragile neurons, the robust HEK293 cells have survived the transfection
treatment better, although with the lower transfection rate (16.9% for HEK293 and 38.38% for neurons).
This is not surprising, considering their everyday division and production of new, young and healthy
cells. During the long experimental trials of producing the appropriate constructs aiming for rAAV
production, however, the only remaining method of DNA insertion for the neurons was chemical
transfection. Since it is very damaging for the cells, they could not be successfully patched or subjected
to any electrophysiological experimental procedures in this condition. The flabby membranes could not
be sealed to the pipette tip during the patch-clamp so the gigaseal actually could not occur.
Although the expression of ArcLight or its derivatives in the transfected neurons in the recent
research did not appear to affect the protein properties [50], it has already been attempted to use
either lentivirus or AAV to express constructs in vivo instead of transfection. Hereby, after the successful
rAAV6 production, we transduced neurons. Since for the patch-clamp experiment is needed only one
healthy, fluorescent cell, there is no data in the literature suggesting the efficiency of the insertion
methods to compare with. The sufficient expression of ArcLight-A242 was observed from DPT7 (84%). As
far as the Butterfly expression (70.7% for mCitrine and 52.8% for mKate), due to the slow onset of
expression from the pSub vector, it was expected to achieve it later than for ArcLight. Accordingly, the
expression rate increased over time. Although it was known before that the drawback of pSub vector-
mediated gene transfer is the slow onset of expression, due to the rate-limiting step of ss to ds DNA
conversion [76], this result resolved a time-scale of expression duration. The firmness of the membrane
was improved and the neurons, have been successfully patched. This way, sealing the cell membrane to
the patch pipette tip did not have negative influence to measured parameters, so the further
electrophysiological measurements were carried out.
4.2. Electrophysiology results
On the healthy, fluorescent cells transduced by rAAV, we could perform the patch-clamp
experiments in the whole-cell V-C mode. The shape of an action potential was in accordance with the

DISCUSSION
80
typical shape of action potentials found in the literature [77]. Sometimes, it has happened that the patch
was lost during the recording, what could be seen from the shape of the current trace. It might be that
the cell did not endure the procedure if the recording was taking too long, or there was a case where
the patch pipette experienced drifts. Despite the technical difficulties before and during the experiment,
we have successfully recorded the fluorescence of the cell while stimulating it electrically.
In our results (Figure 3.10, Figure 3.11) despite the action potential triggering, there is no
detected change in fluorescence. Since the background noise was constantly at the high level, the
contrast between the fluorescent cells and their surroundings was not adequate. This could be
concluded considering the raw data, where the total number of photon counts was almost homogenous
over the whole visual field. Depending on the observed protein, excitation and illumination source
intensity, the difference between the ROI and the background was only 1%, respectively, 4%.
In all our recordings, there was no case of the noticeable signal appearance. One of the possible
reasons is the trade-off between the recording settings for Andor Zyla sCMOS camera and the sensitivity
of the measurements we would have liked to achieve. Considering the low contrast between the
fluorescent cell and the background, it is necessary to set the illumination source to 100% intensity and
increase the exposure time. Doing so, the bleaching effect is intensified (the photon count value during
the 70 s measurement drops approximately 9%). A similar bleaching value of 8% we have gotten
analysing the raw ROI data from the Live imager setup. This results, still, are in accordance with the
literature [50], where the bleach rates were from 4.83% to 6.38% but measured only during the first two
seconds of recordings. Considering the optical noise as a second by-product, we have calculated that it
effects our measurements in time-frame rate more than bleaching. Thus, it takes the role as a dominant
effector for our recordings in patch-clamp setup (2.4). In the live imager (2.5) the level of optical noise is
significantly lower. This is explainable by the fact that the patch-clamp setup is an open one, while the
live imager is completely closed in a shaded dark cupboard. This way, all the surrounding illumination
from the lab may not influence the live imager recordings.
The other approach one may think about is another side-effect of those settings; the kinetics of
our proteins cannot be shown (i.e. the ability for accurately defining an action potential is dropping off).
Besides, the recording rate automatically slows down. The highest we have been able to achieve for 100
ms exposure time and ~70 s of recording length was just 9.7 frame rates per second. According to the
kinetics of the VSFP we use and exposure time which is sufficient for their excitation, it is obvious that
even if the optical signal exists, it may not be recorded due to the low frame rate.

DISCUSSION
81
4.3. Imaging in real time
Using the Zeiss live imager inverted microscope, the live monitoring of the fluorescent cells was
done. The developer of ArcLight-A242 [50] provided reference values for the tested performance
parameters. While they used transfected HEK293 and hippocampal neurons, we used transduced
cortical rat neurons. The importance to examine characteristics of ArcLight under the new experimental
conditions is highlighted by the fact that ArcLight-A242 shows great differences in signal properties
across biological systems [50] and hardware of the used setup. The recording in duration of 60 s
successfully detected an action potential in the ROI1 (Figure 3.15). The decrease of fluorescence (ΔF/F0)
during the membrane depolarisation is -3.54%. It is lower than the literature values which is -35% [50],
this may imply that there was depolarisation of the membrane, but not the full action potential change
in potential.
Considering SNR, it is 1.4. This value is also below standard values that indicate significance of
the signal (which is 2). Since it seems that the two fluorescent neuronal cells are forming a small
network, one could expect the signal propagation from one to another. In this case, we should be able
to notice the fluorescence decrease in ROI2 as well. Unfortunately, this is not the case. Fluorescence
intensity of ROI2, during the whole recording period remains without any changes. It is supposed that
the signal during propagation decreased and it was insufficient to cause the changes in VSFP. Besides,
one can think about failed transmission as another possible explanation. If the signal in ROI1 would be
significant, we could expect to see its propagation and the same outcome of the membrane
depolarisation on ROI2 as a decrease in fluorescence.
In comparison to other imaging method such as calcium signalling, there are few differences we
can discuss. Considering Ca2+ multiple pathways and roles in the cell signalling, gene transcription,
muscle contraction and cell proliferation, it is not surprising that it is highly regulated [78]. During the
action potential, Ca2+ enters the cell, what is by default time - consuming. Therefore, this method
provides indirect measure of neuronal activity, limited to certain parts of the neuronal cell. Since VSFP
are already there, incorporated into the cell membrane, it is not surprising that by them resolving an
action potential is much faster and therefore more reliable (as we have shown, in ms time scale
according to even s range in calcium imaging). These parameters, of course, depend on the applied
exposure time and the frame rate of recording. Besides, their powerful advantage is resolving
subtreshold action potentials, while calcium imaging can resolve only spiking activities.
CONCLUSION
82
5. CONCLUSION
Despite all the recent achievements in the neuroscience, the questions that have motivated
scientists about the information processing in individual neurons still remain unanswered. Studying
neuronal behaviour in vitro facilitates the availability of a single neuron investigation, but requires non-
invasiveness with high spatial and temporal resolution. Expansion of the neurophysiologic recording
toolbox with the optogenetic stimulation has enabled such recordings.
The included work shows the usage of genetically encoded voltage-sensitive fluorescent
proteins as a non-invasive optogenetic tool for recording electrophysiological signals in
electrogenic cells.
The cortical neurons have been transduced with the new constructs, hSyn_ArcLight and
hSyn_Butterfly by recombinant adeno-associated viral vectors.
These novel constructs, specifically expressed in the neuronal cells, have been evaluated
by electrophysiological experiments with electrical stimulations recorded optically.
It has been shown that ArcLight A-242 is a valuable tool for recording and detection of
single action potentials.
Although not successful so far (due to the available equipment), Butterfly should be an
even more reliable tool for the detection of even sub-threshold potential changes.
Going forward, it might be assumed that the optogenetic toolbox, enriched by those two
components, is a step closer to non-invasive, optical monitoring of neural electrical activity.

BIBLIOGRAPHY
83
6. BIBLIOGRAPHY
1. Golding, B., Evolution: when was life's first branch point? Curr Biol, 1996. 6: p. 679-82. 2. Guyton, A.C. and J.E. Hall, Textbook of Medical Physiology. 11th ed. 2006: Elsevier Saunders. 3. Byrne, J., An electronic textbook for the neurosciences. 2013: The University of Texas Medical
School at Houston. 4. Jarosz, Q., Neuron. 2009: http://en.wikipedia.org. 5. Alberts, B., Johnson, A. and J. Lewis, Molecular Biology of the Cell. Vol. 5th edition. 2007, New
York: Garland Science. 6. Nagel, S.M. and G.L. K., Introductory Biological Psychology Tutorials. 2008: Saginaw Valley State
University, Athabasca University. 7. Christie, W.W. An Introduction to Sphingolipids and Membrane Rafts. 2013; Available from:
http://lipidlibrary.aocs.org/Lipids/introsph/index.htm. 8. Hursh, J.B., Conduction Velocity and Diameter of Nerve Fibers. Vol. 127. 1939. 131-139. 9. Byrne, J.H. and J.L. Roberts, From Molecules to Network - An Introduction to Cellular and
Molecular Neuroscience. Vol. 2nd Edition. 2009, London, UK: Elsevier Inc. . 10. Blaustein, M.P., J.P.Y. Kao, and D.R. Matteson, Cellular Physiology and Neurophysiology. Vol.
2nd Edition. 2012, Philadelphia: Elsevier, Mosby 11. Squire, L., Berg, D., Bloom, F., du Lac, S., Ghosh, A. and N. Spitzer, Fundamental Neuroscience.
Vol. 3rd Edition. 2008: Academic Press. 12. Images, L.C., Types of Neurons Illustration showing three types of neurons. 1989-2001,
Lippincott Williams & Wilkins: Baltimore, MD. 13. Smith, C.U.M., Elements of Molecular Neurobiology. Vol. 3rd Edition. 2002, Department of
Vision Sciences, Aston University, Birmingham, UK: John Willey & Sons, LTD. 14. Singer, S.J. and G.L. Nicolson, The fluid mosaic model of the structure of cell membranes.
Science, 1972. 175: p. 720-31. 15. Edidin, M., Membrane cholesterol, protein phosphorylation, and lipid rafts. Sci STKE, 2001: p.
pe1. 16. Wisniewska, A., J. Draus, and W.K. Subczynski, Is a fluid-mosaic model of biological membranes
fully relevant? Studies on lipid organization in model and biological membranes. Cell Mol Biol Lett, 2003. 8: p. 147-59.
17. Sonnino, S. and A. Prinetti, Membrane domains and the "lipid raft" concept. Curr Med Chem, 2013. 20: p. 4-21.
18. Nelson, D.L., A.L. Lehninger, and M.M. Cox, Lehninger principles of biochemistry. 2008, New York: W.H. Freeman.
19. Burn, P., Amphitropic proteins: a new class of membrane proteins. Trends Biochem Sci, 1988. 13: p. 79-83.
20. Ruiz, M., A detailed diagram of the cell membrane. 2007: http://en.wikipedia.org. 21. Cohen, J. and F. Khalili-Araghi, Case Study: Structure of Ion Channels. 2012, NIH Center for
Macromolecular Modeling & Bioinformatics: Universitiy of Illinois at Urbana-Champaign. 22. Lai, H.C. and L.Y. Jan, The distribution and targeting of neuronal voltage-gated ion channels. Nat
Rev Neurosci, 2006. 7: p. 548-62. 23. Lodish, H., et al., Molecular Cel Biology. Vol. 5th Edition. 2004, New York: WHFreeman. 24. Sigg, D.C., et al., Basic Cardiac Electrophysiology: Excitable Membranes, in Cardiac
Electrophysiology Methods and Models. 2010, Springer. 25. Boron, F.B. and E.L. Boulpaep, Electrical Model of a Cell Membrane, in Medical Physiology. 2008,
Elsevier Health Sciences.

BIBLIOGRAPHY
84
26. Bedard, C. and A. Destexhe, Generalized cable theory for neurons in complex and heterogeneous media. Phys Rev E Stat Nonlin Soft Matter Phys, 2013. 88: p. 022709.
27. Jaeger, D., Realistic Single Cell Modeling – from Experiment to Simulation. Brains, Minds and Media, 2005.
28. Boron, W.F., Boulpaep, E. L., Signal Conduction in Dendrites, in Medical Physiology. 2008, Elsevier Health Sciences.
29. Beals, M., Gross, L., Harrell, S. Synapse transmission. 1999. 30. Horn, R., How ion channels sense membrane potential. Proc Natl Acad Sci U S A, 2005. 102: p.
4929-30. 31. Tiriveedhi, V., Miller, M., Butko, P. and M. Li, Autonomous transmembrane segment S4 of the
voltage sensor domain partitions into the lipid membrane. Biochim Biophys Acta, 2012. 1818: p. 1698-705.
32. Li, Q., Wanderling, S., Paduch, M., Medovoy, D., Singharoy, A., McGreevy, R., Villaba'Galea, C., E Hulse, R., Roux, B., Schulten, K., Kossiakoff, A. and E. Perozzo, Structural mechanism of voltage-dependent gating in an isolated voltage-sensing domain. Nat Struct Mol Biol, 2014. 21: p. 244-52.
33. Bezanilla, F., The action potential: from voltage-gated conductances to molecular structures. Biol Res, 2006. 39: p. 425-35.
34. Barnett, M.W. and P.M. Larkman, The action potential. Practical neurology, 2007. 7(3): p. 192-7. 35. Hodgkin, A.L. and A.F. Huxley, Resting and action potentials in single nerve fibres. J Physiol,
1945. 104: p. 176-95. 36. Mantegazza, M. and W.A. Catterall, Voltage-Gated Na+ Channels: Structure, Function, and
Pathophysiology, in Jasper's Basic Mechanisms of the Epilepsies, J.L. Noebels, et al., Editors. 2012: Bethesda (MD).
37. Bullock, T.H., R. Orkand, and A. Grinnell, Introduction to Nervous System. 1977, San Francisco: W. H. Freeman & Co. .
38. Bean, B.P., The action potential in mammalian central neurons. Nat Rev Neurosci, 2007. 8: p. 451-65.
39. Schematic of an action potential. 2007, http://en.wikipedia.org. 40. Saltatory conduction. http://bio1152.nicerweb.com/Locked/media/ch48/myelin.html. 41. Propagation of action potential.
http://www.rci.rutgers.edu/~uzwiak/AnatPhys/APFallLect18.html. 42. Akemann, W., Mutoh, H., Perron, A., Park, Y., Iwamoto, Y. and T. Knöpfel., Imaging neural circuit
dynamics with a voltage-sensitive fluorescent protein. J Neurophysiol, 2012. 108: p. 2323-37. 43. Babiloni, C., Pizzella, V., del Gratta, C., Ferretti, A. and G. Romani, Fundamentals of
electroencefalography, magnetoencefalography, and functional magnetic resonance imaging. Int Rev Neurobiol, 2009. 86: p. 67-80.
44. Wintermark, M., Sesay, M., Barbier, E., Borbely, K., Dillon, J., Glenn, T., Grandin, C., Soustiel, J., Nariai, T., Zaharchuk, G., Caille, J., Dousset, V. and H. Yonas, Comparative overview of brain perfusion imaging techniques. Stroke, 2005. 36: p. e83-99.
45. Perron, A., Mutoh, H. and T. Knöpfel, Second and third generation voltage-sensitive fluorescent proteins for monitoring membrane potential. Front Mol Neurosci, 2009. 2: p. 5.
46. Canepari, M. and D. Zecevic, Design and Use of Organic Voltage Sensitive Dyes, in Membrane Potential Imaging in the Nervous System. 2011. p. 13-23.
47. Murata, Y., Iwasaki, H., Sasaki, M., Inaba, K. and Y. Okamura, Phosphoinositide phosphatase activity coupled to an intrinsic voltage sensor. Nature, 2005. 435: p. 1239-43.
48. Kohout, S.C., Bell, S., Liu, L., Xu, Q., Minor, D. and E. Isacoff, Electrochemical coupling in the voltage-dependent phosphatase Ci-VSP. Nat Chem Biol, 2010. 6: p. 369-75.

BIBLIOGRAPHY
85
49. Okamura, Y., Lipids: PI couples voltage to catalysis. Nat Chem Biol, 2010. 6: p. 315-6. 50. Jin, L., et al., Single action potentials and subthreshold electrical events imaged in neurons with
a fluorescent protein voltage probe. Neuron, 2012. 75: p. 779-85. 51. Ahern, C.A., The secret lives of voltage sensors. J Physiol, 2007. 583: p. 813-4. 52. Cao, G., et al., Genetically Targeted Optical Electrophysiology in Intact Neural Circuits. Cell, 2013.
154: p. 904-913. 53. Villalba-Galea, C.A., et al., Charge movement of a voltage-sensitive fluorescent protein. Biophys
J, 2009. 96: p. L19-21. 54. Piston, W.D., Claxton, N. S., Olenych, S. G., Davidson, M. W., The Fluorescent Protein Color
Palette. Olympus corporation. 55. McNamara, G., Multi-Probe Microscopy. 2011: The University of Texas MD Anderson Cancer
Center. 56. Han, Z., Jin, L., Chen, F., Loturco, J., Cohen, L., Bondar, A., Lazar, J. and V. Pieribone, Mechanistic
Studies of the Genetically Encoded Fluorescent Protein Voltage Probe ArcLight. PLoS One, 2014. 9: p. e113873.
57. Han, Z., Jin, L., Platisa, J., Cohen, L., Baker, B. and V. Pieribone, Fluorescent protein voltage probes derived from ArcLight that respond to membrane voltage changes with fast kinetics. PLoS One, 2013. 8: p. e81295.
58. Akemann, W., Sasaki, M., Mutoh, H., Imamura, T., Honkura, N. and T. Knöpfel, Two-photon voltage imaging using a genetically encoded voltage indicator. Sci Rep, 2013. 3: p. 2231.
59. Shcherbo, D., Merzlyak, E., Chepurnykh, T., Fradkov, A., Ermakova, G., Solovieva, E., Lukyanov, K., Bogdanova, E., Zaraisky, A., Lukyanov, S. and D. Chudakov, Bright far-red fluorescent protein for whole-body imaging. Nat Methods, 2007. 4: p. 741-6.
60. Vasileva, A. and R. Jessberger, Precise hit: adeno-associated virus in gene targeting. Nat Rev Microbiol, 2005. 3: p. 837-47.
61. Aschauer, D.F., S. Kreuz, and S. Rumpel, Analysis of transduction efficiency, tropism and axonal transport of AAV serotypes 1, 2, 5, 6, 8 and 9 in the mouse brain. PLoS One, 2013. 8: p. e76310.
62. Cearley, C.N. and J.H. Wolfe, Transduction characteristics of adeno-associated virus vectors expressing cap serotypes 7, 8, 9, and Rh10 in the mouse brain. Mol Ther, 2006. 13: p. 528-37.
63. Goncalves, M.A., Adeno-associated virus: from defective virus to effective vector. Virol J, 2005. 2: p. 43.
64. Bleijs, D.A. Adeno-Associated Viral Vectors. 2013. 65. Zincarelli, C., Soltys, S., Rengo, G. and J. Rabinowitz, Analysis of AAV serotypes 1-9 mediated
gene expression and tropism in mice after systemic injection. Mol Ther, 2008. 16: p. 1073-80. 66. Dreyfuss, J.L., Regatieri, C., Jarrouge, T., Cavalheiro, R. Sampaio, L. and H. Nader, Heparan sulfate
proteoglycans: structure, protein interactions and cell signaling. An Acad Bras Cienc, 2009. 81: p. 409-29.
67. Kotin, R.M., Siniscalo, M., Smulski, R., Zhu, X.D., Hunter, L., Laughlin, C.A., McLaughlin, S., Muzyczka, N., Rocchi, M. and K.I. Berns, Site-specific integration by adeno-associated virus. Proc Natl Acad Sci U S A, 1990. 87: p. 2211-5.
68. Daya, S. and K.I. Berns, Gene therapy using adeno-associated virus vectors. Clin Microbiol Rev, 2008. 21: p. 583-93.
69. de Backer, M.W., Garner, K.M., Luijedijk, M.C. and R.A. Adan, Recombinant adeno-associated viral vectors. Methods Mol Biol, 2011. 789: p. 357-76.
70. Ferrari, F.K., Samulski, T., Shenk, T. and R.J. Samulski, Second-strand synthesis is a rate-limiting step for efficient transduction by recombinant adeno-associated virus vectors. J Virol, 1996. 70: p. 3227-34.

BIBLIOGRAPHY
86
71. Grieger, J.C., V.W. Choi, and R.J. Samulski, Production and characterization of adeno-associated viral vectors. Nat Protoc, 2006. 1: p. 1412-28.
72. Elektronik, H., Manual 2.4; EPC10 / EPC10 USB, in Patch Clamp Amplifier. 2014, HEKA Elektronik Dr. Schulze GmbH.
73. Lange, W., Transduktion von primären corticalen Neuronen aus der Ratte. 2011, Institute of Bioelectronics: Forschungszentrum Juelich.
74. Addison, C.L., Hitt, M., Kunsken, D. and F.L. Graham, Comparison of human versus murine cytomegalovirus immediate early gene promoters for transgene expression by adenoviral vectors. J Gen Virol, 1997. 78: p. 1653-61.
75. Hong, S., Hwang, D.Y., Yoon, S., Isacson, O., Ramezani, A., Hawley, R.G. and K.S. Kim, Functional analysis of various promoters in lentiviral vectors at different stages of in vitro differentiation of mouse embryonic stem cells. Mol Ther, 2007. 15: p. 1630-9.
76. Bernardi, G. and S.C. Makrides, Gene transfer and expression in mammalian cells. Vol. 38. 2003, the Netherlands: New comprehensive biochemistry, Elsevier.
77. Gold, C., Henze, D.A., Koch, C. and G. Buzsaki, On the origin of the extracellular action potential waveform: a modeling study. J Neurophysiol. 2006. 95: p. 3113-28.
78. Bootman, M.D., Collins, T.J., Peppiatt C.M., Prothero, L., MacKenzie, L. and P. De Smet, Calcium signaling - an overview. Cell & Developmental Biology, 2001. 12: p. 3-10.

APPENDIX
87
7. APPENDIX
7.1. List of Tables
Table 1. Major ionic components of intra and extracellular fluids and their equilibrium potential. ......... 16
Table 2. Neurobasal medium (NB) contents ............................................................................................. 41
Table 3. PCR reaction contents and procedure ......................................................................................... 44
Table 4. Supplemented RPMI contents ..................................................................................................... 49
Table 5. List of used reagents and their suppliers ..................................................................................... 50
Table 6. The list of filters and accompanying wavelengths ....................................................................... 51
Table 7. Extracellular and intracellular patch solution contents ............................................................... 53
7.2. List of Figures
Figure 1.1 The structure of a typical neuron. ............................................................................................ 10
Figure 1.2 Three types of neuron morphology ......................................................................................... 12
Figure 1.3 Scheme of the cell membrane and its components. ................................................................ 14
Figure 1.4 Differential distribution of ions across the plasma membrane of neurons. ............................. 15
Figure 1.5 Schematic view of plasma membrane in 3D, with salient Na+ and K+ voltage-gated ion
channels (a) and analogous electrical circuit (b). ...................................................................................... 18
Figure 1.6 Cable theory's simplified view of a neuronal fiber as an electric circuit................................... 19
Figure 1.7 A model of the EPSP conductance ........................................................................................... 20
Figure 1.8 Model of a voltage-gate potassium channel subunit in the plasma membrane. ..................... 21
Figure 1.9 Conventional model of voltage sensor movement during depolarisation. .............................. 22
Figure 1.10 Action potential recording between inside and outside of a giant squid axon. ..................... 23
Figure 1.11 Schematic of a neuronal action potential. ............................................................................. 25
Figure 1.12 The saltatory conduction. ...................................................................................................... 26
Figure 1.13 Propagation of action potential. ............................................................................................ 27
Figure 1.14 Structures of a voltage-gated ion channel and Ci-VSP. .......................................................... 30
Figure 1.15 Schematic mechanism of Ci-VSP action. ................................................................................ 31
Figure 1.16 Chromophore structural motifs of GFP variants .................................................................... 32

APPENDIX
88
Figure 1.17 Scheme of ArcLight-A242 VSFP .............................................................................................. 33
Figure 1.18 Scheme of Butterfly 1.2 VSFP ................................................................................................. 34
Figure 1.19 AAV life cycle. ......................................................................................................................... 37
Figure 1.20 Comparison between conventional ssAAV and scAAV vectors .............................................. 38
Figure 2.1. Molecular cloning scheme of psc_hSyn1_ArcLight plasmid .................................................... 45
Figure 2.2 Molecular cloning scheme (1) of pSubc_hSyn1_Butterfly plasmid: blunt end ligation ............ 46
Figure 2.3 Molecular cloning scheme (2) of pSubc_hSyn1_Butterfly plasmid: general overview ............. 47
Figure 2.4 Schematic depiction of the illumination path in VCF setup...................................................... 52
Figure 2.5 Visualisation of the stimulation protocol ................................................................................. 55
Figure 3.1 Map of the psc_hSyn_ArcLight plasmid ................................................................................... 59
Figure 3.2 ArcLight-A242 fragment evaluation by restriction enzyme digestion and gel-electrophoresis 60
Figure 3.3 ITR evaluation by restriction enzyme digestion and gel-electrophoresis for
psc_hSyn1_ArcLight .................................................................................................................................. 60
Figure 3.4 Map of the pSub_hSyn_Butterfly plasmid................................................................................ 62
Figure 3.5 ITR evaluation by restriction enzyme digestion and gel-electrophoresis for
pSub_hSyn1_Butterfly .............................................................................................................................. 62
Figure 3.6 Transduced HEK293 and cortical neurons ................................................................................ 64
Figure 3.7 Comparison between FuGene transfected and AAV transduced cortical neurons with ArcLight
construct ................................................................................................................................................... 66
Figure 3.8 In vitro transduction of embryonic cortical neurons with rAAV6 serotype .............................. 67
Figure 3.9 mCitrine/mKate expression rates............................................................................................. 68
Figure 3.10 Correlated electrical and optical signals for ArcLight-A242 VSFP ........................................... 70
Figure 3.11 Correlated electrical and optical signals for Butterfly 1.2 VSFP.............................................. 71
Figure 3.12 The fluorescence change of Butterfly VSFP induced by local KCl application......................... 73
Figure 3.13 The fluorescence change of ArcLight-A242 VSFP induced by local KCl application ................ 74
Figure 3.14 psc_hSyn1_ArcLight transduced cortical neurons .................................................................. 76
Figure 3.15 Fluorescence chart of the two transduced neurons expressing ArcLight-A242 VSFP ............. 77

APPENDIX
89
7.3. Protocols
7.3.1. Standard V-C protocol
A standard V-C protocol starts with the resting membrane potential that is set in TIDA after
forming a high resistance in the membrane, a gigaseal. Then, the membrane potential is stepped from
resting to holding potential with incensement of 10 mV and then stepped back to resting potential. The
written stimulation code for TIDA is saved as .stm file and as such, attached here. It is indicated that
there are 26 loops.
rem Aufsteigende (-50 bis +50 mV) VC-Pulsserie zur Zellanregung rem Dateiname: VC-check.stm rem Beschreibung: - Generierung einer Serie von 20 200 ms Pulsen: -50mV, ... , +50mV rem - Pause vor den Pulsen jeweils 50 ms rem - Pause zwischen den Pulsen jeweils 50 ms rem - Anzeige des Stromkanals Channel 2 und Spannungskanals Channel 1 rem - Über Kanal 5 wird paralell eine die externe Spannung rem aufgezeichnet rem (FET Input) rem - Die Stimulation erfolgt um den Faktor 10 überhöht da der EPC 9 rem ein rem Signalteilverhältnis von 1:10 aufweist. rem - Achtung: Spannung ist abhängig vom Haltepotential und wird damit rem verrechnet(hier -50 mV) rem Initialisierung channels 3 3 4 5 pps 25000 da 1 0 da 2 0 da 3 0 da 4 0 rem Umschalten in Overwrite Mode zur überlagerten Darstellung der Kurven owr rem Beginn der Wiederholungsschleife zur 11-fachen Wiederholung for 26 acq rem Pulsformung: 50 ms Pause vor Puls da 2 0 wait 50 da 2 -.50 * wait 200 da 2 0 wait 50 rem Ende der Wiederholungsschleife mit Erhöhung der Pulsspannung um je 10 mV sacq next 0.1 end

APPENDIX
90
7.3.2. Stimulation V-C protocol
The stimulation protocol, written and adjusted according to the stimulation preferences in the
fluorescent cortical neurons, is attached here. There are two active channels here, #2 (voltage) and #3
(current). It is indicated that the trigger gives a signal to start the iteration of 26 loops. The program is
adjusted to the exposure time of 100 ms; hereby the duration time of every step is multiplied 6-10x
regarding the standard V-C check protocol.
rem Aufsteigende (-50 bis +50 mV) VC-Pulsserie zur Zellanregung rem Dateiname: VC_onetimetrigger_ex100ms_Zeljka.stm rem Beschreibung: - Generierung einer Serie von 20 200 ms Pulsen: -50mV, ... , +50mV rem - Pause vor den Pulsen jeweils 50 ms rem - Pause zwischen den Pulsen jeweils 50 ms rem - Anzeige des Stromkanals Channel 2 und Spannungskanals Channel 1 rem - Über Kanal 5 wird paralell eine die externe Spannung aufgezeichnet (FET rem Input) rem - Die Stimulation erfolgt um den Faktor 10 überhöht da der EPC 9 ein rem Signalteilverhältnis von 1:10 aufweist. rem - Achtung: Spannung ist abhängig vom Haltepotential und wird damit rem verrechnet(hier -50 mV) rem Initialisierung channels 2 2 3 pps 25000 da 1 0 da 2 0 da 3 0 da 4 0 rem Umschalten in Overwrite Mode zur überlagerten Darstellung der Kurven owr Trigger X rem Beginn der Wiederholungsschleife zur 11-fachen Wiederholung for 26 acq rem Pulsformung: 50 ms Pause vor Puls da 2 0 wait 1000 da 2 -.50 * wait 600 da 2 0 wait 1000 rem Ende der Wiederholungsschleife mit Erhöhung der Pulsspannung um je 10 mV sacq next 0.1 end

ACKNOWLEDGEMENTS
91
8. ACKNOWLEDGEMENTS
I would like to express my greatest appreciation to Prof. Offenhäusser, the head of the Institute of
Bioelectronics, ICS-8, for the given opportunity to become a part of the research team. With his
professional support and inspiration, I was able to conduct my very first interdisciplinary research
project as a Master thesis. My deep gratitude goes to Dr. Vanessa Maybeck, my research supervisor, for
the patient guidance through the project with the constant constructive discussions, suggestions and
critics. Besides, for the professional and psychological encouragement while struggling with difficulties
in research as well as in private. Hereby, I would like to extend my special thanks to Dr. Wienke Lange,
who has supervised me from the early beginnings in the lab, yet as a summer student and motivated me
for pursuing the Master thesis here. Just as much I want to thank Prof. Ivančid – Bade for being my on-
distance supervisor at the home Faculty of Science, University of Zagreb.
The cell – culture experiments would be impossible without the lab technicians Bettina Breuer and
Rita Fricke, who did the neuronal cell preparation every week. Additionally, I would like to thank Prof.
Baumann from the Institute of Cellular Biophysics, ICS-4, for the advice in molecular cloning and for
finding alternative solutions for many obstacles on the molecular level that have interfered with our
work. Also, my grateful thanks belong to Anne Günther and Nadine Gruteser for the virus preparation
and the help with the plasmid design.
As one of the two main subjects of this work, plasmid CAG_Butterfly, was originally designed at
the Knöpfel Lab. The basic idea of its modification and potential usage has arisen after it was given to
ICS-4, as a present. Hence, thank you!
I wish to acknowledge the men’s support and every day’s life discussions provided by my
irreplaceable office mates: Lars, Bernd and Duy. A great appreciation to Wenfang, who has always been
here as an older and more experienced student willing to help. To all other members of the IBN-2/PGI-
8/ICS-4, thanks for providing a pleasurable working atmosphere (and cakes), where one can find a lot of
motivation even during the most difficult days. It was a pleasure to work with you!
For giving me the very first lab experiences and introducing me with the science abroad already
during the bachelor study, I am thankful to Sandra Vidak. Conducting this thesis abroad, from the

ACKNOWLEDGEMENTS
92
administrative point of view, would be much more difficult without the immense help of Student office
workers, Vlatka Marjan and Sanjica Mihaljevid.
As an external support, first I would like to thank my closest family; mom, dad and sis for all the
sacrifices they made on my behalf, encouraging my education and understandings they had while raising
me as a grown-up, independent and tolerable citizen of the world. I am thankful to all other family
members who were also a tail wind, both emotionally and financially. I consider a huge luck to have so
many good friends who, although far away, were always achievable as an emotional support. Therefore,
Antonela, Barbara, Iva, Ivana, Lara, Marta, Nataša, Petre, Stela, Tihana, hvala! To my molecool friends,
nowadays scattered around Europe, a great thank for feeling so close to you, no matter where. Adrijana,
Marija, Vesna, Alen, Frane, Goran, Kruno, hvala! Finally, for limitless encouragement, motivation, joyful
moments and journeys on our way, as well as for scientific help, heartfelt thanks to Alexey.

CURRICULUM VITAE
93
9. CURRICULUM VITAE
Zeljka Trepotec
Dubovecki breg 24; 48000 Koprivnica, Croatia +49(0)16092238751; +385(0)99797243 [email protected]
Personal information
Date of birth 01/10/1990
Nationality Croatian
Education
09/2012 – 02/2015 M.Sc. in Molecular Biology University of Zagreb, Faculty of Science, Department of Biology Master thesis: “Optogenetic monitoring of neuronal electrical activity using fluorescent protein-based voltage sensors” conducted at Research Center Jülich at the Institute of Complex Systems/Bioelectronics supervised by Prof. Dr. Andreas Offenhäusser GPA: 4.5/5.0
09/2009 – 09/2012 B.Sc. in Molecular Biology University of Zagreb, Faculty of Science, Department of Biology Bachelor thesis: “Genetic instability in cancer and Telomeres” supervised by Dr. Inga
Marijanovic
Research and work experience
03/2014 – 02/2015 Institute for Complex Systems/Bioelectronics (ICS-8), Research Center Jülich; Germany Master student
Thesis project “Optogenetic monitoring of neuronal electrical activity using fluorescent protein-based voltage sensors”
Description: novel voltage sensor fluorescent proteins (ArcLight A-242 and Butterfly 1.2) were introduced as a non-invasive method for action potential recordings in cortical neurons
Experience: voltage-clamp fluorometry, adeno-associated viral (AAV) transduction, molecular cloning and neuronal cell-culture
07/2013 – 10/2013 Research internship
Worked on the research project “Genetically targeted optogenetic transduction”
Description: achieved temporal and spatial control of neuronal activity of cells expressing light-activated ion channel (Channelrhodopsin-2)
Experience: patch-clamp and multielectrode array measurements, immunofluorescence staining, fluorescence microscopy, molecular cloning, AAV transduction and neuronal cell-culture
07/2012 – 08/2012 Max F. Perutz Laboratories, Vienna Biocenter; Austria
Summer internship
Participated in the project “The role of Nucleoplasmic Lamin A/C-Lap2α-pRb Complexes in Hutchinson-Gilford Progeria Syndrome”

CURRICULUM VITAE
94
Description: investigation of potential deregulation of the signalling pathway (of the pRb protein) in the development of cellular progeria phenotypes upon progerin expression
Experience: cell-culture of human fibroblasts and HeLa cells, PCR, Western blotting and molecular cloning
09/2010 – 02/2011 University of Zagreb, Faculty of Science, Department of Biology; Croatia
Student teaching assistant of the Cell Biology course Guided students through the practical part and assisted in explaining theory
Scholarships
03/2014 – 02/2015 Erasmus Student mobility Practicum (SMP) and Erasmus+ SMP grant EU Erasmus Program
07/2013 – 10/2013 “IHRS BioSoft Guest Student Programme” Internship Program Scholarship International Helmholtz Research School of Biophysics and Soft Matter
09/2009 – 02/2015 Student scholarship City of Koprivnica
Professional skills
• Knowledge and experience with laboratory animals in biological research • HPLC course conducted at Ruder Boskovic Institute (Zagreb, Croatia)
• Bioinformatics course (University of Zagreb)
Additional skills
Languages • English – fluent • German, Italian – basic • Croatian – mother tongue
Computing • Microsoft Office™ tools (Word™, Excel™ and PowerPoint™) • Molecular Biology software (SerialCloner, GENtle and SnapGene) • Programs for statistical and data analysis (R and Origin, ImageJ)
Management • Project liaison for the popular scientific manifestation Biology night (2009–12)
• Leader of Odonatology section of Biology student association BIUS (2 years) • Fieldwork on island Hvar (2011 for 10 days) and island Cres (2013 for 10 days) -
inventarisation of dragonflies • Part-time promoter of the food products for Podravka Inc. (a food processing and pharmaceutical company), Koprivnica, Croatia
Licenses • Driving license (Category B) • Diving license CMAS1*/Open Water Diver PADI
Attendances
9-10/2014 12th Greta Pifat Mrzljak International School of Biophysics (Primosten, Croatia)
10/2014 16th EMBL PhD Symposium (Heidelberg, Germany)
11/2013 10th Forensic Science Symposium (Ankara, Turkey)
06/2013 8th ISABS Conference on Forensic and Anthropologic Genetics and Mayo Clinic Lectures in Individualised Medicine (Split, Croatia)