oracle fusion middlewareoracle® fusion middleware tuning performance of oracle weblogic server 12c...
TRANSCRIPT

Oracle® Fusion MiddlewareTuning Performance of Oracle WebLogic Server
12c (12.2.1.2.0)
E77983-03
December 2016
This document is for people who monitor performance andtune the components in a WebLogic Server environment.

Oracle Fusion Middleware Tuning Performance of Oracle WebLogic Server, 12c (12.2.1.2.0)
E77983-03
Copyright © 2007, 2016, Oracle and/or its affiliates. All rights reserved.
This software and related documentation are provided under a license agreement containing restrictions onuse and disclosure and are protected by intellectual property laws. Except as expressly permitted in yourlicense agreement or allowed by law, you may not use, copy, reproduce, translate, broadcast, modify, license,transmit, distribute, exhibit, perform, publish, or display any part, in any form, or by any means. Reverseengineering, disassembly, or decompilation of this software, unless required by law for interoperability, isprohibited.
The information contained herein is subject to change without notice and is not warranted to be error-free. Ifyou find any errors, please report them to us in writing.
If this is software or related documentation that is delivered to the U.S. Government or anyone licensing it onbehalf of the U.S. Government, then the following notice is applicable:
U.S. GOVERNMENT END USERS: Oracle programs, including any operating system, integrated software,any programs installed on the hardware, and/or documentation, delivered to U.S. Government end users are"commercial computer software" pursuant to the applicable Federal Acquisition Regulation and agency-specific supplemental regulations. As such, use, duplication, disclosure, modification, and adaptation of theprograms, including any operating system, integrated software, any programs installed on the hardware,and/or documentation, shall be subject to license terms and license restrictions applicable to the programs.No other rights are granted to the U.S. Government.
This software or hardware is developed for general use in a variety of information management applications.It is not developed or intended for use in any inherently dangerous applications, including applications thatmay create a risk of personal injury. If you use this software or hardware in dangerous applications, then youshall be responsible to take all appropriate fail-safe, backup, redundancy, and other measures to ensure itssafe use. Oracle Corporation and its affiliates disclaim any liability for any damages caused by use of thissoftware or hardware in dangerous applications.
Oracle and Java are registered trademarks of Oracle and/or its affiliates. Other names may be trademarks oftheir respective owners.
Intel and Intel Xeon are trademarks or registered trademarks of Intel Corporation. All SPARC trademarks areused under license and are trademarks or registered trademarks of SPARC International, Inc. AMD, Opteron,the AMD logo, and the AMD Opteron logo are trademarks or registered trademarks of Advanced MicroDevices. UNIX is a registered trademark of The Open Group.
This software or hardware and documentation may provide access to or information about content, products,and services from third parties. Oracle Corporation and its affiliates are not responsible for and expresslydisclaim all warranties of any kind with respect to third-party content, products, and services unlessotherwise set forth in an applicable agreement between you and Oracle. Oracle Corporation and its affiliateswill not be responsible for any loss, costs, or damages incurred due to your access to or use of third-partycontent, products, or services, except as set forth in an applicable agreement between you and Oracle.
Contents
Preface ................................................................................................................................................................ xi
Documentation Accessibility ..................................................................................................................... xi
Conventions.................................................................................................................................................. xi
1 Introduction and Roadmap
1.1 Document Scope and Audience...................................................................................................... 1-1
1.2 Guide to this Document................................................................................................................... 1-1
1.3 Performance Features of this Release ............................................................................................ 1-2
2 Top Tuning Recommendations for WebLogic Server
2.1 Tune Pool Sizes ................................................................................................................................. 2-1
2.2 Use the Prepared Statement Cache ................................................................................................ 2-1
2.3 Use Logging Last Resource Optimization .................................................................................... 2-2
2.4 Tune Connection Backlog Buffering .............................................................................................. 2-2
2.5 Use Optimistic or Read-only Concurrency................................................................................... 2-2
2.6 Use Local Interfaces.......................................................................................................................... 2-2
2.7 Use eager-relationship-caching ..................................................................................................... 2-2
2.8 Tune HTTP Sessions......................................................................................................................... 2-3
2.9 Tune Messaging Applications ........................................................................................................ 2-3
3 Performance Tuning Roadmap
3.1 Performance Tuning Roadmap....................................................................................................... 3-1
3.1.1 Understand Your Performance Objectives ........................................................................ 3-1
3.1.2 Measure Your Performance Metrics ................................................................................... 3-2
3.1.3 Monitor Disk and CPU Utilization ..................................................................................... 3-2
3.1.4 Monitor Data Transfers Across the Network.................................................................... 3-3
3.1.5 Locate Bottlenecks in Your System..................................................................................... 3-3
3.1.6 Minimize Impact of Bottlenecks.......................................................................................... 3-3
3.1.7 Tune Your Application......................................................................................................... 3-3
3.1.8 Tune your DB......................................................................................................................... 3-4
3.1.9 Tune WebLogic Server Performance Parameters ............................................................. 3-4
3.1.10 Tune Your JVM.................................................................................................................... 3-4
iii
3.1.11 Tune the Operating System ............................................................................................... 3-4
3.1.12 Achieve Performance Objectives....................................................................................... 3-4
3.2 Tuning Tips........................................................................................................................................ 3-4
4 Tuning Java Virtual Machines (JVMs)
4.1 JVM Tuning Considerations............................................................................................................ 4-1
4.2 Changing To a Different JVM ......................................................................................................... 4-2
4.3 Garbage Collection ........................................................................................................................... 4-2
4.3.1 VM Heap Size and Garbage Collection.............................................................................. 4-2
4.3.2 Choosing a Garbage Collection Scheme ............................................................................ 4-3
4.3.3 Using Verbose Garbage Collection to Determine Heap Size.......................................... 4-3
4.3.4 Specifying Heap Size Values ............................................................................................... 4-4
4.3.5 Tuning Tips for Heap Sizes.................................................................................................. 4-4
4.3.6 Java HotSpot VM Heap Size Options................................................................................. 4-5
4.3.7 Automatically Logging Low Memory Conditions ........................................................... 4-6
4.3.8 Manually Requesting Garbage Collection......................................................................... 4-6
4.3.9 Requesting Thread Stacks .................................................................................................... 4-6
4.4 Increasing Java Heap Size for Managed Servers.......................................................................... 4-6
4.4.1 Using the Administration Console to Set Java Heap Size ............................................... 4-7
4.4.2 Modify the startManagedWebLogic Script to Set Java Heap Size ................................. 4-7
4.4.3 Using the Command Line to Set Java Heap Size.............................................................. 4-7
4.4.4 Determining the Memory Values Used by a Managed Server....................................... 4-7
5 Tuning WebLogic Diagnostic Framework and Java Flight Recorder Integration
5.1 Using Java Flight Recorder.............................................................................................................. 5-1
5.2 Using WLDF ...................................................................................................................................... 5-1
5.3 Tuning Considerations..................................................................................................................... 5-1
6 Tuning WebLogic Server
6.1 Setting Java Parameters for Starting WebLogic Server ............................................................... 6-1
6.2 Development vs. Production Mode Default Tuning Values ...................................................... 6-2
6.3 Deployment ....................................................................................................................................... 6-3
6.3.1 On-demand Deployment of Internal Applications .......................................................... 6-3
6.3.2 Use FastSwap Deployment to Minimize Redeployment Time ...................................... 6-3
6.3.3 Generic Overrides ................................................................................................................. 6-4
6.4 Thread Management ........................................................................................................................ 6-4
6.4.1 Tuning a Work Manager ...................................................................................................... 6-4
6.4.2 Self-Tuning Thread Pool Size .............................................................................................. 6-4
6.4.3 How Many Work Managers are Needed? ......................................................................... 6-5
6.4.4 What are the SLA Requirements for Each Work Manager?............................................ 6-5
6.4.5 Understanding the Differences Between Work Managers and Execute Queues......... 6-5
6.4.6 Migrating from Previous Releases...................................................................................... 6-5
6.4.7 Tuning the Stuck Thread Detection Behavior ................................................................... 6-6
iv
6.5 Tuning Network I/O........................................................................................................................ 6-6
6.5.1 Tuning Muxers....................................................................................................................... 6-6
6.5.2 Network Channels ................................................................................................................ 6-8
6.5.3 Reducing the Potential for Denial of Service Attacks ...................................................... 6-9
6.5.4 Tuning Connection Backlog Buffering............................................................................. 6-10
6.5.5 Tuning Cached Connections.............................................................................................. 6-10
6.6 Multitenancy Tuning Recommendations.................................................................................... 6-10
6.7 Tuning the Work Manager Queue Size ....................................................................................... 6-11
6.8 Optimize Java Expressions............................................................................................................ 6-12
6.9 Using WebLogic Server Clusters to Improve Performance...................................................... 6-12
6.9.1 Scalability and High Availability...................................................................................... 6-12
6.9.2 How to Ensure Scalability for WebLogic Clusters ......................................................... 6-13
6.9.3 Running Multiple Server Instances on Multi-Core Machines ...................................... 6-16
6.9.4 Improving Cluster Throughput using XA Transaction Cluster Affinity .................... 6-16
6.10 Monitoring a WebLogic Server Domain ................................................................................... 6-17
6.10.1 Using the Administration Console to Monitor WebLogic Server .............................. 6-17
6.10.2 Using the WebLogic Diagnostic Framework ................................................................ 6-17
6.10.3 Using JMX to Monitor WebLogic Server ....................................................................... 6-17
6.10.4 Using WLST to Monitor WebLogic Server .................................................................... 6-17
6.10.5 Resources to Monitor WebLogic Server......................................................................... 6-17
6.11 Tuning Class and Resource Loading ......................................................................................... 6-17
6.11.1 Filtering Loader Mechanism............................................................................................ 6-18
6.11.2 Class Caching..................................................................................................................... 6-18
6.12 SSL Considerations ...................................................................................................................... 6-19
7 Tuning the WebLogic Persistent Store
7.1 Overview of Persistent Stores ......................................................................................................... 7-1
7.1.1 Using the Default Persistent Store ...................................................................................... 7-1
7.1.2 Using Custom File Stores and JDBC Stores....................................................................... 7-2
7.1.3 Using a JDBC TLOG Store ................................................................................................... 7-2
7.1.4 Using JMS Paging Stores ...................................................................................................... 7-2
7.1.5 Using Diagnostic Stores........................................................................................................ 7-3
7.2 Best Practices When Using Persistent Stores ................................................................................ 7-4
7.3 Tuning JDBC Stores.......................................................................................................................... 7-4
7.4 Tuning File Stores ............................................................................................................................. 7-4
7.4.1 Basic Tuning Information..................................................................................................... 7-4
7.4.2 Tuning a File Store Direct-Write-With-Cache Policy ....................................................... 7-6
7.4.3 Tuning the File Store Direct-Write Policy.......................................................................... 7-7
7.4.4 Tuning the File Store Block Size.......................................................................................... 7-8
7.5 Using a Network File System........................................................................................................ 7-10
7.5.1 Configuring Synchronous Write Policies......................................................................... 7-10
7.5.2 Test Server Restart Behavior.............................................................................................. 7-11
7.5.3 Handling NFS Locking Errors........................................................................................... 7-11
v
8 Database Tuning
8.1 General Suggestions ......................................................................................................................... 8-1
8.2 Database-Specific Tuning ................................................................................................................ 8-2
8.2.1 Oracle ...................................................................................................................................... 8-2
8.2.2 Microsoft SQL Server............................................................................................................ 8-3
8.2.3 Sybase...................................................................................................................................... 8-3
9 Tuning WebLogic Server EJBs
9.1 General EJB Tuning Tips.................................................................................................................. 9-1
9.2 Tuning EJB Caches............................................................................................................................ 9-2
9.2.1 Tuning the Stateful Session Bean Cache ............................................................................ 9-2
9.2.2 Tuning the Entity Bean Cache ............................................................................................. 9-2
9.2.3 Tuning the Query Cache ...................................................................................................... 9-3
9.3 Tuning EJB Pools............................................................................................................................... 9-4
9.3.1 Tuning the Stateless Session Bean Pool.............................................................................. 9-4
9.3.2 Tuning the MDB Pool ........................................................................................................... 9-4
9.3.3 Tuning the Entity Bean Pool ................................................................................................ 9-4
9.4 CMP Entity Bean Tuning................................................................................................................. 9-5
9.4.1 Use Eager Relationship Caching ......................................................................................... 9-5
9.4.2 Use JDBC Batch Operations................................................................................................. 9-6
9.4.3 Tuned Updates ...................................................................................................................... 9-6
9.4.4 Using Field Groups ............................................................................................................... 9-6
9.4.5 include-updates ..................................................................................................................... 9-6
9.4.6 call-by-reference .................................................................................................................... 9-7
9.4.7 Bean-level Pessimistic Locking............................................................................................ 9-7
9.4.8 Concurrency Strategy ........................................................................................................... 9-7
9.5 Tuning In Response to Monitoring Statistics................................................................................ 9-8
9.5.1 Cache Miss Ratio ................................................................................................................... 9-8
9.5.2 Lock Waiter Ratio .................................................................................................................. 9-9
9.5.3 Lock Timeout Ratio ............................................................................................................... 9-9
9.5.4 Pool Miss Ratio .................................................................................................................... 9-10
9.5.5 Destroyed Bean Ratio.......................................................................................................... 9-10
9.5.6 Pool Timeout Ratio.............................................................................................................. 9-11
9.5.7 Transaction Rollback Ratio ................................................................................................ 9-11
9.5.8 Transaction Timeout Ratio................................................................................................. 9-11
10 Tuning Message-Driven Beans
10.1 Use Transaction Batching ............................................................................................................ 10-1
10.2 MDB Thread Management .......................................................................................................... 10-1
10.2.1 Determining the Number of Concurrent MDBs ........................................................... 10-2
10.2.2 Selecting a Concurrency Strategy ................................................................................... 10-2
10.2.3 Thread Utilization When Using WebLogic Destinations ............................................ 10-3
vi
10.2.4 Limitations for Multi-threaded Topic MDBs ................................................................ 10-3
10.3 Best Practices for Configuring and Deploying MDBs Using Distributed Topics .............. 10-4
10.4 Using MDBs with Foreign Destinations.................................................................................... 10-4
10.4.1 Concurrency for MDBs that Process Messages from Foreign Destinations ............. 10-4
10.4.2 Thread Utilization for MDBs that Process Messages from Foreign Destinations.... 10-5
10.5 Token-based Message Polling for Transactional MDB Listening on Queues/Topics........ 10-5
10.6 Compatibility for WLS 10.0 and Earlier-style Polling ............................................................. 10-6
11 Tuning Data Sources
11.1 Tune the Number of Database Connections............................................................................. 11-1
11.2 Waste Not....................................................................................................................................... 11-2
11.3 Use Test Connections on Reserve with Care ............................................................................ 11-2
11.4 Cache Prepared and Callable Statements.................................................................................. 11-3
11.5 Using Pinned-To-Thread Property to Increase Performance................................................. 11-3
11.6 Database Listener Timeout under Heavy Server Loads ......................................................... 11-3
11.7 Disable Wrapping of Data Type Objects ................................................................................... 11-3
11.8 Advanced Configurations for Oracle Drivers and Databases................................................ 11-4
11.9 Use Best Design Practices ............................................................................................................ 11-4
12 Tuning Transactions
12.1 Global Transaction Tuning.......................................................................................................... 12-1
12.2 XA Transaction Cluster Affinity................................................................................................. 12-1
12.3 Logging Last Resource Transaction Optimization .................................................................. 12-2
12.3.1 LLR Tuning Guidelines .................................................................................................... 12-2
12.4 Read-only, One-Phase Commit Optimizations ........................................................................ 12-2
12.5 Configure XA Transactions without TLogs .............................................................................. 12-3
13 Tuning WebLogic JMS
13.1 JMS Performance & Tuning Check List..................................................................................... 13-1
13.2 Handling Large Message Backlogs ............................................................................................ 13-3
13.2.1 Improving Message Processing Performance ............................................................... 13-3
13.2.2 Controlling Message Production .................................................................................... 13-5
13.3 Cache and Re-use Client Resources ........................................................................................... 13-6
13.4 Tuning Distributed Queues......................................................................................................... 13-6
13.5 Tuning Topics................................................................................................................................ 13-7
13.5.1 Tuning Non-durable Topic Publishers........................................................................... 13-8
13.6 Tuning for Large Messages ......................................................................................................... 13-8
13.7 Defining Quota.............................................................................................................................. 13-8
13.7.1 Quota Resources ................................................................................................................ 13-9
13.7.2 Destination-Level Quota .................................................................................................. 13-9
13.7.3 JMS Server-Level Quota ................................................................................................. 13-10
13.8 Blocking Senders During Quota Conditions .......................................................................... 13-10
13.8.1 Defining a Send Timeout on Connection Factories.................................................... 13-10
vii

13.8.2 Specifying a Blocking Send Policy on JMS Servers .................................................... 13-11
13.9 Tuning MessageMaximum........................................................................................................ 13-11
13.9.1 Tuning MessageMaximum Limitations ....................................................................... 13-11
13.10 Setting Maximum Message Size for Network Protocols..................................................... 13-12
13.11 Compressing Messages............................................................................................................ 13-12
13.12 Paging Out Messages To Free Up Memory .......................................................................... 13-13
13.12.1 Specifying a Message Paging Directory..................................................................... 13-13
13.12.2 Tuning the Message Buffer Size Option .................................................................... 13-14
13.13 Controlling the Flow of Messages on JMS Servers and Destinations ............................... 13-14
13.13.1 How Flow Control Works............................................................................................ 13-14
13.13.2 Configuring Flow Control ........................................................................................... 13-15
13.13.3 Flow Control Thresholds.............................................................................................. 13-16
13.14 Handling Expired Messages ................................................................................................... 13-17
13.14.1 Defining a Message Expiration Policy........................................................................ 13-17
13.14.2 Configuring an Expiration Policy on Topics ............................................................. 13-17
13.14.3 Configuring an Expiration Policy on Queues ........................................................... 13-18
13.14.4 Configuring an Expiration Policy on Templates ...................................................... 13-18
13.14.5 Defining an Expiration Logging Policy...................................................................... 13-19
13.14.6 Expiration Log Output Format.................................................................................... 13-19
13.14.7 Tuning Active Message Expiration............................................................................. 13-20
13.14.8 Configuring a JMS Server to Actively Scan Destinations for Expired Messages. 13-20
13.15 Tuning Applications Using Unit-of-Order ........................................................................... 13-21
13.15.1 Best Practices .................................................................................................................. 13-21
13.15.2 Using UOO and Distributed Destinations................................................................. 13-21
13.15.3 Migrating Old Applications to Use UOO .................................................................. 13-22
13.16 Using One-Way Message Sends ............................................................................................. 13-22
13.16.1 Configure One-Way Sends On a Connection Factory ............................................. 13-22
13.16.2 One-Way Send Support In a Cluster With a Single Destination ............................ 13-23
13.16.3 One-Way Send Support In a Cluster With Multiple Destinations......................... 13-23
13.16.4 When One-Way Sends Are Not Supported............................................................... 13-23
13.16.5 Different Client and Destination Hosts...................................................................... 13-24
13.16.6 XA Enabled On Client's Host Connection Factory................................................... 13-24
13.16.7 Higher QOS Detected ................................................................................................... 13-24
13.16.8 Destination Quota Exceeded ....................................................................................... 13-24
13.16.9 Change In Server Security Policy................................................................................ 13-24
13.16.10 Change In JMS Server or Destination Status ........................................................... 13-25
13.16.11 Looking Up Logical Distributed Destination Name .............................................. 13-25
13.16.12 Hardware Failure ........................................................................................................ 13-25
13.16.13 One-Way Send QOS Guidelines................................................................................ 13-25
13.17 Tuning the Messaging Performance Preference Option ..................................................... 13-26
13.17.1 Messaging Performance Configuration Parameters ................................................ 13-26
13.17.2 Compatibility With the Asynchronous Message Pipeline ...................................... 13-27
13.18 Client-side Thread Pools.......................................................................................................... 13-28
viii

13.19 Best Practices for JMS .NET Client Applications ................................................................. 13-28
13.20 Considerations for Oracle Data Guard Environments........................................................ 13-28
13.20.1 Pause Destinations for Planned Down Time............................................................. 13-29
13.20.2 Migrate JMS Services for Unexpected Outages ........................................................ 13-29
14 Tuning WebLogic JMS Store-and-Forward
14.1 Best Practices for JMS SAF........................................................................................................... 14-1
14.2 Tuning Tips for JMS SAF............................................................................................................. 14-1
15 Tuning WebLogic Message Bridge
15.1 Best Practices ................................................................................................................................. 15-1
15.2 Changing the Batch Size .............................................................................................................. 15-1
15.3 Changing the Batch Interval........................................................................................................ 15-2
15.4 Changing the Quality of Service................................................................................................. 15-2
15.5 Using Multiple Bridge Instances ................................................................................................ 15-2
15.6 Changing the Thread Pool Size .................................................................................................. 15-2
15.7 Avoiding Durable Subscriptions ................................................................................................ 15-3
15.8 Co-locating Bridges with Their Source or Target Destination ............................................... 15-3
15.9 Changing the Asynchronous Mode Enabled Attribute .......................................................... 15-3
15.10 Tuning Environments with Many Bridges ............................................................................. 15-4
16 Tuning Resource Adapters
16.1 Classloading Optimizations for Resource Adapters ............................................................... 16-1
16.2 Connection Optimizations........................................................................................................... 16-1
16.3 Thread Management .................................................................................................................... 16-2
16.4 InteractionSpec Interface ............................................................................................................. 16-2
17 Tuning Web Applications
17.1 Best Practices ................................................................................................................................. 17-1
17.1.1 Disable Page Checks ......................................................................................................... 17-1
17.1.2 Use Custom JSP Tags ........................................................................................................ 17-1
17.1.3 Precompile JSPs ................................................................................................................. 17-2
17.1.4 Use HTML Template Compression................................................................................ 17-2
17.1.5 Use Service Level Agreements ........................................................................................ 17-2
17.1.6 Related Reading................................................................................................................. 17-2
17.2 Session Management.................................................................................................................... 17-2
17.2.1 Managing Session Persistence ......................................................................................... 17-2
17.2.2 Minimizing Sessions ......................................................................................................... 17-3
17.2.3 Aggregating Session Data ................................................................................................ 17-3
17.3 Pub-Sub Tuning Guidelines ........................................................................................................ 17-4
17.4 Enabling GZIP Compression ...................................................................................................... 17-4
ix

18 Tuning Web Services
18.1 Web Services Best Practices......................................................................................................... 18-1
18.2 Tuning Web Service Reliable Messaging Agents..................................................................... 18-2
18.3 Tuning Heavily Loaded Systems to Improve Web Service Performance ............................ 18-2
18.3.1 Setting the Work Manager Thread Pool Minimum Size Constraint.......................... 18-3
18.3.2 Setting the Buffering Sessions.......................................................................................... 18-3
18.3.3 Releasing Asynchronous Resources ............................................................................... 18-3
19 Tuning WebLogic Tuxedo Connector
19.1 Configuration Guidelines ............................................................................................................ 19-1
19.2 Best Practices ................................................................................................................................. 19-2
A Capacity Planning
A.1 Capacity Planning Factors.............................................................................................................. A-1
A.1.1 Programmatic and Web-based Clients.............................................................................. A-2
A.1.2 RMI and Server Traffic ........................................................................................................ A-2
A.1.3 SSL Connections and Performance.................................................................................... A-3
A.1.4 WebLogic Server Process Load .......................................................................................... A-3
A.1.5 Database Server Capacity and User Storage Requirements .......................................... A-3
A.1.6 Concurrent Sessions............................................................................................................. A-4
A.1.7 Network Load....................................................................................................................... A-4
A.1.8 Clustered Configurations.................................................................................................... A-4
A.1.9 Server Migration................................................................................................................... A-5
A.1.10 Application Design ............................................................................................................ A-5
A.2 Assessing Your Application Performance Objectives ................................................................ A-5
A.3 Hardware Tuning ............................................................................................................................ A-5
A.3.1 Benchmarks for Evaluating Performance ......................................................................... A-5
A.3.2 Supported Platforms............................................................................................................ A-5
A.4 Network Performance..................................................................................................................... A-6
A.4.1 Determining Network Bandwidth..................................................................................... A-6
A.5 Related Information ....................................................................................................................... A-6
x

Preface
This preface describes the document accessibility features and conventions used in thisguide—Tuning Performance of Oracle WebLogic Server.
Documentation AccessibilityFor information about Oracle's commitment to accessibility, visit the OracleAccessibility Program website at http://www.oracle.com/pls/topic/lookup?ctx=acc&id=docacc.
Access to Oracle Support
Oracle customers that have purchased support have access to electronic supportthrough My Oracle Support. For information, visit http://www.oracle.com/pls/topic/lookup?ctx=acc&id=info or visit http://www.oracle.com/pls/topic/lookup?ctx=acc&id=trs if you are hearing impaired.
ConventionsThe following text conventions are used in this document:
Convention Meaning
boldface Boldface type indicates graphical user interface elements associated with anaction, or terms defined in text or the glossary.
italic Italic type indicates book titles, emphasis, or placeholder variables for whichyou supply particular values.
monospace Monospace type indicates commands within a paragraph, URLs, code inexamples, text that appears on the screen, or text that you enter.
xi


1Introduction and Roadmap
This chapter describes the contents and organization of this guide—TuningPerformance of Oracle WebLogic Server.
This chapter includes the following sections:
• Document Scope and Audience
• Guide to this Document
• Performance Features of this Release
1.1 Document Scope and AudienceThis document is written for people who monitor performance and tune thecomponents in a WebLogic Server environment. It is assumed that readers knowserver administration and hardware performance tuning fundamentals, WebLogicServer, XML, and the Java programming language.
1.2 Guide to this Document• This chapter, Introduction and Roadmap introduces the organization of this guide.
• Top Tuning Recommendations for WebLogic Server discusses the most frequentlyrecommended steps for achieving optimal performance tuning for applicationsrunning on WebLogic Server.
• Performance Tuning Roadmap provides a roadmap to help tune your applicationenvironment to optimize performance.
• Tuning Java Virtual Machines (JVMs) discusses JVM tuning considerations.
• Tuning WebLogic Diagnostic Framework and Java Flight Recorder Integrationprovides information on how WebLogic Diagnostic Framework (WLDF) workswith Java Flight Recorder.
• Tuning WebLogic Server contains information on how to tune WebLogic Server tomatch your application needs.
• Tuning the WebLogic Persistent Store provides information on how to tune apersistent store.
• DataBase Tuning provides information on how to tune your data base.
• Tuning WebLogic Server EJBs provides information on how to tune applicationsthat use EJBs.
Introduction and Roadmap 1-1
• Tuning Message-Driven Beans provides information on how to tune Message-Driven beans.
• Tuning Data Sources provides information on how to tune JDBC applications.
• Tuning Transactions provides information on how to tune Logging Last Resourcetransaction optimization.
• Tuning WebLogic JMS provides information on how to tune applications that useWebLogic JMS.
• Tuning WebLogic JMS Store-and-Forward provides information on how to tuneapplications that use JMS Store-and-Forward.
• Tuning WebLogic Message Bridge provides information on how to tuneapplications that use the WebLogic Message Bridge.
• Tuning Resource Adapters provides information on how to tune applications thatuse resource adaptors.
• Tuning Web Applications provides best practices for tuning WebLogic Webapplications and application resources:
• Tuning Web Services provides information on how to tune applications that useWeb services.
• Tuning WebLogic Tuxedo Connector provides information on how to tuneapplications that use WebLogic Tuxedo Connector.
• Capacity Planning provides an introduction to capacity planning.
1.3 Performance Features of this ReleaseWebLogic Server introduces the following performance enhancements:
• Improving Cluster Throughput using XA Transaction Cluster Affinity
• Configure XA Transactions without TLogs.
Performance Features of this Release
1-2 Tuning Performance of Oracle WebLogic Server

2Top Tuning Recommendations for
WebLogic Server
Tuning WebLogic Server and your WebLogic Server application is a complex anditerative process. To get you started, we recommend the following ways optimize yourapplication's performance. These tuning techniques are applicable to nearly allWebLogic applications.
This chapter includes the following sections:
• Tune Pool Sizes
• Use the Prepared Statement Cache
• Use Logging Last Resource Optimization
• Tune Connection Backlog Buffering
• Use Optimistic or Read-only Concurrency
• Use Local Interfaces
• Use eager-relationship-caching
• Tune HTTP Sessions
• Tune Messaging Applications
2.1 Tune Pool SizesProvide pool sizes (such as pools for JDBC connections, Stateless Session EJBs, andMDBs) that maximize concurrency for the expected thread utilization.
• For WebLogic Server releases 9.0 and higher—A server instance uses a self-tunedthread-pool. The best way to determine the appropriate pool size is to monitor thepool's current size, shrink counts, grow counts, and wait counts. See ThreadManagement. Tuning MDBs are a special case, please see Tuning Message-DrivenBeans.
2.2 Use the Prepared Statement CacheThe prepared statement cache keeps compiled SQL statements in memory, thusavoiding a round-trip to the database when the same statement is used later. See Tuning Data Sources.
Top Tuning Recommendations for WebLogic Server 2-1
2.3 Use Logging Last Resource OptimizationWhen using transactional database applications, consider using the JDBC data sourceLogging Last Resource (LLR) transaction policy instead of XA. The LLR optimizationcan significantly improve transaction performance by safely eliminating some of the2PC XA overhead for database processing, especially for two-phase commit databaseinsert, update, and delete operations. For more information, see Tuning Data Sources.
2.4 Tune Connection Backlog BufferingYou can tune the number of connection requests that a WebLogic Server instanceaccepts before refusing additional requests. This tunable applies primarily for Webapplications. See Tuning Connection Backlog Buffering.
2.5 Use Optimistic or Read-only ConcurrencyUse optimistic concurrency with cache-between-transactions or read-only concurrencywith query-caching for CMP EJBs wherever possible. Both of these two optionsleverage the Entity Bean cache provided by the EJB container.
• Optimistic-concurrency with cache-between-transactions work best with read-mostly beans. Using verify-reads in combination with these provides high dataconsistency guarantees with the performance gain of caching. See TuningWebLogic Server EJBs.
• Query-caching is a WebLogic Server 9.0 feature that allows the EJB container tocache results for arbitrary non-primary-key finders defined on read-only EJBs. Allof these parameters can be set in the application/module deployment descriptors.See Concurrency Strategy.
2.6 Use Local InterfacesUse local-interfaces or use call-by-reference semantics to avoid the overhead ofserialization when one EJB calls another or an EJB is called by a servlet/JSP in thesame application. Note the following:
• In release prior to WebLogic Server 8.1, call-by-reference is turned on by default.For releases of WebLogic Server 8.1 and higher, call-by-reference is turned off bydefault. Older applications migrating to WebLogic Server 8.1 and higher that donot explicitly turn on call-by-reference may experience a drop in performance.
• This optimization does not apply to calls across different applications.
2.7 Use eager-relationship-cachingUse eager-relationship-caching wherever possible. This feature allows the EJBcontainer to load related beans using a single SQL statement. It improves performanceby reducing the number of database calls to load related beans in transactions when abean and it's related beans are expected to be used in that transaction. See TuningWebLogic Server EJBs.
Use Logging Last Resource Optimization
2-2 Tuning Performance of Oracle WebLogic Server
2.8 Tune HTTP SessionsOptimize your application so that it does as little work as possible when handlingsession persistence and sessions. You should also design a session managementstrategy that suits your environment and application. See Session Management.
2.9 Tune Messaging ApplicationsOracle provides messaging users a rich set of performance tunables. In general, youshould always configure quotas and paging. See:
• Tuning the WebLogic Persistent Store
• Tuning WebLogic JMS
• Tuning WebLogic JMS Store-and-Forward
• Tuning WebLogic Message Bridge
Tune HTTP Sessions
Top Tuning Recommendations for WebLogic Server 2-3

Tune Messaging Applications
2-4 Tuning Performance of Oracle WebLogic Server

3Performance Tuning Roadmap
Use the performance tuning roadmap and tuning tips described in this chapter as amethodical approach to optimizing your system’s performance.
This chapter includes the following sections:
• Performance Tuning Roadmap
• Tuning Tips
3.1 Performance Tuning RoadmapThe following steps provide a roadmap to help tune your application environment tooptimize performance:
1. Understand Your Performance Objectives
2. Measure Your Performance Metrics
3. Locate Bottlenecks in Your System
4. Minimize Impact of Bottlenecks
5. Achieve Performance Objectives
3.1.1 Understand Your Performance ObjectivesTo determine your performance objectives, you need to understand the applicationdeployed and the environmental constraints placed on the system. Gather informationabout the levels of activity that components of the application are expected to meet,such as:
• The anticipated number of users.
• The number and size of requests.
• The amount of data and its consistency.
• Determining your target CPU utilization.
Your target CPU usage should not be 100%, you should determine a target CPUutilization based on your application needs, including CPU cycles for peak usage.If your CPU utilization is optimized at 100% during normal load hours, you haveno capacity to handle a peak load. In applications that are latency sensitive andmaintaining the ability for a fast response time is important, high CPU usage(approaching 100% utilization) can reduce response times while throughput staysconstant or even increases because of work queuing up in the server. For suchapplications, a 70% - 80% CPU utilization recommended. A good target for non-latency sensitive applications is about 90%.
Performance Tuning Roadmap 3-1
Performance objectives are limited by constraints, such as
• The configuration of hardware and software such as CPU type, disk size vs. diskspeed, sufficient memory.
There is no single formula for determining your hardware requirements. Theprocess of determining what type of hardware and software configuration isrequired to meet application needs adequately is called capacity planning. Capacityplanning requires assessment of your system performance goals and anunderstanding of your application. Capacity planning for server hardware shouldfocus on maximum performance requirements. See Capacity Planning.
• The ability to interoperate between domains, use legacy systems, support legacydata.
• Development, implementation, and maintenance costs.
You will use this information to set realistic performance objectives for yourapplication environment, such as response times, throughput, and load on specifichardware.
3.1.2 Measure Your Performance MetricsAfter you have determined your performance criteria in Understand YourPerformance Objectives, take measurements of the metrics you will use to quantifyyour performance objectives. The following sections provide information onmeasuring basic performance metrics:
• Monitor Disk and CPU Utilization
• Monitor Data Transfers Across the Network
3.1.3 Monitor Disk and CPU UtilizationRun your application under a high load while monitoring the:
• Application server (disk and CPU utilization)
• Database server (disk and CPU utilization)
The goal is to get to a point where the application server achieves your target CPUutilization. If you find that the application server CPU is under utilized, confirmwhether the database is bottle necked. If the database CPU is 100 percent utilized, thencheck your application SQL calls query plans. For example, are your SQL calls usingindexes or doing linear searches? Also, confirm whether there are too many ORDERBY clauses used in your application that are affecting the database CPU.
If you discover that the database disk is the bottleneck (for example, if the disk is 100percent utilized), try moving to faster disks or to a RAID (redundant array ofindependent disks) configuration, assuming the application is not doing more writesthen required.
Once you know the database server is not the bottleneck, determine whether theapplication server disk is the bottleneck. Some of the disk bottlenecks for applicationserver disks are:
• Persistent Store writes
• Transaction logging (tlogs)
Performance Tuning Roadmap
3-2 Tuning Performance of Oracle WebLogic Server

• HTTP logging
• Server logging
The disk I/O on an application server can be optimized using faster disks or RAID,disabling synchronous JMS writes, using JTA direct writes for tlogs, or increasing theHTTP log buffer.
3.1.4 Monitor Data Transfers Across the NetworkCheck the amount of data transferred between the application and the applicationserver, and between the application server and any remote endpoint. This amountshould not exceed your network bandwidth; otherwise, your network becomes thebottleneck.
3.1.5 Locate Bottlenecks in Your SystemIf you determine that neither the network nor the database server is the bottleneck,start looking at your operating system, JVM, and WebLogic Server configurations.Most importantly, is the machine running WebLogic Server able to get your targetCPU utilization with a high client load? If the answer is no, then check if there is anylocking taking place in the application. You should profile your application topinpoint bottlenecks and improve application performance, see Java Mission Control.
Tip:
Even if you find that the CPU is 100 percent utilized, you should profile yourapplication for performance improvements.
3.1.6 Minimize Impact of BottlenecksIn this step, you tune your environment to minimize the impact of bottlenecks on yourperformance objectives. It is important to realize that in this step you are minimizingthe impact of bottlenecks, not eliminating them. Tuning allows you to adjust resourcesto achieve your performance objectives. For the scope of this document, this includes(from most important to least important):
• Tune Your Application
• Tune your DB
• Tune WebLogic Server Performance Parameters
• Tune Your JVM
• Tune the Operating System
• Tuning the WebLogic Persistent Store
3.1.7 Tune Your ApplicationTo quote the authors of Oracle WebLogic Server: Optimizing WebLogic Server Performance:"Good application performance starts with good application design. Overly-complexor poorly-designed applications will perform poorly regardless of the system-leveltuning and best practices employed to improve performance." In other words, a poorlydesigned application can create unnecessary bottlenecks. For example, resourcecontention could be a case of poor design, rather than inherent to the applicationdomain.
Performance Tuning Roadmap
Performance Tuning Roadmap 3-3

For more information, see:
• Tuning WebLogic Server EJBs
• Tuning Message-Driven Beans
• Tuning Data Sources
• Tuning Transactions
• Tuning WebLogic JMS
• Tuning WebLogic JMS Store-and-Forward
• Tuning WebLogic Message Bridge
• Tuning Resource Adapters
• Tuning Web Applications
• Tuning Web Services
• Tuning WebLogic Tuxedo Connector
3.1.8 Tune your DBYour database can be a major enterprise-level bottleneck. Database optimization canbe complex and vender dependent. See DataBase Tuning.
3.1.9 Tune WebLogic Server Performance ParametersThe WebLogic Server uses a number of OOTB (out-of-the-box) performance-relatedparameters that can be fine-tuned depending on your environment and applications.Tuning these parameters based on your system requirements (rather than runningwith default settings) can greatly improve both single-node performance and thescalability characteristics of an application. See Tuning WebLogic Server.
3.1.10 Tune Your JVMThe Java virtual machine (JVM) is a virtual "execution engine" instance that executesthe bytecodes in Java class files on a microprocessor. See Tuning Java VirtualMachines (JVMs).
3.1.11 Tune the Operating SystemTune your operating system according to your operating system documentation basedon your application environment.
3.1.12 Achieve Performance ObjectivesPerformance tuning is an iterative process. After you have minimized the impact ofbottlenecks on your system, go to Step 2, Measure Your Performance Metrics anddetermine if you have met your performance objectives.
3.2 Tuning TipsThis section provides tips and guidelines when tuning overall system performance:
Tuning Tips
3-4 Tuning Performance of Oracle WebLogic Server
• Performance tuning is not a silver bullet. Simply put, good system performancedepends on: good design, good implementation, defined performance objectives,and performance tuning.
• Performance tuning is ongoing process. Implement mechanisms that provideperformance metrics which you can compare against your performance objectives,allowing you to schedule a tuning phase before your system fails.
• The object is to meet your performance objectives, not eliminate all bottlenecks.Resources within a system are finite. By definition, at least one resource (CPU,memory, or I/O) will be a bottleneck in the system. Tuning allows you minimizethe impact of bottlenecks on your performance objectives.
• Design your applications with performance in mind:
– Keep things simple - avoid inappropriate use of published patterns.
– Apply Java EE performance patterns.
– Optimize your Java code.
Tuning Tips
Performance Tuning Roadmap 3-5

Tuning Tips
3-6 Tuning Performance of Oracle WebLogic Server
4Tuning Java Virtual Machines (JVMs)
Configure the JVM tuning options for WebLogic Server. The Java virtual machine(JVM) is a virtual "execution engine" instance that executes the bytecodes in Java classfiles on a microprocessor. How you tune your JVM affects the performance ofWebLogic Server and your applications.
This chapter includes the following sections:
• JVM Tuning Considerations
• Garbage Collection
• Increasing Java Heap Size for Managed Servers
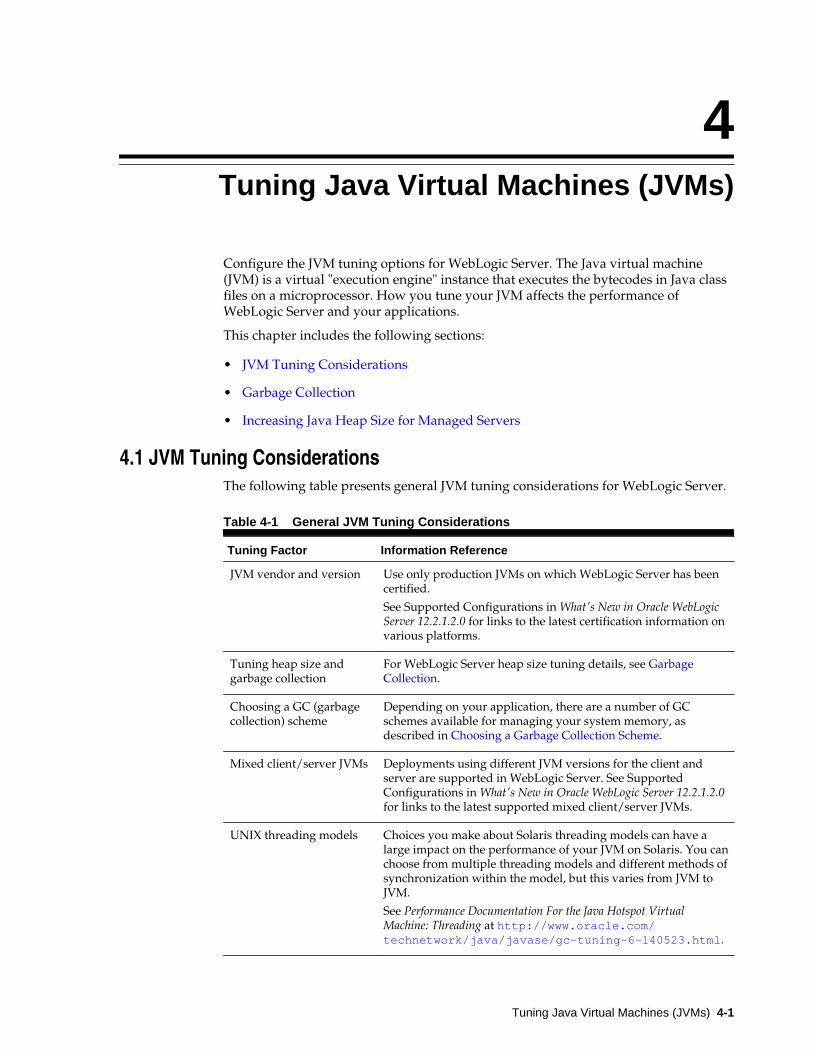
4.1 JVM Tuning ConsiderationsThe following table presents general JVM tuning considerations for WebLogic Server.
Table 4-1 General JVM Tuning Considerations
Tuning Factor Information Reference
JVM vendor and version Use only production JVMs on which WebLogic Server has beencertified.
See Supported Configurations in What's New in Oracle WebLogicServer 12.2.1.2.0 for links to the latest certification information onvarious platforms.
Tuning heap size andgarbage collection
For WebLogic Server heap size tuning details, see GarbageCollection.
Choosing a GC (garbagecollection) scheme
Depending on your application, there are a number of GCschemes available for managing your system memory, asdescribed in Choosing a Garbage Collection Scheme.
Mixed client/server JVMs Deployments using different JVM versions for the client andserver are supported in WebLogic Server. See SupportedConfigurations in What's New in Oracle WebLogic Server 12.2.1.2.0for links to the latest supported mixed client/server JVMs.
UNIX threading models Choices you make about Solaris threading models can have alarge impact on the performance of your JVM on Solaris. You canchoose from multiple threading models and different methods ofsynchronization within the model, but this varies from JVM toJVM.
See Performance Documentation For the Java Hotspot VirtualMachine: Threading at http://www.oracle.com/technetwork/java/javase/gc-tuning-6-140523.html.
Tuning Java Virtual Machines (JVMs) 4-1

4.2 Changing To a Different JVMWhen you create a domain, you choose the JVM that you want to run your domainand the configuration wizard configures the Oracle start scripts based on your choice.After you create a domain, if you want to use a different JVM, see Changing the JVMThat Runs Servers in Administering Server Startup and Shutdown for Oracle WebLogicServer.
4.3 Garbage CollectionGarbage collection is the VM's process of freeing up unused Java objects in the Javaheap. The following sections provide information on tuning your VM's garbagecollection:
• VM Heap Size and Garbage Collection
• Choosing a Garbage Collection Scheme
• Using Verbose Garbage Collection to Determine Heap Size
• Specifying Heap Size Values
• Automatically Logging Low Memory Conditions
• Manually Requesting Garbage Collection
• Requesting Thread Stacks
4.3.1 VM Heap Size and Garbage CollectionThe Java heap is where the objects of a Java program live. It is a repository for liveobjects, dead objects, and free memory. When an object can no longer be reached fromany pointer in the running program, it is considered "garbage" and ready forcollection. A best practice is to tune the time spent doing garbage collection to within5% of execution time.
The JVM heap size determines how often and how long the VM spends collectinggarbage. An acceptable rate for garbage collection is application-specific and should beadjusted after analyzing the actual time and frequency of garbage collections. If youset a large heap size, full garbage collection is slower, but it occurs less frequently. Ifyou set your heap size in accordance with your memory needs, full garbage collectionis faster, but occurs more frequently.
The goal of tuning your heap size is to minimize the time that your JVM spends doinggarbage collection while maximizing the number of clients that WebLogic Server canhandle at a given time. To ensure maximum performance during benchmarking, youmight set high heap size values to ensure that garbage collection does not occurduring the entire run of the benchmark.
You might see the following Java error if you are running out of heap space:
java.lang.OutOfMemoryError <<no stack trace available>>java.lang.OutOfMemoryError <<no stack trace available>>Exception in thread "main"
To modify heap space values, see Specifying Heap Size Values.
Changing To a Different JVM
4-2 Tuning Performance of Oracle WebLogic Server

To configure WebLogic Server to detect automatically when you are running out ofheap space and to address low memory conditions in the server, see AutomaticallyLogging Low Memory Conditions and Specifying Heap Size Values.
4.3.2 Choosing a Garbage Collection SchemeDepending on which JVM you are using, you can choose from several garbagecollection schemes to manage your system memory. For example, some garbagecollection schemes are more appropriate for a given type of application. Once youhave an understanding of the workload of the application and the different garbagecollection algorithms utilized by the JVM, you can optimize the configuration of thegarbage collection.
Refer to the following links for in-depth discussions of garbage collection options foryour JVM:
• For an overview of the garbage collection schemes available with Sun's HotSpotVM, see "Java SE 6 HotSpot[tm] Virtual Machine Garbage Collection Tuning" at http://www.oracle.com/technetwork/java/javase/gc-tuning-6-140523.html.
• For a comprehensive explanation of the collection schemes available, see"Improving Java Application Performance and Scalability by Reducing Garbage CollectionTimes and Sizing Memory Using JDK 1.4.1" at http://www.oracle.com/technetwork/java/index-jsp-138820.html.
4.3.3 Using Verbose Garbage Collection to Determine Heap SizeThe verbose garbage collection option (verbosegc) enables you to measure exactlyhow much time and resources are put into garbage collection. To determine the mosteffective heap size, turn on verbose garbage collection and redirect the output to a logfile for diagnostic purposes.
The following steps outline this procedure:
1. Monitor the performance of WebLogic Server under maximum load whilerunning your application.
2. Use the -verbosegc option to turn on verbose garbage collection output for yourJVM and redirect both the standard error and standard output to a log file.
This places thread dump information in the proper context with WebLogic Serverinformational and error messages, and provides a more useful log for diagnosticpurposes.
For example, on Windows and Solaris, enter the following:
% java -ms32m -mx200m -verbosegc -classpath $CLASSPATH-Dweblogic.Name=%SERVER_NAME% -Dbea.home="C:\Oracle\Middleware"-Dweblogic.management.username=%WLS_USER%-Dweblogic.management.password=%WLS_PW%-Dweblogic.management.server=%ADMIN_URL%-Dweblogic.ProductionModeEnabled=%STARTMODE%-Djava.security.policy="%WL_HOME%\server\lib\weblogic.policy" weblogic.Server >> logfile.txt 2>&1
where the logfile.txt 2>&1 command redirects both the standard error andstandard output to a log file.
3. Analyze the following data points:
Garbage Collection
Tuning Java Virtual Machines (JVMs) 4-3
a. How often is garbage collection taking place? In the weblogic.log file,compare the time stamps around the garbage collection.
b. How long is garbage collection taking? Full garbage collection should nottake longer than 3 to 5 seconds.
c. What is your average memory footprint? In other words, what does the heapsettle back down to after each full garbage collection? If the heap alwayssettles to 85 percent free, you might set the heap size smaller.
4. Review the New generation heap sizes, see Java HotSpot VM Heap Size Options.
5. Make sure that the heap size is not larger than the available free RAM on yoursystem.
Use as large a heap size as possible without causing your system to "swap" pagesto disk. The amount of free RAM on your system depends on your hardwareconfiguration and the memory requirements of running processes on yourmachine. See your system administrator for help in determining the amount offree RAM on your system.
6. If you find that your system is spending too much time collecting garbage (yourallocated virtual memory is more than your RAM can handle), lower your heapsize.
Typically, you should use 80 percent of the available RAM (not taken by theoperating system or other processes) for your JVM.
7. If you find that you have a large amount of available free RAM remaining, runmore instances of WebLogic Server on your machine.
Remember, the goal of tuning your heap size is to minimize the time that yourJVM spends doing garbage collection while maximizing the number of clients thatWebLogic Server can handle at a given time.
4.3.4 Specifying Heap Size ValuesSystem performance is greatly influenced by the size of the Java heap available to theJVM. This section describes the command line options you use to define the heap sizesvalues.You must specify Java heap size values each time you start an instance ofWebLogic Server. This can be done either from the java command line or bymodifying the default values in the sample startup scripts that are provided with theWebLogic distribution for starting WebLogic Server.
• Tuning Tips for Heap Sizes
• Java HotSpot VM Heap Size Options
4.3.5 Tuning Tips for Heap SizesThe following section provides general guidelines for tuning VM heap sizes:
• The heap sizes should be set to values such that the maximum amount of memoryused by the VM does not exceed the amount of available physical RAM. If thisvalue is exceeded, the OS starts paging and performance degrades significantly.The VM always uses more memory than the heap size. The memory required forinternal VM functionality, native libraries outside of the VM, and permanentgeneration memory (for the Sun VM only: memory required to store classes andmethods) is allocated in addition to the heap size settings.
Garbage Collection
4-4 Tuning Performance of Oracle WebLogic Server

• When using a generational garbage collection scheme, the nursery size should notexceed more than half the total Java heap size. Typically, 25% to 40% of the heapsize is adequate.
• In production environments, set the minimum heap size and the maximum heapsize to the same value to prevent wasting VM resources used to constantly growand shrink the heap. This also applies to the New generation heap sizes.
4.3.6 Java HotSpot VM Heap Size OptionsYou achieve best performance by individually tuning each application. However,configuring the Java HotSpot VM heap size options listed in the following table whenstarting WebLogic Server increases performance for most applications.
These options may differ depending on your architecture and operating system. Seeyour vendor's documentation for platform-specific JVM tuning options.
Table 4-2 Java Heap Size Options
Task Option Comments
Setting the Newgeneration heapsize
-XX:NewSizeAs a general rule, set -XX:NewSize to be one-fourththe size of the heap size. Increase the value of thisoption for larger numbers of short-lived objects.
Be sure to increase the New generation as you increasethe number of processors. Memory allocation can beparallel, but garbage collection is not parallel.
Setting themaximum Newgeneration heapsize
-XX:MaxNewSizeSet the maximum size of the New Generation heapsize.
Setting Newheap size ratios -
XX:SurvivorRatio
The New generation area is divided into three sub-areas: Eden, and two survivor spaces that are equal insize.
Configure the ratio of the Eden/survivor space size.Try setting this value to 8, and then monitor yourgarbage collection.
Setting initialheap size -Xms
As a general rule, set initial heap size (-Xms) equal tothe maximum heap size (-Xmx) to minimize garbagecollections.
Settingmaximum heapsize
-XmxSet the maximum size of the heap.
For example, when you start a WebLogic Server instance from a java command line,you could specify the HotSpot VM heap size values as follows:
$ java -XX:NewSize=128m -XX:MaxNewSize=128m -XX:SurvivorRatio=8 -Xms512m -Xmx512m
The default size for these values is measured in bytes. Append the letter 'k' or 'K' to thevalue to indicate kilobytes, 'm' or 'M' to indicate megabytes, and 'g' or 'G' to indicategigabytes. The example above allocates 128 megabytes of memory to the Newgeneration and maximum New generation heap sizes, and 512 megabytes of memoryto the minimum and maximum heap sizes for the WebLogic Server instance runningin the JVM.
Garbage Collection
Tuning Java Virtual Machines (JVMs) 4-5
4.3.6.1 Other Java HotSpot VM Options
Oracle provides other standard and non-standard command-line options to improvethe performance of your VM. How you use these options depends on how yourapplication is coded.
Test both your client and server JVMs to see which options perform better for yourparticular application. See http://www.oracle.com/technetwork/java/javase/tech/vmoptions-jsp-140102.html for more information on thecommand-line options and environment variables that can affect the performancecharacteristics of the Java HotSpot Virtual Machine.
For additional examples of the HotSpot VM options, see:
• Standard Options for Windows (Win32) VMs at http://docs.oracle.com/javase/6/docs/technotes/tools/windows/java.html.
• Standard Options for Solaris VMs and Linux VMs at http://docs.oracle.com/javase/6/docs/technotes/tools/solaris/java.html.
The Java Virtual Machine document provides a detailed discussion of the Client andServer implementations of the Java virtual machine for Java SE at http://docs.oracle.com/javase/6/docs/technotes/guides/vm/.
4.3.7 Automatically Logging Low Memory ConditionsWebLogic Server enables you to automatically log low memory conditions observedby the server. WebLogic Server detects low memory by sampling the available freememory a set number of times during a time interval. At the end of each interval, anaverage of the free memory is recorded and compared to the average obtained at thenext interval. If the average drops by a user-configured amount after any sampleinterval, the server logs a low memory warning message in the log file and sets theserver health state to "warning". See Log low memory conditions in Oracle WebLogicServer Administration Console Online Help.
4.3.8 Manually Requesting Garbage CollectionYou may find it necessary to manually request full garbage collection from theWebLogic Server Administration Console. When you do, remember that garbagecollection is costly as the JVM often examines every living object in the heap. See Manually request garbage collection in Oracle WebLogic Server Administration ConsoleOnline Help.
4.3.9 Requesting Thread StacksYou may find it necessary to display thread stacks while tuning your applications. See Display thread stacks in Oracle WebLogic Server Administration Console Online Help.
4.4 Increasing Java Heap Size for Managed ServersFor better performance, you may need to increase the heap size for each ManagedServer in your environment.
The following sections provide information about how to modify the Java heap sizefor Managed Servers:
• Using the Administration Console to Set Java Heap Size
Increasing Java Heap Size for Managed Servers
4-6 Tuning Performance of Oracle WebLogic Server

• Modify the startManagedWebLogic Script to Set Java Heap Size
• Using the Command Line to Set Java Heap Size
• Determining the Memory Values Used by a Managed Server
See Configuring Remote Startup Arguments in Administering Node Manager for OracleWebLogic Server.
4.4.1 Using the Administration Console to Set Java Heap SizeIf you use Node Manager to start the Managed Servers, you can specify a heap size asa Java argument on the Server Start tab for each Managed Server. See Increasing theJava Heap size for a managed server in the Oracle WebLogic Server AdministrationConsole Online Help. Your heap size values are then persisted in thestartup.properties file for the server.
4.4.2 Modify the startManagedWebLogic Script to Set Java Heap SizeYou can update the startManagedWebLogic script with the required heap size inJAVA_OPTIONS. For example:
JAVA_OPTIONS="-Xms2g -Xmx2g" ${JAVA_OPTIONS}
See Starting Managed Servers with a Startup Script in Administering Server Startup andShutdown for Oracle WebLogic Server.
4.4.3 Using the Command Line to Set Java Heap SizeYou can pass JVM parameters when starting a managed server by invokingweblogic.Server class in a Java command. See weblogic.Server Command-LineReference in the Command Reference for Oracle WebLogic Server.
4.4.4 Determining the Memory Values Used by a Managed ServerStart scripts and the Administration Console (the startup.properties file) arecommon ways to configure memory arguments in managed servers. Often, they areset in multiple places and with different values. How do you determine which valuesare actually used by a running managed server?
A running managed server always uses the last set of memory arguments passed tothe server during startup. You can verify this by looking through the log files. If yousee the memory arguments listed multiple times, the last set in the output contains thevalues used by the server. If you used the Administration Console to set the values,see Using the Administration Console to Set Java Heap Size, thestartup.properties file is always processed last, after all scripts. This provides aconvenient method to tune memory size for an individual managed server when usingcommon scripts. If you prefer not to include memory arguments that are not actuallyused in the environment, you will need to remove any extraneous memory argumentssuch as MEM_ARGS and JAVA_OPTONS from the scripts used to start a managed server.
Increasing Java Heap Size for Managed Servers
Tuning Java Virtual Machines (JVMs) 4-7

Increasing Java Heap Size for Managed Servers
4-8 Tuning Performance of Oracle WebLogic Server

5Tuning WebLogic Diagnostic Framework
and Java Flight Recorder Integration
Tune WLDF and Java Flight Recorder using the tips and guidelines described in thischapter.
This chapter includes the following sections:
• Using Java Flight Recorder
• Using WLDF
• Tuning Considerations
5.1 Using Java Flight RecorderJava Flight Recorder is a performance monitoring and profiling tool that recordsdiagnostic information on a continuous basis, making it always available, even in thewake of catastrophic failure such as a system crash. Java Flight Recorder is available inOracle HotSpot. When WebLogic Server is configured with HotSpot, Java FlightRecorder is not enabled by default. See Using Java Flight Recorder with OracleHotSpot in Configuring and Using the Diagnostics Framework for Oracle WebLogic Server,for information about how to enable Java Flight Recorder with WebLogic Server.
5.2 Using WLDFIf WebLogic Server is configured with Oracle HotSpot, and the Java Flight Recorder isenabled, the Java Flight Recorder data is automatically also captured in the diagnosticimage capture. This data can be extracted from the diagnostic image capture andviewed in Java Mission Control. If Java Flight Recorder is not enabled, or if WebLogicServer is configured with a different JVM, the Java Flight Recorder data is notcaptured in the diagnostics image capture.
The volume of Java Flight Recorder data that is captured can be configured using theDiagnostic Volume attribute in the WebLogic Server Administration Console, see Configuring WLDF Diagnostic Volume in Configuring and Using the DiagnosticsFramework for Oracle WebLogic Server. You can also set the volume using WLST.
5.3 Tuning ConsiderationsIn most environments, there is little performance impact when the DiagnosticVolume is set to Low and the most performance impact if Diagnostic Volume is setto High. The volume of diagnostic data produced by WebLogic Server needs to beweighed against potential performance loss.
Tuning WebLogic Diagnostic Framework and Java Flight Recorder Integration 5-1

Tuning Considerations
5-2 Tuning Performance of Oracle WebLogic Server
6Tuning WebLogic Server
Tune WebLogic Server to match your application using the procedures described inthis chapter.
This chapter includes the following sections:
• Setting Java Parameters for Starting WebLogic Server
• Development vs. Production Mode Default Tuning Values
• Deployment
• Thread Management
• Tuning Network I/O
• Multitenancy Tuning Recommendations
• Tuning the Work Manager Queue Size
• Optimize Java Expressions
• Using WebLogic Server Clusters to Improve Performance
• Monitoring a WebLogic Server Domain
• Tuning Class and Resource Loading
• SSL Considerations
6.1 Setting Java Parameters for Starting WebLogic ServerJava parameters must be specified whenever you start WebLogic Server. For simpleinvocations, this can be done from the command line with the weblogic.Servercommand. However, because the arguments needed to start WebLogic Server from thecommand line can be lengthy and prone to error, Oracle recommends that youincorporate the command into a script. To simplify this process, you can modify thedefault values in the sample scripts that are provided with the WebLogic Serverdistribution, as described in Specifying Java Options for a WebLogic Server Instance inAdministering Server Startup and Shutdown for Oracle WebLogic Server.
If you used the Configuration Wizard to create your domain, the WebLogic startupscripts are located in the domain-name directory where you specified your domain. Bydefault, this directory is ORACLE_HOME\user_projects\domain\domain-name,where ORACLE_HOME is the directory you specified as the Oracle Home when youinstalled Oracle WebLogic Server, and domain-name is the name of the domaindirectory defined by the selected configuration template.
Tuning WebLogic Server 6-1
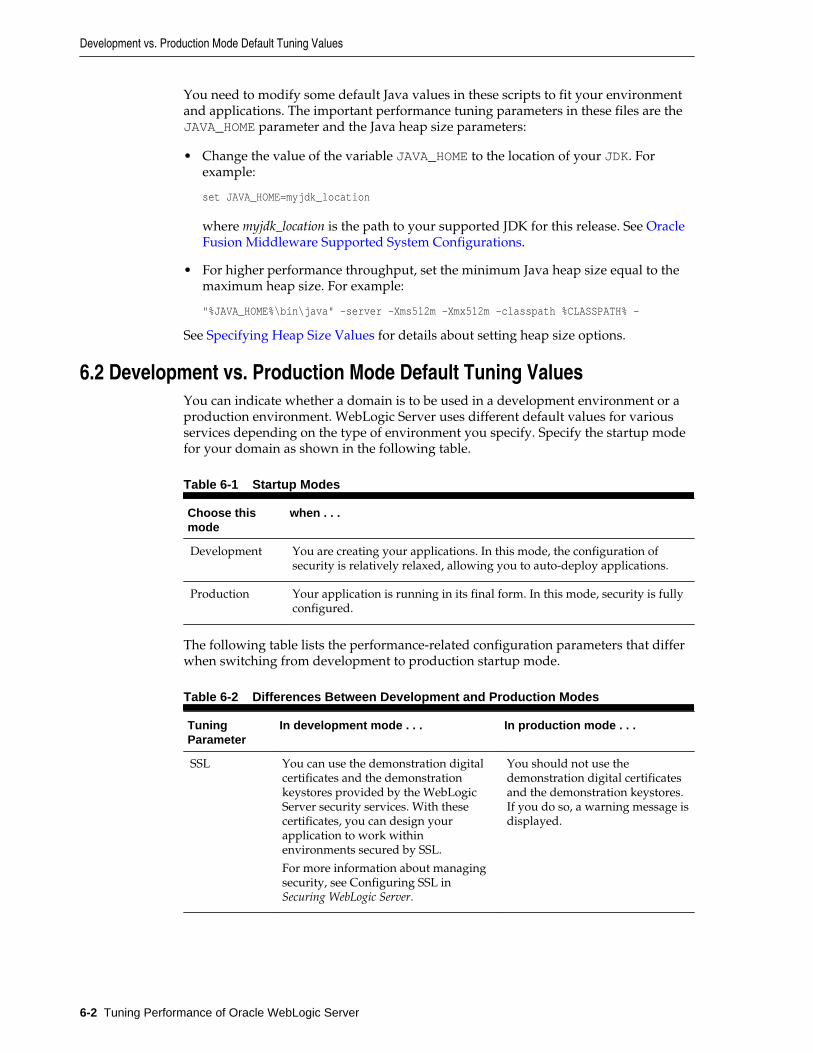
You need to modify some default Java values in these scripts to fit your environmentand applications. The important performance tuning parameters in these files are theJAVA_HOME parameter and the Java heap size parameters:
• Change the value of the variable JAVA_HOME to the location of your JDK. Forexample:
set JAVA_HOME=myjdk_location
where myjdk_location is the path to your supported JDK for this release. See OracleFusion Middleware Supported System Configurations.
• For higher performance throughput, set the minimum Java heap size equal to themaximum heap size. For example:
"%JAVA_HOME%\bin\java" -server –Xms512m –Xmx512m -classpath %CLASSPATH% -
See Specifying Heap Size Values for details about setting heap size options.
6.2 Development vs. Production Mode Default Tuning ValuesYou can indicate whether a domain is to be used in a development environment or aproduction environment. WebLogic Server uses different default values for variousservices depending on the type of environment you specify. Specify the startup modefor your domain as shown in the following table.
Table 6-1 Startup Modes
Choose thismode
when . . .
Development You are creating your applications. In this mode, the configuration ofsecurity is relatively relaxed, allowing you to auto-deploy applications.
Production Your application is running in its final form. In this mode, security is fullyconfigured.
The following table lists the performance-related configuration parameters that differwhen switching from development to production startup mode.
Table 6-2 Differences Between Development and Production Modes
TuningParameter
In development mode . . . In production mode . . .
SSL You can use the demonstration digitalcertificates and the demonstrationkeystores provided by the WebLogicServer security services. With thesecertificates, you can design yourapplication to work withinenvironments secured by SSL.
For more information about managingsecurity, see Configuring SSL inSecuring WebLogic Server.
You should not use thedemonstration digital certificatesand the demonstration keystores.If you do so, a warning message isdisplayed.
Development vs. Production Mode Default Tuning Values
6-2 Tuning Performance of Oracle WebLogic Server
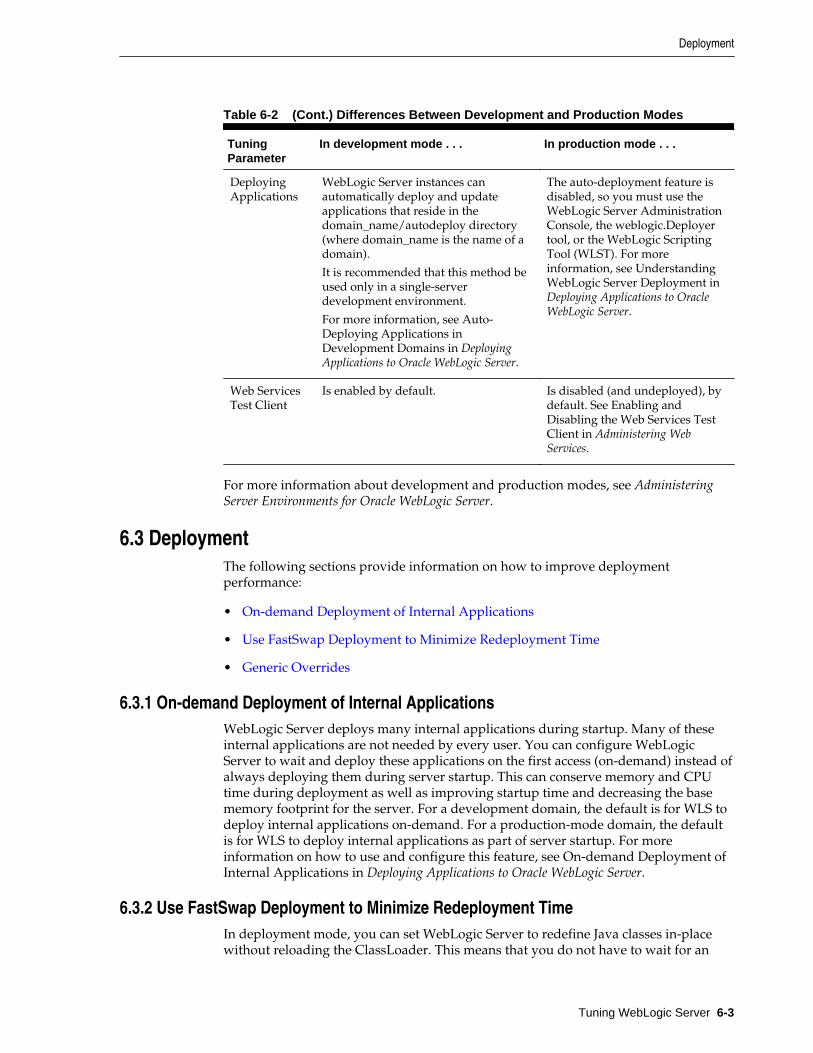
Table 6-2 (Cont.) Differences Between Development and Production Modes
TuningParameter
In development mode . . . In production mode . . .
DeployingApplications
WebLogic Server instances canautomatically deploy and updateapplications that reside in thedomain_name/autodeploy directory(where domain_name is the name of adomain).
It is recommended that this method beused only in a single-serverdevelopment environment.
For more information, see Auto-Deploying Applications inDevelopment Domains in DeployingApplications to Oracle WebLogic Server.
The auto-deployment feature isdisabled, so you must use theWebLogic Server AdministrationConsole, the weblogic.Deployertool, or the WebLogic ScriptingTool (WLST). For moreinformation, see UnderstandingWebLogic Server Deployment inDeploying Applications to OracleWebLogic Server.
Web ServicesTest Client
Is enabled by default. Is disabled (and undeployed), bydefault. See Enabling andDisabling the Web Services TestClient in Administering WebServices.
For more information about development and production modes, see AdministeringServer Environments for Oracle WebLogic Server.
6.3 DeploymentThe following sections provide information on how to improve deploymentperformance:
• On-demand Deployment of Internal Applications
• Use FastSwap Deployment to Minimize Redeployment Time
• Generic Overrides
6.3.1 On-demand Deployment of Internal ApplicationsWebLogic Server deploys many internal applications during startup. Many of theseinternal applications are not needed by every user. You can configure WebLogicServer to wait and deploy these applications on the first access (on-demand) instead ofalways deploying them during server startup. This can conserve memory and CPUtime during deployment as well as improving startup time and decreasing the basememory footprint for the server. For a development domain, the default is for WLS todeploy internal applications on-demand. For a production-mode domain, the defaultis for WLS to deploy internal applications as part of server startup. For moreinformation on how to use and configure this feature, see On-demand Deployment ofInternal Applications in Deploying Applications to Oracle WebLogic Server.
6.3.2 Use FastSwap Deployment to Minimize Redeployment TimeIn deployment mode, you can set WebLogic Server to redefine Java classes in-placewithout reloading the ClassLoader. This means that you do not have to wait for an
Deployment
Tuning WebLogic Server 6-3
application to redeploy and then navigate back to wherever you were in the Web pageflow. Instead, you can make your changes, auto compile, and then see the effectsimmediately. For more information on how to use and configure this feature, see Using FastSwap Deployment to Minimize Redeployment in Deploying Applications toWebLogic Server.
6.3.3 Generic OverridesGeneric overrides allow you to override application specific property files withouthaving to crack a jar file by placing application specific files to be overridden into theAppFileOverrides optional subdirectory. For more information on how to use andconfigure this feature, see Generic File Loading Overrides in Deploying Applications toWebLogic Server.
6.4 Thread ManagementWebLogic Server provides the following mechanisms to manage threads to performwork.
• Tuning a Work Manager
• Understanding the Differences Between Work Managers and Execute Queues
• Migrating from Previous Releases
• Tuning the Stuck Thread Detection Behavior
6.4.1 Tuning a Work ManagerIn this release, WebLogic Server allows you to configure how your applicationprioritizes the execution of its work. Based on rules you define and by monitoringactual runtime performance, WebLogic Server can optimize the performance of yourapplication and maintain service level agreements (SLA).
You tune the thread utilization of a server instance by defining rules and constraintsfor your application by defining a Work Manager and applying it either globally toWebLogic Server domain or to a specific application component. The primary tuningconsiderations are:
• How Many Work Managers are Needed?
• What are the SLA Requirements for Each Work Manager?
See Using Work Managers to Optimize Scheduled Work in Administering ServerEnvironments for Oracle WebLogic Server.
6.4.2 Self-Tuning Thread Pool SizeThe thread pool allocates threads to process the requests of service and client servers.The default value of selfTuningThreadPoolSizeMax MBean attribute is 400.Depending on the service provider and service consumer requests, the pool size can beincreased to the maximum value of 65534.
It is recommended to increase the pool size if:
• Service provider and service consumer share the same WebLogic server.
• The number of concurrent requests from the service consumer is greater than themaximum thread pool size of the work manager.
Thread Management
6-4 Tuning Performance of Oracle WebLogic Server
• Service consumer requests occupy all the threads from the thread pool and there isno thread available for the service provider to respond to the blocking requests.
For more information, see Self-Tuning Thread Pool in Administering ServerEnvironments for Oracle WebLogic Server.
6.4.3 How Many Work Managers are Needed?Each distinct SLA requirement needs a unique work manager.
6.4.4 What are the SLA Requirements for Each Work Manager?Service level agreement (SLA) requirements are defined by instances of requestclasses. A request class expresses a scheduling guideline that a server instance uses toallocate threads. See Understanding Work Managers in Administering ServerEnvironments for Oracle WebLogic Server.
6.4.5 Understanding the Differences Between Work Managers and Execute QueuesThe easiest way to conceptually visualize the difference between the execute queues ofprevious releases with work managers is to correlate execute queues (or rather,execute-queue managers) with work managers and decouple the one-to-onerelationship between execute queues and thread pools.
For releases prior to WebLogic Server 9.0, incoming requests are put into a defaultexecute queue or a user-defined execute queue. Each execute queue has an associatedexecute queue manager that controls an exclusive, dedicated thread-pool with a fixednumber of threads in it. Requests are added to the queue on a first-come-first-servedbasis. The execute-queue manager then picks the first request from the queue and anavailable thread from the associated thread pool and dispatches the request to beexecuted by that thread.
For releases of WebLogic Server 9.0 and higher, there is a single priority-based executequeue in the server. Incoming requests are assigned an internal priority based on theconfiguration of work managers you create to manage the work performed by yourapplications. The server increases or decreases threads available for the execute queuedepending on the demand from the various work-managers. The position of a requestin the execute queue is determined by its internal priority:
• The higher the priority, closer it is placed to the head of the execute queue.
• The closer to the head of the queue, more quickly the request will be dispatched athread to use.
Work managers provide you the ability to better control thread utilization (serverperformance) than execute-queues, primarily due to the many ways that you canspecify scheduling guidelines for the priority-based thread pool. These schedulingguidelines can be set either as numeric values or as the capacity of a server-managedresource, like a JDBC connection pool.
6.4.6 Migrating from Previous ReleasesIf you upgrade application domains from prior releases that contain execute queues,the resulting 9.x domain will contain execute queues.
• Migrating application domains from a previous release to WebLogic Server 9.xdoes not automatically convert an execute queues to work manager.
Thread Management
Tuning WebLogic Server 6-5

• If execute queues are present in the upgraded application configuration, the serverinstance assigns work requests appropriately to the execute queue specified in thedispatch-policy.
• Requests without a dispatch-policy use the self-tuning thread pool.
See Roadmap for Upgrading Your Application Environment in Upgrading OracleWebLogic Server.
6.4.7 Tuning the Stuck Thread Detection BehaviorWebLogic Server automatically detects when a thread in an execute queue becomes"stuck." Because a stuck thread cannot complete its current work or accept new work,the server logs a message each time it diagnoses a stuck thread.
WebLogic Server diagnoses a thread as stuck if it is continually working (not idle) fora set period of time. You can tune a server's thread detection behavior by changing thelength of time before a thread is diagnosed as stuck, and by changing the frequencywith which the server checks for stuck threads. Although you can change the criteriaWebLogic Server uses to determine whether a thread is stuck, you cannot change thedefault behavior of setting the "warning" and "critical" health states when all threadsin a particular execute queue become stuck. For more information, see ConfiguringWebLogic Server to Avoid Overload Conditions in Administering Server Environmentsfor Oracle WebLogic Server. To configure stuck thread detection behavior, see Tuningexecute thread detection behavior in Oracle WebLogic Server Administration ConsoleOnline Help.
6.5 Tuning Network I/OThe following sections provide information on network communication betweenclients and servers (including T3 and IIOP protocols, and their secure versions):
• Tuning Muxers
• Network Channels
• Reducing the Potential for Denial of Service Attacks
• Tuning Connection Backlog Buffering
• Tuning Cached Connections
6.5.1 Tuning MuxersWebLogic Server uses software modules called muxers to read incoming requests onthe server and incoming responses on the client. WebLogic Server supports thefollowing muxer types:
• Java Non-Blocking IO (NIO) Muxer
• Native Muxers
6.5.1.1 Java Non-Blocking IO (NIO) Muxer
WebLogic Server provides a non-blocking IO muxer implementation as the defaultmuxer configuration. In the default configuration, MuxerClass is set toweblogic.socket.NIOSocketMuxer.
Tuning Network I/O
6-6 Tuning Performance of Oracle WebLogic Server
6.5.1.2 Native Muxers
Native Muxers are not recommended for most environments. If you must enable thesemuxers, the value of the MuxerClass attribute must be explicitly set:
• Solaris/HP-UX Native Muxer: weblogic.socket.DevPollSocketMuxer
• POSIX Native Muxer: weblogic.socket.PosixSocketMuxer
• Windows Native Muxer: weblogic.socket.NTSocketMuxer
For example, switching to the native NT Socket Muxer on Windows platforms mayimprove performance for larger messages/payloads when there is one socketconnection to the WebLogic Server instance.
-Dweblogic.MuxerClass=weblogic.socket.NTSocketMux
The POSIX Native Muxer provides similar performance improvements for largermessages/payloads in UNIX-like systems that support poll system calls, such asSolaris and HP-UX:
-Dweblogic.MuxerClass=weblogic.socket.PosixSocketMuxer
Native muxers use platform-specific native binaries to read data from sockets. Themajority of all platforms provide some mechanism to poll a socket for data. Forexample, Unix systems use the poll system call and the Windows architecture usescompletion ports. Native muxers implement a non-blocking thread model. When anative muxer is used, the server creates a fixed number of threads dedicated toreading incoming requests. Prior to WebLogic Server 12.1.2, Oracle recommended touse native muxers and referred to as performance packs.
For WebLogic Server 12.1.2 and subsequent releases, the Non-Blocking IO (NIO)muxer is recommended by default. However, Oracle still provides native muxer as anoption for users upgrading WebLogic Server versions prior to 12.1.2 to maximizeconsistency of the runtime environment after upgrading. See Enable Native IO inOracle WebLogic Server Administration Console Help.
With native muxers, you may be able to improve throughput for some cpu-boundapplications by using the following:
-Dweblogic.socket.SocketMuxer.DELAY_POLL_WAKEUP=xx
where xx is the amount of time, in microseconds, to delay before checking if data isavailable. The default value is 0, which corresponds to no delay.
6.5.1.3 Server Location and Supported Platforms
You can refer to the below example for WebLogic Server installation and supportedplatforms.
Install Location
[/home/gmcdermo/Oracle/src1221_GA] find wlserver/server/native/ -type f wlserver/server/native/linux/x86_64/libjmsc.sowlserver/server/native/linux/x86_64/libcloudstore1.sowlserver/server/native/linux/x86_64/libwlenv.sowlserver/server/native/linux/x86_64/libwlfileio3.sowlserver/server/native/linux/x86_64/libnodemanager.sowlserver/server/native/linux/x86_64/libweblogicunix1.sowlserver/server/native/linux/x86_64/libipc1.sowlserver/server/native/linux/x86_64/libwlrepstore1.so
Tuning Network I/O
Tuning WebLogic Server 6-7
wlserver/server/native/linux/x86_64/libmuxer.sowlserver/server/native/linux/x86_64/wlkeytoolwlserver/server/native/linux/x86_64/rs_daemonwlserver/server/native/linux/x86_64/rs_adminwlserver/server/native/linux/x86_64/libstackdump.sowlserver/server/native/linux/x86_64/libmql1.so
Supported Platforms
The native library supports the following platforms:
oracle.wls.core.app.server.nativelib/template.xml: dest="server/native/solaris/sparc64/libmuxer.so" source="wlserver/server/native/solaris/sparc64/libmuxer.so"oracle.wls.core.app.server.nativelib/template.xml: dest="server/native/solaris/sparc/libmuxer.so" source="wlserver/server/native/solaris/sparc/libmuxer.so"oracle.wls.core.app.server.nativelib/template.xml: dest="server/native/solaris/x64/libmuxer.so" source="wlserver/server/native/solaris/x64/libmuxer.so"oracle.wls.core.app.server.nativelib/template.xml: dest="server/native/solaris/x86/libmuxer.so" source="wlserver/server/native/solaris/x86/libmuxer.so"oracle.wls.core.app.server.nativelib/template.xml: dest="server/native/linux/s390x/libmuxer.so" source="wlserver/server/native/linux/s390x/libmuxer.so"oracle.wls.core.app.server.nativelib/template.xml: dest="server/native/linux/ia64/libmuxer.so" source="wlserver/server/native/linux/ia64/libmuxer.so"oracle.wls.core.app.server.nativelib/template.xml: dest="server/native/aix/ppc64/libmuxer.so" source="wlserver/server/native/aix/ppc64/libmuxer.so"oracle.wls.core.app.server.nativelib/template.xml: dest="server/native/aix/ppc/libmuxer.so" source="wlserver/server/native/aix/ppc/libmuxer.so"oracle.wls.core.app.server.nativelib/template.xml: dest="server/native/macosx/libmuxer.jnilib" source="wlserver/server/native/macosx/libmuxer.jnilib"oracle.wls.core.app.server.nativelib/template.xml: dest="server/native/hpux11/IPF64/libmuxer.so" source="wlserver/server/native/hpux11/IPF64/libmuxer.so"oracle.wls.core.app.server.tier1nativelib/template.xml: dest="server/native/linux/i686/libmuxer.so" source="wlserver/server/native/linux/i686/libmuxer.so"oracle.wls.core.app.server.tier1nativelib/template.xml: dest="server/native/linux/x86_64/libmuxer.so" source="wlserver/server/native/linux/x86_64/libmuxer.so"
6.5.2 Network ChannelsNetwork channels, also called network access points, allow you to specify differentquality of service (QOS) parameters for network communication. Each networkchannel is associated with its own exclusive socket using a unique IP address and port.By default, T3 requests from a multi-threaded client are multiplexed over the sameremote connection and the server instance reads requests from the socket one at atime. If the request size is large, this becomes a bottleneck.
Although the primary role of a network channel is to control the network traffic for aserver instance, you can leverage the ability to create multiple custom channels toallow a multi-threaded client to communicate with server instance over multiple
Tuning Network I/O
6-8 Tuning Performance of Oracle WebLogic Server
connections, reducing the potential for a bottleneck. To configure custom multi-channel communication, use the following steps:
1. Configure multiple network channels using different IP and port settings. See Configure custom network channels in Oracle WebLogic Server AdministrationConsole Online Help.
2. In your client-side code, use a JNDI URL pattern similar to the pattern used inclustered environments. The following is an example for a client using twonetwork channels:
t3://<ip1>:<port1>,<ip2>:<port2>
See Understanding Network Channels in Administering Server Environments for OracleWebLogic Server.
6.5.3 Reducing the Potential for Denial of Service AttacksTo reduce the potential for Denial of Service (DoS) attacks while simultaneouslyoptimizing system availability, WebLogic Server allows you to specify the followingsettings:
• Maximum incoming message size
• Complete message timeout
• Number of file descriptors (UNIX systems)
For optimal system performance, each of these settings should be appropriate for theparticular system that hosts WebLogic Server and should be in balance with eachother, as explained in the sections that follow.
6.5.3.1 Tuning Message Size
WebLogic Server allows you to specify a maximum incoming request size to preventserver from being bombarded by a series of large requests. You can set a global valueor set specific values for different protocols and network channels. Although it doesnot directly impact performance, JMS applications that aggregate messages beforesending to a destination may be refused if the aggregated size is greater than specifiedvalue. See Servers: Protocols: General in Oracle WebLogic Server Administration ConsoleOnline Help and Tuning Applications Using Unit-of-Order.
6.5.3.2 Tuning Complete Message Timeout
Make sure that the complete message timeout parameter is configured properly foryour system. This parameter sets the maximum number of seconds that a server waitsfor a complete message to be received.
The default value is 60 seconds, which applies to all connection protocols for thedefault network channel. This setting might be appropriate if the server has a numberof high-latency clients. However, you should tune this to the smallest possible valuewithout compromising system availability.
If you need a complete message timeout setting for a specific protocol, you canalternatively configure a new network channel for that protocol.
For information about displaying the WebLogic Server Administration Console pagefrom which the complete message timeout parameter can be set, see Configureprotocols in the Oracle WebLogic Server Administration Console Online Help.
Tuning Network I/O
Tuning WebLogic Server 6-9
6.5.3.3 Tuning Number of File Descriptors
On UNIX systems, each socket connection to WebLogic Server consumes a filedescriptor. To optimize availability, the number of file descriptors for WebLogicServer should be appropriate for the host machine. By default, WebLogic Serverconfigures 1024 file descriptors. However, this setting may be low, particularly forproduction systems.
Note that when you tune the number of file descriptors for WebLogic Server, yourchanges should be in balance with any changes made to the complete message timeoutparameter. A higher complete message timeout setting results in a socket not closinguntil the message timeout occurs, which therefore results in a longer hold on the filedescriptor. So if the complete message timeout setting is high, the file descriptor limitshould also be set high. This balance provides optimal system availability withreduced potential for denial-of-service attacks.
For information about how to tune the number of available file descriptors, consultyour UNIX vendor's documentation.
6.5.4 Tuning Connection Backlog BufferingYou can tune the number of connection requests that a WebLogic Server instance willaccept before refusing additional requests. The Accept Backlog parameter specifieshow many Transmission Control Protocol (TCP) connections can be buffered in a waitqueue. This fixed-size queue is populated with requests for connections that the TCPstack has received, but the application has not accepted yet.
You can tune the number of connection requests that a WebLogic Server instance willaccept before refusing additional requests, see Tune connection backlog buffering inOracle WebLogic Server Administration Console Online Help.
6.5.5 Tuning Cached ConnectionsUse the http.keepAliveCache.socketHealthCheckTimeout system propertyfor tuning the behavior of how a socket connection is returned from the cache whenkeep-alive is enabled when using HTTP 1.1 protocol. By default, the cache does notcheck the health condition before returning the cached connection to the client for use.Under some conditions, such as due to an unstable network connection, the systemneeds to check the connection's health condition before returning it to the client. Toenable this behavior (checking the health condition), sethttp.keepAliveCache.socketHealthCheckTimeout to a value greater than 0.
6.6 Multitenancy Tuning RecommendationsIf you are running multiple partitions under heavy load on a system with a largenumber of cores, you might need to modify some of the WLS thread pool settings toimprove CPU utilization. Tuning the thread pools can result in increased throughput,reduced response times, and better CPU utilization.
The following guidelines should be considered a starting point. You will likely need toexperiment with different values to find optimal settings for your specific work load.
• Muxer Threads (Socket Readers)
Muxer threads are responsible for handling incoming network requests anddispatching them to appropriate work threads. For the native muxer (typically thedefault muxer), WLS uses a fairly low number of muxer threads (4) but this value
Multitenancy Tuning Recommendations
6-10 Tuning Performance of Oracle WebLogic Server
might not be sufficient to keep up with the throughput capacity of a high corecount system.
To increase the number of muxer threads on a WLS server you can:
– Set it usingServerMBean.setSocketReaders(N), or
– Set it by passing the following JAVA_OPTION on server startup: -Dweblogic.SocketReaders=N
To confirm the number of socket readers, look for the log message: Allocating Nreader threadsat server startup.
For a starting point, try setting the number of muxer threads to be roughly 20% ofthe number of system hardware threads.
• Thread Pool
The thread pool is responsible for allocating threads to do the work in WLS afterrequests have been dispatched by the muxer threads. By default WLS uses a selftuning pool that generally works well for a variety of work loads but underconstant, heavy load, it can sometimes be more efficient to tune the thread pool sizeto better match the core count of the server.
To modify the thread pool settings on a WLS server you can:
– Set it using ServerMBean.setSelfTuningThreadPoolSizeMin(N)andsetSelfTuningThreadPoolSizeMax(N), or
– Set it by passing the following JAVA_OPTIONs on server startup: -Dweblogic.threadpool.MinPoolSize=N -Dweblogic.threadpool.MaxPoolSize=N
For a starting point, try setting the thread pool min and max size to be roughly 80%of the number of system hardware threads.
To improve performance when Resource Consumption Management (RCM) isenabled with a varying number of partitions, WLS has introduced a systemproperty, weblogic.work.rcm.perPartitionPoolSize, for tuning the perpartition pool size.
When RCM is enabled, the WLS self-tuning thread pool will try to use threads thathave previously executed work requests for a partition to perform the next workrequest for that same partition. WLS maintains a cache of threads for each partition.The default size of this cache is 16 threads. You can configure the cache size usingthe weblogic.work.rcm.perPartitionPoolSizesystem property. Whenspecified, its value should be between 1 and 256, and will be rounded up to thenext power of 2. A smaller value reduces memory usage while a larger valueincreases the chance of finding a cached thread from the same partition forexecuting the work request.
For additional resource sharing topics, see Configuring Resource ConsumptionManagement in Using WebLogic Server MT.
6.7 Tuning the Work Manager Queue SizeBy default, the queue size for the Work Manager’s maximum threads constraint is8,192 (8K). During times of high load (when the machine CPU runs at 100%utilization), Work Manager instances may be unable to process messages in the queuequickly enough using this default setting. In multitenant environments, you may want
Tuning the Work Manager Queue Size
Tuning WebLogic Server 6-11
to increase the queue size, particularly if you anticipate running Managed Serversunder high load for long periods of time. You may also need to increase the queue sizein response to the following runtime exception:
java.lang.RuntimeException: [WorkManager:002943]Maximum ThreadsConstraint "ClusterMessaging" queue for work manager"ClusterMessaging" reached maximum capacity of 8,192 elements.Consider setting a larger queue size for the maximum threadsconstraint.
Use the <self-tuning> element in the config.xml file to adjust the queue size.
In the following example, the target is specified by the server name (Server-0), and thequeue size is increased to 65,536 (64K).
<max-threads-constraint> <name>ClusterMessaging-max</name> <target>Server-0</target> <count>1</count> <queue-size>65536</queue-size></max-threads-constraint>
<work-manager> <name>ClusterMessaging</name> <target>Server-0</target> <max-threads-constraint>ClusterMessaging-max</max-threads-constraint> </work-manager>
You can specify the target using either the server name or the cluster name. You canuse either server or cluster as target names.
6.8 Optimize Java ExpressionsSet the optimize-java-expression element to optimize Java expressions to improveruntime performance. See jsp-descriptor in Developing Web Applications, Servlets,and JSPs for Oracle WebLogic Server.
6.9 Using WebLogic Server Clusters to Improve PerformanceA WebLogic Server cluster is a group of WebLogic Servers instances that togetherprovide fail-over and replicated services to support scalable high-availabilityoperations for clients within a domain. A cluster appears to its clients as a single serverbut is in fact a group of servers acting as one to provide increased scalability andreliability.
A domain can include multiple WebLogic Server clusters and non-clustered WebLogicServer instances. Clustered WebLogic Server instances within a domain behavesimilarly to non-clustered instances, except that they provide failover and loadbalancing. The Administration Server for the domain manages all the configurationparameters for the clustered and non-clustered instances.
For more information about clusters, see Understanding WebLogic Server Clusteringin Administering Clusters for Oracle WebLogic Server.
6.9.1 Scalability and High AvailabilityScalability is the ability of a system to grow in one or more dimensions as moreresources are added to the system. Typically, these dimensions include (among other
Optimize Java Expressions
6-12 Tuning Performance of Oracle WebLogic Server
things), the number of concurrent users that can be supported and the number oftransactions that can be processed in a given unit of time.
Given a well-designed application, it is entirely possible to increase performance bysimply adding more resources. To increase the load handling capabilities of WebLogicServer, add another WebLogic Server instance to your cluster—without changing yourapplication. Clusters provide two key benefits that are not provided by a single server:scalability and availability.
WebLogic Server clusters bring scalability and high-availability to Java EEapplications in a way that is transparent to application developers. Scalability expandsthe capacity of the middle tier beyond that of a single WebLogic Server or a singlecomputer. The only limitation on cluster membership is that all WebLogic Serversmust be able to communicate by IP multicast. New WebLogic Servers can be added toa cluster dynamically to increase capacity.
A WebLogic Server cluster guarantees high-availability by using the redundancy ofmultiple servers to insulate clients from failures. The same service can be provided onmultiple servers in a cluster. If one server fails, another can take over. The ability tohave a functioning server take over from a failed server increases the availability of theapplication to clients.
Note:
Provided that you have resolved all application and environment bottleneckissues, adding additional servers to a cluster should provide linear scalability.When doing benchmark or initial configuration test runs, isolate issues in asingle server environment before moving to a clustered environment.
Clustering in the Messaging Service is provided through distributed destinations;connection concentrators, and connection load-balancing (determined by connectionfactory targeting); and clustered Store-and-Forward (SAF). Client load-balancing withrespect to distributed destinations is tunable on connection factories. Distributeddestination Message Driven Beans (MDBs) that are targeted to the same cluster thathosts the distributed destination automatically deploy only on cluster servers that hostthe distributed destination members and only process messages from their localdestination. Distributed queue MDBs that are targeted to a different server or clusterthan the host of the distributed destination automatically create consumers for everydistributed destination member. For example, each running MDB has a consumer foreach distributed destination queue member.
6.9.2 How to Ensure Scalability for WebLogic ClustersIn general, any operation that requires communication between the servers in a clusteris a potential scalability hindrance. The following sections provide information onissues that impact the ability to linearly scale clustered WebLogic servers:
• Database Bottlenecks
• Session Replication
• Asynchronous HTTP Session Replication
• Invalidation of Entity EJBs
• Invalidation of HTTP sessions
Using WebLogic Server Clusters to Improve Performance
Tuning WebLogic Server 6-13
• JNDI Binding_ Unbinding and Rebinding
6.9.2.1 Database Bottlenecks
In many cases where a cluster of WebLogic servers fails to scale, the database is thebottleneck. In such situations, the only solutions are to tune the database or reduceload on the database by exploring other options. See DataBase Tuning and TuningData Sources.
6.9.2.2 Session Replication
User session data can be stored in two standard ways in a Java EE application: statefulsession EJBs or HTTP sessions. By themselves, they are rarely a impact clusterscalability. However, when coupled with a session replication mechanism required toprovide high-availability, bottlenecks are introduced. If a Java EE application has Weband EJB components, you should store user session data in HTTP sessions:
• HTTP session management provides more options for handling fail-over, such asreplication, a shared DB or file.
• Superior scalability.
• Replication of the HTTP session state occurs outside of any transactions. Statefulsession bean replication occurs in a transaction which is more resource intensive.
• The HTTP session replication mechanism is more sophisticated and providesoptimizations a wider variety of situations than stateful session bean replication.
See Session Management.
6.9.2.3 Asynchronous HTTP Session Replication
Asynchronous replication of http sessions provides the option of choosingasynchronous session replication using:
• Asynchronous HTTP Session Replication using a Secondary Server
• Asynchronous HTTP Session Replication using a Database
6.9.2.3.1 Asynchronous HTTP Session Replication using a Secondary Server
Set the PersistentStoreType to async-replicated or async-replicated-if-clustered tospecify asynchronous replication of data between a primary server and a secondaryserver. See session-descriptor section of Developing Web Applications, Servlets, andJSPs for Oracle WebLogic Server. To tune batched replication, adjust theSessionFlushThreshold parameter.
Replication behavior depends on cluster type. The following table describes howasynchronous replication occurs for a given cluster topology.
Table 6-3 Asynchronous Replication Behavior by Cluster Topology
Topology Behavior
LAN Replication to a secondary server within the same cluster occurs asynchronouslywith the "async-replication" setting in the webapp.
MAN Replication to a secondary server in a remote cluster. This happensasynchronously with the "async-replication" setting in the webapp.
Using WebLogic Server Clusters to Improve Performance
6-14 Tuning Performance of Oracle WebLogic Server

Table 6-3 (Cont.) Asynchronous Replication Behavior by Cluster Topology
Topology Behavior
WAN Replication to a secondary server within the cluster happens asynchronouslywith the "async-replication" setting in the webapp. Persistence to a databasethrough a remote cluster happens asynchronously regardless of whether "async-replication" or "replication" is chosen.
The following section outlines asynchronous replication session behavior:
• During undeployment or redeployment:
– The session is unregistered and removed from the update queue.
– The session on the secondary server is unregistered.
• If the application is moved to admin mode, the sessions are flushed and replicatedto the secondary server. If secondary server is down, the system attempts tofailover to another server.
• A server shutdown or failure state triggers the replication of any batched sessionsto minimize the potential loss of session information.
6.9.2.3.2 Asynchronous HTTP Session Replication using a Database
Set the PersistentStoreType to async-jdbc to specify asynchronous replication of datato a database. See session-descriptor section of Developing Web Applications, Servlets,and JSPs for Oracle WebLogic Server. To tune batched replication, adjust theSessionFlushThreshold and the SessionFlushInterval parameters.
The following section outlines asynchronous replication session behavior:
• During undeployment or redeployment:
– The session is unregistered and removed from the update queue.
– The session is removed from the database.
• If the application is moved to admin mode, the sessions are flushed and replicatedto the database.
6.9.2.4 Invalidation of Entity EJBs
This applies to entity EJBs that use a concurrency strategy of Optimistic orReadOnly with a read-write pattern.
Optimistic—When an Optimistic concurrency bean is updated, the EJB containersends a multicast message to other cluster members to invalidate their local copies ofthe bean. This is done to avoid optimistic concurrency exceptions being thrown by theother servers and hence the need to retry transactions. If updates to the EJBs arefrequent, the work done by the servers to invalidate each other's local caches become aserious bottleneck. A flag called cluster-invalidation-disabled (default false)is used to turn off such invalidations. This is set in the rdbms descriptor file.
ReadOnly with a read-write pattern—In this pattern, persistent data that wouldotherwise be represented by a single EJB are actually represented by two EJBs: oneread-only and the other updatable. When the state of the updateable bean changes, thecontainer automatically invalidates corresponding read-only EJB instance. If updates
Using WebLogic Server Clusters to Improve Performance
Tuning WebLogic Server 6-15
to the EJBs are frequent, the work done by the servers to invalidate the read-only EJBsbecomes a serious bottleneck.
6.9.2.5 Invalidation of HTTP sessions
Similar to Invalidation of Entity EJBs, HTTP sessions can also be invalidated. This isnot as expensive as entity EJB invalidation, since only the session data stored in thesecondary server needs to be invalidated. HTTP sessions should be invalidated if theyare no longer in use.
6.9.2.6 JNDI Binding, Unbinding and Rebinding
In general, JNDI binds, unbinds and rebinds are expensive operations. However, theseoperations become a bigger bottleneck in clustered environments because JNDI treechanges have to be propagated to all members of a cluster. If such operations areperformed too frequently, they can reduce cluster scalability significantly.
6.9.3 Running Multiple Server Instances on Multi-Core MachinesWith multi-core machines, additional consideration must be given to the ratio of thenumber of available cores to clustered WebLogic Server instances. Because WebLogicServer has no built-in limit to the number of server instances that reside in a cluster,large, multi-core servers, can potentially host very large clusters or multiple clusters.
Consider the following when determining the optimal ratio of cores to WebLogicServer instances:
• The memory requirements of the application. Choose the heap sizes of anindividual instance and the total number of instances to ensure that you'reproviding sufficient memory for the application and achieving good GCperformance. For some applications, allocating very large heaps to a single instancemay lead to longer GC pause times. In this case the performance may benefit fromincreasing the number of instances and giving each instance a smaller heap.
• Maximizing CPU utilization. While WebLogic Server is capable of utilizingmultiple cores per instance, for some applications, increasing the number ofinstances on a given machine (reducing the number of cores per instance) canimprove CPU utilization and overall performance.
6.9.4 Improving Cluster Throughput using XA Transaction Cluster AffinityXA transaction cluster affinity allows server instances that are participating in a globaltransactions to service related requests rather than load-balancing these requests toother member servers. When Enable Transaction Affinity=true, clusterthroughput is increased by:
• Reducing inter-server transaction coordination traffic
• Improving resource utilization, such as reducing JDBC connections
• Simplifying asynchronous processing of transactions
See Configure clusters in Oracle WebLogic Server Administration Console Online Help and XA Transaction Affinity in Administering Clusters for Oracle WebLogic Server.
Using WebLogic Server Clusters to Improve Performance
6-16 Tuning Performance of Oracle WebLogic Server
6.10 Monitoring a WebLogic Server DomainThe following sections provide information on how to monitor WebLogic Serverdomains:
• Using the Administration Console to Monitor WebLogic Server
• Using the WebLogic Diagnostic Framework
• Using JMX to Monitor WebLogic Server
• Using WLST to Monitor WebLogic Server
6.10.1 Using the Administration Console to Monitor WebLogic ServerThe tool for monitoring the health and performance of your WebLogic Server domainis the Administration Console. See Monitor servers in Oracle WebLogic ServerAdministration Console Online Help.
6.10.2 Using the WebLogic Diagnostic FrameworkThe WebLogic Diagnostic Framework (WLDF) is a monitoring and diagnosticframework that defines and implements a set of services that run within WebLogicServer processes and participate in the standard server life cycle. See Overview of theWLDF Architecture in Configuring and Using the Diagnostics Framework for OracleWebLogic Server.
6.10.3 Using JMX to Monitor WebLogic ServerWebLogic Server provides its own set of MBeans that you can use to configure,monitor, and manage WebLogic Server resources. See Understanding WebLogicServer MBeans in Developing Custom Management Utilities Using JMX for OracleWebLogic Server.
6.10.4 Using WLST to Monitor WebLogic ServerThe WebLogic Scripting Tool (WLST) is a command-line scripting interface thatsystem administrators and operators use to monitor and manage WebLogic Serverinstances and domains. See Understanding WebLogic Server MBeans in DevelopingCustom Management Utilities Using JMX for Oracle WebLogic Server.
6.10.5 Resources to Monitor WebLogic ServerThe Oracle Technology Network at http://www.oracle.com/technetwork/index.html provides product downloads, articles, sample code, productdocumentation, tutorials, white papers, news groups, and other key content forWebLogic Server.
6.11 Tuning Class and Resource LoadingThe default class and resource loading default behavior in WebLogic Server is tosearch the classloader hierarchy beginning with the root. As a result, the full systemclasspath is searched for every class or resource loading request, even if the class orresource belongs to the application. For classes and resources that are only looked uponce (for example: classloading during deployment), the cost of the full classpath
Monitoring a WebLogic Server Domain
Tuning WebLogic Server 6-17
search is typically not a serious problem. For classes and resources that are requestedrepeatedly by an application at runtime (explicit application calls to loadClass orgetResource) the CPU and memory overhead of repeatedly searching a long systemand application classpath can be significant. The worst case scenario is when therequested class or resource is missing. A missing class or resource results in the cost ofa full scan of the classpath and is compounded by the fact that if an application failsto find the class/resource it is likely to request it repeatedly. This problem is morecommon for resources than for classes.
Ideally, application code is optimized to avoid requests for missing classes andresources and frequent repeated calls to load the same class/resource. While it is notalways possible to fix the application code (for example, a third party library), analternative is to use WebLogic Server's Filtering Loader Mechanism.
6.11.1 Filtering Loader MechanismWebLogic Server provides a filtering loader mechanism that allows the systemclasspath search to be bypassed when looking for specific application classes andresources that are on the application classpath. This mechanism requires a userconfiguration that specifies the specific classes and resources that bypass the systemclasspath search. See Using a Filtering Classloader in Developing Applications forOracle WebLogic Server.
New for this release is the ability to filter resource loading requests. The basicconfiguration of resource filtering is specified in META-INF/weblogic-application.xml file and is similar to the class filtering. The the syntax for filteringresources is shown in the following example:
<prefer-application-resources><resource-name>x/y</resource-name><resource-name>z*</resource-name></prefer-application-resources>
In this example, resource filtering has been configured for the exact resource name"x/y" and for any resource whose name starts with "z". '*' is the only wild card patternallowed. Resources with names matching these patterns are searched for only on theapplication classpath, the system classpath search is skipped.
Note:
If you add a class or resource to the filtering configuration and subsequentlyget exceptions indicating the class or resource isn't found, the most likelycause is that the class or resource is on the system classpath, not on theapplication classpath.
6.11.2 Class CachingWebLogic Server allows you to enable class caching for faster start ups. Once youenable caching, the server records all the classes loaded until a specific criterion isreached and persists the class definitions in an invisible file. When the server restarts,the cache is checked for validity with the existing code sources and the server uses thecache file to bulk load the same sequence of classes recorded in the previous run. Ifany change is made to the system classpath or its contents, the cache will beinvalidated and re-built on server restart.
The advantages of using class caching are:
Tuning Class and Resource Loading
6-18 Tuning Performance of Oracle WebLogic Server

• Reduces server startup time.
• The package level index reduces search time for all classes and resources.
For more information, see Configuring Class Caching in Developing Applications forOracle WebLogic Server.
Note:
Class caching is supported in development mode when starting the serverusing a startWebLogic script. Class caching is disabled by default and isnot supported in production mode. The decrease in startup time varies amongdifferent JRE vendors.
6.12 SSL ConsiderationsIf WebLogic Server is configured with JDK 7, you may find that the out-of-the-box SSLperformance slower than in previous WebLogic Server releases. This performancechange is due to the stronger cipher and MAC algorithm used by default when JDK 7is used with the JSSE-based SSL provider in WebLogic Server. See SSL PerformanceConsiderations in Administering Security for Oracle WebLogic Server.
SSL Considerations
Tuning WebLogic Server 6-19

SSL Considerations
6-20 Tuning Performance of Oracle WebLogic Server
7Tuning the WebLogic Persistent Store
The persistent store provides a built-in, high-performance storage solution forWebLogic Server subsystems and services that require persistence. Tune the persistentstore by following the procedures described in this chapter.
This chapter includes the following sections:
• Overview of Persistent Stores
• Best Practices When Using Persistent Stores
• Tuning JDBC Stores
• Tuning File Stores
• Using a Network File System
7.1 Overview of Persistent StoresThe following sections provide information on using persistent stores.
• Using the Default Persistent Store
• Using Custom File Stores and JDBC Stores
• Using a JDBC TLOG Store
• Using JMS Paging Stores
• Using Diagnostic Stores
7.1.1 Using the Default Persistent StoreEach server instance, including the administration server, has a default persistent storethat requires no configuration. The default store is a file-based store that maintains itsdata in a group of files in a server instance's data\store\default directory. Adirectory for the default store is automatically created if one does not already exist.This default store is available to subsystems that do not require explicit selection of aparticular store and function best by using the system's default storage mechanism.For example, a JMS Server with no persistent store configured will use the defaultstore for its Managed Server and will support persistent messaging. See:
• Using the WebLogic Persistent Store in Administering the WebLogic Persistent Store.
• Modify the Default Store Settings in Oracle WebLogic Server Administration ConsoleOnline Help.
Tuning the WebLogic Persistent Store 7-1

7.1.2 Using Custom File Stores and JDBC StoresIn addition to using the default file store, you can also configure a file store or JDBCstore to suit your specific needs. A custom file store, like the default file store,maintains its data in a group of files in a directory. However, you may want to create acustom file store so that the file store's data is persisted to a particular storage device.When configuring a file store directory, the directory must be accessible to the serverinstance on which the file store is located.
A JDBC store can be configured when a relational database is used for storage. A JDBCstore enables you to store persistent messages in a standard JDBC-capable database,which is accessed through a designated JDBC data source. The data is stored in theJDBC store's database table, which has a logical name of WLStore. It is up to thedatabase administrator to configure the database for high availability andperformance. See:
• When to Use a Custom Persistent Store in Administering the WebLogic PersistentStore.
• Comparing File Stores and JDBC Stores in Administering the WebLogic PersistentStore.
• Creating a Custom (User-Defined) File Store in Administering the WebLogic PersistentStore.
• Creating a JDBC Store in Administering the WebLogic Persistent Store.
7.1.3 Using a JDBC TLOG StoreYou can configure a JDBC TLOG store to persist transaction logs to a database, whichallows you to leverage replication and HA characteristics of the underlying database,simplify disaster recovery, and improve Transaction Recovery service migration. See Using a JDBC TLog Store in Administering the WebLogic Persistent Store.
7.1.4 Using JMS Paging StoresEach JMS server implicitly creates a file based paging store. When the WebLogicServer JVM runs low on memory, this store is used to page non-persistent messages aswell as persistent messages. Depending on the application, paging stores maygenerate heavy disk activity.
You can optionally change the directory location and the threshold settings at whichpaging begins. You can improve performance by locating paging store directories on alocal file system, preferably in a temporary directory. Paging store files do not need tobe backed up, replicated, or located in universally accessible location as they areautomatically repopulated each time a JMS server restarts. See JMS Server Behavior inWebLogic Server 9.x and Later in Administering JMS Resources for Oracle WebLogicServer.
Overview of Persistent Stores
7-2 Tuning Performance of Oracle WebLogic Server
Note:
Paged persistent messages are potentially physical stored in two differentplaces:
• Always in a recoverable default or custom store.
• Potentially in a paging directory.
7.1.4.1 Using Flash Storage to Page JMS Messages
You can often improve paging performance for JMS messages (persistent or non-persistent) by configuring JMS server paging directories to reference a directory on alocally mounted enterprise-class flash storage device. This can be significantly fasterthan other technologies
Note:
Most Flash storage devices are a single point of failure and are typically onlyaccessible as a local device. They are suitable for JMS server paging storeswhich do not recover data after a failure and automatically reconstructthemselves as needed.
In most cases, Flash storage devices are not suitable for custom or defaultstores which typically contains data that must be safely recoverable. Aconfigured Directory attribute of a default or custom store should notnormally reference a directory that is on a single point of failure device.
Use the following steps to use a Flash storage device to page JMS messages:
1. Set the JMS server Message Paging Directory attribute to the path of yourflash storage device, see Specifying a Message Paging Directory.
2. Tune the Message Buffer Size attribute (it controls when paging becomesactive). You may be able to use lower threshold values as faster I/O operationsprovide improved load absorption. See Tuning the Message Buffer Size Option.
3. Tune JMS Server quotas to safely account for any Flash storage space limitations.This ensures that your JMS server(s) will not attempt to page more messages thanthe device can store, potentially yielding runtime errors and/or automaticshutdowns. As a conservative rule of thumb, assume page file usage will be at least1.5 * ((Maximum Number of Active Messages) * (512 + average message body size))rounded up to the nearest 16MB. See Defining Quota.
7.1.5 Using Diagnostic StoresThe Diagnostics store is a file store that implicitly always uses the Disabledsynchronous write policy. It is dedicated to storing WebLogic server diagnosticsinformation. One diagnostic store is configured per WebLogic Server instance. See Configuring Diagnostic Archives in Configuring and Using the Diagnostics Framework forOracle WebLogic Server.
Overview of Persistent Stores
Tuning the WebLogic Persistent Store 7-3
7.2 Best Practices When Using Persistent Stores• For subsystems that share the same server instance, share one store between
multiple subsystems rather than using a store per subsystem. Sharing a store ismore efficient for the following reasons:
– A single store batches concurrent requests into single I/Os which reducesoverall disk usage.
– Transactions in which only one resource participates are lightweight one-phasetransactions. Conversely, transactions in which multiple stores participatebecome heavier weight two-phase transactions.
For example, configure all SAF agents and JMS servers that run on the same serverinstance so that they share the same store.
• Add a new store only when the old store(s) no longer scale.
7.3 Tuning JDBC StoresThe following section provides information on tuning JDBC Stores:
• A WebLogic JDBC Store instance obtains two JDBC connections from its DataSource and caches these connections for its entire lifetime. The JDBC Stores shouldtune their Data Source to test connections.
• Under heavy JDBC store I/O loads, you can improve performance by configuring aJDBC store to use multiple JDBC connections to concurrently process I/Ooperations. See Enabling I/O Multithreading for JDBC Stores in Administering theWebLogic Persistent Store.
• When using Oracle BLOBS, you may be able to improve performance by tuning the ThreeStepThreshold value. See Enabling Oracle BLOB Record Columns inAdministering the WebLogic Persistent Store.
• The location of the JDBC store DDL that is used to initialize empty stores is nowconfigurable. This simplifies the use of custom DDL for database table creation,which is sometimes used for database specific performance tuning. Forinformation, see Create JDBC stores in Oracle WebLogic Server Administration ConsoleOnline Help and Using the WebLogic Persistent Store in Administering the WebLogicPersistent Store.
7.4 Tuning File StoresThe following section provides information on tuning File Stores:
• Basic Tuning Information
• Tuning a File Store Direct-Write-With-Cache Policy
• Tuning the File Store Direct-Write Policy
• Tuning the File Store Block Size
7.4.1 Basic Tuning InformationThe following section provides general information on tuning File Stores:
Best Practices When Using Persistent Stores
7-4 Tuning Performance of Oracle WebLogic Server

• For basic (non-RAID) disk hardware, consider dedicating one disk per file store. Astore can operate up to four to five times faster if it does not have to compete withany other store on the disk. Remember to consider the existence of the default filestore in addition to each configured store and a JMS paging store for each JMSserver.
• For custom and default file stores, tune the Synchronous Write Policy.
– There are three transactionally safe synchronous write policies: Direct-Write-With-Cache, Direct-Write, and Cache-Flush. Direct-Write-With-Cache is generally has the best performance of these policies, Cache-Flush generally has the lowest performance, and Direct-Write is thedefault. Unlike other policies, Direct-Write-With-Cache creates cache filesin addition to primary files.
– The Disabled synchronous write policy is transactionally unsafe. TheDisabled write-policy can dramatically improve performance, especially atlow client loads. However, it is unsafe because writes become asynchronousand data can be lost in the event of Operating System or power failure.
– See Guidelines for Configuring a Synchronous Write Policy in Administering theWebLogic Persistent Store.
Note:
Certain older versions of Microsoft Windows may incorrectly report storagedevice synchronous write completion if the Windows default Write CacheEnabled setting is used. This violates the transactional semantics oftransactional products (not specific to Oracle), including file stores configuredwith a Direct-Write (default) or Direct-Write-With-Cache policy, as asystem crash or power failure can lead to a loss or a duplication of records/messages. One of the visible symptoms is that this problem may manifest itselfin high persistent message/transaction throughput exceeding the physicalcapabilities of your storage device. You can address the problem by applyinga Microsoft supplied patch, disabling the Windows Write Cache Enabledsetting, or by using a power-protected storage device. See http://support.microsoft.com/kb/281672 and http://support.microsoft.com/kb/332023.
• When performing head-to-head vendor comparisons, make sure all the writepolicies for the persistent store are equivalent. Some non-WebLogic vendorsdefault to the equivalent of Disabled.
• Depending on the synchronous write policy, custom and default stores have avariety of additional tunable attributes that may improve performance. Theseinclude CacheDirectory, MaxWindowBufferSize, IOBufferSize,BlockSize, InitialSize, and MaxFileSize. For more information see the JMSFileStoreMBean in the MBean Reference for Oracle WebLogic Server.
Note:
.The JMSFileStoreMBean is deprecated, but the individual bean attributesapply to the non-deprecated beans for custom and default file stores.
Tuning File Stores
Tuning the WebLogic Persistent Store 7-5

• If disk performance continues to be a bottleneck, consider purchasing disk or RAIDcontroller hardware that has a built-in write-back cache. These caches significantlyimprove performance by temporarily storing persistent data in volatile memory. Toensure transactionally safe write-back caches, they must be protected againstpower outages, host machine failure, and operating system failure. Typically, suchprotection is provided by a battery-backed write-back cache.
7.4.2 Tuning a File Store Direct-Write-With-Cache PolicyThe Direct-Write-With-Cache synchronous write policy is commonly the highestperformance option that still provides transactionally safe disk writes. It is typicallynot as high-performing as the Disabled synchronous write policy, but the Disabledpolicy is not a safe option for production systems unless you have some means toprevent loss of buffered writes during a system failure.
Direct-Write-With-Cache file stores write synchronously to a primary set of filesin the location defined by the Directory attribute of the file store configuration.They also asynchronously write to a corresponding temporary cache file in thelocation defined by the CacheDirectory attribute of the file store configuration. Thecache directory and the primary file serve different purposes and require differentlocations. In many cases, primary files should be stored in remote storage for highavailability, whereas cache files are strictly for performance and not for highavailability and can be stored locally.
When the Direct-Write-With-Cache synchronous write policy is selected, thereare several additional tuning options that you should consider:
• Setting the CacheDirectory. For performance reasons, the cache directoryshould be located on a local file system. It is placed in the operating system tempdirectory by default.
• Increasing the MaxWindowBufferSize and IOBufferSize attributes. Thesetune native memory usage of the file store.
• Increasing the InitialSize and MaxFileSize tuning attributes. These tune theinitial size of a store, and the maximum file size of a particular file in the storerespectively.
• Tune the BlockSize attribute. See Tuning the File Store Block Size.
For more information on individual tuning parameters, see the JMSFileStoreMBean inthe MBean Reference for Oracle WebLogic Server.
7.4.2.1 Using Flash Storage to Increase Performance
You can gain additional I/O performance by using enterprise-class flash drives, whichcan be significantly faster than spinning disks for accessing data in real-timeapplications and allows you to free up memory for other processing tasks.
Simply update the CacheDirectory attribute with the path to your flash storagedevice and ensure that the device contains sufficient free storage to accommodate afull copy of the store's primary files. See the CacheDirectory attribute in the MBeanReference for Oracle WebLogic Server.
7.4.2.2 Additional Considerations
Consider the following when tuning the Direct-Write-With-Cache policy:
Tuning File Stores
7-6 Tuning Performance of Oracle WebLogic Server
• There may be additional security and file locking considerations when using theDirect-Write-With-Cache synchronous write policy. See Securing a ProductionEnvironment for Oracle WebLogic Server and the CacheDirectory andLockingEnabled attributes of the JMSFileStoreMBean in the MBean Reference forOracle WebLogic Server.
– The JMSFileStoreMBean is deprecated, but the individual bean attributesapply to the non-deprecated beans for custom and default file stores.
• It is safe to delete a cache directory while the store is not running, but this mayslow down the next store boot. Cache files are re-used to speed up the file storeboot and recovery process, but only if the store's host WebLogic server has beenshut down cleanly prior to the current boot (not after kill -9, nor after anOS/JVM crash) and there was no off-line change to the primary files (such as astore admin compaction). If the existing cache files cannot be safely used at boottime, they are automatically discarded and new files are created. In addition, aWarning log 280102 is generated. After a migration or failover event, this sameWarning message is generated, but can be ignored.
• If the a Direct-Write-With-Cache file store fails to load a wlfileio nativedriver, the synchronous write policy automatically changes to the equivalent ofDirect-Write with AvoidDirectIO=true. To view a running custom ordefault file store's configured and actual synchronous write policy and driver,examine the server log for WL-280008 and WL-280009 messages.
• To prevent unused cache files from consuming disk space, test and developmentenvironments may need to be modified to periodically delete cache files that areleft over from temporarily created domains. In production environments, cachefiles are managed automatically by the file store.
7.4.3 Tuning the File Store Direct-Write Policy
Note:
The AvoidDirectIO properties described in this section are still supportedin this release, but have been deprecated as of 11gR1PS2. Use the configurableDirect-Write-With-Cache synchronous write policy as an alternative tothe Direct-Write policy.
For file stores with the synchronous write policy of Direct-Write, you may bedirected by Oracle Support or a release note to set weblogic.Server options on thecommand line or start script of the JVM that runs the store:
• Globally changes all stores running in the JVM:
-Dweblogic.store.AvoidDirectIO=true
• For a single store, where store-name is the name of the store:
-Dweblogic.store.store-name.AvoidDirectIO=true
• For the default store, where server-name is the name of the server hosting thestore:
-Dweblogic.store._WLS_server-name.AvoidDirectIO=true
Tuning File Stores
Tuning the WebLogic Persistent Store 7-7
Setting AvoidDirectIO on an individual store overrides the setting of the global -Dweblogic.store.AvoidDirectIO option. For example: If you have two stores, Aand B, and set the following options:
-Dweblogic.store.AvoidDirectIO=true-Dweblogic.store.A.AvoidDirectIO=false
then only store B has the setting AvoidDirectIO=true.
Note:
Setting the AvoidDirectIO option may have performance implicationswhich often can be mitigated using the block size setting described in Tuningthe File Store Block Size.
7.4.4 Tuning the File Store Block SizeYou may want to tune the file store block size for file stores that are configured with asynchronous write policy of Direct-Write (default), Direct-Write-With-Cache, or Cache-Flush, especially when using Direct-Write withAvoidDirectIO=true as described in Tuning the File Store Direct-Write Policy orfor systems with a hard-drive-based write-back cache where you see that performanceis limited by physical storage latency.
Consider the following example:
• A single WebLogic JMS producer sends persistent messages one by one.
• The network overhead is known to be negligible.
• The file store's disk drive has a 10,000 RPM rotational rate.
• The disk drive has a battery-backed write-back cache.
and the messaging rate is measured at 166 messages per second.
In this example, the low messaging rate matches the disk drive's latency (10,000RPM / 60 seconds = 166 RPS) even though a much higher rate is expected due to thebattery-backed write-back cache. Tuning the store's block size to match the filesystems' block size could result in a significant improvement.
In some other cases, tuning the block size may result in marginal or no improvement:
• The caches are observed to yield low latency (so the I/O subsystem is not asignificant bottleneck).
• Write-back caching is not used and performance is limited by larger disk drivelatencies.
There may be a trade off between performance and file space when using higher blocksizes. Multiple application records are packed into a single block only when they arewritten concurrently. Consequently, a large block size may cause a significant increasein store file sizes for applications that have little concurrent server activity andproduce small records. In this case, one small record is stored per block and theremaining space in each block is unused. As an example, consider a Web ServiceReliable Messaging (WS-RM) application with a single producer that sends small 100byte length messages, where the application is the only active user of the store.
Tuning File Stores
7-8 Tuning Performance of Oracle WebLogic Server

Oracle recommends tuning the store block size to match the block size of the filesystem that hosts the file store (typically 4096 for most file systems) when this yields aperformance improvement. Alternately, tuning the block size to other values (such aspaging and cache units) may yield performance gains. If tuning the block size does notyield a performance improvement, Oracle recommends leaving the block size at thedefault as this helps to minimize use of file system resources.
7.4.4.1 Setting the Block Size for a File Store
Note:
The BlockSize command line properties that are described in this sectionare still supported in 11gR1PS2, but are deprecated. Oracle recommends usingthe BlockSize configurable on custom and default file stores instead.
To set the block size of a store, use one of the following properties on the commandline or start script of the JVM that runs the store:
• Globally sets the block size of all file stores that don't have pre-existing files.
-Dweblogic.store.BlockSize=block-size
• Sets the block size for a specific file store that doesn't have pre-existing files.
-Dweblogic.store.store-name.BlockSize=block-size
• Sets the block size for the default file store, if the store doesn't have pre-existingfiles:
-Dweblogic.store._WLS_server-name. BlockSize=block-size
The value used to set the block size is an integer between 512 and 8192 which isautomatically rounded down to the nearest power of 2.
Setting BlockSize on an individual store overrides the setting of the global -Dweblogic.store.BlockSize option. For example: If you have two stores, A andB, and set the following options:
-Dweblogic.store.BlockSize=8192-Dweblogic.store.A.BlockSize=512
then store B has a block size of 8192 and store A has a block size of 512.
Note:
Setting the block size using command line properties only takes effect for filestores that have no pre-existing files. If a store has pre-existing files, the storecontinues to use the block size that was set when the store was first created.
7.4.4.2 Determining the File Store Block Size
You can verify a file store's current block size and synchronous write policy byviewing the server log of the server that hosts the store. Search for a "280009" storeopened message.
Tuning File Stores
Tuning the WebLogic Persistent Store 7-9
7.4.4.3 Determining the File System Block Size
To determine your file system's actual block size, consult your operating systemdocumentation. For example:
• Linux ext2 and ext3 file systems: run /sbin/dumpe2fs /dev/device-name andlook for "Block size"
• Windows NTFS: run fsutil fsinfo ntfsinfo device letter: and lookfor "Bytes Per Cluster"
7.4.4.4 Converting a Store with Pre-existing Files
If the data in a store's pre-existing files do not need to be preserved, then simplyshutdown the host WebLogic Server instance and delete the files to allow the blocksize to change when the store is restarted. If you need to preserve the data, convert astore with pre-existing files to a different block size by creating a version of the filestore with the new block size using the compact command of the command line storeadministration utility:
1. java -Dweblogic.store.BlockSize=block-sizeweblogic.store.Admin
2. Type help for available commands.
3. Storeadmin->compact -dir file-store-directory
See Store Administration Using a Java Command-line in Administering the WebLogicPersistent Store.
7.5 Using a Network File SystemThe following sections provide information on using a WebLogic Persistent Store witha Network File System (NFS):
• Configuring Synchronous Write Policies
• Test Server Restart Behavior
• Handling NFS Locking Errors
7.5.1 Configuring Synchronous Write PoliciesNFS storage may not fully protect transactional data, as it may be configured tosilently buffer synchronous write requests in volatile memory. If a file store Directoryis located on an NFS mount, and the file store's Synchronous Write Policy is anythingother than Disabled, check your NFS implementation and configuration to make surethat it is configured to support synchronous writes. A Disabled synchronous writepolicy does not perform synchronous writes, but, as a consequence, is generally nottransactionally safe. You may detect undesirable buffering of synchronous writerequests by observing high persistent message or transaction throughput that exceedsthe physical capabilities of your storage device. On the NFS server, check thesynchronous write setting of the exported NFS directory hosting your File Store. ASAN based file store, or a JDBC store, may provide an easier solution for safecentralized storage.
Using a Network File System
7-10 Tuning Performance of Oracle WebLogic Server
7.5.2 Test Server Restart BehaviorOracle strongly recommends verifying the behavior of a server restart after abruptmachine failures when the JMS messages and transaction logs are stored on an NFSmounted directory. Depending on the NFS implementation, different issues can ariseafter a failover or restart. The behavior can be verified by abruptly shutting down thenode hosting the Web Logic servers while these are running. If the server is configuredfor server migration, it should be started automatically in the failover node after thecorresponding failover period. If not, a manual restart of the WebLogic Server on thesame host (after the node has completely rebooted) can be performed.
7.5.3 Handling NFS Locking Errors
Note:
You can configure a NFS v4 based Network Attached Storage (NAS) server torelease locks within the approximate time required to complete servermigration. If you tune and test your NFS v4 environment, you do not need tofollow the procedures in this section. See your storage vendor'sdocumentation for information on locking files stored in NFS-mounteddirectories on the storage device.
If Oracle WebLogic Server does not restart after abrupt machine failure when JMSmessages and transaction logs are stored on NFS mounted directory, the followingerrors may appear in the server log files:
Example 7-1 Store Restart Failure Error Message
MMM dd, yyyy hh:mm:ss a z> <Error> <Store> <BEA-280061> <The persistent store "_WLS_server_soa1" could not be deployed: weblogic.store.PersistentStoreException: java.io.IOException:[Store:280021]There was an error while opening the file store file "_WLS_SERVER_SOA1000000.DAT"at weblogic.store.io.file.Heap.open(Heap.java:168)at weblogic.store.io.file.FileStoreIO.open(FileStoreIO.java:88)...java.io.IOException: Error from fcntl() for file locking, Resource temporarily unavailable, errno=11
This error is due to the NFS system not releasing the lock on the stores. WebLogicServer maintains locks on files used for storing JMS data and transaction logs toprotect from potential data corruption if two instances of the same WebLogic Serverare accidentally started. The NFS storage device does not become aware of machinefailure in a timely manner and the locks are not released by the storage device. As aresult, after abrupt machine failure, followed by a restart, any subsequent attempt byWebLogic Server to acquire locks on the previously locked files may fail. Refer to yourstorage vendor documentation for additional information on the locking of files storedin NFS mounted directories on the storage device. If it is not reasonably possible totune locking behavior in your NFS environment, use one of the following twosolutions to unlock the logs and data files.
Use one of the following two solutions to unlock the logs and data files:
• Solution 1 - Copying Data Files to Remove NFS Locks
Using a Network File System
Tuning the WebLogic Persistent Store 7-11

• Solution 2 - Disabling File Locks in WebLogic Server File Stores
7.5.3.1 Solution 1 - Copying Data Files to Remove NFS Locks
Manually unlock the logs and JMS data files and start the servers by creating a copy ofthe locked persistence store file and using the copy for subsequent operations. Tocreate a copy of the locked persistence store file, rename the file, and then copy it backto its original name. The following sample steps assume that transaction logs arestored in the /shared/tlogs directory and JMS data is stored in the /shared/jmsdirectory.
Example 7-2 Sample Steps to Remove NFS Locks
cd /shared/tlogsmv _WLS_SOA_SERVER1000000.DAT _WLS_SOA_SERVER1000000.DAT.oldcp _WLS_SOA_SERVER1000000.DAT.old _WLS_SOA_SERVER1000000.DATcd /shared/jmsmv SOAJMSFILESTORE_AUTO_1000000.DAT SOAJMSFILESTORE_AUTO_1000000.DAT.oldcp SOAJMSFILESTORE_AUTO_1000000.DAT.old SOAJMSFILESTORE_AUTO_1000000.DATmv UMSJMSFILESTORE_AUTO_1000000.DAT UMSJMSFILESTORE_AUTO_1000000.DAT.oldcp UMSJMSFILESTORE_AUTO_1000000.DAT.old UMSJMSFILESTORE_AUTO_1000000.DAT
With this solution, the WebLogic file locking mechanism continues to provideprotection from any accidental data corruption if multiple instances of the sameservers were accidently started. However, the servers must be restarted manually afterabrupt machine failures. File stores will create multiple consecutively numbered.DATfiles when they are used to store large amounts of data. All files may need to be copiedand renamed when this occurs.
7.5.3.2 Solution 2 - Disabling File Locks in WebLogic Server File Stores
Note:
With this solution, since the WebLogic Server locking is disabled, automatedserver restarts and failovers should succeed. Be very cautious, however, whenusing this option. The WebLogic file locking feature is designed to helpprevent severe file corruptions that can occur in undesired concurrencyscenarios. If the server using the file store is configured for server migration,always configure the database based leasing option. This enforces additionallocking mechanisms using database tables, and prevents automated restart ofmore than one instance of the same WebLogic Server. Additional proceduralprecautions must be implemented to avoid any human error and to ensurethat one and only one instance of a server is manually started at any give pointin time. Similarly, extra precautions must be taken to ensure that no twodomains have a store with the same name that references the same directory.
You can also use the WebLogic Server Administration Console to disable WebLogicfile locking mechanisms for the default file store, a custom file store, a JMS paging filestore, and a Diagnostics file store, as described in the following sections:
• Disabling File Locking for the Default File Store
• Disabling File Locking for a Custom File Store
• Disabling File Locking for a JMS Paging File Store
• Disabling File Locking for a Diagnostics File Store
Using a Network File System
7-12 Tuning Performance of Oracle WebLogic Server

7.5.3.2.1 Disabling File Locking for the Default File Store
Follow these steps to disable file locking for the default file store using the WebLogicServer Administration Console:
1. If necessary, click Lock & Edit in the Change Center (upper left corner) of theWebLogic Server Administration Console to get an Edit lock for the domain.
2. In the Domain Structure tree, expand the Environment node and select Servers.
3. In the Summary of Servers list, select the server you want to modify.
4. Select the Configuration > Services tab.
5. Scroll down to the Default Store section and click Advanced.
6. Scroll down and deselect the Enable File Locking check box.
7. Click Save to save the changes. If necessary, click Activate Changes in the ChangeCenter.
8. Restart the server you modified for the changes to take effect.
The resulting config.xml entry looks like:
Example 7-3 Example config.xml Entry for Disabling File Locking for a Default FileStore
<server><name>examplesServer</name>...<default-file-store><synchronous-write-policy>Direct-Write</synchronous-write-policy><io-buffer-size>-1</io-buffer-size><max-file-size>1342177280</max-file-size><block-size>-1</block-size><initial-size>0</initial-size><file-locking-enabled>false</file-locking-enabled></default-file-store></server>
7.5.3.2.2 Disabling File Locking for a Custom File Store
Use the following steps to disable file locking for a custom file store using theWebLogic Server Administration Console:
1. If necessary, click Lock & Edit in the Change Center (upper left corner) of theWebLogic Server Administration Console to get an Edit lock for the domain.
2. In the Domain Structure tree, expand the Services node and select PersistentStores.
3. In the Summary of Persistent Stores list, select the custom file store you want tomodify.
4. On the Configuration tab for the custom file store, click Advanced to displayadvanced store settings.
5. Scroll down to the bottom of the page and deselect the Enable File Locking checkbox.
Using a Network File System
Tuning the WebLogic Persistent Store 7-13

6. Click Save to save the changes. If necessary, click Activate Changes in the ChangeCenter.
7. If the custom file store was in use, you must restart the server for the changes totake effect.
The resulting config.xml entry looks like:
Example 7-4 Example config.xml Entry for Disabling File Locking for a Custom FileStore
<file-store><name>CustomFileStore-0</name><directory>C:\custom-file-store</directory><synchronous-write-policy>Direct-Write</synchronous-write-policy><io-buffer-size>-1</io-buffer-size><max-file-size>1342177280</max-file-size><block-size>-1</block-size><initial-size>0</initial-size><file-locking-enabled>false</file-locking-enabled><target>examplesServer</target></file-store>
7.5.3.2.3 Disabling File Locking for a JMS Paging File Store
Use the following steps to disable file locking for a JMS paging file store using theWebLogic Server Administration Console:
1. If necessary, click Lock & Edit in the Change Center (upper left corner) of theWebLogic Server Administration Console to get an Edit lock for the domain.
2. In the Domain Structure tree, expand the Services node, expand the Messagingnode, and select JMS Servers.
3. In the Summary of JMS Servers list, select the JMS server you want to modify.
4. On the Configuration > General tab for the JMS Server, scroll down and deselectthe Paging File Locking Enabled check box.
5. Click Save to save the changes. If necessary, click Activate Changes in the ChangeCenter.
6. Restart the server you modified for the changes to take effect.
The resulting config.xml entry looks like:
Example 7-5 Example config.xml Entry for Disabling File Locking for a JMS PagingFile Store
<jms-server><name>examplesJMSServer</name><target>examplesServer</target><persistent-store>exampleJDBCStore</persistent-store>...<paging-file-locking-enabled>false</paging-file-locking-enabled>...</jms-server>
7.5.3.2.4 Disabling File Locking for a Diagnostics File Store
Use the following steps to disable file locking for a Diagnostics file store using theWebLogic Server Administration Console:
Using a Network File System
7-14 Tuning Performance of Oracle WebLogic Server

1. If necessary, click Lock & Edit in the Change Center (upper left corner) of theWebLogic Server Administration Console to get an Edit lock for the domain.
2. In the Domain Structure tree, expand the Diagnostics node and select Archives.
3. In the Summary of Diagnostic Archives list, select the server name of the archivethat you want to modify.
4. On the Settings for [server_name] page, deselect the Diagnostic Store FileLocking Enabled check box.
5. Click Save to save the changes. If necessary, click Activate Changes in the ChangeCenter.
6. Restart the server you modified for the changes to take effect.
The resulting config.xml entry looks like:
Example 7-6 Example config.xml Entry for Disabling File Locking for a DiagnosticsFile Store
<server><name>examplesServer</name>...<server-diagnostic-config><diagnostic-store-dir>data/store/diagnostics</diagnostic-store-dir><diagnostic-store-file-locking-enabled>false</diagnostic-store-file-lockingenabled><diagnostic-data-archive-type>FileStoreArchive</diagnostic-data-archive-type><data-retirement-enabled>true</data-retirement-enabled><preferred-store-size-limit>100</preferred-store-size-limit><store-size-check-period>1</store-size-check-period></server-diagnostic-config></server>
Using a Network File System
Tuning the WebLogic Persistent Store 7-15

Using a Network File System
7-16 Tuning Performance of Oracle WebLogic Server
8Database Tuning
Prevent your database from becoming a major enterprise-level bottleneck byconfiguring it for optimal performance, by following the tuning guidelines in thischapter and in the product documentation for the database you are using.
This chapter includes the following sections:
• General Suggestions
• Database-Specific Tuning
8.1 General SuggestionsThis section provides general database tuning suggestions:
• Good database design — Distribute the database workload across multiple disks toavoid or reduce disk overloading. Good design also includes proper sizing andorganization of tables, indexes, and logs.
• Disk I/O optimization — Disk I/O optimization is related directly to throughputand scalability. Access to even the fastest disk is orders of magnitude slower thanmemory access. Whenever possible, optimize the number of disk accesses. Ingeneral, selecting a larger block/buffer size for I/O reduces the number of diskaccesses and might substantially increase throughput in a heavily loadedproduction environment.
• Checkpointing — This mechanism periodically flushes all dirty cache data to disk,which increases the I/O activity and system resource usage for the duration of thecheckpoint. Although frequent checkpointing can increase the consistency of on-disk data, it can also slow database performance. Most database systems havecheckpointing capability, but not all database systems provide user-level controls.Oracle, for example, allows administrators to set the frequency of checkpointswhile users have no control over SQLServer 7.x checkpoints. For recommendedsettings, see the product documentation for the database you are using.
• Disk and database overhead can sometimes be dramatically reduced by batchingmultiple operations together and/or increasing the number of operations that runin parallel (increasing concurrency). Examples:
– Increasing the value of the Message bridge BatchSize or the Store-and-Forward WindowSize can improve performance as larger batch sizes producefewer but larger I/Os.
– Programmatically leveraging JDBC's batch APIs.
– Use the MDB transaction batching feature. See Tuning Message-Driven Beans.
Database Tuning 8-1

– Increasing concurrency by increasing max-beans-in-free-pool and threadpool size for MDBs (or decreasing it if batching can be leveraged).
8.2 Database-Specific TuningThe following sections provide basic tuning suggestions for Oracle, SQL Server, andSybase:
• Oracle
• Microsoft SQL Server
• Sybase
Note:
Always check the tuning guidelines in your database-specific vendordocumentation.
8.2.1 OracleThis section describes performance tuning for Oracle.
• Number of processes — On most operating systems, each connection to the Oracleserver spawns a shadow process to service the connection. Thus, the maximumnumber of processes allowed for the Oracle server must account for the number ofsimultaneous users, as well as the number of background processes used by theOracle server. The default number is usually not big enough for a system thatneeds to support a large number of concurrent operations. For platform-specificissues, see your Oracle administrator's guide. The current setting of this parametercan be obtained with the following query:
SELECT name, value FROM v$parameter WHERE name = 'processes';
• Buffer pool size —The buffer pool usually is the largest part of the Oracle serversystem global area (SGA). This is the location where the Oracle server caches datathat it has read from disk. For read-mostly applications, the single most importantstatistic that affects data base performance is the buffer cache hit ratio. The bufferpool should be large enough to provide upwards of a 95% cache hit ratio. Set thebuffer pool size by changing the value, in data base blocks, of the db_cache_sizeparameter in the init.ora file.
• Shared pool size — The share pool in an important part of the Oracle server systemglobal area (SGA). The SGA is a group of shared memory structures that containdata and control information for one Oracle database instance. If multiple users areconcurrently connected to the same instance, the data in the instance's SGA isshared among the users. The shared pool portion of the SGA caches data for twomajor areas: the library cache and the dictionary cache. The library cache storesSQL-related information and control structures (for example, parsed SQLstatement, locks). The dictionary cache stores operational metadata for SQLprocessing.
For most applications, the shared pool size is critical to Oracle performance. If theshared pool is too small, the server must dedicate resources to managing thelimited amount of available space. This consumes CPU resources and causescontention because Oracle imposes restrictions on the parallel management of the
Database-Specific Tuning
8-2 Tuning Performance of Oracle WebLogic Server
various caches. The more you use triggers and stored procedures, the larger theshared pool must be. The SHARED_POOL_SIZE initialization parameter specifiesthe size of the shared pool in bytes.
The following query monitors the amount of free memory in the share pool:
SELECT * FROM v$sgastatWHERE name = 'free memory' AND pool = 'shared pool';
• Maximum opened cursor — To prevent any single connection taking all theresources in the Oracle server, the OPEN_CURSORS initialization parameter allowsadministrators to limit the maximum number of opened cursors for eachconnection. Unfortunately, the default value for this parameter is too small forsystems such as WebLogic Server. Cursor information can be monitored using thefollowing query:
SELECT name, value FROM v$sysstatWHERE name LIKE 'opened cursor%';
• Database block size — A block is Oracle's basic unit for storing data and thesmallest unit of I/O. One data block corresponds to a specific number of bytes ofphysical database space on disk. This concept of a block is specific to OracleRDBMS and should not be confused with the block size of the underlyingoperating system. Since the block size affects physical storage, this value can be setonly during the creation of the database; it cannot be changed once the databasehas been created. The current setting of this parameter can be obtained with thefollowing query:
SELECT name, value FROM v$parameter WHERE name = 'db_block_size';
• Sort area size — Increasing the sort area increases the performance of large sortsbecause it allows the sort to be performed in memory during query processing.This can be important, as there is only one sort area for each connection at anypoint in time. The default value of this init.ora parameter is usually the size of6–8 data blocks. This value is usually sufficient for OLTP operations but should beincreased for decision support operation, large bulk operations, or large index-related operations (for example, recreating an index). When performing these typesof operations, you should tune the following init.ora parameters (which arecurrently set for 8K data blocks):
sort_area_size = 65536sort_area_retained_size = 65536
8.2.2 Microsoft SQL ServerThe following guidelines pertain to performance tuning parameters for Microsoft SQLServer databases. For more information about these parameters, see your MicrosoftSQL Server documentation.
• Store tempdb on a fast I/O device.
• Increase the recovery interval if perfmon shows an increase in I/O.
• Use an I/O block size larger than 2 KB.
8.2.3 SybaseThe following guidelines pertain to performance tuning parameters for Sybasedatabases. For more information about these parameters, see your Sybasedocumentation.
Database-Specific Tuning
Database Tuning 8-3

• Lower recovery interval setting results in more frequent checkpoint operations,resulting in more I/O operations.
• Use an I/O block size larger than 2 KB.
• Sybase controls the number of engines in a symmetric multiprocessor (SMP)environment. They recommend configuring this setting to equal the number ofCPUs minus 1.
Database-Specific Tuning
8-4 Tuning Performance of Oracle WebLogic Server

9Tuning WebLogic Server EJBs
Tune the WebLogic Server EJBs for your application environment by following theprocedures described in this chapter.
This chapter includes the following sections:
• General EJB Tuning Tips
• Tuning EJB Caches
• Tuning EJB Pools
• CMP Entity Bean Tuning
• Tuning In Response to Monitoring Statistics
9.1 General EJB Tuning Tips• Deployment descriptors are schema-based. Descriptors that are new in this release
of WebLogic Server are not available as DTD-based descriptors.
• Avoid using the RequiresNew transaction parameter. Using RequiresNewcauses the EJB container to start a new transaction after suspending any currenttransactions. This means additional resources, including a separate databaseconnection is allocated.
• Use local-interfaces or set call-by-reference to true to avoid the overhead ofserialization when one EJB calls another or an EJB is called by a servlet/JSP in thesame application. Note the following:
– In releases prior to WebLogic Server 8.1, call-by-reference is turned on bydefault. For releases of WebLogic Server 8.1 and later, call-by-reference isturned off by default. Older applications migrating to WebLogic Server 8.1 andlater that do not explicitly turn on call-by-reference may experience a drop inperformance.
– This optimization does not apply to calls across different applications.
The calls across different applications can be between:
⁎ applications on different JVMs
⁎ applications on the same JVM
For example, when you have a JVM thatcontains EJBApp1.ear and EJBApp2.ear on the same server, and youdeploy one EJB on EJBApp1.ear and another EJB on EJBApp2.ear , thecalls between the applications on EJBApp1.ear and EJBApp2.ear are
Tuning WebLogic Server EJBs 9-1

considered as calls across different applications even though they are on thesame JVM.
• Use stateless session beans over stateful session beans whenever possible. Statelesssession beans scale better than stateful session beans because there is no stateinformation to be maintained.
• WebLogic Server provides additional transaction performance benefits for EJBsthat reside in a WebLogic Server cluster. When a single transaction uses multipleEJBs, WebLogic Server attempts to use EJB instances from a single WebLogicServer instance, rather than using EJBs from different servers. This approachminimizes network traffic for the transaction. In some cases, a transaction can useEJBs that reside on multiple WebLogic Server instances in a cluster. This can occurin heterogeneous clusters, where all EJBs have not been deployed to all WebLogicServer instances. In these cases, WebLogic Server uses a multitier connection toaccess the datastore, rather than multiple direct connections. This approach usesfewer resources, and yields better performance for the transaction. However, forbest performance, the cluster should be homogeneous — all EJBs should reside onall available WebLogic Server instances.
9.2 Tuning EJB CachesThe following sections provide information on how to tune EJB caches:
• Tuning the Stateful Session Bean Cache
• Tuning the Entity Bean Cache
• Tuning the Query Cache
9.2.1 Tuning the Stateful Session Bean CacheThe EJB Container caches stateful session beans in memory up to a count specified bythe max-beans-in-cache parameter specified in weblogic-ejb-jar.xml. Thisparameter should be set equal to the number of concurrent users. This ensuresminimum passivation of stateful session beans to disk and subsequent activation fromdisk which yields better performance.
9.2.2 Tuning the Entity Bean CacheEntity beans are cached at two levels by the EJB container:
• Transaction-Level Caching
• Caching between Transactions
• Ready Bean Caching
9.2.2.1 Transaction-Level Caching
Once an entity bean has been loaded from the database, it is always retrieved from thecache whenever it is requested when using the findByPrimaryKey or invoked froma cached reference in that transaction. Getting an entity bean using a non-primary keyfinder always retrieves the persistent state of the bean from the data base.
Tuning EJB Caches
9-2 Tuning Performance of Oracle WebLogic Server
9.2.2.2 Caching between Transactions
Entity bean instances are also cached between transactions. However, by default, thepersistent state of the entity beans are not cached between transactions. To enablecaching between transactions, set the value of the cache-between-transactionsparameter to true.
Is it safe to cache the state? This depends on the concurrency-strategy for that bean.The entity-bean cache is really only useful when cache-between-transactionscan be safely set to true. In cases where ejbActivate() and ejbPassivate()callbacks are expensive, it is still a good idea to ensure the entity-cache size is largeenough. Even though the persistent state may be reloaded at least once pertransaction, the beans in the cache are already activated. The value of the cache-size isset by the deployment descriptor parameter max-beans-in-cache and should beset to maximize cache-hits. In most situations, the value need not be larger than theproduct of the number of rows in the table associated with the entity bean and thenumber of threads expected to access the bean concurrently.
9.2.2.3 Ready Bean Caching
For entity beans with a high cache miss ratio, maintaining ready bean instances canadversely affect performance.
If you can set disable-ready-instances in the entity-cache element of anentity-descriptor, the container does not maintain the ready instances in cache.If the feature is enabled in the deployment descriptor, the cache only keeps the activeinstances. Once the involved transaction is committed or rolled back, the bean instanceis moved from active cache to the pool immediately.
9.2.3 Tuning the Query CacheQuery Caching is a new feature in WebLogic Server 9.0 that allows read-only CMPentity beans to cache the results of arbitrary finders. Query caching is supported for allfinders except prepared-query finders. The query cache can be an application-levelcache as well as a bean-level cache. The size of the cache is limited by the weblogic-ejb-jar.xml parameter max-queries-in-cache. The finder-level flag in theweblogic-cmp-rdbms descriptor file, enable-query-caching is used to specifywhether the results of that finder are to be cached. A flag with the same name has thesame purpose for internal relationship finders when applied to the weblogic-relationship-role element. Queries are evicted from the query-cache under thefollowing circumstances:
• The query is least recently used and the query-cache has hit its size limit.
• At least one of the EJBs that satisfy the query has been evicted from the entity beancache, regardless of the reason.
• The query corresponds to a finder that has eager-relationship-cachingenabled and the query for the associated internal relationship finder has beenevicted from the related bean's query cache.
It is possible to let the size of the entity-bean cache limit the size of the query-cache bysetting the max-queries-in-cache parameter to 0, since queries are evicted fromthe cache when the corresponding EJB is evicted. This may avoid some lock contentionin the query cache, but the performance gain may not be significant.
Tuning EJB Caches
Tuning WebLogic Server EJBs 9-3
9.3 Tuning EJB PoolsThe following section provides information on how to tune EJB pools:
• Tuning the Stateless Session Bean Pool
• Tuning the MDB Pool
• Tuning the Entity Bean Pool
9.3.1 Tuning the Stateless Session Bean PoolThe EJB container maintains a pool of stateless session beans to avoid creating anddestroying instances. Though generally useful, this pooling is even more important forperformance when the ejbCreate() and the setSessionContext() methods areexpensive. The pool has a lower as well as an upper bound. The upper bound is themore important of the two.
• The upper bound is specified by the max-beans-in-free-pool parameter. Itshould be set equal to the number of threads expected to invoke the EJBconcurrently. Using too small of a value impacts concurrency.
• The lower bound is specified by the initial-beans-in-free-pool parameter.Increasing the value of initial-beans-in-free-pool increases the time ittakes to deploy the application containing the EJB and contributes to startup timefor the server. The advantage is the cost of creating EJB instances is not incurred atrun time. Setting this value too high wastes memory.
9.3.2 Tuning the MDB PoolThe life cycle of MDBs is very similar to stateless session beans. The MDB pool has thesame tuning parameters as stateless session beans and the same factors apply whentuning them. In general, most users will find that the default values are adequate formost applications. See Tuning Message-Driven Beans.
9.3.3 Tuning the Entity Bean PoolThe entity bean pool serves two purposes:
• A target objects for invocation of finders via reflection.
• A pool of bean instances the container can recruit if it cannot find an instance for aparticular primary key in the cache.
The entity pool contains anonymous instances (instances that do not have a primarykey). These beans are not yet active (meaning ejbActivate() has not been invokedon them yet), though the EJB context has been set. Entity bean instances evicted fromthe entity cache are passivated and put into the pool. The tunables are the initial-beans-in-free-pool and max-beans-in-free-pool. Unlike stateless sessionbeans and MDBs, the max-beans-in-free-pool has no relation with the threadcount. You should increase the value of max-beans-in-free-pool if the entitybean constructor or setEnityContext() methods are expensive.
Tuning EJB Pools
9-4 Tuning Performance of Oracle WebLogic Server
9.4 CMP Entity Bean TuningThe largest performance gains in entity beans are achieved by using caching tominimize the number of interactions with the data base. However, in most situations,it is not realistic to be able to cache entity beans beyond the scope of a transaction. Thefollowing sections provide information on WebLogic Server EJB container features,most of which are configurable, that you can use to minimize database interactionsafely:
• Use Eager Relationship Caching
• Use JDBC Batch Operations
• Tuned Updates
• Using Field Groups
• include-updates
• call-by-reference
• Bean-level Pessimistic Locking
• Concurrency Strategy
9.4.1 Use Eager Relationship CachingUsing eager relationship caching allows the EJB container to load related entity beansusing a single SQL join. Use only when the same transaction accesses related beans.See Relationship Caching in Developing Enterprise JavaBeans, Version 2.1, for OracleWebLogic Server.
In this release of WebLogic Server, if a CMR field has specified both relationship-caching and cascade-delete, the owner bean and related bean are loaded to SQLwhich can provide an additional performance benefit.
9.4.1.1 Using Inner Joins
The EJB container always uses an outer join in a CMP bean finder when eagerrelationship-caching is turned on. Typically, inner joins are faster to executethan outer joins with the drawback that inner joins do not return rows which do nothave data in the corresponding joined table. Where applicable, using an inner join onvery large databases may help to free CPU resources.
In WLS 10.3, use-inner-join has been added in weblogic-cmp-rdbms-jar.xml, as an attribute of the weblogic-rdbms-bean, as shown here:
<weblogic-rdbms-bean>
<ejb-name>exampleBean</ejb-name>
...
<use-inner-join>true</use-inner-join>
</weblogic-rdbms-bean>
This element should only be set to true if the CMP bean's related beans can never benull or an empty set.
CMP Entity Bean Tuning
Tuning WebLogic Server EJBs 9-5

The default value is false. If you specify its value as true, all relationship cache queryon the entity bean use an inner join instead of a left outer join to execute a select queryclause.
9.4.2 Use JDBC Batch OperationsJDBC batch operations are turned on by default in the EJB container. The EJB containerautomatically re-orders and executes similar data base operations in a single batchwhich increases performance by eliminating the number of data base round trips.Oracle recommends using batch operations.
9.4.3 Tuned UpdatesWhen an entity EJB is updated, the EJB container automatically updates in the database only those fields that have actually changed. As a result the update statementsare simpler and if a bean has not been modified, no data base call is made. Becausedifferent transactions may modify different sets of fields, more than one form ofupdate statements may be used to store the bean in the data base. It is important thatyou account for the types of update statements that may be used when setting the sizeof the prepared statement cache in the JDBC connection pool. See Cache Prepared andCallable Statements.
9.4.4 Using Field GroupsField groups allow the user to segregate commonly used fields into a single group. Ifany of the fields in the group is accessed by application/bean code, the entire group isloaded using a single SQL statement. This group can also be associated with a finder.When the finder is invoked and finders-load-bean is true, it loads only thosefields from the data base that are included in the field group. This means that if mosttransactions do not use a particular field that is slow to load, such as a BLOB, it can beexcluded from a field-group. Similarly, if an entity bean has a lot of fields, but atransaction uses only a small number of them, the unused fields can be excluded.
Note:
Be careful to ensure that fields that are accessed in the same transaction arenot configured into separate field-groups. If that happens, multiple data basecalls occur to load the same bean, when one would have been enough.
9.4.5 include-updatesThis flag causes the EJB container to flush all modified entity beans to the data basebefore executing a finder. If the application modifies the same entity bean more thanonce and executes a non-pk finder in-between in the same transaction, multipleupdates to the data base are issued. This flag is turned on by default to comply withthe EJB specification.
If the application has transactions where two invocations of the same or differentfinders could return the same bean instance and that bean instance could have beenmodified between the finder invocations, it makes sense leaving include-updatesturned on. If not, this flag may be safely turned off. This eliminates an unnecessaryflush to the data base if the bean is modified again after executing the second finder.This flag is specified for each finder in the cmp-rdbms descriptor.
CMP Entity Bean Tuning
9-6 Tuning Performance of Oracle WebLogic Server
9.4.6 call-by-referenceWhen it is turned off, method parameters to an EJB are passed by value, whichinvolves serialization. For mutable, complex types, this can be significantly expensive.Consider using for better performance when:
• The application does not require call-by-value semantics, such as methodparameters are not modified by the EJB.
or
• If modified by the EJB, the changes need not be invisible to the caller of the method.
This flag applies to all EJBs, not just entity EJBs. It also applies to EJB invocationsbetween servlets/JSPs and EJBs in the same application. The flag is turned off bydefault to comply with the EJB specification. This flag is specified at the bean-level inthe WebLogic-specific deployment descriptor.
9.4.7 Bean-level Pessimistic LockingBean-level pessimistic locking is implemented in the EJB container by acquiring a database lock when loading the bean. When implemented, each entity bean can only beaccessed by a single transaction in a single server at a time. All other transactions areblocked, waiting for the owning transaction to complete. This is a useful alternative tousing a higher data base isolation level, which can be expensive at the RDBMS level.This flag is specified at the bean level in the cmp-rdbms deployment descriptor.
Note:
If the lock is not exclusive lock, you man encounter deadlock conditions. If thedata base lock is a shared lock, there is potential for deadlocks when usingthat RDBMS.
9.4.8 Concurrency StrategyThe concurrency-strategy deployment descriptor tells the EJB container how tohandle concurrent access of the same entity bean by multiple threads in the sameserver instance. Set this parameter to one of four values:
• Exclusive—The EJB container ensures there is only one instance of an EJB for agiven primary key and this instance is shared among all concurrent transactions inthe server with the container serializing access to it. This concurrency settinggenerally does not provide good performance unless the EJB is used infrequentlyand chances of concurrent access is small.
• Database—This is the default value and most commonly used concurrencystrategy. The EJB container defers concurrency control to the database. Thecontainer maintains multiple instances of an EJB for a given primary-key and eachtransaction gets it's own copy. In combination with this strategy, the databaseisolation-level and bean level pessimistic locking play a major role in determining ifconcurrent access to the persistent state should be allowed. It is possible formultiple transactions to access the bean concurrently so long as it does not need togo to the database, as would happen when the value of cache-between-transactions is true. However, setting the value of cache-between-
CMP Entity Bean Tuning
Tuning WebLogic Server EJBs 9-7
transactions to true unsafe and not recommended with the Dababaseconcurrency strategy.
• Optimistic—The goal of the optimistic concurrency strategy is to minimizelocking at the data base and while continuing to provide data consistency. Thebasic assumption is that the persistent state of the EJB is changed very rarely. Thecontainer attempts to load the bean in a nested transaction so that the isolation-level settings of the outer transaction does not cause locks to be acquired at the database. At commit-time, if the bean has been modified, a predicated update is used toensure it's persistent state has not been changed by some other transaction. If so, anOptimisticConcurrencyException is thrown and must be handled by theapplication.
Since EJBs that can use this concurrency strategy are rarely modified, usingcache-between-transactions on can boost performance significantly. Thisstrategy also allows commit-time verification of beans that have been read, but notchanged. This is done by setting the verify-rows parameter to Read in the cmp-rdbms descriptor. This provides very high data-consistency while at the same timeminimizing locks at the data base. However, it does slow performance somewhat.It is recommended that the optimistic verification be performed using a versioncolumn: it is faster, followed closely by timestamp, and more distantly by modifiedand read. The modified value does not apply if verify-rows is set to Read.
When an optimistic concurrency bean is modified in a server that is part of acluster, the server attempts to invalidate all instances of that bean cluster-wide inthe expectation that it will prevent OptimisticConcurrencyExceptions. Insome cases, it may be more cost effective to simply let other servers throw anOptimisticConcurrencyException. in this case, turn off the cluster-wideinvalidation by setting the cluster-invalidation-disabled flag in the cmp-rdbms descriptor.
• ReadOnly—The ReadOnly value is the most performant. When selected, thecontainer assumes the EJB is non-transactional and automatically turns on cache-between-transactions. Bean states are updated from the data base at periodic,configurable intervals or when the bean has been programmatically invalidated.The interval between updates can cause the persistent state of the bean to becomestale. This is the only concurrency-strategy for which query-caching can beused. See Caching between Transactions.
9.5 Tuning In Response to Monitoring StatisticsThe WebLogic Server Administration Console reports a wide variety of EJB runtimemonitoring statistics, many of which are useful for tuning your EJBs. This sectiondiscusses how some of these statistics can help you tune the performance of EJBs.
To display the statistics in the WebLogic Server Administration Console, see Monitoring EJBs in Oracle WebLogic Server Administration Console Online Help. If youprefer to write a custom monitoring application, you can access the monitoringstatistics using JMX or WLST by accessing the relevant runtime MBeans. See RuntimeMBeans in MBean Reference for Oracle WebLogic Server.
9.5.1 Cache Miss RatioThe cache miss ratio is a ratio of the number of times a container cannot find a bean inthe cache (cache miss) to the number of times it attempts to find a bean in the cache(cache access):
Cache Miss Ratio = (Cache Total Miss Count / Cache Total Access Count) * 100
Tuning In Response to Monitoring Statistics
9-8 Tuning Performance of Oracle WebLogic Server

A high cache miss ratio could be indicative of an improperly sized cache. If yourapplication uses a certain subset of beans (read primary keys) more frequently thanothers, it would be ideal to size your cache large enough so that the commonly usedbeans can remain in the cache as less commonly used beans are cycled in and outupon demand. If this is the nature of your application, you may be able to decreaseyour cache miss ratio significantly by increasing the maximum size of your cache.
If your application doesn't necessarily use a subset of beans more frequently thanothers, increasing your maximum cache size may not affect your cache miss ratio. Werecommend testing your application with different maximum cache sizes to determinewhich give the lowest cache miss ratio. It is also important to keep in mind that yourserver has a finite amount of memory and therefore there is always a trade-off toincreasing your cache size.
9.5.2 Lock Waiter RatioWhen using the Exclusive concurrency strategy, the lock waiter ratio is the ratio ofthe number of times a thread had to wait to obtain a lock on a bean to the total amountof lock requests issued:
Lock Waiter Ratio = (Current Waiter Count / Current Lock Entry Count) * 100
A high lock waiter ratio can indicate a suboptimal concurrency strategy for the bean. Ifacceptable for your application, a concurrency strategy of Database or Optimistic willallow for more parallelism than an Exclusive strategy and remove the need for lockingat the EJB container level.
Because locks are generally held for the duration of a transaction, reducing theduration of your transactions will free up beans more quickly and may help reduceyour lock waiter ratio. To reduce transaction duration, avoid grouping large amountsof work into a single transaction unless absolutely necessary.
9.5.3 Lock Timeout RatioWhen using the Exclusive concurrency strategy, the lock timeout ratio is the ratio oftimeouts to accesses for the lock manager:
Lock Timeout Ratio =(Lock Manager Timeout Total Count / Lock Manager Total Access Count) * 100
The lock timeout ratio is closely related to the lock waiter ratio. If you are concernedabout the lock timeout ratio for your bean, first take a look at the lock waiter ratio andour recommendations for reducing it (including possibly changing your concurrencystrategy). If you can reduce or eliminate the number of times a thread has to wait for alock on a bean, you will also reduce or eliminate the amount of timeouts that occurwhile waiting.
A high lock timeout ratio may also be indicative of an improper transaction timeoutvalue. The maximum amount of time a thread will wait for a lock is equal to thecurrent transaction timeout value.
If the transaction timeout value is set too low, threads may not be waiting long enoughto obtain access to a bean and timing out prematurely. If this is the case, increasing thetrans-timeout-seconds value for the bean may help reduce the lock timeout ratio.
Take care when increasing the trans-timeout-seconds, however, because doing so cancause threads to wait longer for a bean and threads are a valuable server resource.Also, doing so may increase the request time, as a request ma wait longer beforetiming out.
Tuning In Response to Monitoring Statistics
Tuning WebLogic Server EJBs 9-9
9.5.4 Pool Miss RatioThe pool miss ratio is a ratio of the number of times a request was made to get a beanfrom the pool when no beans were available, to the total number of requests for a beanmade to the pool:
Pool Miss Ratio = (Pool Total Miss Count / Pool Total Access Count) * 100
If your pool miss ratio is high, you must determine what is happening to your beaninstances. There are three things that can happen to your beans.
• They are in use.
• They were destroyed.
• They were removed.
Follow these steps to diagnose the problem:
1. Check your destroyed bean ratio to verify that bean instances are not beingdestroyed.
2. Investigate the cause and try to remedy the situation.
3. Examine the demand for the EJB, perhaps over a period of time.
One way to check this is via the Beans in Use Current Count and Idle Beans Countdisplayed in the WebLogic Server Administration Console. If demand for your EJBspikes during a certain period of time, you may see a lot of pool misses as your pool isemptied and unable to fill additional requests.
As the demand for the EJB drops and beans are returned to the pool, many of thebeans created to satisfy requests may be unable to fit in the pool and are thereforeremoved. If this is the case, you may be able to reduce the number of pool misses byincreasing the maximum size of your free pool. This may allow beans that werecreated to satisfy demand during peak periods to remain in the pool so they can beused again when demand once again increases.
9.5.5 Destroyed Bean RatioThe destroyed bean ratio is a ratio of the number of beans destroyed to the totalnumber of requests for a bean.
Destroyed Bean Ratio = (Total Destroyed Count / Total Access Count) * 100
To reduce the number of destroyed beans, Oracle recommends against throwing non-application exceptions from your bean code except in cases where you want the beaninstance to be destroyed. A non-application exception is an exception that is either ajava.rmi.RemoteException (including exceptions that inherit from RemoteException)or is not defined in the throws clause of a method of an EJB's home or componentinterface.
In general, you should investigate which exceptions are causing your beans to bedestroyed as they may be hurting performance and may indicate problem with the EJBor a resource used by the EJB.
Tuning In Response to Monitoring Statistics
9-10 Tuning Performance of Oracle WebLogic Server

9.5.6 Pool Timeout RatioThe pool timeout ratio is a ratio of requests that have timed out waiting for a beanfrom the pool to the total number of requests made:
Pool Timeout Ratio = (Pool Total Timeout Count / Pool Total Access Count) * 100
A high pool timeout ratio could be indicative of an improperly sized free pool.Increasing the maximum size of your free pool via the max-beans-in-free-poolsetting will increase the number of bean instances available to service requests andmay reduce your pool timeout ratio.
Another factor affecting the number of pool timeouts is the configured transactiontimeout for your bean. The maximum amount of time a thread will wait for a beanfrom the pool is equal to the default transaction timeout for the bean. Increasing thetrans-timeout-seconds setting in your weblogic-ejb-jar.xml file will givethreads more time to wait for a bean instance to become available.
Users should exercise caution when increasing this value, however, since doing somay cause threads to wait longer for a bean and threads are a valuable serverresource. Also, request time might increase because a request will wait longer beforetiming out.
9.5.7 Transaction Rollback RatioThe transaction rollback ratio is the ratio of transactions that have rolled back to thenumber of total transactions involving the EJB:
Transaction Rollback Ratio = (Transaction Total Rollback Count / Transaction Total Count) * 100
Begin investigating a high transaction rollback ratio by examining the TransactionTimeout Ratio reported in the WebLogic Server Administration Console. If thetransaction timeout ratio is higher than you expect, try to address the timeout problemfirst.
An unexpectedly high transaction rollback ratio could be caused by a number ofthings. We recommend investigating the cause of transaction rollbacks to findpotential problems with your application or a resource used by your application.
9.5.8 Transaction Timeout RatioThe transaction timeout ratio is the ratio of transactions that have timed out to thetotal number of transactions involving an EJB:
Transaction Timeout Ratio = (Transaction Total Timeout Count / Transaction Total Count) * 100
A high transaction timeout ratio could be caused by the wrong transaction timeoutvalue. For example, if your transaction timeout is set too low, you may be timing outtransactions before the thread is able to complete the necessary work. Increasing yourtransaction timeout value may reduce the number of transaction timeouts.
You should exercise caution when increasing this value, however, since doing so cancause threads to wait longer for a resource before timing out. Also, request time mightincrease because a request will wait longer before timing out.
Tuning In Response to Monitoring Statistics
Tuning WebLogic Server EJBs 9-11

A high transaction timeout ratio could be caused by a number of things such as abottleneck for a server resource. We recommend tracing through your transactions toinvestigate what is causing the timeouts so the problem can be addressed.
Tuning In Response to Monitoring Statistics
9-12 Tuning Performance of Oracle WebLogic Server
10Tuning Message-Driven Beans
Use the tuning and best practice information for Message-Driven Beans (MDBs), asdescribed in this chapter.
This chapter includes the following sections:
• Use Transaction Batching
• MDB Thread Management
• Best Practices for Configuring and Deploying MDBs Using Distributed Topics
• Using MDBs with Foreign Destinations
• Token-based Message Polling for Transactional MDBs Listening on Queues/Topics
• Compatibility for WLS 10.0 and Earlier-style Polling
10.1 Use Transaction BatchingMDB transaction batching allows several JMS messages to be processed in onecontainer managed transaction. Batching amortizes the cost of transactions overmultiple messages and when used appropriately, can reduce or even eliminate thethroughput difference between 2PC and 1PC processing. See Transaction Batching ofMDBs in Developing Message-Driven Beans for Oracle WebLogic Server.
• Using batching may require reducing the number of concurrent MDB instances. Iftoo many MDB instances are available, messages may be processed in parallelrather than in a batch. See MDB Thread Management.
• While batching generally increases throughput, it may also increase latency (thetime it takes for an individual message to complete its MDB processing).
10.2 MDB Thread ManagementThread management for MDBs is described in terms of concurrency—the number ofMDB instances that can be active at the same time. The following sections provideinformation on MDB concurrency:
• Determining the Number of Concurrent MDBs
• Selecting a Concurrency Strategy
• Thread Utilization When Using WebLogic Destinations
• Limitations for Multi-threaded Topic MDBs
Tuning Message-Driven Beans 10-1

10.2.1 Determining the Number of Concurrent MDBsTable 10-1 provides information on how to determine the number of concurrentlyrunning MDB instances for a server instance.
Table 10-1 Determining Concurrency for WebLogic Server MDBs
Type of work manager or executequeue
Threads
Default work manager orunconstrained work manager
varies due to self-tuning, up to Min(max-beans-in-free-pool,16)
Default work manager with self-tuning disabled
Min(default-thread-pool-size/2+1, max-beans-in-free-pool)
This is also the default thread pool concurrencyalgorithm for WebLogic Server 8.1
Custom execute queue Min(execute-queue-size, max-beans-in-free-pool)
Custom work manager withconstraint
varies due to self-tuning, between min-thread-constraint and Min(max-threads-constraint,max-beans-in-free-pool)
Transactional WebLogic MDBs use a synchronous polling mechanism to retrievemessages from JMS destinations if they are either: A) listening to non-WebLogicqueues; or B) listening to a WebLogic queue and transaction batching is enabled. See Token-based Message Polling for Transactional MDBs Listening on Queues/Topics.
10.2.2 Selecting a Concurrency StrategyThe following section provides general information on selecting a concurrencystrategy for your applications:
Note:
Every application is unique, select a concurrency strategy based on how yourapplication performs in its environment.
• In most situations, if the message stream has bursts of messages, using anunconstrained work manager with a high fair share is adequate. Once the messagesin a burst are handled, the threads are returned to the self-tuning pool.
• In most situations, if the message arrival rate is high and constant or if low latencyis required, it makes sense to reserve threads for MDBs. You can reserve threads byeither specifying a work manager with a min-threads-constraint or by usinga custom execute queue.
• If you migrate WebLogic Server 8.1 applications that have custom MDB executequeues, you can convert the MDB execute queue to a custom work manager thathas a configured max-threads-constraint parameter and a high fair sharesetting.
MDB Thread Management
10-2 Tuning Performance of Oracle WebLogic Server
Note:
You must configure the max-threads-constraint parameter to overridethe default concurrency of 16.
• In WebLogic Server 8.1, you could increase the size of the default execute queueknowing that a larger default pool means a larger maximum MDB concurrency.Default thread pool MDBs upgraded to WebLogic Server 9.0 will have a fixedmaximum of 16. To achieve MDB concurrency numbers higher than 16, you willneed to create a custom work manager or custom execute queue. See Table 10-1.
10.2.3 Thread Utilization When Using WebLogic DestinationsThe following section provides information on how threads are allocated whenWebLogic Server interoperates with WebLogic destinations.
• Non-transactional WebLogic MDBs allocate threads from the thread-pooldesignated by the dispatch-policy as needed when there are new messages tobe processed. If the MDB has successfully connected to its source destination, butthere are no messages to be processed, then the MDB will use no threads.
• Transactional WebLogic MDBs with transaction batching disabled work the same asnon-transactional MDBs except for Topic MDBs with a Topic MessagesDistribution Mode of Compatibility (the default), in which case the MDBalways limits the thread pool size to 1.
• The behavior of transactional MDBs with transaction batching enabled depends onwhether the MDB is listening on a topic or a queue:
– MDBs listening on topics: — Each deployed MDB uses a dedicated daemonpolling thread that is created in Non-Pooled Threads thread group.
⁎ Topic Messages Distribution Mode = Compatibility: Each deployed MDBuses a dedicated daemon polling thread that is created in the Non-PooledThreads thread group.
⁎ Topic Messages Distribution Mode = One-Copy-Per-Server or One-Copy-Per-Application: Same as queues.
– MDBs listening on queues — Instead of a dedicated thread, each deployed MDBuses a token-based, synchronous polling mechanism that always uses at leastone thread from the dispatch-policy. See Token-based Message Polling forTransactional MDBs Listening on Queues/Topics.
For information on how threads are allocated when WebLogic Server interoperateswith MDBs that consume from Foreign destinations, see Thread Utilization for MDBsthat Process Messages from Foreign Destinations.
10.2.4 Limitations for Multi-threaded Topic MDBsWhen the topicMessagesDistributionMode is Compatibility, the defaultbehavior for non-transactional topic MDBs is to multi-thread the message processing.In this situation, the MDB container fails to provide reproducible behavior when thetopic is not a WebLogic JMS Topic, such as unexpected exceptions andacknowledgement of messages that have not yet been processed. For example, if anapplication throws a RuntimeException from onmessage, the container may stillacknowledge the message. Oracle recommends setting max-beans-in-free-pool
MDB Thread Management
Tuning Message-Driven Beans 10-3
to a value of 1 in the deployment descriptor to prevent multi-threading in topic MDBswhen the topic is a foreign vendor topic (not a WebLogic JMS topic).
Caution:
Non-transactional Foreign Topics: Oracle recommends explicitly setting max-beans-in-free-pool to 1 for non-transactional MDBs that work withforeign (non-WebLogic) topics. Failure to do so may result in lost messages inthe event of certain failures, such as the MDB application throwing Runtimeor Error exceptions.
Unit-of-Order: Oracle recommends explicitly setting max-beans-in-free-pool to 1 for non-transactional Compatibility mode MDBs that consumefrom a WebLogic JMS topic and process messages that have a WebLogic JMSUnit-of-Order value. Unit-of-Order messages in this use case may not beprocessed in order unless max-beans-in-free-pool is set to 1.
Transactional MDBs automatically force concurrency to 1 regardless of the max-beans-in-free-pool setting.
10.3 Best Practices for Configuring and Deploying MDBs UsingDistributed Topics
Message-driven beans provide a number of application design and deploymentoptions that offer scalability and high availability when using distributed topics. Formore detailed information, see Configuring and Deploying MDBs Using DistributedTopics in Developing Message-Driven Beans for Oracle WebLogic Server.
10.4 Using MDBs with Foreign Destinations
Note:
The term "Foreign destination" in this context refers to destinations that arehosted by a non-WebLogic JMS provider. It does not refer to remote WebLogicdestinations.
The following sections provide information on the behavior of WebLogic Server whenusing MDBs that consume messages from Foreign destinations:
• Concurrency for MDBs that Process Messages from Foreign Destinations
• Thread Utilization for MDBs that Process Messages from Foreign Destinations
10.4.1 Concurrency for MDBs that Process Messages from Foreign DestinationsThe concurrency of MDBs that consume from destinations hosted by foreign providers(non-WebLogic JMS destinations) is determined using the same algorithm that is usedfor WebLogic JMS destinations.
Best Practices for Configuring and Deploying MDBs Using Distributed Topics
10-4 Tuning Performance of Oracle WebLogic Server

10.4.2 Thread Utilization for MDBs that Process Messages from Foreign DestinationsThe following section provides information on how threads are allocated whenWebLogic Server interoperates with MDBs that process messages from foreigndestinations:
• Non-transactional MDBs use a foreign vendor's thread, not a WebLogic Serverthread. In this situation, the dispatch-policy is ignored except for determiningconcurrency.
• Transactional MDBs run in WebLogic Server threads, as follow:
– MDBs listening on topics — Each deployed MDB uses a dedicated daemonpolling thread that is created in Non-Pooled Threads thread group.
– MDBs listening on queues — Instead of a dedicated thread, each deployed MDBuses a token-based, synchronous polling mechanism that always uses at leastone thread from the dispatch-policy. See Token-based Message Polling forTransactional MDBs Listening on Queues/Topics
10.5 Token-based Message Polling for Transactional MDB Listening onQueues/Topics
Transactional WebLogic MDB use a synchronous polling mechanism to retrievemessages from JMS destinations if they are:
• Listening to non-WebLogic queues
• Listening to a WebLogic queue and transaction batching is enabled
• Listening to a WebLogic Topic where:
– Topic Messages Distribution Mode = One-Copy-Per-Server and transactionbatching is enabled
– Topic Messages Distribution Mode = One-Copy-Per-Application andtransaction batching is enabled
With synchronous polling, one or more WebLogic polling threads synchronouslyreceive messages from the MDB's source destination and then invoke the MDBapplication's onMessage callback.
As of WebLogic 10.3, the polling mechanism changed to a token-based approach toprovide better control of the concurrent poller thread count under changing messageloads. In previous releases, the thread count ramp-up could be too gradual in certainuse cases. Additionally, child pollers, once awoken, could not be ramped down andreturned back to the pool for certain foreign JMS providers.
When a thread is returned to the thread pool with token-based polling, the thread'sinternal JMS consumer is closed rather than cached. This assures that messages willnot be implicitly pre-fetched by certain foreign JMS Providers while there is no pollingthread servicing the consumer.
In addition, each MDB maintains a single token that provides permission for a givenpoller thread to create another thread.
• On receipt of a message — A poller thread that already has the token or that is able toacquire the token because the token is not owned, wakes up an additional poller
Token-based Message Polling for Transactional MDB Listening on Queues/Topics
Tuning Message-Driven Beans 10-5

thread and gives the token to the new poller if the maximum concurrency has notyet been reached. If maximum concurrency has been reached, the poller threadsimply releases the token (leaving it available to any other poller).
• On finding an empty queue/Topic — A poller tries to acquire the token and ifsuccessful will try to poll the queue periodically. If it fails to acquire the token, itreturns itself back to the pool. This ensures that with an empty queue or topic,there is still at least one poller checking for messages.
WebLogic 12.2.1.2.0 introduces two properties of type activation-configproperty:mdbDestinationPollIntervalMillis and minimizeAQSessions. ThemdbDestinationPollInternvalMillis property controls the message pollinginterval that is used by the synchronous polling mechanism for MDB. When the JMSprovider is AQJMS, the minimizeAQSessions property reduces the use of databaseresources by minimizing the number of AQ JMS sessions.
10.6 Compatibility for WLS 10.0 and Earlier-style PollingIn WLS 10.0 and earlier, transactional MDBs with batching enabled created adedicated polling thread for each deployed MDB. This polling thread was notallocated from the pool specified by dispatch-policy, it was an entirely newthread in addition to the all other threads running on the system. See Use TransactionBatching.
To override the token-based polling behavior and implement the WLS 10.0 and earlierbehavior, you can either:
• At the server level, set the weblogic.mdb.message.81StylePolling systemproperty to True to override the token-based polling behavior.
• At the MDB level, set the use81-style-polling element under message-driven-descriptor to override the token-based polling behavior. When usingforeign transactional MDBs with the WLS 8.1-style polling flag, some foreignvendors require a permanently allocated thread per concurrent MDB instance.These threads are drawn from the pool specified by dispatch-policy and arenot returned to the pool until the MDB is undeployed. Since these threads are notshared, the MDB can starve other resources in the same pool. In this situation, youmay need to increase the number of threads in the pool. With the token-basedpolling approach for such foreign vendors, the thread's internal JMS messageconsumer is closed rather than cached to assure that messages will not be reservedby the destination for the specific consumer.
Compatibility for WLS 10.0 and Earlier-style Polling
10-6 Tuning Performance of Oracle WebLogic Server
11Tuning Data Sources
To get the best performance from your WebLogic data sources, use the tuning tipsprovided in this chapter.
This chapter includes the following sections:
• Tune the Number of Database Connections
• Waste Not
• Use Test Connections on Reserve with Care
• Cache Prepared and Callable Statements
• Using Pinned-To-Thread Property to Increase Performance
• Database Listener Timeout under Heavy Server Loads
• Disable Wrapping of Data Type Objects
• Advanced Configurations for Oracle Drivers and Databases
• Use Best Design Practices
11.1 Tune the Number of Database ConnectionsA straightforward and easy way to boost performance of a data source in WebLogicServer applications is to set the value of Initial Capacity equal to the value forMaximum Capacity when configuring connection pools in your data source.
Creating a database connection is a relatively expensive process in any environment.Typically, a connection pool starts with a small number of connections. As clientdemand for more connections grow, there may not be enough in the pool to satisfy therequests. WebLogic Server creates additional connections and adds them to the pooluntil the maximum pool size is reached.
One way to avoid connection creation delays for clients using the server is to initializeall connections at server startup, rather than on-demand as clients need them. Set theinitial number of connections equal to the maximum number of connections in theConnection Pool tab of your data source configuration. See JDBC Data Source:Configuration: Connection Pool in the Oracle WebLogic Server Administration ConsoleOnline Help. You will still need to determine the optimal value for the MaximumCapacity as part of your pre-production performance testing.
Note that if you configure the value of Initial Capacityto be zero, WebLogicServer does not get a connection during startup. This provides a big startupperformance gain, especially if several data sources are available. But moreimportantly, it allows the data source to be deployed on startup, even if the database is
Tuning Data Sources 11-1
not available or has problems at startup (or it could be a standby data source that isnot even available when the primary service is running).
There are two situations in which a connection is reserved, even if InitialCapacityis zero:
1. For a multi data source configured for LLR, a connection is reserved on eachmember data source to determine if the underlying database is an Oracle RealApplication Clusters (Oracle RAC) database. If it is Oracle RAC, only one of themember data sources must be available.
2. For an Active GridLink (AGL) data source configured with auto-ONS(that is, withno ONS host and port pairs provided), a connection is created to get the ONSconfiguration information from the database.
For more tuning information, see Tuning Data Source Connection Pool Options inAdministering JDBC Data Sources for Oracle WebLogic Server.
11.2 Waste NotAnother simple way to boost performance is to avoid wasting resources. Here aresome situations where you can avoid wasting JDBC related resources:
• JNDI lookups are relatively expensive, so caching an object that required a looked-up in client code or application code avoids incurring this performance hit morethan once.
• Once client or application code has a connection, maximize the reuse of thisconnection rather than closing and reacquiring a new connection. While acquiringand returning an existing creation is much less expensive than creating a new one,excessive acquisitions and returns to pools creates contention in the connectionpool and degrades application performance.
• Don't hold connections any longer than is necessary to achieve the work needed.Getting a connection once, completing all necessary work, and returning it as soonas possible provides the best balance for overall performance.
11.3 Use Test Connections on Reserve with CareWhen Test Connections on Reserve is enabled, the server instance checks adatabase connection prior to returning the connection to a client. This helps reduce therisk of passing invalid connections to clients.
However, it is a fairly expensive operation. Typically, a server instance performs thetest by executing a full-fledged SQL query with each connection prior to returning it. Ifthe SQL query fails, the connection is destroyed and a new one is created in its place.A new and optional performance tunable has been provided in WebLogic Server 9.xwithin this "test connection on reserve" feature. The new optional performance tunablein 9.x allows WebLogic Server to skip this SQL-query test within a configured timewindow of a prior successful client use (default is 10 seconds). When a connection isreturned to the pool by a client, the connection is timestamped by WebLogic Server.WebLogic Server will then skip the SQL-query test if this particular connection isreturned to a client within the time window. Once the time window expires, WebLogicServer will execute the SQL-query test. This feature can provide significantperformance boosts for busy systems using "test connection on reserve".
Waste Not
11-2 Tuning Performance of Oracle WebLogic Server

11.4 Cache Prepared and Callable StatementsWhen you use a prepared statement or callable statement in an application or EJB,there is considerable processing overhead for the communication between theapplication server and the database server and on the database server itself. Tominimize the processing costs, WebLogic Server can cache prepared and callablestatements used in your applications. When an application or EJB calls any of thestatements stored in the cache, WebLogic Server reuses the statement stored in thecache. Reusing prepared and callable statements reduces CPU usage on the databaseserver, improving performance for the current statement and leaving CPU cycles forother tasks. For more details, see Increasing Performance with the Statement Cache inAdministering JDBC Data Sources for Oracle WebLogic Server.
Using the statement cache can dramatically increase performance, but you mustconsider its limitations before you decide to use it. For more details, see UsageRestrictions for the Statement Cache in Administering JDBC Data Sources for OracleWebLogic Server.
11.5 Using Pinned-To-Thread Property to Increase PerformanceTo minimize the time it takes for an application to reserve a database connection froma data source and to eliminate contention between threads for a database connection,you can add the Pinned-To-Thread property in the connection Properties list forthe data source, and set its value to true.
In this release, the Pinned-To-Thread feature does not work with multi data sources,Oracle RAC, and IdentityPool. These features rely on the ability to return a connectionto the connection pool and reacquire it if there is a connection failure or connectionidentity does not match
See JDBC Data Source: Configuration: Connection Pool in the Oracle WebLogic ServerAdministration Console Online Help.
11.6 Database Listener Timeout under Heavy Server LoadsIn some situations where WebLogic Server is under heavy loads (high CPUutilization), the database listener may timeout and throw an exception while creating anew connection. To workaround this issue, increase the listener timeout on thedatabase server. The following example is for an Oracle driver and database:
• The exception thrown is a ResourceDeadException and the driver exceptionwas Socket read timed out.
• The workaround is to increase the timeout of the database server using thefollowing:
sqlnet.ora: SQLNET.INBOUND_CONNECT_TIMEOUT=180
listener.ora: INBOUND_CONNECT_TIMEOUT_listener_name=180
11.7 Disable Wrapping of Data Type ObjectsBy default, data type objects for Array, Blob, Clob, NClob, Ref, SQLXML, and Struct,plus ParameterMetaData and ResultSetMetaData objects are wrapped with aWebLogic wrapper. You can disable wrapping, which can improve performance andallow applications to use native driver objects directly. See Using Unwrapped DataType Objects in Administering JDBC Data Sources for Oracle WebLogic Server.
Cache Prepared and Callable Statements
Tuning Data Sources 11-3

11.8 Advanced Configurations for Oracle Drivers and DatabasesOracle provides advanced configuration options that can provide improved datasource and driver performance when using Oracle drivers and databases. Optionsinclude proxy authentication, setting credentials on a connection, connectionharvesting, and labeling connections. See Advanced Configurations for Oracle Driversand Databases in Administering JDBC Data Sources for Oracle WebLogic Server.
11.9 Use Best Design PracticesMost performance gains or losses in a database application is not determined by theapplication language, but by how the application is designed. The number andlocation of clients, size and structure of DBMS tables and indexes, and the number andtypes of queries all affect application performance. See Designing Your Application forBest Performance in Developing JDBC Applications for Oracle WebLogic Server.
Advanced Configurations for Oracle Drivers and Databases
11-4 Tuning Performance of Oracle WebLogic Server

12Tuning Transactions
To optimize transaction performance, use the tuning guidelines described in thischapter.
This chapter includes the following sections:
• Global Transaction Tuning
• XA Transaction Cluster Affinity
• Logging Last Resource Transaction Optimization
• Read-only_ One-Phase Commit Optimizations
• Configure XA Transactions without TLogs
12.1 Global Transaction TuningXA transaction cluster affinity allows server instances that are participating in a globaltransactions to service related requests rather than load-balancing these requests toother member servers. When Enable Transaction Affinity=true, clusterthroughput is increased by:
• Reducing inter-server transaction coordination traffic
• Improving resource utilization, such as reducing JDBC connections
• Simplifying asynchronous processing of transactions
See Configure clusters in Oracle WebLogic Server Administration Console Online Help and XA Transaction Affinity in Administering Clusters for Oracle WebLogic Server.
12.2 XA Transaction Cluster AffinityXA transaction cluster affinity allows server instances that are participating in a globaltransactions to service related requests rather than load-balancing these requests toother member servers. When Enable Transaction Affinity=true, clusterthroughput is increased by:
• Reducing inter-server transaction coordination traffic
• Improving resource utilization, such as reducing JDBC connections
• Simplifying asynchronous processing of transactions
See Configure clusters in Oracle WebLogic Server Administration Console Online Help and XA Transaction Affinity in Administering Clusters for Oracle WebLogic Server.
Tuning Transactions 12-1
12.3 Logging Last Resource Transaction OptimizationThe Logging Last Resource (LLR) transaction optimization through JDBC data sourcessafely reduces the overhead of two-phase transactions involving database inserts,updates, and deletes. Two phase transactions occur when two different resourcesparticipate in the same global transaction (global transactions are often referred to as"XA" or "JTA" transactions). Consider the following:
• Typical two-phase transactions in JMS applications usually involve both a JMSserver and a database server. The LLR option can as much as double performancecompared to XA.
• The safety of the JDBC LLR option contrasts with well known but less-safe XAoptimizations such as "last-agent", "last-participant", and "emulate-two-phase-commit" that are available from other vendors as well as WebLogic.
• JDBC LLR works by storing two-phase transaction records in a database tablerather than in the transaction manager log (the TLOG).
See Logging Last Resource Transaction Optimization in Developing JTA Applications forOracle WebLogic Server.
12.3.1 LLR Tuning GuidelinesThe following section provides tuning guidelines for LLR:
• Oracle recommends that you read and understand Logging Last ResourceTransaction Optimization in Developing JTA Applications for Oracle WebLogic Serverand Programming Considerations and Limitations for LLR Data Sources inAdministering JDBC Data Sources for Oracle WebLogic Server. LLR has a number ofimportant administration and design implications.
• JDBC LLR generally improves performance of two-phase transactions that involveSQL updates, deletes, or inserts.
• LLR generally reduces the performance of two-phase transactions where all SQLoperations are read-only (just selects).
• JDBC LLR pools provide no performance benefit to WebLogic JDBC stores.WebLogic JDBC stores are fully transactional but do not use JTA (XA) transactionson their internal JDBC connections.
• Consider using LLR instead of the less safe "last-agent" optimization forconnectors, and the less safe "emulate-two-phase-commit" option for JDBCconnection pools (formerly known as the "enable two-phase commit" option forpools that use non-XA drivers).
• On Oracle databases, heavily used LLR tables may become fragmented over time,which can lead to unused extents. This is likely due to the highly transient natureof the LLR table's data. To help avoid the issue, set PCT_FREE to 5 and PCT_USEDto 95 on the LLR table. Also periodically defragment using the ALTERTABLESPACE [tablespace-name] COALESCE command.
12.4 Read-only, One-Phase Commit OptimizationsWhen resource managers, such as the Oracle Database (including Oracle AQ andOracle RAC), provide read-only optimizations, Oracle WebLogic can provide a read-
Logging Last Resource Transaction Optimization
12-2 Tuning Performance of Oracle WebLogic Server

only, one-phase commit optimization that provides a number of benefits – even whenenabling multiple connections of the same XA transactions – such as eliminatingXAResource.prepare network calls and transaction log writes, both in OracleWebLogic and in the resource manager.
See Read-only, One-Phase Commit Optimizations in Developing JTA Applications forOracle WebLogic Server.
12.5 Configure XA Transactions without TLogsImproves XA transaction performance by eliminating TLogs when XA transactionsspan a single Transaction Manager (TM). XA transaction resources (Determiners) areused during transaction recovery when a TLog is not present. See Transactionswithout TLogs in Developing JTA Applications for Oracle WebLogic Server.
Configure XA Transactions without TLogs
Tuning Transactions 12-3

Configure XA Transactions without TLogs
12-4 Tuning Performance of Oracle WebLogic Server

13Tuning WebLogic JMS
Get the most out of your applications by implementing the administrativeperformance tuning features available with WebLogic JMS, described in this chapter.
This chapter includes the following sections:
• JMS Performance & Tuning Check List
• Handling Large Message Backlogs
• Cache and Re-use Client Resources
• Tuning Distributed Queues
• Tuning Topics
• Tuning for Large Messages
• Defining Quota
• Blocking Senders During Quota Conditions
• Tuning MessageMaximum
• Setting Maximum Message Size for Network Protocols
• Compressing Messages
• Paging Out Messages To Free Up Memory
• Controlling the Flow of Messages on JMS Servers and Destinations
• Handling Expired Messages
• Tuning Applications Using Unit-of-Order
• Using One-Way Message Sends
• Tuning the Messaging Performance Preference Option
• Client-side Thread Pools
• Best Practices for JMS .NET Client Applications
• Considerations for Oracle Data Guard Environments
13.1 JMS Performance & Tuning Check ListThe following section provides a checklist of items to consider when tuning WebLogicJMS:
Tuning WebLogic JMS 13-1

• Always configure quotas, see Defining Quota.
• Verify that default paging settings apply to your needs, see Paging Out MessagesTo Free Up Memory. Paging lowers performance but may be required if JVMmemory is insufficient.
• Avoid large message backlogs. See Handling Large Message Backlogs.
• Create and use custom connection factories with all applications instead of usingdefault connection factories, including when using MDBs. Default connectionfactories are not tunable, while custom connection factories provide many optionsfor performance tuning.
• Write applications so that they cache and re-use JMS client resources, includingJNDI contexts and lookups, and JMS connections, sessions, consumers, orproducers. These resources are relatively expensive to create. For information ondetecting when caching is needed, as well as on built-in pooling features, see Cacheand Re-use Client Resources.
• For asynchronous consumers and MDBs, tune MessagesMaximum on theconnection factory. Increasing MessagesMaximum can improve performance,decreasing MessagesMaximum to its minimum value can lower performance, buthelps ensure that messages do not end up waiting for a consumer that's alreadyprocessing a message. See Tuning MessageMaximum.
• Avoid single threaded processing when possible. Use multiple concurrentproducers and consumers and ensure that enough threads are available to servicethem.
• Tune server-side applications so that they have enough instances. Considercreating dedicated thread pools for these applications. See Tuning Message-DrivenBeans.
• For client-side applications with asynchronous consumers, tune client-side threadpools using Client-side Thread Pools.
• Tune persistence as described in Tuning the WebLogic Persistent Store. Inparticular, it's normally best for multiple JMS servers, destinations, and otherservices to share the same store so that the store can aggregate concurrent requestsinto single physical I/O requests, and to reduce the chance that a JTA transactionspans more than one store. Multiple stores should only be considered once it's beenestablished that the a single store is not scaling to handle the current load.
• If you have large messages, see Tuning for Large Messages.
• Prevent unnecessary message routing in a cluster by carefully configuringconnection factory targets. Messages potentially route through two servers, as theyflow from a client, through the client's connection host, and then on to a finaldestination. For server-side applications, target connection factories to the cluster.For client-side applications that work with a distributed destination, targetconnection factories only to servers that host the distributed destinations members.For client-side applications that work with a singleton destination, target theconnection factory to the same server that hosts the destination.
• If JTA transactions include both JMS and JDBC operations, consider enabling theJDBC LLR optimization. LLR is a commonly used safe "ACID" optimization thatcan lead to significant performance improvements, with some drawbacks. See Tuning Transactions.
JMS Performance & Tuning Check List
13-2 Tuning Performance of Oracle WebLogic Server

• If you are using Java clients, avoid thin Java clients except when a small jar size ismore important than performance. Thin clients use the slower IIOP protocol evenwhen T3 is specified so use a full java client instead. For more information aboutstandalone clients, see Developing Standalone Clients for Oracle WebLogic Server.
• Tune JMS Store-and-Forward according to Tuning WebLogic JMS Store-and-Forward.
• Tune a WebLogic Messaging Bridge according Tuning WebLogic Message Bridge.
• If you are using non-persistent non-transactional remote producer clients, thenconsider enabling one-way calls. See Using One-Way Message Sends.
• Consider using JMS distributed queues. See Using Distributed Queues inDeveloping JMS Applications for Oracle WebLogic Server.
• If you are already using distributed queues, see Tuning Distributed Queues.
• Consider using advanced distributed topic features (PDTs). See DevelopingAdvanced Pub/Sub Applications in Developing JMS Applications for Oracle WebLogicServer.
• If your applications use Topics, see Tuning Topics.
• Avoid configuring sorted destinations, including priority sorted destinations. FIFOor LIFO destinations are the most efficient. Destination sorting can be expensivewhen there are large message backlogs, even a backlog of a few hundred messagescan lower performance.
• Use careful selector design. See Filtering Messages in Developing JMS Applicationsfor Oracle WebLogic Server.
• Run applications on the same WebLogic Servers that are also hosting destinations.This eliminates networking and some or all marshalling overhead, and can heavilyreduce network and CPU usage. It also helps ensure that transactions are local to asingle server. This is one of the major advantages of using an application server'sembedded messaging.
13.2 Handling Large Message BacklogsWhen message senders inject messages faster than consumers, messages accumulateinto a message backlog. Large backlogs can be problematic for a number of reasons, forexample:
• Indicates consumers may not be capable of handling the incoming message load,are failing, or are not properly load balanced across a distributed queue.
• Can lead to out-of-memory on the server, which in turn prevents the server fromdoing any work.
• Can lead to high garbage collection (GC) overhead. A JVM's GC overhead ispartially proportional to the number of live objects in the JVM.
13.2.1 Improving Message Processing PerformanceOne area for investigation is to improve overall message processing performance.Here are some suggestions:
Handling Large Message Backlogs
Tuning WebLogic JMS 13-3
• Follow the JMS tuning recommendations as described in JMS Performance &Tuning Check List.
• Check for programming errors in newly developed applications. In particular,ensure that non-transactional consumers are acknowledging messages, thattransactional consumers are committing transactions, that plain javax.jmsapplications called javax.jms.Connection.start(), and that transactiontimeouts are tuned to reflect the needs of your particular application. Here aresome symptoms of programming errors: consumers are not receiving any messages(make sure they called start()), high "pending" counts for queues, alreadyprocessed persistent messages re-appearing after a shutdown and restart, andalready processed transactional messages re-appearing after a delay (the defaultJTA timeout is 30 seconds, default transacted session timeout is one hour).
• Check WebLogic statistics for queues that are not being serviced by consumers. Ifyou're having a problem with distributed queues, see Tuning Distributed Queues.
• Check WebLogic statistics for topics with high pending counts. This usuallyindicates that there are topic subscriptions that are not being serviced. There maybe a slow or unresponsive consumer client that's responsible for processing themessages, or it's possible that a durable subscription may no longer be needed andshould be deleted, or the messages may be accumulating due to delayeddistributed topic forwarding. You can check statistics for individual durablesubscriptions on the WebLogic Server Administration Console. A durablesubscription with a large backlog may have been created by an application butnever deleted. Unserviced durable subscriptions continue to accumulate topicmessages until they are either administratively destroyed, or unsubscribed by astandard JMS client.
• Understand distributed topic behavior when not all members are active. Indistributed topics, each produced message to a particular topic member isforwarded to each remote topic member. If a remote topic member is unavailablethen the local topic member will store each produced message for later forwarding.Therefore, if a topic member is unavailable for a long period of time, then largebacklogs can develop on the active members. In some applications, this backlog canbe addressed by setting expiration times on the messages. See Defining a MessageExpiration Policy.
• In certain applications it may be fine to automatically delete old unprocessedmessages. See Handling Expired Messages.
• For transactional MDBs, consider using MDB transaction batching as this can yielda 5 fold improvement in some use cases.
• Leverage distributed queues and add more JVMs to the cluster (in order to addmore distributed queue member instances). For example, split a 200,000 messagebacklog across 4 JVMs at 50,000 messages per JVM, instead of 100,000 messages perJVM.
• For client applications, use asynchronous consumers instead of synchronousconsumers when possible. Asynchronous consumers can have a significantly lowernetwork overhead, lower latency, and do not block a thread while waiting for amessage.
• For synchronous consumer client applications, consider: enabling prefetch, usingCLIENT_ACKNOWLEDGE to enable acknowledging multiple consumed messages ata time, and using DUPS_OK_ACKNOWLEDGE instead of AUTO_ACKNOWLEDGE.
Handling Large Message Backlogs
13-4 Tuning Performance of Oracle WebLogic Server
• For asynchronous consumer client applications, consider usingDUPS_OK_ACKNOWLEDGE instead of AUTO_ACKNOWLEDGE.
• Leverage batching. For example, include multiple messages in each transaction, orsend one larger message instead of many smaller messages.
• For non-durable subscriber client-side applications handling missing ("dropped")messages, investigate MULTICAST_NO_ACKNOWLEDGE. This mode broadcastsmessages concurrently to subscribers over UDP multicast.
13.2.2 Controlling Message ProductionAnother area for investigation is to slow down or even stop message production. Hereare some suggestions:
• Set lower quotas. See Defining Quota.
• Use fewer producer threads.
• Tune a sender blocking timeout that occurs during a quota condition, as described Blocking Senders During Quota Conditions. The timeout is tunable on connectionfactory.
• Tune producer flow control, which automatically slows down producer calls underthreshold conditions. See Controlling the Flow of Messages on JMS Servers andDestinations.
• Consider modifying the application to implement flow-control. For example, someapplications do not allow producers to inject more messages until a consumer hassuccessfully processed the previous batch of produced messages (a windowingprotocol). Other applications might implement a request/reply algorithm where anew request isn't submitted until the previous reply is received (essentially awindowing protocol with a window size of 1). In some cases, JMS tuning is notrequired as the synchronous flow from the RMI/EJB/Servlet is adequate.
13.2.2.1 Drawbacks to Controlling Message Production
Slowing down or stopping message processing has at least two potential drawbacks:
• It puts back-pressure on the down-stream flow that is calling the producer.Sometimes the down-stream flow cannot handle this back-pressure, and a hard-to-handle backlog develops behind the producer. The location of the backlog dependson what's calling the producer. For example, if the producer is being called by aservlet, the backlog might manifest as packets accumulating on the incomingnetwork socket or network card.
• Blocking calls on server threads can lead to thread-starvation, too many activethreads, or even dead-locks. Usually the key to address this problem is to ensurethat the producer threads are running in a size limited dedicated thread pool, asthis ensures that the blocking threads do not interfere with activity in other threadpools. For example, if an EJB or servlet is calling a "send" that might block for asignificant time: configure a custom work manager with a max threadsconstraint, and set the dispatch-policy of the EJB/servlet to reference thiswork-manager.
Handling Large Message Backlogs
Tuning WebLogic JMS 13-5

13.3 Cache and Re-use Client ResourcesJMS client resources are relatively expensive to create in comparison to sending andreceiving messages. These resources should be cached or pooled for re-use rather thanrecreating them with each message. They include contexts, destinations, connectionfactories, connections, sessions, consumers, or producers.
In addition, it is important for applications to close contexts, connections, sessions,consumers, or producers once they are completely done with these resources. Failingto close unused resources leads to a memory leak, which lowers overall JVMperformance and eventually may cause the JVM to fail with an out-of-memory error.Be aware that JNDI contexts have close() method, and that closing a JMS connectionautomatically efficiently closes all sessions, consumers, and producers created usingthe connection.
For server-side applications, WebLogic automatically wraps and pools JMS resourcesthat are accessed using a resource reference. See Enhanced Support for UsingWebLogic JMS with EJBs and Servlets in Developing JMS Applications for OracleWebLogic Server. This pooling code can be inefficient at pooling producers if the targetdestination changes frequently, but there's a simple work-around: use anonymousproducers by passing null for the destination when the application callscreateProducer() and then instead pass the desired destination into each sendcall.
• To check for heavy JMS resource allocation or leaks, you can monitor mbean statsand/or use your particular JVM's built in facilities. You can monitor mbean statsusing the console, WLST, or java code.
• Check JVM heap statistics for memory leaks or unexpectedly high allocationcounts.
• Similarly, check WebLogic statistics for memory leaks or unexpectedly highallocation counts.
13.4 Tuning Distributed QueuesIf produced messages are failing to load balance evenly across all distributed queuemembers, you may wish to change the configuration of your producer connectionfactories to disable server affinity (enabled by default).
Once created, a JMS consumer remains pinned to a particular queue member. This canlead to situations where consumers are not evenly load balanced across all distributedqueue members, particularly if new members become available after all consumershave been initialized. If consumers fail to load balance evenly across all distributedqueue members, the best option is to use an MDB that's targeted to a cluster designedto process the messages. WebLogic MDBs automatically ensure that all distributedqueue members are serviced. If MDBs are not an option, here are some suggestions toimprove consumer load balancing:
• Ensure that your application is creating enough consumers and the consumer'sconnection factory is tuned using the available load balancing options. Inparticular, consider disabling the default server affinity setting.)
• Change applications to periodically close and recreate consumers. This forcesconsumers to re-load balance.
Cache and Re-use Client Resources
13-6 Tuning Performance of Oracle WebLogic Server
• Consume from individual queue members instead of from the distributed queueslogical name. Each distributed queue member is individually advertised in JNDI asjms-server-name@distributed-destination-jndi-name.
• Configure the distributed queue to enable forwarding. Distributed queueforwarding automatically internally forwards messages that have been idled on amember destination without consumers to a member that has consumers. Thisapproach may not be practical for high message load applications.
Note:
Queue forwarding is not compatible with the WebLogic JMS Unit-of-Orderfeature, as it can cause messages to be delivered out of order.
See Using Distributed Destinations in Developing JMS Applications for OracleWebLogic Server and Configuring Advanced JMS System Resources in AdministeringJMS Resources for Oracle WebLogic Server.
13.5 Tuning TopicsThe following section provides information on how to tune WebLogic Topics:
• You may want to convert singleton topics to distributed topics. A distributed topicwith a Partitioned policy generally outperforms the Replicated policy choice.
• Oracle highly recommends leveraging MDBs to process Topic messages, especiallywhen working with Distributed Topics. MDBs automate the creation and servicingof multiple subscriptions and also provide high scalability options to automaticallydistribute the messages for a single subscription across multiple Distributed Topicmembers.
• There is a Sharable subscription extension that allows messages on a single topicsubscription to be processed in parallel by multiple subscribers on multiple JVMs.WebLogic MDBs leverage this feature when they are not in Compatibilitymode.
• If produced messages are failing to load balance evenly across the members of aPartitioned Distributed Topic, you may need to change the configuration of yourproducer connection factories to disable server affinity (enabled by default).
• Before using any of these previously mentioned advanced features, Oraclerecommends fully reviewing the following related documentation:
– Configuring and Deploying MDBs Using Distributed Topics in DevelopingMessage-Driven Beans for Oracle WebLogic Server
– Developing Advanced Pub/Sub Applications in Administering JMS Resources forOracle WebLogic Server
– Advanced Programming with Distributed Destinations Using the JMSDestination Availability Helper API in Administering JMS Resources for OracleWebLogic Server
Tuning Topics
Tuning WebLogic JMS 13-7
13.5.1 Tuning Non-durable Topic PublishersSince WebLogic Server 9.0, a non-durable topic message publish request may blockuntil the message is pushed to all consumers that are currently ready to process themessage. This may cause non-durable topic publishers with large numbers ofconsumers to take longer to publish a message than expected. To revert to a publishthat does not wait for consumers and waits only until it's confirmed the messagearrived on a JMS server, use the following property:
-Dweblogic.messaging.DisableTopicMultiSender=true
13.6 Tuning for Large MessagesThe following sections provide information on how to improve JMS performancewhen handling large messages:
• Tuning MessageMaximum
• Setting Maximum Message Size for Network Protocols
• Compressing Messages
• Paging Out Messages To Free Up Memory
13.7 Defining QuotaIt is highly recommended to always configure message count quotas. Quotas helpprevent large message backlogs from causing out-of-memory errors, and WebLogicJMS does not set quotas by default.
There are many options for setting quotas, but in most cases it is enough to simply seta Messages Maximum quota on each JMS Server rather than using destination levelquotas. Keep in mind that each current JMS message consumes JVM memory evenwhen the message has been paged out, because paging pages out only the messagebodies but not message headers. A good rule of thumb for queues is to assume thateach current JMS message consumes 512 bytes of memory. A good rule of thumb fortopics is to assume that each current JMS message consumes 256 bytes of memory plusan additional 256 bytes of memory for each subscriber that hasn't acknowledged themessage yet. For example, if there are 3 subscribers on a topic, then a single publishedmessage that hasn't been processed by any of the subscribers consumes 256 + 256*3 =1024 bytes even when the message is paged out. Although message header memoryusage is typically significantly less than these rules of thumb indicate, it is a bestpractice to make conservative estimates on memory utilization.
In prior releases, there were multiple levels of quotas: destinations had their ownquotas and would also have to compete for quota within a JMS server. In this release,there is only one level of quota: destinations can have their own private quota or theycan compete with other destinations using a shared quota.
In addition, a destination that defines its own quota no longer also shares space in theJMS server's quota. Although JMS servers still allow the direct configuration ofmessage and byte quotas, these options are only used to provide quota fordestinations that do not refer to a quota resource.
Tuning for Large Messages
13-8 Tuning Performance of Oracle WebLogic Server
13.7.1 Quota ResourcesA quota is a named configurable JMS module resource. It defines a maximum numberof messages and bytes, and is then associated with one or more destinations and isresponsible for enforcing the defined maximums. Multiple destinations referring tothe same quota share available quota according to the sharing policy for that quotaresource.
Quota resources include the following configuration parameters:
Table 13-1 Quota Parameters
Attribute Description
Bytes Maximum andMessages Maximum
The Messages Maximum/Bytes Maximum parameters for aquota resource defines the maximum number of messagesand/or bytes allowed for that quota resource. No considerationis given to messages that are pending; that is, messages that arein-flight, delayed, or otherwise inhibited from delivery still countagainst the message and/or bytes quota.
Quota Sharing The Shared parameter for a quota resource defines whethermultiple destinations referring to the same quota resourcecompete for resources with each other.
Quota Policy The Policy parameter defines how individual clients compete forquota when no quota is available. It affects the order in whichsend requests are unblocked when the Send Timeout feature isenabled on the connection factory, as described in Tuning forLarge Messages.
For more information about quota configuration parameters, see QuotaBean in theMBean Reference for Oracle WebLogic Server. For instructions on configuring a quotaresource using the WebLogic Server Administration Console, see Create a quota fordestinations in the Oracle WebLogic Server Administration Console Online Help.
13.7.2 Destination-Level QuotaDestinations no longer define byte and messages maximums for quota, but can use aquota resource that defines these values, along with quota policies on sharing andcompetition.
The Quota parameter of a destination defines which quota resource is used to enforcequota for the destination. This value is dynamic, so it can be changed at any time.However, if there are unsatisfied requests for quota when the quota resource ischanged, then those requests will fail with ajavax.jms.ResourceAllocationException.
Note:
Outstanding requests for quota will fail at such time that the quota resource ischanged. This does not mean changes to the message and byte attributes forthe quota resource, but when a destination switches to a different quota.
Defining Quota
Tuning WebLogic JMS 13-9
13.7.3 JMS Server-Level QuotaIn some cases, there will be destinations that do not configure quotas. JMS Serverquotas allow JMS servers to limit the resources used by these quota-less destinations.All destinations that do not explicitly set a value for the Quota attribute share thequota of the JMS server where they are deployed. The behavior is exactly the same asif there were a special Quota resource defined for each JMS server with the Sharedparameter enabled.
The interfaces for the JMS server quota are unchanged from prior releases. The JMSserver quota is entirely controlled using methods on the JMSServerMBean. The quotapolicy for the JMS server quota is set by the Blocking Send Policy parameter on a JMSserver, as explained in Specifying a Blocking Send Policy on JMS Servers. It behavesjust like the Policy setting of any other quota.
13.8 Blocking Senders During Quota Conditions• Defining a Send Timeout on Connection Factories
• Specifying a Blocking Send Policy on JMS Servers
13.8.1 Defining a Send Timeout on Connection FactoriesBlocking producers during quota conditions (by defining a send timeout) candramatically improve the performance of applications and benchmarks thatcontinuously retry message sends on quota failures. The Send Timeout featureprovides more control over message send operations by giving message produces theoption of waiting a specified length of time until space becomes available on adestination. For example, if a producer makes a request and there is insufficient space,then the producer is blocked until space becomes available, or the operation times out.See Controlling the Flow of Messages on JMS Servers and Destinations for anothermethod of flow control.
To use the WebLogic Server Administration Console to define how long a JMSconnection factory will block message requests when a destination exceeds itsmaximum quota.
1. Follow the directions for navigating to the JMS Connection Factory: Configuration:Flow Control page in Configure message flow control in the Oracle WebLogic ServerAdministration Console Online Help.
2. In the Send Timeout field, enter the amount of time, in milliseconds, a sender willblock messages when there is insufficient space on the message destination. Oncethe specified waiting period ends, one of the following results will occur:
• If sufficient space becomes available before the timeout period ends, theoperation continues.
• If sufficient space does not become available before the timeout period ends,you receive a resource allocation exception.
If you choose not to enable the blocking send policy by setting this value to 0,then you will receive a resource allocation exception whenever sufficient spaceis not available on the destination.
Blocking Senders During Quota Conditions
13-10 Tuning Performance of Oracle WebLogic Server

For more information about the Send Timeout field, see JMS ConnectionFactory: Configuration: Flow Control in the Oracle WebLogic ServerAdministration Console Online Help.
3. Click Save.
13.8.2 Specifying a Blocking Send Policy on JMS ServersThe Blocking Send policies enable you to define the JMS server's blocking behavior onwhether to deliver smaller messages before larger ones when multiple messageproducers are competing for space on a destination that has exceeded its messagequota.
To use the WebLogic Server Administration Console to define how a JMS server willblock message requests when its destinations are at maximum quota.
1. Follow the directions for navigating to the JMS Server: Configuration: Thresholdsand Quotas page of the WebLogic Server Administration Console in Configure JMSserver thresholds and quota in Oracle WebLogic Server Administration Console OnlineHelp.
2. From the Blocking Send Policy list box, select one of the following options:
• FIFO — All send requests for the same destination are queued up one behindthe other until space is available. No send request is permitted to completewhen there another send request is waiting for space before it.
• Preemptive — A send operation can preempt other blocking send operations ifspace is available. That is, if there is sufficient space for the current request, thenthat space is used even if there are previous requests waiting for space.
• For more information about the Blocking Send Policy field, see JMS Server:Configuration: Thresholds and Quota in the Oracle WebLogic ServerAdministration Console Online Help.
3. Click Save.
13.9 Tuning MessageMaximumWebLogic JMS pipelines messages that are delivered to asynchronous consumers(otherwise known as message listeners) or prefetch-enabled synchronous consumers.This action aids performance because messages are aggregated when they areinternally pushed from the server to the client. The messages backlog (the size of thepipeline) between the JMS server and the client is tunable by configuring theMessagesMaximum setting on the connection factory. See Asynchronous MessagePipeline in Developing JMS Applications for Oracle WebLogic Server.
In some circumstances, tuning the MessagesMaximum parameter may improveperformance dramatically, such as when the JMS application defers acknowledges orcommits. In this case, Oracle suggests setting the MessagesMaximum value to:
2 * (ack or commit interval) + 1
For example, if the JMS application acknowledges 50 messages at a time, set theMessagesMaximum value to 101.
13.9.1 Tuning MessageMaximum LimitationsTuning the MessagesMaximum value too high can cause:
Tuning MessageMaximum
Tuning WebLogic JMS 13-11
• Increased memory usage on the client.
• Affinity to an existing client as its pipeline fills with messages. For example: IfMessagesMaximum has a value of 10,000,000, the first consumer client to connectwill get all messages that have already arrived at the destination. This conditionleaves other consumers without any messages and creates an unnecessary backlogof messages in the first consumer that may cause the system to run out of memory.
• Packet is too large exceptions and stalled consumers. If the aggregate size of themessages pushed to a consumer is larger than the current protocol's maximummessage size (default size is 10 MB and is configured on a per WebLogic Serverinstance basis using the console and on a per client basis using the -Dweblogic.MaxMessageSize command line property), the message deliveryfails.
13.10 Setting Maximum Message Size for Network ProtocolsYou may need to configure WebLogic clients in addition to the WebLogic Serverinstances, when sending and receiving large messages.
For most protocols, including T3, WLS limits the size of a network call to 10MB bydefault. If individual JMS message sizes exceed this limit, or if a set of JMS messagesthat is batched into the same network call exceeds this limit, this can lead to either"packet too large exceptions" and/or stalled consumers. Asynchronous consumers cancause multiple JMS messages to batch into the same network call, to control this batchsize, see Tuning MessageMaximum Limitations.
To set the maximum message size on a server instance, tune the maximum messagesize for each supported protocol on a per protocol basis for each involved defaultchannel or custom channel. In this context the word 'message' refers to all networkcalls over the given protocol, not just JMS calls.
To set the maximum message size on a client, use the following command lineproperty:
-Dweblogic.MaxMessageSize
Note:
This setting applies to all WebLogic Server network packets delivered to theclient, not just JMS related packets.
13.11 Compressing MessagesA message compression threshold can be set programmatically using a JMS APIextension to the WLMessageProducer interface, or administratively by eitherspecifying a Default Compression Threshold value on a connection factory or on a JMSSAF remote context. Compressed messages may actually inadvertently affectdestination quotas since some message types actually grow larger when compressed
For instructions on configuring default compression thresholds using the WebLogicServer Administration Console, see:
• Connection factories — Configure default delivery parameters in the OracleWebLogic Server Administration Console Online Help.
Setting Maximum Message Size for Network Protocols
13-12 Tuning Performance of Oracle WebLogic Server

• Store-and-Forward (SAF) remote contexts — Configure SAF remote contexts in theOracle WebLogic Server Administration Console Online Help.
Once configured, message compression is triggered on producers for client sends, onconnection factories for message receives and message browsing, or through SAFforwarding. Messages are compressed using GZIP. Compression only occurs whenmessage producers and consumers are located on separate server instances wheremessages must cross a JVM boundary, typically across a network connection whenWebLogic domains reside on different machines. Decompression automatically occurson the client side and only when the message content is accessed, except for thefollowing situations:
• Using message selectors on compressed XML messages can cause decompression,since the message body must be accessed in order to filter them. For moreinformation on defining XML message selectors, see Filtering Messages inDeveloping JMS Applications for Oracle WebLogic Server.
• Interoperating with earlier versions of WebLogic Server can cause decompression.For example, when using the Messaging Bridge, messages are decompressed whensent from the current release of WebLogic Server to a receiving side that is anearlier version of WebLogic Server.
On the server side, messages always remains compressed, even when they are writtento disk.
13.12 Paging Out Messages To Free Up MemoryWith the message paging feature, JMS servers automatically attempt to free up virtualmemory during peak message load periods. This feature can greatly benefitapplications with large message spaces. Message paging is always enabled on JMSservers, and so a message paging directory is automatically created without having toconfigure one. You can, however, specify a directory using the Paging Directoryoption, then paged-out messages are written to files in this directory.
In addition to the paging directory, a JMS server uses either a file store or a JDBC storefor persistent message storage. The file store can be user-defined or the server's defaultstore. Paged JDBC store persistent messages are copied to both the JDBC store as wellas the JMS Server's paging directory. Paged file store persistent messages that aresmall are copied to both the file store as well as the JMS Server's paging directory.Paged larger file store messages are not copied into the paging directory. See BestPractices When Using Persistent Stores.
However, a paged-out message does not free all of the memory that it consumes, sincethe message header with the exception of any user properties, which are paged outalong with the message body, remains in memory for use with searching, sorting, andfiltering. Queuing applications that use selectors to select paged messages may showseverely degraded performance as the paged out messages must be paged back in.This does not apply to topics or to applications that select based only on messageheader fields (such as CorrelationID). A good rule of thumb is to conservativelyassume that messages each use 512 bytes of JVM memory even when paged out.
13.12.1 Specifying a Message Paging DirectoryIf a paging directory is not specified, then paged-out message bodies are written to thedefault \tmp directory inside the servername subdirectory of a domain's root directory.For example, if no directory name is specified for the default paging directory, itdefaults to:
Paging Out Messages To Free Up Memory
Tuning WebLogic JMS 13-13

oracle_home\user_projects\domains\domainname\servers\servername\tmp
where domainname is the root directory of your domain, typically c:\Oracle\Middleware\Oracle_Home\user_projects\domains\domainname, which isparallel to the directory in which WebLogic Server program files are stored, typicallyc:\Oracle\Middleware\Oracle_Home\wlserver.
To configure the Message Paging Directory attribute, see "Configure general JMSserver properties" in Oracle WebLogic Server Administration Console Online Help.
13.12.2 Tuning the Message Buffer Size OptionThe Message Buffer Size option specifies the amount of memory that will be used tostore message bodies in memory before they are paged out to disk. The default valueof Message Buffer Size is approximately one-third of the maximum heap size for theJVM, or a maximum of 512 megabytes. The larger this parameter is set, the morememory JMS will consume when many messages are waiting on queues or topics.Once this threshold is crossed, JMS may write message bodies to the directoryspecified by the Paging Directory option in an effort to reduce memory usage belowthis threshold.
It is important to remember that this parameter is not a quota. If the number ofmessages on the server passes the threshold, the server writes the messages to diskand evicts the messages from memory as fast as it can to reduce memory usage, but itwill not stop accepting new messages. It is still possible to run out of memory ifmessages are arriving faster than they can be paged out. Users with high messagingloads who wish to support the highest possible availability should consider setting aquota, or setting a threshold and enabling flow control to reduce memory usage on theserver.
13.13 Controlling the Flow of Messages on JMS Servers and DestinationsWith the Flow Control feature, you can direct a JMS server or destination to slowdown message producers when it determines that it is becoming overloaded. See Compressing Messages.
The following sections describe how flow control feature works and how to configureflow control on a connection factory.
• How Flow Control Works
• Configuring Flow Control
• Flow Control Thresholds
13.13.1 How Flow Control WorksSpecifically, when either a JMS server or it's destinations exceeds its specified byte ormessage threshold, it becomes armed and instructs producers to limit their messageflow (messages per second).
Producers will limit their production rate based on a set of flow control attributesconfigured for producers via the JMS connection factory. Starting at a specified flowmaximum number of messages, a producer evaluates whether the server/destination isstill armed at prescribed intervals (for example, every 10 seconds for 60 seconds). If ateach interval, the server/destination is still armed, then the producer continues tomove its rate down to its prescribed flow minimum amount.
Controlling the Flow of Messages on JMS Servers and Destinations
13-14 Tuning Performance of Oracle WebLogic Server
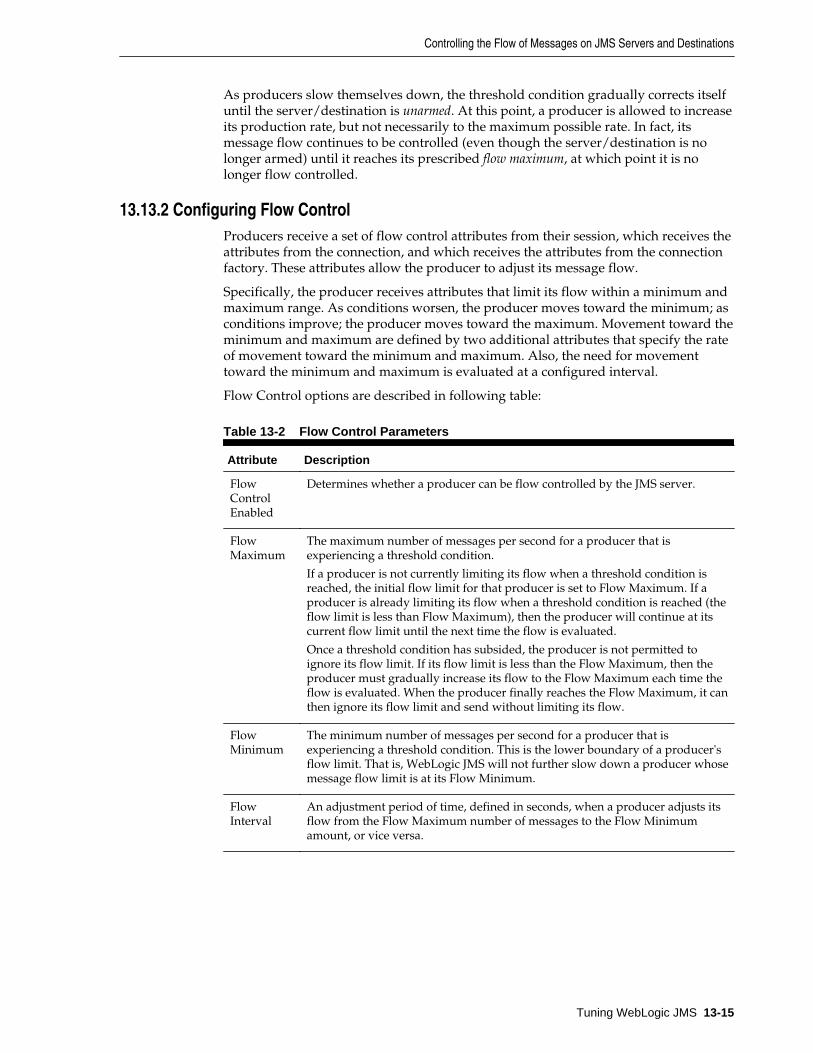
As producers slow themselves down, the threshold condition gradually corrects itselfuntil the server/destination is unarmed. At this point, a producer is allowed to increaseits production rate, but not necessarily to the maximum possible rate. In fact, itsmessage flow continues to be controlled (even though the server/destination is nolonger armed) until it reaches its prescribed flow maximum, at which point it is nolonger flow controlled.
13.13.2 Configuring Flow ControlProducers receive a set of flow control attributes from their session, which receives theattributes from the connection, and which receives the attributes from the connectionfactory. These attributes allow the producer to adjust its message flow.
Specifically, the producer receives attributes that limit its flow within a minimum andmaximum range. As conditions worsen, the producer moves toward the minimum; asconditions improve; the producer moves toward the maximum. Movement toward theminimum and maximum are defined by two additional attributes that specify the rateof movement toward the minimum and maximum. Also, the need for movementtoward the minimum and maximum is evaluated at a configured interval.
Flow Control options are described in following table:
Table 13-2 Flow Control Parameters
Attribute Description
FlowControlEnabled
Determines whether a producer can be flow controlled by the JMS server.
FlowMaximum
The maximum number of messages per second for a producer that isexperiencing a threshold condition.
If a producer is not currently limiting its flow when a threshold condition isreached, the initial flow limit for that producer is set to Flow Maximum. If aproducer is already limiting its flow when a threshold condition is reached (theflow limit is less than Flow Maximum), then the producer will continue at itscurrent flow limit until the next time the flow is evaluated.
Once a threshold condition has subsided, the producer is not permitted toignore its flow limit. If its flow limit is less than the Flow Maximum, then theproducer must gradually increase its flow to the Flow Maximum each time theflow is evaluated. When the producer finally reaches the Flow Maximum, it canthen ignore its flow limit and send without limiting its flow.
FlowMinimum
The minimum number of messages per second for a producer that isexperiencing a threshold condition. This is the lower boundary of a producer'sflow limit. That is, WebLogic JMS will not further slow down a producer whosemessage flow limit is at its Flow Minimum.
FlowInterval
An adjustment period of time, defined in seconds, when a producer adjusts itsflow from the Flow Maximum number of messages to the Flow Minimumamount, or vice versa.
Controlling the Flow of Messages on JMS Servers and Destinations
Tuning WebLogic JMS 13-15
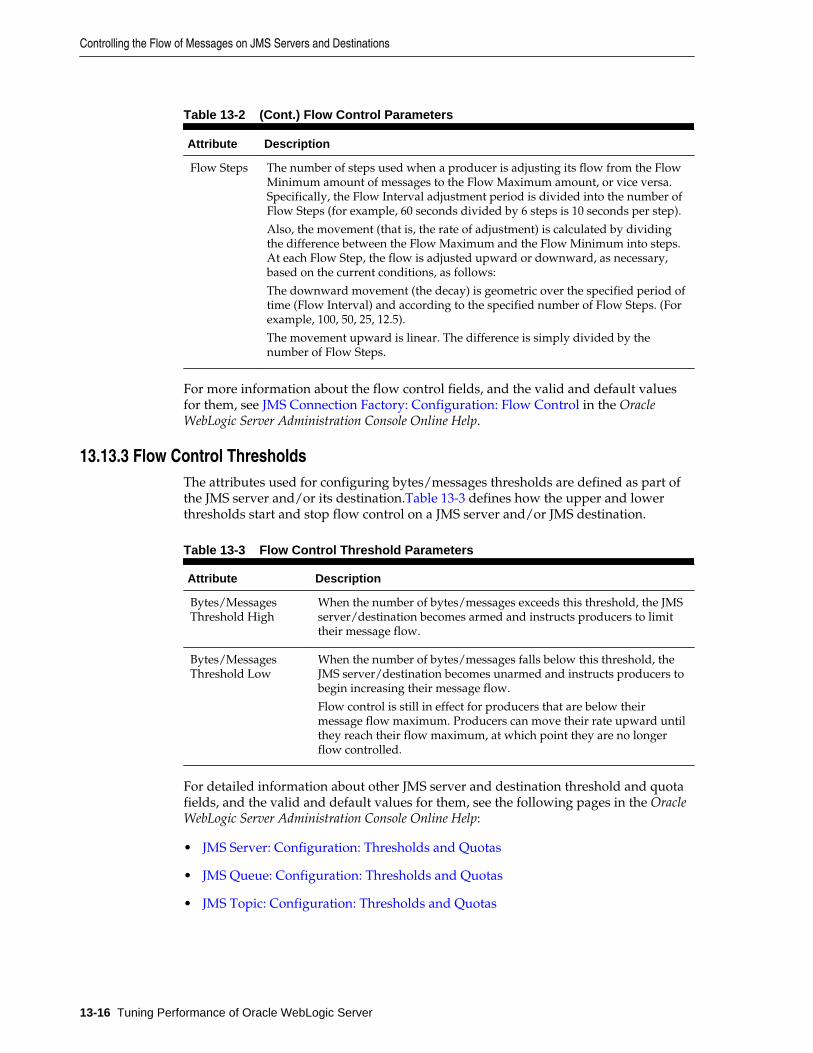
Table 13-2 (Cont.) Flow Control Parameters
Attribute Description
Flow Steps The number of steps used when a producer is adjusting its flow from the FlowMinimum amount of messages to the Flow Maximum amount, or vice versa.Specifically, the Flow Interval adjustment period is divided into the number ofFlow Steps (for example, 60 seconds divided by 6 steps is 10 seconds per step).
Also, the movement (that is, the rate of adjustment) is calculated by dividingthe difference between the Flow Maximum and the Flow Minimum into steps.At each Flow Step, the flow is adjusted upward or downward, as necessary,based on the current conditions, as follows:
The downward movement (the decay) is geometric over the specified period oftime (Flow Interval) and according to the specified number of Flow Steps. (Forexample, 100, 50, 25, 12.5).
The movement upward is linear. The difference is simply divided by thenumber of Flow Steps.
For more information about the flow control fields, and the valid and default valuesfor them, see JMS Connection Factory: Configuration: Flow Control in the OracleWebLogic Server Administration Console Online Help.
13.13.3 Flow Control ThresholdsThe attributes used for configuring bytes/messages thresholds are defined as part ofthe JMS server and/or its destination.Table 13-3 defines how the upper and lowerthresholds start and stop flow control on a JMS server and/or JMS destination.
Table 13-3 Flow Control Threshold Parameters
Attribute Description
Bytes/MessagesThreshold High
When the number of bytes/messages exceeds this threshold, the JMSserver/destination becomes armed and instructs producers to limittheir message flow.
Bytes/MessagesThreshold Low
When the number of bytes/messages falls below this threshold, theJMS server/destination becomes unarmed and instructs producers tobegin increasing their message flow.
Flow control is still in effect for producers that are below theirmessage flow maximum. Producers can move their rate upward untilthey reach their flow maximum, at which point they are no longerflow controlled.
For detailed information about other JMS server and destination threshold and quotafields, and the valid and default values for them, see the following pages in the OracleWebLogic Server Administration Console Online Help:
• JMS Server: Configuration: Thresholds and Quotas
• JMS Queue: Configuration: Thresholds and Quotas
• JMS Topic: Configuration: Thresholds and Quotas
Controlling the Flow of Messages on JMS Servers and Destinations
13-16 Tuning Performance of Oracle WebLogic Server
13.14 Handling Expired MessagesThe following sections describe two message expiration features, the messageExpiration Policy and the Active Expiration of message, which provide more controlover how the system searches for expired messages and how it handles them whenthey are encountered.
Active message expiration ensures that expired messages are cleaned up immediately.Moreover, expired message auditing gives you the option of tracking expiredmessages, either by logging when a message expires or by redirecting expiredmessages to a defined error destination.
• Defining a Message Expiration Policy
• Tuning Active Message Expiration
13.14.1 Defining a Message Expiration PolicyUse the message Expiration Policy feature to define an alternate action to take whenmessages expire. Using the Expiration Policy attribute on the Destinations node, anexpiration policy can be set on a per destination basis. The Expiration Policy attributedefines the action that a destination should take when an expired message isencountered: discard the message, discard the message and log its removal, or redirectthe message to an error destination.
Also, if you use JMS templates to configure multiple destinations, you can use theExpiration Policy field to quickly configure an expiration policy on all yourdestinations. To override a template's expiration policy for specific destinations, youcan modify the expiration policy on any destination.
For instructions on configuring the Expiration Policy, click one of the following links:
• Configuring an Expiration Policy on Topics
• Configuring an Expiration Policy on Queues
• Configuring an Expiration Policy on Templates
• Defining an Expiration Logging Policy
13.14.2 Configuring an Expiration Policy on TopicsFollow these directions if you are configuring an expiration policy on topics withoutusing a JMS template. Expiration policies that are set on specific topics will overridethe settings defined on a JMS template.
1. Follow the directions for navigating to the JMS Topic: Configuration: DeliveryFailure page in Configure topic message delivery failure options in the OracleWebLogic Server Administration Console Online Help.
2. From the Expiration Policy list box, select an expiration policy option.
• Discard — Expired messages are removed from the system. The removal is notlogged and the message is not redirected to another location.
• Log — Removes expired messages and writes an entry to the server log fileindicating that the messages were removed from the system. You define the
Handling Expired Messages
Tuning WebLogic JMS 13-17

actual information that will be logged in the Expiration Logging Policy field innext step.
• Redirect — Moves expired messages from their current location into the ErrorDestination defined for the topic.
For more information about the Expiration Policy options for a topic, see JMSTopic: Configuration: Delivery Failure in the Oracle WebLogic ServerAdministration Console Online Help.
3. If you selected the Log expiration policy in previous step, use the ExpirationLogging Policy field to define what information about the message is logged.
For more information about valid Expiration Logging Policy values, see Definingan Expiration Logging Policy.
4. Click Save.
13.14.3 Configuring an Expiration Policy on QueuesFollow these directions if you are configuring an expiration policy on queues withoutusing a JMS template. Expiration policies that are set on specific queues will overridethe settings defined on a JMS template.
1. Follow the directions for navigating to the JMS Queue: Configuration: DeliveryFailure page in Configure queue message delivery failure options in the OracleWebLogic Server Administration Console Online Help.
2. From the Expiration Policy list box, select an expiration policy option.
• Discard — Expired messages are removed from the system. The removal is notlogged and the message is not redirected to another location.
• Log — Removes expired messages from the queue and writes an entry to theserver log file indicating that the messages were removed from the system. Youdefine the actual information that will be logged in the Expiration LoggingPolicy field described in the next step.
• Redirect — Moves expired messages from the queue and into the ErrorDestination defined for the queue.
• For more information about the Expiration Policy options for a queue, see JMSQueue: Configuration: Delivery Failure in the Oracle WebLogic ServerAdministration Console Online Help.
3. If you selected the Log expiration policy in the previous step, use the ExpirationLogging Policy field to define what information about the message is logged.
For more information about valid Expiration Logging Policy values, see Definingan Expiration Logging Policy.
4. Click Save
13.14.4 Configuring an Expiration Policy on TemplatesSince JMS templates provide an efficient way to define multiple destinations (topics orqueues) with similar attribute settings, you can configure a message expiration policyon an existing template (or templates) for your destinations.
Handling Expired Messages
13-18 Tuning Performance of Oracle WebLogic Server
1. Follow the directions for navigating to the JMS Template: Configuration: DeliveryFailure page in Configure JMS template message delivery failure options in theOracle WebLogic Server Administration Console Online Help.
2. In the Expiration Policy list box, select an expiration policy option.
• Discard — Expired messages are removed from the messaging system. Theremoval is not logged and the message is not redirected to another location.
• Log — Removes expired messages and writes an entry to the server log fileindicating that the messages were removed from the system. The actualinformation that is logged is defined by the Expiration Logging Policy fielddescribed in the next step.
• Redirect — Moves expired messages from their current location into the ErrorDestination defined for the destination.
• For more information about the Expiration Policy options for a template, see JMS Template: Configuration: Delivery Failure in the Oracle WebLogic ServerAdministration Console Online Help.
3. If you selected the Log expiration policy in Step 4, use the Expiration LoggingPolicy field to define what information about the message is logged.
For more information about valid Expiration Logging Policy values, see Definingan Expiration Logging Policy.
4. Click Save.
13.14.5 Defining an Expiration Logging PolicyThe following section provides information on the expiration policy.
The Expiration Logging Policy parameter has been deprecated in this release ofWebLogic Server. In its place, Oracle recommends using the Message Life CycleLogging feature, which provide a more comprehensive view of the basic events thatJMS messages will traverse through once they are accepted by a JMS server, includingdetailed message expiration data. For more information about message life cyclelogging options, see Message Life Cycle Logging in Administering JMS Resources forOracle WebLogic Server.
For example, you could specify one of the following values:
• JMSPriority, Name, Address, City, State, Zip
• %header%, Name, Address, City, State, Zip
• JMSCorrelationID, %properties%
The JMSMessageID field is always logged and cannot be turned off. Therefore, if theExpiration Policy is not defined (that is, none) or is defined as an empty string, thenthe output to the log file contains only the JMSMessageID of the message.
13.14.6 Expiration Log Output FormatWhen an expired message is logged, the text portion of the message (not includingtimestamps, severity, thread information, security identity, etc.) conforms to thefollowing format:
Handling Expired Messages
Tuning WebLogic JMS 13-19
<ExpiredJMSMessage JMSMessageId='$MESSAGEID' > <HeaderFields Field1='Value1' [Field2='Value2'] … ] /> <UserProperties Property1='Value1' [Property='Value2'] … ] /></ExpiredJMSMessage>
where $MESSAGEID is the exact string returned by Message.getJMSMessageID().
For example:
<ExpiredJMSMessage JMSMessageID='ID:P<851839.1022176920343.0' > <HeaderFields JMSPriority='7' JMSRedelivered='false' /> <UserProperties Make='Honda' Model='Civic' Color='White'Weight='2680' /></ExpiredJMSMessage>
If no header fields are displayed, the line for header fields is not be displayed. If nouser properties are displayed, that line is not be displayed. If there are no header fieldsand no properties, the closing </ExpiredJMSMessage> tag is not necessary as theopening tag can be terminated with a closing bracket (/>).
For example:
<ExpiredJMSMessage JMSMessageID='ID:N<223476.1022177121567.1' />
All values are delimited with double quotes. All string values are limited to 32characters in length. Requested fields and/or properties that do not exist are notdisplayed. Requested fields and/or properties that exist but have no value (a nullvalue) are displayed as null (without single quotes). Requested fields and/orproperties that are empty strings are displayed as a pair of single quotes with no spacebetween them.
For example:
<ExpiredJMSMessage JMSMessageID='ID:N<851839.1022176920344.0' > <UserProperties First='Any string longer than 32 char ...' Second=null Third='' /></ExpiredJMSMessage>
13.14.7 Tuning Active Message ExpirationUse the Active Expiration feature to define the timeliness in which expired messagesare removed from the destination to which they were sent or published. Messages arenot necessarily removed from the system at their expiration time, but they areremoved within a user-defined number of seconds. The smaller the window, the closerthe message removal is to the actual expiration time.
13.14.8 Configuring a JMS Server to Actively Scan Destinations for Expired MessagesFollow these directions to define how often a JMS server will actively scan itsdestinations for expired messages. The default value is 30 seconds, which means theJMS server waits 30 seconds between each scan interval.
1. Follow the directions for navigating to the JMS Server: Configuration: General pageof the WebLogic Server Administration Console in Configure general JMS serverproperties in the Oracle WebLogic Server Administration Console Online Help.
2. In the Scan Expiration Interval field, enter the amount of time, in seconds, that youwant the JMS server to pause between its cycles of scanning its destinations forexpired messages to process.
To disable active scanning, enter a value of 0 seconds. Expired messages arepassively removed from the system as they are discovered.
Handling Expired Messages
13-20 Tuning Performance of Oracle WebLogic Server

For more information about the Expiration Scan Interval attribute, see JMS Server:Configuration: General in the Oracle WebLogic Server Administration Console OnlineHelp.
3. Click Save.
There are a number of design choices that impact performance of JMS applications.Some others include reliability, scalability, manageability, monitoring, usertransactions, message driven bean support, and integration with an application server.In addition, there are WebLogic JMS extensions and features have a direct impact onperformance.
For more information on designing your applications for JMS, see Best Practices forApplication Design in Developing JMS Applications for Oracle WebLogic Server.
13.15 Tuning Applications Using Unit-of-OrderMessage Unit-of-Order is a WebLogic Server value-added feature that enables a stand-alone message producer, or a group of producers acting as one, to group messagesinto a single unit with respect to the processing order (a sub-ordering). This single unitis called a Unit-of-Order (or UOO) and requires that all messages from that unit beprocessed sequentially in the order they were created. UOO replaces the followingcomplex design patterns:
• A dedicated consumer with a unique selector per each sub-ordering
• A new destination per sub-ordering, one consumer per destination.
See Using Message Unit-of-Order in Developing JMS Applications for Oracle WebLogicServer.
13.15.1 Best PracticesThe following sections provide best practice information when using UOO:
• Ideal for applications that have strict message ordering requirements. UOOsimplifies administration and application design, and in most applicationsimproves performance.
• Use MDB batching to:
– Speed-up processing of the messages within a single sub-ordering.
– Consume multiple messages at a time under the same transaction.
See Tuning Message-Driven Beans.
• You can configure a default UOO for the destination. Only one consumer on thedestination processes messages for the default UOO at a time.
13.15.2 Using UOO and Distributed DestinationsTo ensure strict ordering when using distributed destinations, each different UOO ispinned to a specific physical destination instance. There are two options forautomatically determining the correct physical destination for a given UOO:
• Hashing – Is generally faster and the UOO setting. Hashing works by using a hashfunction on the UOO name to determine the physical destination. It has thefollowing drawbacks:
Tuning Applications Using Unit-of-Order
Tuning WebLogic JMS 13-21

– It doesn't correctly handle the administrative deleting or adding physicaldestinations to a distributed destination.
– If a UOO hashes to an unavailable destination, the message send fails.
• Path Service – Is a single server UOO directory service that maps the physicaldestination for each UOO. The Path Service is generally slower than hashing ifthere are many differently named UOO created per second. In this situation, eachnew UOO name implicitly forces a check of the path service before sending themessage. If the number of UOOs created per second is limited, Path Serviceperformance is not an issue as the UOO paths are cached throughout the cluster.
13.15.3 Migrating Old Applications to Use UOOFor releases prior to WebLogic Server 9.0, applications that had strict messageordering requirements were required to do the following:
• Use a single physical destination with a single consumer
• Ensure the maximum asynchronous consumer message backlog (TheMessagesMaximum parameter on the connection factory) was set to a value of 1.
UOO relaxes these requirements significantly as it allows for multiple consumers andallows for a asynchronous consumer message backlog of any size. To migrate olderapplications to take advantage of UOO, simply configure a default UOO name on thephysical destination. See Configure connection factory unit-of-order parameters inOracle WebLogic Server Administration Console Online Help and Ordered Redelivery ofMessages in Developing JMS Applications for Oracle WebLogic Server.
13.16 Using One-Way Message SendsOne-way message sends can greatly improve the performance of applications that arebottle-necked by senders, but do so at the risk of introducing a lower QOS (quality-of-service). Typical message sends from a JMS producer are termed two-way sendsbecause they include both an internal request and an internal response. When anproducer application calls send(), the call generates a request that contains theapplication's message and then waits for a response from the JMS server to confirm itsreceipt of the message. This call-and-response mechanism regulates the producer,since the producer is forced to wait for the JMS server's response before theapplication can make another send call. Eliminating the response message eliminatesthis wait, and yields a one-way send. WebLogic Server supports a configurable one-waysend option for non-persistent, non-transactional messaging; no application codechanges are required to leverage this feature.
By enabling the One-Way Send Mode options, you allow message producers createdby a user-defined connection factory to do one-way message sends, when possible.When active, the associated producers can send messages without internally waitingfor a response from the target destination's host JMS server. You can choose to allowqueue senders and topic publishers to do one-way sends, or to limit this capability totopic publishers only. You must also specify a One-Way Window Size to determinewhen a two-way message is required to regulate the producer before it can continuemaking additional one-way sends.
13.16.1 Configure One-Way Sends On a Connection FactoryYou configure one-way message send parameters on a connection factory by using theWebLogic Server Administration Console, as described in Configure connection
Using One-Way Message Sends
13-22 Tuning Performance of Oracle WebLogic Server

factory flow control in the Oracle WebLogic Server Administration Console Online Help.You can also use the WebLogic Scripting Tool (WLST) or JMX via the FlowControlParamsBean MBean.
Note:
One-way message sends are disabled if your connection factory is configuredwith "XA Enabled". This setting disables one-way sends whether or not thesender actually uses transactions.
13.16.2 One-Way Send Support In a Cluster With a Single DestinationTo ensure one-way send support in a cluster with a single destination, verify that theconnection factory and the JMS server hosting the destination are targeted to the sameWebLogic server. The connection factory must not be targeted to any other WebLogicServer instances in the cluster.
13.16.3 One-Way Send Support In a Cluster With Multiple DestinationsTo ensure one-way send support in a cluster with multiple destinations that share thesame name, special care is required to ensure the WebLogic Server instance that hoststhe client connection also hosts the destination. One solution is the following:
1. Configure the cluster wide RMI load balancing algorithm to "Server Affinity".
2. Ensure that no two destinations are hosted on the same WebLogic Server instance.
3. Configure each destination to have the same local-jndi-name.
4. Configure a connection factory that is targeted to only those WebLogic Serverinstances that host the destinations.
5. Ensure sender clients use the JNDI names configured in Steps 3 and 4 to obtaintheir destination and connection factory from their JNDI context.
6. Ensure sender clients use URLs limited to only those WebLogic Server instancesthat host the destinations in Step 3.
This solution disables RMI-level load balancing for clustered RMI objects, whichincludes EJB homes and JMS connection factories. Effectively, the client will obtain aconnection and destination based only on the network address used to establish theJNDI context. Load balancing can be achieved by leveraging network load balancing,which occurs for URLs that include a comma-separated list of WebLogic Serveraddresses, or for URLs that specify a DNS name that resolves to a round-robin set ofIP addresses (as configured by a network administrator).
For more information on Server Affinity for clusters, see Load Balancing for EJBs andRMI Objects in Administering Clusters for Oracle WebLogic Server.
13.16.4 When One-Way Sends Are Not SupportedThis section defines when one-way sends are not supported. When one-ways are notsupported, the send QOS is automatically upgraded to standard two-ways.
Using One-Way Message Sends
Tuning WebLogic JMS 13-23

13.16.5 Different Client and Destination HostsOne-way sends are supported when the client producer's connection host and the JMSserver hosting the target destination are the same WebLogic Server instance;otherwise, the one-way mode setting will ignored and standard two-way sends will beused instead.
13.16.6 XA Enabled On Client's Host Connection FactoryOne-way message sends are disabled if the client's host connection factory isconfigured with XA Enabled. This setting disables one-way sends whether or not thesender actually uses transactions.
13.16.7 Higher QOS DetectedWhen the following higher QOS features are detected, then the one-way mode settingwill be ignored and standard two-way sends will be used instead:
• XA
• Transacted sessions
• Persistent messaging
• Unit-of-order
• Unit-of-work
• Distributed destinations
13.16.8 Destination Quota ExceededWhen the specified quota is exceeded on the targeted destination, then standard two-way sends will be used until the quota clears.
One-way messages that exceed quota are silently deleted, without immediatelythrowing exceptions back to the client. The client will eventually get a quota exceptionif the destination is still over quota at the time the next two-way send occurs. (Even inone-way mode, clients will send a two-way message every One Way Send Window Sizenumber of messages configured on the client's connection factory.)
A workaround that helps avoid silently-deleted messages during quota conditions isto increase the value of the Blocking Send Timeout configured on the connectionfactory, as described in Compressing Messages. The one-way messages will not bedeleted immediately, but instead will optimistically wait on the JMS server for thespecified time until the quota condition clears (presumably due to messages gettingconsumed or by messages expiring). The client sender will not block until it sends atwo-way message. For each client, no more than One Way Window Size messages willaccumulate on the server waiting for quota conditions to clear.
13.16.9 Change In Server Security PolicyA change in the server-side security policy could prevent one-way message sendswithout notifying the JMS client of the change in security status.
Using One-Way Message Sends
13-24 Tuning Performance of Oracle WebLogic Server

13.16.10 Change In JMS Server or Destination StatusOne-way sends can be disabled when a host JMS server or target destination isadministratively undeployed, or when message production is paused on either theJMS server or the target destination using the "Production Pause/Resume" feature. See Production Pause and Production Resume in Administering JMS Resources for OracleWebLogic Server.
13.16.11 Looking Up Logical Distributed Destination NameOne-way message sends work with distributed destinations provided the client looksup the physical distributed destination members directly rather than using the logicaldistributed destination's name. See Using Distributed Destinations in Developing JMSApplications for Oracle WebLogic Server.
13.16.12 Hardware FailureA hardware or network failure will disable one-way sends. In such cases, the JMSproducer is notified by an OnException or by the next two-way message send. (Evenin one-way mode, clients will send a two-way message every One Way Send WindowSize number of messages configured on the client's connection factory.) The producerwill be closed. The worst-case scenario is that all messages can be lost up to the lasttwo-way message before the failure occurred.
13.16.13 One-Way Send QOS GuidelinesUse the following QOS-related guidelines when using the one-way send mode fortypical non-persistent messaging.
• When used in conjunction with the Blocking Sends feature, then using one-waysends on a well-running system should achieve similar QOS as when using thetwo-way send mode.
• One-way send mode for topic publishers falls within the QOS guidelines set by theJMS Specification, but does entail a lower QOS than two-way mode (the WebLogicServer default mode).
• One-way send mode may not improve performance if JMS consumer applicationsare a system bottleneck, as described in Asynchronous vs. Synchronous Consumersin Developing JMS Applications for Oracle WebLogic Server.
• Consider enlarging the JVM's heap size on the client and/or server to account forincreased batch size (the Window) of sends. The potential memory usage isproportioned to the size of the configured Window and the number of senders.
• The sending application will not receive all quota exceptions. One-way messagesthat exceed quota are silently deleted, without throwing exceptions back to thesending client. See Destination Quota Exceeded for more information and apossible work around.
• Configuring one-way sends on a connection factory effectively disables anymessage flow control parameters configured on the connection factory.
• By default, the One-way Window Size is set to "1", which effectively disables one-way sends as every one-way message will be upgraded to a two-way send. (Evenin one-way mode, clients will send a two-way message every One Way Send
Using One-Way Message Sends
Tuning WebLogic JMS 13-25
Window Size number of messages configured on the client's connection factory.)Therefore, you must set the one-way send window size much higher. It isrecommended to try setting the window size to "300" and then adjust it accordingto your application requirements.
• The client application will not immediately receive network or server failureexceptions, some messages may be sent but silently deleted until the failure isdetected by WebLogic Server and the producer is automatically closed. See Hardware Failure for more information.
13.17 Tuning the Messaging Performance Preference Option
Note:
This is an advanced option for fine tuning. It is normally best to explore othertuning options first.
The Messaging Performance Preference tuning option on JMS destinations enables youto control how long a destination should wait (if at all) before creating full batches ofavailable messages for delivery to consumers. At the minimum value, batching isdisabled. Tuning above the default value increases the amount of time a destination iswilling to wait before batching available messages. The maximum message count of afull batch is controlled by the JMS connection factory's Messages Maximum perSession setting.
Using the WebLogic Server Administration Console, this advanced option is availableon the General Configuration page for both standalone and uniform distributeddestinations (or via the DestinationBean API), as well as for JMS templates (or viathe TemplateBean API).
Specifically, JMS destinations include internal algorithms that attempt to automaticallyoptimize performance by grouping messages into batches for delivery to consumers.In response to changes in message rate and other factors, these algorithms changebatch sizes and delivery times. However, it isn't possible for the algorithms tooptimize performance for every messaging environment. The Messaging PerformancePreference tuning option enables you to modify how these algorithms react to changesin message rate and other factors so that you can fine-tune the performance of yoursystem.
13.17.1 Messaging Performance Configuration ParametersThe Message Performance Preference option includes the following configurationparameters:
Table 13-4 Message Performance Preference Values
WebLogic ServerAdministration ConsoleValue
MBeanValue
Description
Do Not Batch Messages 0 Effectively disables message batching. Availablemessages are promptly delivered to consumers.
This is equivalent to setting the value of theconnection factory's Messages Maximum perSession field to "1".
Tuning the Messaging Performance Preference Option
13-26 Tuning Performance of Oracle WebLogic Server
Table 13-4 (Cont.) Message Performance Preference Values
WebLogic ServerAdministration ConsoleValue
MBeanValue
Description
Batch Messages WithoutWaiting
25 (default) Less-than-full batches are immediately deliveredwith available messages.
This is equivalent to the value set on theconnection factory's Messages Maximum perSession field.
Low Waiting Thresholdfor Message Batching
50 Wait briefly before less-than-full batches aredelivered with available messages.
Medium WaitingThreshold for MessageBatching
75 Possibly wait longer before less-than-full batchesare delivered with available messages.
High Waiting Thresholdfor Message Batching
100 Possibly wait even longer before less-than-fullbatches are delivered with available messages.
It may take some experimentation to find out which value works best for your system.For example, if you have a queue with many concurrent message consumers, byselecting the WebLogic Server Administration Console's Do Not Batch Messages value(or specifying "0" on the DestinationBean MBean), the queue will make everyeffort to promptly push messages out to its consumers as soon as they are available.Conversely, if you have a queue with only one message consumer that doesn't requirefast response times, by selecting the console's High Waiting Threshold for MessageBatching value (or specifying "100" on the DestinationBean MBean), then thequeue will strongly attempt to only push messages to that consumer in batches, whichwill increase the waiting period but may improve the server's overall throughput byreducing the number of sends.
For instructions on configuring Messaging Performance Preference parameters on astandalone destinations, uniform distributed destinations, or JMS templates using theWebLogic Server Administration Console, see the following sections in theAdministration Console Online Help:
• Configure advanced topic parameters
• Configure advanced queue parameters
• Uniform distributed topics - configure advanced parameters
• Uniform distributed queues - configure advanced parameters
• Configure advanced JMS template parameters
For more information about these parameters, see DestinationBean and TemplateBean in the MBean Reference for Oracle WebLogic Server.
13.17.2 Compatibility With the Asynchronous Message PipelineThe Message Performance Preference option is compatible with asynchronousconsumers using the Asynchronous Message Pipeline, and is also compatible withsynchronous consumers that use the Prefetch Mode for Synchronous Consumersfeature, which simulates the Asynchronous Message Pipeline. However, if the value of
Tuning the Messaging Performance Preference Option
Tuning WebLogic JMS 13-27

the Maximum Messages value is set too low, it may negate the impact of thedestination's higher-level performance algorithms (e.g., Low, Medium, and HighWaiting Threshold for Message Batching). For more information on the AsynchronousMessage Pipeline, see Receiving Messages in Developing JMS Applications for OracleWebLogic Server.
13.18 Client-side Thread PoolsWith most java client side applications, the default client thread pool size of 5 threadsis sufficient. If, however, the application has a large number of asynchronousconsumers, then it is often beneficial to allocate slightly more threads thanasynchronous consumers. This allows more asynchronous consumers to runconcurrently.
WebLogic client thread pools are configured differently than WebLogic server thread-pools, and are not self tuning. WebLogic clients have a specific thread pool that is usedfor handling incoming requests from the server, such as JMS MessageListenerinvocations. This pool can be configured via the command-line property:
-Dweblogic.ThreadPoolSize=n
where n is the number of threads
You can force a client-side thread dump to verify that this setting is taking effect.
13.19 Best Practices for JMS .NET Client ApplicationsThe following is a short list of performance related best practices to use when creatinga JMS .NET client application:
• Always register a connection exception listener using an IConnection if theapplication needs to take action when an idle connection fails.
• Have multiple .NET client threads share a single context to ensure that they use asingle socket.
• Cache and reuse frequently accessed JMS resources, such as contexts, connections,sessions, producers, destinations, and connection factories. Creating and closingthese resources consumes significant CPU and network bandwidth.
• Use DNS aliases or comma separated addresses for load balancing JMS .NETclients across multiple JMS .NET client host servers in a cluster.
For more information on best practices and other programming considerations forJMS .NET client applications, see Programming Considerations in DevelopingJMS .NET Client Applications for Oracle WebLogic Server.
13.20 Considerations for Oracle Data Guard EnvironmentsThe following sections provide configuration considerations for a WebLogic JMSenvironment that includes Oracle Data Guard.
• Pause Destinations for Planned Down Time
• Migrate JMS Services for Unexpected Outages
For more information on Oracle Data Guard, see http://www.oracle.com/us/products/database/options/active-data-guard/overview/index.html.
Client-side Thread Pools
13-28 Tuning Performance of Oracle WebLogic Server

13.20.1 Pause Destinations for Planned Down TimeFor planned maintenance windows, pause the impacted JMS destinations beforeinitiating the switch from the production database instance to standby instance. Whenthe standby database has transitioned to production, resume the JMS destinations. See Pause JMS server message operations at runtime in Oracle WebLogic ServerAdministration Console Online Help.
13.20.2 Migrate JMS Services for Unexpected OutagesFor unexpected service outages, implement JMS Service migration with the Restart onFailure option. Should the amount of time required to switch from the production tostandby database exceed the value of the Store IORetryDelaySeconds attribute andthe JMS Services fails, the JMS service and associated store are restarted in-place. See In-Place Restarting of Failed Migratable Services in Administering Clusters for OracleWebLogic Server.
Considerations for Oracle Data Guard Environments
Tuning WebLogic JMS 13-29

Considerations for Oracle Data Guard Environments
13-30 Tuning Performance of Oracle WebLogic Server
14Tuning WebLogic JMS Store-and-Forward
WebLogic JMS provides advanced Store-and-Forwarding (SAF) capability for high-performance message forwarding from a local server instance to a remote JMSdestination. Get the best performance from SAF applications by following therecommendations described in this chapter.
This chapter includes the following sections:
• Best Practices for JMS SAF
• Tuning Tips for JMS SAF
For more information about SAF, see Understanding the Store-and-Forward Service inAdministering the Store-and-Forward Service for Oracle WebLogic Server.
14.1 Best Practices for JMS SAF• Avoid using SAF if remote destinations are already highly available. JMS clients
can send directly to remote destinations. Use SAF in situations where remotedestinations are not highly available, such as an unreliable network or differentmaintenance schedules.
• Use the better performing JMS SAF feature instead of using a Messaging Bridgewhen forwarding messages to remote destinations. In general, a JMS SAF agent issignificantly faster than a Messaging Bridge. One exception is a configuration whensending messages in a non-persistent exactly-once mode.
Note:
A Messaging Bridge is still required to store-and-forward messages to foreigndestinations and destinations from releases prior to WebLogic 9.0.
• Configure separate SAF Agents for JMS SAF and Web Services Reliable MessagingAgents (WS-RM) to simplify administration and tuning.
• Sharing the same WebLogic Store between subsystems provides increasedperformance for subsystems requiring persistence. For example, transactions thatinclude SAF and JMS operations, transactions that include multiple SAFdestinations, and transactions that include SAF and EJBs. See Tuning the WebLogicPersistent Store.
14.2 Tuning Tips for JMS SAF• Target imported destinations to multiple SAF agents to load balance message sends
among available SAF agents.
Tuning WebLogic JMS Store-and-Forward 14-1

• Consider using a separate remote SAF context for each SAF destination for betterperformance. SAF destinations that use the same remote SAF context are typicallysingle threaded.
• Increase the JMS SAF Window Size for applications that handle small messages.By default, a JMS SAF agent forwards messages in batches that contain up to 10messages. For small messages size, it is possible to double or triple performance byincreasing the number of messages in each batch to be forwarded. A moreappropriate initial value for Window Size for small messages is 100. You can thenoptimize this value for your environment.
Changing the Window Size for applications handling large message sizes is notlikely to increase performance and is not recommended. Window Size also tunesWS-RM SAF behavior, so it may not be appropriate to tune this parameter for SAFAgents of type Both.
Note:
For a distributed queue, WindowSize is ignored and the batch size is setinternally at 1 message.
• Increase the JMS SAF Window Interval. By default, a JMS SAF agent has aWindow Interval value of 0 which forwards messages as soon as they arrive.This can lower performance as it can make the effective Window size muchsmaller than the configured value. A more appropriate initial value for WindowInterval value is 500 milliseconds. You can then optimize this value for yourenvironment. In this context, small messages are less than a few K, while largemessages are on the order of tens of K.
Changing the Window Interval improves performance only in cases where theforwarder is already able to forward messages as fast as they arrive. In this case,instead of immediately forwarding newly arrived messages, the forwarder pausesto accumulate more messages and forward them as a batch. The resulting largerbatch size improves forwarding throughput and reduces overall system disk andCPU usage at the expense of increasing latency.
Note:
For a distributed queue, Window Interval is ignored.
• Set the Non-Persistent QOS value to At-Least-Once for importeddestinations if your application can tolerate duplicate messages.
Tuning Tips for JMS SAF
14-2 Tuning Performance of Oracle WebLogic Server
15Tuning WebLogic Message Bridge
Improve message bridge performance using the methods described in this chapter.
This chapter includes the following sections:
• Best Practices
• Changing the Batch Size
• Changing the Batch Interval
• Changing the Quality of Service
• Using Multiple Bridge Instances
• Changing the Thread Pool Size
• Avoiding Durable Subscriptions
• Co-locating Bridges with Their Source or Target Destination
• Changing the Asynchronous Mode Enabled Attribute
• Tuning Environments with Many Bridges
15.1 Best Practices• Avoid using a Messaging Bridge if remote destinations are already highly
available. JMS clients can send directly to remote destinations. Use messagingbridge in situations where remote destinations are not highly available, such as anunreliable network or different maintenance schedules.
• Use the better performing JMS SAF feature instead of using a Messaging Bridgewhen forwarding messages to remote destinations. In general, a JMS SAF agent issignificantly faster than a Messaging Bridge. One exception is a configuration whensending messages in a non-persistent exactly-once mode.
Note:
A Messaging Bridge is still required to store-and-forward messages to foreigndestinations and destinations from releases prior to WebLogic 9.0.
15.2 Changing the Batch SizeWhen the Asynchronous Mode Enabled attribute is set to false and the quality ofservice is Exactly-once, the Batch Size attribute can be used to reduce thenumber of transaction commits by increasing the number of messages per transaction
Tuning WebLogic Message Bridge 15-1
(batch). The best batch size for a bridge instance depends on the combination of JMSproviders used, the hardware, operating system, and other factors in the applicationenvironment. See Configure transaction properties in Oracle WebLogic ServerAdministration Console Online Help.
15.3 Changing the Batch IntervalWhen the Asynchronous Mode Enabled attribute is set to false and the quality ofservice is Exactly-once, the BatchInterval attribute is used to adjust the amountof time the bridge waits for each batch to fill before forwarding batched messages. Thebest batch interval for a bridge instance depends on the combination of JMS providersused, the hardware, operating system, and other factors in the applicationenvironment. For example, if the queue is not very busy, the bridge may frequentlystop forwarding in order to wait batches to fill, indicating the need to reduce the valueof the BatchInterval attribute. See Configure transaction properties in OracleWebLogic Server Administration Console Online Help.
15.4 Changing the Quality of ServiceAn Exactly-once quality of service may perform significantly better or worse than At-most-once and Duplicate-okay.
When the Exactly-once quality of service is used, the bridge must undergo a two-phase commit with both JMS servers in order to ensure the transaction semantics andthis operation can be very expensive. However, unlike the other qualities of service,the bridge can batch multiple operations together using Exactly-once service.
You may need to experiment with this parameter to get the best possible performance.For example, if the queue is not very busy or if non-persistent messages are used,Exactly-once batching may be of little benefit. See Configure messaging bridgeinstances in Oracle WebLogic Server Administration Console Online Help.
15.5 Using Multiple Bridge InstancesIf message ordering is not required, consider deploying multiple bridges.
Multiple instances of the bridge may be deployed using the same destinations. Whenthis is done, each instance of the bridge runs in parallel and message throughput mayimprove. If multiple bridge instances are used, messages will not be forwarded in thesame order they had in the source destination. See Create messaging bridge instancesin Oracle WebLogic Server Administration Console Online Help.
Consider the following factors when deciding whether to use multiple bridges:
• Some JMS products do not seem to benefit much from using multiple bridges
• WebLogic JMS messaging performance typically improves significantly, especiallywhen handling persistent messages.
• If the CPU or disk storage is already saturated, increasing the number of bridgeinstances may decrease throughput.
15.6 Changing the Thread Pool SizeA general bridge configuration rule is to provide a thread for each bridge instancetargeted to a server instance. Use one of the following options to ensure that anadequate number of threads is available for your environment:
Changing the Batch Interval
15-2 Tuning Performance of Oracle WebLogic Server

• Use the common thread pool—A server instance changes its thread pool sizeautomatically to maximize throughput, including compensating for the number ofbridge instances configured. See Understanding How WebLogic Server UsesThread Pools in Administering Server Environments for Oracle WebLogic Server.
• Configure a work manager for the weblogic.jms.MessagingBridge class. See Understanding Work Managers in Administering Server Environments for OracleWebLogic Server.
• Use the WebLogic Server Administration Console to set the Thread Pool Sizeproperty in the Messaging Bridge Configuration section on the Configuration:Services page for a server instance. To avoid competing with the default executethread pool in the server, messaging bridges share a separate thread pool. Thisthread pool is used only in synchronous mode (Asynchronous Mode Enabledis not set). In asynchronous mode the bridge runs in a thread created by the JMSprovider for the source destination. Deprecated in WebLogic Server 9.0.
• Ensure that the bridge resource adapter pool is twice as large as the number ofbridges. See Resource Adapters in Administering the WebLogic Messaging Bridge forOracle WebLogic Server.
15.7 Avoiding Durable SubscriptionsIf the bridge is listening on a topic and it is acceptable that messages are lost when thebridge is not forwarding messages, disable the Durability Enabled flag to ensureundeliverable messages do not accumulate in the source server's store. Disabling theflag also makes the messages non-persistent. See Configure messaging bridgeinstances in Oracle WebLogic Server Administration Console Online Help.
15.8 Co-locating Bridges with Their Source or Target DestinationIf a messaging bridge source or target is a WebLogic destination, deploy the bridge tothe same WebLogic server as the destination. Targeting a messaging bridge with oneof its destinations eliminates associated network and serialization overhead. Suchoverhead can be significant in high-throughput applications, particularly if themessages are non-persistent.
15.9 Changing the Asynchronous Mode Enabled AttributeThe Asynchronous Mode Enabled attribute determines whether the messagingbridge receives messages asynchronously using the JMS MessageListenerinterface at http://docs.oracle.com/javaee/5/api/javax/jms/MessageListener.html, or whether the bridge receives messages using thesynchronous JMS APIs. In most situations, the Asynchronous Enabled attributesvalue is dependent on the QOS required for the application environment as shown in Table 15-1:
Table 15-1 Asynchronous Mode Enabled Values for QOS Level
QOS Asynchronous Mode Enabled Attribute value
Exactly-once1 false
At-least-once true
At-most-once true
Avoiding Durable Subscriptions
Tuning WebLogic Message Bridge 15-3

1 If the source destination is a non-WebLogic JMS provider and the QOS is Exactly-once, then theAsynchronous Mode Enabled attribute is disabled and the messages are processed in synchronous mode.
See Configure messaging bridge instances in Oracle WebLogic Server AdministrationConsole Online Help.
A quality of service of Exactly-once has a significant effect on bridge performance.The bridge starts a new transaction for each message and performs a two-phasecommit across both JMS servers involved in the transaction. Since the two-phasecommit is usually the most expensive part of the bridge transaction, as the number ofmessages being processed increases, the bridge performance tends to decrease.
15.10 Tuning Environments with Many BridgesThis section provides information on how to improve system boot time and generalperformance of systems that deploy many bridge instances.
• Modify the capacity of the connection factory associated with each resourceadaptor by adjusting the max-capacity attribute in the weblogic-ra.xmldescriptor file. The value of the max-capacity attribute should be at least twotimes the number of bridge instances.
For example, if your environment has up to ten message bridge instances targeted,a max-capacity attribute setting of 20 in the default configuration is adequate.But if you increase the number of bridge instances to 15, increase the max-capacity attribute to 30. See Setting the Number of Connection Factories inAdministering the WebLogic Messaging Bridge for Oracle WebLogic Server.
• Increase the entire server's thread pool size to something somewhat higher than thenumber of active bridges. This applies for any XA (transactional) bridge with abatch size higher than 1, or any XA bridge that consumes from a source destinationhosted by a non-WebLogic JMS provider.
For example, pass the following on the command line if you have 90 messagebridges:
-Dweblogic.threadpool.MinPoolSize=100
This ensures there are enough threads available when affected bridges initialize. Ifthere are not enough threads available, there can be a multi-second delay until anew thread is created.
• Provide a thread for each bridge instance targeted to a server instance. See Changing the Thread Pool Size.
Tuning Environments with Many Bridges
15-4 Tuning Performance of Oracle WebLogic Server
16Tuning Resource Adapters
Tune resource adapters by using the best practices provided in this chapter.
This chapter includes the following sections:
• Classloading Optimizations for Resource Adapters
• Connection Optimizations
• Thread Management
• InteractionSpec Interface
16.1 Classloading Optimizations for Resource AdaptersYou can package resource adapter classes in one or more JAR files, and then place theJAR files in the RAR file. These are called nested JARs. When you nest JAR files in theRAR file, and classes need to be loaded by the classloader, the JARs within the RARfile must be opened and closed and iterated through for each class that must beloaded.
If there are very few JARs in the RAR file and if the JARs are relatively small in size,there will be no significant performance impact. On the other hand, if there are manyJARs and the JARs are large in size, the performance impact can be great.
To avoid such performance issues, you can either:
1. Deploy the resource adapter in an exploded format. This eliminates the nesting ofJARs and hence reduces the performance hit involved in looking for classes.
2. If deploying the resource adapter in exploded format is not an option, the JARs canbe exploded within the RAR file. This also eliminates the nesting of JARs and thusimproves the performance of classloading significantly.
16.2 Connection OptimizationsOracle recommends that resource adapters implement the optional enhancementsdescribed in Connection Optimization section of the J2CA 1.5 Specification at http://www.oracle.com/technetwork/java/index.html. Implementingthese interfaces allows WebLogic Server to provide several features that will not beavailable without them.
Lazy Connection Association allows the server to automatically clean up unusedconnections and prevent applications from hogging resources. Lazy TransactionEnlistment allows applications to start a transaction after a connection is alreadyopened.
Tuning Resource Adapters 16-1

16.3 Thread ManagementResource adapter implementations should use the WorkManager (as described inChapter 10, "Work Management" in the J2CA 1.5 Specification at http://www.oracle.com/technetwork/java/index.html) to launch operations thatneed to run in a new thread, rather than creating new threads directly. This allowsWebLogic Server to manage and monitor these threads.
16.4 InteractionSpec InterfaceWebLogic Server supports the Common Client Interface (CCI) for EIS access, asdefined in Chapter 17, "Common Client Interface" in the J2CA 1.5 Specification at http://www.oracle.com/technetwork/java/index.html. The CCI defines astandard client API for application components that enables application componentsand EAI frameworks to drive interactions across heterogeneous EISes.
As a best practice, you should not store the InteractionSpec class that the CCIresource adapter is required to implement in the RAR file. Instead, you shouldpackage it in a separate JAR file outside of the RAR file, so that the client can access itwithout having to put the InteractionSpec interface class in the genericCLASSPATH.
With respect to the InteractionSpec interface, it is important to remember thatwhen all application components (EJBs, resource adapters, Web applications) arepackaged in an EAR file, all common classes can be placed in the APP-INF/libdirectory. This is the easiest possible scenario.
This is not the case for standalone resource adapters (packaged as RAR files). If theinterface is serializable (as is the case with InteractionSpec), then both the clientand the resource adapter need access to the InteractionSpec interface as well asthe implementation classes. However, if the interface extends java.io.Remote, thenthe client only needs access to the interface class.
Thread Management
16-2 Tuning Performance of Oracle WebLogic Server

17Tuning Web Applications
Use the best practices for tuning Web applications and managing sessions described inthis chapter.
This chapter includes the following sections:
• Best Practices
• Session Management
• Pub-Sub Tuning Guidelines
17.1 Best Practices• Disable Page Checks
• Use Custom JSP Tags
• Precompile JSPs
• Use HTML Template Compression
• Use Service Level Agreements
• Related Reading
17.1.1 Disable Page ChecksYou can improve performance by disabling servlet and JDP page checks. Set each ofthe following parameters to -1:
• pageCheckSeconds
• servlet-reload-check-secs
• servlet Reload Check
These are default values for production mode.
17.1.2 Use Custom JSP TagsOracle provides three specialized JSP tags that you can use in your JSP pages: cache,repeat, and process. These tags are packaged in a tag library jar file called weblogic-tags.jar. This jar file contains classes for the tags and a tag library descriptor (TLD).To use these tags, you copy this jar file to the Web application that contains your JSPsand reference the tag library in your JSP. See Using Custom WebLogic JSP Tags (cache,process, repeat) in Developing Web Applications, Servlets, and JSPs for Oracle WebLogicServer.
Tuning Web Applications 17-1

17.1.3 Precompile JSPsYou can configure WebLogic Server to precompile your JSPs when a Web Applicationis deployed or re-deployed or when WebLogic Server starts up by setting theprecompile parameter to true in the jsp-descriptor element of the weblogic.xmldeployment descriptor. To avoid recompiling your JSPs each time the server restartsand when you target additional servers, precompile them using weblogic.appc andplace them in the WEB-INF/classes folder and archive them in a .war file. Keepingyour source files in a separate directory from the archived .war file eliminates thepossibility of errors caused by a JSP having a dependency on one of the class files. Fora complete explanation on how to avoid JSP recompilation, see Avoiding UnnecessaryJSP Recompilation.
17.1.4 Use HTML Template CompressionUsing the compress-html-template element compresses the HTML in the JSPtemplate blocks which can improve runtime performance. If the JSP's HTML templateblock contains the <pre> HTML tag, do not enable this feature.
See jsp-descriptor in Developing Web Applications, Servlets, and JSPs for OracleWebLogic Server.
17.1.5 Use Service Level AgreementsYou should assign servlets and JSPs to work managers based on the service levelagreements required by your applications. See Thread Management.
17.1.6 Related Reading
• Servlet Best Practices in Developing Web Applications, Servlets, and JSPs for OracleWebLogic Server.
• Servlet and JSP Performance Tuning at http://www.javaworld.com/javaworld/jw-06-2004/jw-0628-performance_p.html, by RahulChaudhary, JavaWorld, June 2004.
17.2 Session ManagementAs a general rule, you should optimize your application so that it does as little work aspossible when handling session persistence and sessions. The following sectionsprovide information on how to design a session management strategy that suits yourenvironment and application:
• Managing Session Persistence
• Minimizing Sessions
• Aggregating Session Data
17.2.1 Managing Session PersistenceWebLogic Server offers many session persistence mechanisms that cater to thediffering requirements of your application, including Async-replicated andAsync-JDBC modes. The session persistence mechanisms are configurable at the Webapplication layer. Which session management strategy you choose for yourapplication depends on real-world factors like HTTP session size, session life cycle,
Session Management
17-2 Tuning Performance of Oracle WebLogic Server

reliability, and session failover requirements. For example, a Web application with nofailover requirements could be maintained as a single memory-based session;whereas, a Web application with session fail-over requirements could be maintainedas replicated sessions or JDBC-based sessions, based on their life cycle and object size.
In terms of pure performance, replicated session persistence is a better overall choicewhen compared to JDBC-based persistence for session state. However, replicated-based session persistence requires the use of WebLogic clustering, so it isn't an optionin a single-server environment.
On the other hand, an environment using JDBC-based persistence does not require theuse of WebLogic clusters and can maintain the session state for longer periods of timein the database. One way to improve JDBC-based session persistence is to optimizeyour code so that it has as high a granularity for session state persistence as possible.Other factors that can improve the overall performance of JDBC-based sessionpersistence are: the choice of database, proper database server configuration, JDBCdriver, and the JDBC connection pool configuration.
For more information on managing session persistence, see:
• Configuring Session Persistence in Developing Web Applications, Servlets, and JSPs forOracle WebLogic Server
• HTTP Session State Replication in Administering Clusters for Oracle WebLogic Server
• Using a Database for Persistent Storage (JDBC Persistence) in Developing WebApplications, Servlets, and JSPs for Oracle WebLogic Server
17.2.2 Minimizing SessionsConfiguring how WebLogic Server manages sessions is a key part of tuning yourapplication for best performance. Consider the following:
• Use of sessions involves a scalability trade-off.
• Use sessions sparingly. In other words, use sessions only for state that cannotrealistically be kept on the client or if URL rewriting support is required. Forexample, keep simple bits of state, such as a user's name, directly in cookies. Youcan also write a wrapper class to "get" and "set" these cookies, in order to simplifythe work of servlet developers working on the same project.
• Keep frequently used values in local variables.
For more information, see Setting Up Session Management in Developing WebApplications, Servlets, and JSPs for Oracle WebLogic Server.
17.2.3 Aggregating Session DataThis section provides best practices on how to aggregate session data. WebLogicServer tracks and replicates changes in the session by attribute so you should:
• Aggregate session data that changes in tandem into a single session attribute.
• Aggregate session data that changes frequently and read-only session data intoseparate session attributes
For example: If you use a a single large attribute that contains all the session data andonly 10% of that data changes, the entire attribute has to be replicated. This causesunnecessary serialization/deserialization and network overhead. You should movethe 10% of the session data that changes into a separate attribute.
Session Management
Tuning Web Applications 17-3
17.3 Pub-Sub Tuning GuidelinesThe following section provides general tuning guidelines for a pub-sub server:
• Increase file descriptors to cater for a large number of long-living connections,especially for applications with thousands of clients.
• Tune logging level for WebLogic Server.
• Tune JVM options. Suggested options: -Xms1536m -Xmx1536m -Xns512m -XXtlaSize:min=128k,preferred=256k
• Increase the maximum message. If your application publishes messages under highvolumes, consider setting the value to <max-message-size>10000000</max-message-size>.
17.4 Enabling GZIP CompressionThe WebLogic Server Web container supports HTTP content-encoding GZIPcompression, which is part of HTTP/1.1. With GZIP compression, you can reduce thesize of the data that a Web browser has to download, improving network bandwidth.You can tune Web applications by enabling and configuring GZIP compression ateither the domain level or Web application level. For more information, see EnablingGZIP Compression for Web Applications in Developing Web Applications, Servlets, andJSPs for Oracle WebLogic Server.
Pub-Sub Tuning Guidelines
17-4 Tuning Performance of Oracle WebLogic Server
18Tuning Web Services
Use Oracle best practices for designing, developing, and deploying WebLogic WebServices applications and application resources.
This chapter includes the following sections:
• Web Services Best Practices
• Tuning Web Service Reliable Messaging Agents
• Tuning Heavily Loaded Systems to Improve Web Service Performance
18.1 Web Services Best PracticesDesign and architectural decisions have a strong impact on runtime performance andscalability of Web Service applications. Here are few key recommendations to achievebest performance.
• Design Web Service applications for course-grained service with moderate sizepayloads.
• Choose correct service-style & encoding for your Web service application.
• Control serializer overheads and namespaces declarations to achieve betterperformance.
• Use MTOM/XOP or Fast Infoset to optimizing the format of a SOAP message.
• Carefully design SOAP attachments and security implementations for minimumperformance overheads.
• Consider using an asynchronous messaging model for applications with:
– Slow and unreliable transport.
– Complex and long-running process.
• For transactional Service Oriented Architectures (SOA) consider using the LastLogging Resource transaction optimization (LLR) to improve performance. See Tuning Transactions.
• Use replication and caching of data and schema definitions to improveperformance by minimizing network overhead.
• Consider any XML compression technique only when XML compression/decompression overheads are less than network overheads involved.
• Applications that are heavy users of XML functionality (parsers) may encounterperformance issues or run out of file descriptors. This may occur because XML
Tuning Web Services 18-1
parser instances are bootstrapped by doing a lookup in the jaxp.properties file(JAXP API). Oracle recommends setting the properties on the command line toavoid unnecessary file operations at runtime and improve performance andresource usage.
• Follow JWS Programming Best Practices in Developing JAX-WS Web Services forOracle WebLogic Server.
• Follow best practice and tuning recommendations for all underlying components,such as Tuning WebLogic Server EJBs, Tuning Web Applications, Tuning DataSources, and Tuning WebLogic JMS.
18.2 Tuning Web Service Reliable Messaging AgentsWeb Service Reliable Messaging provides advanced store-and-forward capability forhigh-performance message forwarding from a local server instance to a remotedestination. See Understanding the Store-and-Forward Service in Administering theStore-and-Forward Service for Oracle WebLogic Server. The following section providesinformation on how to get the best performance from Store-and-Forward (SAF)applications:
• Configure separate SAF Agents for JMS SAF and Web Services Reliable MessagingAgents to simplify administration and tuning.
• Sharing the same WebLogic Store between subsystems provides increasedperformance for subsystems requiring persistence. For example, transactions thatinclude SAF and JMS operations, transactions that include multiple SAFdestinations, and transactions that include SAF and EJBs. See Tuning the WebLogicPersistent Store.
• Consider increasing the WindowSize parameter on the remote SAF agent. Forsmall messages of less than 1K, tuning WindowSize as high as 300 can improvethroughput.
Note:
WindowSize also tunes JMS SAF behavior, so it may not be appropriate totune this parameter for SAF agents of type both.
• Ensure that retry delay is not set too low. This may cause the system to makeunnecessary delivery attempts.
18.3 Tuning Heavily Loaded Systems to Improve Web ServicePerformance
The asynchronous request-response, reliable messaging, and buffering features are allpre-tuned for minimum system resource usage to support a small number of clients(under 10). If you plan on supporting a larger number of clients or high messagevolumes, you should adjust the tuning parameters to accommodate the additionalload, as described in the following sections:
• Setting the Work Manager Thread Pool Minimum Size Constraint
• Setting the Buffering Sessions
Tuning Web Service Reliable Messaging Agents
18-2 Tuning Performance of Oracle WebLogic Server
• Releasing Asynchronous Resources
18.3.1 Setting the Work Manager Thread Pool Minimum Size ConstraintDefine a Work Manager and set the thread pool minimum size constraint (min-threads-constraint) to a value that is at least as large as the expected number ofconcurrent requests or responses into the service.
For example, if a Web service client issues 20 requests in rapid succession, therecommended thread pool minimum size constraint value would be 20 for theapplication hosting the client. If the configured constraint value is too small,performance can be severely degraded as incoming work waits for a free processingthread.
For more information about the thread pool minimum size constraint, see Constraintsin Administering Server Environments for Oracle WebLogic Server.
18.3.2 Setting the Buffering SessionsThe reliable messaging and buffering features use JMS queue sessions to sendmessages to the reliability/buffer queues. By default, WebLogic Server allocates 10sessions for buffering which enables 10 clients to enqueue messages simultaneouslyonto the reliability/buffer queue.
For asynchronous request-response, the request and response portion of thecommunication exchange count separately, as two clients. In this case, the default poolof sessions can support five simultaneous asynchronous request-response clients. Toaccommodate the number of concurrent clients you expect in your application, set thefollowing parameter to twice the number of expected client threads:
-Dweblogic.wsee.buffer.QueueSessionPoolSize=size
18.3.3 Releasing Asynchronous ResourcesWhen using the asynchronous request-response feature, WebLogic Server persistentlystores information about the request until the asynchronous response is returned tothe client. These resources remain in the persistent store until they are released by abackground thread, called the store cleaner.
Often, these resources can be released sooner. Executing the store cleaner morefrequently can help to reduce the size of the persistent store and minimize the timerequired to clean it.
By default, the store cleaner runs every two minutes (120000 ms). Oracle recommendsthat you set the store cleaner interval to one minute (60000 ms) using the followingJava system property:
-Dweblogic.wsee.StateCleanInterval=60000
Tuning Heavily Loaded Systems to Improve Web Service Performance
Tuning Web Services 18-3

Tuning Heavily Loaded Systems to Improve Web Service Performance
18-4 Tuning Performance of Oracle WebLogic Server
19Tuning WebLogic Tuxedo Connector
Get the best performance from WebLogic Tuxedo Connector (WTC) applications usingthe tips provided in this chapter. The WebLogic Tuxedo Connector (WTC) providesinteroperability between WebLogic Server applications and Tuxedo services. WTCallows WebLogic Server clients to invoke Tuxedo services and Tuxedo clients toinvoke WebLogic Server Enterprise Java Beans (EJBs) in response to a service request.
This chapter includes the following sections:
• Configuration Guidelines
• Best Practices
For more information, see Introduction to Oracle WebLogic Tuxedo ConnectorProgramming in Developing Oracle WebLogic Tuxedo Connector Applications for OracleWebLogic Server.
19.1 Configuration GuidelinesUse the following guidelines when configuring WebLogic Tuxedo Connector:
• You may have more than one WTC Service in your configuration.
• You can only target one WTC Service to a server instance.
• WTC does not support connection pooling. WTC multiplexes requests though asingle physical connection.
• Configuration changes implemented as follows:
– Changing the session/connection configuration (local APs, remote APs,Passwords, and Resources) before a connection/session is established. Thechanges are accepted and are implemented in the new session/connection.
– Changing the session/connection configuration (local APs, remote APs,Passwords, and Resources) after a connection/session is established.Thechanges accepted but are not implemented in the existing connection/sessionuntil the connection is disconnected and reconnected. See Assign a WTC Serviceto a Server in Oracle WebLogic Server Administration Console Online Help.
– Changing the Imported and Exported services configuration. The changes areaccepted and are implemented in the next inbound or outbound request. Oracledoes not recommend this practice as it can leave in-flight requests in anunknown state.
– Changing the tBridge configuration. Any change in a deployed WTC servicecauses an exception. You must untarget the WTC service before making anytBridge configuration changes. After untargeting and making configurationchanges, you must target the WTC service to implement the changes.
Tuning WebLogic Tuxedo Connector 19-1

19.2 Best PracticesThe following section provides best practices when using WTC:
• When configuring the connection policy, use ON_STARTUP and INCOMING_ONLY.ON_STARTUP and INCOMING_ONLY always paired. For example: If a WTC remoteaccess point is configured with ON_STARTUP, the DM_TDOMAIN section of theTuxedo domain configuration must be configured with the remote access point asINCOMING_ONLY. In this case, WTC always acts as the session initiator. See Configuring the Connections Between Access Points in the Administering WebLogicTuxedo Connector for Oracle WebLogic Server.
• Avoid using connection policy ON_DEMAND. The preferred connection policy isON_STARTUP and INCOMING_ONLY. This reduces the chance of service requestfailure due to the routing semantics of ON_DEMAND. See Configuring theConnections Between Access Points in the Administering WebLogic Tuxedo Connectorfor Oracle WebLogic Server.
• Consider using the following WTC features: Link Level Failover, Service Levelfailover and load balancing when designing your application. See ConfiguringFailover and Failback in the Administering WebLogic Tuxedo Connector for OracleWebLogic Server.
• Consider using WebLogic Server clusters to provide additional load balancing andfailover. To use WTC in a WebLogic Server cluster:
– Configure a WTC instance on all the nodes of the WebLogic Server cluster.
– Each WTC instance in each cluster node must have the same configuration.
See How to Manage WebLogic Tuxedo Connector in a Clustered Environment inthe Administering WebLogic Tuxedo Connector for Oracle WebLogic Server.
• If your WTC to Tuxedo connection uses the internet, use the following securitysettings:
– Set the value of Security to DM_PW. See Authentication of Remote AccessPoints in the Administering WebLogic Tuxedo Connector for Oracle WebLogic Server.
– Enable Link-level encryption and set the min-encrypt-bits parameter to 40and the max-encrypt-bits to 128. See Link-Level Encryption in theAdministering WebLogic Tuxedo Connector for Oracle WebLogic Server.
• Your application logic should provide mechanisms to manage and interpret errorconditions in your applications.
– See Application Error Management in the Developing Oracle WebLogic TuxedoConnector Applications for Oracle WebLogic Server.
– See System Level Debug Settings in the Administering WebLogic Tuxedo Connectorfor Oracle WebLogic Server.
• Avoid using embedded TypedFML32 buffers inside TypedFML32 buffers. See Using FML with WebLogic Tuxedo Connector in the Developing Oracle WebLogicTuxedo Connector Applications for Oracle WebLogic Server.
• If your application handles heavy loads, consider configuring more remote Tuxedoaccess points and let WTC load balance the work load among the access points. See
Best Practices
19-2 Tuning Performance of Oracle WebLogic Server

Configuring Failover and Failback in the Administering WebLogic Tuxedo Connectorfor Oracle WebLogic Server.
• When using transactional applications, try to make the remote services involved inthe same transaction available from the same remote access point. See WebLogicTuxedo Connector JATMI Transactions in the Developing Oracle WebLogic TuxedoConnector Applications for Oracle WebLogic Server.
• The number of client threads available when dispatching services from the gatewaymay limit the number of concurrent services running. There is no WebLogicTuxedo Connector attribute to increase the number of available threads. Use areasonable thread model when invoking service. See Thread Management and Using Work Managers to Optimize Scheduled Work in Administering ServerEnvironments for Oracle WebLogic Server.
• WebLogic Server Releases 9.2 and higher provide improved routing algorithmswhich enhance transaction performance. Specifically, performance is improvedwhen there are more than one Tuxedo service requests involved in a 2 phasecommit (2PC) transaction. If your application does only single service request tothe Tuxedo domain, you can disable this feature by setting the following WebLogicServer command line parameter:
-Dweblogic.wtc.xaAffinity=false
• Call the constructor TypedFML32 using the maximum number of objects in thebuffer. Even if the maximum number is difficult to predict, providing a reasonablenumber improves performance. You approximate the maximum number bymultiplying the number of fields by 1.33.
Note:
This performance tip does not apply to TypedFML buffer type.
For example:
If there are 50 fields in a TypedFML32 buffer type then the maximum number is 63.Calling the constructor TypedFML32(63, 50) performs better thanTypedFML32().
If there are 50 fields in a TypedFML32 buffer type and each can have maximum 10occurrences, then call the constructor TypedFML32(625, 50) will give betterperformance than TypedFML32()
• When configuring Tuxedo applications that act as servers interoperating with WTCclients, take into account of parallelism that may be achieved by carefullyconfiguring different servers on different Tuxedo machines.
• Be aware of the possibility of database access deadlock in Tuxedo applications. Youcan avoid deadlock through careful Tuxedo application configuration.
• If your are using WTC load balancing or service level failover, Oracle recommendsthat you do not disable WTC transaction affinity.
• For load balancing outbound requests, configure the imported service withmultiple entries using a different key. The imported service uses composite key todetermine each record's uniqueness. The composite key is compose of "the servicename + the local access point + the primary route in the remote access point list".
Best Practices
Tuning WebLogic Tuxedo Connector 19-3
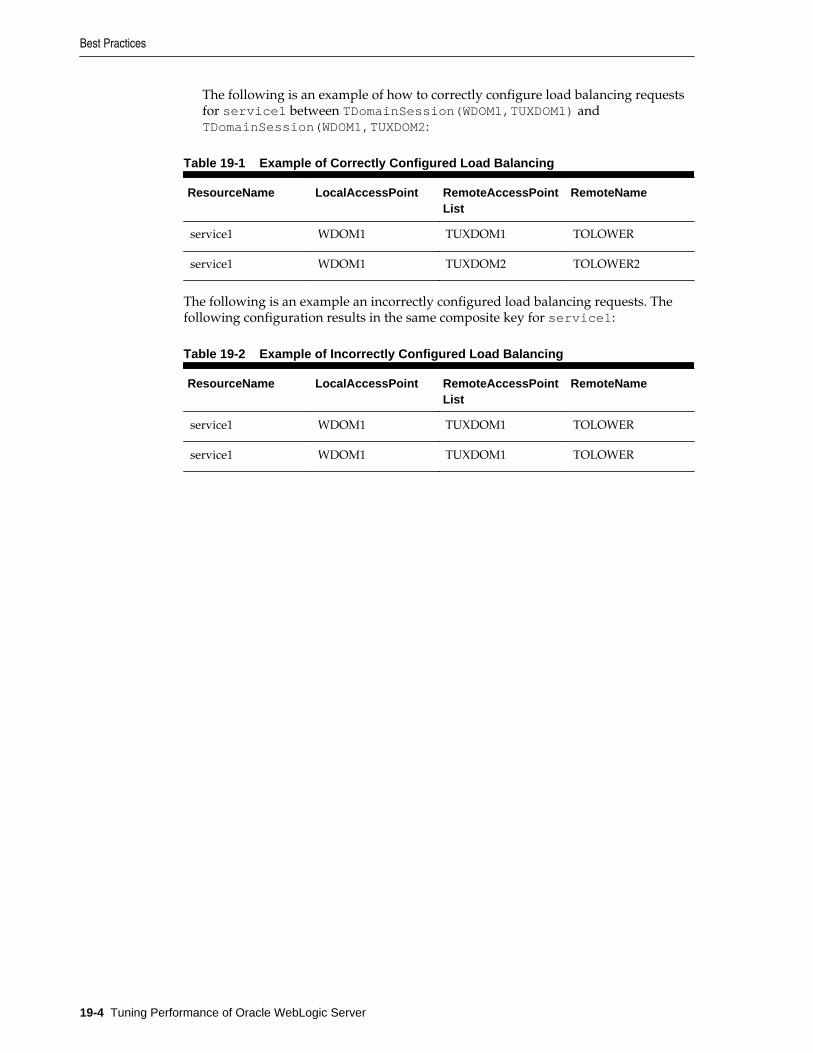
The following is an example of how to correctly configure load balancing requestsfor service1 between TDomainSession(WDOM1,TUXDOM1) andTDomainSession(WDOM1,TUXDOM2:
Table 19-1 Example of Correctly Configured Load Balancing
ResourceName LocalAccessPoint RemoteAccessPointList
RemoteName
service1 WDOM1 TUXDOM1 TOLOWER
service1 WDOM1 TUXDOM2 TOLOWER2
The following is an example an incorrectly configured load balancing requests. Thefollowing configuration results in the same composite key for service1:
Table 19-2 Example of Incorrectly Configured Load Balancing
ResourceName LocalAccessPoint RemoteAccessPointList
RemoteName
service1 WDOM1 TUXDOM1 TOLOWER
service1 WDOM1 TUXDOM1 TOLOWER
Best Practices
19-4 Tuning Performance of Oracle WebLogic Server

ACapacity Planning
Capacity planning is the process of determining what type of hardware and softwareconfiguration is required to meet application needs adequately. Capacity planning isnot an exact science. Every application is different and every user behavior is different.
This appendix includes the following sections:
• Capacity Planning Factors
• Assessing Your Application Performance Objectives
• Hardware Tuning
• Network Performance
• Related Information
A.1 Capacity Planning FactorsA number of factors influence how much capacity a given hardware configuration willneed in order to support a WebLogic Server instance and a given application. Thehardware capacity required to support your application depends on the specifics ofthe application and configuration. You should consider how each of these factorsapplies to your configuration and application.
The following sections discuss several of these factors. Understanding these factorsand considering the requirements of your application will aid you in generating serverhardware requirements for your configuration. Consider the capacity planningquestions in Table A-1.
Table A-1 Capacity Planning Factors and Information Reference
Capacity Planning Questions For Information, See:
Is WebLogic Server well-tuned? Assessing Your Application PerformanceObjectives
How well-designed is the user application? Database Server Capacity and User StorageRequirements
Is there enough bandwidth? Network Load
How many transactions need to runsimultaneously?
Concurrent Sessions
Is the database a limiting factor? Are thereadditional user storage requirements?
Database Server Capacity and User StorageRequirements
Capacity Planning A-1
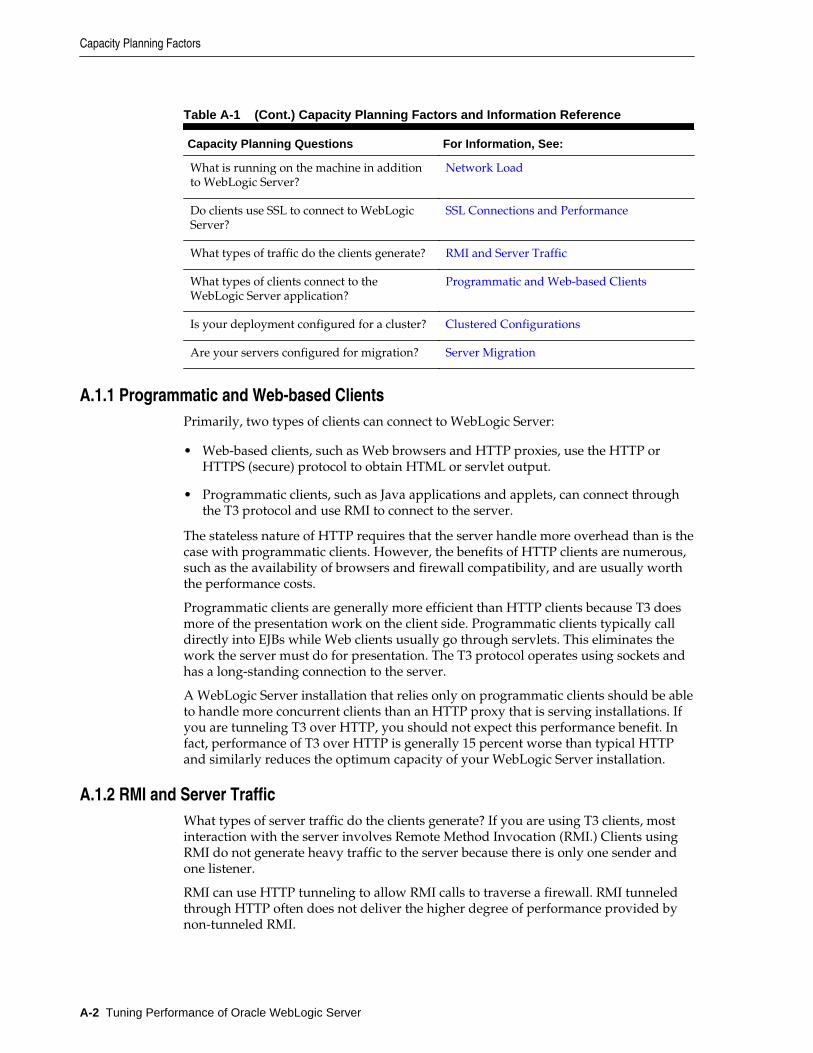
Table A-1 (Cont.) Capacity Planning Factors and Information Reference
Capacity Planning Questions For Information, See:
What is running on the machine in additionto WebLogic Server?
Network Load
Do clients use SSL to connect to WebLogicServer?
SSL Connections and Performance
What types of traffic do the clients generate? RMI and Server Traffic
What types of clients connect to theWebLogic Server application?
Programmatic and Web-based Clients
Is your deployment configured for a cluster? Clustered Configurations
Are your servers configured for migration? Server Migration
A.1.1 Programmatic and Web-based ClientsPrimarily, two types of clients can connect to WebLogic Server:
• Web-based clients, such as Web browsers and HTTP proxies, use the HTTP orHTTPS (secure) protocol to obtain HTML or servlet output.
• Programmatic clients, such as Java applications and applets, can connect throughthe T3 protocol and use RMI to connect to the server.
The stateless nature of HTTP requires that the server handle more overhead than is thecase with programmatic clients. However, the benefits of HTTP clients are numerous,such as the availability of browsers and firewall compatibility, and are usually worththe performance costs.
Programmatic clients are generally more efficient than HTTP clients because T3 doesmore of the presentation work on the client side. Programmatic clients typically calldirectly into EJBs while Web clients usually go through servlets. This eliminates thework the server must do for presentation. The T3 protocol operates using sockets andhas a long-standing connection to the server.
A WebLogic Server installation that relies only on programmatic clients should be ableto handle more concurrent clients than an HTTP proxy that is serving installations. Ifyou are tunneling T3 over HTTP, you should not expect this performance benefit. Infact, performance of T3 over HTTP is generally 15 percent worse than typical HTTPand similarly reduces the optimum capacity of your WebLogic Server installation.
A.1.2 RMI and Server TrafficWhat types of server traffic do the clients generate? If you are using T3 clients, mostinteraction with the server involves Remote Method Invocation (RMI.) Clients usingRMI do not generate heavy traffic to the server because there is only one sender andone listener.
RMI can use HTTP tunneling to allow RMI calls to traverse a firewall. RMI tunneledthrough HTTP often does not deliver the higher degree of performance provided bynon-tunneled RMI.
Capacity Planning Factors
A-2 Tuning Performance of Oracle WebLogic Server

A.1.3 SSL Connections and PerformanceSecure sockets layer (SSL) is a standard for secure Internet communications. WebLogicServer security services support X.509 digital certificates and access control lists(ACLs) to authenticate participants and manage access to network services. Forexample, SSL can protect JSP pages listing employee salaries, blocking access toconfidential information.
SSL involves intensive computing operations. When supporting the cryptographyoperations in the SSL protocol, WebLogic Server can not handle as many simultaneousconnections.
The number of SSL connections required out of the total number of clients required.Typically, for every SSL connection that the server can handle, it can handle three non-SSL connections. SSL substantially reduces the capacity of the server depending uponthe strength of encryption used in the SSL connections. Also, the amount of overheadSSL imposes is related to how many client interactions have SSL enabled. WebLogicServer includes native performance packs for SSL operations.
A.1.4 WebLogic Server Process LoadWhat is running on the machine in addition to a WebLogic Server? The machine maybe processing much more than presentation and business logic. For example, it couldbe running a Web server or maintaining a remote information feed, such as a stockinformation feed from a quote service.
Consider how much of your WebLogic Server machine's processing power isconsumed by processes unrelated to WebLogic Server. In the case in which WebLogicServer (or the machine on which it resides) is doing substantial additional work, youneed to determine how much processing power will be drained by other processes.When a Web server proxy is running on the same machine as WebLogic Server, expectanywhere from 25 to 50 percent of the computing capacity.
A.1.5 Database Server Capacity and User Storage RequirementsIs the database a bottleneck? Are there additional user storage requirements? Often thedatabase server runs out of capacity much sooner that WebLogic Server does. Plan fora database that is sufficiently robust to handle the application. Typically, a goodapplication's database requires hardware three to four times more powerful than theapplication server hardware. It is good practice to use a separate machine for yourdatabase server.
Generally, you can tell if your database is the bottleneck if you are unable to maintainWebLogic Server CPU usage in the 85 to 95 percent range. This indicates thatWebLogic Server is often idle and waiting for the database to return results. With loadbalancing in a cluster, the CPU utilization across the nodes should be about even.
Some database vendors are beginning to provide capacity planning information forapplication servers. Frequently this is a response to the three-tier model forapplications.
An application might require user storage for operations that do not interact with adatabase. For example, in a secure system disk and memory are required to storesecurity information for each user. You should calculate the size required to store oneuser's information, and multiply by the maximum number of expected users.
Capacity Planning Factors
Capacity Planning A-3
A.1.6 Concurrent SessionsHow many transactions must run concurrently? Determine the maximum number ofconcurrent sessions WebLogic Server will be called upon to handle. For each session,you will need to add more RAM for efficiency. Oracle recommends that you install aminimum of 256 MB of memory for each WebLogic Server installation that will behandling more than minimal capacity.
Next, research the maximum number of clients that will make requests at the sametime, and how frequently each client will be making a request. The number of userinteractions per second with WebLogic Server represents the total number ofinteractions that should be handled per second by a given WebLogic Serverdeployment. Typically for Web deployments, user interactions access JSP pages orservlets. User interactions in application deployments typically access EJBs.
Consider also the maximum number of transactions in a given period to handle spikesin demand. For example, in a stock report application, plan for a surge after the stockmarket opens and before it closes. If your company is broadcasting a Web site as partof an advertisement during the World Series or World Cup Soccer playoffs, youshould expect spikes in demand.
A.1.7 Network LoadIs the bandwidth sufficient? WebLogic Server requires enough bandwidth to handleall connections from clients. In the case of programmatic clients, each client JVM willhave a single socket to the server. Each socket requires bandwidth. A WebLogic Serverhandling programmatic clients should have 125 to 150 percent the bandwidth that aserver with Web-based clients would handle. If you are interested in the bandwidthrequired to run a web server, you can assume that each 56kbps (kilobits per second) ofbandwidth can handle between seven and ten simultaneous requests depending uponthe size of the content that you are delivering. If you are handling only HTTP clients,expect a similar bandwidth requirement as a Web server serving static pages.
The primary factor affecting the requirements for a LAN infrastructure is the use ofreplicated sessions for servlets and stateful session EJBs. In a cluster, replicatedsessions are the biggest consumer of LAN bandwidth. Consider whether yourapplication will require the replication of session information for servlets and EJBs.
To determine whether you have enough bandwidth in a given deployment, look at thenetwork tools provided by your network operating system vendor. In most cases,including Windows NT, Windows 2000, and Solaris, you can inspect the load on thenetwork system. If the load is very high, bandwidth may be a bottleneck for yoursystem.
A.1.8 Clustered ConfigurationsClusters greatly improve efficiency and failover. Customers using clustering shouldnot see any noticeable performance degradation. A number of WebLogic Serverdeployments in production involve placing a cluster of WebLogic Server instances ona single multiprocessor server.
Large clusters performing replicated sessions for Enterprise JavaBeans (EJBs) orservlets require more bandwidth than smaller clusters. Consider the size of sessiondata and the size of the cluster.
Capacity Planning Factors
A-4 Tuning Performance of Oracle WebLogic Server
A.1.9 Server MigrationAre your servers configured for migration? Migration in WebLogic Server is theprocess of moving a clustered WebLogic Server instance or a component running on aclustered instance elsewhere in the event of failure. In the case of whole servermigration, the server instance is migrated to a different physical machine upon failure,either manually or automatically.
For capacity planning in a production environment, keep in mind that server startupduring migration taxes CPU utilization. You cannot assume that because a machinecan handle x number of servers running concurrently that it also can handle that samenumber of servers starting up on the same machine at the same time.
A.1.10 Application DesignHow well-designed is the application? WebLogic Server is a platform for userapplications. Badly designed or unoptimized user applications can drastically slowdown the performance of a given configuration from 10 to 50 percent. The prudentcourse is to assume that every application that is developed for WebLogic Server willnot be optimal and will not perform as well as benchmark applications. Increase themaximum capacity that you calculate or expect. See Tune Your Application.
A.2 Assessing Your Application Performance ObjectivesAt this stage in capacity planning, you gather information about the level of activityexpected on your server, the anticipated number of users, the number of requests,acceptable response time, and preferred hardware configuration. Capacity planningfor server hardware should focus on maximum performance requirements and setmeasurable objectives for capacity.
The numbers that you calculate from using one of our sample applications are ofcourse just a rough approximation of what you may see with your application. Thereis no substitute for benchmarking with the actual production application usingproduction hardware. In particular, your application may reveal subtle contention orother issues not captured by our test applications.
A.3 Hardware TuningWhen you examine performance, a number of factors influence how much capacity agiven hardware configuration will need in order to support WebLogic Server and agiven application. The hardware capacity required to support your applicationdepends on the specifics of the application and configuration. You should considerhow each factor applies to your configuration and application.
A.3.1 Benchmarks for Evaluating PerformanceThe Standard Performance Evaluation Corporation, at http://www.spec.org,provides a set of standardized benchmarks and metrics for evaluating computersystem performance.
A.3.2 Supported PlatformsSee Supported Configurations in What's New in Oracle WebLogic Server for links to thelatest certification information on the hardware/operating system platforms that aresupported for each release of WebLogic Server.
Assessing Your Application Performance Objectives
Capacity Planning A-5

A.4 Network PerformanceNetwork performance is affected when the supply of resources is unable to keep upwith the demand for resources. Today's enterprise-level networks are very fast and arenow rarely the direct cause of performance in well-designed applications. However, ifyou find that you have a problem with one or more network components (hardwareor software), work with your network administrator to isolate and eliminate theproblem. You should also verify that you have an appropriate amount of networkbandwidth available for WebLogic Server and the connections it makes to other tiersin your architecture, such as client and database connections. Therefore, it is importantto continually monitor your network performance to troubleshoot potentialperformance bottlenecks.
A.4.1 Determining Network BandwidthA common definition of bandwidth is "the rate of the data communicationstransmission, usually measured in bits-per-second, which is the capacity of the link tosend and receive communications." A machine running WebLogic Server requiresenough network bandwidth to handle all WebLogic Server client connections. In thecase of programmatic clients, each client JVM has a single socket to the server, andeach socket requires dedicated bandwidth. A WebLogic Server instance handlingprogrammatic clients should have 125–150 percent of the bandwidth that a similarWeb server would handle. If you are handling only HTTP clients, expect a bandwidthrequirement similar to a Web server serving static pages.
To determine whether you have enough bandwidth in a given deployment, you canuse the network monitoring tools provided by your network operating system vendorto see what the load is on the network system. You can also use common operatingsystem tools, such as the netstat command for Solaris or the System Monitor(perfmon) for Windows, to monitor your network utilization. If the load is very high,bandwidth may be a bottleneck for your system.
Also monitor the amount of data being transferred across the your network bychecking the data transferred between the application and the application server, andbetween the application server and the database server. This amount should notexceed your network bandwidth; otherwise, your network becomes the bottleneck. Toverify this, monitor the network statistics for retransmission and duplicate packets, asfollows:
netstat -s -P tcp
A.5 Related InformationThe Oracle Technology Network provides detailed documentation for WebLogicServer. See http://www.oracle.com/technetwork/middleware/weblogic/documentation/index.html.
Information on topics related to capacity planning is available from numerous third-party software sources.
Network Performance
A-6 Tuning Performance of Oracle WebLogic Server