oral hygiene in adults
TRANSCRIPT

NATIONAL CENTER Series 11
For HEALTH STATISTICS I Number 16
VITAL and HEALTH STATISTICS DATA FROM THE NATIONAL HEALTH SURVEY
O ral Hygiene in Adults United States- 19604962
Estimates of levels of oral hygiene other demographic characteristics, ferentials by income and education statistical relationship between oral tal disease.
Washington, D.C.
U.S. DEPARTMENT OF
HEALTH, EDUCATION, AND WELFARE John W . Gardner
Secretary
by age, sex, race, and with an analysis of difand an inquiry into the
hygiene and periodon-
June 1966
Public Health Service Will iam H. Stewart
Surgeon General

Public Health Service Publication No. lOOO-Series 11-No. 16
For sale by the Superintendent of Documents, U.S. Government Printing Office Washington, D.C., 20402 - Price 30 cents
NATIONAL CENTER FOR HEALTH STATISTICS FORREST E. LINDER, PH. D., D~WCW
THEODORE Q. ViOOLSEY, Deputy Director
OSWALD K. SAGEN, PH. D., zhsistant Director
WALT R. SIMMONS, M.A., &&&al ~dtisor
ALICE M. WATERHOUSE, M.D., Medical Advisor
JAMES E. KELLY, D.D.S., Dental Advisor
LOUIS R. STOLCIS, M.A., Executie Ojicer
DIVISION OF HEALTH EXAMINATION STATISTICS ARTHUR J. MCDOWELL, Chief
‘1Xv1a GURDON, As&ant Chief
COOPERATION OF THE BUREAU OF THE CENSUS
In accordance with specifications established by the National Health Survey, the Bureau of the Census, under a contractual agreement, participated in the design and selection of the sample, and carried out the first stage of the field interviewing and certain parts of the statistical processing.
Public Health Service Publication No. 1000~Series 11-No. 16
Library o/ Congress Catalog Card Number 6640078

CONTENTS Page
Introduction ________________________________________------------------ 1
Findings ________________________________________--------------------- 2 Age and Sex------------------------------------------------------- 2 Race-------------------------------------------------------------- 3 Other Demographic Variables---------------------------------------- 4 Income and Education----------------------------------------------- 4 Race by Income and Education _--_--- -----_----_- _________ - __________ 6 place of Residence------------------------------------------------- 7
Ora1 Hygiene and periodontal Disease---------- ____-___________________ 7
9
Detailed Tables------------------------------------------------------- 11
Appendix 1. The Dental Examination----------------------------------- 21 Simplified Ora1 Hygiene Index (OHI-S)-------------------------------- 21
Examining for Ora1 Debris -____-_ - _____ - _____ --_-- _-__ - __________ 21 Examining for Ora1 Calculus _-__-_ -------__--_-__--__---- _______-_ 22 Calculating the Index _____________ - ___________r____________ - ______ 22
periodontal Index (pI)----------------------------------------------- 22
Appendix 11. Statistical Notes------------------------------------------ 23 The Survey Design-------------------------------------------------- 23 Reliability--------------------------------------------------------- 23 Sampling and Measurement Error------------------------------------ 23 Expected Values---------------------------------------------------- 24 Adjusted Values---------------------------------------------------- 24 Small Numbers----------------------------------------------------- 25 Tests of Significance------------------------------------------------ 25
Appendix 111. Demographic Terms-------------------------------------- 29

IN THIS REPORT aye included detailed national estimates of oral hyzygiene levels prevailing in U.S. adults by age, sex, yace, and other majoy demographic characteristics. A brief analysis of the variation in oral hygiene occurring at various levels of education and family income is followed by a concluding inquiry into the statistical relationship between oral hygiene and periodontal disease.
All estimates aye based on examinations conducted by the Health Examination Survey in 1960-62 on a probability sample of U.S. adults, aged 18- 79 years, selected from the civilian po@lation at large, Oral hygiene was assessed by the Simplified Oral Hygiene Index, a method by which the extent of debris (soft foreign material loosely attached to the tooth) and the extent of calculus (hardened foreign material firmly attached to the tooth and sometimes called tartar) on at least one of six predesignated teeth aye estimated.
Oral hygiene status was sign@cantly related to many of the basic variables which demographically describe the U.S. population. For example, women weYe found to have cleaner teeth than men, as weYe white men and women in comparison with Negro adults. Oral hygiene also was found to improve with increasing education and with increasing family income. On the other hand, oral cleanliness worsened with advancing age because of a gradual increase in the amount of calculus.
A large part of the diffeerence occurring in oral hygiene by race was attributable to differences in education and income levels. Interestingly, this was true to a much greater extent for men than for women. Oral hygiene was more closely associated with education, however, than it was with family income.
Trends in the oral hygiene status of U.S. adults weye remarkably parallel to trends in periodontal disease in the same population. Analysis of the statistical relationship between the two dental conditions indicated that variations in periodontal disease by sex and yace weYe secondary to underlying diffeerences in oral hygiene. Among persons with equivalent oral hygiene, definite but greatly reduced trends persisted in the amount of periodontal disease by both income and education. Age, however, persisted throughout as a strong and separate factor in the prevalence and severity of periodontal disease.
SYMBOLS
Data not available ____- ______________-_-- ___
Category not applicable------------------- . . .
Quantity zero---------------------------- -
Quantity more than 0 but less than 0.05----- 0.0
Figure does not meet standards of *reliability or precision------------------

ORAL HYGIENE IN ADULTS James E. Kelly, D.D.S., Lawrence E. Van Kirk, Jr., D.D.S., and Caroline C. Garst
Division of Health Examination Statistics A
INTRODUCTION The truth of the matter is that with the exception of relatively few studies there is scant evidence
Oral hygiene has been widely acclaimed and that clean teeth are more resistant to decay than endorsed as an important preventive practice dirty ones.ll 2 which assures better dental health. Americans On the other hand, data collected by numerous brush their teeth with a regularity and a frequency investigators have revealed that periodontal which, by hearsay, are unmatched. Many visit disease increases in prevalence and severity with their dentists at regular intervals for removal increasing degrees of oral uncleanliness.“-g In of hardened deposits-calculus or tartar-which one of these studies, differences in periodontal form on teeth‘ and cling so tightly that dislodge- disease between white and Negro persons were ment by tooth brushing is impossible. Over the noted only when the condition of their oral hygiene years an enormous outlay in both hours and also differed.7 In another, differences in severity dollars is expended in a conscientious effort to by sex were accounted for by variations in oral maintain oral cleanliness. hygiene, and in still another, the incidence of
Far from misspent, the investment by all gingivitis was sharply lowered by a supervised odds is a wise one, since the importance of oral program of oral cleanliness?9 6 cleanliness in preserving sound teeth and sup- To summarize recent survey findings, perioporting structures has up to a point been un- dontal disease can be depicted as increasing in questionably demonstrated. Contrary to popular prevalence and severity with age, oral uncleanliexpectation, however, proper oral hygiene is ness, and descending socioeconomic status. Men probably more beneficial in averting gingival and are more frequently and more severely attacked periodontal disease than in curbing dental decay. than women, and in the United States, Negroes For example, the following Health Examination more than white persons. Some of the observed Survey estimates of the mean number of DMF variations are apparently secondary to differences (decayed, missing, and filled) teeth per person in oral hygiene. It should be noted, however, that give no indication that men and women with better there were at least two instances, a difference oral hygiene (lower index scores) have fewer observed by education and another by race, that teeth attacked by decay than do other persons could not fully be accounted for, suggesting that (see Appendix I): a factor other than hygiene and age may have been
involved.73 g It seems quite clear indeed. that faulty oral
Simplified Oral Hygiene Index hygiene not only invites the onset of periodontal Sex disease but causes it. Although this reasoning is
o.o- 1.1- 2.1- 3.1- 4.1-1.0 2.0 3.0 4.0 6.0
based largely on the close correlation repeatedly established between the two conditions, evidence
Men, 18-34 of a more conclusive nature is to some extent years----- 15.9 14.3 13.3 12.8 15.1 beside the point. In the final analysis, establish-
Women,18-34 ing oral cleanliness and maintaining it have for years----- 17.2 15.0 13.9 13.3 13.5 decades been mainstays in the successful treat-
1

ment of periodontal disease. It is difficult to imagine that they will ever cease to beso, despite the fact that there is still much to be learned about periodontal disease, including its precise relationship with oral hygiene.
In this report, levels of oral hygiene in the U.S. adult population aged 18-79 years are presented by age, sex, race, and other selected demographic characteristics. National estimates of prevalence and distribution are based on examinations in 1960-62 of 6,672 persons selected by probability sampling to represent approximately 111 million adults in the civilian, noninstitutional population. A description of the selection of sample persons, a description and an assessment of the dental examination, and an explanation of the procedure for deriving national estimates were published in earlier reports of the Vital and Health Statistics series.iO> ii
Another section of the present report briefly examines the statistical relationship between oral hygiene and periodontal disease.
Each dental examination was completed under comparable conditions by one of five dentists carefully instructed and uniformly trained to per-form a prescribed examination procedure. Oral hygiene status was determined by the Simplified Oral Hygiene Index (OHI-S), an abridged version of the earlier index (OHI) developed by Greene and Vermillion to assess oral hygiene macroscopically by estimating the amount of foreign matter adhering to the teeth or, in the abbreviated method, adhering to selected surfaces of designated teeth. 12t i3 In the simplified method, as it was used by the Health Examination Survey, the extent of oral debris and the extent of oral calculus are measured on selected surfaces of six pre-designated teeth, or as many of the six as there are. The buccal of upper molars, the lingual of lower molars, and the labial of upper and lower central incisors are included among the assessed surfaces. The proportion (in thirds) of total surface area overlaid by debris and the proportion overlaid by calculus are averaged and summed to give the Simplified Oral Hygiene Index, which ranges from a low of 0.0 (no debris, stain, or calculus) to a maximum of 6.0 (more than two-thirds of the examined tooth surfaces covered with both debris and calculus). Appendix I gives a more detailed description of the examination.
Estimates of oral hygiene levels in this re-port are for men and women who had at least one of the six designated teeth. Based on examinations, approximately 90 million adults fulfilled the requirement, but more than 20 million others-mostly edentulous persons-did not. Exclusion of the latter resulted in a diminishing proportion of persons eligible for oral hygiene assessment within each older age group (fig. l), and within specified age ranges, proportionately fewer white persons than Negroes and fewer women thanmen.
O!20 AGE IN YEARS
Figure I. Percent of persons eligible for oral hygiene assessment, by age.
FINDINGS
Age and Sex
The estimated mean OHI-S for the nearly 90 million men and women with at least one of the six teeth eligible for assessment was 1.5. However, women had perceptibly cleaner teeth
2

than men. The same trend by sex prevailed within each of the various age ranges, resulting in a significantly lower mean score for women than for men-l.3 as contrasted with 1.8 (table 1 and fig. 2).
:1;;40 50 60 70 8030
AGE IN YEARS
Figure 2. Average Simplified Oral Hygiene Index for men and women, by age.
The overall distribution of oral hygiene scores in the adult population is shown in table A.
The favorable balance of low scores in comparison with high scores attests the relatively good level of oral hygiene that prevailed among most adults. Nearly half had little or no debris and calculus (scores of 1 .O or less), and another quarter had so little that their scores did not exceed 2.0. Scores greater than 3.0, indicating serious and probably habitual neglect, were found in only about an eighth of all persons.
As men and women grew older, their oral hygiene slowly but steadily became worse. As a
Table A. Number and percent distribution of persons, by level of Simplified Oral Hygiene Index: United States, 1960-62
Per centSirnplif ied Ora 1 Number of in distri-Hygiene Index persons
thousands bution
Total------ 88,568 1 100.0 I
0*0-1.(-j----------1.1-2*0----------2.1~3.0~---------3*1-4*0----------4.1-6-O----------
result, mean scores rose from a low of 1.5 and 1.2 for the youngest group of men and women, respectively, to a high of 2.5 for men aged 65-74 years and 1.9 for women aged 75-79 years. The gradual deterioration in oral hygiene with time was due to a continuing accretion of calculus. By contrast, debris loosely attached to teeth neither increased nor decreased markedly, but remained relatively constant at all ages.
Mean Simplified Debris and Calculus Indexes, the two components whose sum is the mean Simplified Oral Hygiene Index, also appear in table 1. Until age 75, debris scores for men and women were higher than complementary calculus scores; only in the age group 75-79 years was the reverse true, with the oral hygiene score of the oldest men and women more heavily weighted by calculus. Within any given age group, however, women without fail had both less debris and less calculus than did men.
Race
Pronounced differences in oral hygiene were found to exist by race. The amount of both debris and calculus measured on the teeth of Negro adults usually exceeded the amount measured on white adults. This observation was expressed quantitatively by the mean OHI-S for Negro men and women, 2.2, which was half again larger than the corresponding score for white adults, 1.5.
Mean oral hygiene scores by age, sex, and race are shown in table 2 and in figure 3. The
3

Other Demographic Variables
The prevalence and severity of many dental conditions have been found to vary significantly with differences in income, education, and other
4.5 - 1 demographic variables. For instance, the Health Negro women i Examination Survey found that periodontal disease
1: z D 4.0 - I-- was selectively concentrated in distinct segments
i 2 i of the general U.S. adult popu1ation.l” In the folw 3.5 - i lowing section, the U.S. population has again been5>L subdivided and grouped into graduated levels of
3.0 - income and education; in addition, it has been classified by specified place of residence.
After the population was grouped, anydifferences which appeared in oral hygiene among the various groups, as measured by the Simplified Oral Hygiene Index, were then observed. For ex-
White women ample, mean oral hygiene scores for persons at five different levels of income were compared to determine whether the prevailing level of oral
0,o 20
I 30
I I I I 40 50 60 70 60 hygiene within one income range differed from that
within another. Allowance was made for differ-AGE IN YEARS ences in the age and sex distribution of persons
composing the various groups, since oral hygiene has already been shown to vary importantly by
Figure 3. Average Simplified Oral Hygiene Index both of these characteristics. for white and Negro men and women, by age. Because of the relatively limited number of
sample persons, sampling variability for specific age and sex groups was usually quite large. It is for this reason that summary comparisons of the actual and expected mean Simplified Oral
scores, higher at any given age for Negro than Hygiene Index by sex and race were preferred to
for white men and women, generally increased comparisons of mean age-specific scores.
with advancing age up to 75 years, W ith the ex- Expected values were calculated by weighting
ception of Negro adults aged 75-79 years, men age- and sex-specific mean scores for the total
typically had poorer oral hygiene than did women U.S. population by the age-sex distribution of
of comparable age and race. However, because respective groups. Actual and expected values for
of the small number of sample persons, the sam- the same group may occasionally be expected to differ by chance. But when the difference is notpling variability for the oldest group of adults statistically significant, it can generally be as-
was quite large. sumed that differences between mean oral hygieneIn both races, debris measurements were scores for component age-sex groups fluctuatedtrendless with changes in age. However, older randomly.persons still had increasingly heavier deposits
of calculus. W ithin specified age ranges, the Sim- Income and Educationplified Debris and Calculus Indexes were higher for Negro adults than for white adults, as they The degree of oral cleanliness maintained also were for men as compared with women of by adults varied widely according to their eco the same race. nomic status. The poorest oral hygiene was en-

countered most frequently among persons whose family income was lowest, and, conversely, the best was found among persons whose income was highest (table 3 and fig. 4). Among adults of all races, the largest mean oral hygiene score per person, 2.6, belonged to men whose total family income was under $2,000 per year. As yearly in-come increased, however, oral hygiene improved steadily. ‘The smallest scores, or best hygiene, in any group of men were reported for those whose yearly income was in excess of $9,999.
Oral hygiene was even more highly correlated with. education than with family income (table 4 and fig. 5). Men and women of all races who had attended school for relatively brief periods were more likely to tolerate larger amounts of dental debris and calculus than were persons who had attended school for longer periods. Men who had completed at least 1 year in college had a low
0.9
FAMILY INCOME
mean OHI-S of 1.1. By contrast, the group of men with least formal education had an oral hygiene score nearly threefold greater, 3.0.
Within specified levels of income and education, mean scores continued toreflect appreciable differences in oral hygiene by sex. Without exception, Negro and white women had lower scores than did men of comparable age and race.
Earning power in the United States is closely scaled to educational attainment. Better educated persons usually earn higher salaries than men and women who have had less schooling. Yet, there are grounds for assuming that education and income have essentially different implications insofar as they pertain to dental health. Meager funds, for instance, may sometimes deter persons from seeking dental care, but it is not so clear that ample income alone motivates persons to obtain care, still less to begin more effective
FAMILY INCOME
Figure 4. Differences between actual and expected mean Simplified Oral Hygiene Index for men and women, by family income.

I Under 5-6 S-12 13 years Under 5-0 S-12 13 years
5 years years yews and over 5 years years yeLlr3 and over
EDUCATION EDUCATION
Figure 5. Differences between actual and expected mean Simplified Oral Hygiene Index for men and WCJIXN, by education.
measures of oral hygiene. On the other hand, education presumably instills deeper awareness of the importance of good health and greater conversance with ways to attain it.
In figure 6, the effect of income (independent of education) upon changes in the Simplified Oral Hygiene Index is examined. As demonstrated, mean scores continued to vary inversely with family income. Adjustment for differences in education, however, reduced the variance of the mean Oral Hygiene Index attributable to income to approximately a quarter of its former value. This indicates, as forecast, that education exercised a stronger influence on oral hygiene than did family income.
Race by income and Education
A significantly large part of the difference observed in oral hygiene by race was accounted for by differences in income and education (table 5). However, when either income or education was kept constant, a greater reduction between mean scores by race resulted for men than for women. There were no differences between the mean Simplified Oral Hygiene Indexes of Negro and white men with less than 5 years and with 5-8 years of schooling, and there was relatively little for those who had completed at least 1 year of high school. Because proportionately few Negro adults had family incomes exceeding $6,999

FAMILY INCOME WITH ADJUSTMENT FOR EDUCATION
Figure 6. Differences between actual and expected mean Simplified Oral Hygiene Index for men and women, by income adjusted for education.
per year or education beyond high school, average scores could not be meaningfully compared at these levels.
Place of Residence
Estimates of the mean Simplified Oral Hygiene Index for men and women residing in three regions of the country were as follows:
Men Women Northeast------------ 1.7 1.3 South __________ --_-_- 1.9 1.3 West ___________-____ 1.9 1.3
The estimates did not vary widely enough to indicate significant regional variation in oral hygiene. However, it should be noted that the three geographic regions defined by the Health Exami
nation Survey were extremely broad and did not conform with any of the more familiar definitions.
Estimates of oral hygiene were alsoobtained by place description, population size, and urban-rural residence (tables 6-8). W ithout exception, white rural residents-both farm and nonfarm-had significantly higher scores than did the white residents of nonrural areas. Other estimates of oral hygiene by place of residence did not vary significantly.
ORAL HYGIENE AND PERIODONTAL
DISEASE The exposition of findings on oral hygiene in
U.S. adults has closely followed in format a previous report which described the occurrence of periodontal disease in the same population.14 The format was repeated to put greater stress on the
7

many striking analogies existing in the two conditions. These include a worsening with ageof one and an increase with age in the prevalence and severity of the other. In addition, among persons of the same age, poorer oral hygiene and more periodontal disease were found in men than in women and inNegroes than in white adults. Finally, both oral hygiene and periodontal scores varied inversely with educational attainment and family income.
Oral debris and calculus have long been regarded as, at the very least, important contributing factors within the perplexing pathologic nexus clinically manifested as periodontal disease. The extremely high frequency with which the two conditions occur conjointly has largely been responsible for a growing conviction that poor oral hygiene actually causes periodontal disease. Findings of the present survey furnish neither proof positive, which rarely if ever results from an epidemiological study, nor even so much as new evidence on the nature of the linkage between oral hygiene and periodontal disease. They nonetheless tellingly demonstrate the close relationship of the dual conditions in a broadly representative sample of U.S. adults.
In table 9, mean periodontal scores are displayed by age and sex within specified ranges of the Simplified Oral Hygiene Index. Abrupt, step-like increases in mean periodontal scores, coincident with increasing levels of the Simplified Oral Hygiene Index, affirm the strong association between oral hygiene and periodontal disease. For instance, white men whose indexrangedfrom 0.0 through 1.0 had a mean periodontal score of only 0.37, whereas those with indexes greater than 4.0 had a mean periodontal score of 4.20. Equally large gradients were obtained for both men and women regardless of their race.
The contents of table 9 suggest at once an underlying explanation for variations in periodontal disease contingent upon sex and race. With the Simplified Oral Hygiene Index constant, significant differences in the mean Periodontal Index by sex and by race disappear. To put it briefly, as long as men and women of the same age (either white or Negro) had the same level of oral hygiene, they also had the same level of periodontal disease. Furthermore, almost all of the variation in periodontal disease associated with income and education was accounted for by oral hygiene
(tables 10and 11). Although it is perhaps simplistic to ascribe to oral debris and calculus the role of causal agent, periodontal disease in U.S. adults has behavedstatistically as though it were a function of oral hygiene.
Age, on the other hand, apparently was in-dependently correlated with periodontal disease, for, unlike variations by sex and race, variations occurring with age did not correspond with differences in oral hygiene. For example, the Periodontal Index for older persons was significantly higher than that for younger persons who had an equivalent level of oral cleanliness (fig. 7).
Debris and calculus, the components of poor oral hygiene, were both highly correlated with periodontal disease. Holding the former or the latter constant greatly narrowed the margin of difference between the mean Periodontal Indexes by sex and race (table 9). Residual differences were greater, however, when the Simplified Debris Index was constant, indicating a higher correlation between calculus and periodontal disease than between debris and periodontal disease.
Analysis of the several interrelated factors in oral hygiene and periodontal disease is complicated by the more chronic nature of calculus and destructive periodontal disease, both of which become increasingly severe with age compared with the more acute and often transitory nature of debris and gingivitis. As expected, the two component indexes, as well as the composite Simplified Oral Hygiene Index, were more sensitively associated with periodontal disease in younger adults than in older ones.
The relationship of oral hygiene and destructive periodontal disease can be examined first-hand by considering the percent of persons with periodontal pockets while at the same time con-trolling for both debris and calculus. People accordingly were placed into one of nine groups which ranged in order from a low for both debris and calculus to a high for both conditions. The percent of persons in each group actually having periodontal pockets and the percent expected to have them, by dint of their age-sex composition, were computed. As the last step, differences between actual and expected values were obtained.
In table 12 it will be noted thatthe percent of persons with advanced disease increased in relation to expected or average values when the Simplified Calculus Index increased and debris
8

I,0 -
0.0 20 30 40 50 60 70 00 20 30 40 50 60 70 60
AGE IN YEARS AGE IN YEARS
Figure 7. Mean Periodontal Index for men and women, by age and by specified levels of the Simplified Oral Hygiene Index.
was constant, and also when the reverse conditions prevailed. The smallest percent of persons with periodontal pockets was in the group whose debris and calculus scores were lowest; the largest per-cent was in the group with highest debris and calculus scores. Thus, both debris and calculus appeared to exert an independent influence upon destructive periodontal disease.
SUMMARY
In spite of wide acceptance as an essential safeguard for lasting dental health, oral hygiene was gravely neglected by a mu ltitude of U.S. adults. Wh ile it is true that men and women on
the whole observed a fairly good level of oral cleanliness, more than one out of four had sub-standard levels ranging from barely adequate to injuriously poor.
National estimates of oral hygiene are based on the examination in 1960-62 of a probability sample of 6,672 persons from the civilian, n’oninstitutional population 18-79 years of age. Oral hygiene was assessed by the Simplified Oral Hygiene Index, a method requiring the presence of at least one of six predesignated teeth.
Healthier levels of oral hygiene were found in women than in men. As a result, the mean Simplified Oral Hygiene Index, which ranges from a low of 0.0 (no debris, calculus, or stain present)
9

to a high of 6.0 (more than two-thirds of the examined tooth surfaces covered by both debris and calculus), was estimated to be 1.3 for women and 1.8 for men. Because of a slow but steady accumulation of calculus, oral hygiene in both men and women became progressively worse with advancing age. By contrast, the quantity of debris showed no appreciable trend with age, but stayed comparatively constant.
Relatively large differences in oral hygiene were found by race. The mean oral hygiene score for Negro men and women was 2.2, an estimate which was half again higher than the corresponding score for white adults (1.5). Moreover, mean scores at any given age were higher for Negro adults than for white men and women.
Oral hygiene also varied markedly by levels of family income and education. Poorer oral hygiene was found more often among persons with low income rather than high and among persons who had less education. Oral hygiene, however, was more closely associated with education than with income.
Much of the difference observed in oral hygiene by race was attributed to corresponding differences in family income and education. With either variable constant, however, differences by race were more sharply reduced for men than they were for women.
The oral hygiene status of white adults re-siding in rural areas was decidedly less adequate than that of white urban dwellers. Variation by other specified places of residence and by region was negligible.
Many demographic variations in the distribution of periodontal disease were resolved in full or in large measure by analysis of the relation-ship between oral hygiene and periodontal disease. Among persons with equivalent levels of oral hygiene, periodontal disease continued to show slight but consistent trends with education and family income, but trends by sex and race were no longer apparent. Age, on the other hand, persisted as a strong and separate factor in the prevalence and severity of periodontal disease.
REFERENCES IFosdick, L.S.: The reduction of the incidence of dental
caries. I, Immediate tooth-brushing with a neutral dentifrice. J.Am.Dent.A. 40:133, Feb. 1950.
2Weisenstein, P., Radike, A., and Robinson, H.B.G.: Clininal studies of dental caries in small groups of children-dentifrice, brushing, and participation effects; abstracted, J. Dent.Res. 33:690, Oct. 1954.
3Lovdal, A., Arno, A., and Waerhaug, J.: Incidence of clinical manifestation of periodontal disease in light of oral hygiene and calculus formation. J.Am.Dent.A. 56:21, Jan. 1958.
4Lovda1, A., and others: Combined effect of subgingival scaling and controlled oral hygiene on the incidence of gingivitis. Acta odont.scandinav. 19:537, Dec. 1961.
5Schei, O., and others: Alveolar bone loss as related to oral hygiene and age. J.Periodont. 30:7, Jan. 1959.
6Greene, J.C.: Oral hygieneand periodontal disease. Am. J.Pub.HeaZth 53:913, June 1963.
‘IRussell, A.L., and Ayers, P.: Periodontal disease and socioeconomic status in Birmingham, Ala. Am.J.Pub.Health 50:206, Feb. 1960.
8Englander, H.R., and White, C.L.: Periodontal and oral hygiene statusof teen-agers in optimum and fluoride-deficient cities. J.Am.Dent.A. 68:173, Feb. 1964.
‘Greene, J.C.: Periodontal disease in India, report of an epidemiological study. J.Dent.Res. 39:302, Mar.-Apr. 1960.
lONational Center for Health Statistics: Plan and initial program of the Health Examination Survey. Vital and Health Statistics. PHS Pub. No. 1000-Series l-No. 4. Public Health Service. Washington. U.S. Government Printing Office, July 1965.
llNationa1 Center for Health Statistics: Selected dental findings in adults by age, race, and sex. Vital and Health Statistics. PHS Pub. No. lOOO-Series ll-No. 7. PublicHealth Service. Washington. U.S. Government Printing Office, Feb. 1965.
IsGreene, J.C., and Vermillion, J.R.: The simplified oral hygiene index. J.Am.Dent.A. 68:7, Jan. 1964.
ISGreene, J.C., and Vermillion, J.R.: The oral hygiene index, a method for classifying oral hygiene status. J.Am. Dent.A. 61:172, Aug. 1960.
l$National Center for Health Statistics: Periodontal disease in adults. Vital and Health Statistics. PHS Pub, No. lOOO-Series 11-No. 12. Public Health Service. Washington. U.S. Government Printing Office, Nov. 1965.
15National Center for Health Statistics: Cycle I of the Health Examination Survey, sample and response. Vital and Health Statistics. PHS Pub. No. lOOO-Series H-No. 1. Public Health Service. Washington. U.S. Government Printing Office, Apr. 1964.
000
10

Table 1.
2.
3.
4.
5.
6.
7.
8.
9.
10.
11.
12.
DETAILED TABLES
Page
by age: United Hygiene, Debris, and Calculus Indexes for men and women,
12Average Simplified
States,Oral
1960-62---------------------------------------------------
Average Simplified Oral Hygiene, Debris, and Calculus Indexes for white and Negro men and women, by age: United States, 1960-62------------------------------ 13
Actual and expected average Simplified Oral Hygiene Index for men and women, by race and family income: United States, 1960-62----------------------------------- 14
Actual and expected average Simplified Oral Hygiene Index for men and women, by race and education: United States, 1960-62--------------------------------------- 15
Mean Simplified Oral Hygiene Index for white and Negro men and women, by familyincome and education: United States, 1960-62------------------------------------- 15
Actual and expected average Simplified Oral Hygiene Index for men and women, by race, and place description: United States, 1960-62------------------------------ 16
Actual and expected average Simplified Oral Hygiene Index for men and women, by race and urban-rural residence: United States, 1960-62--------------------------- 16
Actual and expected Simplified Oral Hygiene Index for men and women, by race and population-size group: United States, 1960-62------------------------------------ 17
Average Periodontal Index for white and Negro men and women, by Simplified Oral Hygiene, Debris, and Calculus Indexes: United States, 1960-62-------------------- 18
Differences between actual and expected levels of the average Periodontal Index forStates,
men and women, by family income and Simplified Oral Hygiene Index: United 191960-62------------------------------------------------------------------
Differences between actual and expected levels of the average Periodontal Index for men and women, by education and Simplified Oral Hygiene Index: United States,
201960-62--------------------------------------------------------------------------
Differences between actual and expected percent of men and women with periodontalpockets, by Simplified Debris and Calculus Indexes: United States, 1960-62------ 20
11

Table 1. Average Simplified Oral Hygiene, Debris, and Calculus Indexes for men and women, by age:United States, 1960-62
-Simplified Simplified SimplifiedOralSex and age Hygiene Debris Calculus
Index Index Index
Both sexes
Tot-l, 18-79 years------------------------------------ 1.5 0.9 0.6
Men
Total, 18-79 years------------------------------------ 1.8 1.1 0.7
18-24 years------------------------------------------------- 1.5 1.1 0.4
25-34 years------------------------------------------------- 1.6 1.0 0.6
35-44 years------------------------------------------------- 1.7 1.0 0.7
45-54 years------------------------------------------------- lo9 1.1 0.8
55-64 years------------------------------------------------- 2.1 1.2 0.9
65-74 years------------------------------------------------- 2.5 1.4 1.1
75-79 years------------------------------------------------- 2.2 1.0 1.2
Women
Total, 18-79 years------------------------------------ 1.3 0.8 0.5
18-,24 years------------------------------------------------- 1.2 0.9 0.3
25-34 years------------------------------------------------- 1.2 0.8 0.4
35-44 years------------------------------------------------- 1.2 0.8 0.5
45-54 years------------------------------------------------- 1.5 0.8 0.7
55-64 years------------------------------------------------- 1.6 0.9 0.7
65-74 years------------------------------------------------- 1.6 0.9 0.7
75-79 years------------------------------------------------- 1.9 0.9 1.0
12

Table 2. Average Simplified Oral Hygiene, Debris, and Calculus Indexes for white and Negro men and women, by age: United States, 1960-62
- - -I
Simplified Oral Simplified Simplified
Sex and age T Hygiene Index r Debris Index r Calculus Index
White Negro White Negro White Negro
Both sexes
Total, 18-79 years----------- 1.5 2.2 0.9 1.2 0.6 1.0
Men-
Total, 18-79 years----------- 1.7 2.4 1.0 1.3 0.7 1.1
18-24 years------------------------ 1.5 2.0 1.1 1.3 0.4 0.7 25-34 years------------------------ 1.6 2.0 1.0 1.1 0.6 0.9 35-44 years------------------------ 1.7 2.5 1.0 1.3 0.7 1.2 45-54 years------------------------ 1.9 2.6 1.1 1.4 0.8 1.2 55-64 years------------------------ 1.9 2.8 1.1 1.5 0.8 1.3 65-74 years------------------------ 2.5 3.3 1.4 1.6 1.1 1.7 75-79 years------------------------ 2.1 2.7 1.0 0.9 1.1 1.8
Women
Total, 18-79 years----------- 1.3 2.0 0.8 1.1 0.5 0.9
18-24 years------------------------ 1.1 1.8 0.8 1.1 0.3 0.7 25-34 years------------------------ 1.1 1.9 0.7 1.1 0.4 0.8 35-44 years------------------------ 1.1 1.8 0.7 1.0 0.4 0.8
45-54 years------------------------ 1.4 2.3 0.8 1.1 0.6 1.2 55-64 years------------------------ 1.4 2.7 0.8 1.3 0.6 1.4 65-74 years------------------------ 1.6 2.3 0.9 1.2 0.7 1.1 75-79 years------------------------ 1.5 4.6 0.7 2.3 0.8 2.3
13

-----------------------
Table 3. Actual and expected average Simplified Oral Hygiene Index for men and women, by race and family income: United States, 1960-62
Men Women Race and income
Actual Expected Difference Actual Expected Difference
All races
Under $z,OOO------------------------ 2.6 1.9 0.7 1.9 1.4 0.5 $2,00()-$3,ggg -----______----_-_----- 2.2 1.8 0.4 1.6 1.3 0.3 $4,000-$6,999----------------------- 1.8 1.8 0.0 1.2 1.3 -0.1 $7,ooo-$g,ggg----------------------- 1.5 1.8 -0.3 1.1 1.3 -0.2 $10,000 and over-------------------- 1.2 1.8 -0.6 0.9 1.4 -0.5 Unknown----------------------------- 2.1 1.8 0.3 1.5 1.4 0.1
White
Under $z,OOO------------------------ 2.5 1.8 0.7 1.5 1.3 0.2 $2,000-$3,ggg ----_--_-__-_---_--_--- 2.1 1.7 0.4 1.6 1.2 0.4 $4,000-$6,999----------------------- 1.8 1.7 0.1 1.2 1.2 0.0 $7,ooo-$g,ggg----------------------- 1.4 1.7 -0.3 1.1 1.2 -0.1 $10,000 and over-------------------- 1.1 1.8 -0.7 0.9 1.2 -0.3 Unknown----------------------------- 2.1 1.8 0.3 1.4 1.3 0.1
Negro
Under $2,000------------------------ 2.7 2.5 0.2 2.4 2.1 0.3 $2,000-$3,ggg----------------------- 2.3 2.5 -0.2 1.8 2.0 -0.2 $4,000-$6,999----------------------- 2.4 2.3 0.1 1.6 1.9 -0.3 $7,ooo-$g,ggg 2.3 2.3 0.0 1.4 1.9 -0.5 $lO,O()O and over-------------------- 2.2 2.4 -0.2 1.2 1.8 -0.6 Unknown----------------------------- 2.1 2.5 -0.4 2.3 2.0 0.3
NOTE: Computation of expected values explained in Appendix II.
14

Table 4. Actual and expected average Simplified Oral Hygiene Index for men and women, by race and education: United States, 1960-62
- -
T T Women Race and education
Actual Expected Xfference Actual Expected Difference
All races
Under 5 years-----------------------5-8 years --------------_-----_______ g-12 years--------------------------13 years and over-------------------
White
Under 5 years-----------------------5-8 years ---__------_-----__________ 9-12 years ---------__-_----_________ 13 years and over-------------------
Negro
Under 5 years-----------------------5-8 years---------------------------9-12 years--------------------------13 years and over-------------------
2.0 E 1.4
E -0:1 ?';1:8 -0.7 1:3
::i Z 2:
2: -E ::;
95' -$4; z 213 -012 1:9 2.4 0.4 2.0
NOTE: Computation of expected values explained in Appendix II.
Table 5. Mean Simplified Oral Hygiene Index for white and Negro men and women, by family income and education: United States, 1960-62- -
T Men r Women Family income and education
White' Negro White1 Negro
Family income
Education
Under 5 years --_---_-__-_---___--____________________---5-8 years ----_--_---___-_--__--------------------------- z 9-12 years --_--__--__--__----_-------------------------- 119
lvalue for white population adjusted to be comparable with value for Negro population. Computation explained in Appendix II.
15

Table 6. Actual and expected average Simplified Oral Hygiene Index for men and women, by race and place description: United States, 1960-62- -- r Men T
Race and place description Actual Expected Difference Actual Expected Difference
All races
SMSA-in central city---------------- 1.8 0.0 SMSA-outside central city----------- ::6" -H:E ::4 -0.1Urban not SMSA---------------------- .Rural farm-------------------------- E i-3 ifiRma 1 nonfarm-- _ _ -__ _ _ -_ _ --_ __ __ ___ _ 2:1 i:: 1:5 012
White
SMSA-in central city---------------- -0.1 SMSA-outside central city----------- 1':; i-87 -0.2 1':: Eurban not SMSA---------------------- 117 0.0Rural farm-------------------------- ::: i*: I:;Rural nonfarm----------------------- 2.0 2; FE 1:4 .
Negro
SMSA-in central city---------------- -0.1 SMSA-outside central city----------- f *"d t:“; -2; 1':; 5-i -0.3Urban not SMSA---------------------- 2:6 2:1Rural farm-------------------------- 4-z i?iRm-1 nonfarm----------------------- 22:: 2:4 3:; 0:2
NOTE: Computation of expected values explained in Appendix II.
Table 7. Actual and expected average Simplified Oral Hygiene Index for men and women, by race and urban-rural residence: United States, 1960-62- -
Race and urban-rural residence l- Men r Women
Actual Expected Difference Actual Expected Difference
All races
Urban------------------------------- -0.1Rural------------------------------- 0.2 ::2 ;:3
White
Urban------------------------------- 1.7 1.2Rural------------------------------- 1.9 E 1’:: 1.2
Negro
Urban------------------------------- 2.4 0.0Rwral------------------------------- 2.6 0.1 3:; Z
NOTE: Computation of expected values explained in Appendix II.
16

Table 8. Actual and expected Simplified Oral Hygiene Index for men and women, by race and population-size group: United States, 1960-62-
T - Men Women Race and population-size group
Actual Zxpected Difference lctual Expected Difference
All races
Giant metropolitan areas------------
Other very large metropolitan areas-
Other standard metropolitanstatistical areas------------------
Other urban areas-------------------
Rural areas-------------------------
White
Giant metropolitan areas------------
Other very large metropolitan areas-
Other standard metropolitanstatistical areas------------------
Other urban areas-------------------
Rural areas-------------------------
Negro
Giant metropolitan areas------------
Other very large metropolitan areas-
Other standard metropolitanstatistical areas------------------
Other urban areas-------------------
Rural areas-------------------------
1.7 1.8
1.7 1.8
1.7 1.8
1.9 1.8
2.1 1.8
1.7 1.8
1.7 1.7
1.6 1.7
1.8 1.7
2.0 1.7
2.3 2.3
2.1 2.3
2.5 2.5
2.6 2.5
2.5 2.5
-0.1 1.3 1.4 -0.1
-0.1 1.4 1.3 0.1
-0.1 1.2 1.3 -0.1
0.1 1.3 1.3 0.0
0.3 1.6 1.3 0.3
-0.1 1.3 1.3 0.0
0.0 1.3 1.2 0.1
-0.1 1.1 1.2 -0.1
0.1 1.2 1.2 0.0
0.3 1.4 1.2 0.2
0.0 1.6 2.0 -0.4
-0.2 2.3 2.0 \ 0.3
0.0 2.1 2.1 0.0
0.1 2.0 2.0 0.0
0.0 2.4 2.1 0.3
Note: Computation of expected values explained in Appendix II.
17

Table 9. Average Periodontal Index for white and Negro men and women, by Simplified Oral Hygiene,Debris, and Calculus Indexes: United States, 1960-62-r Men Women Index levels
White Negro White Negro
Simplified Oral Hygiene Index
Adjusted totall-------------------------------------
O.O-l.O-------------------------------------------------1.1-2.0-------------------------------------------------2.1-3.0-------------------------------------------------3.1-4.0-------------------------------------------------
4.1-6.0 -------_--_--_---_-------------------------------
Debris Index
Adjusted totall-------------------------------------
O.O-l,O------------------------------------------------1.1-2.0-------------------------------------------------2.1-3.0-------------------------------------------------
Calculus Index
Adjusted total'-------------------------------------
O.O-l.O-------------------------------------------------1.1-2.0-------------------------------------------------2.1-3.0-------------------------------------------------
1.21 1.77 0.81 1.41
1.79 1.77 1.42 1.41
0.37 0.23 0.31 0.25 0.98 1.04 0.91 1.11 1.65 1.55 1.68 1.71 2.99 2.96 2.85 2.48 4.20 4.36 4.21 4.28
1.50 1.77 1.11 1.41
0.65 0.89 0.54 0.80 1.89 2.25 1.63 1.92 3.38 3.52 2.89 3.49
1.65 1.77 1.27 1.41
0.67 0.92 0.51 0.83 2.19 2.20 2.03 1.91 3.93 3.92 3.89 3.70
'Value for white population adjusted to be comparable with value for Negro population. Computation explained in Appendix II.
18

Table 10. Differences between actual ur $2and expected levels of the average Periodontal Index for men and women, by family income and Simplified Oral Hygiene Index: United States, 1960-62
Family income Simplified Oral Hygiene Index
and over Unknown
-Men Differences
Total------------------------- r0.55 0.22 0.05 -0.30 -0.59 0.28
Adjusted total------------------ 0.06 -0.03 0.06 -0.02 -0.03 0.05
0.0-1-o----------------------------- 0.13 -0.03 0.02 -0.05 -0.01 0.06 1.1-2.0----------------------------- 0.01 0.07 0.00 -0.01 -0.19 0.18 2.1-3.0----------------------------- 0.08 -0.33 0.22 0.09 -0.20 0.00 3.1-4.0 --___---____-_---__-_________ -0.29 0.00 0.30 -0.37 -0.06 0.26 4.1-6.0----------------------------- 0.06 0.28 -0.18 0.50 1.03 -0.78
Women
Total------------------------- 0.43 0.25 -0.06 -0.25 -0.40 0.10 -
Adjusted total------------------ 0.04 0.10 0.01 -0.13 -0.17 -0.01
-0.02 0.12 0.03 -0.03 -0.08 -0.06 0.05 0.18 -0.03 -0.23 -0.07 0.09 0.10 0.03 0.08 -0.22 -0.21 -0.10
-0.30 -0.16 0.48 -0.10 -0.17 0.17 0.88 0.20 -0.98 -0.34 -1.48 -0.08
NOTE: Computation of adjusted values explained in Appendix Il.
19
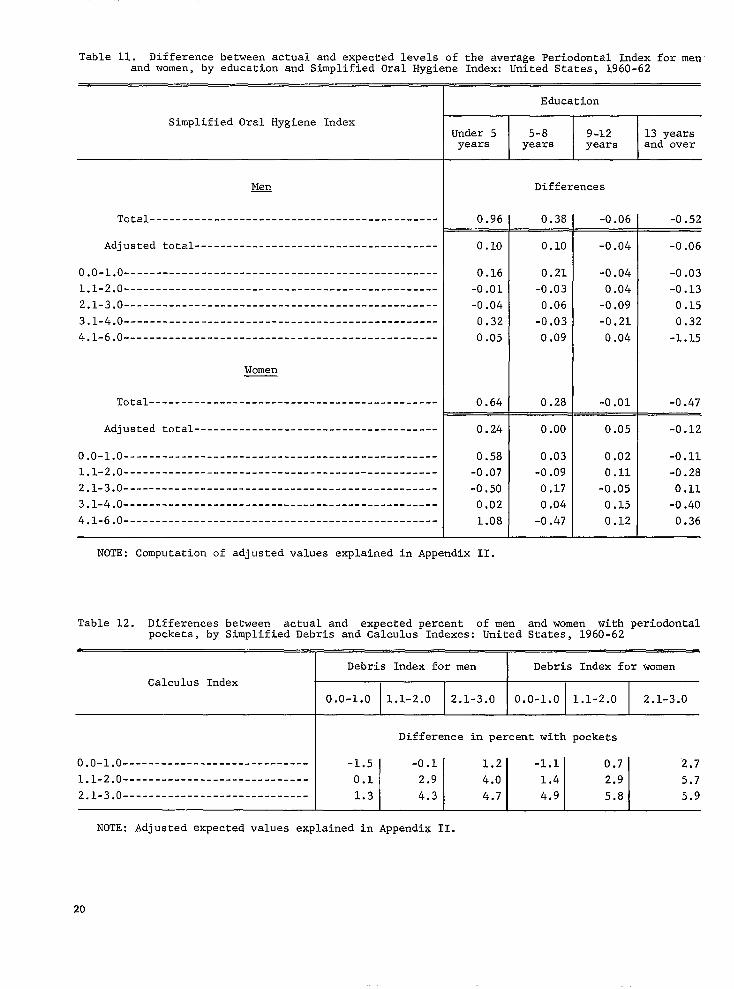
Table 11. Difference between actual and expected levels of the average Periodontal Index for men and women, by education and Simplified Oral Hygiene Index: United States, 1960-62
Education
Simplified Oral Hygiene Index
Men Differences
Total--------------------------------------------- 0.96 0.38 -0.06 -0.52 -
Adjusted total-------------------------------------- 0.10 0.10 -0.04 -0.06
0.16 0.21 -0.04 -0.03 -0 .Ol -0.03 0.04 -0.13 -0.04 0.06 -0.09 0.15
0.32 -0.03 -0.21 0.32 0.05 0.09 0.04 -1.15
Women
Total--------------------------------------------- 0.64 0.28 -0 .Ol -0.47
Adjusted total-------------------------------------- 0.24 0 .oo 0.05 -0.12
O.O-l.O------------------------------------------------- 0.58 0.03 0.02 -0.11 1.1-2.0------------------------------------------------- -0.07 -0.09 0.11 -0.28 2.1-3.0------------------------------------------------- -0.50 0.17 -0.05 0.11 3.1-4.0------------------------------------------------- 0.02 0.04 0.15 -0.40 4.1-6.0------------------------------------------------- 1.08 -0.47 0.12 0.36
NOTE: Computation of adjusted values explained in Appendix II.
Table 12. Differences between actual and expected percent of men and women with periodontalpockets, by Simplified Debris and Calculus Indexes: United States, 1960-62
Debris Index for men Debris Index for women Calculus Index
0.0-1.0 1.1-2.0 2.1-3.0 0.0-1.0 1.1-2.0 2.1-3.0
Difference in percent with pockets
O .O-l.O----------------------------- -1.1 0.7 2.7-1.5 -0.1 1.2 1.1-2.0----------------------------- 0.1 2.9 4.0 1.4 2.9 5.7 2.1-3.0----------------------------- 1.3 1 4.3 I 4.7 4.9 5.8 5.9
NOTE: Adjusted expected values explained in Appendix II.
20

APPENDIX I
THE DENTAL EXAMINATION
The Health Examination Survey was intended, at its inception as it is today, to gather comparable information on the health status of the U.S. population. In keeping with this goal, its dental examination procedure is rigidly standardized so that several examiners canobtaintheir findings on a more uniform basis than would otherwise be possible. ‘The examination includes observation of the condition of each tooth-whether, for instance, it is decayed, filled, or missing-as well as so-called index assessment of oral hygiene and periodontal disease. Each examination is completed by one of five different dentists who use a mouth mirror and explorer.
Early in this report the mean numbers of decayed, missing, and filled (DMF) teeth per person for men and women 18-34 years old are cited, at various levels of oral hygiene, as a measure of the attack rate of dental decay. For anyone at any age, DMF teeth can be defined as the sum total of permanent teeth that are decayed, filled, and missing or indicated for extraction. In younger adults, who lose relatively few teeth because of periodontal disease, each DMF tooth is a count of at least one previous incident of decay. Thus, DMF teeth collectively are a measure of the accrued toll of dental decay in the permanent dentition of younger men and women.
It should also be noted that DMF counts in this report are based on 32 teeth, including third molars. Since unerupted third molars are not identified, they are included, along with extracted molars, in counts of missing teeth. This procedure results in over-estimates of DMF counts as a measure of the impact of dental disease, especially for younger adults, many of whom have unerupted third molars.
Descriptions of the Simplified Oral Hygiene Index and the Periodontal Index follow.
SIMPLIFIED ORAL HYGIENE INDEX (OHI-S)
Selected surfaces of six teeth are used in making this estimation of oral hygiene status. For the purposes of this examination, each surface that is used, buccal or lingual, is considered to encompass half of the circumference of the tooth. The buccal surface of a molar, for example, is considered to include half of the mesial surface and half of the distal.
The posterior teeth used for the assessment are the first fully erupted teeth distal to the bicuspid area on each side of each arch. In most cases this will be a first molar, but in others it may be a second or third molar. The buccal surfaces of upper molars and the lingual of lowers are examined. In the anterior portion of the mouth, the labial surfaces of the upper right central incisor and the lower left central incisor are examined. When one or both of these teethare missing, the adjacent central incisor is substituted.
Examining for Oral Debris
The surface area covered by debris is estimated by running a number five explorer along the surface being examined and noting the occlusal or incisal extent of the debris as it is removed from the tooth surface and adheres to the explorer.
Scoring:
0 - No debris or stain present. 1 - (a) Soft debris covering not more than the
gingival third of the tooth surface, or (b) the presence of the extrinsic stains without
debris regardless of surface area covered.
27

2 - Soft debris covering more than one-third but not more than two-thirds of the exposed tooth surface.
3 - Soft debris covering more than two-thirds of the exposed tooth surface.
Examining for Oral Calculus
A number five explorer is also used to estimate surface area covered by supragingival calculus and to probe for subgingival calculus.
Scoring:
0 - No calculus present. 1 - Supragingival calculus covering not more than
one-third of the exposed tooth surface. 2 - Supragingival calculus covering more than
one-third but not more than two-thirds of the exposed tooth surface, and/or the presence of individual flecks of subgingival calculus around the cervical portion of the tooth.
3 - Supragingival calculus covering more than two-thirds of exposed tooth surface and/or a continuous heavy band of subgingival calculus around the cervical portion of the tooth.
Calculating the Index
The debris scores are totaled and divided by the number of surfaces scored to obtain the Simplified Debris Index. The Simplified Calculus Index is deter
-oo
mined similarly. The debris and calculus scores are then added to give the Simplified Oral Hygiene Index.
PERIODONTAL INDEX (PI)
A periodontal score is recorded for each tooth in the mouth, and the arithmetic average of all scores is the individual’s Periodontal Index.
Scoring:
0 - Negative. There is neither overt inflammation in the investing tissues nor loss of function due to destruction of supporting tissues.
1 - Mild gingivitis. There is an overt area of inflammation in the free gingivae, but this area does not circumscribe the tooth.
2 - Gingivitis. Inflammation completely circumscribes the tooth, but there is no apparent break in the epithelial attachment.
6 - Gingivitis witkpocketformatim. ‘The epithelial attachment has been broken and there is a a pocket (not merely a deepened gingival crevice due to swelling in the free gingivae). There is no interference with normal masticatory function, the tooth is firm in its socket, and has not drifted.
8 - Advanced destmction with loss of masticatoYY function. The tooth may be loose; may have drifted; may sound dull on percussion with a metallic instrument; may be depressible in its socket.
22

APPENDIX II
STATISTICAL NOTES
The Survey Design
The first cycle of the Health Examination Survey employed a highly stratified multistage probability design in which a sample of the civilian, noninstitutional population of the conterminous UnitedStates 18-79 years of age was selected. At the first stage, a sample of 42 primary sampling units (PSI-l’s) was drawn from among the 1,900 geographic units into which the United States was divided. Random selection was controlled within regional and size-of-urban-place strata into which the units were classified. As used here a PSU is a standard metropolitan statistical area or one tothree contiguous counties. Later stages result in the random selection of clusters of typically about four persons from a neighborhood within the PSU. The total sample included some 7,700 persons in 29 different States. The detailed structure of the design and the conduct of the Survey have been described in previous reports.“‘,‘”
Reliability
The methodological strength of the Survey derives especially from its use of scientific probability sampling techniques and highly standardized and closely con-trolled measurement processes. This does not imnlv that statistics from the Survey are exact or without error. Data from the Survey are imperfect for three major reasons: (1) results are subject to sampling error, (2) the actual conduct of a survey never agrees perfectly with the design, and (3) the measurement processes themselves are inexact even though standardized and controlled.
The first-stage evaluation of the Survey was re-ported in reference 15, which dealt principally with an analysis of the faithfulness with which the sampling design was carried out. This study notes that out of the 7,700 sample persons the 6,670 who were examined-a response rate of over 86 percent-gave evidence that they were a highly representative sample of the civilian, noninstitutional population of the United States. Imputation of nonrespondents was accomplished by attributing to nonexamined persons the characteristics of comparable examined persons as described in reference 15. The specific procedure used amounted to inflating the sampling weight for each examined
person in order to compensate for sample persons at that stand of the same age-ses group who were not esamined.
It is impossible to be certain that theOral Hygiene Indes is the same in the examined and the nonexamined groups. There were 6,672 persons who came in for examination. Of these, 19 did not receive a dental esamination. Another 1.170 did not receive an oral hygiene score because they were edentulous. and 101 did not receive a score for other reasons. Thus a total of 5,382 persons received oral hygiene scores. The distribution of these persons by age and sex is given in table I.
Sampling and Measurement Error
In the present report, reference has been made to efforts to minimize bias and variability of the measurement techniques.
The probability design of the Survey makes possible the calculation of sampling errors. Traditionally the role of the sampling error has been the determination of how imprecise the survey results may be because they come from a sample rather than from the measurement of all elements in the universe.
The estimation of sampling errors for a study of the type of the Health Examination Survey is difficult for at least three reasons: (1) measurement error and “pure” sampling error are confounded in the data-it is not easy to find a procedure which will either completely include both or treat one or the other separately, (2) the survey design and estimation procedure are comples and, accordingly, require computationally involved techniques for the calculation of variances, and (3) from the survey are coming thousands of statistics, many for subclasses of the population for which there are a small number of sample cases. Estimates of sampling error are obtained from the sample data and are themselves subject to sampling error when the number of cases in a cell is small or, even occasionally, when the number of cases is substantial.
Estimates of approximate sampling variability for selected statistics used in this report are presented in tables IIand III. These estimates have been prepared by a replication technique which yields overall varia-
23

bility through observation of variability among random subsamples of the total sample. The method reflects both “pure” sampling variance and a part of the measurement variance.
In accordance with usual practice, the interval estimate for any statistic may be considered the range within one standard error of the tabulated statistic, with 68 percent confidence; or the range within two standard errors of the tabulated statistic, with 95 percent confidence.
Expected Values
In tables 3. 4, and 6-8, the actual mean Simplified Oral Hygiene Index for each of the selected demographic variables is compared with the expected. The computation of expected rates was done as follows:
Suppose that in a subgroup the Health Examination Survey estimates that there are Ni persons
in the i th age-sex-race group (;=I,2 . . .42, sum of Ni =N).
Suppose the Health Examination Survey estimates that the mean Simplified Oral Hygiene Index
prevalence rate for the United States in the i th
age-sex-race group is Xi. Then the expected
Oral Hygiene Index subgroup is
-!- Z N, jziN i
Comparison of an actual value for, say, a region with the expected value for that region is undertaken on the assumption that a meaningful statement can be made which holds, in some average way, for all persons in the region. This may or may not be true. The specified region may have higher values for younger persons and lower values for older persons than are found in other regions. In that case, an average comparison will obliterate one or both of these differentials. A similar remark may be made with respect to values computed for all races together, since relationships found in one race may not be found in another. In arriving at the general conclusions expressed in the text an effort was made to consider all the specific data, including data not presented in this report, but it must be recognized that balancing such evidence is a qualitative exercise rather than a quantitative one. The standard error of the difference between an actual and expected value may be approximated by the standard error of the actual value (table III).
Aside from tables 3, 4, and 6-8, expected values are computed for figure 6. The computation of D,,
the mean deviation adjusted for education of the Simplified Oral Hygiene Index for sex-income group k was done as follows:
Let Xiir be the estimated mean Simplified Oral
Hygiene Index for persons in sex-income group
k who are in the i th age group and the j th
education group. Let nijk he the estimated number of people
in that group.
’ RijkXijkLet xii = -_k-
En..k Ilk
Then ’ “jkdjk Dk=+- where
Jk enijk cXijk- Xi,)
dir = “ik
Computation of expected values for table 12 are done as follows:
Suppose a person belongs to class Cii (calculus
class i, debris class j) and to age-sex group k. Then it is expected that the probability of his having a periodontal pocket is indicated by the proportionof persons having pockets in his age-sex group (X,). If
there are n iik persons of age and sex k in class Cii ,
the expected value for class Cij is
z k ?lk xk
4 Rijk
The difference tabulated in table 12 for class Cii is
the actual value minus the expected value for that class.
Adjusted Values
In table 5, the oral hygiene scores for white persons in a specified income or education group were adjusted to the age distribution of the Negroes in the same group. The adjusted mean score for white
persons in the k th sex-income or education group was
computed as follows:
Let xlk be the estimated mean OHI-S for white
persons in the sex-income group or sex-education group k who are in the age group i.

Let nilc be the number of Negro persons in that
group.
Then rZ, =Z xik nik where Zi
nik = zzk
Rk
In table 9, the total Periodontal Indes (PI) score for w!Cte persons was adjusted to the distribution of Negroes with the specified OkI4 debris or calculus levels.
The adjusted total of mean PI for white persons, X, was computed as follows:
Let X, be the estimated mean PI for white persons
of one sex with an OHI-S (or debris or calculus) score K. Let nk be the number of Negro persons in that
grouPh ThenX= x xk nk where n =I: Rk
k n
In tables 10 and 11 the adjusted difference between actual and expected PI scores for persons in specific income or education groups was obtained by weighting the differences between actual and expected levels of PI in the specific income or education group by the overall percent of persons with specified OHI-S levels. The expected value for each specific group was computed by the method described above. The adjusteddifference between actual and expected PI scores for a specific income or education group, D. was computed as follows:
Let d,, be the difference between actual and
expected PI scores for a specific income or education group i with OHI-S level k.
Let nk be the number of people with OHI-S level
k.
Then 6, = Z d,, nk where n=Zn -k- k k
n
Smal l Numbers
In some tables magnitudes are shown for cells for which the sample size is so small that the sampling error may be several t imes as great as the statistic itself. Obviously in such instances the statistic has no meaning in itself except to indicate that the true quantity is small. Such numbers, if shown, have been included to convey an impression of the overall story of the table.
Tests of Significance
Tests of significance for demographic variables were performed in two ways. The first was to determine if the difference between the actual and expected value was greater than 2 times its standard error. For example, for men with incomes of less than $2,000 the actual score was 0.7 higher than the expected score and the standard error was 0.1. Since the difference was 7 times its standard error, it may be deemed statistically significant.
The second method was to examine theage-specific differences (not published) between the prevalence for the specified group and the prevalence for all persons. Thus; when classified by population size, men from rural areas had a mean oral hygiene score which was greater than the overall mean score for all six age groups under 75 years. The probability of such an occurrence is 0.06, and the difference is considered statistically significant. In this instance, thedifference between the actual and expected value is 1.4 times its standard error. which (using tables of the normal distribution) has a probability of 0.08 and is not statistically significant.
25

Table I. Number of men and women examined and number on whom oral hygiene scores are available,by age: Health Examination Survey, 1960-62
Number examined Number with oral hygiene scores
Age Men Women Men Women
Total, 18-79 years------------ 3,091 3,581 2,528 2,855
18-24 years------------------------
25-34 years-------------------------
35-44 years-------------------------
45-54 years------------------------
years------------------------
years-------------------------
55-64
65-74 75-79 years-------------------------
26
411 534 403 523
675 746 661 696
703 784 653 700
547 705 421 544
418 443 240 254
265 299 126 119
72 70 24 19

Table II. Standard error in mean Oral Hygiene Index of men and women, by race and age: United States, 1960-62
T - -
Simplified Oral l-Simplified Debris TSimplified Calculus
Both sexes
Total, 18-79 years------- 0.03 I0.03 0.04 0.01 0.02 0.04
Men
Total, 18-79 years------- 0.04 0.05 0.10 0.02 0.02 0.05 0.06
18-24 years-------------------- 0.06 0.07 0.23 0.04 0.04 0.14 0.04 0.04 0.09 25-34 years-------------------- 0.07 0.06 0.16 0.04 0.04 0.10 0.05 0.05 0.12 35-44 years-------------------- 0.07 0.07 0.20 0.04 0.04 0.10 0.05 0.06 0.13 45-54 years-------------------- 0.08 0.09 0.21 0.05 0.04 0.11 0.07 0.07 0.14 55-64 years-------------------- 0.08 0.13 0.31 0.05 0.07 0.14 0.07 0.10 0.16 65-74 years-------------------- 0.15 0.17 0.46 0.07 0.08 0.15 0.10 0.12 0.26 75-79 years-------------------- 0.32 0.32 0.67 0.11 0.12 0.52 0.24 0.24 1.05
Hygiene Index Index 1 - Index Sex and age
All All All races White Negro races White Negro races White Negro
Women
Total, 18-79 years------- 0.03 0.02 0.02 0.04 0.04
18-24 years-------------------- 0.05 0.06 0.16 0.03 0.04 0.10 0.03 0.09 25-34 years-------------------- 0.05 0.05 0.16 0.03 0.03 0.08 0.03 0.08 35-44 years-------------------- 0.05 0.06 0.16 0.03 0.03 0.08 0.04 0.08 45-54 years-------------------- 0.06 0.07 0.19 0.03 0.04 0.09 0.05 0.14 55-64 years-------------------- 0.09 0.08 0.30 0.05 0.05 0.16 0.06 0.17 65-74 years-------------------- 0.11 0.11 0.38 0.05 0.05 0.17 0.08 0.20 75-79 years-------------------- 0.43 0.48 0.33 0.19 0.24 0.51 0.37 0.51
27

Table III. Standard error in mean Oral Hygiene Index of men and women,by race and specified characteristics: United States, 1960-62- -
T T Women Specified characteristic
All All races White Negro races White Negro
Income under $2,000---------------------- 0.10 0.10 0.16 0.07 0.08 0.12 $2,000-$3,ggg--------------------- 0.09 0.08 0.12 0.05 0.06 0.11 $4,000-$6,999 _____________________ 0.04 0.05 0.19 0.04 0.04 0.13 $7,ooo-$g,ggg ----__-_---_-______-- 0.06 0.07 0.51 0.04 0.04 0.42 $10,000 and over------------------ 0.05 0.06 0.48 0.04 0.05 0.61 Unknown--------------------------- 0.08 0.12 0.41 0.06 0.07 0.18
Education Under 5 years--------------------- 0.09 0.09 0.19 0.12 0.18 0.18 5-S years------------------------- 0.07 0.10 0.14 0.07 0.07 0.14 9-12 years------------------------ 0.05 0.07 0.13 0.04 0.04 0.10 13 years and over----------------- 0.04 0.05 0.56 0.03 0.04 0.10 Unknown--------------------------- 0.22 0.26 0.49 0.22 0.20 0.45
Place description
SMSA-in central city-------------- 0.06 0.07 0.12 0.03 0.06 0.11
SMSA-outside central city--------- 0.06 0.06 0.18 0.06 0.06 0.14 Urban not SMSA-------------------- 0.20 0.28 0.52 0.09 0.09 0.20 Rural farm------------------------ 0.18 0.21 0.24 0.20 0.26 0.15 Rural nonfarm--------------------- 0.06 0.20 0.32 0.11 0.11 0.29
Population-size group
Giant metropolitan areas---------- 0.05 0.08 0.14 0.04 0.08 0.16
Other very large metropolitanareas---------------------------- 0.10 0.17 0.19 0.11 0.10 0.14 Other standard metropolitanstatistical areas---------------- 0.08 0.13 0.25 0.05 0.07 0.21 Other urban areas----------------- 0.12 0.15 0.36 0.11 0.10 0.12 Rural areas----------------------- 0.12 0.16 0.15 0.11 0.11 0.29
Urban-rural residence Urban----------------------------- 0.05 0.08 0.10 0.02 0.03 0.07 Rural----------------------------- 0.08 0.08 0.21 0.09 0.08 0.20
28

APPENDIX III
DEMOGRAPHIC TERMS
1 Age. -The agerecordedfor each person is the age at last birthday. Age is recorded in single years.
Race.-Race is recorded as “white,” “Ne.gro,” or “other.” “Other” includes American Indian, Chinese, Japanese, and so forth. Mexican persons are included with “white” unless definitely known to be Indian or other nonwhite race.
, Income of fatnil OY unrelated imiividuals.- Each member of a family is classified according to the total income of the family of which he is a member. Within the household all persons related to each other by blood, marriage, or adoption constitute a family. Unrelated individuals are classified according to their own income.
The income recorded is the total of all income received by members of the family in the l&month period preceding the week of interview. Income from all sources is included, e.g., wages, salaries, rents from properties, pensions, and help from relatives.
/ Education. - Each personis classified by education in terms of the highest grade of schoolcompleted. Only grades completed in regular schools, where persons are given a formal education, are included. A “regular” school is one which advances a person toward an elementary or high school diploma or a college, university, or professional school degree. Thus, education in vocational. trade, or business schools outside the regular school system is not counted in determining the highest grade of school completed.
Population site.-The five classes comprising this characteristic were derived from the design of the sample, which accomplished a stratification of the primary sampling units by population size in each of three broad geographic locations. Because the survey was started in 1960, the primary sampling units within each of the five population-size classes were necessarily based on populations and definitions of the 1950 census. The name of each selected primary sampling unit within each population-size class and geographic location, along with other selected sample data, is presented in an earlier repor
The definitions for each of the five population-size classes are as follows:
Giant metropolitan areas.-This class includes primary sampling units defined in the census as standard metropolitan statistical areas (SMSA’s) having a population of 3,000,OOO persons or more.
Other very large vnetvopolitan areas--Included in this class are standard metropolitan statistical areas with populations of 500,000 to 3,000,OOO as defined by the 1950 census.
Other standard metropolitan statistical areas.-This class includes other SR4SA’s.
Otlzer uvban areas.-This includes primary sampling units which were highly urban in composition but were not defined as SMSA’s.
RzwaZ areas.-This includes primary sampling units which were primarily rural in composition according to census definitions.
’ Regiotz.-For the purpose of classifying the population by geographic area, the United States was divided into three major regions. This division was especially made for the design of the HES sample. The regions and the States included are as follows:
Region States Included
Northeast------- Maine, Vermont. New Hampshire, Massachusetts, Connecticut, Rhode Island, New York, New Jersey. Pennsylvania, Ohio, and Michigan
South- _ _ __ __ _ __ _ Delaware. Maryland, District of Columbia, West Virginia, Virginia, North Carolina, South Carolina, Georgia, Florida, Kentucky, Tennessee, Alabama, Mississippi, Arkansas, Louisiana, Oklahoma, and Texas
West----------- Washington, Oregon, California, Idaho, Nevada, Montana, Utah, Arizona, Wyoming, Colorado, New h4exico, North Dakota, South Dakota, Nebraska, Kansas, h~4innesota, Iowa, Missouri, Wisconsin, Illinois, and Indiana
&-ban and rural .-For the first six primary sampling units at which examinations were conducted, the definition of urban and rural was the same as that used in the 1950 census. These locations were Philadelphia, Pa., Valdosta, Ga., Akron, Ohio, Muskegon, Mich.,
29

Chicago, Ill., and Butler, MO. For the remainder of the sampling units the 1960 census definitions were used.
The change from 1950 to 1960 definitions is of small consequence in the Survey, since only six locations were affected; the major difference is the designation in 1960 of urban towns in New England and of urban townships in New Jersey and Pennsylvania.
According to the 1960 definition, the urban population comprises all persons living in (a) places of 2,500 inhabitants or more incorporated as cities, -boroughs, villages, and towns (except towns in New England, New York, and Wisconsin); (b) the densely settled urban fringe, whether incorporated or unincorporated, of urbanized areas; (c) towns inNew England and townships in New Jersey and Pennsylvania which contain no incorporated municipalities as subdivisions and have either 25,000 inhabitants or more or a population of 2,500-25,000 and a density of 1,500 persons or more per square mile; (d) counties in States other than the New England States, New Jersey, and Pennsylvania that have no incorporated municipalities within their boundaries and have a density of 1,500 persons or more per square mile; and (e) unincorporated places of 2,500 inhabitants or more not included in any urban fringe. The remaining population is classified as rural.
Place description. ---In this survey the urban population is classified as living “in the central city” or “outside the central city” of an SMSA. The remaining urban population is classified as “not in. SMSA.”
-oo--
The definitions and titles of standard metropolitan statistical areas are established by the U.S. Bureau of the Budget with the advice of the Federal Committee on Standard Metropolitan Statistical Areas.
The definition of an individual standard metropolitan statistical area involves two considerations: first, a city or cities of specified population to constitute the central city and to identify the county in which it is located as the central county; and, second, economic and social relationships with contiguous counties which are metropolitan in character so that the periphery of the specific metropolitan area may be determined.
Persons “in the central city” of an SMSA are therefore defined as those whose residency is in the city appearing in the stand and metropolitan statistical area title. Persons residing in an SMSA but not in the city appearing in the SMSA title are considered to reside “outside the central city.”
The remaining population is allocated into rural-farm and rural-nonfarm groups. The farm population includes all persons living in rural territory on places of 10 acres or more from which salesof farm products amounted to $50 or more during the previous 12 months or in places of less than 10 acres from which sales of farm products amounted to $250 or more during the preceding 12 months. Other persons living in rural territory are classified as nonfarm. Persons are also classified as nonfarm if their household paid rent for the house but their rent did not include any land used for farming.
30
Series 1.
Series 2.
Series 3.
Series 4.
Series 10.
Series 11.
Series 12.
Series 20.
Series 21.
Series 22.
OUTLINE OF REPORT SERIES FOR VITAL AND HEALTH STATISTICS
Public Health Service Publication No. 1000
Programs and collection procedures. -Reports which describe the general programs of the National Center for Health Statistics and its offices and divisions, data collection methods used, definitions, and other material necessary for understanding the data.
Reports number 1-4
Data evaluation and methods research.-Studies of new statistical methodology including: experimental tests of new survey methods, studies of vital statistics collection methods, new analytical techniques, objective evaluations of reliability of collected data, contributions to statistical theory.
Reports number l- 17
Analytical studies. -Reports presenting analytical or interpretive studies baaed on vital and health statistics, carrying the analysis further than the expository types of reports in the other series.
Reports number 1-4
Documents and committee reports .-Final reports of major committees concerned with vital and health statistics, and documents such as recommended model vital registration laws and revised birth and death certificates.
Reports number 1-5
Data From the Health Intefview Survey .-Statistics on illness, accidental injuries, disability, use of hospital, medical, dental, and other services, and other health-related topics, based on data collected in a continuing national household interview survey.
Reports number l-32
Data From the Health Examination Survey .-Statistics based on the direct examination, testing, and measurement of national samples of the population, including the medically defined prevalence of specific diseases, and distributions of the population with respect to various physical, physiological, and psychological measurements. Reports number 1-16
Data From the Health Records Survey. -Statistics from records of hospital discharges and statistics relating to the health characteristics of persons in institutions, and on hospital, medical, nursing, and personal care received, based on national samples of establishments providing these services and samples of tk residents or patients.
Reports number 1-4
Data on mortality .-Various statistics on mortality other than as included in annual or monthly reports-special analyses by cause of death, age, and other demographic variables, also geographic and time series analyses.
Reports number 1 and 2
Data on natality, marriage, and divorce. -Various statistics on natality, marriage, and divorce other than as included in annual or monthly reports -special analyses by demographic variables, also geographic and time series analyses, studies of fertility.
Reports number 1-9
Data From the National Natal@ and Mortality Surveys.- Statistics on characteristics of births and deaths not available from the vital records, based on sample surveys stemming from these records, including such topics as mortality by socioeconomic class, medical experience in the last year of life, characteristics of pregnancy, etc.
Reports number 1 and 2
For a list of titles of reports published in these series, write to: National Center for Health Statistics U.S. Public Health Service Washington, D.C. 20201