oregon climate assessment report. 5 future projections of vegetation type. ... oregon climate...
TRANSCRIPT

Oregon Climate Assessment Report
Kathie Dello and Philip Mote, OCCRI www.occri.net/
photo credit: Dudley Chelton

hb 3543
• the Oregon Climate Change Research Institute must assess, at least once each biennium, the state of climate change science as it pertains to Oregon
• physical, biological and social sciences

• 9 lead authors, OCCRI coordinated
• 70 + contributors from 4 OUS universities, state and federal agencies
• drew from peer reviewed literature and other climate assessments from WA (Climate Impacts Group) and CA (Climate Action Team)
• not a prescriptive or policy document
• link up to state adaptation framework (agency directors and workgroup)

Outline
• Legislative summary
• Executive summary
• Chapter 1 - Climate
• Chapter 2 - Defining the problem & causes
• Chapter 3 - Freshwater resources
• Chapter 4 - Agriculture
• Chapter 5 - Vegetation
• Chapter 6 - Coasts and estuaries
• Chapter 7 - Fish and wildlife
• Chapter 8 - Economics
• Chapter 9 - Human dimensions

OWSC, www.climate.washington.edu/trendanalysis
Annual mean warming trends, 1920-2005Ch. 1

Mote and Salathé, 2010
Text
Ch. 1

Seasonal changes
• Changes in precipitation equivocal fall, winter, spring
• More warming (and drier) in summer
• Likelihood of more extreme precipitation
Ch. 1

Oregon Greenhouse Gas Inventory, 2010
Ch. 2

Chang and Jung 2010
April 1 snow water equivalent in Willamette Basin
Ch. 3

Simulated Natural Flow in the Willamette River at the Columbia
Modeling: Alan HamletAnalysis: Kathie Dello
Ch. 3

agriculture in OR
• state is top producer of 15 US commodities
• agriculture makes up about 9% of OR ghg emissions
• Concerns: availability of water; weeds, insects
• Plus: longer growing season, more wine varieties
Ch. 4

Jones et al. 2004
Ch. 4

MAPSS, R. Neilson
Future Projections of Vegetation TypeCh. 5

MAPSS, R. Neilson
changed in biomass burned
Ch. 5

after Komar et al., 2010 (in press)
Ch. 6

Shoreline retreat and armoring, Rockaway
photo: Don Best
Ch. 6

observed species changes
• Could be natural variability or climate change
• insects moving in from south of Oregon
• frogs reproducing earlier in the year
• land birds are shifting their distributions northward
• freshwater fish losing habitats
• humboldt squid appearing off OR coast
Ch. 7

algal blooms
Hixon et al., 2010
Ch. 7

Economic risksGlobal estimates of costs 1-5% GDP
• Oregon: Reductions in snow and water supply
• Energy
• Agriculture: crop yield, water supply
• Forestry: Wildfire, insects, shifting species
• Riverine and coastal flooding
• Salmon, Health, Recreation (CLI report)

Recently there has been much discussion about climate change and global warming due to years of human use of fossil fuels such as petroleum and coal. Some have called for the development of renewable energy sources—such as wind, solar, wave and geothermal—to reduce our reliance on fossil fuels. In general, which of the following views best describes your opinion in this area?
Recently there has been much discussion about climate change and global warming due to years of human use of fossil fuels such as petroleum and coal. Some have called for the development of renewable energy sources—such as wind, solar, wave and geothermal—to reduce our reliance on fossil fuels. In general, which of the following views best describes your opinion in this area?
Statement % respondents agreeing
1. Do not know 1.6%2. Climate change is not a problem; existing energy policies should be
maintained. 25.6%3. Climate change is a minor problem; only minor energy policy changes are
needed to encourage the development of renewable energy sources. 9.4%4. Climate change is a moderate problem; moderate energy policy changes are
needed to encourage the development of renewable energy sources. 30.3%
5. Climate change is a serious problem; significant energy policy changes are needed to encourage the development of renewable energy sources. 33.2%
N=1,480
Borberg et al. 2009
Ch. 9

key findings
• increases in annual temperature, warmer drier summers
• summer water supply will decrease
• reduced snowpack, drier summers
• Oregon’s most ghg intensive sector is transportation
• availability, quality and cost of water will be a limiting fact

key findings• potential opportunities in the ag sector
• wildfire is projected to increase
• frequency and magnitude of coastal flooding events may increase
• many plant and animal species on land, freshwater and sea will shift their distributions
• changes to the marine environment, increased temps

moving forward
• we call for a more complete economic analysis of the impacts of climate change on Oregon’s economy
• we’re already experiencing impacts now
• measures for adaptation should be taken now
• OR Climate Change Adaptation Framework

Oregon Climate Change
Adaptation Framework
Land Conservation and Development Commission
January 12, 2011

January 12, 2011
Climate Change Adaptation Framework
Presentation at a glance:
Purposes of the framework
Climate risks
Short-term priority actions
Recommendations for implementation

January 12, 2011
Previous effort: The Oregon Climate Change Integration Group’s Framework for Addressing Rapid Climate Change, January 2008
Starting point: LCDC direction to develop a climate change strategy in July 2009. October 2009 meeting of Governor Kulongoski, agency directors and representatives of the university system: Develop a framework for organizing how Oregon should prepare for changes to our climate
Parallel effort: Practical steps to apply the OCCRI state of the science report (Oregon Climate Assessment Report)
Resources: Declining revenues focus efforts on low or no cost (low hanging fruit) ways to get started
Framework Context

January 12, 2011
• Identify future climate conditions that pose major risks for Oregonians
• Provide a framework to help state agencies, local governments and citizens to begin to prepare for the effects of changes in Oregon’s climate
• Assess our current capacity to address climate-related risks to people, communities, infrastructure, and natural resources
• Identify next steps: short-term, low- cost priority actions to begin helping Oregon to prepare
Purposes of the Framework
January 12, 2011
Climate Change Adaptation Framework
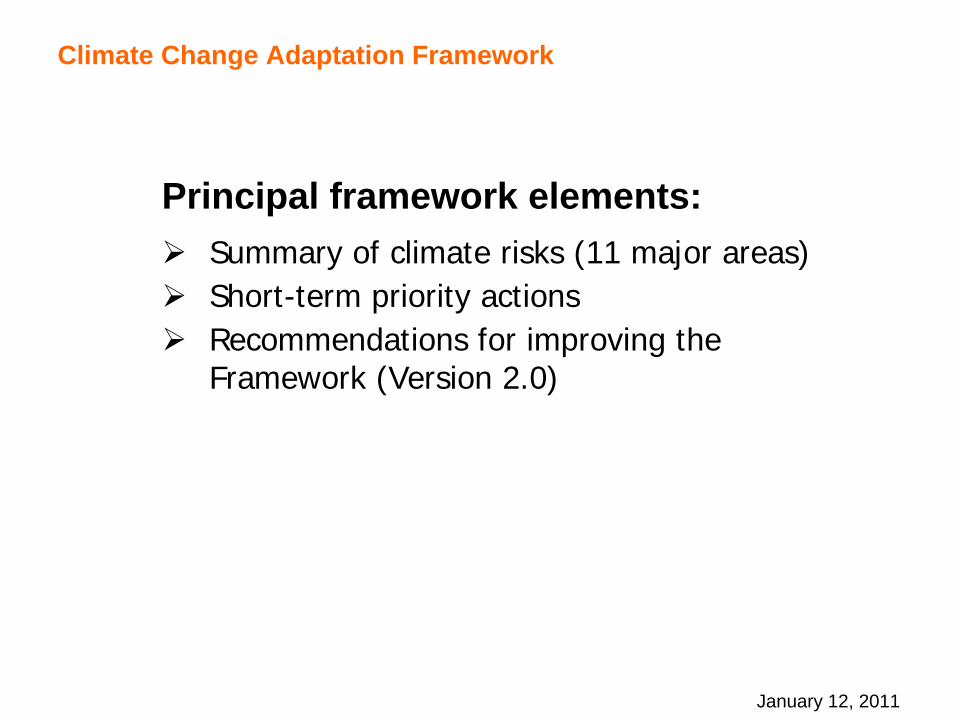
Principal framework elements:
Summary of climate risks (11 major areas)
Short-term priority actions
Recommendations for improving the Framework (Version 2.0)

January 12, 2011
Climate Risks
Risks that are very likely to occur
Increase in average annual air temperature and likelihood of extreme heat events
Changes in hydrology and water supply; reduced snowpack and water availability in some basins; changes in water quality and timing of water availability

January 12, 2011
Climate Risks
Risks that are likely to occur (slide 1 of 2)
Increase in wildfire frequency and intensity
Increase in ocean temperatures with potential for changes in ocean chemistry and increased ocean acidification
Increased incidence of drought
Increased coastal erosion and risk of inundation from increasing sea levels and increasing wave heights and storm surges
(continued)

January 12, 2011
Climate Risks
Risks that are likely to occur (slide 2 of 2)…
Changes in abundance and geographical distributions of plant species and habitats for aquatic and terrestrial wildlife
Increase in diseases, invasive species and insect, animal and plant pests
Loss of wetland ecosystems and services

January 12, 2011
Climate Risks
Risks that are more likely than not to occur
Increase incidence and magnitude of damaging floods and frequency of extreme precipitation events
Increased incidence of landslides

January 12, 2011
Risks that are very likely to occur
1. Increase in average annual air temperatures and likelihood of extreme heat events
Enhance and sustain public health system (state and local) capacity to prepare for and respond to heat waves and smoke emergencies, and improve
delivery of information on heat events and cooling centers, especially for isolated and vulnerable populations.
2. Changes in hydrology and water supply; reduced snowpack and water availability in some basins; changes in water quality and timing
of water availability
Maintain the capacity to assist landowners to restore wetlands, uplands and riparian zones to increase the capacity for natural water storage.
Improve real-time forecasting of water delivery and basin yields to improve management of stored water.
Improve capacity to provide technical assistance and incentives to increase storage and to improve conservation, reuse, and water use efficiency among all consumptive water uses.
Short-term Priority Actions

January 12, 2011
Risks that are likely to occur
3. Increase in wildfire frequency and intensity
Improve integration of wildfire risk into planning to reduce vulnerability to natural hazards.
Restore fire-adapted ecosystems to withstand natural recurring wildfires.
Develop short-
and medium-term climate change adaptation strategies for forests and other fire-prone habitats, and improve development standards to reduce exposure to fire risk at the urban-wildland interface.
Improve the capabilities of public health agencies to plan for and respond to the public health and safety risks of wildfire emergencies.
4. Increase in ocean temperatures, with potential for changes in ocean chemistry and increased ocean acidification
Increase research on the impacts of changes in ocean temperature
and chemistry on estuarine and near-shore marine habitats, including commercial and recreational fisheries.
Short-term Priority Actions

January 12, 2011
Risks that are likely to occur
5. Increased incidence of drought
Improve capacity to provide technical assistance and incentives to increase storage capacity and to improve conservation, reuse, and water use efficiency among all consumptive water uses.
6. Increased coastal erosion and risk of inundation from increasing
sea levels and increasing wave heights and storm surges
Inventory and map coastal shorelands that are at risk of erosion
or inundation, or are barriers to shoreline migration, and develop long-term state and local adaptation strategies for shorelands.
7. Changes in the abundance and geographical distributions of plant
species and habitats for aquatic and terrestrial wildlife
Work with private, local and federal partners to identify ways to manage ecosystems to improve their resilience to changes in climate conditions.
Short-term Priority Actions

January 12, 2011
Risks that are likely to occur
8. Increase in diseases, invasive species, and insect, animal and plant pests
Increase monitoring, detection and control measures for pest insects and plant and wildlife diseases.
Increase surveillance and monitoring for climate-sensitive infectious diseases to humans.
Increase outreach and community education about disease and invasive species prevention measures.
Seek new means of securing resources to detect and combat diseases and invasive species.
9. Loss of wetland ecosystems and services
Support implementation of priority actions for Risks 2, 5, 6, 7,
and 10 related to hydrologic changes, drought, coastal erosion and inundation,
habitats, and flooding.
Short-term Priority Actions

January 12, 2011
Risks that are more likely to occur than not
10. Increased frequency of extreme precipitation events and incidence and magnitude of damaging floods
Inventory past flood conditions and define and map future flood conditions.
Improve capability to rapidly assess and repair damaged transportation infrastructure, in order to ensure rapid reopening of transportation corridors.
11. Increased incidence of landslides
Develop public education and outreach on landslide risks and how
to adapt to landslide risks.
Short-term Priority Actions
January 12, 2011
Recommendations for Implementing the Framework
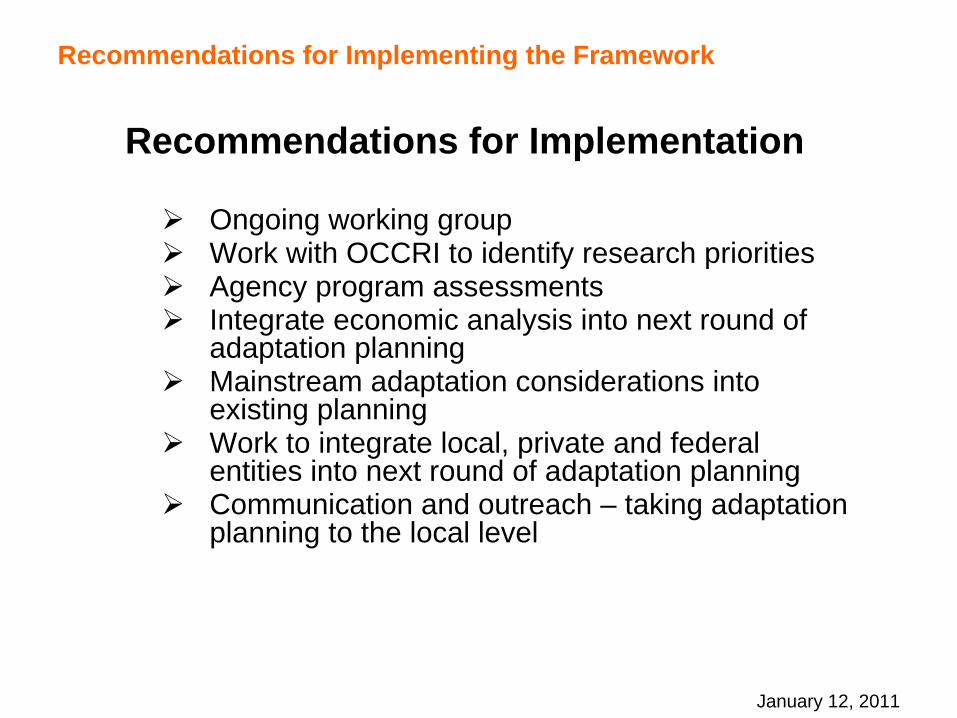
Recommendations for Implementation
Ongoing working group
Work with OCCRI to identify research priorities
Agency program assessments
Integrate economic analysis into next round of adaptation planning
Mainstream adaptation considerations into existing planning
Work to integrate local, private and federal entities into next round of adaptation planning
Communication and outreach – taking adaptation planning to the local level

Oregon Climate Change
Adaptation Framework
For more information: http://www.oregon.gov/LCD/

Agenda Item 3 01/19/2011
1
www.KeepOregonCool.org
HB 3543 – 2007 Legislature Sets Goals
1. By 2010 Oregon shall have arrested the increase in greenhouse gas emissions and shall begin real reductions.
2. By 2020, Oregon’s greenhouse gas emissions shall not exceed a level 10% below 1990 levels.
3. By 2050, Oregon’s greenhouse gas emissions shall not exceed a level at least 75% below 1990 levels.
Oregon GHG Goals/Trends
Agenda Item 3 01/19/2011
2
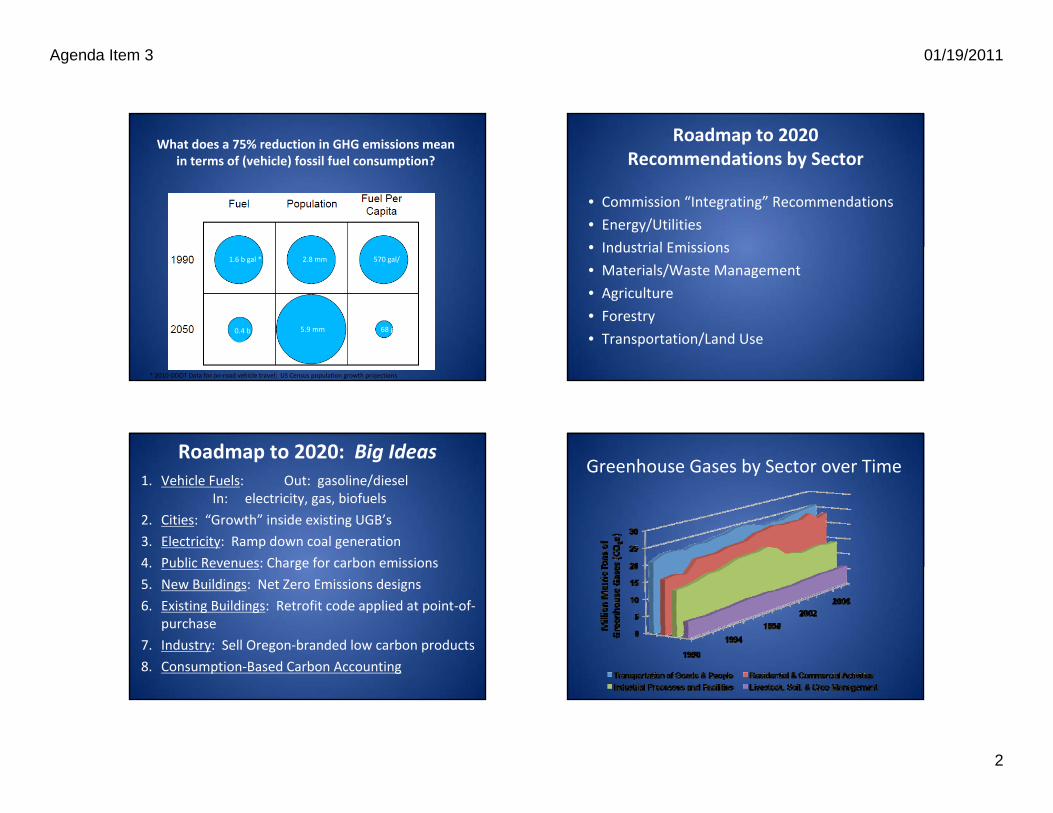
What does a 75% reduction in GHG emissions mean in terms of (vehicle) fossil fuel consumption?
570 gal/
68 gal/5.9 mm
2.8 mm1.6 b gal *
0.4 b gal
* 2010 ODOT Data for on‐road vehicle travel; US Census population growth projections
Roadmap to 2020Recommendations by Sector
• Commission “Integrating” Recommendations
• Energy/Utilities
• Industrial Emissions
• Materials/Waste Management
• Agriculture
• Forestry
• Transportation/Land Use
Roadmap to 2020: Big Ideas1. Vehicle Fuels: Out: gasoline/diesel
In: electricity, gas, biofuels
2. Cities: “Growth” inside existing UGB’s
3. Electricity: Ramp down coal generation
4. Public Revenues: Charge for carbon emissions
5. New Buildings: Net Zero Emissions designs
6. Existing Buildings: Retrofit code applied at point‐of‐purchase
7. Industry: Sell Oregon‐branded low carbon products
8. Consumption‐Based Carbon Accounting
Greenhouse Gases by Sector over Time

Agenda Item 3 01/19/2011
3
**37% of all OR GHG
**
OR Transportation GHG Emissions: Recent History
1990 ‐ 2000• OR Population +20%; GHG+15%
(Pd GHG +4%)
• OR VMT +24% (Pd VMT +17%)
• OR VMT/capita +4%
2000 ‐ 2007• OR population +12%; GHG +6%
(Pd emissions ‐2%)
• OR VMT ‐3% (Pd VMT ‐7%)
• OR VMT/capita ‐8% (Pd –14%; Metro ‐4%; national +5%)
• OR Freight GHG emissions +7% (mostly medium/heavy duty diesel trucks)
• Metro pop +30% (1990‐2004); UGB expanded by 12%;
• Pd Metro average commute 16% shorter than national average; saves drivers $2.5 B/year and 1.4 mm tons CO2
Transportation/Land UseTier One Recommendations
• Change funding strategies/increase funding• Expand Urban, Intercity Transportation Options/• Create compact neighborhoods with accessible services within existing urban growth boundaries
• Enable lower‐carbon freight movement (Industrial zones and transport corridor design/operations)
• Embed climate change in transportation planning• Demand reduction• Manage/price parking• Low Carbon Fuel Standards/Electric/Alt Fuels Vehicle market uptake, infrastructure
T + LU + GHG Planning Underway
• ODOT STIP recommends “GHG reduction be considered and discussed” in 2012‐15 submissions (required thereafter)
• HB 2001 (2009): ODOT will develop Transportation Least Cost Planning
• SB 1059 (2010): MPO’s begin GHG planning
• Metro: SB 1059 compliance + RTP

Agenda Item 3 01/19/2011
4
Least Cost Planning
• Used in utility planning since +1980
• Costs/benefits compared across multiple attributes and goals
• Qualitative and quantitative evidence
• Internalized + externalized costs
• Risk and uncertainty explicitly recognized, and quantified if possible
• Question: applied at system level or project level?
The GreenSTEP model
• GreenSTEP = Greenhouse gas State Transportation Emissions Planning model
• Work started (2008) at the request of the Oregon Global Warming Commission (OGWC) for a model to evaluate a broad range of GHG policies
• Integral to both SB 1059 and LCP processes
GreenSTEP addresses a large number of factors affecting GHG emissions
• Demographic and income changes
• Relative amounts of development occurring in urban and rural areas
• Metropolitan and other urban area densities
• Urban form (i.e. mixed-use)• Amounts of metropolitan area
public transit service• Highway capacity• Vehicle proportions: autos, light
trucks, EVs, PHEVs
• Vehicle ages• Vehicle fuel efficiency• Pricing of fuel, carbon, VMT,
parking• Use of bicycle & other light-
weight vehicles• TDM and eco-driving• Effects of congestion on fuel
economy• Lifecycle carbon content of
fuels• CO2 production from electrical
power use for transportation
Factors are interconnected

Agenda Item 3 01/19/2011
5
1990 2000 2010 2020 2030 2040
2.0e
+10
2.5e
+10
3.0e
+10
3.5e
+10
4.0e
+10
4.5e
+10
Annual CO2 Equivalent EmissionsAll Vehicle Efficiency & Fuels Scenarios
Year
Pou
nds CO2 Equ
ivalen
ts
Med Lt Veh EffHigh Lt Veh EffEV & High Lt Veh EffEV & High All Veh EffEV, High All Veh Eff & Low Carb Fuel
Energy/Utilities Tier One Recommendations
• Develop State Energy/Climate Policy & Benchmarks
• Energy Efficiency Codes, Standards, Incentive
• New Transmission
• OUS Research Priorities
• Gas Infrastructure
• Smart Grid/Resource Integration
• Ramp down coal
Agenda Item 3 01/19/2011
6
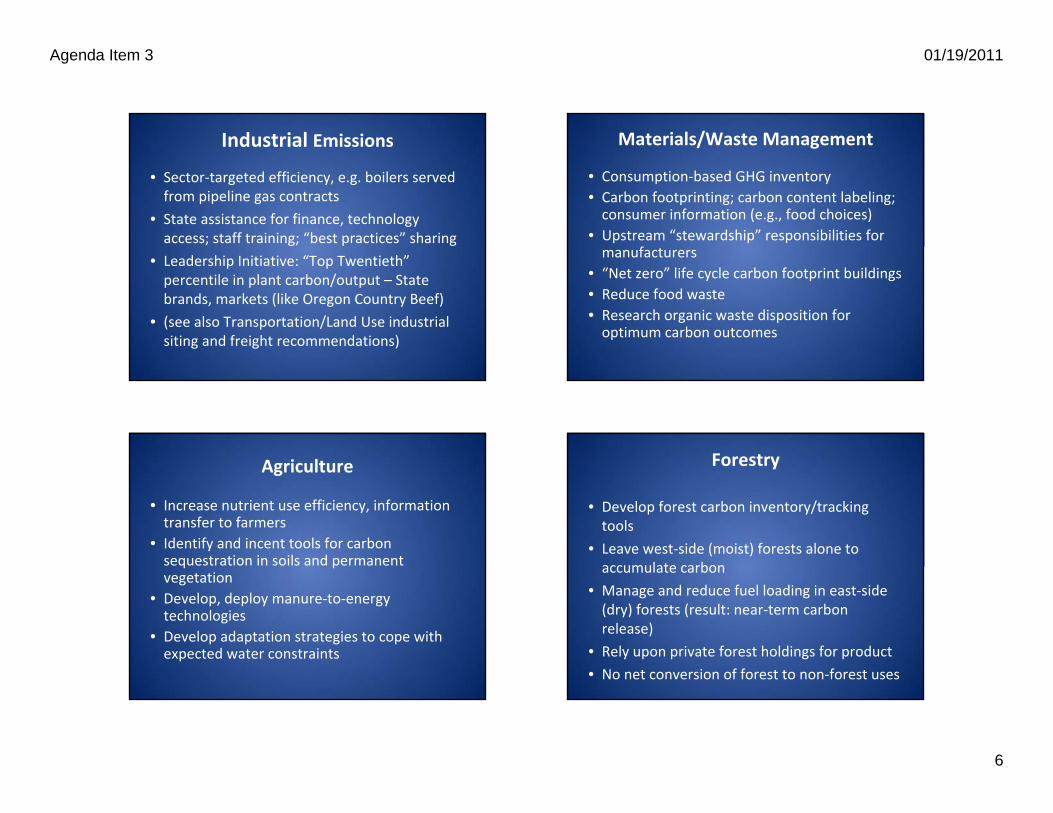
Industrial Emissions
• Sector‐targeted efficiency, e.g. boilers served from pipeline gas contracts
• State assistance for finance, technology access; staff training; “best practices” sharing
• Leadership Initiative: “Top Twentieth”percentile in plant carbon/output – State brands, markets (like Oregon Country Beef)
• (see also Transportation/Land Use industrial siting and freight recommendations)
Materials/Waste Management
• Consumption‐based GHG inventory• Carbon footprinting; carbon content labeling; consumer information (e.g., food choices)
• Upstream “stewardship” responsibilities for manufacturers
• “Net zero” life cycle carbon footprint buildings• Reduce food waste• Research organic waste disposition for optimum carbon outcomes
Agriculture
• Increase nutrient use efficiency, information transfer to farmers
• Identify and incent tools for carbon sequestration in soils and permanent vegetation
• Develop, deploy manure‐to‐energy technologies
• Develop adaptation strategies to cope with expected water constraints
Forestry
• Develop forest carbon inventory/tracking tools
• Leave west‐side (moist) forests alone to accumulate carbon
• Manage and reduce fuel loading in east‐side (dry) forests (result: near‐term carbon release)
• Rely upon private forest holdings for product
• No net conversion of forest to non‐forest uses

Agenda Item 3 01/19/2011
7
Savery Steam Engine – 1698


