oregon department of human services -...
TRANSCRIPT

AAAddduuulllttt MMMeeedddiiicccaaaiiiddd SSSpppooonnnsssooorrr RRReeepppooorrrttt September 2008
Oregon Department of Human Services
2008 CAHPS Health Plan Survey
Adult Medicaid Sponsor Report
Oregon Department of Human Services
Section A: Results at a Glance
Section B: Results in Detail
Prepared by Westat and Shaller Consulting
September 2008
The National CAHPS® Benchmarking Database is funded by the U.S. Agency for Healthcare Research and Quality and administered by Westat under Contract Number HHSA290200710024C. For more information, please visit the Web site (https://www.cahps.ahrq.gov) or contact the CAHPS User Network at 1-800-492-9261.

2008 CAHPS-HP 4.0 Adult Medicaid Sponsor Report i
Table of Contents Page Introduction .......................................................................................................................... ii
Section A: Results at a Glance A-1 Summary of Statistically Significant Differences .......................................................... A-2 Summary of Percentile Rankings................................................................................. A-4
Section B: Results in Detail B-1
Participants in the 2008 CAHPS Health Plan Survey Database .................................. B-2 Demographic Characteristics ....................................................................................... B-3 Utilization Characteristics............................................................................................. B-4 Survey Results in Detail ............................................................................................... B-5 Regional Benchmarks .................................................................................................. B-6
Consumers’ Reports of Their Experiences with Care Getting Needed Care Getting Care Quickly How Well Doctors Communicate Health Plan Information & Customer Service
Consumers’ Ratings of Their Experiences with Care Overall Rating of Personal Doctor Overall Rating of Specialists Overall Rating of Health Care Overall Rating of Health Plan
HEDIS Survey Items

2008 CAHPS-HP 4.0 Adult Medicaid Sponsor Report ii
Introduction
This report presents results for Oregon Department of Human Services 2008 CAHPS Health Plan (CAHPS-HP) survey of adult Medicaid managed care enrollees compared to results of surveys conducted by other adult Medicaid survey sponsors participating in the 2008 CAHPS Health Plan Survey Database. The 2008 CAHPS Database contains 4.0 and 4.0H Health Plan survey results from 120 unique adult Medicaid plans that conducted surveys between October 2007 and June 2008. The 2008 CAHPS Health Plan Survey adult Medicaid sponsor report is organized in three sections:
• Section A: Results at a Glance: Presents two summary tables of comparative results,
showing both statistically significant differences and percentile rankings of CAHPS-HP survey sponsor results compared to benchmarks from the CAHPS Health Plan Survey Database.
• Section B: Results in Detail: Presents detailed results for survey items through a series
of bar charts. This section begins with a list of participants in the 2008 CAHPS Health Plan Survey Database and two sponsor-specific tables showing a comparison of demographic and utilization characteristics of respondents.
• Section C: Background and Methodology: Presents overview information about the
CAHPS Database and CAHPS Health Plan Survey and includes guidelines for using reports, methodological information on consumer reports and consumer ratings (i.e., items included, calculations), response rate calculation, case mix adjustment, and significance testing.
Sections A and B are presented together in this document. Section C is presented as a separate companion document. Questions regarding this report or any aspect of the CAHPS Database can be directed by e-mail to [email protected]. Further information about the CAHPS Database is available through the Web site at: https://www.cahps.ahrq.gov

2008 CAHPS-HP 4.0 Adult Medicaid Sponsor Report A-1
Section A: Results at a Glance This section summarizes the 2008 adult Medicaid Health Plan Survey results for Oregon Department of Human Services in two ways: Table 1. Summary of Statistically Significant Differences: This table presents the results of statistical significance tests. Up or down arrows are shown when the results are significantly different from their relevant comparison group. The comparison groups are (1) the sponsor results compared against all other sponsors, and (2) individual health plan results compared against all other health plans. For each composite measure, a mean value (case-mix adjusted) is calculated for each sponsor and for each health plan. These mean values are then statistically compared to the mean value for all sponsors (the mean of all sponsor means) or compared to the mean value for all health plans (the mean of all plan means). All tests were conducted at the .05 level of statistical significance. All survey respondents for a given sponsor are combined to form the sponsor-level results. Note that when a sponsor submits data for only a single health plan, the individual health plan and sponsor results may vary because the sponsor results are compared to the mean of all sponsor means, whereas the health plan results are compared to the mean of all health plan means. The arrows in the table indicate the results of the statistical comparison: • ( ) up arrow - result is statistically above the mean value of all sponsors or health plans. • ( ) down arrow - result is statistically below the mean value of all sponsors or health
plans. • ( ) two-sided arrow - result is statistically equivalent to the mean value of all sponsors
or health plans. Table 2. Summary of Percentile Rankings: This table presents the results by percentile rankings using stars to indicate the percentile band for a specific result. This table shows where each health plan result fell within the percentile range of all the plans in the country that submitted CAHPS 4.0 or 4.0H adult Medicaid survey results to the CAHPS Health Plan Survey Database. Five stars indicate the plan performed within the top ten percent of adult Medicaid plans in the CAHPS Health Plan Survey Database while one star indicates the plan performed within the bottom twenty-five percent of plans in the CAHPS Health Plan Survey Database. Rankings are based on a direct comparison of the plan result to the full range of results from all adult Medicaid plan samples in the 2008 CAHPS Health Plan Survey Database; no statistical comparisons were performed.

Oregon Department of Human ServicesTable 1. Statistically Significant Differences Summary
Symbol
Interpretation
Getting Needed Care
Getting Care Quickly
How Well Doctors Communicate
Health Plan Information &
Customer Service
2008 CAHPS-HP 4.0 Adult Medicaid Sponsor Report A-2
indicates result is statistically above the mean value for the given
comparison group
indicates result is statistically equivalent to the mean value for the
given comparison group
indicates result is statistically below the mean value for the given
comparison group
Consumer Reports
Oregon Department of Human Services (Sponsor)
Care Oregon
Cascade Comprehensive Care
Central Oregon Ind Health Services
Doctors of the Coast South
Douglas County IPA
Family Care
FFS/PCCM (Medicaid)
Intercommunity Health Network
Kaiser Permanente Oregon Plus
Lane IPA
Marion-Polk Community Health Plan
Mid-Rogue IPA
ODS Community Health
Oregon Health Management Services
Providence Health Plan
Tuality Health Alliance

Oregon Department of Human ServicesTable 1 (cont.) Statistically Significant Differences Summary
Symbol
Interpretation
Overall Rating of Personal Doctor
Overall Rating of Specialists
Overall Rating of Health Care
Overall Rating of Health Plan
Care Oregon
Cascade Comprehensive Care
Central Oregon Ind Health Services
Doctors of the Coast South
Douglas County IPA
Family Care
FFS/PCCM (Medicaid)
Intercommunity Health Network
Kaiser Permanente Oregon Plus
Lane IPA
Marion-Polk Community Health Plan
Mid-Rogue IPA
ODS Community Health
Oregon Health Management Services
Providence Health Plan
Tuality Health Alliance
2008 CAHPS-HP 4.0 Adult Medicaid Sponsor Report A-3
Oregon Department of Human Services (Sponsor)
Consumer Ratings
indicates result is statistically above the mean value for the given
comparison group
indicates result is statistically equivalent to the mean value for the
given comparison group
indicates result is statistically below the mean value for the given
comparison group
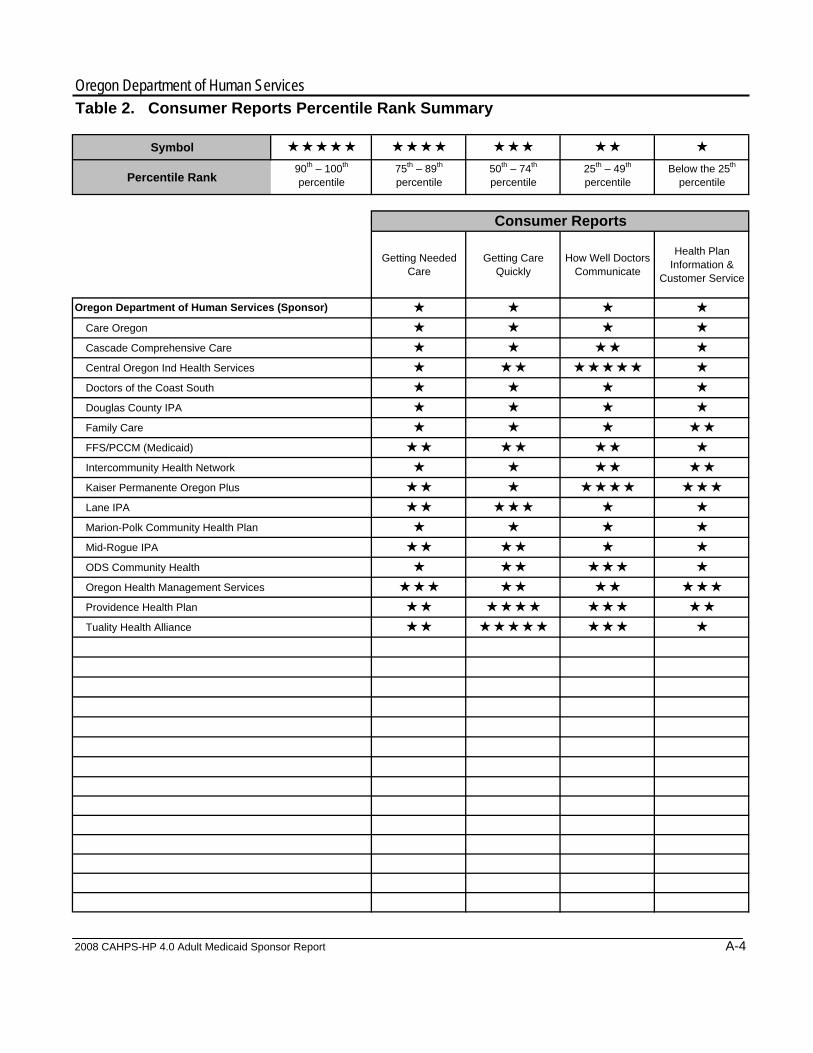
Oregon Department of Human ServicesTable 2. Consumer Reports Percentile Rank Summary
Symbol
Percentile Rank 90th – 100th
percentile75th – 89th
percentile50th – 74th
percentile25th – 49th
percentileBelow the 25th
percentile
Getting Needed Care
Getting Care Quickly
How Well Doctors Communicate
Health Plan Information &
Customer Service
Care Oregon
Cascade Comprehensive Care
Central Oregon Ind Health Services
Doctors of the Coast South
Douglas County IPA
Family Care
FFS/PCCM (Medicaid)
Intercommunity Health Network
Kaiser Permanente Oregon Plus
Lane IPA
Marion-Polk Community Health Plan
Mid-Rogue IPA
ODS Community Health
Oregon Health Management Services
Providence Health Plan
Tuality Health Alliance
2008 CAHPS-HP 4.0 Adult Medicaid Sponsor Report A-4
Consumer Reports
Oregon Department of Human Services (Sponsor)

Oregon Department of Human ServicesTable 2 (cont.) Consumer Ratings Percentile Rank Summary
Symbol
Percentile Rank 90th – 100th
percentile75th – 89th
percentile50th – 74th
percentile25th – 49th
percentileBelow the 25th
percentile
Overall Rating of Personal Doctor
Overall Rating of Specialists
Overall Rating of Health Care
Overall Rating of Health Plan
Care Oregon
Cascade Comprehensive Care
Central Oregon Ind Health Services
Doctors of the Coast South
Douglas County IPA
Family Care
FFS/PCCM (Medicaid)
Intercommunity Health Network
Kaiser Permanente Oregon Plus
Lane IPA
Marion-Polk Community Health Plan
Mid-Rogue IPA
ODS Community Health
Oregon Health Management Services
Providence Health Plan
Tuality Health Alliance
2008 CAHPS-HP 4.0 Adult Medicaid Sponsor Report A-5
Consumer Ratings
Oregon Department of Human Services (Sponsor)

2008 CAHPS-HP 4.0 Adult Medicaid Sponsor Report B-1
Section B: Results in Detail
This section presents comparisons of sponsor-specific 2008 CAHPS Health Plan (CAHPS-HP) survey results in detail. The section begins with a list of sponsors participating in the 2008 CAHPS Health Plan Survey Database, followed by sponsor-specific demographic and utilization characteristics of respondents compared to the CAHPS Health Plan Survey Database adult Medicaid health plan sample. Detailed survey results and their respective items are presented for consumer reports, followed by consumer ratings and HEDIS survey item results (if applicable).
Please refer to Section C of this report (separate companion document) for more information on question item and response definitions.

Oregon Department of Human Services
Sponsor NameNumber of
Plans Surveyed
Total Number Sampled
Total Number of Completed Surveys1
Range of Response
Rates
Assoc Community Affiliated Plans (ACAP) 12 17,768 5,646 20% - 41%Boston Medical Center HealthNet Plan 1 1,418 420 30%Cariten-PHP Healthcare 1 1,350 459 35%Colorado Dept. of Health Care Policy 4 5,739 2,065 28% - 46%Coventry Health Care, Inc. 3 4,050 1,157 28% - 31%Excellus Health Plan, Inc. 2 3,308 929 26% - 31%Fallon Community Health Plan 1 1,755 471 28%Florida Agency for Health Care Admin 9 3,039 3,039 11% - 17%Health Net 2 4,320 1,169 27% - 31%Humana Inc 2 3,375 967 20% - 41%Kansas Foundation for Medical Care, Inc. 1 1,975 584 30%Lovelace Health Plan 1 1,755 334 19%Maryland Dept of Health & Mental Hygiene 7 11,901 3,582 26% - 35%Med-QUEST Division, DHS 3 4,050 1,672 32% - 48%Michigan Department of Community Health 12 19,238 5,890 20% - 46%Minnesota Department of Human Services 9 19,800 8,549 34% - 55%Molina Healthcare of CA Partner Plan 1 3,375 558 17%Neighborhood Health Plan 1 1,755 504 29%Neighborhood Health Plan of Rhode Island 1 1,755 516 20%New Mexico Health Policy Commission 3 5,535 1,149 19% - 23%New York State Department of Health 23 34,500 11,740 29% - 45%NJ Div. of Med. Assistance & Health Svc. 3 664 664 7% - 11%Ohio Dept. of Job and Family Services 7 12,285 4,649 33% - 43%Oklahoma Health Care Authority 1 1,620 334 21%Oregon Department of Human Services 16 13,962 5,383 40% - 53%Pennsylvania Dept. of Public Welfare 8 11,881 3,767 23% - 40%Rocky Mountain Health Plans 1 1,553 574 40%
Total Submitted to CAHPS-HP Database 135 193,726 66,771 7%-55%Deduplicated Total 2 120 171,300 59,840 7%-55%
2008 CAHPS-HP 4.0 Adult Medicaid Sponsor Report B-2
Table 3. Participants in the 2008 CAHPS Health Plan Survey DatabaseThe table below shows the composition of the 2008 CAHPS Health Plan Survey Database adult Medicaid data.
1Total number of completed surveys includes only those surveys coded as a “complete” by the sponsor or their vendor(s).2 For 2008, sponsors submitted CAHPS 4.0 Health Plan Survey adult Medicaid data for 120 unique health plan samples.

Oregon Department of Human Services
Demographic Characteristics Sponsor 2008 CAHPS-HP Database
Gender Male 29% 29% Female 71% 71% Age 18-34 years 33% 36% 35-54 years 43% 39% 55-74 years 24% 20% 75+ years 0% 4% Education Less than high school graduate 25% 28% High school graduate/GED 39% 38% Some college/2 year degree 30% 26% 4 year college graduate 3% 5% More than 4 year college degree 2% 2% Race/Ethnicity White 82% 60% African-American 3% 19% Asian 2% 5% Native Hawaiian/Pacific Islander 0% 1% American Indian/Native Alaskan 3% 1% Other 5% 9% Multi-racial 6% 5% Hispanic/Latino origin or decent Yes 9% 17% No 91% 83% Self-Reported Health Status Excellent 7% 11% Very Good 17% 23% Good 32% 32% Fair 29% 24% Poor 15% 10%
2008 CAHPS-HP 4.0 Adult Medicaid Sponsor Report B-3
Table 4. Demographic Characteristics – CAHPS-HP Database and Oregon Department of Human ServicesTable 4 presents descriptive information for Oregon Department of Human Services compared to the 2008 CAHPS Health Plan Survey Database adult Medicaid data. Similar information about the general adult population available from the U.S. Census Bureau’s Current Population Survey can be used for comparison purposes.
Oregon Department of Human Services
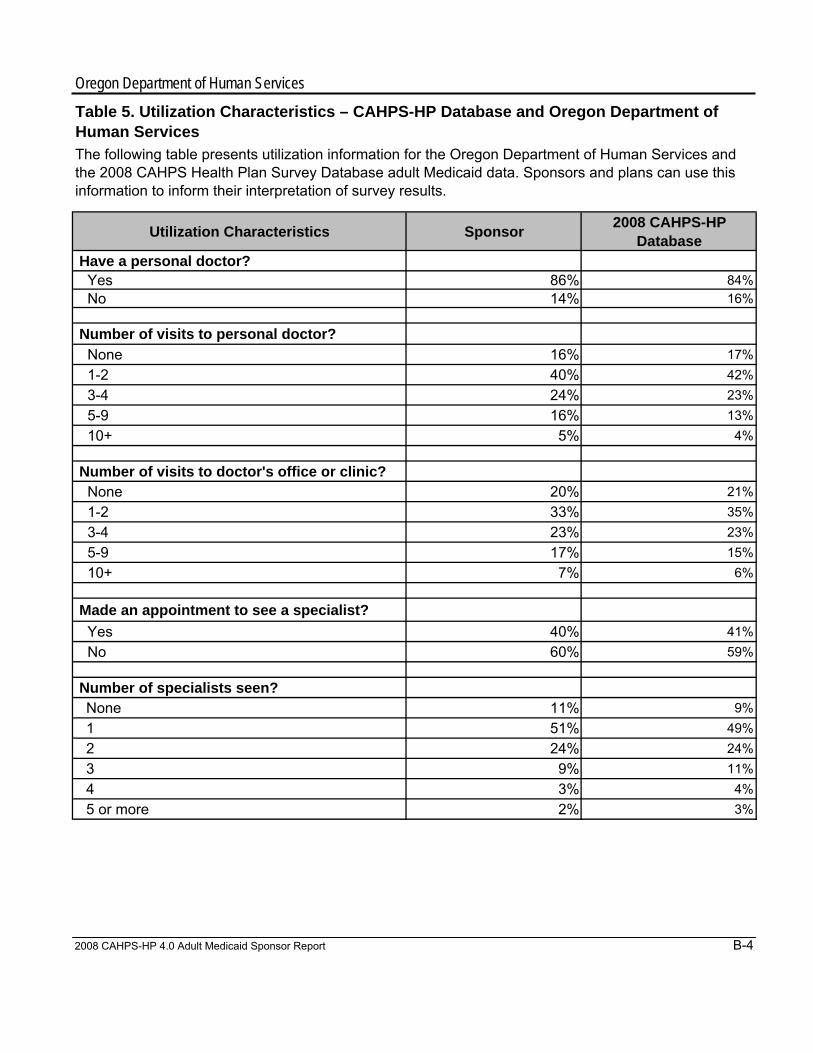
Utilization Characteristics Sponsor 2008 CAHPS-HP Database
Have a personal doctor? Yes 86% 84% No 14% 16%
Number of visits to personal doctor? None 16% 17% 1-2 40% 42% 3-4 24% 23% 5-9 16% 13% 10+ 5% 4%
Number of visits to doctor's office or clinic? None 20% 21% 1-2 33% 35% 3-4 23% 23% 5-9 17% 15% 10+ 7% 6%
Made an appointment to see a specialist? Yes 40% 41% No 60% 59%
Number of specialists seen?None 11% 9%1 51% 49%2 24% 24%3 9% 11%4 3% 4%5 or more 2% 3%
2008 CAHPS-HP 4.0 Adult Medicaid Sponsor Report B-4
Table 5. Utilization Characteristics – CAHPS-HP Database and Oregon Department of Human ServicesThe following table presents utilization information for the Oregon Department of Human Services and the 2008 CAHPS Health Plan Survey Database adult Medicaid data. Sponsors and plans can use this information to inform their interpretation of survey results.

Oregon Department of Human Services
The definitions of the comparative benchmarks used in the bar charts are as follows:● Adult Medicaid – The distribution of results for all adult Medicaid surveys in the 2008 CAHPS
Health Plan Survey Database. ● Region – The distribution of results for all adult Medicaid surveys within the region of the 2008
CAHPS Health Plan Survey Database. See the table on Regional Benchmarks for details on how the regions were defined.
● HMO/POS/PPO – The distribution of results for all adult Medicaid surveys of HMO, POS and PPO plans in the 2008 CAHPS Health Plan Survey Database. For 2008, sponsors submitted 116 HMO, 1 POS and 1 PPO plan(s).
● Primary Care Case Management (PCCM) – The distribution of results for all adult Medicaid PCCM plans in the 2008 CAHPS Health Plan Survey Database.
● Sponsor – The distribution of results for all of the the sponsor’s health plans.
Arrows are shown when the results are significantly different from their relevant comparison group. In this report, the comparison groups are (1) the “Sponsor” result compared against all other Sponsors, and (2) individual health plan results compared against all other health plans. For each survey item or composite measure a mean value (case-mix adjusted) is calculated for each Sponsor
2008 CAHPS-HP 4.0 Adult Medicaid Sponsor Report B-5
(the mean of all plan means). All tests were conducted at the .05 level of statistical significance.all Sponsors (the mean of all Sponsor means) or compared to the mean value for all health plans
Survey Results in Detail
The detailed survey results in this section present the full range of responses in a bar chart format, as shown in the example below for the Getting Needed Care composite:
and for each health plan. These mean values are then statistically compared to the mean value for
Getting Needed Care
Adult Medicaid (n=35518)
South Regional (n=5274)
HMO/POS/PPO (n=34838)
PCCM NA
Sponsor (n=631)
Plan A (n=206)
Plan B (n=215)
Plan C (n=210)
This chart displays the data for "Getting Needed Care", an aggregate of survey questions 23 and 27. Results for the individual questions are displayed on each of the following pages.
AlwaysNever + Sometimes Usually
24%
28%
24%
22%
23%
22%
26%
28%
23%
28%
24%
25%
24%
20%
48%
48%
48%
53%
53%
54%
54%
0% 20% 40% 60% 80% 100%
= Above the mean value of all sponsor or plan means (p < 0.05)
= Below the mean value of all sponsor or plan means (p < 0.05)

Oregon Department of Human Services
RegionNortheast
Midwest
South
West
2008 CAHPS-HP 4.0 Adult Medicaid Sponsor Report B-6
Regional Benchmarks
The regional benchmarks were calculated according to the United States Census Bureau Regions. The table below lists the regions and included states.
Connecticut, Maine, Massachusetts, New Hampshire, New Jersey, New York, Pennsylvania, Puerto Rico, Rhode Island, Vermont
States
Alaska, Arizona, California, Colorado, Guam, Hawaii, Idaho, Montana, Nevada, New Mexico, Oregon, Utah, Washington, Wyoming
Illinois, Indiana, Iowa, Kansas, Michigan, Minnesota, Missouri, Nebraska, North Dakota, Ohio, South Dakota, Wisconsin
Alabama, Arkansas, Delaware, DC, Florida, Georgia, Kentucky, Louisiana, Maryland, Mississippi, North Carolina, Oklahoma, South Carolina, Tennessee, Texas, Virginia, West Virginia

Oregon Department of Human Services
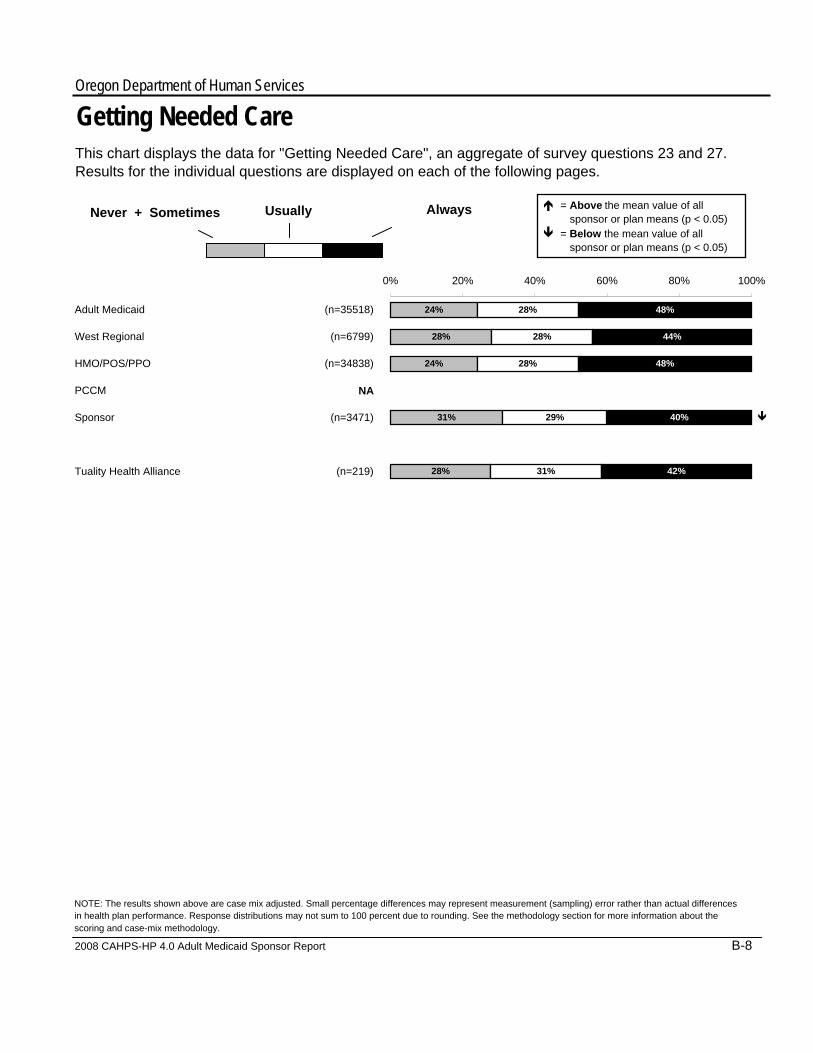
Getting Needed Care
Adult Medicaid (n=35518)
West Regional (n=6799)
HMO/POS/PPO (n=34838)
PCCM NA
Sponsor (n=3471)
Care Oregon (n=196)
Cascade Comprehensive Care (n=231)
Central Oregon Ind Health Services (n=197)
Doctors of the Coast South (n=270)
Douglas County IPA (n=247)
Family Care (n=180)
FFS/PCCM (Medicaid) (n=181)
Intercommunity Health Network (n=234)
Kaiser Permanente Oregon Plus (n=177)
Lane IPA (n=230)
Marion-Polk Community Health Plan (n=234)
Mid-Rogue IPA (n=253)
ODS Community Health (n=129)
Oregon Health Management Services (n=275)
Providence Health Plan (n=218)
2008 CAHPS-HP 4.0 Adult Medicaid Sponsor Report B-7
This chart displays the data for "Getting Needed Care", an aggregate of survey questions 23 and 27. Results for the individual questions are displayed on each of the following pages.
NOTE: The results shown above are case mix adjusted. Small percentage differences may represent measurement (sampling) error rather than actual differencesin health plan performance. Response distributions may not sum to 100 percent due to rounding. See the methodology section for more information about thescoring and case-mix methodology.
AlwaysNever + Sometimes Usually
24%
28%
24%
31%
32%
34%
36%
37%
34%
34%
31%
31%
28%
26%
33%
26%
37%
23%
29%
28%
28%
28%
29%
27%
25%
34%
27%
26%
27%
29%
30%
27%
32%
32%
30%
26%
31%
25%
48%
44%
48%
40%
41%
41%
30%
36%
40%
39%
40%
39%
46%
42%
35%
44%
37%
46%
46%
0% 20% 40% 60% 80% 100%
= Above the mean value of all sponsor or plan means (p < 0.05)
= Below the mean value of all sponsor or plan means (p < 0.05)
Oregon Department of Human Services
Getting Needed Care
Adult Medicaid (n=35518)
West Regional (n=6799)
HMO/POS/PPO (n=34838)
PCCM NA
Sponsor (n=3471)
Tuality Health Alliance (n=219)
2008 CAHPS-HP 4.0 Adult Medicaid Sponsor Report B-8
This chart displays the data for "Getting Needed Care", an aggregate of survey questions 23 and 27. Results for the individual questions are displayed on each of the following pages.
NOTE: The results shown above are case mix adjusted. Small percentage differences may represent measurement (sampling) error rather than actual differencesin health plan performance. Response distributions may not sum to 100 percent due to rounding. See the methodology section for more information about thescoring and case-mix methodology.
AlwaysNever + Sometimes Usually
24%
28%
24%
31%
28%
28%
28%
28%
29%
31%
48%
44%
48%
40%
42%
0% 20% 40% 60% 80% 100%
= Above the mean value of all sponsor or plan means (p < 0.05)
= Below the mean value of all sponsor or plan means (p < 0.05)

Oregon Department of Human Services
Adult Medicaid (n=22782)
West Regional (n=4059)
HMO/POS/PPO (n=22335)
PCCM NA
Sponsor (n=2030)
Care Oregon (n=111)
Cascade Comprehensive Care (n=127)
Central Oregon Ind Health Services (n=113)
Doctors of the Coast South (n=171)
Douglas County IPA (n=163)
Family Care (n=95)
FFS/PCCM (Medicaid) (n=108)
Intercommunity Health Network (n=141)
Kaiser Permanente Oregon Plus (n=91)
Lane IPA (n=137)
Marion-Polk Community Health Plan (n=136)
Mid-Rogue IPA (n=143)
ODS Community Health (n=76)
Oregon Health Management Services (n=150)
Providence Health Plan (n=125)
2008 CAHPS-HP 4.0 Adult Medicaid Sponsor Report B-9
Q23. Of those respondents who tried to make an appointment to see a specialist: "In the last 6 months, how often was it easy to get appointments with specialists?"
NOTE: The results shown above are case mix adjusted. Small percentage differences may represent measurement (sampling) error rather than actual differencesin health plan performance. Response distributions may not sum to 100 percent due to rounding. See the methodology section for more information about thescoring and case-mix methodology.
AlwaysNever + Sometimes Usually
26%
29%
26%
31%
32%
34%
34%
36%
31%
33%
31%
32%
36%
26%
35%
26%
39%
21%
32%
28%
28%
28%
29%
25%
23%
36%
30%
23%
26%
31%
30%
23%
34%
32%
30%
26%
35%
23%
46%
43%
46%
40%
43%
43%
30%
33%
45%
41%
38%
38%
41%
40%
33%
44%
34%
43%
45%
0% 20% 40% 60% 80% 100%
= Above the mean value of all sponsor or plan means (p < 0.05)
= Below the mean value of all sponsor or plan means (p < 0.05)

Oregon Department of Human Services
Adult Medicaid (n=22782)
West Regional (n=4059)
HMO/POS/PPO (n=22335)
PCCM NA
Sponsor (n=2030)
Tuality Health Alliance (n=143)
2008 CAHPS-HP 4.0 Adult Medicaid Sponsor Report B-10
Q23. Of those respondents who tried to make an appointment to see a specialist: "In the last 6 months, how often was it easy to get appointments with specialists?"
NOTE: The results shown above are case mix adjusted. Small percentage differences may represent measurement (sampling) error rather than actual differencesin health plan performance. Response distributions may not sum to 100 percent due to rounding. See the methodology section for more information about thescoring and case-mix methodology.
AlwaysNever + Sometimes Usually
26%
29%
26%
31%
22%
28%
28%
28%
29%
31%
46%
43%
46%
40%
47%
0% 20% 40% 60% 80% 100%
= Above the mean value of all sponsor or plan means (p < 0.05)
= Below the mean value of all sponsor or plan means (p < 0.05)

Oregon Department of Human Services
Adult Medicaid (n=30466)
West Regional (n=5980)
HMO/POS/PPO (n=29874)
PCCM NA
Sponsor (n=3134)
Care Oregon (n=175)
Cascade Comprehensive Care (n=211)
Central Oregon Ind Health Services (n=182)
Doctors of the Coast South (n=247)
Douglas County IPA (n=224)
Family Care (n=157)
FFS/PCCM (Medicaid) (n=157)
Intercommunity Health Network (n=218)
Kaiser Permanente Oregon Plus (n=158)
Lane IPA (n=204)
Marion-Polk Community Health Plan (n=213)
Mid-Rogue IPA (n=229)
ODS Community Health (n=110)
Oregon Health Management Services (n=255)
Providence Health Plan (n=200)
2008 CAHPS-HP 4.0 Adult Medicaid Sponsor Report B-11
Q27. Of those respondents who tried to get any kind of care, tests, or treatment through their health plan: "In the last 6 months, how often was it easy to get the care, tests, or treatment you thought you needed through your health plan?"
NOTE: The results shown above are case mix adjusted. Small percentage differences may represent measurement (sampling) error rather than actual differencesin health plan performance. Response distributions may not sum to 100 percent due to rounding. See the methodology section for more information about thescoring and case-mix methodology.
AlwaysNever + Sometimes Usually
22%
26%
22%
31%
33%
35%
38%
38%
37%
35%
30%
31%
19%
26%
31%
26%
35%
24%
26%
28%
28%
28%
29%
28%
27%
32%
24%
28%
28%
27%
30%
30%
30%
32%
30%
25%
27%
27%
50%
46%
50%
40%
39%
39%
30%
38%
35%
37%
43%
39%
51%
44%
37%
44%
39%
48%
48%
0% 20% 40% 60% 80% 100%
= Above the mean value of all sponsor or plan means (p < 0.05)
= Below the mean value of all sponsor or plan means (p < 0.05)

Oregon Department of Human Services
Adult Medicaid (n=30466)
West Regional (n=5980)
HMO/POS/PPO (n=29874)
PCCM NA
Sponsor (n=3134)
Tuality Health Alliance (n=194)
2008 CAHPS-HP 4.0 Adult Medicaid Sponsor Report B-12
Q27. Of those respondents who tried to get any kind of care, tests, or treatment through their health plan: "In the last 6 months, how often was it easy to get the care, tests, or treatment you thought you needed through your health plan?"
NOTE: The results shown above are case mix adjusted. Small percentage differences may represent measurement (sampling) error rather than actual differencesin health plan performance. Response distributions may not sum to 100 percent due to rounding. See the methodology section for more information about thescoring and case-mix methodology.
AlwaysNever + Sometimes Usually
22%
26%
22%
31%
34%
28%
28%
28%
29%
30%
50%
46%
50%
40%
37%
0% 20% 40% 60% 80% 100%
= Above the mean value of all sponsor or plan means (p < 0.05)
= Below the mean value of all sponsor or plan means (p < 0.05)

Oregon Department of Human Services
Getting Care Quickly
Adult Medicaid (n=45668)
West Regional (n=8536)
HMO/POS/PPO (n=44834)
PCCM NA
Sponsor (n=4047)
Care Oregon (n=233)
Cascade Comprehensive Care (n=270)
Central Oregon Ind Health Services (n=238)
Doctors of the Coast South (n=309)
Douglas County IPA (n=276)
Family Care (n=199)
FFS/PCCM (Medicaid) (n=227)
Intercommunity Health Network (n=265)
Kaiser Permanente Oregon Plus (n=211)
Lane IPA (n=281)
Marion-Polk Community Health Plan (n=279)
Mid-Rogue IPA (n=285)
ODS Community Health (n=149)
Oregon Health Management Services (n=316)
Providence Health Plan (n=246)
2008 CAHPS-HP 4.0 Adult Medicaid Sponsor Report B-13
This chart displays the data for "Getting Care Quickly", an aggregate of survey questions 4 and 6. Results for the individual questions are displayed on each of the following pages.
NOTE: The results shown above are case mix adjusted. Small percentage differences may represent measurement (sampling) error rather than actual differencesin health plan performance. Response distributions may not sum to 100 percent due to rounding. See the methodology section for more information about thescoring and case-mix methodology.
AlwaysNever + Sometimes Usually
20%
22%
20%
22%
27%
28%
18%
25%
27%
28%
20%
24%
22%
16%
19%
20%
22%
20%
15%
25%
27%
25%
29%
28%
26%
30%
27%
31%
27%
29%
29%
29%
32%
37%
30%
28%
27%
29%
55%
52%
55%
50%
46%
46%
51%
48%
43%
45%
51%
48%
49%
52%
44%
50%
51%
53%
57%
0% 20% 40% 60% 80% 100%
= Above the mean value of all sponsor or plan means (p < 0.05)
= Below the mean value of all sponsor or plan means (p < 0.05)

Oregon Department of Human Services
Getting Care Quickly
Adult Medicaid (n=45668)
West Regional (n=8536)
HMO/POS/PPO (n=44834)
PCCM NA
Sponsor (n=4047)
Tuality Health Alliance (n=263)
2008 CAHPS-HP 4.0 Adult Medicaid Sponsor Report B-14
This chart displays the data for "Getting Care Quickly", an aggregate of survey questions 4 and 6. Results for the individual questions are displayed on each of the following pages.
NOTE: The results shown above are case mix adjusted. Small percentage differences may represent measurement (sampling) error rather than actual differencesin health plan performance. Response distributions may not sum to 100 percent due to rounding. See the methodology section for more information about thescoring and case-mix methodology.
AlwaysNever + Sometimes Usually
20%
22%
20%
22%
16%
25%
27%
25%
29%
25%
55%
52%
55%
50%
60%
0% 20% 40% 60% 80% 100%
= Above the mean value of all sponsor or plan means (p < 0.05)
= Below the mean value of all sponsor or plan means (p < 0.05)
Oregon Department of Human Services
Adult Medicaid (n=25186)
West Regional (n=4735)
HMO/POS/PPO (n=24700)
PCCM NA
Sponsor (n=2309)
Care Oregon (n=136)
Cascade Comprehensive Care (n=150)
Central Oregon Ind Health Services (n=156)
Doctors of the Coast South (n=178)
Douglas County IPA (n=161)
Family Care (n=110)
FFS/PCCM (Medicaid) (n=124)
Intercommunity Health Network (n=146)
Kaiser Permanente Oregon Plus (n=126)
Lane IPA (n=159)
Marion-Polk Community Health Plan (n=160)
Mid-Rogue IPA (n=158)
ODS Community Health (n=75)
Oregon Health Management Services (n=184)
Providence Health Plan (n=134)
2008 CAHPS-HP 4.0 Adult Medicaid Sponsor Report B-15
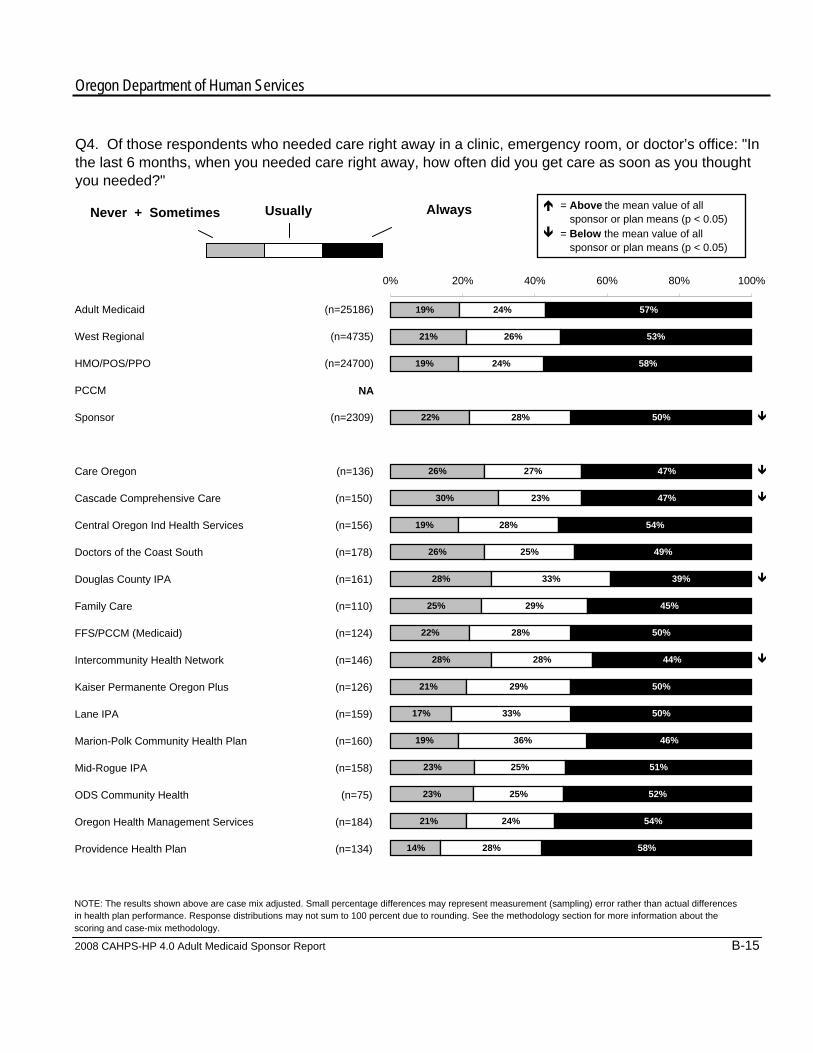
Q4. Of those respondents who needed care right away in a clinic, emergency room, or doctor’s office: "In the last 6 months, when you needed care right away, how often did you get care as soon as you thought you needed?"
NOTE: The results shown above are case mix adjusted. Small percentage differences may represent measurement (sampling) error rather than actual differencesin health plan performance. Response distributions may not sum to 100 percent due to rounding. See the methodology section for more information about thescoring and case-mix methodology.
AlwaysNever + Sometimes Usually
19%
21%
19%
22%
26%
30%
19%
26%
28%
25%
22%
28%
21%
17%
19%
23%
23%
21%
14%
24%
26%
24%
28%
27%
23%
28%
25%
33%
29%
28%
28%
29%
33%
36%
25%
25%
24%
28%
57%
53%
58%
50%
47%
47%
54%
49%
39%
45%
50%
44%
50%
50%
46%
51%
52%
54%
58%
0% 20% 40% 60% 80% 100%
= Above the mean value of all sponsor or plan means (p < 0.05)
= Below the mean value of all sponsor or plan means (p < 0.05)

Oregon Department of Human Services
Adult Medicaid (n=25186)
West Regional (n=4735)
HMO/POS/PPO (n=24700)
PCCM NA
Sponsor (n=2309)
Tuality Health Alliance (n=152)
2008 CAHPS-HP 4.0 Adult Medicaid Sponsor Report B-16
Q4. Of those respondents who needed care right away in a clinic, emergency room, or doctor’s office: "In the last 6 months, when you needed care right away, how often did you get care as soon as you thought you needed?"
NOTE: The results shown above are case mix adjusted. Small percentage differences may represent measurement (sampling) error rather than actual differencesin health plan performance. Response distributions may not sum to 100 percent due to rounding. See the methodology section for more information about thescoring and case-mix methodology.
AlwaysNever + Sometimes Usually
19%
21%
19%
22%
18%
24%
26%
24%
28%
22%
57%
53%
58%
50%
59%
0% 20% 40% 60% 80% 100%
= Above the mean value of all sponsor or plan means (p < 0.05)
= Below the mean value of all sponsor or plan means (p < 0.05)

Oregon Department of Human Services
Adult Medicaid (n=41759)
West Regional (n=7785)
HMO/POS/PPO (n=40981)
PCCM NA
Sponsor (n=3697)
Care Oregon (n=211)
Cascade Comprehensive Care (n=241)
Central Oregon Ind Health Services (n=208)
Doctors of the Coast South (n=291)
Douglas County IPA (n=259)
Family Care (n=172)
FFS/PCCM (Medicaid) (n=206)
Intercommunity Health Network (n=244)
Kaiser Permanente Oregon Plus (n=190)
Lane IPA (n=262)
Marion-Polk Community Health Plan (n=258)
Mid-Rogue IPA (n=269)
ODS Community Health (n=134)
Oregon Health Management Services (n=289)
Providence Health Plan (n=224)
2008 CAHPS-HP 4.0 Adult Medicaid Sponsor Report B-17
Q6. Of those respondents who made appointment at doctor's office:"In last 6 months, not counting the times you needed care right away, how often did you get an appointment for health care at a doctor's office or clinic as soon as you thought you needed?"
NOTE: The results shown above are case mix adjusted. Small percentage differences may represent measurement (sampling) error rather than actual differencesin health plan performance. Response distributions may not sum to 100 percent due to rounding. See the methodology section for more information about thescoring and case-mix methodology.
AlwaysNever + Sometimes Usually
20%
22%
21%
21%
28%
26%
18%
24%
25%
30%
18%
19%
23%
15%
19%
17%
21%
19%
16%
27%
28%
27%
30%
28%
30%
33%
30%
28%
24%
30%
29%
29%
31%
38%
34%
30%
29%
29%
53%
50%
53%
49%
44%
44%
49%
47%
47%
45%
51%
52%
48%
54%
43%
49%
49%
51%
55%
0% 20% 40% 60% 80% 100%
= Above the mean value of all sponsor or plan means (p < 0.05)
= Below the mean value of all sponsor or plan means (p < 0.05)

Oregon Department of Human Services
Adult Medicaid (n=41759)
West Regional (n=7785)
HMO/POS/PPO (n=40981)
PCCM NA
Sponsor (n=3697)
Tuality Health Alliance (n=239)
2008 CAHPS-HP 4.0 Adult Medicaid Sponsor Report B-18
Q6. Of those respondents who made appointment at doctor's office:"In last 6 months, not counting the times you needed care right away, how often did you get an appointment for health care at a doctor's office or clinic as soon as you thought you needed?"
NOTE: The results shown above are case mix adjusted. Small percentage differences may represent measurement (sampling) error rather than actual differencesin health plan performance. Response distributions may not sum to 100 percent due to rounding. See the methodology section for more information about thescoring and case-mix methodology.
AlwaysNever + Sometimes Usually
20%
22%
21%
21%
13%
27%
28%
27%
30%
27%
53%
50%
53%
49%
60%
0% 20% 40% 60% 80% 100%
= Above the mean value of all sponsor or plan means (p < 0.05)
= Below the mean value of all sponsor or plan means (p < 0.05)

Oregon Department of Human Services
How Well Doctors Communicate
Adult Medicaid (n=38540)
West Regional (n=7198)
HMO/POS/PPO (n=37797)
PCCM NA
Sponsor (n=3525)
Care Oregon (n=174)
Cascade Comprehensive Care (n=225)
Central Oregon Ind Health Services (n=196)
Doctors of the Coast South (n=282)
Douglas County IPA (n=246)
Family Care (n=174)
FFS/PCCM (Medicaid) (n=195)
Intercommunity Health Network (n=234)
Kaiser Permanente Oregon Plus (n=185)
Lane IPA (n=244)
Marion-Polk Community Health Plan (n=241)
Mid-Rogue IPA (n=255)
ODS Community Health (n=114)
Oregon Health Management Services (n=280)
Providence Health Plan (n=233)
2008 CAHPS-HP 4.0 Adult Medicaid Sponsor Report B-19
This chart displays the data for "How Well Doctors Communicate", an aggregate of survey questions 15, 16, 17 and 18. Results for the individual questions are displayed on each of the following pages.
NOTE: The results shown above are case mix adjusted. Small percentage differences may represent measurement (sampling) error rather than actual differencesin health plan performance. Response distributions may not sum to 100 percent due to rounding. See the methodology section for more information about thescoring and case-mix methodology.
AlwaysNever + Sometimes Usually
12%
13%
12%
14%
14%
12%
8%
19%
20%
17%
13%
15%
11%
17%
16%
15%
12%
13%
11%
20%
21%
20%
22%
26%
22%
20%
23%
21%
25%
21%
20%
19%
23%
23%
22%
17%
23%
20%
69%
66%
69%
64%
60%
65%
72%
58%
60%
58%
67%
65%
70%
61%
61%
63%
70%
64%
69%
0% 20% 40% 60% 80% 100%
= Above the mean value of all sponsor or plan means (p < 0.05)
= Below the mean value of all sponsor or plan means (p < 0.05)

Oregon Department of Human Services
How Well Doctors Communicate
Adult Medicaid (n=38540)
West Regional (n=7198)
HMO/POS/PPO (n=37797)
PCCM NA
Sponsor (n=3525)
Tuality Health Alliance (n=247)
2008 CAHPS-HP 4.0 Adult Medicaid Sponsor Report B-20
This chart displays the data for "How Well Doctors Communicate", an aggregate of survey questions 15, 16, 17 and 18. Results for the individual questions are displayed on each of the following pages.
NOTE: The results shown above are case mix adjusted. Small percentage differences may represent measurement (sampling) error rather than actual differencesin health plan performance. Response distributions may not sum to 100 percent due to rounding. See the methodology section for more information about thescoring and case-mix methodology.
AlwaysNever + Sometimes Usually
12%
13%
12%
14%
12%
20%
21%
20%
22%
22%
69%
66%
69%
64%
66%
0% 20% 40% 60% 80% 100%
= Above the mean value of all sponsor or plan means (p < 0.05)
= Below the mean value of all sponsor or plan means (p < 0.05)

Oregon Department of Human Services
Adult Medicaid (n=38242)
West Regional (n=7160)
HMO/POS/PPO (n=37503)
PCCM NA
Sponsor (n=3507)
Care Oregon (n=173)
Cascade Comprehensive Care (n=225)
Central Oregon Ind Health Services (n=195)
Doctors of the Coast South (n=278)
Douglas County IPA (n=244)
Family Care (n=174)
FFS/PCCM (Medicaid) (n=195)
Intercommunity Health Network (n=234)
Kaiser Permanente Oregon Plus (n=184)
Lane IPA (n=243)
Marion-Polk Community Health Plan (n=241)
Mid-Rogue IPA (n=253)
ODS Community Health (n=114)
Oregon Health Management Services (n=278)
Providence Health Plan (n=231)
2008 CAHPS-HP 4.0 Adult Medicaid Sponsor Report B-21
Q15. Of those respondents who went to a personal doctor's office: "In the last 6 months, how often did your personal doctor explain things in a way that was easy to understand?"
NOTE: The results shown above are case mix adjusted. Small percentage differences may represent measurement (sampling) error rather than actual differencesin health plan performance. Response distributions may not sum to 100 percent due to rounding. See the methodology section for more information about thescoring and case-mix methodology.
AlwaysNever + Sometimes Usually
12%
13%
12%
13%
13%
13%
6%
17%
18%
14%
13%
13%
10%
12%
15%
13%
14%
10%
10%
20%
22%
20%
22%
27%
19%
22%
23%
23%
28%
18%
21%
20%
22%
24%
23%
20%
23%
21%
68%
65%
68%
65%
60%
68%
72%
60%
59%
59%
69%
65%
71%
65%
61%
64%
66%
67%
68%
0% 20% 40% 60% 80% 100%
= Above the mean value of all sponsor or plan means (p < 0.05)
= Below the mean value of all sponsor or plan means (p < 0.05)

Oregon Department of Human Services
Adult Medicaid (n=38242)
West Regional (n=7160)
HMO/POS/PPO (n=37503)
PCCM NA
Sponsor (n=3507)
Tuality Health Alliance (n=245)
2008 CAHPS-HP 4.0 Adult Medicaid Sponsor Report B-22
Q15. Of those respondents who went to a personal doctor's office: "In the last 6 months, how often did your personal doctor explain things in a way that was easy to understand?"
NOTE: The results shown above are case mix adjusted. Small percentage differences may represent measurement (sampling) error rather than actual differencesin health plan performance. Response distributions may not sum to 100 percent due to rounding. See the methodology section for more information about thescoring and case-mix methodology.
AlwaysNever + Sometimes Usually
12%
13%
12%
13%
10%
20%
22%
20%
22%
20%
68%
65%
68%
65%
70%
0% 20% 40% 60% 80% 100%
= Above the mean value of all sponsor or plan means (p < 0.05)
= Below the mean value of all sponsor or plan means (p < 0.05)

Oregon Department of Human Services
Adult Medicaid (n=38189)
West Regional (n=7145)
HMO/POS/PPO (n=37448)
PCCM NA
Sponsor (n=3506)
Care Oregon (n=173)
Cascade Comprehensive Care (n=222)
Central Oregon Ind Health Services (n=196)
Doctors of the Coast South (n=279)
Douglas County IPA (n=244)
Family Care (n=174)
FFS/PCCM (Medicaid) (n=194)
Intercommunity Health Network (n=231)
Kaiser Permanente Oregon Plus (n=185)
Lane IPA (n=243)
Marion-Polk Community Health Plan (n=240)
Mid-Rogue IPA (n=255)
ODS Community Health (n=112)
Oregon Health Management Services (n=279)
Providence Health Plan (n=233)
2008 CAHPS-HP 4.0 Adult Medicaid Sponsor Report B-23
Q16. Of those respondents who went to a personal doctor's office: "In the last 6 months, how often did your personal doctor listen carefully to you?"
NOTE: The results shown above are case mix adjusted. Small percentage differences may represent measurement (sampling) error rather than actual differencesin health plan performance. Response distributions may not sum to 100 percent due to rounding. See the methodology section for more information about thescoring and case-mix methodology.
AlwaysNever + Sometimes Usually
11%
13%
11%
15%
15%
11%
9%
19%
20%
17%
14%
15%
11%
19%
16%
16%
13%
15%
10%
18%
20%
18%
20%
28%
21%
18%
22%
18%
24%
18%
19%
17%
19%
23%
20%
14%
22%
18%
70%
67%
70%
65%
57%
68%
72%
59%
63%
59%
68%
66%
72%
62%
62%
65%
73%
63%
71%
0% 20% 40% 60% 80% 100%
= Above the mean value of all sponsor or plan means (p < 0.05)
= Below the mean value of all sponsor or plan means (p < 0.05)

Oregon Department of Human Services
Adult Medicaid (n=38189)
West Regional (n=7145)
HMO/POS/PPO (n=37448)
PCCM NA
Sponsor (n=3506)
Tuality Health Alliance (n=246)
2008 CAHPS-HP 4.0 Adult Medicaid Sponsor Report B-24
Q16. Of those respondents who went to a personal doctor's office: "In the last 6 months, how often did your personal doctor listen carefully to you?"
NOTE: The results shown above are case mix adjusted. Small percentage differences may represent measurement (sampling) error rather than actual differencesin health plan performance. Response distributions may not sum to 100 percent due to rounding. See the methodology section for more information about thescoring and case-mix methodology.
AlwaysNever + Sometimes Usually
11%
13%
11%
15%
12%
18%
20%
18%
20%
20%
70%
67%
70%
65%
67%
0% 20% 40% 60% 80% 100%
= Above the mean value of all sponsor or plan means (p < 0.05)
= Below the mean value of all sponsor or plan means (p < 0.05)

Oregon Department of Human Services
Adult Medicaid (n=38149)
West Regional (n=7155)
HMO/POS/PPO (n=37409)
PCCM NA
Sponsor (n=3500)
Care Oregon (n=173)
Cascade Comprehensive Care (n=225)
Central Oregon Ind Health Services (n=195)
Doctors of the Coast South (n=279)
Douglas County IPA (n=244)
Family Care (n=173)
FFS/PCCM (Medicaid) (n=193)
Intercommunity Health Network (n=232)
Kaiser Permanente Oregon Plus (n=183)
Lane IPA (n=241)
Marion-Polk Community Health Plan (n=239)
Mid-Rogue IPA (n=255)
ODS Community Health (n=112)
Oregon Health Management Services (n=279)
Providence Health Plan (n=231)
2008 CAHPS-HP 4.0 Adult Medicaid Sponsor Report B-25
Q17. Of those respondents who went to a personal doctor's office: "In the last 6 months, how often did your personal doctor show respect for what you had to say?"
NOTE: The results shown above are case mix adjusted. Small percentage differences may represent measurement (sampling) error rather than actual differencesin health plan performance. Response distributions may not sum to 100 percent due to rounding. See the methodology section for more information about thescoring and case-mix methodology.
AlwaysNever + Sometimes Usually
10%
11%
10%
13%
12%
11%
6%
19%
17%
14%
9%
14%
10%
15%
15%
15%
8%
13%
10%
16%
18%
16%
18%
21%
18%
15%
19%
18%
21%
19%
14%
15%
21%
17%
19%
15%
20%
15%
74%
71%
74%
69%
66%
71%
79%
62%
65%
64%
72%
72%
74%
64%
69%
66%
77%
67%
75%
0% 20% 40% 60% 80% 100%
= Above the mean value of all sponsor or plan means (p < 0.05)
= Below the mean value of all sponsor or plan means (p < 0.05)

Oregon Department of Human Services
Adult Medicaid (n=38149)
West Regional (n=7155)
HMO/POS/PPO (n=37409)
PCCM NA
Sponsor (n=3500)
Tuality Health Alliance (n=246)
2008 CAHPS-HP 4.0 Adult Medicaid Sponsor Report B-26
Q17. Of those respondents who went to a personal doctor's office: "In the last 6 months, how often did your personal doctor show respect for what you had to say?"
NOTE: The results shown above are case mix adjusted. Small percentage differences may represent measurement (sampling) error rather than actual differencesin health plan performance. Response distributions may not sum to 100 percent due to rounding. See the methodology section for more information about thescoring and case-mix methodology.
AlwaysNever + Sometimes Usually
10%
11%
10%
13%
11%
16%
18%
16%
18%
22%
74%
71%
74%
69%
68%
0% 20% 40% 60% 80% 100%
= Above the mean value of all sponsor or plan means (p < 0.05)
= Below the mean value of all sponsor or plan means (p < 0.05)

Oregon Department of Human Services
Adult Medicaid (n=38127)
West Regional (n=7137)
HMO/POS/PPO (n=37385)
PCCM NA
Sponsor (n=3490)
Care Oregon (n=174)
Cascade Comprehensive Care (n=222)
Central Oregon Ind Health Services (n=196)
Doctors of the Coast South (n=279)
Douglas County IPA (n=241)
Family Care (n=172)
FFS/PCCM (Medicaid) (n=193)
Intercommunity Health Network (n=233)
Kaiser Permanente Oregon Plus (n=180)
Lane IPA (n=241)
Marion-Polk Community Health Plan (n=238)
Mid-Rogue IPA (n=254)
ODS Community Health (n=113)
Oregon Health Management Services (n=278)
Providence Health Plan (n=231)
2008 CAHPS-HP 4.0 Adult Medicaid Sponsor Report B-27
Q18. Of those respondents who went to a personal doctor's office: "In the last 6 months, how often did your personal doctor spend enough time with you?"
NOTE: The results shown above are case mix adjusted. Small percentage differences may represent measurement (sampling) error rather than actual differencesin health plan performance. Response distributions may not sum to 100 percent due to rounding. See the methodology section for more information about thescoring and case-mix methodology.
AlwaysNever + Sometimes Usually
15%
16%
15%
17%
18%
15%
12%
23%
24%
22%
14%
18%
12%
20%
19%
17%
15%
16%
15%
23%
25%
24%
26%
28%
32%
24%
28%
24%
28%
28%
26%
24%
28%
29%
27%
20%
24%
23%
62%
58%
62%
56%
55%
53%
64%
49%
52%
50%
58%
55%
64%
52%
53%
56%
65%
60%
61%
0% 20% 40% 60% 80% 100%
= Above the mean value of all sponsor or plan means (p < 0.05)
= Below the mean value of all sponsor or plan means (p < 0.05)

Oregon Department of Human Services
Adult Medicaid (n=38127)
West Regional (n=7137)
HMO/POS/PPO (n=37385)
PCCM NA
Sponsor (n=3490)
Tuality Health Alliance (n=245)
2008 CAHPS-HP 4.0 Adult Medicaid Sponsor Report B-28
Q18. Of those respondents who went to a personal doctor's office: "In the last 6 months, how often did your personal doctor spend enough time with you?"
NOTE: The results shown above are case mix adjusted. Small percentage differences may represent measurement (sampling) error rather than actual differencesin health plan performance. Response distributions may not sum to 100 percent due to rounding. See the methodology section for more information about thescoring and case-mix methodology.
AlwaysNever + Sometimes Usually
15%
16%
15%
17%
13%
23%
25%
24%
26%
27%
62%
58%
62%
56%
60%
0% 20% 40% 60% 80% 100%
= Above the mean value of all sponsor or plan means (p < 0.05)
= Below the mean value of all sponsor or plan means (p < 0.05)

Oregon Department of Human Services
Health Plan Information & Customer Service
Adult Medicaid (n=15645)
West Regional (n=2379)
HMO/POS/PPO (n=15428)
PCCM NA
Sponsor (n=1138)
Care Oregon (n=72)
Cascade Comprehensive Care (n=78)
Central Oregon Ind Health Services (n=73)
Doctors of the Coast South (n=70)
Douglas County IPA (n=91)
Family Care (n=61)
FFS/PCCM (Medicaid) (n=46)
Intercommunity Health Network (n=68)
Kaiser Permanente Oregon Plus (n=59)
Lane IPA (n=64)
Marion-Polk Community Health Plan (n=93)
Mid-Rogue IPA (n=68)
ODS Community Health (n=53)
Oregon Health Management Services (n=72)
Providence Health Plan (n=85)
2008 CAHPS-HP 4.0 Adult Medicaid Sponsor Report B-29
This chart displays the data for "Health Plan Information & Customer Service", an aggregate of survey questions 31 and 32. Results for the individual questions are displayed on each of the following pages.
NOTE: The results shown above are case mix adjusted. Small percentage differences may represent measurement (sampling) error rather than actual differencesin health plan performance. Response distributions may not sum to 100 percent due to rounding. See the methodology section for more information about thescoring and case-mix methodology.
AlwaysNever + Sometimes Usually
21%
27%
21%
30%
31%
31%
41%
35%
36%
28%
35%
25%
19%
27%
28%
28%
35%
21%
24%
22%
24%
22%
24%
24%
18%
25%
23%
21%
23%
22%
21%
26%
29%
25%
24%
23%
21%
25%
57%
50%
57%
47%
46%
51%
35%
42%
42%
49%
43%
54%
55%
44%
48%
48%
42%
57%
51%
0% 20% 40% 60% 80% 100%
= Above the mean value of all sponsor or plan means (p < 0.05)
= Below the mean value of all sponsor or plan means (p < 0.05)

Oregon Department of Human Services
Health Plan Information & Customer Service
Adult Medicaid (n=15645)
West Regional (n=2379)
HMO/POS/PPO (n=15428)
PCCM NA
Sponsor (n=1138)
Tuality Health Alliance (n=85)
2008 CAHPS-HP 4.0 Adult Medicaid Sponsor Report B-30
This chart displays the data for "Health Plan Information & Customer Service", an aggregate of survey questions 31 and 32. Results for the individual questions are displayed on each of the following pages.
NOTE: The results shown above are case mix adjusted. Small percentage differences may represent measurement (sampling) error rather than actual differencesin health plan performance. Response distributions may not sum to 100 percent due to rounding. See the methodology section for more information about thescoring and case-mix methodology.
AlwaysNever + Sometimes Usually
21%
27%
21%
30%
30%
22%
24%
22%
24%
26%
57%
50%
57%
47%
44%
0% 20% 40% 60% 80% 100%
= Above the mean value of all sponsor or plan means (p < 0.05)
= Below the mean value of all sponsor or plan means (p < 0.05)

Oregon Department of Human Services
Adult Medicaid (n=15506)
West Regional (n=2357)
HMO/POS/PPO (n=15289)
PCCM NA
Sponsor (n=1126)
Care Oregon (n=72)
Cascade Comprehensive Care (n=78)
Central Oregon Ind Health Services (n=73)
Doctors of the Coast South (n=69)
Douglas County IPA (n=91)
Family Care (n=61)
FFS/PCCM (Medicaid) (n=46)
Intercommunity Health Network (n=67)
Kaiser Permanente Oregon Plus (n=58)
Lane IPA (n=63)
Marion-Polk Community Health Plan (n=92)
Mid-Rogue IPA (n=64)
ODS Community Health (n=53)
Oregon Health Management Services (n=70)
Providence Health Plan (n=85)
2008 CAHPS-HP 4.0 Adult Medicaid Sponsor Report B-31
Q31. Of those respondents who tried to get information or help from their health plan's customer service: "In the last 6 months, how often did your health plan’s customer service give you the information or help you needed?"
NOTE: The results shown above are case mix adjusted. Small percentage differences may represent measurement (sampling) error rather than actual differencesin health plan performance. Response distributions may not sum to 100 percent due to rounding. See the methodology section for more information about thescoring and case-mix methodology.
AlwaysNever + Sometimes Usually
29%
35%
29%
39%
38%
38%
55%
49%
46%
34%
43%
36%
28%
37%
40%
36%
43%
31%
33%
23%
23%
23%
22%
25%
18%
15%
16%
18%
26%
26%
22%
24%
29%
20%
25%
25%
23%
21%
48%
42%
48%
39%
38%
44%
30%
35%
36%
39%
30%
42%
48%
35%
40%
39%
32%
46%
46%
0% 20% 40% 60% 80% 100%
= Above the mean value of all sponsor or plan means (p < 0.05)
= Below the mean value of all sponsor or plan means (p < 0.05)

Oregon Department of Human Services
Adult Medicaid (n=15506)
West Regional (n=2357)
HMO/POS/PPO (n=15289)
PCCM NA
Sponsor (n=1126)
Tuality Health Alliance (n=84)
2008 CAHPS-HP 4.0 Adult Medicaid Sponsor Report B-32
Q31. Of those respondents who tried to get information or help from their health plan's customer service: "In the last 6 months, how often did your health plan’s customer service give you the information or help you needed?"
NOTE: The results shown above are case mix adjusted. Small percentage differences may represent measurement (sampling) error rather than actual differencesin health plan performance. Response distributions may not sum to 100 percent due to rounding. See the methodology section for more information about thescoring and case-mix methodology.
AlwaysNever + Sometimes Usually
29%
35%
29%
39%
38%
23%
23%
23%
22%
24%
48%
42%
48%
39%
38%
0% 20% 40% 60% 80% 100%
= Above the mean value of all sponsor or plan means (p < 0.05)
= Below the mean value of all sponsor or plan means (p < 0.05)

Oregon Department of Human Services
Adult Medicaid (n=15456)
West Regional (n=2352)
HMO/POS/PPO (n=15239)
PCCM NA
Sponsor (n=1125)
Care Oregon (n=71)
Cascade Comprehensive Care (n=78)
Central Oregon Ind Health Services (n=72)
Doctors of the Coast South (n=70)
Douglas County IPA (n=91)
Family Care (n=61)
FFS/PCCM (Medicaid) (n=45)
Intercommunity Health Network (n=68)
Kaiser Permanente Oregon Plus (n=59)
Lane IPA (n=61)
Marion-Polk Community Health Plan (n=93)
Mid-Rogue IPA (n=67)
ODS Community Health (n=53)
Oregon Health Management Services (n=70)
Providence Health Plan (n=85)
2008 CAHPS-HP 4.0 Adult Medicaid Sponsor Report B-33
Q32. Of those respondents who tried to get information or help from their health plan's customer service: “In the last 6 months, how often did your health plan’s customer service staff treat you with courtesy and respect?"
NOTE: The results shown above are case mix adjusted. Small percentage differences may represent measurement (sampling) error rather than actual differencesin health plan performance. Response distributions may not sum to 100 percent due to rounding. See the methodology section for more information about thescoring and case-mix methodology.
AlwaysNever + Sometimes Usually
14%
19%
14%
20%
24%
23%
26%
21%
26%
21%
27%
13%
10%
18%
15%
19%
26%
11%
15%
21%
24%
21%
25%
23%
18%
35%
30%
25%
20%
18%
21%
29%
30%
30%
24%
21%
20%
29%
66%
57%
66%
55%
54%
59%
39%
49%
48%
59%
56%
66%
61%
52%
55%
57%
53%
69%
55%
0% 20% 40% 60% 80% 100%
= Above the mean value of all sponsor or plan means (p < 0.05)
= Below the mean value of all sponsor or plan means (p < 0.05)

Oregon Department of Human Services
Adult Medicaid (n=15456)
West Regional (n=2352)
HMO/POS/PPO (n=15239)
PCCM NA
Sponsor (n=1125)
Tuality Health Alliance (n=81)
2008 CAHPS-HP 4.0 Adult Medicaid Sponsor Report B-34
Q32. Of those respondents who tried to get information or help from their health plan's customer service: “In the last 6 months, how often did your health plan’s customer service staff treat you with courtesy and respect?"
NOTE: The results shown above are case mix adjusted. Small percentage differences may represent measurement (sampling) error rather than actual differencesin health plan performance. Response distributions may not sum to 100 percent due to rounding. See the methodology section for more information about thescoring and case-mix methodology.
AlwaysNever + Sometimes Usually
14%
19%
14%
20%
21%
21%
24%
21%
25%
28%
66%
57%
66%
55%
51%
0% 20% 40% 60% 80% 100%
= Above the mean value of all sponsor or plan means (p < 0.05)
= Below the mean value of all sponsor or plan means (p < 0.05)

Oregon Department of Human Services
Overall Rating of Personal Doctor
Adult Medicaid (n=46014)
West Regional (n=8613)
HMO/POS/PPO (n=45123)
PCCM NA
Sponsor (n=4178)
Care Oregon (n=205)
Cascade Comprehensive Care (n=270)
Central Oregon Ind Health Services (n=236)
Doctors of the Coast South (n=336)
Douglas County IPA (n=278)
Family Care (n=229)
FFS/PCCM (Medicaid) (n=222)
Intercommunity Health Network (n=292)
Kaiser Permanente Oregon Plus (n=228)
Lane IPA (n=294)
Marion-Polk Community Health Plan (n=266)
Mid-Rogue IPA (n=306)
ODS Community Health (n=137)
Oregon Health Management Services (n=333)
Providence Health Plan (n=273)
2008 CAHPS-HP 4.0 Adult Medicaid Sponsor Report B-35
Q21. Of those respondents who reported having a personal doctor: "Using any number from 0 to 10, where 0 is the worst personal doctor possible and 10 is the best personal doctor possible, what number would you use to rate your personal doctor?”
NOTE: The results shown above are case mix adjusted. Small percentage differences may represent measurement (sampling) error rather than actual differencesin health plan performance. Response distributions may not sum to 100 percent due to rounding. See the methodology section for more information about thescoring and case-mix methodology.
9-100-6 7-8
15%
17%
15%
19%
14%
13%
11%
20%
23%
21%
18%
23%
15%
28%
20%
22%
16%
21%
14%
24%
23%
24%
23%
32%
26%
18%
26%
22%
26%
25%
23%
23%
21%
25%
20%
21%
21%
21%
61%
60%
61%
58%
55%
61%
70%
54%
55%
52%
57%
54%
62%
50%
55%
58%
63%
58%
66%
0% 20% 40% 60% 80% 100%
= Above the mean value of all sponsor or plan means (p < 0.05)
= Below the mean value of all sponsor or plan means (p < 0.05)

Oregon Department of Human Services
Overall Rating of Personal Doctor
Adult Medicaid (n=46014)
West Regional (n=8613)
HMO/POS/PPO (n=45123)
PCCM NA
Sponsor (n=4178)
Tuality Health Alliance (n=273)
2008 CAHPS-HP 4.0 Adult Medicaid Sponsor Report B-36
Q21. Of those respondents who reported having a personal doctor: "Using any number from 0 to 10, where 0 is the worst personal doctor possible and 10 is the best personal doctor possible, what number would you use to rate your personal doctor?”
NOTE: The results shown above are case mix adjusted. Small percentage differences may represent measurement (sampling) error rather than actual differencesin health plan performance. Response distributions may not sum to 100 percent due to rounding. See the methodology section for more information about thescoring and case-mix methodology.
9-100-6 7-8
15%
17%
15%
19%
15%
24%
23%
24%
23%
24%
61%
60%
61%
58%
61%
0% 20% 40% 60% 80% 100%
= Above the mean value of all sponsor or plan means (p < 0.05)
= Below the mean value of all sponsor or plan means (p < 0.05)

Oregon Department of Human Services
Overall Rating of Specialists
Adult Medicaid (n=20475)
West Regional (n=3588)
HMO/POS/PPO (n=20068)
PCCM NA
Sponsor (n=1769)
Care Oregon (n=96)
Cascade Comprehensive Care (n=112)
Central Oregon Ind Health Services (n=101)
Doctors of the Coast South (n=141)
Douglas County IPA (n=143)
Family Care (n=86)
FFS/PCCM (Medicaid) (n=97)
Intercommunity Health Network (n=116)
Kaiser Permanente Oregon Plus (n=73)
Lane IPA (n=117)
Marion-Polk Community Health Plan (n=118)
Mid-Rogue IPA (n=127)
ODS Community Health (n=69)
Oregon Health Management Services (n=138)
Providence Health Plan (n=104)
2008 CAHPS-HP 4.0 Adult Medicaid Sponsor Report B-37
Q25. Of those respondents who reported seeing a specialist: "Using any number from 0 to 10, where 0 is the worst specialist possible and 10 is the best specialist possible, what number would you use to rate that specialist?”
NOTE: The results shown above are case mix adjusted. Small percentage differences may represent measurement (sampling) error rather than actual differencesin health plan performance. Response distributions may not sum to 100 percent due to rounding. See the methodology section for more information about thescoring and case-mix methodology.
9-100-6 7-8
16%
18%
16%
18%
10%
17%
18%
21%
20%
17%
19%
14%
10%
20%
22%
20%
26%
18%
17%
24%
23%
25%
24%
26%
25%
28%
21%
20%
19%
25%
28%
30%
26%
25%
28%
25%
23%
23%
60%
60%
59%
58%
64%
58%
54%
58%
60%
64%
57%
59%
60%
54%
53%
52%
49%
59%
60%
0% 20% 40% 60% 80% 100%
= Above the mean value of all sponsor or plan means (p < 0.05)
= Below the mean value of all sponsor or plan means (p < 0.05)

Oregon Department of Human Services
Overall Rating of Specialists
Adult Medicaid (n=20475)
West Regional (n=3588)
HMO/POS/PPO (n=20068)
PCCM NA
Sponsor (n=1769)
Tuality Health Alliance (n=131)
2008 CAHPS-HP 4.0 Adult Medicaid Sponsor Report B-38
Q25. Of those respondents who reported seeing a specialist: "Using any number from 0 to 10, where 0 is the worst specialist possible and 10 is the best specialist possible, what number would you use to rate that specialist?”
NOTE: The results shown above are case mix adjusted. Small percentage differences may represent measurement (sampling) error rather than actual differencesin health plan performance. Response distributions may not sum to 100 percent due to rounding. See the methodology section for more information about thescoring and case-mix methodology.
9-100-6 7-8
16%
18%
16%
18%
19%
24%
23%
25%
24%
18%
60%
60%
59%
58%
63%
0% 20% 40% 60% 80% 100%
= Above the mean value of all sponsor or plan means (p < 0.05)
= Below the mean value of all sponsor or plan means (p < 0.05)

Oregon Department of Human Services
Overall Rating of Health Care
Adult Medicaid (n=43550)
West Regional (n=8354)
HMO/POS/PPO (n=42736)
PCCM NA
Sponsor (n=4006)
Care Oregon (n=210)
Cascade Comprehensive Care (n=264)
Central Oregon Ind Health Services (n=225)
Doctors of the Coast South (n=310)
Douglas County IPA (n=281)
Family Care (n=198)
FFS/PCCM (Medicaid) (n=210)
Intercommunity Health Network (n=272)
Kaiser Permanente Oregon Plus (n=209)
Lane IPA (n=286)
Marion-Polk Community Health Plan (n=269)
Mid-Rogue IPA (n=285)
ODS Community Health (n=150)
Oregon Health Management Services (n=319)
Providence Health Plan (n=244)
2008 CAHPS-HP 4.0 Adult Medicaid Sponsor Report B-39
Q12. Of those respondents who went to a doctor's office: "Using any number from 0 to 10, where 0 is the worst health care possible and 10 is the best health care possible, what number would you use to rate all your health care in the last 6 months?”
NOTE: The results shown above are case mix adjusted. Small percentage differences may represent measurement (sampling) error rather than actual differencesin health plan performance. Response distributions may not sum to 100 percent due to rounding. See the methodology section for more information about thescoring and case-mix methodology.
9-100-6 7-8
21%
24%
21%
27%
33%
27%
26%
34%
34%
25%
24%
31%
23%
26%
29%
29%
27%
29%
13%
32%
31%
32%
32%
30%
35%
31%
34%
28%
35%
29%
29%
30%
35%
40%
29%
28%
29%
33%
47%
45%
47%
41%
37%
38%
43%
33%
38%
40%
47%
40%
47%
39%
31%
42%
45%
42%
54%
0% 20% 40% 60% 80% 100%
= Above the mean value of all sponsor or plan means (p < 0.05)
= Below the mean value of all sponsor or plan means (p < 0.05)

Oregon Department of Human Services
Overall Rating of Health Care
Adult Medicaid (n=43550)
West Regional (n=8354)
HMO/POS/PPO (n=42736)
PCCM NA
Sponsor (n=4006)
Tuality Health Alliance (n=274)
2008 CAHPS-HP 4.0 Adult Medicaid Sponsor Report B-40
Q12. Of those respondents who went to a doctor's office: "Using any number from 0 to 10, where 0 is the worst health care possible and 10 is the best health care possible, what number would you use to rate all your health care in the last 6 months?”
NOTE: The results shown above are case mix adjusted. Small percentage differences may represent measurement (sampling) error rather than actual differencesin health plan performance. Response distributions may not sum to 100 percent due to rounding. See the methodology section for more information about thescoring and case-mix methodology.
9-100-6 7-8
21%
24%
21%
27%
21%
32%
31%
32%
32%
33%
47%
45%
47%
41%
46%
0% 20% 40% 60% 80% 100%
= Above the mean value of all sponsor or plan means (p < 0.05)
= Below the mean value of all sponsor or plan means (p < 0.05)

Oregon Department of Human Services
Overall Rating of Health Plan
Adult Medicaid (n=55892)
West Regional (n=10910)
HMO/POS/PPO (n=54876)
PCCM NA
Sponsor (n=5196)
Care Oregon (n=294)
Cascade Comprehensive Care (n=346)
Central Oregon Ind Health Services (n=299)
Doctors of the Coast South (n=391)
Douglas County IPA (n=342)
Family Care (n=291)
FFS/PCCM (Medicaid) (n=316)
Intercommunity Health Network (n=340)
Kaiser Permanente Oregon Plus (n=291)
Lane IPA (n=340)
Marion-Polk Community Health Plan (n=338)
Mid-Rogue IPA (n=359)
ODS Community Health (n=196)
Oregon Health Management Services (n=408)
Providence Health Plan (n=315)
2008 CAHPS-HP 4.0 Adult Medicaid Sponsor Report B-41
Q35. Using any number from 0 to 10, where 0 is the worst health plan possible and 10 is the best health plan possible, what number would you use to rate your health plan?
NOTE: The results shown above are case mix adjusted. Small percentage differences may represent measurement (sampling) error rather than actual differencesin health plan performance. Response distributions may not sum to 100 percent due to rounding. See the methodology section for more information about thescoring and case-mix methodology.
9-100-6 7-8
20%
23%
20%
29%
32%
28%
35%
32%
34%
31%
26%
28%
17%
32%
31%
25%
32%
28%
18%
29%
30%
29%
32%
30%
34%
30%
30%
32%
32%
28%
36%
31%
36%
33%
35%
33%
32%
30%
50%
47%
50%
39%
38%
38%
34%
38%
35%
37%
45%
36%
52%
32%
36%
41%
35%
40%
51%
0% 20% 40% 60% 80% 100%
= Above the mean value of all sponsor or plan means (p < 0.05)
= Below the mean value of all sponsor or plan means (p < 0.05)

Oregon Department of Human Services
Overall Rating of Health Plan
Adult Medicaid (n=55892)
West Regional (n=10910)
HMO/POS/PPO (n=54876)
PCCM NA
Sponsor (n=5196)
Tuality Health Alliance (n=330)
2008 CAHPS-HP 4.0 Adult Medicaid Sponsor Report B-42
Q35. Using any number from 0 to 10, where 0 is the worst health plan possible and 10 is the best health plan possible, what number would you use to rate your health plan?
NOTE: The results shown above are case mix adjusted. Small percentage differences may represent measurement (sampling) error rather than actual differencesin health plan performance. Response distributions may not sum to 100 percent due to rounding. See the methodology section for more information about thescoring and case-mix methodology.
9-100-6 7-8
20%
23%
20%
29%
27%
29%
30%
29%
32%
35%
50%
47%
50%
39%
37%
0% 20% 40% 60% 80% 100%
= Above the mean value of all sponsor or plan means (p < 0.05)
= Below the mean value of all sponsor or plan means (p < 0.05)

Oregon Department of Human Services
HEDIS Survey Item
Adult Medicaid (n=30946)
West Regional (n=4393)
HMO/POS/PPO (n=30130)
PCCM NA
Sponsor NA
Care Oregon NA
Cascade Comprehensive Care NA
Central Oregon Ind Health Services NA
Doctors of the Coast South NA
Douglas County IPA NA
Family Care NA
FFS/PCCM (Medicaid) NA
Intercommunity Health Network NA
Kaiser Permanente Oregon Plus NA
Lane IPA NA
Marion-Polk Community Health Plan NA
Mid-Rogue IPA NA
ODS Community Health NA
Oregon Health Management Services NA
Providence Health Plan NA
2008 CAHPS-HP 4.0 Adult Medicaid Sponsor Report B-43
Q8. Of those respondents who went to the doctor's office or clinic: "In the last 6 months, how often did you and a doctor or other health provider talk about specific things you could do to prevent illness?"
NOTE: The results shown above are case mix adjusted. Small percentage differences may represent measurement (sampling) error rather than actual differencesin health plan performance. Response distributions may not sum to 100 percent due to rounding. See the methodology section for more information about thescoring and case-mix methodology.
AlwaysNever + Sometimes Usually
44%
43%
44%
23%
25%
23%
33%
32%
33%
0% 20% 40% 60% 80% 100%
= Above the mean value of all sponsor or plan means (p < 0.05)
= Below the mean value of all sponsor or plan means (p < 0.05)

Oregon Department of Human Services
HEDIS Survey Item
Adult Medicaid (n=30946)
West Regional (n=4393)
HMO/POS/PPO (n=30130)
PCCM NA
Sponsor NA
Tuality Health Alliance NA
2008 CAHPS-HP 4.0 Adult Medicaid Sponsor Report B-44
Q8. Of those respondents who went to the doctor's office or clinic: "In the last 6 months, how often did you and a doctor or other health provider talk about specific things you could do to prevent illness?"
NOTE: The results shown above are case mix adjusted. Small percentage differences may represent measurement (sampling) error rather than actual differencesin health plan performance. Response distributions may not sum to 100 percent due to rounding. See the methodology section for more information about thescoring and case-mix methodology.
AlwaysNever + Sometimes Usually
44%
43%
44%
23%
25%
23%
33%
32%
33%
0% 20% 40% 60% 80% 100%
= Above the mean value of all sponsor or plan means (p < 0.05)
= Below the mean value of all sponsor or plan means (p < 0.05)

Oregon Department of Human Services
HEDIS Survey Item
Adult Medicaid (n=11329)
West Regional (n=2176)
HMO/POS/PPO (n=10902)
PCCM NA
Sponsor NA
Care Oregon NA
Cascade Comprehensive Care NA
Central Oregon Ind Health Services NA
Doctors of the Coast South NA
Douglas County IPA NA
Family Care NA
FFS/PCCM (Medicaid) NA
Intercommunity Health Network NA
Kaiser Permanente Oregon Plus NA
Lane IPA NA
Marion-Polk Community Health Plan NA
Mid-Rogue IPA NA
ODS Community Health NA
Oregon Health Management Services NA
Providence Health Plan NA
2008 CAHPS-HP 4.0 Adult Medicaid Sponsor Report B-45
Q10. Of those respondents informed by their doctor/health provider about their treatment/ health care: “In the last 6 months, did a doctor or other health provider talk with you about the pros and cons of each choice for your treatment or health care?”
NOTE: The results shown above are case mix adjusted. Small percentage differences may represent measurement (sampling) error rather than actual differencesin health plan performance. Response distributions may not sum to 100 percent due to rounding. See the methodology section for more information about thescoring and case-mix methodology.
Definitely yesSomewhat no + Definitely no
Somewhat yes
10%
10%
10%
31%
31%
31%
59%
59%
59%
0% 20% 40% 60% 80% 100%
= Above the mean value of all sponsor or plan means (p < 0.05)
= Below the mean value of all sponsor or plan means (p < 0.05)

Oregon Department of Human Services
HEDIS Survey Item
Adult Medicaid (n=11329)
West Regional (n=2176)
HMO/POS/PPO (n=10902)
PCCM NA
Sponsor NA
Tuality Health Alliance NA
2008 CAHPS-HP 4.0 Adult Medicaid Sponsor Report B-46
Q10. Of those respondents informed by their doctor/health provider about their treatment/ health care: “In the last 6 months, did a doctor or other health provider talk with you about the pros and cons of each choice for your treatment or health care?”
NOTE: The results shown above are case mix adjusted. Small percentage differences may represent measurement (sampling) error rather than actual differencesin health plan performance. Response distributions may not sum to 100 percent due to rounding. See the methodology section for more information about thescoring and case-mix methodology.
Definitely yesSomewhat no + Definitely no
Somewhat yes
10%
10%
10%
31%
31%
31%
59%
59%
59%
0% 20% 40% 60% 80% 100%
= Above the mean value of all sponsor or plan means (p < 0.05)
= Below the mean value of all sponsor or plan means (p < 0.05)

Oregon Department of Human Services
HEDIS Survey Item
Adult Medicaid (n=11235)
West Regional (n=2169)
HMO/POS/PPO (n=10809)
PCCM NA
Sponsor NA
Care Oregon NA
Cascade Comprehensive Care NA
Central Oregon Ind Health Services NA
Doctors of the Coast South NA
Douglas County IPA NA
Family Care NA
FFS/PCCM (Medicaid) NA
Intercommunity Health Network NA
Kaiser Permanente Oregon Plus NA
Lane IPA NA
Marion-Polk Community Health Plan NA
Mid-Rogue IPA NA
ODS Community Health NA
Oregon Health Management Services NA
Providence Health Plan NA
2008 CAHPS-HP 4.0 Adult Medicaid Sponsor Report B-47
Q11. Of those respondents informed by their doctor/health provider about the treatment/health care choices: “When there was more than one choice for your treatment or health care did a doctor or other health provider ask which choice was best for you?”
NOTE: The results shown above are case mix adjusted. Small percentage differences may represent measurement (sampling) error rather than actual differencesin health plan performance. Response distributions may not sum to 100 percent due to rounding. See the methodology section for more information about thescoring and case-mix methodology.
Definitely yesSomewhat no + Definitely no
Somewhat yes
14%
11%
14%
30%
31%
30%
56%
58%
56%
0% 20% 40% 60% 80% 100%
= Above the mean value of all sponsor or plan means (p < 0.05)
= Below the mean value of all sponsor or plan means (p < 0.05)

Oregon Department of Human Services
HEDIS Survey Item
Adult Medicaid (n=11235)
West Regional (n=2169)
HMO/POS/PPO (n=10809)
PCCM NA
Sponsor NA
Tuality Health Alliance NA
2008 CAHPS-HP 4.0 Adult Medicaid Sponsor Report B-48
Q11. Of those respondents informed by their doctor/health provider about the treatment/health care choices: “When there was more than one choice for your treatment or health care did a doctor or other health provider ask which choice was best for you?”
NOTE: The results shown above are case mix adjusted. Small percentage differences may represent measurement (sampling) error rather than actual differencesin health plan performance. Response distributions may not sum to 100 percent due to rounding. See the methodology section for more information about thescoring and case-mix methodology.
Definitely yesSomewhat no + Definitely no
Somewhat yes
14%
11%
14%
30%
31%
30%
56%
58%
56%
0% 20% 40% 60% 80% 100%
= Above the mean value of all sponsor or plan means (p < 0.05)
= Below the mean value of all sponsor or plan means (p < 0.05)

Oregon Department of Human Services
HEDIS Survey Item
Adult Medicaid (n=18542)
West Regional (n=1978)
HMO/POS/PPO (n=18094)
PCCM NA
Sponsor NA
Care Oregon NA
Cascade Comprehensive Care NA
Central Oregon Ind Health Services NA
Doctors of the Coast South NA
Douglas County IPA NA
Family Care NA
FFS/PCCM (Medicaid) NA
Intercommunity Health Network NA
Kaiser Permanente Oregon Plus NA
Lane IPA NA
Marion-Polk Community Health Plan NA
Mid-Rogue IPA NA
ODS Community Health NA
Oregon Health Management Services NA
Providence Health Plan NA
2008 CAHPS-HP 4.0 Adult Medicaid Sponsor Report B-49
Q20. Of those respondents who got care from a doctor/health provider besides their personal doctor: “How often did your personal doctor seem informed and up-to-date about the care you got from these doctors or other health providers?”
NOTE: The results shown above are case mix adjusted. Small percentage differences may represent measurement (sampling) error rather than actual differencesin health plan performance. Response distributions may not sum to 100 percent due to rounding. See the methodology section for more information about thescoring and case-mix methodology.
AlwaysNever + Sometimes Usually
22%
22%
22%
27%
27%
27%
51%
51%
51%
0% 20% 40% 60% 80% 100%
= Above the mean value of all sponsor or plan means (p < 0.05)
= Below the mean value of all sponsor or plan means (p < 0.05)

Oregon Department of Human Services
HEDIS Survey Item
Adult Medicaid (n=18542)
West Regional (n=1978)
HMO/POS/PPO (n=18094)
PCCM NA
Sponsor NA
Tuality Health Alliance NA
2008 CAHPS-HP 4.0 Adult Medicaid Sponsor Report B-50
Q20. Of those respondents who got care from a doctor/health provider besides their personal doctor: “How often did your personal doctor seem informed and up-to-date about the care you got from these doctors or other health providers?”
NOTE: The results shown above are case mix adjusted. Small percentage differences may represent measurement (sampling) error rather than actual differencesin health plan performance. Response distributions may not sum to 100 percent due to rounding. See the methodology section for more information about thescoring and case-mix methodology.
AlwaysNever + Sometimes Usually
22%
22%
22%
27%
27%
27%
51%
51%
51%
0% 20% 40% 60% 80% 100%
= Above the mean value of all sponsor or plan means (p < 0.05)
= Below the mean value of all sponsor or plan means (p < 0.05)

Oregon Department of Human Services
HEDIS Survey Item
Adult Medicaid (n=6947)
West Regional (n=748)
HMO/POS/PPO (n=6776)
PCCM NA
Sponsor NA
Care Oregon NA
Cascade Comprehensive Care NA
Central Oregon Ind Health Services NA
Doctors of the Coast South NA
Douglas County IPA NA
Family Care NA
FFS/PCCM (Medicaid) NA
Intercommunity Health Network NA
Kaiser Permanente Oregon Plus NA
Lane IPA NA
Marion-Polk Community Health Plan NA
Mid-Rogue IPA NA
ODS Community Health NA
Oregon Health Management Services NA
Providence Health Plan NA
2008 CAHPS-HP 4.0 Adult Medicaid Sponsor Report B-51
Q29. Of those respondents who looked for information about how their health plan works: “In the last 6 months, how often did the written materials or the Internet provide the information you needed about how your health plan works?”
NOTE: The results shown above are case mix adjusted. Small percentage differences may represent measurement (sampling) error rather than actual differencesin health plan performance. Response distributions may not sum to 100 percent due to rounding. See the methodology section for more information about thescoring and case-mix methodology.
AlwaysNever + Sometimes Usually
37%
38%
37%
32%
30%
32%
31%
32%
31%
0% 20% 40% 60% 80% 100%
= Above the mean value of all sponsor or plan means (p < 0.05)
= Below the mean value of all sponsor or plan means (p < 0.05)

Oregon Department of Human Services
HEDIS Survey Item
Adult Medicaid (n=6947)
West Regional (n=748)
HMO/POS/PPO (n=6776)
PCCM NA
Sponsor NA
Tuality Health Alliance NA
2008 CAHPS-HP 4.0 Adult Medicaid Sponsor Report B-52
Q29. Of those respondents who looked for information about how their health plan works: “In the last 6 months, how often did the written materials or the Internet provide the information you needed about how your health plan works?”
NOTE: The results shown above are case mix adjusted. Small percentage differences may represent measurement (sampling) error rather than actual differencesin health plan performance. Response distributions may not sum to 100 percent due to rounding. See the methodology section for more information about thescoring and case-mix methodology.
AlwaysNever + Sometimes Usually
37%
38%
37%
32%
30%
32%
31%
32%
31%
0% 20% 40% 60% 80% 100%
= Above the mean value of all sponsor or plan means (p < 0.05)
= Below the mean value of all sponsor or plan means (p < 0.05)

Oregon Department of Human Services
HEDIS Survey Item
Adult Medicaid (n=28579)
West Regional (n=5763)
HMO/POS/PPO (n=27551)
PCCM NA
Sponsor NA
Care Oregon NA
Cascade Comprehensive Care NA
Central Oregon Ind Health Services NA
Doctors of the Coast South NA
Douglas County IPA NA
Family Care NA
FFS/PCCM (Medicaid) NA
Intercommunity Health Network NA
Kaiser Permanente Oregon Plus NA
Lane IPA NA
Marion-Polk Community Health Plan NA
Mid-Rogue IPA NA
ODS Community Health NA
Oregon Health Management Services NA
Providence Health Plan NA
2008 CAHPS-HP 4.0 Adult Medicaid Sponsor Report B-53
Q37. Do you now smoke cigarettes every day, some days, or not at all?
NOTE: The results shown above are case mix adjusted. Small percentage differences may represent measurement (sampling) error rather than actual differencesin health plan performance. Response distributions may not sum to 100 percent due to rounding. See the methodology section for more information about thescoring and case-mix methodology.
Not at allEvery day Some days
26%
19%
26%
12%
10%
12%
62%
72%
62%
0% 20% 40% 60% 80% 100%
= Above the mean value of all sponsor or plan means (p < 0.05)
= Below the mean value of all sponsor or plan means (p < 0.05)

Oregon Department of Human Services
HEDIS Survey Item
Adult Medicaid (n=28579)
West Regional (n=5763)
HMO/POS/PPO (n=27551)
PCCM NA
Sponsor NA
Tuality Health Alliance NA
2008 CAHPS-HP 4.0 Adult Medicaid Sponsor Report B-54
Q37. Do you now smoke cigarettes every day, some days, or not at all?
NOTE: The results shown above are case mix adjusted. Small percentage differences may represent measurement (sampling) error rather than actual differencesin health plan performance. Response distributions may not sum to 100 percent due to rounding. See the methodology section for more information about thescoring and case-mix methodology.
Not at allEvery day Some days
26%
19%
26%
12%
10%
12%
62%
72%
62%
0% 20% 40% 60% 80% 100%
= Above the mean value of all sponsor or plan means (p < 0.05)
= Below the mean value of all sponsor or plan means (p < 0.05)

Oregon Department of Human Services
HEDIS Survey Item
Adult Medicaid (n=9795)
West Regional (n=1399)
HMO/POS/PPO (n=9383)
PCCM NA
Sponsor NA
Care Oregon NA
Cascade Comprehensive Care NA
Central Oregon Ind Health Services NA
Doctors of the Coast South NA
Douglas County IPA NA
Family Care NA
FFS/PCCM (Medicaid) NA
Intercommunity Health Network NA
Kaiser Permanente Oregon Plus NA
Lane IPA NA
Marion-Polk Community Health Plan NA
Mid-Rogue IPA NA
ODS Community Health NA
Oregon Health Management Services NA
Providence Health Plan NA
2008 CAHPS-HP 4.0 Adult Medicaid Sponsor Report B-55
Q38. Of those respondents who smoke cigarettes every day or some days: “In the last 6 months, on how many visits were you advised to quit smoking by a doctor or other health provider in your plan?”
NOTE: The results shown above are case mix adjusted. Small percentage differences may represent measurement (sampling) error rather than actual differencesin health plan performance. Response distributions may not sum to 100 percent due to rounding. See the methodology section for more information about thescoring and case-mix methodology.
5 or more visitsNone 1-4 visits
30%
37%
30%
51%
48%
51%
19%
15%
19%
0% 20% 40% 60% 80% 100%
= Above the mean value of all sponsor or plan means (p < 0.05)
= Below the mean value of all sponsor or plan means (p < 0.05)

Oregon Department of Human Services
HEDIS Survey Item
Adult Medicaid (n=9795)
West Regional (n=1399)
HMO/POS/PPO (n=9383)
PCCM NA
Sponsor NA
Tuality Health Alliance NA
2008 CAHPS-HP 4.0 Adult Medicaid Sponsor Report B-56
Q38. Of those respondents who smoke cigarettes every day or some days: “In the last 6 months, on how many visits were you advised to quit smoking by a doctor or other health provider in your plan?”
NOTE: The results shown above are case mix adjusted. Small percentage differences may represent measurement (sampling) error rather than actual differencesin health plan performance. Response distributions may not sum to 100 percent due to rounding. See the methodology section for more information about thescoring and case-mix methodology.
5 or more visitsNone 1-4 visits
30%
37%
30%
51%
48%
51%
19%
15%
19%
0% 20% 40% 60% 80% 100%
= Above the mean value of all sponsor or plan means (p < 0.05)
= Below the mean value of all sponsor or plan means (p < 0.05)

Oregon Department of Human Services
HEDIS Survey Item
Adult Medicaid (n=9813)
West Regional (n=1406)
HMO/POS/PPO (n=9396)
PCCM NA
Sponsor NA
Care Oregon NA
Cascade Comprehensive Care NA
Central Oregon Ind Health Services NA
Doctors of the Coast South NA
Douglas County IPA NA
Family Care NA
FFS/PCCM (Medicaid) NA
Intercommunity Health Network NA
Kaiser Permanente Oregon Plus NA
Lane IPA NA
Marion-Polk Community Health Plan NA
Mid-Rogue IPA NA
ODS Community Health NA
Oregon Health Management Services NA
Providence Health Plan NA
2008 CAHPS-HP 4.0 Adult Medicaid Sponsor Report B-57
Q39. On how many visits was medication recommended or discussed to assist you with quitting smoking (for example: nicotine gum, patch, nasal spray, inhaler, prescription medication)?
NOTE: The results shown above are case mix adjusted. Small percentage differences may represent measurement (sampling) error rather than actual differencesin health plan performance. Response distributions may not sum to 100 percent due to rounding. See the methodology section for more information about thescoring and case-mix methodology.
5 or more visitsNone 1-4 visits
58%
65%
58%
35%
29%
35%
8%
5%
8%
0% 20% 40% 60% 80% 100%
= Above the mean value of all sponsor or plan means (p < 0.05)
= Below the mean value of all sponsor or plan means (p < 0.05)

Oregon Department of Human Services
HEDIS Survey Item
Adult Medicaid (n=9813)
West Regional (n=1406)
HMO/POS/PPO (n=9396)
PCCM NA
Sponsor NA
Tuality Health Alliance NA
2008 CAHPS-HP 4.0 Adult Medicaid Sponsor Report B-58
Q39. On how many visits was medication recommended or discussed to assist you with quitting smoking (for example: nicotine gum, patch, nasal spray, inhaler, prescription medication)?
NOTE: The results shown above are case mix adjusted. Small percentage differences may represent measurement (sampling) error rather than actual differencesin health plan performance. Response distributions may not sum to 100 percent due to rounding. See the methodology section for more information about thescoring and case-mix methodology.
5 or more visitsNone 1-4 visits
58%
65%
58%
35%
29%
35%
8%
5%
8%
0% 20% 40% 60% 80% 100%
= Above the mean value of all sponsor or plan means (p < 0.05)
= Below the mean value of all sponsor or plan means (p < 0.05)

Oregon Department of Human Services
HEDIS Survey Item
Adult Medicaid (n=9742)
West Regional (n=1403)
HMO/POS/PPO (n=9329)
PCCM NA
Sponsor NA
Care Oregon NA
Cascade Comprehensive Care NA
Central Oregon Ind Health Services NA
Doctors of the Coast South NA
Douglas County IPA NA
Family Care NA
FFS/PCCM (Medicaid) NA
Intercommunity Health Network NA
Kaiser Permanente Oregon Plus NA
Lane IPA NA
Marion-Polk Community Health Plan NA
Mid-Rogue IPA NA
ODS Community Health NA
Oregon Health Management Services NA
Providence Health Plan NA
2008 CAHPS-HP 4.0 Adult Medicaid Sponsor Report B-59
Q40. On how many visits did your doctor or health provider recommend or discuss methods and strategies (other than medication) to assist you with quitting smoking?
NOTE: The results shown above are case mix adjusted. Small percentage differences may represent measurement (sampling) error rather than actual differencesin health plan performance. Response distributions may not sum to 100 percent due to rounding. See the methodology section for more information about thescoring and case-mix methodology.
5 or more visitsNone 1-4 visits
58%
61%
58%
33%
33%
33%
8%
6%
9%
0% 20% 40% 60% 80% 100%
= Above the mean value of all sponsor or plan means (p < 0.05)
= Below the mean value of all sponsor or plan means (p < 0.05)

Oregon Department of Human Services
HEDIS Survey Item
Adult Medicaid (n=9742)
West Regional (n=1403)
HMO/POS/PPO (n=9329)
PCCM NA
Sponsor NA
Tuality Health Alliance NA
2008 CAHPS-HP 4.0 Adult Medicaid Sponsor Report B-60
Q40. On how many visits did your doctor or health provider recommend or discuss methods and strategies (other than medication) to assist you with quitting smoking?
NOTE: The results shown above are case mix adjusted. Small percentage differences may represent measurement (sampling) error rather than actual differencesin health plan performance. Response distributions may not sum to 100 percent due to rounding. See the methodology section for more information about thescoring and case-mix methodology.
5 or more visitsNone 1-4 visits
58%
61%
58%
33%
33%
33%
8%
6%
9%
0% 20% 40% 60% 80% 100%
= Above the mean value of all sponsor or plan means (p < 0.05)
= Below the mean value of all sponsor or plan means (p < 0.05)

2008 CAHPS Health Plan Survey
Adult Medicaid Sponsor Report
Section C: Background and Methodology
Prepared by Westat and Shaller Consulting
September 2008 The National CAHPS® Benchmarking Database (the CAHPS Database) is funded by the U.S. Agency for Healthcare Research and Quality and administered by Westat under Contract Number HHSA290200710024C. For more information, please visit the Web site (https://www.cahps.ahrq.gov) or contact the CAHPS User Network at 1-800-492-9261.

2008 CAHPS-HP Adult Medicaid Sponsor Report Methodology i
Table of Contents Page Introduction ................................................................................................................................ii Background C-1 About the CAHPS Survey ........................................................................................................C-1 About the CAHPS Database....................................................................................................C-1 Guidelines for Using Sponsor Reports.....................................................................................C-4 Report Methodology C-5 Consumers’ Reports of Their Experiences with Care ..............................................................C-5 Consumers’ Ratings of Their Experiences with Care ..............................................................C-6 Sampling Methodology ............................................................................................................C-7 Response Rate Calculation .....................................................................................................C-7 Case Mix Adjustment ...............................................................................................................C-8 Testing for Statistical Differences ............................................................................................C-9 The CAHPS Database Compared to NCQA’s Quality Compass® .........................................C-10

2008 CAHPS-HP Adult Medicaid Sponsor Report Methodology ii
Introduction
This report presents descriptive and methodological information pertaining to the 2008 CAHPS® 4.0 and 4.0H Health Plan surveys, conducted between October 2007 and June 2008. This document is one of three sections that comprise the 2008 CAHPS Health Plan Survey Sponsor Reports. Each section is described below:
• Section A: Results at a Glance: Presents two summary tables of comparative results,
showing both statistically significant differences and percentile rankings of CAHPS Health Plan Survey (CAHPS-HP) sponsor results compared to benchmarks from the CAHPS Health Plan Survey Database.
• Section B: Results in Detail: Presents detailed results for survey items through a series
of bar charts. This section begins with a list of CAHPS-HP participants in the 2008 CAHPS Health Plan Survey Database and two sponsor-specific tables showing a comparison of demographic and utilization characteristics of respondents.
• Section C: Background and Methodology: Presents overview information about
CAHPS and the CAHPS Database, and includes guidelines for using reports, methodological information on consumer reports and consumer ratings (i.e., items included, calculations), response rate calculation, case mix adjustment, and significance testing for CAHPS-HP surveys.
Sections A and B are presented together in another document; Section C is presented within this report. Questions regarding this report or any aspect of the CAHPS Database can be directed by e-mail to [email protected]. Further information about the CAHPS Database is available through the Web site at: (https://www.cahps.ahrq.gov).

2008 CAHPS-HP Adult Medicaid Sponsor Report Methodology C-1
Background About the CAHPS® Survey CAHPS refers to a comprehensive and evolving family of surveys that ask consumers and patients to evaluate the interpersonal aspects of health care. The term “CAHPS” initially stood for the Consumer Assessment of Health Plans Study, but as the products have evolved beyond health plans, the acronym now stands for “Consumer Assessment of Healthcare Providers and Systems”. CAHPS surveys probe those aspects of care for which consumers and patients are the best and/or only source of information, as well as those that consumers and patients have identified as being important. By responding to a standardized set of questions administered through a mail or telephone questionnaire, consumers report on their experiences and rate their health plans, hospitals and providers in several areas. CAHPS surveys are administered to a random sample of consumers or patients by independent survey vendors following standardized procedures. The development of CAHPS has been and continues to be a collaborative effort of public and private research organizations. The CAHPS program is funded and managed by the Agency for Healthcare Research and Quality (AHRQ; see www.ahrq.gov). AHRQ works closely with the Centers for Medicare and Medicaid Services (CMS; see www.cms.gov), which has been a major partner in this initiative since 1996. Both of these agencies are part of the U.S. Department of Health and Human Services. The CAHPS Health Plan surveys are designed for use with all types of health insurance enrollees (Commercial, Medicaid, and Medicare) and across the full range of health care delivery systems from fee-for-service to managed care plans. A core survey questionnaire is available for adults concerning their own experiences and for parents concerning the experiences of their children. Supplemental questions have been developed as modules for people with chronic conditions and special health care needs. AHRQ provides the CAHPS Health Plan Survey and Reporting Kit to all interested users through the CAHPS User Network. The Kit provides everything required to field the survey and report the results and includes survey questionnaires, a data analysis program and report templates. Further information and technical assistance are also available from the User Network, which can be reached through www.cahps.ahrq.gov or through the helpline at 1-800-492-9261. About the CAHPS Database The National CAHPS Benchmarking Database (the CAHPS Database) is the national repository for data from the CAHPS family of surveys. The primary purpose of the CAHPS Database is to facilitate comparisons of CAHPS survey results by and among survey sponsors. This voluntary compilation of survey results from a large pool of sponsors into a single national database enables participants to compare their own results to relevant benchmarks (i.e., reference points such as national and regional averages). The CAHPS Database also offers an important source of primary data for research related to consumer assessments of quality as measured by CAHPS surveys.

2008 CAHPS-HP Adult Medicaid Sponsor Report Methodology C-2
The CAHPS Database consists of three major components, each with its own line of products and services:
• CAHPS Health Plan Survey Database: This database currently contains 10 years of data from over 3.2 million respondents sampled from enrollees in commercial, Medicaid, State Children’s Health Insurance Program (SCHIP), and Medicare Managed Care health plans. Major products supporting benchmarking and research related to the CAHPS Health Plan Survey include: Sponsor Reports: Each fall, participating Medicaid and SCHIP sponsors receive a free,
customized report comparing their results to appropriate national benchmarks, including national and regional distributions.
Annual Chartbooks: These reports published each fall, present cross-sector comparisons
of CAHPS Health Plan Survey results for commercial (adult and child), Medicaid (adult and child), SCHIP (child), and Medicare (adult) populations.
Research Files: The CAHPS Database aggregates respondent-level data files across
sponsors and health plans for the commercial, Medicaid, and SCHIP populations. Researchers may gain authorized access to data needed to help answer important health services research questions related to consumer assessments of quality.
• CAHPS Hospital Survey (H-CAHPS) Database: This database currently contains 3 years of data from 2005 - 2007 contributed by over 2,300 hospitals. Products include a series of Chartbooks presenting summary-level H-CAHPS survey results by selected hospital characteristics, such as bed size, region, teaching status, and ownership. Participants receive detailed Excel data files of the Chartbook tables and charts, which enable hospitals and vendors to make direct comparisons to their own results, as well as percentile scores adjusted for mode of survey administration and patient case-mix. The H-CAHPS data contributed by participating hospitals and vendors are also made available for authorized research purposes.
• CAHPS Clinician & Group Survey Database: This database is currently under development as survey sponsors begin to implement the new CAHPS Clinician & Group Survey, which was endorsed by the National Quality Forum in July 2007. Anticipated products include annual Chartbook and research files.
In addition, the CAHPS Database provides national data used by policymakers and others through such publications as the AHRQ National Healthcare Quality and Disparities Reports. The CAHPS Database also provides customized support and technical assistance to survey sponsors as time and resources permit.
Administration of the CAHPS Database The CAHPS Database is sponsored and funded by the Agency for Healthcare Research and Quality (AHRQ) and administered by Westat. Oversight and direction for the project are provided by an Advisory Group composed of representatives of survey sponsors from the public and private sectors as well as members of the CAHPS Consortium. Further information about the CAHPS Database is available through the Web site at (https://www.cahps.ahrq.gov)

2008 CAHPS-HP Adult Medicaid Sponsor Report Methodology C-3
Use of the CAHPS Database for Benchmarking A central purpose of the CAHPS Database is to facilitate comparisons of CAHPS survey results by survey sponsors. By compiling CAHPS survey results from a variety of sponsors into a single national database, the CAHPS Database enables purchasers and plans to compare their own results to relevant national benchmarks, in order to identify performance strengths as well as opportunities for improvement. Survey sponsors participate in the CAHPS Database by submitting their CAHPS survey data according to specified guidelines. In return, sponsors receive a customized Sponsor Report that compares their own results to appropriate benchmarks derived from the CAHPS Database. Comparative data include national, regional and product type distributions of the CAHPS results. Sponsors also receive a quarterly electronic newsletter with updates and sponsor profiles, as well as opportunities to interact with other participants through User Group activities. Use of the CAHPS Database for Research Researchers may gain authorized access to data from the CAHPS Database to help answer important health services research questions related to consumer assessments of quality as measured by CAHPS. CAHPS data are available for researchers who submit an application and sign a data release agreement that ensures the confidentiality of the data. A description of the data application process and a list of current research projects are included on the Web site (https://www.cahps.ahrq.gov). CAHPS Database Chartbook In 2001, staff from the CAHPS Database produced an annual report that included cross-sector comparisons of CAHPS survey results for the current year’s data between the Commercial (adult and child), Medicaid (adult and child) and Medicare populations. In 2002, the annual report was replaced with a Chartbook that Sponsors can use to assess plan performance and identify opportunities for improvement by comparing their survey results to national distributions. The annual Chartbook provides comparative data to Sponsors in a rapid timeframe (early fall) and is posted on the Web site (https://www.cahps.ahrq.gov). Custom Analyses and Reports In addition to customized Sponsor Reports and the annual Chartbook, CAHPS Database staff is available to conduct specialized data analyses and reports upon request. All analyses and reports will adhere to data policies regarding confidentiality of respondents, plans and sponsors.

2008 CAHPS-HP Adult Medicaid Sponsor Report Methodology C-4
Guidelines for Using Sponsor Reports The Advisory Group has adopted the following principles to guide participating sponsors in their use of Sponsor Reports from the CAHPS Database: 1. Health plan and sponsor comparisons to national distributions and benchmarks are intended
to support efforts to improve health plan performance, care delivery and health care purchasing strategies.
2. Participating sponsors are encouraged to use comparative data from the CAHPS Database
to identify areas for focusing improvement efforts and for demonstrating accountability. For example,
• Sponsors can develop improvement plans and targets based on differences that show
possible areas for improvement.
• Sponsors can document areas in which performance is high relative to CAHPS Database distributions and benchmarks in order to reward excellence and create incentives for continued improvement.
3. Comparative data from the CAHPS Database are not designated for advertising purposes.
Health plan sponsors choosing to use results from their Sponsor Reports in paid advertising or promotions are encouraged to follow the guidelines for advertising developed by the National Committee for Quality Assurance (available through the NCQA Web site located at: www.ncqa.org).
4. Participating sponsors should include the following statement when using data or
information provided in Sponsor Reports in any publication:
“The source for comparative CAHPS® survey data used in this publication is the National CAHPS Benchmarking Database (CAHPS Database). Any analysis, interpretation, or conclusion based on these data is solely that of the authors. The CAHPS Database is a collaborative initiative of Westat and Shaller Consulting, with funding provided by the U.S. Agency for Healthcare Research and Quality.”
For assistance with using CAHPS data for quality improvement and value purchasing, call the CAHPS User Network helpline at 1-800-492-9261 or email [email protected].

2008 CAHPS-HP Adult Medicaid Sponsor Report Methodology C-5
Report Methodology Sponsor Reports follow CAHPS consumer reporting methods and summarize the survey results using four consumer reports of their experiences with care and four consumer ratings of their experiences with care. Both types of results are described in detail below. Consumers’ Reports of Their Experiences with Care
CAHPS Health Plan Survey was designed to move beyond satisfaction scores (a function of expectations) to more accurate assessments based on “reports” of the consumer experience. Much investigation went into the design of questions that capture consumer experiences with high quality care. Most of the CAHPS Health Plan Survey questions ask respondents to report on their experiences with different aspects of their care. These reporting questions are combined into groups that address the same aspect of care or service to arrive at a broader assessment. CAHPS reporting questions fall into four major reports, or “composites,” that summarize consumer experiences in the following areas:
• getting needed care; • getting care quickly; • doctors who communicate well; • health plan information & customer service. The exact questions and responses for each consumer report are presented in the table below: 4.0H Adult Medicaid Reports and Items Response Grouping
for Presentation
Getting Needed Care
Q23
In the last 6 months, how often was it easy to get appointments with specialists?
Never, Sometimes, Usually, Always
Q27 In the last 6 months, how often was it easy to get the care, tests, or treatment you thought you needed through your health plan?
Never, Sometimes, Usually, Always
Getting Care Quickly Q4 In the last 6 months, when you needed care right away, how often
did you get care as soon as you thought you needed? Never, Sometimes, Usually, Always
Q6 In the last 6 months, not counting the times you needed care right away, how often did you get an appointment for your health care at a doctor's office or clinic as soon as you thought you needed?
Never, Sometimes, Usually, Always
How Well Doctors Communicate Q15 In the last 6 months, how often did your personal doctor explain
things in a way that was easy to understand? Never, Sometimes, Usually, Always
Q16 In the last 6 months, how often did your personal doctor listen carefully to you?
Never, Sometimes, Usually, Always
Q17 In the last 6 months, how often did your personal doctor show respect for what you had to say?
Never, Sometimes, Usually, Always
Q18 In the last 6 months, how often did your personal doctor spend enough time with you?
Never, Sometimes, Usually, Always

2008 CAHPS-HP Adult Medicaid Sponsor Report Methodology C-6
Health Plan Information & Customer Service Q31 In the last 6 months, how often did your health plan’s customer
service give you the information or help you needed? Never, Sometimes, Usually, Always
Q32 In the last 6 months, how often did your health plan’s customer service staff treat you with courtesy and respect?
Never, Sometimes, Usually, Always
Note: Question numbers correspond to the CAHPS 4.0H Adult Medicaid mail survey Weighting Items Within a Consumer Report Each item of a consumer report is given equal weight in calculating the composite results for CAHPS. Computationally, this implies calculating the mean of each item within the plan and then taking an unweighted distribution of the item means to obtain the composite mean. Equal weighting follows from the fact that there is no evidence to suggest that any item is more important than another. For example, the number of members who have a personal doctor is likely to be larger than the number of members who receive care from a specialist. Therefore, survey results will likely include more responses for a question related to personal doctor than for one about a specialist. Despite this difference, the item about specialty care is included in the consumer report or composite with equal weighting because it is regarded as potentially important to every member. Another advantage of equal weighting is that the weights are consistent from year to year, as well as across plans within the same year. Consumers’ Ratings of Their Experiences with Care CAHPS collects four separate global ratings to distinguish between important aspects of care. The four questions ask plan enrollees to rate their experiences in the past 6 months with: • their personal doctor ; • the specialist they saw most often; • health care received from all doctors and other health providers; and • their health plan. Ratings are scored on a 0 to 10 scale, where 0 is the “worst possible” and 10 is the “best possible.” The ratings are analyzed and presented in the three-category display used in the CAHPS consumer reports: the percentage of consumers who gave a rating of either 0-6, 7-8, or 9-10. This three-part scale is used because testing by the CAHPS team determined that these cut-points improve the ability to discriminate among plans while simplifying the presentation of results. The exact questions and responses are presented in the table on page C-7.

2008 CAHPS-HP Adult Medicaid Sponsor Report Methodology C-7
4.0H Adult Consumer Ratings Response Grouping
for Presentation Overall Rating of Personal Doctor Q21 Using any number from 0 to 10, where 0 is the worst personal
doctor possible and 10 is the best personal doctor possible, what number would you use to rate your personal doctor?
0-6, 7-8, 9-10
Overall Rating of Specialists Q25 We want to know your rating of the specialist you saw most often
in the last 6 months. Using any number from 0 to 10, where 0 is the worst specialist possible and 10 is the best specialist possible, what number would you use to rate the specialist?
0-6, 7-8, 9-10
Overall Rating of Health Care Q12 Using any number from 0 to 10, where 0 is the worst health care
possible and 10 is the best health care possible, what number would you use to rate all your health care in the last 6 months?
0-6, 7-8, 9-10
Overall Rating of Health Plan Q35 Using any number from 0 to 10, where 0 is the worst health plan
possible and 10 is the best health plan possible, what number would you use to rate your health plan?
0-6, 7-8, 9-10
Note: Question numbers correspond to the CAHPS 4.0H Adult Medicaid mail survey Sampling Methodology The CAHPS sampling recommendation is to achieve a minimum of 300 completed responses per plan, with a 50 percent response rate. If there are multiple plans in a sponsor’s portfolio, the recommendation is to draw equal sample sizes from each of the plans, regardless of the size of the plan membership, so as to achieve 300 completed responses. And the plan samples are not adjusted for unequal probabilities of selection. This logic stems from the principle that the precision of the estimates depends primarily on the size of the sample and not on the size of the population from which it is drawn. Therefore, the given sample size will give the same precision for means or rates regardless of the overall size of the population. Response Rate Calculation In its simplest form, the response rate is the total number of completed questionnaires divided by the total number of respondents selected. Following CAHPS guidelines, the CAHPS Database adjusts response rates according to the following formula:
Number of completed returned questionnaires Total number of respondents selected – (deceased + ineligible)
In calculating the response rate, the CAHPS Database does not exclude respondents who refused, had bad addresses or phone numbers or were institutionalized or incompetent. The tables below present definitions for the categories included and excluded in the response rate calculation.

2008 CAHPS-HP Adult Medicaid Sponsor Report Methodology C-8
Numerator Definitions
Inclusions Exclusions Completed questionnaires - A questionnaire is considered complete if it was coded as complete by the sponsor and has at least one question completed. (For Sponsors that submitted to NCQA and the CAHPS Database, the CAHPS Database will include those records marked with a disposition of M10, T10, or I10 – completed by mail, telephone, or internet, respectively).
Surveys not marked with a disposition of M10, T10 or I10 will be excluded, even if the survey is complete.
Denominator Definitions
Inclusions Exclusions ♦ Refusals. The sample member refused in
writing, or refused to be interviewed. ♦ Nonresponse. The sample member was
always unavailable and is presumed to be eligible.
♦ Institutionalized or incompetent respondents. The caregiver or guardian received the survey or was contacted by phone, and the sample member was institutionalized or incompetent and could not be contacted directly.
♦ Bad addresses/phone numbers. The sample member was never located and is considered “nonlocatable” and included in the denominator.
♦ Deceased. Deceased sample members are excluded from the denominator. In some cases a household or family member may have provided information about the death of the sample member.
♦ Ineligible - not enrolled in the plan. The sample member disenrolled from the plan, was never in the plan, or was enrolled in the plan for less than 6 months.
Case Mix Adjustment Several methodological problems complicate the measurement and reporting of health care data, particularly when reports draw comparisons among health plans, as is the case in this report. Among these challenges is the need to adjust appropriately for case-mix differences. Case mix refers to the proportion of enrollees with serious health conditions and other demographic characteristics that have been demonstrated to affect respondents’ reports and ratings of the quality of care received. Case-mix takes into account enrollee characteristics that are not under the control of the plan but may affect measures of outcomes or processes, such as demographic and social characteristics or health status. Many of the CAHPS questions ask about aspects of access or processes of care that should not vary by enrollee characteristics. Therefore, case-mix adjustment may be less important for CAHPS data than for outcomes of care, which are known to be influenced by enrollee characteristics in a way that is independent of plan performance. Nonetheless, there are at least

2008 CAHPS-HP Adult Medicaid Sponsor Report Methodology C-9
two reasons why case-mix adjustment might still be necessary. First, there are certain processes that one would expect to vary according to the characteristics of enrollees. For example, one CAHPS question is "how often did your health plan’s customer service give you the information or help you needed?" Although it is desirable to communicate clearly with all enrollees, it probably is harder to do so with enrollees who have less education than with other enrollees. Second, enrollee characteristics might influence the response to questions, even if the process of care is the same for different enrollees. For example, individuals' expectations might strongly influence their response to questions asking for evaluations, such as "how often did you get an appointment for your health care at a doctor's office or clinic as soon as you thought you needed?" If an enrollee has very low expectations for the quality of care, he or she might be very satisfied with poor quality. Also, certain types of enrollees may have a general tendency to give positive ratings or have biases that are not associated with the quality of care. For example, some groups of enrollees may generally have more trust and confidence in authority figures and institutions, even if there are no differences in their care. In this report, consumer reports and ratings results were case mix adjusted but item level data and frequencies were not case mix adjusted. Mean scores for composite and ratings measures were adjusted using a linear regression model. The case mix adjustment model included plans members’ age, self-reported health status, and education. These variables were entered into the adjustment model as ordered categories. The resulting case-mix adjusted means were tested for significance as described in the next section. Testing for Statistical Differences The Sponsor Reports test for statistically significant differences between mean consumer report scores and ratings of individual health plans and the mean of all plan means in the CAHPS Database using the t-test. A significance level of 0.05 or less is considered statistically significant. As described in the previous sections, the mean scores are adjusted for case-mix differences before the statistical tests are applied. To compute the means, reports and rating responses are grouped into three categories and assigned a score of 1, 2 or 3. Then, significance tests for both the reports and ratings are conducted on the mean scores. Individual plan results that differ significantly from the overall mean are denoted by arrows, either pointing up (significantly higher than the overall mean) or down (significantly lower than the overall mean). Readers should note that sample size affects significance testing in at least two important ways. First, due to the large sample sizes in the CAHPS Database, not all statistically significant differences may reflect meaningful differences in plan performance. For example, consider the following data: Composite: Customer Service Plan A - 54.2% CAHPS Database - 56.4% Because of the large sample size for the CAHPS Database, it is possible for Plan A to be statistically below the CAHPS Database distribution. However, purchasers and consumers may not consider a difference of 2.2 percentage points to be an important or meaningful difference in performance.

2008 CAHPS-HP Adult Medicaid Sponsor Report Methodology C-10
Second, differences in sample size among health plans may mean that two plans with an identical result, but different sample sizes, may produce different results on the statistical significance tests. This is because smaller sample sizes at the plan level yield less precise measures of performance and may be insufficient to achieve statistical significance. Therefore, readers should take sample size into account when interpreting the results of statistical tests. Please refer to the CAHPS Survey and Reporting Kit for more information on substantive or practical significance. Finally, note that this method of determining statistical differences does not translate into plan-to-plan comparisons. For example, if one plan has an up arrow on a particular item and another plan has no arrow for that item, it does not necessarily mean that the first plan’s result is significantly higher than the second because both results were compared to the overall mean. The CAHPS Health Plan Survey Database Compared to NCQA Quality Compass® While the CAHPS Database is the national repository for CAHPS Health Plan Survey results, the National Committee for Quality Assurance (NCQA) also collects CAHPS results from health plans. NCQA is an independent, non-profit organization that evaluates and reports on the quality of the nations managed care organizations. NCQA evaluates health care through Accreditation (a rigorous on-site review of key clinical and administrative processes) and through the Health Plan Employer Data and Information Set (HEDIS® -- a tool used to measure performance in key areas like immunization and mammography screening rates). Before the development of CAHPS, NCQA collected plan satisfaction data using a HEDIS Member Satisfaction Survey. In 1998, NCQA worked with AHRQ to develop CAHPS 2.0H, a version of the survey with a specified protocol for managed care plans to use to report results to NCQA for accreditation or HEDIS®. Effective with HEDIS® 2007, NCQA adopted the 4.0H version of the CAHPS Health Plan Survey, Adult Version to collect information on the experiences of adult members with the health plan. Detailed information on the requirements for HEDIS/CAHPS 4.0H survey reporting is available directly from NCQA (www.ncqa.org). Beginning in 2007, the CAHPS Database entered into a partnership with NCQA to obtain commercial sector CAHPS Health Plan Survey data submitted to NCQA by health plans. Health plans were given the option to approve the use of the data they submitted to NCQA by the CAHPS Database. The purpose of this partnership is to streamline the submission of data for health plans and vendors, and to move to a single, common database for commercial health plan enrollees. Medicaid and SCHIP sponsors still submit CAHPS survey data directly to the CAHPS Database. Because NCQA’s purposes for the data differ from those of the CAHPS Database, there are corresponding differences in survey administration, analysis methods, and presentation of the data. The table on the following pages presents differences between the CAHPS Database and the CAHPS 4.0H Medicaid survey data in NCQA’s Quality Compass.

2008 CAHPS-HP Adult Medicaid Sponsor Report Methodology C-11
National CAHPS® Benchmarking Database NCQA Quality Compass® Database Participation
Criteria Open to all sponsors of CAHPS Health Plan surveys that choose to participate (including public and private purchasers and health plans).
Includes health plans that use the HEDIS survey specifications to collect and report results, including plans that are part of NCQA’s accreditation process and those that choose to publicly report their HEDIS results.
Survey Administration
Survey Instrument Standards CAHPS 4.0 or CAHPS 4.0H CAHPS 4.0H Survey Administration Standards ♦ Administration Survey must be conducted by a third party
vendor according to CAHPS guidelines or the HEDIS protocol.
Survey must be conducted by a NCQA-Certified HEDIS Survey Vendor, using the HEDIS protocol.
♦ Collection mode
Mail, telephone or mixed mode protocols are accepted. Internet enhancement is accepted.
The standard HEDIS protocol includes two options: 1) Mail-only methodology 2) Mail with telephone follow up. Internet enhancements, other enhancements and alternative protocols must receive prior approval by NCQA.
♦ Sample size Large enough to yield 300 completed surveys per health plan product, a cost-effective method shown to produce statistically useful survey comparisons.
Required sample sizes are set with the goal of achieving 411 completed surveys per health plan product.
♦ Response Rates Target rates are 60% for commercial health plans and 50% for Medicaid, but lower rates are accepted.
Target rates are 55% for commercial and 45% for Medicaid, but lower rates are accepted if HEDIS protocol is followed exactly.
♦ Completion criteria The CAHPS Database includes all records that have been coded as a complete and have at least one completed question.
Surveys used in the calculation of plan level results must have Question 1 and at least 80% of total pertinent questions answered or skipped. Responses to survey questions indicate the member meets the eligible population criteria.

2008 CAHPS-HP Adult Medicaid Sponsor Report Methodology C-12
National CAHPS® Benchmarking Database NCQA Quality Compass® Data Analysis and Reporting
Audit Requirements for Data Submission
No formal audit required. The CAHPS Database ensures the quality of submitted data through extensive contact with sponsors and vendors and thorough data cleaning and review of submitted member level files.
Only HEDIS survey measures that have been validated through a HEDIS Compliance Audit™ are eligible for use in Accreditation scoring or for inclusion in NCQA information products (Quality Compass®). The focus of the audit is to verify that the sample frame has been prepared correctly.
Survey Results Calculation The CAHPS Database calculates survey results from member-level data files submitted by each sponsor’s vendor.
NCQA receives member-level files from certified vendors and then centrally calculates HEDIS survey results and creates validated member-level data files and plan-level survey results on behalf of each vendor.
Calculation of National Distribution/Average
National distribution is calculated using respondent-level data.
National Average is calculated using plan-level data. Summary averages comprise both publicly and non-publicly reporting plans who submit data to NCQA.
Case Mix Adjustment CAHPS Database comparisons of reports and ratings are adjusted for respondent age, education, and self-reported health status.
No case mix adjustment used.
Summary Comparisons Statistical differences between plan means and the mean of all plan means are indicated by an arrow up (above the national plan distribution), down (below the national plan distribution), or no arrow (no difference). Summary results also are presented by grouping plans into five percentile categories. (90th -100th ; 75th -89th ; 50th -74th; 25th-49th; below 25th )
Plans are grouped into percentile rate categories. Percentiles are plan rates sorted by score, from lowest to highest. The percentile rates are segmented into 10th, 25th, 50th, 75th, and 90th, with the corresponding rate for the plans that fall within those categories.
Consumer Report Results/Individual Question Items
Consumer report results are presented in three-part bar charts showing the results for “Always”, “Usually” and “Sometimes + Never”.
Three types of consumer report results are presented: percentage responses for each question option, question summary rates, and global proportions (“always+usually” depending on the composite).
Ratings Ratings are presented using a three-category display for the 0-10 scale questions: 0-6, 7-8, 9-10.
Percent responding to each category are presented as well as the percent responding 8-10 and the percent responding 9-10.
Question Numbering Numbering of questions based on CAHPS 4.0H. Numbering of questions based on CAHPS 4.0H.

2008 CAHPS-HP Adult Medicaid Sponsor Report Methodology C-13
National CAHPS® Benchmarking Database NCQA Quality Compass® Summary Reports CAHPS Database Chartbook:
• Published annually in the fall. • Compares consumer reports and ratings for
commercial, Medicaid, SCHIP and Medicare populations.
• Results include the current and prior year’s data.
• Results include consumer reports and ratings, individual question items that make up the composite as well as sections related to key findings, background on CAHPS and the CAHPS Database, and data sources and limitations.
Quality Compass: Published annually in July for Commercial
data and November for Medicaid data sets.
Web-based product that compares health plans’ performance and benchmarks of public reporting plans. Detailed and summary level responses are displayed for specific CAHPS measures.
Data are available for Commercial and Medicaid populations.
State of Health Care Quality Report: • Published annually in September. • Compares adult commercial survey reports
and ratings by top and bottom regions and by 90th and 10th percentiles.
Sponsor Reports Participating Medicaid and SCHIP sponsors receive a free, customized Sponsor Report that compares their own results (adjusted for respondent age, education, and self-reported health status) to appropriate benchmarks derived from the CAHPS Database. Comparisons include national, regional, and plan type distributions.
Plans who submit data receive a report that compares their current year results to benchmark results from the previous year.
Access to Data Files • Authorized access to respondent-level data files open to researchers free of charge upon approval by the CAHPS Database Executive Research Committee.
• Access requires agreement to maintain confidentiality of sponsor and plan identities.
• Special provisions apply to Medicare data files.
Access to summary and plan-level data files by purchase of Quality Compass license agreement. Non-identifying respondent level data are also available for purchase.
CCChhhiiilllddd MMMeeedddiiicccaaaiiiddd SSSpppooonnnsssooorrr RRReeepppooorrrttt September 2008
Oregon Department of Human Services

2008 CAHPS Health Plan Survey
Child Medicaid Sponsor Report
Oregon Department of Human Services
Section A: Results at a Glance
Section B: Results in Detail
Prepared by Westat and Shaller Consulting
September 2008
The National CAHPS® Benchmarking Database is funded by the U.S. Agency for Healthcare Research and Quality and administered by Westat under Contract Number HHSA290200710024C. For more information, please visit the Web site (https://www.cahps.ahrq.gov) or contact the CAHPS User Network at 1-800-492-9261.

2008 CAHPS-HP 4.0 Child Medicaid Sponsor Report i
Table of Contents Page Introduction .......................................................................................................................... ii
Section A: Results at a Glance A-1 Summary of Statistically Significant Differences .......................................................... A-2 Summary of Percentile Rankings................................................................................. A-4
Section B: Results in Detail B-1
Participants in the 2008 CAHPS Health Plan Survey Database .................................. B-2 Demographic Characteristics ....................................................................................... B-3 Utilization Characteristics............................................................................................. B-4 Survey Results in Detail ............................................................................................... B-5 Regional Benchmarks .................................................................................................. B-6
Consumers’ Reports of Their Experiences with Care Getting Needed Care for Children Getting Care Quickly for Children How Well Doctors Communicate Health Plan Information & Customer Service
Consumers’ Ratings of Their Experiences with Care Overall Rating of Child’s Personal Doctor Overall Rating of Child’s Specialists Overall Rating of Child’s Health Care Overall Rating of Child’s Health Plan
Chronic Conditions Items (if applicable)

2008 CAHPS-HP 4.0 Child Medicaid Sponsor Report ii
Introduction
This report presents results for Oregon Department of Human Services 2008 CAHPS Health Plan (CAHPS-HP) survey of child Medicaid managed care enrollees compared to results of surveys conducted by other child Medicaid survey sponsors participating in the 2008 CAHPS Health Plan Survey Database. The 2008 CAHPS Database contains 4.0 Health Plan survey results from 29 unique child Medicaid plans that conducted surveys between October 2007 and June 2008. The 2008 CAHPS Health Plan Survey 4.0 child Medicaid sponsor report is organized in three sections:
• Section A: Results at a Glance: Presents two summary tables of comparative results,
showing both statistically significant differences and percentile rankings of CAHPS-HP survey sponsor results compared to benchmarks from the CAHPS Health Plan Survey Database.
• Section B: Results in Detail: Presents detailed results for survey items through a series
of bar charts. This section begins with a list of participants in the 2008 CAHPS Health Plan Survey Database and two sponsor-specific tables showing a comparison of demographic and utilization characteristics of respondents.
• Section C: Background and Methodology: Presents overview information about the
CAHPS Database and CAHPS Health Plan Survey and includes guidelines for using reports, methodological information on consumer reports and consumer ratings (i.e., items included, calculations), response rate calculation, case mix adjustment, and significance testing.
Sections A and B are presented together in this document. Section C is presented as a separate companion document. Questions regarding this report or any aspect of the CAHPS Database can be directed by e-mail to [email protected]. Further information about the CAHPS Database is available through the Web site at: https://www.cahps.ahrq.gov

2008 CAHPS-HP 4.0 Child Medicaid Sponsor Report A-1
Section A: Results at a Glance This section summarizes the 2008 child Medicaid Health Plan Survey results for Oregon Department of Human Services in two ways: Table 1. Summary of Statistically Significant Differences: This table presents the results of statistical significance tests. Up or down arrows are shown when the results are significantly different from their relevant comparison group. The comparison groups are (1) the sponsor results compared against all other sponsors, and (2) individual health plan results compared against all other health plans. For each composite measure, a mean value (case-mix adjusted) is calculated for each sponsor and for each health plan. These mean values are then statistically compared to the mean value for all sponsors (the mean of all sponsor means) or compared to the mean value for all health plans (the mean of all plan means). All tests were conducted at the .05 level of statistical significance. All survey respondents for a given sponsor are combined to form the sponsor-level results. Note that when a sponsor submits data for only a single health plan, the individual health plan and sponsor results may vary because the sponsor results are compared to the mean of all sponsor means, whereas the health plan results are compared to the mean of all health plan means. The arrows in the table indicate the results of the statistical comparison: • ( ) up arrow - result is statistically above the mean value of all sponsors or health plans. • ( ) down arrow - result is statistically below the mean value of all sponsors or health
plans. • ( ) two-sided arrow - result is statistically equivalent to the mean value of all sponsors
or health plans. Table 2. Summary of Percentile Rankings: This table presents the results by percentile rankings using stars to indicate the percentile band for a specific result. This table shows where each health plan result fell within the percentile range of all the plans in the country that submitted CAHPS 4.0 child Medicaid survey results to the CAHPS Health Plan Survey Database. Five stars indicate the plan performed within the top ten percent of child Medicaid plans in the CAHPS Health Plan Survey Database while one star indicates the plan performed within the bottom twenty-five percent of plans in the CAHPS Health Plan Survey Database. Rankings are based on a direct comparison of the plan result to the full range of results from all child Medicaid plan samples in the 2008 CAHPS Health Plan Survey Database; no statistical comparisons were performed.

Oregon Department of Human ServicesTable 1. Statistically Significant Differences Summary
Symbol
Interpretation
Getting Needed Care for Children
Getting Care Quickly for Children
How Well Doctors Communicate
Health Plan Information &
Customer Service
2008 CAHPS-HP 4.0 Child Medicaid Sponsor Report A-2
Consumer Reports
indicates result is statistically above the mean value for the given
comparison group
indicates result is statistically equivalent to the mean value for the
given comparison group
indicates result is statistically below the mean value for the given
comparison group
Lane IPA
Marion-Polk Community Health Plan
Oregon Department of Human Services (Sponsor)
Care Oregon
Cascade Comprehensive Care
Central Oregon Ind Health Services
Doctors of the Coast South
Douglas County IPA
Family Care
FFS/PCCM (Medicaid)
Intercommunity Health Network
Kaiser Permanente Oregon Plus
Mid-Rogue IPA
ODS Community Health
Oregon Health Management Services
Providence Health Plan
Tuality Health Alliance

Oregon Department of Human ServicesTable 1 (cont.) Statistically Significant Differences Summary
Symbol
Interpretation
Overall Rating of Child’s Personal
Doctor
Overall Rating of Child’s Specialists
Overall Rating of Child’s Health
Care
Overall Rating of Child’s Health
Plan
Care Oregon
Cascade Comprehensive Care
Central Oregon Ind Health Services
Doctors of the Coast South
Douglas County IPA
Family Care
FFS/PCCM (Medicaid)
Intercommunity Health Network
Kaiser Permanente Oregon Plus
Lane IPA
Marion-Polk Community Health Plan
Mid-Rogue IPA
ODS Community Health
Oregon Health Management Services
Providence Health Plan
Tuality Health Alliance
2008 CAHPS-HP 4.0 Child Medicaid Sponsor Report A-3
Oregon Department of Human Services (Sponsor)
Consumer Ratings
indicates result is statistically above the mean value for the given
comparison group
indicates result is statistically equivalent to the mean value for the
given comparison group
indicates result is statistically below the mean value for the given
comparison group

Oregon Department of Human ServicesTable 2. Consumer Reports Percentile Rank Summary
Symbol
Percentile Rank 90th – 100th
percentile75th – 89th
percentile50th – 74th
percentile25th – 49th
percentileBelow the 25th
percentile
Getting Needed Care for Children
Getting Care Quickly for Children
How Well Doctors Communicate
Health Plan Information &
Customer Service
Care Oregon
Cascade Comprehensive Care
Central Oregon Ind Health Services
Doctors of the Coast South
Douglas County IPA
Family Care
FFS/PCCM (Medicaid)
Intercommunity Health Network
Kaiser Permanente Oregon Plus
Lane IPA
Marion-Polk Community Health Plan
Mid-Rogue IPA
ODS Community Health
Oregon Health Management Services
Providence Health Plan
Tuality Health Alliance
2008 CAHPS-HP 4.0 Child Medicaid Sponsor Report A-4
Consumer Reports
Oregon Department of Human Services (Sponsor)

Oregon Department of Human ServicesTable 2 (cont.) Consumer Ratings Percentile Rank Summary
Symbol
Percentile Rank 90th – 100th
percentile75th – 89th
percentile50th – 74th
percentile25th – 49th
percentileBelow the 25th
percentile
Overall Rating of Child’s Personal
Doctor
Overall Rating of Child’s Specialists
Overall Rating of Child’s Health Care
Overall Rating of Child’s Health Plan
Care Oregon
Cascade Comprehensive Care
Central Oregon Ind Health Services
Doctors of the Coast South
Douglas County IPA
Family Care
FFS/PCCM (Medicaid)
Intercommunity Health Network
Kaiser Permanente Oregon Plus
Lane IPA
Marion-Polk Community Health Plan
Mid-Rogue IPA
ODS Community Health
Oregon Health Management Services
Providence Health Plan
Tuality Health Alliance
2008 CAHPS-HP 4.0 Child Medicaid Sponsor Report A-5
Consumer Ratings
Oregon Department of Human Services (Sponsor)

2008 CAHPS-HP 4.0 Child Medicaid Sponsor Report B-1
Section B: Results in Detail
This section presents comparisons of sponsor-specific 2008 CAHPS Health Plan (CAHPS-HP) Survey results in detail. The section begins with a list of sponsors participating in the 2008 CAHPS Health Plan Survey Database, followed by sponsor-specific demographic and utilization characteristics of respondents compared to the CAHPS Health Plan Survey Database child Medicaid health plan sample. Detailed survey results and their respective items are presented for consumer reports, followed by consumer ratings and chronic conditions survey item results (if applicable).
Please refer to Section C of this report (separate companion document) for more information on question item and response definitions.

Oregon Department of Human Services
Sponsor Name
Number of Plans
Surveyed
Total Number Sampled
Total Number of Completed Surveys1
% of Completed
Surveys that met Chronic
Conditions Screener
Range of Response
Rates
Florida Agency for Health Care Admin 10 3,465 3,465 N/A 15% - 24%NJ Div. of Med. Assistance & Health Svc. 3 735 735 N/A 9% - 10%Oregon Department of Human Services 16 13,747 5,555 N/A 41% - 59%
Total Submitted to CAHPS Database 29 17,947 9,755 N/A 9%-59%Deduplicated Total 2 29 17,947 9,755 N/A 9%-59%
2 For 2008, sponsors submitted CAHPS 4.0 Health Plan child Medicaid data for 29 unique health plan samples.
2008 CAHPS-HP 4.0 Child Medicaid Sponsor Report B-2
Table 3. Participants in 2008 CAHPS Health Plan Survey Database
The table below shows the composition of the 2008 CAHPS Health Plan Survey Database child Medicaid data.
1 Total number of completed surveys includes only those surveys coded as a “complete” by the sponsor or their vendor(s).

Oregon Department of Human Services
Demographic Characteristics 2008 CAHPS-HP Database
Met Chronic Conditions Screener Total
Gender (parent/guardian)Male 11% 11% 12%Female 89% 89% 88%
Gender (child)Male 55% 51% 51%Female 45% 49% 49%
Age (parent/guardian)Under 18 years 6% 5% 3%18-34 years 30% 43% 44%35-54 years 49% 42% 44%55-74 years 14% 9% 8%75+ years 1% 0% 1%
Age (child)0-3 years 11% 25% 27%4-7 years 20% 24% 25%8-11 years 26% 21% 19%12+ years 43% 30% 29%
Education (parent/guardian)Less than high school graduate 17% 26% 24%High school graduate/GED 34% 35% 36%Some college/2 year degree 40% 31% 29%4 year college graduate 5% 5% 7%More than 4 year college degree 4% 3% 4%
Race/Ethnicity (child)White 74% 71% 58%African-American 3% 3% 14%Asian 1% 2% 2%Native Hawaiian/Pacific Islander 0% 1% 0%American Indian/Native Alaskan 4% 3% 2%Other 8% 14% 18%Multi-racial 10% 8% 6%
Hispanic/Latino origin or decent Yes 20% 34% 38% No 80% 66% 62% Health Status of Child
Excellent 18% 39% 41%Very Good 39% 36% 33%Good 32% 20% 21%Fair 10% 5% 5%Poor 1% 0% 1%
2008 CAHPS-HP 4.0 Child Medicaid Sponsor Report B-3
Table 4. Demographic Characteristics – CAHPS-HP Database and Oregon Department of Human ServicesTable 4 presents descriptive information for Oregon Department of Human Services sample compared to the 2008 CAHPS Health Plan Survey Database child Medicaid data. Similar information about the general child population available from the U.S. Census Bureau’s Current Population Survey can be used for comparison purposes.
Sponsor

Oregon Department of Human Services
Utilization Characteristics 2008 CAHPS-HP Database
Met Chronic Conditions Screener Total
Have a personal doctor? Yes 91% 87% 89% No 9% 13% 11%
Number of visits to personal doctor? None 21% 27% 22% 1-2 49% 51% 50% 3-4 20% 15% 19% 5-9 8% 5% 7% 10+ 2% 1% 2%
Number of visits to doctor's office or clinic? None 21% 32% 26% 1-2 44% 46% 45% 3-4 23% 16% 19% 5-9 9% 5% 7% 10+ 4% 2% 2%
Made an appointment to see a specialist? Yes 30% 15% 20% No 70% 85% 80%
Number of specialists seen?None 14% 16% 16%1 56% 61% 57%2 17% 14% 17%3 7% 5% 5%4 2% 1% 1%5 or more 4% 2% 2%
2008 CAHPS-HP 4.0 Child Medicaid Sponsor Report B-4
Table 5. Utilization Characteristics – CAHPS-HP Database and Oregon Department of Human ServicesThe following table presents utilization information for Oregon Department of Human Services compared to the 2008 CAHPS Health Plan Survey Database child Medicaid data. Sponsors and plans can use this information to inform their interpretation of survey results.
Sponsor

Oregon Department of Human Services
The definitions of the comparative benchmarks used in the bar charts are as follows:
● Child Medicaid – The distribution of results for all child Medicaid surveys in the 2008 CAHPS Health Plan Survey Database.
● Region – The distribution of results for all child Medicaid surveys within the region of the 2008 CAHPS Health Plan Survey Database. See the section on the next page for details on how the
regions were defined.● HMO/POS/PPO – The distribution of results for all child Medicaid surveys of HMO, POS and
PPO plans in the 2008 CAHPS Health Plan Survey Database. For 2008, sponsors submitted 29 HMO plans.
Medicaid surveys of PCCM programs in the 2008 CAHPS Health Plan Survey Database. ● Sponsor – The distribution of results for all of the sponsor’s health plans.
Arrows are shown when the results are significantly different from their relevant comparison group. In this report, the comparison groups are (1) the “Sponsor” result compared against all other Sponsors, and (2) individual health plan results compared against all other health plans. For each survey item or composite measure a mean value (case-mix adjusted) is calculated for each Sponsor
2008 CAHPS-HP 4.0 Child Medicaid Sponsor Report B-5
(the mean of all plan means). All tests were conducted at the .05 level of statistical significance.all Sponsors (the mean of all Sponsor means) or compared to the mean value for all health plans and for each health plan. These mean values are then statistically compared to the mean value for
Survey Results in Detail
The detailed survey results in this section present the full range of responses in a bar chart format, as shown in the example below for the Getting Needed Care composite:
● Primary Care Case Management (PCCM) – The distribution of results for all child
Getting Needed Care for Children
Child Medicaid (n=3856)
Northeast Regional NA
HMO/POS/PPO (n=3856)
PCCM NA
Sponsor (n=319)
Plan A (n=117)
Plan B (n=91)
Plan C (n=111)
This chart displays the data for "Getting Needed Care for Children", an aggregate of survey questions 20 and 24. Results for the individual questions are displayed on each of the following pages.
AlwaysNever + Sometimes Usually
28%
28%
26%
25%
27%
27%
22%
22%
23%
25%
23%
21%
50%
50%
51%
51%
50%
52%
0% 20% 40% 60% 80% 100%
= Above the mean value of all sponsor or plan means (p < 0.05)
= Below the mean value of all sponsor or plan means (p < 0.05)

Oregon Department of Human Services
RegionNortheast
Midwest
South
West
2008 CAHPS-HP 4.0 Child Medicaid Sponsor Report B-6
Alaska, Arizona, California, Colorado, Guam, Hawaii, Idaho, Montana, Nevada, New Mexico, Oregon, Utah, Washington, Wyoming
Alabama, Arkansas, Delaware, DC, Florida, Georgia, Kentucky, Louisiana, Maryland, Mississippi, North Carolina, Oklahoma, South Carolina, Tennessee, Texas, Virginia, West Virginia
Illinois, Indiana, Iowa, Kansas, Michigan, Minnesota, Missouri, Nebraska, North Dakota, Ohio, South Dakota, Wisconsin
Regional Benchmarks
The regional benchmarks were calculated according to the United States Census Bureau Regions. The table below lists the regions and included states.
Connecticut, Maine, Massachusetts, New Hampshire, New Jersey, New York, Pennsylvania, Puerto Rico, Rhode Island, Vermont
States

Oregon Department of Human Services
Getting Needed Care for Children
Child Medicaid (n=3856)
West Regional (n=1924)
HMO/POS/PPO (n=3856)
PCCM NA
Sponsor (n=1924)
Care Oregon (n=111)
Cascade Comprehensive Care (n=126)
Central Oregon Ind Health Services (n=127)
Doctors of the Coast South (n=157)
Douglas County IPA (n=140)
Family Care (n=100)
FFS/PCCM (Medicaid) (n=113)
Intercommunity Health Network (n=141)
Kaiser Permanente Oregon Plus (n=132)
Lane IPA (n=135)
Marion-Polk Community Health Plan (n=118)
Mid-Rogue IPA (n=135)
ODS Community Health (n=86)
Oregon Health Management Services (n=102)
Providence Health Plan (n=92)
2008 CAHPS-HP 4.0 Child Medicaid Sponsor Report B-7
This chart displays the data for "Getting Needed Care for Children", an aggregate of survey questions 41 and 45. Results for the individual questions are displayed on each of the following pages.
NOTE: The results shown above are case mix adjusted. Small percentage differences may represent measurement (sampling) error rather than actual differencesin health plan performance. Response distributions may not sum to 100 percent due to rounding. See the methodology section for more information about thescoring and case-mix methodology.
AlwaysNever + Sometimes Usually
28%
25%
28%
25%
36%
26%
31%
20%
27%
33%
17%
30%
23%
25%
27%
14%
24%
22%
29%
22%
26%
22%
26%
23%
29%
26%
27%
24%
31%
28%
25%
23%
26%
35%
24%
28%
26%
20%
50%
48%
50%
48%
41%
45%
43%
53%
48%
36%
55%
45%
54%
48%
39%
63%
48%
53%
52%
0% 20% 40% 60% 80% 100%
= Above the mean value of all sponsor or plan means (p < 0.05)
= Below the mean value of all sponsor or plan means (p < 0.05)

Oregon Department of Human Services
Getting Needed Care for Children
Child Medicaid (n=3856)
West Regional (n=1924)
HMO/POS/PPO (n=3856)
PCCM NA
Sponsor (n=1924)
Tuality Health Alliance (n=109)
2008 CAHPS-HP 4.0 Child Medicaid Sponsor Report B-8
This chart displays the data for "Getting Needed Care for Children", an aggregate of survey questions 41 and 45. Results for the individual questions are displayed on each of the following pages.
NOTE: The results shown above are case mix adjusted. Small percentage differences may represent measurement (sampling) error rather than actual differencesin health plan performance. Response distributions may not sum to 100 percent due to rounding. See the methodology section for more information about thescoring and case-mix methodology.
AlwaysNever + Sometimes Usually
28%
25%
28%
25%
27%
22%
26%
22%
26%
24%
50%
48%
50%
48%
49%
0% 20% 40% 60% 80% 100%
= Above the mean value of all sponsor or plan means (p < 0.05)
= Below the mean value of all sponsor or plan means (p < 0.05)

Oregon Department of Human Services
Child Medicaid (n=1885)
West Regional (n=803)
HMO/POS/PPO (n=1885)
PCCM NA
Sponsor (n=803)
Care Oregon (n=36)
Cascade Comprehensive Care (n=50)
Central Oregon Ind Health Services (n=57)
Doctors of the Coast South (n=64)
Douglas County IPA (n=49)
Family Care (n=43)
FFS/PCCM (Medicaid) (n=45)
Intercommunity Health Network (n=56)
Kaiser Permanente Oregon Plus (n=56)
Lane IPA (n=51)
Marion-Polk Community Health Plan (n=47)
Mid-Rogue IPA (n=48)
ODS Community Health (n=37)
Oregon Health Management Services (n=38)
Providence Health Plan (n=54)
2008 CAHPS-HP 4.0 Child Medicaid Sponsor Report B-9
Q41. Of those respondents who made an appointment for their child to see a specialist: "In the last 6 months, how often was it easy to get appointments for your child with specialists?”
NOTE: The results shown above are case mix adjusted. Small percentage differences may represent measurement (sampling) error rather than actual differencesin health plan performance. Response distributions may not sum to 100 percent due to rounding. See the methodology section for more information about thescoring and case-mix methodology.
AlwaysNever + Sometimes Usually
30%
28%
30%
28%
42%
28%
33%
20%
27%
40%
20%
34%
27%
29%
26%
19%
24%
21%
28%
22%
27%
22%
27%
28%
30%
25%
27%
20%
35%
22%
23%
30%
27%
38%
21%
27%
26%
20%
48%
45%
48%
45%
31%
42%
42%
53%
53%
26%
58%
43%
43%
43%
36%
60%
49%
53%
52%
0% 20% 40% 60% 80% 100%
= Above the mean value of all sponsor or plan means (p < 0.05)
= Below the mean value of all sponsor or plan means (p < 0.05)

Oregon Department of Human Services
Child Medicaid (n=1885)
West Regional (n=803)
HMO/POS/PPO (n=1885)
PCCM NA
Sponsor (n=803)
Tuality Health Alliance (n=72)
2008 CAHPS-HP 4.0 Child Medicaid Sponsor Report B-10
Q41. Of those respondents who made an appointment for their child to see a specialist: "In the last 6 months, how often was it easy to get appointments for your child with specialists?”
NOTE: The results shown above are case mix adjusted. Small percentage differences may represent measurement (sampling) error rather than actual differencesin health plan performance. Response distributions may not sum to 100 percent due to rounding. See the methodology section for more information about thescoring and case-mix methodology.
AlwaysNever + Sometimes Usually
30%
28%
30%
28%
28%
22%
27%
22%
27%
31%
48%
45%
48%
45%
42%
0% 20% 40% 60% 80% 100%
= Above the mean value of all sponsor or plan means (p < 0.05)
= Below the mean value of all sponsor or plan means (p < 0.05)

Oregon Department of Human Services
Child Medicaid (n=3236)
West Regional (n=1682)
HMO/POS/PPO (n=3236)
PCCM NA
Sponsor (n=1682)
Care Oregon (n=95)
Cascade Comprehensive Care (n=117)
Central Oregon Ind Health Services (n=102)
Doctors of the Coast South (n=141)
Douglas County IPA (n=126)
Family Care (n=89)
FFS/PCCM (Medicaid) (n=99)
Intercommunity Health Network (n=122)
Kaiser Permanente Oregon Plus (n=110)
Lane IPA (n=123)
Marion-Polk Community Health Plan (n=100)
Mid-Rogue IPA (n=126)
ODS Community Health (n=77)
Oregon Health Management Services (n=93)
Providence Health Plan (n=74)
2008 CAHPS-HP 4.0 Child Medicaid Sponsor Report B-11
Q45. Of those respondents who tried to get any kind of care, tests, or treatment for their child through the health plan: "How often was it easy to get the care, tests, or treatment you thought your child needed through his or her health plan?”
NOTE: The results shown above are case mix adjusted. Small percentage differences may represent measurement (sampling) error rather than actual differencesin health plan performance. Response distributions may not sum to 100 percent due to rounding. See the methodology section for more information about thescoring and case-mix methodology.
AlwaysNever + Sometimes Usually
25%
23%
25%
23%
31%
24%
28%
19%
28%
26%
14%
26%
20%
21%
28%
9%
23%
23%
30%
22%
26%
22%
26%
18%
28%
27%
28%
29%
27%
34%
26%
15%
25%
31%
26%
30%
25%
19%
53%
51%
53%
51%
52%
48%
44%
53%
44%
47%
52%
48%
65%
54%
41%
65%
47%
53%
51%
0% 20% 40% 60% 80% 100%
= Above the mean value of all sponsor or plan means (p < 0.05)
= Below the mean value of all sponsor or plan means (p < 0.05)

Oregon Department of Human Services
Child Medicaid (n=3236)
West Regional (n=1682)
HMO/POS/PPO (n=3236)
PCCM NA
Sponsor (n=1682)
Tuality Health Alliance (n=88)
2008 CAHPS-HP 4.0 Child Medicaid Sponsor Report B-12
Q45. Of those respondents who tried to get any kind of care, tests, or treatment for their child through the health plan: "How often was it easy to get the care, tests, or treatment you thought your child needed through his or her health plan?”
NOTE: The results shown above are case mix adjusted. Small percentage differences may represent measurement (sampling) error rather than actual differencesin health plan performance. Response distributions may not sum to 100 percent due to rounding. See the methodology section for more information about thescoring and case-mix methodology.
AlwaysNever + Sometimes Usually
25%
23%
25%
23%
26%
22%
26%
22%
26%
18%
53%
51%
53%
51%
56%
0% 20% 40% 60% 80% 100%
= Above the mean value of all sponsor or plan means (p < 0.05)
= Below the mean value of all sponsor or plan means (p < 0.05)

Oregon Department of Human Services
Getting Care Quickly for Children
Child Medicaid (n=6667)
West Regional (n=3545)
HMO/POS/PPO (n=6667)
PCCM NA
Sponsor (n=3545)
Care Oregon (n=227)
Cascade Comprehensive Care (n=246)
Central Oregon Ind Health Services (n=226)
Doctors of the Coast South (n=256)
Douglas County IPA (n=251)
Family Care (n=186)
FFS/PCCM (Medicaid) (n=193)
Intercommunity Health Network (n=247)
Kaiser Permanente Oregon Plus (n=201)
Lane IPA (n=233)
Marion-Polk Community Health Plan (n=222)
Mid-Rogue IPA (n=226)
ODS Community Health (n=210)
Oregon Health Management Services (n=185)
Providence Health Plan (n=192)
2008 CAHPS-HP 4.0 Child Medicaid Sponsor Report B-13
This chart displays the data for "Getting Care Quickly for Children", an aggregate of survey questions 4 and 6. Results for the individual questions are displayed on each of the following pages.
NOTE: The results shown above are case mix adjusted. Small percentage differences may represent measurement (sampling) error rather than actual differencesin health plan performance. Response distributions may not sum to 100 percent due to rounding. See the methodology section for more information about thescoring and case-mix methodology.
AlwaysNever + Sometimes Usually
15%
13%
15%
13%
18%
13%
16%
8%
17%
17%
12%
14%
17%
12%
11%
10%
13%
10%
11%
17%
21%
17%
21%
23%
17%
23%
22%
21%
20%
22%
21%
22%
20%
23%
20%
23%
17%
19%
69%
66%
69%
66%
59%
70%
61%
70%
63%
63%
66%
65%
61%
68%
66%
70%
64%
73%
70%
0% 20% 40% 60% 80% 100%
= Above the mean value of all sponsor or plan means (p < 0.05)
= Below the mean value of all sponsor or plan means (p < 0.05)

Oregon Department of Human Services
Getting Care Quickly for Children
Child Medicaid (n=6667)
West Regional (n=3545)
HMO/POS/PPO (n=6667)
PCCM NA
Sponsor (n=3545)
Tuality Health Alliance (n=244)
2008 CAHPS-HP 4.0 Child Medicaid Sponsor Report B-14
This chart displays the data for "Getting Care Quickly for Children", an aggregate of survey questions 4 and 6. Results for the individual questions are displayed on each of the following pages.
NOTE: The results shown above are case mix adjusted. Small percentage differences may represent measurement (sampling) error rather than actual differencesin health plan performance. Response distributions may not sum to 100 percent due to rounding. See the methodology section for more information about thescoring and case-mix methodology.
AlwaysNever + Sometimes Usually
15%
13%
15%
13%
9%
17%
21%
17%
21%
19%
69%
66%
69%
66%
72%
0% 20% 40% 60% 80% 100%
= Above the mean value of all sponsor or plan means (p < 0.05)
= Below the mean value of all sponsor or plan means (p < 0.05)

Oregon Department of Human Services
Child Medicaid (n=3024)
West Regional (n=1512)
HMO/POS/PPO (n=3024)
PCCM NA
Sponsor (n=1512)
Care Oregon (n=87)
Cascade Comprehensive Care (n=94)
Central Oregon Ind Health Services (n=106)
Doctors of the Coast South (n=130)
Douglas County IPA (n=121)
Family Care (n=86)
FFS/PCCM (Medicaid) (n=70)
Intercommunity Health Network (n=99)
Kaiser Permanente Oregon Plus (n=86)
Lane IPA (n=88)
Marion-Polk Community Health Plan (n=92)
Mid-Rogue IPA (n=99)
ODS Community Health (n=89)
Oregon Health Management Services (n=79)
Providence Health Plan (n=95)
2008 CAHPS-HP 4.0 Child Medicaid Sponsor Report B-15
Q4. Of those respondents whose child had an illness, injury or condition that needed care right away: "In the last 6 months, when your child needed care right away, how often did your child get care as soon as you thought he or she needed?”
NOTE: The results shown above are case mix adjusted. Small percentage differences may represent measurement (sampling) error rather than actual differencesin health plan performance. Response distributions may not sum to 100 percent due to rounding. See the methodology section for more information about thescoring and case-mix methodology.
AlwaysNever + Sometimes Usually
13%
12%
13%
12%
15%
13%
13%
8%
14%
19%
9%
14%
15%
14%
10%
10%
13%
9%
8%
15%
19%
15%
19%
24%
16%
25%
21%
18%
10%
24%
16%
16%
16%
24%
20%
19%
13%
18%
72%
69%
72%
69%
61%
71%
62%
72%
68%
71%
67%
70%
69%
70%
66%
70%
67%
78%
74%
0% 20% 40% 60% 80% 100%
= Above the mean value of all sponsor or plan means (p < 0.05)
= Below the mean value of all sponsor or plan means (p < 0.05)

Oregon Department of Human Services
Child Medicaid (n=3024)
West Regional (n=1512)
HMO/POS/PPO (n=3024)
PCCM NA
Sponsor (n=1512)
Tuality Health Alliance (n=91)
2008 CAHPS-HP 4.0 Child Medicaid Sponsor Report B-16
Q4. Of those respondents whose child had an illness, injury or condition that needed care right away: "In the last 6 months, when your child needed care right away, how often did your child get care as soon as you thought he or she needed?”
NOTE: The results shown above are case mix adjusted. Small percentage differences may represent measurement (sampling) error rather than actual differencesin health plan performance. Response distributions may not sum to 100 percent due to rounding. See the methodology section for more information about thescoring and case-mix methodology.
AlwaysNever + Sometimes Usually
13%
12%
13%
12%
8%
15%
19%
15%
19%
16%
72%
69%
72%
69%
76%
0% 20% 40% 60% 80% 100%
= Above the mean value of all sponsor or plan means (p < 0.05)
= Below the mean value of all sponsor or plan means (p < 0.05)

Oregon Department of Human Services
Child Medicaid (n=6138)
West Regional (n=3242)
HMO/POS/PPO (n=6138)
PCCM NA
Sponsor (n=3242)
Care Oregon (n=209)
Cascade Comprehensive Care (n=224)
Central Oregon Ind Health Services (n=202)
Doctors of the Coast South (n=240)
Douglas County IPA (n=226)
Family Care (n=166)
FFS/PCCM (Medicaid) (n=179)
Intercommunity Health Network (n=228)
Kaiser Permanente Oregon Plus (n=182)
Lane IPA (n=214)
Marion-Polk Community Health Plan (n=207)
Mid-Rogue IPA (n=208)
ODS Community Health (n=187)
Oregon Health Management Services (n=164)
Providence Health Plan (n=177)
2008 CAHPS-HP 4.0 Child Medicaid Sponsor Report B-17
Q6. Of those respondents who made appointment at doctor's office or clinic: "In the last 6 months, not counting the times your child needed care right away, how often did you get an appointment for health care as soon as you thought your child needed?"
NOTE: The results shown above are case mix adjusted. Small percentage differences may represent measurement (sampling) error rather than actual differencesin health plan performance. Response distributions may not sum to 100 percent due to rounding. See the methodology section for more information about thescoring and case-mix methodology.
AlwaysNever + Sometimes Usually
17%
14%
17%
14%
21%
13%
19%
8%
19%
16%
15%
14%
19%
11%
13%
9%
13%
12%
14%
18%
23%
18%
23%
22%
18%
21%
23%
23%
29%
20%
25%
27%
23%
22%
20%
27%
21%
20%
65%
63%
65%
63%
56%
69%
59%
68%
58%
55%
65%
61%
53%
65%
66%
71%
60%
67%
66%
0% 20% 40% 60% 80% 100%
= Above the mean value of all sponsor or plan means (p < 0.05)
= Below the mean value of all sponsor or plan means (p < 0.05)

Oregon Department of Human Services
Child Medicaid (n=6138)
West Regional (n=3242)
HMO/POS/PPO (n=6138)
PCCM NA
Sponsor (n=3242)
Tuality Health Alliance (n=229)
2008 CAHPS-HP 4.0 Child Medicaid Sponsor Report B-18
Q6. Of those respondents who made appointment at doctor's office or clinic: "In the last 6 months, not counting the times your child needed care right away, how often did you get an appointment for health care as soon as you thought your child needed?"
NOTE: The results shown above are case mix adjusted. Small percentage differences may represent measurement (sampling) error rather than actual differencesin health plan performance. Response distributions may not sum to 100 percent due to rounding. See the methodology section for more information about thescoring and case-mix methodology.
AlwaysNever + Sometimes Usually
17%
14%
17%
14%
10%
18%
23%
18%
23%
21%
65%
63%
65%
63%
69%
0% 20% 40% 60% 80% 100%
= Above the mean value of all sponsor or plan means (p < 0.05)
= Below the mean value of all sponsor or plan means (p < 0.05)

Oregon Department of Human Services
How Well Doctors Communicate
Child Medicaid (n=6438)
West Regional (n=3309)
HMO/POS/PPO (n=6438)
PCCM NA
Sponsor (n=3309)
Care Oregon (n=187)
Cascade Comprehensive Care (n=218)
Central Oregon Ind Health Services (n=195)
Doctors of the Coast South (n=245)
Douglas County IPA (n=226)
Family Care (n=159)
FFS/PCCM (Medicaid) (n=178)
Intercommunity Health Network (n=240)
Kaiser Permanente Oregon Plus (n=193)
Lane IPA (n=235)
Marion-Polk Community Health Plan (n=204)
Mid-Rogue IPA (n=219)
ODS Community Health (n=201)
Oregon Health Management Services (n=162)
Providence Health Plan (n=189)
2008 CAHPS-HP 4.0 Child Medicaid Sponsor Report B-19
This chart displays the data for "How Well Doctors Communicate", an aggregate of survey questions 29, 30, 31, 33 and 34. Results for the individual questions are displayed on each of the following pages.
NOTE: The results shown above are case mix adjusted. Small percentage differences may represent measurement (sampling) error rather than actual differencesin health plan performance. Response distributions may not sum to 100 percent due to rounding. See the methodology section for more information about thescoring and case-mix methodology.
AlwaysNever + Sometimes Usually
10%
9%
10%
9%
11%
9%
6%
9%
8%
11%
7%
11%
8%
9%
9%
7%
11%
7%
11%
16%
20%
16%
20%
18%
22%
23%
20%
19%
21%
20%
21%
16%
20%
17%
14%
24%
21%
17%
75%
72%
75%
72%
72%
69%
71%
71%
72%
69%
73%
68%
76%
70%
74%
79%
66%
73%
72%
0% 20% 40% 60% 80% 100%
= Above the mean value of all sponsor or plan means (p < 0.05)
= Below the mean value of all sponsor or plan means (p < 0.05)

Oregon Department of Human Services
How Well Doctors Communicate
Child Medicaid (n=6438)
West Regional (n=3309)
HMO/POS/PPO (n=6438)
PCCM NA
Sponsor (n=3309)
Tuality Health Alliance (n=258)
2008 CAHPS-HP 4.0 Child Medicaid Sponsor Report B-20
This chart displays the data for "How Well Doctors Communicate", an aggregate of survey questions 29, 30, 31, 33 and 34. Results for the individual questions are displayed on each of the following pages.
NOTE: The results shown above are case mix adjusted. Small percentage differences may represent measurement (sampling) error rather than actual differencesin health plan performance. Response distributions may not sum to 100 percent due to rounding. See the methodology section for more information about thescoring and case-mix methodology.
AlwaysNever + Sometimes Usually
10%
9%
10%
9%
9%
16%
20%
16%
20%
19%
75%
72%
75%
72%
73%
0% 20% 40% 60% 80% 100%
= Above the mean value of all sponsor or plan means (p < 0.05)
= Below the mean value of all sponsor or plan means (p < 0.05)

Oregon Department of Human Services
Child Medicaid (n=6396)
West Regional (n=3294)
HMO/POS/PPO (n=6396)
PCCM NA
Sponsor (n=3294)
Care Oregon (n=187)
Cascade Comprehensive Care (n=218)
Central Oregon Ind Health Services (n=194)
Doctors of the Coast South (n=244)
Douglas County IPA (n=226)
Family Care (n=159)
FFS/PCCM (Medicaid) (n=176)
Intercommunity Health Network (n=239)
Kaiser Permanente Oregon Plus (n=191)
Lane IPA (n=234)
Marion-Polk Community Health Plan (n=201)
Mid-Rogue IPA (n=219)
ODS Community Health (n=201)
Oregon Health Management Services (n=161)
Providence Health Plan (n=187)
2008 CAHPS-HP 4.0 Child Medicaid Sponsor Report B-21
Q29. Of those respondents whose child had a personal doctor: "In the last 6 months, how often did your child’s personal doctor explain things in a way that was easy to understand?”
NOTE: The results shown above are case mix adjusted. Small percentage differences may represent measurement (sampling) error rather than actual differencesin health plan performance. Response distributions may not sum to 100 percent due to rounding. See the methodology section for more information about thescoring and case-mix methodology.
AlwaysNever + Sometimes Usually
7%
7%
7%
7%
9%
7%
5%
7%
7%
8%
6%
8%
5%
6%
6%
5%
9%
10%
14%
17%
14%
17%
16%
20%
20%
18%
17%
19%
15%
21%
15%
16%
17%
14%
20%
19%
13%
78%
76%
78%
76%
75%
73%
76%
74%
77%
73%
79%
71%
81%
78%
77%
81%
71%
77%
76%
0% 20% 40% 60% 80% 100%
= Above the mean value of all sponsor or plan means (p < 0.05)
= Below the mean value of all sponsor or plan means (p < 0.05)

Oregon Department of Human Services
Child Medicaid (n=6396)
West Regional (n=3294)
HMO/POS/PPO (n=6396)
PCCM NA
Sponsor (n=3294)
Tuality Health Alliance (n=257)
2008 CAHPS-HP 4.0 Child Medicaid Sponsor Report B-22
Q29. Of those respondents whose child had a personal doctor: "In the last 6 months, how often did your child’s personal doctor explain things in a way that was easy to understand?”
NOTE: The results shown above are case mix adjusted. Small percentage differences may represent measurement (sampling) error rather than actual differencesin health plan performance. Response distributions may not sum to 100 percent due to rounding. See the methodology section for more information about thescoring and case-mix methodology.
AlwaysNever + Sometimes Usually
7%
7%
7%
7%
6%
14%
17%
14%
17%
18%
78%
76%
78%
76%
76%
0% 20% 40% 60% 80% 100%
= Above the mean value of all sponsor or plan means (p < 0.05)
= Below the mean value of all sponsor or plan means (p < 0.05)

Oregon Department of Human Services
Child Medicaid (n=6407)
West Regional (n=3291)
HMO/POS/PPO (n=6407)
PCCM NA
Sponsor (n=3291)
Care Oregon (n=185)
Cascade Comprehensive Care (n=216)
Central Oregon Ind Health Services (n=194)
Doctors of the Coast South (n=244)
Douglas County IPA (n=225)
Family Care (n=156)
FFS/PCCM (Medicaid) (n=177)
Intercommunity Health Network (n=240)
Kaiser Permanente Oregon Plus (n=192)
Lane IPA (n=233)
Marion-Polk Community Health Plan (n=203)
Mid-Rogue IPA (n=218)
ODS Community Health (n=201)
Oregon Health Management Services (n=162)
Providence Health Plan (n=187)
2008 CAHPS-HP 4.0 Child Medicaid Sponsor Report B-23
Q30. Of those respondents whose child had a personal doctor: "In the last 6 months, how often did your child’s personal doctor listen carefully to you?”
NOTE: The results shown above are case mix adjusted. Small percentage differences may represent measurement (sampling) error rather than actual differencesin health plan performance. Response distributions may not sum to 100 percent due to rounding. See the methodology section for more information about thescoring and case-mix methodology.
AlwaysNever + Sometimes Usually
7%
7%
7%
7%
9%
7%
8%
9%
9%
6%
10%
6%
9%
7%
6%
6%
6%
14%
17%
14%
17%
16%
21%
19%
18%
16%
19%
16%
21%
13%
18%
16%
11%
19%
21%
18%
79%
76%
79%
76%
76%
72%
77%
75%
74%
72%
79%
69%
81%
73%
81%
82%
75%
73%
75%
0% 20% 40% 60% 80% 100%
= Above the mean value of all sponsor or plan means (p < 0.05)
= Below the mean value of all sponsor or plan means (p < 0.05)

Oregon Department of Human Services
Child Medicaid (n=6407)
West Regional (n=3291)
HMO/POS/PPO (n=6407)
PCCM NA
Sponsor (n=3291)
Tuality Health Alliance (n=258)
2008 CAHPS-HP 4.0 Child Medicaid Sponsor Report B-24
Q30. Of those respondents whose child had a personal doctor: "In the last 6 months, how often did your child’s personal doctor listen carefully to you?”
NOTE: The results shown above are case mix adjusted. Small percentage differences may represent measurement (sampling) error rather than actual differencesin health plan performance. Response distributions may not sum to 100 percent due to rounding. See the methodology section for more information about thescoring and case-mix methodology.
AlwaysNever + Sometimes Usually
7%
7%
7%
7%
5%
14%
17%
14%
17%
16%
79%
76%
79%
76%
79%
0% 20% 40% 60% 80% 100%
= Above the mean value of all sponsor or plan means (p < 0.05)
= Below the mean value of all sponsor or plan means (p < 0.05)

Oregon Department of Human Services
Child Medicaid (n=6420)
West Regional (n=3299)
HMO/POS/PPO (n=6420)
PCCM NA
Sponsor (n=3299)
Care Oregon (n=187)
Cascade Comprehensive Care (n=217)
Central Oregon Ind Health Services (n=195)
Doctors of the Coast South (n=244)
Douglas County IPA (n=226)
Family Care (n=159)
FFS/PCCM (Medicaid) (n=175)
Intercommunity Health Network (n=240)
Kaiser Permanente Oregon Plus (n=192)
Lane IPA (n=234)
Marion-Polk Community Health Plan (n=204)
Mid-Rogue IPA (n=219)
ODS Community Health (n=201)
Oregon Health Management Services (n=161)
Providence Health Plan (n=188)
2008 CAHPS-HP 4.0 Child Medicaid Sponsor Report B-25
Q31. Of those respondents whose child had a personal doctor: "In the last 6 months, how often did your child’s personal doctor show respect for what you had to say?”
NOTE: The results shown above are case mix adjusted. Small percentage differences may represent measurement (sampling) error rather than actual differencesin health plan performance. Response distributions may not sum to 100 percent due to rounding. See the methodology section for more information about thescoring and case-mix methodology.
AlwaysNever + Sometimes Usually
6%
6%
6%
6%
7%
7%
9%
7%
8%
8%
5%
8%
5%
7%
7%
11%
14%
11%
14%
13%
17%
17%
12%
15%
15%
13%
17%
11%
16%
8%
11%
18%
16%
12%
83%
80%
83%
80%
80%
76%
79%
79%
78%
77%
83%
76%
84%
76%
88%
84%
78%
77%
80%
0% 20% 40% 60% 80% 100%
= Above the mean value of all sponsor or plan means (p < 0.05)
= Below the mean value of all sponsor or plan means (p < 0.05)

Oregon Department of Human Services
Child Medicaid (n=6420)
West Regional (n=3299)
HMO/POS/PPO (n=6420)
PCCM NA
Sponsor (n=3299)
Tuality Health Alliance (n=257)
2008 CAHPS-HP 4.0 Child Medicaid Sponsor Report B-26
Q31. Of those respondents whose child had a personal doctor: "In the last 6 months, how often did your child’s personal doctor show respect for what you had to say?”
NOTE: The results shown above are case mix adjusted. Small percentage differences may represent measurement (sampling) error rather than actual differencesin health plan performance. Response distributions may not sum to 100 percent due to rounding. See the methodology section for more information about thescoring and case-mix methodology.
AlwaysNever + Sometimes Usually
6%
6%
6%
6%
5%
11%
14%
11%
14%
12%
83%
80%
83%
80%
82%
0% 20% 40% 60% 80% 100%
= Above the mean value of all sponsor or plan means (p < 0.05)
= Below the mean value of all sponsor or plan means (p < 0.05)

Oregon Department of Human Services
Child Medicaid (n=4037)
West Regional (n=2025)
HMO/POS/PPO (n=4037)
PCCM NA
Sponsor (n=2025)
Care Oregon (n=109)
Cascade Comprehensive Care (n=136)
Central Oregon Ind Health Services (n=117)
Doctors of the Coast South (n=162)
Douglas County IPA (n=144)
Family Care (n=87)
FFS/PCCM (Medicaid) (n=116)
Intercommunity Health Network (n=139)
Kaiser Permanente Oregon Plus (n=109)
Lane IPA (n=160)
Marion-Polk Community Health Plan (n=130)
Mid-Rogue IPA (n=137)
ODS Community Health (n=120)
Oregon Health Management Services (n=103)
Providence Health Plan (n=103)
2008 CAHPS-HP 4.0 Child Medicaid Sponsor Report B-27
Q33. Of those respondents whose child was able to talk with doctors about his or her health care: "In the last 6 months, how often did your child’s personal doctor explain things in a way that was easy for your child to understand?”
NOTE: The results shown above are case mix adjusted. Small percentage differences may represent measurement (sampling) error rather than actual differencesin health plan performance. Response distributions may not sum to 100 percent due to rounding. See the methodology section for more information about thescoring and case-mix methodology.
AlwaysNever + Sometimes Usually
11%
10%
11%
10%
11%
10%
9%
12%
5%
11%
8%
13%
10%
10%
15%
9%
13%
7%
17%
19%
23%
19%
23%
18%
27%
30%
26%
24%
24%
28%
24%
21%
26%
16%
14%
27%
19%
18%
70%
67%
70%
67%
71%
63%
62%
62%
71%
64%
65%
63%
69%
64%
68%
77%
61%
74%
65%
0% 20% 40% 60% 80% 100%
= Above the mean value of all sponsor or plan means (p < 0.05)
= Below the mean value of all sponsor or plan means (p < 0.05)

Oregon Department of Human Services
Child Medicaid (n=4037)
West Regional (n=2025)
HMO/POS/PPO (n=4037)
PCCM NA
Sponsor (n=2025)
Tuality Health Alliance (n=153)
2008 CAHPS-HP 4.0 Child Medicaid Sponsor Report B-28
Q33. Of those respondents whose child was able to talk with doctors about his or her health care: "In the last 6 months, how often did your child’s personal doctor explain things in a way that was easy for your child to understand?”
NOTE: The results shown above are case mix adjusted. Small percentage differences may represent measurement (sampling) error rather than actual differencesin health plan performance. Response distributions may not sum to 100 percent due to rounding. See the methodology section for more information about thescoring and case-mix methodology.
AlwaysNever + Sometimes Usually
11%
10%
11%
10%
8%
19%
23%
19%
23%
20%
70%
67%
70%
67%
72%
0% 20% 40% 60% 80% 100%
= Above the mean value of all sponsor or plan means (p < 0.05)
= Below the mean value of all sponsor or plan means (p < 0.05)

Oregon Department of Human Services
Child Medicaid (n=6353)
West Regional (n=3265)
HMO/POS/PPO (n=6353)
PCCM NA
Sponsor (n=3265)
Care Oregon (n=183)
Cascade Comprehensive Care (n=216)
Central Oregon Ind Health Services (n=194)
Doctors of the Coast South (n=245)
Douglas County IPA (n=223)
Family Care (n=158)
FFS/PCCM (Medicaid) (n=175)
Intercommunity Health Network (n=238)
Kaiser Permanente Oregon Plus (n=186)
Lane IPA (n=234)
Marion-Polk Community Health Plan (n=198)
Mid-Rogue IPA (n=217)
ODS Community Health (n=199)
Oregon Health Management Services (n=162)
Providence Health Plan (n=184)
2008 CAHPS-HP 4.0 Child Medicaid Sponsor Report B-29
Q34. Of those respondents whose child had a personal doctor: “In the last 6 months, how often did your child’s personal doctor spend enough time with your child?”
NOTE: The results shown above are case mix adjusted. Small percentage differences may represent measurement (sampling) error rather than actual differencesin health plan performance. Response distributions may not sum to 100 percent due to rounding. See the methodology section for more information about thescoring and case-mix methodology.
AlwaysNever + Sometimes Usually
15%
14%
15%
14%
18%
14%
10%
11%
14%
16%
11%
16%
15%
14%
17%
10%
21%
9%
15%
22%
26%
22%
26%
26%
27%
29%
26%
25%
26%
30%
24%
21%
26%
27%
19%
34%
28%
25%
63%
59%
63%
59%
56%
59%
61%
63%
61%
58%
59%
61%
65%
59%
56%
71%
46%
62%
60%
0% 20% 40% 60% 80% 100%
= Above the mean value of all sponsor or plan means (p < 0.05)
= Below the mean value of all sponsor or plan means (p < 0.05)

Oregon Department of Human Services
Child Medicaid (n=6353)
West Regional (n=3265)
HMO/POS/PPO (n=6353)
PCCM NA
Sponsor (n=3265)
Tuality Health Alliance (n=253)
2008 CAHPS-HP 4.0 Child Medicaid Sponsor Report B-30
Q34. Of those respondents whose child had a personal doctor: “In the last 6 months, how often did your child’s personal doctor spend enough time with your child?”
NOTE: The results shown above are case mix adjusted. Small percentage differences may represent measurement (sampling) error rather than actual differencesin health plan performance. Response distributions may not sum to 100 percent due to rounding. See the methodology section for more information about thescoring and case-mix methodology.
AlwaysNever + Sometimes Usually
15%
14%
15%
14%
19%
22%
26%
22%
26%
27%
63%
59%
63%
59%
54%
0% 20% 40% 60% 80% 100%
= Above the mean value of all sponsor or plan means (p < 0.05)
= Below the mean value of all sponsor or plan means (p < 0.05)

Oregon Department of Human Services
Health Plan Information and Customer Service
Child Medicaid (n=2022)
West Regional (n=698)
HMO/POS/PPO (n=2022)
PCCM NA
Sponsor (n=698)
Care Oregon (n=40)
Cascade Comprehensive Care (n=36)
Central Oregon Ind Health Services (n=49)
Doctors of the Coast South (n=35)
Douglas County IPA (n=58)
Family Care (n=37)
FFS/PCCM (Medicaid) (n=33)
Intercommunity Health Network (n=49)
Kaiser Permanente Oregon Plus (n=50)
Lane IPA (n=45)
Marion-Polk Community Health Plan (n=49)
Mid-Rogue IPA (n=33)
ODS Community Health (n=41)
Oregon Health Management Services (n=32)
Providence Health Plan (n=47)
2008 CAHPS-HP 4.0 Child Medicaid Sponsor Report B-31
This chart displays the data for "Health Plan Information & Customer Service", an aggregate of survey questions 47 and 48. Results for the individual questions are displayed on each of the following pages.
NOTE: The results shown above are case mix adjusted. Small percentage differences may represent measurement (sampling) error rather than actual differencesin health plan performance. Response distributions may not sum to 100 percent due to rounding. See the methodology section for more information about thescoring and case-mix methodology.
AlwaysNever + Sometimes Usually
23%
25%
23%
25%
42%
22%
19%
23%
19%
14%
34%
32%
24%
25%
30%
17%
33%
8%
26%
18%
24%
18%
24%
19%
24%
29%
34%
30%
26%
27%
23%
15%
26%
20%
26%
22%
29%
20%
58%
51%
58%
51%
39%
54%
52%
43%
51%
61%
39%
45%
61%
49%
51%
58%
45%
63%
54%
0% 20% 40% 60% 80% 100%
= Above the mean value of all sponsor or plan means (p < 0.05)
= Below the mean value of all sponsor or plan means (p < 0.05)

Oregon Department of Human Services
Health Plan Information and Customer Service
Child Medicaid (n=2022)
West Regional (n=698)
HMO/POS/PPO (n=2022)
PCCM NA
Sponsor (n=698)
Tuality Health Alliance (n=64)
2008 CAHPS-HP 4.0 Child Medicaid Sponsor Report B-32
This chart displays the data for "Health Plan Information & Customer Service", an aggregate of survey questions 47 and 48. Results for the individual questions are displayed on each of the following pages.
NOTE: The results shown above are case mix adjusted. Small percentage differences may represent measurement (sampling) error rather than actual differencesin health plan performance. Response distributions may not sum to 100 percent due to rounding. See the methodology section for more information about thescoring and case-mix methodology.
AlwaysNever + Sometimes Usually
23%
25%
23%
25%
24%
18%
24%
18%
24%
24%
58%
51%
58%
51%
52%
0% 20% 40% 60% 80% 100%
= Above the mean value of all sponsor or plan means (p < 0.05)
= Below the mean value of all sponsor or plan means (p < 0.05)

Oregon Department of Human Services
Child Medicaid (n=2008)
West Regional (n=692)
HMO/POS/PPO (n=2008)
PCCM NA
Sponsor (n=692)
Care Oregon (n=40)
Cascade Comprehensive Care (n=36)
Central Oregon Ind Health Services (n=49)
Doctors of the Coast South (n=35)
Douglas County IPA (n=58)
Family Care (n=37)
FFS/PCCM (Medicaid) (n=32)
Intercommunity Health Network (n=49)
Kaiser Permanente Oregon Plus (n=49)
Lane IPA (n=44)
Marion-Polk Community Health Plan (n=49)
Mid-Rogue IPA (n=33)
ODS Community Health (n=41)
Oregon Health Management Services (n=31)
Providence Health Plan (n=46)
2008 CAHPS-HP 4.0 Child Medicaid Sponsor Report B-33
Q47. Of those respondents who tried to get information or help from their child’s health plan’s customer service: "In the last 6 months, how often did customer service at your child’s health plan give you the information or help you needed?”
NOTE: The results shown above are case mix adjusted. Small percentage differences may represent measurement (sampling) error rather than actual differencesin health plan performance. Response distributions may not sum to 100 percent due to rounding. See the methodology section for more information about thescoring and case-mix methodology.
AlwaysNever + Sometimes Usually
31%
33%
31%
33%
50%
33%
31%
37%
26%
19%
47%
43%
33%
30%
43%
18%
41%
16%
33%
19%
22%
19%
22%
13%
22%
20%
31%
29%
30%
22%
16%
10%
30%
16%
27%
20%
29%
22%
50%
45%
50%
45%
38%
44%
49%
31%
45%
51%
31%
41%
57%
41%
41%
55%
39%
55%
46%
0% 20% 40% 60% 80% 100%
= Above the mean value of all sponsor or plan means (p < 0.05)
= Below the mean value of all sponsor or plan means (p < 0.05)

Oregon Department of Human Services
Child Medicaid (n=2008)
West Regional (n=692)
HMO/POS/PPO (n=2008)
PCCM NA
Sponsor (n=692)
Tuality Health Alliance (n=63)
2008 CAHPS-HP 4.0 Child Medicaid Sponsor Report B-34
Q47. Of those respondents who tried to get information or help from their child’s health plan’s customer service: "In the last 6 months, how often did customer service at your child’s health plan give you the information or help you needed?”
NOTE: The results shown above are case mix adjusted. Small percentage differences may represent measurement (sampling) error rather than actual differencesin health plan performance. Response distributions may not sum to 100 percent due to rounding. See the methodology section for more information about thescoring and case-mix methodology.
AlwaysNever + Sometimes Usually
31%
33%
31%
33%
32%
19%
22%
19%
22%
17%
50%
45%
50%
45%
51%
0% 20% 40% 60% 80% 100%
= Above the mean value of all sponsor or plan means (p < 0.05)
= Below the mean value of all sponsor or plan means (p < 0.05)

Oregon Department of Human Services
Child Medicaid (n=2004)
West Regional (n=690)
HMO/POS/PPO (n=2004)
PCCM NA
Sponsor (n=690)
Care Oregon (n=39)
Cascade Comprehensive Care (n=35)
Central Oregon Ind Health Services (n=48)
Doctors of the Coast South (n=35)
Douglas County IPA (n=57)
Family Care (n=37)
FFS/PCCM (Medicaid) (n=32)
Intercommunity Health Network (n=49)
Kaiser Permanente Oregon Plus (n=50)
Lane IPA (n=45)
Marion-Polk Community Health Plan (n=48)
Mid-Rogue IPA (n=33)
ODS Community Health (n=41)
Oregon Health Management Services (n=32)
Providence Health Plan (n=46)
2008 CAHPS-HP 4.0 Child Medicaid Sponsor Report B-35
Q48. Of those respondents who tried to get information or help from their child’s health plan’s customer service: “In the last 6 months, how often did customer service staff at your child’s health plan treat you with courtesy and respect?”
NOTE: The results shown above are case mix adjusted. Small percentage differences may represent measurement (sampling) error rather than actual differencesin health plan performance. Response distributions may not sum to 100 percent due to rounding. See the methodology section for more information about thescoring and case-mix methodology.
AlwaysNever + Sometimes Usually
15%
16%
15%
16%
33%
11%
8%
9%
12%
8%
22%
20%
16%
20%
17%
15%
24%
20%
18%
27%
18%
27%
26%
26%
38%
37%
30%
22%
31%
31%
20%
22%
23%
24%
24%
28%
17%
67%
57%
67%
57%
41%
63%
54%
54%
58%
70%
47%
49%
64%
58%
60%
61%
51%
72%
63%
0% 20% 40% 60% 80% 100%
= Above the mean value of all sponsor or plan means (p < 0.05)
= Below the mean value of all sponsor or plan means (p < 0.05)

Oregon Department of Human Services
Child Medicaid (n=2004)
West Regional (n=690)
HMO/POS/PPO (n=2004)
PCCM NA
Sponsor (n=690)
Tuality Health Alliance (n=63)
2008 CAHPS-HP 4.0 Child Medicaid Sponsor Report B-36
Q48. Of those respondents who tried to get information or help from their child’s health plan’s customer service: “In the last 6 months, how often did customer service staff at your child’s health plan treat you with courtesy and respect?”
NOTE: The results shown above are case mix adjusted. Small percentage differences may represent measurement (sampling) error rather than actual differencesin health plan performance. Response distributions may not sum to 100 percent due to rounding. See the methodology section for more information about thescoring and case-mix methodology.
AlwaysNever + Sometimes Usually
15%
16%
15%
16%
16%
18%
27%
18%
27%
30%
67%
57%
67%
57%
54%
0% 20% 40% 60% 80% 100%
= Above the mean value of all sponsor or plan means (p < 0.05)
= Below the mean value of all sponsor or plan means (p < 0.05)

Oregon Department of Human Services
Overall Rating of Child’s Personal Doctor
Child Medicaid (n=8256)
West Regional (n=4549)
HMO/POS/PPO (n=8256)
PCCM NA
Sponsor (n=4549)
Care Oregon (n=261)
Cascade Comprehensive Care (n=299)
Central Oregon Ind Health Services (n=279)
Doctors of the Coast South (n=332)
Douglas County IPA (n=320)
Family Care (n=218)
FFS/PCCM (Medicaid) (n=225)
Intercommunity Health Network (n=332)
Kaiser Permanente Oregon Plus (n=253)
Lane IPA (n=329)
Marion-Polk Community Health Plan (n=320)
Mid-Rogue IPA (n=298)
ODS Community Health (n=266)
Oregon Health Management Services (n=232)
Providence Health Plan (n=246)
2008 CAHPS-HP 4.0 Child Medicaid Sponsor Report B-37
Q36. Of those respondents whose child had a personal doctor: "Using any number from 0 to 10, where 0 is the worst personal doctor possible, and 10 is the best, what number would you use to rate your child's personal doctor?"
NOTE: The results shown above are case mix adjusted. Small percentage differences may represent measurement (sampling) error rather than actual differencesin health plan performance. Response distributions may not sum to 100 percent due to rounding. See the methodology section for more information about thescoring and case-mix methodology.
9-100-6 7-8
9%
9%
9%
9%
8%
9%
8%
11%
15%
12%
8%
10%
5%
12%
8%
10%
6%
10%
8%
22%
22%
22%
22%
21%
25%
26%
23%
23%
25%
25%
21%
19%
19%
23%
21%
20%
25%
22%
70%
68%
70%
68%
71%
66%
66%
66%
62%
62%
66%
69%
77%
69%
70%
69%
74%
65%
70%
0% 20% 40% 60% 80% 100%
= Above the mean value of all sponsor or plan means (p < 0.05)
= Below the mean value of all sponsor or plan means (p < 0.05)

Oregon Department of Human Services
Overall Rating of Child’s Personal Doctor
Child Medicaid (n=8256)
West Regional (n=4549)
HMO/POS/PPO (n=8256)
PCCM NA
Sponsor (n=4549)
Tuality Health Alliance (n=339)
2008 CAHPS-HP 4.0 Child Medicaid Sponsor Report B-38
Q36. Of those respondents whose child had a personal doctor: "Using any number from 0 to 10, where 0 is the worst personal doctor possible, and 10 is the best, what number would you use to rate your child's personal doctor?"
NOTE: The results shown above are case mix adjusted. Small percentage differences may represent measurement (sampling) error rather than actual differencesin health plan performance. Response distributions may not sum to 100 percent due to rounding. See the methodology section for more information about thescoring and case-mix methodology.
9-100-6 7-8
9%
9%
9%
9%
7%
22%
22%
22%
22%
22%
70%
68%
70%
68%
72%
0% 20% 40% 60% 80% 100%
= Above the mean value of all sponsor or plan means (p < 0.05)
= Below the mean value of all sponsor or plan means (p < 0.05)

Oregon Department of Human Services
Overall Rating of Child’s Specialists
Child Medicaid (n=1597)
West Regional (n=697)
HMO/POS/PPO (n=1597)
PCCM NA
Sponsor (n=697)
Care Oregon (n=31)
Cascade Comprehensive Care (n=44)
Central Oregon Ind Health Services (n=48)
Doctors of the Coast South (n=54)
Douglas County IPA (n=40)
Family Care (n=36)
FFS/PCCM (Medicaid) (n=41)
Intercommunity Health Network (n=47)
Kaiser Permanente Oregon Plus (n=50)
Lane IPA (n=44)
Marion-Polk Community Health Plan (n=39)
Mid-Rogue IPA (n=44)
ODS Community Health (n=35)
Oregon Health Management Services (n=36)
Providence Health Plan (n=45)
2008 CAHPS-HP 4.0 Child Medicaid Sponsor Report B-39
Q43. Of those respondents who reported their child seeing a specialist: "Using any number from 0 to 10, where 0 is the worst specialist possible, and 10 is the best personal specialist possible, what number would you use to rate your child's specialist?"
NOTE: The results shown above are case mix adjusted. Small percentage differences may represent measurement (sampling) error rather than actual differencesin health plan performance. Response distributions may not sum to 100 percent due to rounding. See the methodology section for more information about thescoring and case-mix methodology.
9-100-6 7-8
13%
12%
13%
12%
16%
7%
8%
19%
5%
11%
7%
17%
6%
16%
18%
11%
23%
8%
16%
23%
23%
23%
23%
26%
25%
21%
20%
20%
19%
27%
21%
28%
20%
28%
27%
11%
31%
18%
64%
65%
64%
65%
58%
68%
71%
61%
75%
69%
66%
62%
66%
64%
54%
61%
66%
61%
67%
0% 20% 40% 60% 80% 100%
= Above the mean value of all sponsor or plan means (p < 0.05)
= Below the mean value of all sponsor or plan means (p < 0.05)

Oregon Department of Human Services
Overall Rating of Child’s Specialists
Child Medicaid (n=1597)
West Regional (n=697)
HMO/POS/PPO (n=1597)
PCCM NA
Sponsor (n=697)
Tuality Health Alliance (n=63)
2008 CAHPS-HP 4.0 Child Medicaid Sponsor Report B-40
Q43. Of those respondents who reported their child seeing a specialist: "Using any number from 0 to 10, where 0 is the worst specialist possible, and 10 is the best personal specialist possible, what number would you use to rate your child's specialist?"
NOTE: The results shown above are case mix adjusted. Small percentage differences may represent measurement (sampling) error rather than actual differencesin health plan performance. Response distributions may not sum to 100 percent due to rounding. See the methodology section for more information about thescoring and case-mix methodology.
9-100-6 7-8
13%
12%
13%
12%
10%
23%
23%
23%
23%
25%
64%
65%
64%
65%
65%
0% 20% 40% 60% 80% 100%
= Above the mean value of all sponsor or plan means (p < 0.05)
= Below the mean value of all sponsor or plan means (p < 0.05)

Oregon Department of Human Services
Overall Rating of Child’s Health Care
Child Medicaid (n=6738)
West Regional (n=3537)
HMO/POS/PPO (n=6738)
PCCM NA
Sponsor (n=3537)
Care Oregon (n=215)
Cascade Comprehensive Care (n=256)
Central Oregon Ind Health Services (n=225)
Doctors of the Coast South (n=254)
Douglas County IPA (n=251)
Family Care (n=182)
FFS/PCCM (Medicaid) (n=181)
Intercommunity Health Network (n=245)
Kaiser Permanente Oregon Plus (n=205)
Lane IPA (n=236)
Marion-Polk Community Health Plan (n=214)
Mid-Rogue IPA (n=219)
ODS Community Health (n=226)
Oregon Health Management Services (n=178)
Providence Health Plan (n=196)
2008 CAHPS-HP 4.0 Child Medicaid Sponsor Report B-41
Q12. Of those respondents whose child went to a doctor’s office or clinic: “Using any number from 0 to 10, where 0 is the worst health care possible, and 10 is the best, what number would you use to rate all your child's health care in the last 6 months?
NOTE: The results shown above are case mix adjusted. Small percentage differences may represent measurement (sampling) error rather than actual differencesin health plan performance. Response distributions may not sum to 100 percent due to rounding. See the methodology section for more information about thescoring and case-mix methodology.
9-100-6 7-8
11%
11%
11%
11%
10%
11%
13%
13%
19%
15%
12%
13%
10%
12%
8%
10%
10%
12%
7%
29%
30%
29%
30%
33%
32%
31%
30%
28%
35%
39%
29%
23%
30%
35%
31%
30%
33%
24%
60%
58%
60%
58%
58%
56%
56%
57%
53%
49%
49%
58%
67%
58%
57%
59%
60%
55%
69%
0% 20% 40% 60% 80% 100%
= Above the mean value of all sponsor or plan means (p < 0.05)
= Below the mean value of all sponsor or plan means (p < 0.05)

Oregon Department of Human Services
Overall Rating of Child’s Health Care
Child Medicaid (n=6738)
West Regional (n=3537)
HMO/POS/PPO (n=6738)
PCCM NA
Sponsor (n=3537)
Tuality Health Alliance (n=254)
2008 CAHPS-HP 4.0 Child Medicaid Sponsor Report B-42
Q12. Of those respondents whose child went to a doctor’s office or clinic: “Using any number from 0 to 10, where 0 is the worst health care possible, and 10 is the best, what number would you use to rate all your child's health care in the last 6 months?
NOTE: The results shown above are case mix adjusted. Small percentage differences may represent measurement (sampling) error rather than actual differencesin health plan performance. Response distributions may not sum to 100 percent due to rounding. See the methodology section for more information about thescoring and case-mix methodology.
9-100-6 7-8
11%
11%
11%
11%
7%
29%
30%
29%
30%
24%
60%
58%
60%
58%
68%
0% 20% 40% 60% 80% 100%
= Above the mean value of all sponsor or plan means (p < 0.05)
= Below the mean value of all sponsor or plan means (p < 0.05)

Oregon Department of Human Services
Overall Rating of Child’s Health Plan
Child Medicaid (n=9526)
West Regional (n=5392)
HMO/POS/PPO (n=9526)
PCCM NA
Sponsor (n=5392)
Care Oregon (n=356)
Cascade Comprehensive Care (n=377)
Central Oregon Ind Health Services (n=365)
Doctors of the Coast South (n=355)
Douglas County IPA (n=363)
Family Care (n=289)
FFS/PCCM (Medicaid) (n=282)
Intercommunity Health Network (n=363)
Kaiser Permanente Oregon Plus (n=312)
Lane IPA (n=349)
Marion-Polk Community Health Plan (n=370)
Mid-Rogue IPA (n=329)
ODS Community Health (n=338)
Oregon Health Management Services (n=269)
Providence Health Plan (n=295)
2008 CAHPS-HP 4.0 Child Medicaid Sponsor Report B-43
Q51. Using any number from 0 to 10, where 0 is the worst health plan possible, and 10 is the best health plan possible, what number would you use to rate your child's health plan?"
NOTE: The results shown above are case mix adjusted. Small percentage differences may represent measurement (sampling) error rather than actual differencesin health plan performance. Response distributions may not sum to 100 percent due to rounding. See the methodology section for more information about thescoring and case-mix methodology.
9-100-6 7-8
15%
15%
15%
15%
14%
17%
14%
15%
24%
19%
14%
19%
13%
19%
14%
12%
12%
16%
12%
28%
29%
28%
29%
26%
30%
31%
32%
34%
35%
35%
31%
29%
32%
27%
32%
24%
28%
24%
57%
55%
57%
55%
60%
53%
56%
53%
42%
46%
50%
50%
59%
48%
59%
56%
65%
57%
64%
0% 20% 40% 60% 80% 100%
= Above the mean value of all sponsor or plan means (p < 0.05)
= Below the mean value of all sponsor or plan means (p < 0.05)

Oregon Department of Human Services
Overall Rating of Child’s Health Plan
Child Medicaid (n=9526)
West Regional (n=5392)
HMO/POS/PPO (n=9526)
PCCM NA
Sponsor (n=5392)
Tuality Health Alliance (n=380)
2008 CAHPS-HP 4.0 Child Medicaid Sponsor Report B-44
Q51. Using any number from 0 to 10, where 0 is the worst health plan possible, and 10 is the best health plan possible, what number would you use to rate your child's health plan?"
NOTE: The results shown above are case mix adjusted. Small percentage differences may represent measurement (sampling) error rather than actual differencesin health plan performance. Response distributions may not sum to 100 percent due to rounding. See the methodology section for more information about thescoring and case-mix methodology.
9-100-6 7-8
15%
15%
15%
15%
12%
28%
29%
28%
29%
22%
57%
55%
57%
55%
66%
0% 20% 40% 60% 80% 100%
= Above the mean value of all sponsor or plan means (p < 0.05)
= Below the mean value of all sponsor or plan means (p < 0.05)

Oregon Department of Human Services
Getting Specialized Services
Child Medicaid (n=116)
West Regional (n=116)
HMO/POS/PPO (n=116)
PCCM NA
Sponsor (n=116)
Care Oregon (n=6)
Cascade Comprehensive Care (n=8)
Central Oregon Ind Health Services (n=7)
Doctors of the Coast South (n=9)
Douglas County IPA (n=11)
Family Care (n=9)
FFS/PCCM (Medicaid) (n=7)
Intercommunity Health Network (n=3)
Kaiser Permanente Oregon Plus (n=5)
Lane IPA (n=5)
Marion-Polk Community Health Plan (n=9)
Mid-Rogue IPA (n=4)
ODS Community Health (n=8)
Oregon Health Management Services (n=3)
Providence Health Plan (n=8)
2008 CAHPS-HP 4.0 Child Medicaid Sponsor Report B-45
Q17. Of those respondents who tried to get special medical equipment or devices for their child: "In the last 6 months, how often was it easy to get special medical equipment or devices for your child?"
NOTE: The results shown above are case mix adjusted. Small percentage differences may represent measurement (sampling) error rather than actual differencesin health plan performance. Response distributions may not sum to 100 percent due to rounding. See the methodology section for more information about thescoring and case-mix methodology.
AlwaysNever + Sometimes Usually
29%
29%
29%
29%
33%
38%
71%
33%
36%
11%
33%
20%
22%
25%
38%
25%
27%
27%
27%
27%
25%
29%
11%
9%
56%
43%
60%
60%
22%
25%
50%
13%
44%
44%
44%
44%
67%
38%
56%
55%
33%
57%
67%
40%
20%
56%
50%
13%
100%
63%
0% 20% 40% 60% 80% 100%
= Above the mean value of all sponsor or plan means (p < 0.05)
= Below the mean value of all sponsor or plan means (p < 0.05)

Oregon Department of Human Services
Getting Specialized Services
Child Medicaid (n=116)
West Regional (n=116)
HMO/POS/PPO (n=116)
PCCM NA
Sponsor (n=116)
Tuality Health Alliance (n=14)
2008 CAHPS-HP 4.0 Child Medicaid Sponsor Report B-46
Q17. Of those respondents who tried to get special medical equipment or devices for their child: "In the last 6 months, how often was it easy to get special medical equipment or devices for your child?"
NOTE: The results shown above are case mix adjusted. Small percentage differences may represent measurement (sampling) error rather than actual differencesin health plan performance. Response distributions may not sum to 100 percent due to rounding. See the methodology section for more information about thescoring and case-mix methodology.
AlwaysNever + Sometimes Usually
29%
29%
29%
29%
43%
27%
27%
27%
27%
21%
44%
44%
44%
44%
36%
0% 20% 40% 60% 80% 100%
= Above the mean value of all sponsor or plan means (p < 0.05)
= Below the mean value of all sponsor or plan means (p < 0.05)

Oregon Department of Human Services
Getting Specialized Services
Child Medicaid (n=202)
West Regional (n=202)
HMO/POS/PPO (n=202)
PCCM NA
Sponsor (n=202)
Care Oregon (n=13)
Cascade Comprehensive Care (n=16)
Central Oregon Ind Health Services (n=12)
Doctors of the Coast South (n=13)
Douglas County IPA (n=10)
Family Care (n=11)
FFS/PCCM (Medicaid) (n=11)
Intercommunity Health Network (n=19)
Kaiser Permanente Oregon Plus (n=12)
Lane IPA (n=10)
Marion-Polk Community Health Plan (n=12)
Mid-Rogue IPA (n=14)
ODS Community Health (n=13)
Oregon Health Management Services (n=8)
Providence Health Plan (n=15)
2008 CAHPS-HP 4.0 Child Medicaid Sponsor Report B-47
Q20. Of those respondents who tried to get special therapy such as physical, occupational or speech therapy for their child: "In the last 6 months, how often was it easy to get this therapy for your child?"
NOTE: The results shown above are case mix adjusted. Small percentage differences may represent measurement (sampling) error rather than actual differencesin health plan performance. Response distributions may not sum to 100 percent due to rounding. See the methodology section for more information about thescoring and case-mix methodology.
AlwaysNever + Sometimes Usually
41%
41%
41%
41%
54%
56%
50%
38%
40%
36%
27%
53%
75%
10%
42%
21%
23%
25%
33%
19%
19%
19%
19%
31%
13%
23%
20%
18%
27%
21%
25%
30%
33%
14%
15%
13%
7%
40%
40%
40%
40%
15%
31%
50%
38%
40%
45%
45%
26%
60%
25%
64%
62%
63%
60%
0% 20% 40% 60% 80% 100%
= Above the mean value of all sponsor or plan means (p < 0.05)
= Below the mean value of all sponsor or plan means (p < 0.05)

Oregon Department of Human Services
Getting Specialized Services
Child Medicaid (n=202)
West Regional (n=202)
HMO/POS/PPO (n=202)
PCCM NA
Sponsor (n=202)
Tuality Health Alliance (n=13)
2008 CAHPS-HP 4.0 Child Medicaid Sponsor Report B-48
Q20. Of those respondents who tried to get special therapy such as physical, occupational or speech therapy for their child: "In the last 6 months, how often was it easy to get this therapy for your child?"
NOTE: The results shown above are case mix adjusted. Small percentage differences may represent measurement (sampling) error rather than actual differencesin health plan performance. Response distributions may not sum to 100 percent due to rounding. See the methodology section for more information about thescoring and case-mix methodology.
AlwaysNever + Sometimes Usually
41%
41%
41%
41%
54%
19%
19%
19%
19%
23%
40%
40%
40%
40%
23%
0% 20% 40% 60% 80% 100%
= Above the mean value of all sponsor or plan means (p < 0.05)
= Below the mean value of all sponsor or plan means (p < 0.05)

Oregon Department of Human Services
Getting Specialized Services
Child Medicaid (n=442)
West Regional (n=442)
HMO/POS/PPO (n=442)
PCCM NA
Sponsor (n=442)
Care Oregon (n=25)
Cascade Comprehensive Care (n=33)
Central Oregon Ind Health Services (n=22)
Doctors of the Coast South (n=33)
Douglas County IPA (n=25)
Family Care (n=19)
FFS/PCCM (Medicaid) (n=32)
Intercommunity Health Network (n=33)
Kaiser Permanente Oregon Plus (n=19)
Lane IPA (n=40)
Marion-Polk Community Health Plan (n=36)
Mid-Rogue IPA (n=31)
ODS Community Health (n=17)
Oregon Health Management Services (n=26)
Providence Health Plan (n=18)
2008 CAHPS-HP 4.0 Child Medicaid Sponsor Report B-49
Q23. Of those respondents who tried to get treatment or counseling for an emotional, developmental or behavioral problem for their child: "In the last 6 months, how often was it easy to get this treatment or counseling for your child?"
NOTE: The results shown above are case mix adjusted. Small percentage differences may represent measurement (sampling) error rather than actual differencesin health plan performance. Response distributions may not sum to 100 percent due to rounding. See the methodology section for more information about thescoring and case-mix methodology.
AlwaysNever + Sometimes Usually
30%
30%
30%
30%
28%
27%
14%
30%
20%
47%
34%
42%
37%
25%
42%
23%
18%
27%
33%
26%
26%
26%
26%
28%
36%
36%
33%
28%
11%
28%
12%
21%
23%
17%
29%
35%
50%
17%
43%
43%
43%
43%
44%
36%
50%
36%
52%
42%
38%
45%
42%
53%
42%
48%
47%
23%
50%
0% 20% 40% 60% 80% 100%
= Above the mean value of all sponsor or plan means (p < 0.05)
= Below the mean value of all sponsor or plan means (p < 0.05)

Oregon Department of Human Services
Getting Specialized Services
Child Medicaid (n=442)
West Regional (n=442)
HMO/POS/PPO (n=442)
PCCM NA
Sponsor (n=442)
Tuality Health Alliance (n=33)
2008 CAHPS-HP 4.0 Child Medicaid Sponsor Report B-50
Q23. Of those respondents who tried to get treatment or counseling for an emotional, developmental or behavioral problem for their child: "In the last 6 months, how often was it easy to get this treatment or counseling for your child?"
NOTE: The results shown above are case mix adjusted. Small percentage differences may represent measurement (sampling) error rather than actual differencesin health plan performance. Response distributions may not sum to 100 percent due to rounding. See the methodology section for more information about thescoring and case-mix methodology.
AlwaysNever + Sometimes Usually
30%
30%
30%
30%
30%
26%
26%
26%
26%
21%
43%
43%
43%
43%
48%
0% 20% 40% 60% 80% 100%
= Above the mean value of all sponsor or plan means (p < 0.05)
= Below the mean value of all sponsor or plan means (p < 0.05)

Oregon Department of Human Services
Getting Prescription Medicines
Child Medicaid (n=1093)
West Regional (n=1093)
HMO/POS/PPO (n=1093)
PCCM NA
Sponsor (n=1093)
Care Oregon (n=55)
Cascade Comprehensive Care (n=78)
Central Oregon Ind Health Services (n=53)
Doctors of the Coast South (n=97)
Douglas County IPA (n=84)
Family Care (n=47)
FFS/PCCM (Medicaid) (n=83)
Intercommunity Health Network (n=75)
Kaiser Permanente Oregon Plus (n=75)
Lane IPA (n=74)
Marion-Polk Community Health Plan (n=77)
Mid-Rogue IPA (n=79)
ODS Community Health (n=47)
Oregon Health Management Services (n=51)
Providence Health Plan (n=45)
2008 CAHPS-HP 4.0 Child Medicaid Sponsor Report B-51
Q53. Of those respondents who got a prescription for medicine or refilled a prescription for their child: "In the last 6 months, how often was it easy to get prescription medicines for your child through his or her health plan?"
NOTE: The results shown above are case mix adjusted. Small percentage differences may represent measurement (sampling) error rather than actual differencesin health plan performance. Response distributions may not sum to 100 percent due to rounding. See the methodology section for more information about thescoring and case-mix methodology.
AlwaysNever + Sometimes Usually
13%
13%
13%
13%
11%
19%
17%
9%
13%
21%
17%
12%
12%
12%
13%
8%
13%
11%
25%
25%
25%
25%
18%
29%
28%
33%
23%
30%
22%
27%
20%
19%
26%
23%
17%
37%
22%
62%
62%
62%
62%
71%
51%
55%
58%
64%
49%
61%
61%
68%
69%
61%
70%
70%
59%
67%
0% 20% 40% 60% 80% 100%
= Above the mean value of all sponsor or plan means (p < 0.05)
= Below the mean value of all sponsor or plan means (p < 0.05)

Oregon Department of Human Services
Getting Prescription Medicines
Child Medicaid (n=1093)
West Regional (n=1093)
HMO/POS/PPO (n=1093)
PCCM NA
Sponsor (n=1093)
Tuality Health Alliance (n=73)
2008 CAHPS-HP 4.0 Child Medicaid Sponsor Report B-52
Q53. Of those respondents who got a prescription for medicine or refilled a prescription for their child: "In the last 6 months, how often was it easy to get prescription medicines for your child through his or her health plan?"
NOTE: The results shown above are case mix adjusted. Small percentage differences may represent measurement (sampling) error rather than actual differencesin health plan performance. Response distributions may not sum to 100 percent due to rounding. See the methodology section for more information about thescoring and case-mix methodology.
AlwaysNever + Sometimes Usually
13%
13%
13%
13%
23%
25%
25%
25%
25%
18%
62%
62%
62%
62%
59%
0% 20% 40% 60% 80% 100%
= Above the mean value of all sponsor or plan means (p < 0.05)
= Below the mean value of all sponsor or plan means (p < 0.05)

Oregon Department of Human Services
Family Centered Care: Personal Doctor Who Knows Child
Child Medicaid (n=1036)
West Regional (n=1036)
HMO/POS/PPO (n=1036)
PCCM NA
Sponsor (n=1036)
Care Oregon (n=46)
Cascade Comprehensive Care (n=76)
Central Oregon Ind Health Services (n=50)
Doctors of the Coast South (n=97)
Douglas County IPA (n=74)
Family Care (n=52)
FFS/PCCM (Medicaid) (n=77)
Intercommunity Health Network (n=66)
Kaiser Permanente Oregon Plus (n=70)
Lane IPA (n=67)
Marion-Polk Community Health Plan (n=75)
Mid-Rogue IPA (n=76)
ODS Community Health (n=34)
Oregon Health Management Services (n=55)
Providence Health Plan (n=43)
2008 CAHPS-HP 4.0 Child Medicaid Sponsor Report B-53
Q35. Of those respondents whose child had a personal doctor: In the last 6 months, did your child’s personal doctor talk with you about how your child is feeling, growing, or behaving?
NOTE: The results shown above are case mix adjusted. Small percentage differences may represent measurement (sampling) error rather than actual differencesin health plan performance. Response distributions may not sum to 100 percent due to rounding. See the methodology section for more information about thescoring and case-mix methodology.
16%
16%
16%
16%
15%
21%
14%
14%
14%
23%
14%
20%
17%
22%
9%
14%
12%
16%
21%
84%
84%
84%
84%
85%
79%
86%
86%
86%
77%
86%
80%
83%
78%
91%
86%
88%
84%
79%
0% 20% 40% 60% 80% 100%
No Yes = Above the mean value of all sponsor or plan means (p < 0.05)
= Below the mean value of all sponsor or plan means (p < 0.05)

Oregon Department of Human Services
Family Centered Care: Personal Doctor Who Knows Child
Child Medicaid (n=1036)
West Regional (n=1036)
HMO/POS/PPO (n=1036)
PCCM NA
Sponsor (n=1036)
Tuality Health Alliance (n=78)
2008 CAHPS-HP 4.0 Child Medicaid Sponsor Report B-54
Q35. Of those respondents whose child had a personal doctor: In the last 6 months, did your child’s personal doctor talk with you about how your child is feeling, growing, or behaving?
NOTE: The results shown above are case mix adjusted. Small percentage differences may represent measurement (sampling) error rather than actual differencesin health plan performance. Response distributions may not sum to 100 percent due to rounding. See the methodology section for more information about thescoring and case-mix methodology.
16%
16%
16%
16%
13%
84%
84%
84%
84%
87%
0% 20% 40% 60% 80% 100%
No Yes = Above the mean value of all sponsor or plan means (p < 0.05)
= Below the mean value of all sponsor or plan means (p < 0.05)

Oregon Department of Human Services
Family Centered Care: Personal Doctor Who Knows Child
Child Medicaid (n=978)
West Regional (n=978)
HMO/POS/PPO (n=978)
PCCM NA
Sponsor (n=978)
Care Oregon (n=42)
Cascade Comprehensive Care (n=73)
Central Oregon Ind Health Services (n=46)
Doctors of the Coast South (n=88)
Douglas County IPA (n=74)
Family Care (n=44)
FFS/PCCM (Medicaid) (n=71)
Intercommunity Health Network (n=71)
Kaiser Permanente Oregon Plus (n=56)
Lane IPA (n=68)
Marion-Polk Community Health Plan (n=76)
Mid-Rogue IPA (n=77)
ODS Community Health (n=32)
Oregon Health Management Services (n=58)
Providence Health Plan (n=43)
2008 CAHPS-HP 4.0 Child Medicaid Sponsor Report B-55
Q38. Of those respondents whose child had a medical, behavioral or other health conditions: "Does your child’s personal doctor understand how these medical, behavioral, or other health conditions affect your child’s day-to-day life?"
NOTE: The results shown above are case mix adjusted. Small percentage differences may represent measurement (sampling) error rather than actual differencesin health plan performance. Response distributions may not sum to 100 percent due to rounding. See the methodology section for more information about thescoring and case-mix methodology.
12%
12%
12%
12%
5%
10%
20%
11%
20%
30%
7%
13%
13%
13%
12%
6%
6%
12%
14%
88%
88%
88%
88%
95%
90%
80%
89%
80%
70%
93%
87%
88%
87%
88%
94%
94%
88%
86%
0% 20% 40% 60% 80% 100%
No Yes = Above the mean value of all sponsor or plan means (p < 0.05)
= Below the mean value of all sponsor or plan means (p < 0.05)

Oregon Department of Human Services
Family Centered Care: Personal Doctor Who Knows Child
Child Medicaid (n=978)
West Regional (n=978)
HMO/POS/PPO (n=978)
PCCM NA
Sponsor (n=978)
Tuality Health Alliance (n=59)
2008 CAHPS-HP 4.0 Child Medicaid Sponsor Report B-56
Q38. Of those respondents whose child had a medical, behavioral or other health conditions: "Does your child’s personal doctor understand how these medical, behavioral, or other health conditions affect your child’s day-to-day life?"
NOTE: The results shown above are case mix adjusted. Small percentage differences may represent measurement (sampling) error rather than actual differencesin health plan performance. Response distributions may not sum to 100 percent due to rounding. See the methodology section for more information about thescoring and case-mix methodology.
12%
12%
12%
12%
12%
88%
88%
88%
88%
88%
0% 20% 40% 60% 80% 100%
No Yes = Above the mean value of all sponsor or plan means (p < 0.05)
= Below the mean value of all sponsor or plan means (p < 0.05)

Oregon Department of Human Services
Family Centered Care: Personal Doctor Who Knows Child
Child Medicaid (n=972)
West Regional (n=972)
HMO/POS/PPO (n=972)
PCCM NA
Sponsor (n=972)
Care Oregon (n=41)
Cascade Comprehensive Care (n=73)
Central Oregon Ind Health Services (n=46)
Doctors of the Coast South (n=87)
Douglas County IPA (n=74)
Family Care (n=45)
FFS/PCCM (Medicaid) (n=71)
Intercommunity Health Network (n=70)
Kaiser Permanente Oregon Plus (n=57)
Lane IPA (n=67)
Marion-Polk Community Health Plan (n=77)
Mid-Rogue IPA (n=76)
ODS Community Health (n=32)
Oregon Health Management Services (n=55)
Providence Health Plan (n=42)
2008 CAHPS-HP 4.0 Child Medicaid Sponsor Report B-57
Q39. Of those respondents whose child had a medical, behavioral or other health conditions: "Does your child’s personal doctor understand how your child’s medical, behavioral, or other health conditions affect your family’s day-to-day life?"
NOTE: The results shown above are case mix adjusted. Small percentage differences may represent measurement (sampling) error rather than actual differencesin health plan performance. Response distributions may not sum to 100 percent due to rounding. See the methodology section for more information about thescoring and case-mix methodology.
16%
16%
16%
16%
10%
15%
28%
17%
24%
27%
8%
16%
16%
18%
14%
8%
13%
16%
14%
84%
84%
84%
84%
90%
85%
72%
83%
76%
73%
92%
84%
84%
82%
86%
92%
88%
84%
86%
0% 20% 40% 60% 80% 100%
No Yes = Above the mean value of all sponsor or plan means (p < 0.05)
= Below the mean value of all sponsor or plan means (p < 0.05)

Oregon Department of Human Services
Family Centered Care: Personal Doctor Who Knows Child
Child Medicaid (n=972)
West Regional (n=972)
HMO/POS/PPO (n=972)
PCCM NA
Sponsor (n=972)
Tuality Health Alliance (n=59)
2008 CAHPS-HP 4.0 Child Medicaid Sponsor Report B-58
Q39. Of those respondents whose child had a medical, behavioral or other health conditions: "Does your child’s personal doctor understand how your child’s medical, behavioral, or other health conditions affect your family’s day-to-day life?"
NOTE: The results shown above are case mix adjusted. Small percentage differences may represent measurement (sampling) error rather than actual differencesin health plan performance. Response distributions may not sum to 100 percent due to rounding. See the methodology section for more information about thescoring and case-mix methodology.
16%
16%
16%
16%
19%
84%
84%
84%
84%
81%
0% 20% 40% 60% 80% 100%
No Yes = Above the mean value of all sponsor or plan means (p < 0.05)
= Below the mean value of all sponsor or plan means (p < 0.05)
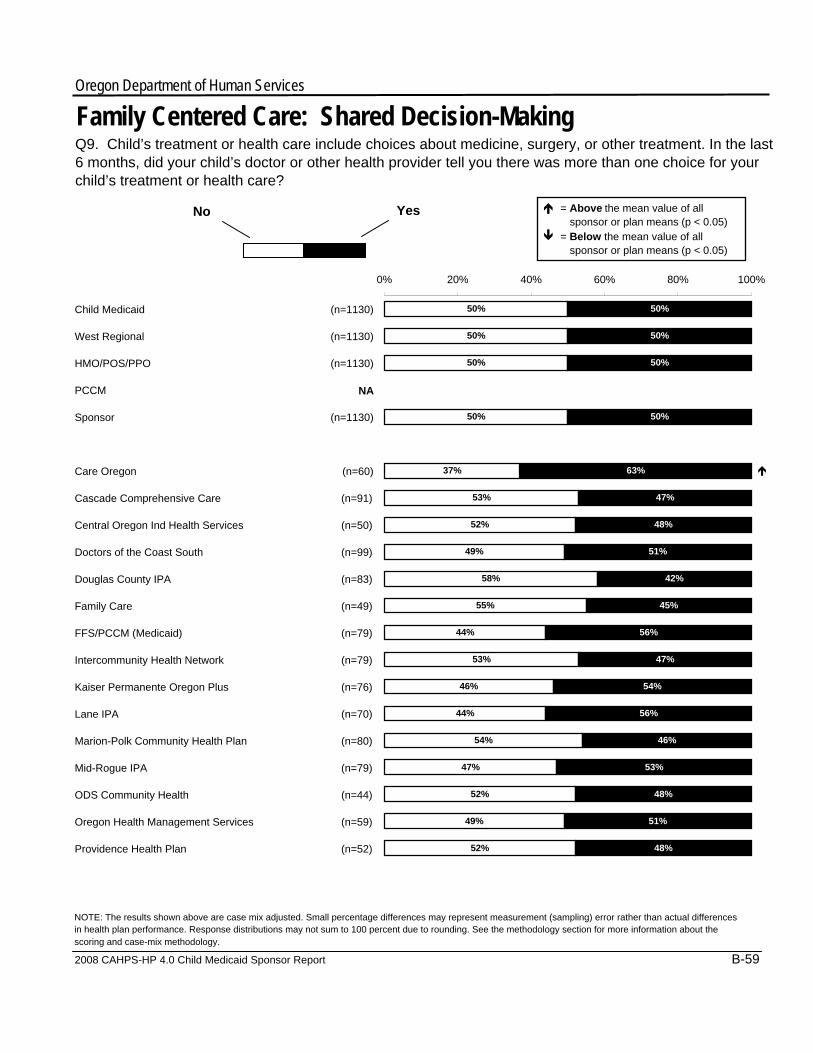
Oregon Department of Human Services
Family Centered Care: Shared Decision-Making
Child Medicaid (n=1130)
West Regional (n=1130)
HMO/POS/PPO (n=1130)
PCCM NA
Sponsor (n=1130)
Care Oregon (n=60)
Cascade Comprehensive Care (n=91)
Central Oregon Ind Health Services (n=50)
Doctors of the Coast South (n=99)
Douglas County IPA (n=83)
Family Care (n=49)
FFS/PCCM (Medicaid) (n=79)
Intercommunity Health Network (n=79)
Kaiser Permanente Oregon Plus (n=76)
Lane IPA (n=70)
Marion-Polk Community Health Plan (n=80)
Mid-Rogue IPA (n=79)
ODS Community Health (n=44)
Oregon Health Management Services (n=59)
Providence Health Plan (n=52)
2008 CAHPS-HP 4.0 Child Medicaid Sponsor Report B-59
Q9. Child’s treatment or health care include choices about medicine, surgery, or other treatment. In the last 6 months, did your child’s doctor or other health provider tell you there was more than one choice for your child’s treatment or health care?
NOTE: The results shown above are case mix adjusted. Small percentage differences may represent measurement (sampling) error rather than actual differencesin health plan performance. Response distributions may not sum to 100 percent due to rounding. See the methodology section for more information about thescoring and case-mix methodology.
50%
50%
50%
50%
37%
53%
52%
49%
58%
55%
44%
53%
46%
44%
54%
47%
52%
49%
52%
50%
50%
50%
50%
63%
47%
48%
51%
42%
45%
56%
47%
54%
56%
46%
53%
48%
51%
48%
0% 20% 40% 60% 80% 100%
No Yes = Above the mean value of all sponsor or plan means (p < 0.05)
= Below the mean value of all sponsor or plan means (p < 0.05)

Oregon Department of Human Services
Family Centered Care: Shared Decision-Making
Child Medicaid (n=1130)
West Regional (n=1130)
HMO/POS/PPO (n=1130)
PCCM NA
Sponsor (n=1130)
Tuality Health Alliance (n=80)
2008 CAHPS-HP 4.0 Child Medicaid Sponsor Report B-60
Q9. Child’s treatment or health care include choices about medicine, surgery, or other treatment. In the last 6 months, did your child’s doctor or other health provider tell you there was more than one choice for your child’s treatment or health care?
NOTE: The results shown above are case mix adjusted. Small percentage differences may represent measurement (sampling) error rather than actual differencesin health plan performance. Response distributions may not sum to 100 percent due to rounding. See the methodology section for more information about thescoring and case-mix methodology.
50%
50%
50%
50%
49%
50%
50%
50%
50%
51%
0% 20% 40% 60% 80% 100%
No Yes = Above the mean value of all sponsor or plan means (p < 0.05)
= Below the mean value of all sponsor or plan means (p < 0.05)

Oregon Department of Human Services
Family Centered Care: Shared Decision-Making
Child Medicaid (n=559)
West Regional (n=559)
HMO/POS/PPO (n=559)
PCCM NA
Sponsor (n=559)
Care Oregon (n=38)
Cascade Comprehensive Care (n=42)
Central Oregon Ind Health Services (n=24)
Doctors of the Coast South (n=49)
Douglas County IPA (n=35)
Family Care (n=22)
FFS/PCCM (Medicaid) (n=44)
Intercommunity Health Network (n=37)
Kaiser Permanente Oregon Plus (n=40)
Lane IPA (n=39)
Marion-Polk Community Health Plan (n=36)
Mid-Rogue IPA (n=41)
ODS Community Health (n=21)
Oregon Health Management Services (n=30)
Providence Health Plan (n=23)
2008 CAHPS-HP 4.0 Child Medicaid Sponsor Report B-61
Q10. In the last 6 months, did your child’s doctor or other health provider talk with you about the pros and cons of each choice for your child’s treatment or health care?
NOTE: The results shown above are case mix adjusted. Small percentage differences may represent measurement (sampling) error rather than actual differencesin health plan performance. Response distributions may not sum to 100 percent due to rounding. See the methodology section for more information about thescoring and case-mix methodology.
8%
8%
8%
8%
5%
14%
21%
6%
6%
14%
14%
8%
8%
5%
9%
92%
92%
92%
92%
95%
86%
79%
94%
94%
100%
86%
86%
93%
92%
97%
98%
95%
97%
91%
0% 20% 40% 60% 80% 100%
No Yes = Above the mean value of all sponsor or plan means (p < 0.05)
= Below the mean value of all sponsor or plan means (p < 0.05)

Oregon Department of Human Services
Family Centered Care: Shared Decision-Making
Child Medicaid (n=559)
West Regional (n=559)
HMO/POS/PPO (n=559)
PCCM NA
Sponsor (n=559)
Tuality Health Alliance (n=38)
2008 CAHPS-HP 4.0 Child Medicaid Sponsor Report B-62
Q10. In the last 6 months, did your child’s doctor or other health provider talk with you about the pros and cons of each choice for your child’s treatment or health care?
NOTE: The results shown above are case mix adjusted. Small percentage differences may represent measurement (sampling) error rather than actual differencesin health plan performance. Response distributions may not sum to 100 percent due to rounding. See the methodology section for more information about thescoring and case-mix methodology.
8%
8%
8%
8%
8%
92%
92%
92%
92%
92%
0% 20% 40% 60% 80% 100%
No Yes = Above the mean value of all sponsor or plan means (p < 0.05)
= Below the mean value of all sponsor or plan means (p < 0.05)

Oregon Department of Human Services
Family Centered Care: Shared Decision-Making
Child Medicaid (n=557)
West Regional (n=557)
HMO/POS/PPO (n=557)
PCCM NA
Sponsor (n=557)
Care Oregon (n=38)
Cascade Comprehensive Care (n=43)
Central Oregon Ind Health Services (n=24)
Doctors of the Coast South (n=48)
Douglas County IPA (n=34)
Family Care (n=22)
FFS/PCCM (Medicaid) (n=43)
Intercommunity Health Network (n=34)
Kaiser Permanente Oregon Plus (n=40)
Lane IPA (n=38)
Marion-Polk Community Health Plan (n=36)
Mid-Rogue IPA (n=41)
ODS Community Health (n=21)
Oregon Health Management Services (n=30)
Providence Health Plan (n=24)
2008 CAHPS-HP 4.0 Child Medicaid Sponsor Report B-63
Q11. In the last 6 months, when there was more than one choice for your child’s treatment or health care, did your child’s doctor or other health provider ask you which choice was best for your child?
NOTE: The results shown above are case mix adjusted. Small percentage differences may represent measurement (sampling) error rather than actual differencesin health plan performance. Response distributions may not sum to 100 percent due to rounding. See the methodology section for more information about thescoring and case-mix methodology.
15%
15%
15%
15%
11%
14%
33%
15%
12%
14%
14%
18%
20%
13%
8%
12%
10%
17%
13%
85%
85%
85%
85%
89%
86%
67%
85%
88%
86%
86%
82%
80%
87%
92%
88%
90%
83%
88%
0% 20% 40% 60% 80% 100%
No Yes = Above the mean value of all sponsor or plan means (p < 0.05)
= Below the mean value of all sponsor or plan means (p < 0.05)

Oregon Department of Human Services
Family Centered Care: Shared Decision-Making
Child Medicaid (n=557)
West Regional (n=557)
HMO/POS/PPO (n=557)
PCCM NA
Sponsor (n=557)
Tuality Health Alliance (n=41)
2008 CAHPS-HP 4.0 Child Medicaid Sponsor Report B-64
Q11. In the last 6 months, when there was more than one choice for your child’s treatment or health care, did your child’s doctor or other health provider ask you which choice was best for your child?
NOTE: The results shown above are case mix adjusted. Small percentage differences may represent measurement (sampling) error rather than actual differencesin health plan performance. Response distributions may not sum to 100 percent due to rounding. See the methodology section for more information about thescoring and case-mix methodology.
15%
15%
15%
15%
17%
85%
85%
85%
85%
83%
0% 20% 40% 60% 80% 100%
No Yes = Above the mean value of all sponsor or plan means (p < 0.05)
= Below the mean value of all sponsor or plan means (p < 0.05)
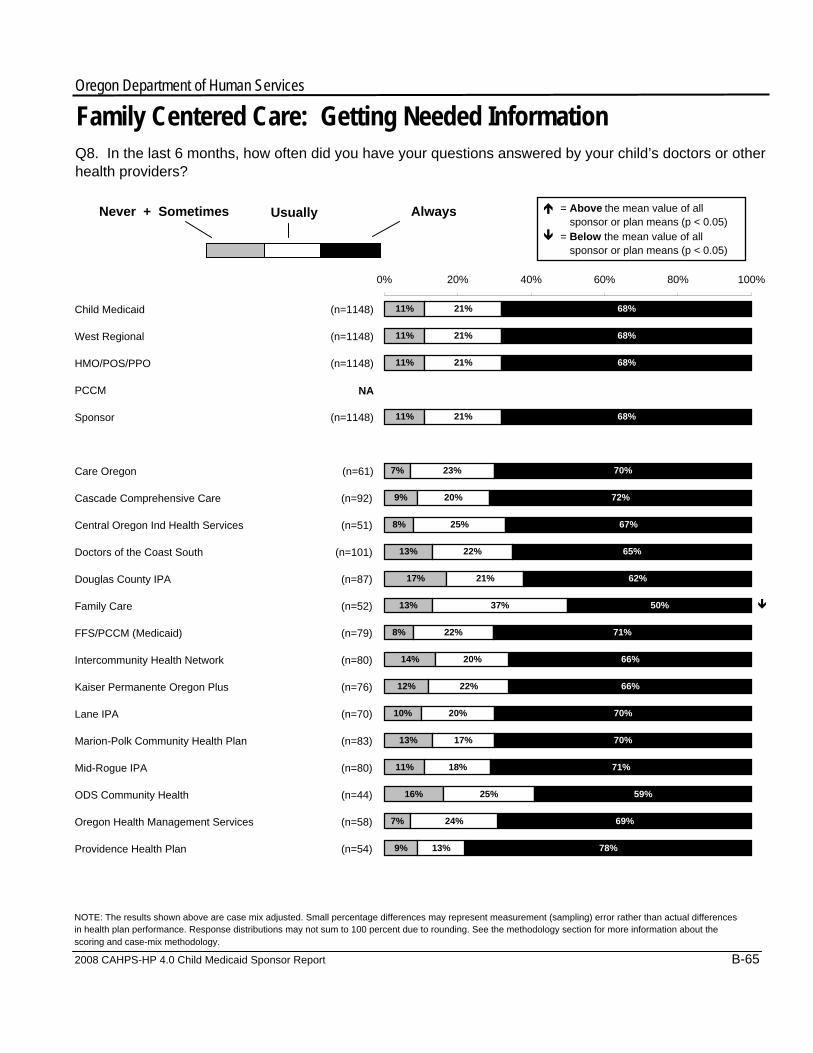
Oregon Department of Human Services
Family Centered Care: Getting Needed Information
Child Medicaid (n=1148)
West Regional (n=1148)
HMO/POS/PPO (n=1148)
PCCM NA
Sponsor (n=1148)
Care Oregon (n=61)
Cascade Comprehensive Care (n=92)
Central Oregon Ind Health Services (n=51)
Doctors of the Coast South (n=101)
Douglas County IPA (n=87)
Family Care (n=52)
FFS/PCCM (Medicaid) (n=79)
Intercommunity Health Network (n=80)
Kaiser Permanente Oregon Plus (n=76)
Lane IPA (n=70)
Marion-Polk Community Health Plan (n=83)
Mid-Rogue IPA (n=80)
ODS Community Health (n=44)
Oregon Health Management Services (n=58)
Providence Health Plan (n=54)
2008 CAHPS-HP 4.0 Child Medicaid Sponsor Report B-65
Q8. In the last 6 months, how often did you have your questions answered by your child’s doctors or other health providers?
NOTE: The results shown above are case mix adjusted. Small percentage differences may represent measurement (sampling) error rather than actual differencesin health plan performance. Response distributions may not sum to 100 percent due to rounding. See the methodology section for more information about thescoring and case-mix methodology.
AlwaysNever + Sometimes Usually
11%
11%
11%
11%
7%
9%
8%
13%
17%
13%
8%
14%
12%
10%
13%
11%
16%
7%
9%
21%
21%
21%
21%
23%
20%
25%
22%
21%
37%
22%
20%
22%
20%
17%
18%
25%
24%
13%
68%
68%
68%
68%
70%
72%
67%
65%
62%
50%
71%
66%
66%
70%
70%
71%
59%
69%
78%
0% 20% 40% 60% 80% 100%
= Above the mean value of all sponsor or plan means (p < 0.05)
= Below the mean value of all sponsor or plan means (p < 0.05)

Oregon Department of Human Services
Family Centered Care: Getting Needed Information
Child Medicaid (n=1148)
West Regional (n=1148)
HMO/POS/PPO (n=1148)
PCCM NA
Sponsor (n=1148)
Tuality Health Alliance (n=80)
2008 CAHPS-HP 4.0 Child Medicaid Sponsor Report B-66
Q8. In the last 6 months, how often did you have your questions answered by your child’s doctors or other health providers?
NOTE: The results shown above are case mix adjusted. Small percentage differences may represent measurement (sampling) error rather than actual differencesin health plan performance. Response distributions may not sum to 100 percent due to rounding. See the methodology section for more information about thescoring and case-mix methodology.
AlwaysNever + Sometimes Usually
11%
11%
11%
11%
11%
21%
21%
21%
21%
15%
68%
68%
68%
68%
74%
0% 20% 40% 60% 80% 100%
= Above the mean value of all sponsor or plan means (p < 0.05)
= Below the mean value of all sponsor or plan means (p < 0.05)

Oregon Department of Human Services
Coordination of Care and Services
Child Medicaid NA
West Regional NA
HMO/POS/PPO NA
PCCM NA
Sponsor NA
Care Oregon NA
Cascade Comprehensive Care NA
Central Oregon Ind Health Services NA
Doctors of the Coast South NA
Douglas County IPA NA
Family Care NA
FFS/PCCM (Medicaid) NA
Intercommunity Health Network NA
Kaiser Permanente Oregon Plus NA
Lane IPA NA
Marion-Polk Community Health Plan NA
Mid-Rogue IPA NA
ODS Community Health NA
Oregon Health Management Services NA
Providence Health Plan NA
2008 CAHPS-HP 4.0 Child Medicaid Sponsor Report B-67
Q15. In the last 6 months, did you get the help you needed from your child's doctors or other health providers in contacting our child's school or daycare?
NOTE: The results shown above are case mix adjusted. Small percentage differences may represent measurement (sampling) error rather than actual differencesin health plan performance. Response distributions may not sum to 100 percent due to rounding. See the methodology section for more information about thescoring and case-mix methodology.
0% 20% 40% 60% 80% 100%
No Yes = Above the mean value of all sponsor or plan means (p < 0.05)
= Below the mean value of all sponsor or plan means (p < 0.05)

Oregon Department of Human Services
Coordination of Care and Services
Child Medicaid NA
West Regional NA
HMO/POS/PPO NA
PCCM NA
Sponsor NA
Tuality Health Alliance NA
2008 CAHPS-HP 4.0 Child Medicaid Sponsor Report B-68
Q15. In the last 6 months, did you get the help you needed from your child's doctors or other health providers in contacting our child's school or daycare?
NOTE: The results shown above are case mix adjusted. Small percentage differences may represent measurement (sampling) error rather than actual differencesin health plan performance. Response distributions may not sum to 100 percent due to rounding. See the methodology section for more information about thescoring and case-mix methodology.
0% 20% 40% 60% 80% 100%
No Yes = Above the mean value of all sponsor or plan means (p < 0.05)
= Below the mean value of all sponsor or plan means (p < 0.05)

Oregon Department of Human Services
Coordination of Care and Services
Child Medicaid (n=482)
West Regional (n=482)
HMO/POS/PPO (n=482)
PCCM NA
Sponsor (n=482)
Care Oregon (n=23)
Cascade Comprehensive Care (n=37)
Central Oregon Ind Health Services (n=28)
Doctors of the Coast South (n=46)
Douglas County IPA (n=36)
Family Care (n=24)
FFS/PCCM (Medicaid) (n=38)
Intercommunity Health Network (n=29)
Kaiser Permanente Oregon Plus (n=21)
Lane IPA (n=35)
Marion-Polk Community Health Plan (n=32)
Mid-Rogue IPA (n=37)
ODS Community Health (n=21)
Oregon Health Management Services (n=27)
Providence Health Plan (n=18)
2008 CAHPS-HP 4.0 Child Medicaid Sponsor Report B-69
Q26. In the last 12 months, did anyone from your child’s health plan, doctor’s office, or clinic help coordinate your child’s care among these different providers or services?
NOTE: The results shown above are case mix adjusted. Small percentage differences may represent measurement (sampling) error rather than actual differencesin health plan performance. Response distributions may not sum to 100 percent due to rounding. See the methodology section for more information about thescoring and case-mix methodology.
44%
44%
44%
44%
39%
38%
39%
43%
39%
54%
42%
38%
52%
31%
53%
57%
52%
41%
28%
56%
56%
56%
56%
61%
62%
61%
57%
61%
46%
58%
62%
48%
69%
47%
43%
48%
59%
72%
0% 20% 40% 60% 80% 100%
No Yes = Above the mean value of all sponsor or plan means (p < 0.05)
= Below the mean value of all sponsor or plan means (p < 0.05)

Oregon Department of Human Services
Coordination of Care and Services
Child Medicaid (n=482)
West Regional (n=482)
HMO/POS/PPO (n=482)
PCCM NA
Sponsor (n=482)
Tuality Health Alliance (n=30)
2008 CAHPS-HP 4.0 Child Medicaid Sponsor Report B-70
Q26. In the last 12 months, did anyone from your child’s health plan, doctor’s office, or clinic help coordinate your child’s care among these different providers or services?
NOTE: The results shown above are case mix adjusted. Small percentage differences may represent measurement (sampling) error rather than actual differencesin health plan performance. Response distributions may not sum to 100 percent due to rounding. See the methodology section for more information about thescoring and case-mix methodology.
44%
44%
44%
44%
63%
56%
56%
56%
56%
37%
0% 20% 40% 60% 80% 100%
No Yes = Above the mean value of all sponsor or plan means (p < 0.05)
= Below the mean value of all sponsor or plan means (p < 0.05)

2008 CAHPS Health Plan Survey
Child Medicaid Sponsor Report
Section C: Background and Methodology
Prepared by Westat and Shaller Consulting
September 2008 The National CAHPS® Benchmarking Database (the CAHPS Database) is funded by the U.S. Agency for Healthcare Research and Quality and administered by Westat under Contract Number HHSA290200710024C. For more information, please visit the Web site (https://www.cahps.ahrq.gov) or contact the CAHPS User Network at 1-800-492-9261.

2008 CAHPS-HP 3.0/4.0 Child Medicaid Sponsor Report i
Table of Contents Page Introduction ...............................................................................................................................ii Background C-1 About the CAHPS Survey ........................................................................................................C-1 About the CAHPS Database....................................................................................................C-1 Guidelines for Using Sponsor Reports.....................................................................................C-4 Report Methodology C-5 Consumers’ Reports of Their Experiences with Care ..............................................................C-5 Consumers’ Ratings of Their Experiences with Care ..............................................................C-7 Chronic Conditions Questions .................................................................................................C-9 Sampling Methodology ..........................................................................................................C-12 Response Rate Calculation ...................................................................................................C-12 Case Mix Adjustment .............................................................................................................C-13 Testing for Statistical Differences .........................................................................................C-14 The CAHPS Health Plan Survey Database Compared to NCQA’s Quality Compass® .........C-15

2008 CAHPS-HP 3.0/4.0 Child Medicaid Sponsor Report ii
Introduction
This report presents descriptive and methodological information pertaining to the 2008 CAHPS® 3.0, 3.0H and 4.0 child Medicaid Health Plan surveys, conducted between October 2007 and June 2008. This document is one of three sections that comprise the 2008 CAHPS Health Plan Survey Database Sponsor Reports. Each section is described below:
• Section A: Results at a Glance: Presents two summary tables of comparative results,
showing both statistically significant differences and percentile rankings of CAHPS Health Plan (CAHPS-HP) Survey sponsor results compared to benchmarks from the CAHPS Health Plan Survey Database.
• Section B: Results in Detail: Presents detailed results for survey items through a series
of bar charts. This section begins with a list of CAHPS-HP participants in the 2008 CAHPS Health Plan Survey Database and two sponsor-specific tables showing a comparison of demographic and utilization characteristics of respondents.
• Section C: Background and Methodology: Presents overview information about
CAHPS and the CAHPS Database, and includes guidelines for using reports, methodological information on consumer reports and consumer ratings (i.e., items included, calculations), response rate calculation, case mix adjustment, and significance testing for CAHPS-HP surveys.
Sections A and B are presented together in another document; Section C is presented within this report. Questions regarding this report or any aspect of the CAHPS Database can be directed by e-mail to [email protected]. Further information about the CAHPS Database is available through the Web site at: (https://www.cahps.ahrq.gov).

2008 CAHPS-HP 3.0/4.0 Child Medicaid Sponsor Report C-1
Background About the CAHPS® Survey
CAHPS refers to a comprehensive and evolving family of surveys that ask consumers and patients to evaluate the interpersonal aspects of health care. The term “CAHPS” initially stood for the Consumer Assessment of Health Plans Study, but as the products have evolved beyond health plans, the acronym now stands for “Consumer Assessment of Healthcare Providers and Systems”. CAHPS surveys probe those aspects of care for which consumers and patients are the best and/or only source of information, as well as those that consumers and patients have identified as being important. By responding to a standardized set of questions administered through a mail or telephone questionnaire, consumers report on their experiences and rate their health plans, hospitals and providers in several areas. CAHPS surveys are administered to a random sample of consumers or patients by independent survey vendors following standardized procedures. The development of CAHPS has been and continues to be a collaborative effort of public and private research organizations. The CAHPS program is funded and managed by the Agency for Healthcare Research and Quality (AHRQ; see www.ahrq.gov). AHRQ works closely with the Centers for Medicare and Medicaid Services (CMS; see www.cms.gov), which has been a major partner in this initiative since 1996. Both of these agencies are part of the U.S. Department of Health and Human Services. The CAHPS Health Plan surveys are designed for use with all types of health insurance enrollees (Commercial, Medicaid, and Medicare) and across the full range of health care delivery systems from fee-for-service to managed care plans. A core survey questionnaire is available for adults concerning their own experiences and for parents concerning the experiences of their children. Supplemental questions have been developed as modules for people with chronic conditions and special health care needs. AHRQ provides the CAHPS Health Plan Survey and Reporting Kit to all interested users through the CAHPS User Network. The Kit provides everything required to field the survey and report the results and includes survey questionnaires, a data analysis program and report templates. Further information and technical assistance are also available from the User Network, which can be reached through www.cahps.ahrq.gov or through the helpline at 1-800-492-9261. About the CAHPS® Database
The National CAHPS Benchmarking Database (the CAHPS Database) is the national repository for data from the CAHPS family of surveys. The primary purpose of the CAHPS Database is to facilitate comparisons of CAHPS survey results by and among survey sponsors. This voluntary compilation of survey results from a large pool of sponsors into a single national database enables participants to compare their own results to relevant benchmarks (i.e., reference points such as national and regional averages). The CAHPS Database also offers an important source of primary data for research related to consumer assessments of quality as measured by CAHPS surveys.

2008 CAHPS-HP 3.0/4.0 Child Medicaid Sponsor Report C-2
The CAHPS Database consists of three major components, each with its own line of products and services: • CAHPS Health Plan Survey Database: This database currently contains 10 years of data
from over 3.2 million respondents sampled from enrollees in commercial, Medicaid, State Children’s Health Insurance Program (SCHIP), and Medicare Managed Care health plans. Major products supporting benchmarking and research related to the CAHPS Health Plan Survey include: Sponsor Reports: Each fall, participating Medicaid and SCHIP sponsors receive a free,
customized report comparing their results to appropriate national benchmarks, including national and regional distributions.
Annual Chartbooks: These reports published each fall, present cross-sector comparisons
of CAHPS Health Plan Survey results for commercial (adult and child), Medicaid (adult and child), SCHIP (child), and Medicare (adult) populations.
Research Files: The CAHPS Database aggregates respondent-level data files across
sponsors and health plans for the commercial, Medicaid, and SCHIP populations. Researchers may gain authorized access to data needed to help answer important health services research questions related to consumer assessments of quality.
• CAHPS Hospital Survey (H-CAHPS) Database: This database currently contains 3 years of data from 2005 - 2007 contributed by over 2,300 hospitals. Products include a series of Chartbooks presenting summary-level H-CAHPS survey results by selected hospital characteristics, such as bed size, region, teaching status, and ownership. Participants receive detailed Excel data files of the Chartbook tables and charts, which enable hospitals and vendors to make direct comparisons to their own results, as well as percentile scores adjusted for mode of survey administration and patient case-mix. The H-CAHPS data contributed by participating hospitals and vendors are also made available for authorized research purposes.
• CAHPS Clinician & Group Survey Database: This database is currently under development as survey sponsors begin to implement the new CAHPS Clinician & Group Survey, which was endorsed by the National Quality Forum in July 2007. Anticipated products include annual Chartbook and research files.
In addition, the CAHPS Database provides national data used by policymakers and others through such publications as the AHRQ National Healthcare Quality and Disparities Reports. The CAHPS Database also provides customized support and technical assistance to survey sponsors as time and resources permit.
Administration of the CAHPS Database The CAHPS Database is sponsored and funded by the Agency for Healthcare Research and Quality (AHRQ) and administered by Westat. Oversight and direction for the project are provided by an Advisory Group composed of representatives of survey sponsors from the public and private sectors as well as members of the CAHPS Consortium. Further information about the CAHPS Database is available through the Web site at (https://www.cahps.ahrq.gov).

2008 CAHPS-HP 3.0/4.0 Child Medicaid Sponsor Report C-3
Use of the CAHPS Database for Benchmarking A central purpose of the CAHPS Database is to facilitate comparisons of CAHPS survey results by survey sponsors. By compiling CAHPS survey results from a variety of sponsors into a single national database, the CAHPS Database enables purchasers and plans to compare their own results to relevant national benchmarks, in order to identify performance strengths as well as opportunities for improvement. Survey sponsors participate in the CAHPS Database by submitting their CAHPS survey data according to specified guidelines. In return, sponsors receive a customized Sponsor Report that compares their own results to appropriate benchmarks derived from the CAHPS Database. Comparative data include national, regional and product type distributions of the CAHPS results. Sponsors also receive a quarterly electronic newsletter with updates and sponsor profiles, as well as opportunities to interact with other participants through User Group activities. Use of the CAHPS Database for Research Researchers may gain authorized access to data from the CAHPS Database to help answer important health services research questions related to consumer assessments of quality as measured by CAHPS. CAHPS data are available for researchers who submit an application and sign a data release agreement that ensures the confidentiality of the data. A description of the data application process and a list of current research projects are included on the Web site (https://www.cahps.ahrq.gov). CAHPS Database Chartbook In 2001, staff from the CAHPS Database produced an annual report that included cross-sector comparisons of CAHPS survey results for the current year’s data between the Commercial (adult and child), Medicaid (adult and child) and Medicare populations. In 2002, the annual report was replaced with a Chartbook that Sponsors can use to assess plan performance and identify opportunities for improvement by comparing their survey results to national distributions. The annual Chartbook provides comparative data to Sponsors in a rapid timeframe (early fall) and is posted on the Web site (https://www.cahps.ahrq.gov). Custom Analyses and Reports In addition to customized Sponsor Reports and the annual Chartbook, CAHPS Database staff is available to conduct specialized data analyses and reports upon request. All analyses and reports will adhere to data policies regarding confidentiality of respondents, plans and sponsors.

2008 CAHPS-HP 3.0/4.0 Child Medicaid Sponsor Report C-4
Guidelines for Using Sponsor Reports
The CAHPS Database Advisory Group has adopted the following principles to guide participating sponsors in their use of Sponsor Reports from the CAHPS Database: 1. Health plan and sponsor comparisons to national distributions and benchmarks are intended
to support efforts to improve health plan performance, care delivery and health care purchasing strategies.
2. Participating sponsors are encouraged to use comparative data from the CAHPS Database
to identify areas for focusing improvement efforts and for demonstrating accountability. For example,
• Sponsors can develop improvement plans and targets based on differences that show
possible areas for improvement.
• Sponsors can document areas in which performance is high relative to CAHPS Health Plan Survey Database distributions and benchmarks in order to reward excellence and create incentives for continued improvement.
3. Comparative data from the CAHPS Database are not designated for advertising purposes.
Health plan sponsors choosing to use results from their Sponsor Reports in paid advertising or promotions are encouraged to follow the guidelines for advertising developed by the National Committee for Quality Assurance (available through the NCQA Web site located at: www.ncqa.org).
4. Participating sponsors should include the following statement when using data or
information provided in Sponsor Reports in any publication:
“The source for comparative CAHPS® survey data used in this publication is the National CAHPS Benchmarking Database (CAHPS Database). Any analysis, interpretation, or conclusion based on these data is solely that of the authors. The CAHPS Database is a collaborative initiative of Westat and Shaller Consulting, with funding provided by the U.S. Agency for Healthcare Research and Quality.”
For assistance with using CAHPS data for quality improvement and value-based purchasing, call the CAHPS User Network helpline at 1-800-492-9261 or email [email protected].

2008 CAHPS-HP 3.0/4.0 Child Medicaid Sponsor Report C-5
Report Methodology Sponsor Reports follow CAHPS consumer reporting methods and summarize the survey results using four consumer reports of their experiences with care and four consumer ratings of their experiences with care. Both types of results are described in detail below.
Consumers’ Reports of Their Experiences with Care
CAHPS Health Plan Survey was designed to move beyond satisfaction scores (a function of expectations) to more accurate assessments based on “reports” of the consumer experience. Much investigation went into the design of questions that capture consumer experiences with high quality care. Most of the CAHPS Health Plan Survey questions ask respondents to report on their experiences with different aspects of their care. These reporting questions are combined into groups called composites that address the same aspect of care or service to arrive at a broader assessment. CAHPS 3.0/3.0H reporting questions fall into five major composites that summarize consumer experiences. The CAHPS 4.0 reporting questions fall into four major composites (the “Courteous and Helpful Office Staff” questions were removed from the 4.0 version). The exact composite question items and responses for the 3.0H and 4.0 child Medicaid consumer report are presented in Tables 1 and 2. Table 1. CAHPS Health Plan Survey 3.0H Child Medicaid Composite Question Items
3.0H Child Medicaid Composite Items Response Grouping for Presentation
Getting Needed Care Q7
Since your child joined his or her health plan, how much of a problem, if any, was it to get a personal doctor or nurse for your child you are happy with?
A big problem, A small problem, Not a problem
Q13 In the last 6 months, how much of a problem, if any, was it to see a specialist that your child needed to see?
A big problem, A small problem, Not a problem
Q28 In the last 6 months, how much of a problem, if any, was it to get the care, tests, or treatment for your child that you or a doctor believed necessary?
A big problem, A small problem, Not a problem
Q30 In the last 6 months, how much of a problem, if any, were delays in health care while you waited for approval from your child’s health plan?
A big problem, A small problem, Not a problem
Getting Care Quickly Q18 In the last 6 months, when you called during regular office hours,
how often did you get the help or advice you needed for your child? Never + Sometimes, Usually, Always
Q20 In the last 6 months, when your child needed care right away for an illness, injury, or condition, how often did your child get care as soon as you wanted?
Never + Sometimes, Usually, Always
Q23 In the last 6 months, not counting the times your child needed health care right away, how often did your child get an appointment for health care as soon as you wanted?
Never + Sometimes, Usually, Always
Q31 In the last 6 months, how often was your child taken to the exam room within 15 minutes of his or her appointment?
Never + Sometimes, Usually, Always

2008 CAHPS-HP 3.0/4.0 Child Medicaid Sponsor Report C-6
Doctors Who Communicate Well Q34 In the last 6 months, how often did your child’s doctors or other
health providers listen carefully to you? Never + Sometimes, Usually, Always
Q36 In the last 6 months, how often did your child’s doctors or other health providers explain things in a way you could understand?
Never + Sometimes, Usually, Always
Q37 In the last 6 months, how often did your child’s doctors or other health providers show respect for what you had to say?
Never + Sometimes, Usually, Always
Q40 In the last 6 months, how often did doctors or other health providers explain things in a way your child could understand?
Never + Sometimes, Usually, Always
Q41 In the last 6 months, how often did doctors or other health providers spend enough time with your child?
Never + Sometimes, Usually, Always
Courteous and Helpful Office Staff Q32 In the last 6 months, how often did office staff at your child’s
doctor’s office or clinic treat you and your child with courtesy and respect?
Never + Sometimes, Usually, Always
Q33 In the last 6 months, how often was office staff at your child’s doctor’s office or clinic as helpful as you thought they should be?
Never + Sometimes, Usually, Always
Customer Service Q79 In the last 6 months, how much of a problem, if any, was it to find
or understand this information? A big problem, A small problem, Not a problem
Q81 In the last 6 months, how much of a problem, if any, was it to get the help you needed when you called your child’s health plan’s customer service?
A big problem, A small problem, Not a problem
Q87 In the last 6 months, how much of a problem, if any, did you have with paperwork for your child’s health plan?
A big problem, A small problem, Not a problem
Note: Question numbers correspond to the CAHPS 3.0H Child Medicaid mail survey. Table 2. CAHPS Health Plan Survey 4.0 Child Medicaid Composite Question Items
4.0 Child Medicaid Composite Items Response Grouping for Presentation
Getting Needed Care Q41
In the last 6 months, how often was it easy to get appointments with specialists?
Never, Sometimes, Usually, Always
Q45 In the last 6 months, how often was it easy to get the care, tests, or treatment you thought you needed through your health plan?
Never, Sometimes, Usually, Always
Getting Care Quickly Q4 In the last 6 months, when you needed care right away, how often
did you get care as soon as you thought you needed? Never, Sometimes, Usually, Always
Q6 In the last 6 months, not counting the times you needed care right away, how often did you get an appointment for your health care at a doctor's office or clinic as soon as you thought you needed?
Never, Sometimes, Usually, Always
How Well Doctors Communicate Q29 In the last 6 months, how often did your child’s personal doctor
explain things in a way that was easy to understand? Never, Sometimes, Usually, Always
Q30 In the last 6 months, how often did your child’s personal doctor listen carefully to you?
Never, Sometimes, Usually, Always
Q31 In the last 6 months, how often did your child’s personal doctor show respect for what you had to say?
Never, Sometimes, Usually, Always

2008 CAHPS-HP 3.0/4.0 Child Medicaid Sponsor Report C-7
Q33 In the last 6 months, how often did your child’s personal doctor
explain things in a way that was easy for your child to understand? Never + Sometimes, Usually, Always
Q34 In the last 6 months, how often did your child’s personal doctor spend enough time with your child?
Never + Sometimes, Usually, Always
Health Plan Information & Customer Service Q47 In the last 6 months, how often did customer service at your child’s
health plan give you the information or help you needed? Never, Sometimes, Usually, Always
Q48 In the last 6 months, how often did customer service staff at your child’s health plan treat you with courtesy and respect?
Never, Sometimes, Usually, Always
Note: Question numbers correspond to the CAHPS 4.0 Child Medicaid mail survey. Weighting Items within a Consumer Report Each item of a consumer report is given equal weight in calculating the composite results for CAHPS. Computationally, this implies calculating the mean of each item and then taking an unweighted distribution of the item means to obtain the composite mean. Equal weighting follows from the fact that there is no evidence to suggest that any item is more important than another. For example, the number of members who have a personal doctor is likely to be larger than the number of members who receive care from a specialist. Therefore, survey results will likely include more responses for a question related to personal doctor than for one about a specialist. Despite this difference, the item about specialty care is included in the consumer report or composite with equal weighting because it is regarded as potentially important to every member. Another advantage of equal weighting is that the weights are consistent from year to year, as well as across plans within the same year. Consumers’ Ratings of Their Experiences with Care In both the 3.0 and 4.0 versions of the CAHPS Health Plan Survey, CAHPS collects four separate global ratings to distinguish between important aspects of care. The four questions ask plan enrollees to rate their experiences in the past 6 months with: • their child’s personal doctor or nurse; • the specialist their child saw most often; • child’s health care received from all doctors and other health providers; and • their child’s health plan. Ratings are scored on a 0 to 10 scale, where 0 is the “worst possible” and 10 is the “best possible.” The ratings are analyzed and presented in a three-category display which groups the responses as follows: the percentage of consumers who gave a rating of either 0-6, 7-8, or 9-10. This three-part scale is used because testing by the CAHPS Consortium determined that these cut-points improve the ability to discriminate among plans while simplifying the presentation of results. The same questions and responses for the consumer rating items are used in the 3.0H and 4.0 child Medicaid surveys. The exact rating question items and responses for the 3.0H and 4.0 child Medicaid consumer report are presented in Table in Table 3.

2008 CAHPS-HP 3.0/4.0 Child Medicaid Sponsor Report C-8
Table 3. CAHPS 3.0H and 4.0 Child Medicaid Health Plan Survey Consumer Rating Items 3.0H and 4.0 Child Medicaid Consumer Ratings
3.0H 4.0
Q Number Question Text
Response Grouping for Presentation
Q Number Question Text
Response Grouping for Presentation
Overall Rating of Child’s Personal Doctor Q5
Using any number from 0 to 10, where 0 is the worst personal doctor or nurse possible and 10 is the best personal doctor or nurse possible, what number would you use to rate your child’s personal doctor or nurse?
0-6, 7-8, 9-10 Q36 Using any number from 0 to 10, where 0 is the worst personal doctor possible and 10 is the best personal doctor possible, what number would you use to rate your child’s personal doctor?
0-6, 7-8, 9-10
Overall Rating of Child’s Specialists Q15 Using any number from
0 to 10, where 0 is the worst specialist possible and 10 is the best specialist possible, what number would you use to rate your child’s specialist?
0-6, 7-8, 9-10 Q43 Using any number from 0 to 10, where 0 is the worst specialist possible and 10 is the best specialist possible, what number would you use to rate your child’s specialist?
0-6, 7-8, 9-10
Overall Rating of Child’s Health Care Q51 Using any number from
0 to 10, where 0 is the worst health care possible and 10 is the best health care possible, what number would you use to rate your child’s health care in the last 6 months?
0-6, 7-8, 9-10 Q12 Using any number from 0 to 10, where 0 is the worst health care possible and 10 is the best health care possible, what number would you use to rate all your child’s health care in the last 6/12 months?
0-6, 7-8, 9-10
Overall Rating of Child’s Health Plan Q88 Using any number from
0 to 10, where 0 is the worst health plan possible and 10 is the best health plan possible, what number would you use to rate your child’s health plan?
0-6, 7-8, 9-10 Q51 Using any number from 0 to 10, where 0 is the worst health plan possible and 10 is the best health plan possible, what number would you use to rate your child’s health plan?
0-6, 7-8, 9-10
Note: Question numbers correspond to the CAHPS 3.0H and 4.0 Child Medicaid mail surveys.

2008 CAHPS-HP 3.0/4.0 Child Medicaid Sponsor Report C-9
Chronic Conditions Questions (3.0H and 4.0) Sponsors using the child survey choose whether or not to include the chronic conditions screener items and questions for children with special health care needs. The screener items and questions consist of the following:
• A 5-item screener that uses current health consequences or service use criteria to non-categorically identify children with special health needs. Children identified by the screener as having a special health care need form the denominator for the questions.
• The CAHPS Health plan Survey Database does not report the chronic conditions
questions at the composite level; instead, results are grouped by content area and reported at the item level. The content areas for the question items are as follows:
• Parents’ experiences with prescription medicine • Parents’ experiences getting specialized services for their children • Family centered care:
Parents' experiences with the child's personal doctor or nurse Parents' experiences with shared decision-making Parents' experiences with getting needed information about their child's
care • Parents’ experiences with coordination of their child’s care
The content areas and specific items for the chronic conditions questions in the 3.0H and 4.0 versions of the child surveys are presented in Table 4 and 5 respectively. Table 4. CAHPS 3.0H Chronic Conditions Questions by Category
Chronic Conditions Questions by Category Response Grouping
for Presentation Parents’ Experiences With Prescription Medicine Q90
In the last 6 months, how much of a problem, if any, was it to get your child's prescription medicine?
A big problem, A small problem, Not a problem
Q91 Did anyone from your child’s health plan, doctor’s office, or clinic help you with this problem?
Yes, No
Parents’ Experiences Getting Specialized Services for Their Children
Q64 In the last 6 months, how much of a problem, if any, was it to get special medical equipment for your child?
A big problem, A small problem, Not a problem
Q65 Did anyone from your child’s health plan, doctor’s office or clinic help you with this problem?
Yes, No
Q67 In the last 6 months how much of a problem, if any, was it to get special therapy for your child?
A big problem, A small problem, Not a problem
Q68 Did anyone from your child’s health plan, doctor’s office or clinic help you with this problem?
Yes, No
Q70 In the last 6 months, how much of a problem if any was it to get this treatment or counseling for your child?
A big problem, A small problem, Not a problem
Q71 Did anyone from your child’s health plan, doctor’s office or clinic help you with this problem?
Yes, No

2008 CAHPS-HP 3.0/4.0 Child Medicaid Sponsor Report C-10
Family Centered Care: Parents' experiences with the child's personal doctor or nurse
Q10 Does your child’s personal doctor or nurse understand how these medical, behavioral, or other health conditions affect your child’s day-to-day life?
Yes, No
Q11 Does your child’s personal doctor or nurse understand how your child’s medical, behavioral, or other health conditions affect your family’s day-to-day life?
Yes, No
Family Centered Care: Parents' experiences with shared decision-making
Q47 When decisions were made in the last 6 months, how often did your child's doctors or other health providers offer you choices about your child's health care?
Always, Usually, Sometimes, Never
Q48 When decisions were made in the last 6 months, how often did your child's doctors or other health providers discuss with you the good and bad things about each of the different choices for your child's health care?
Always, Usually, Sometimes, Never
Q49 When decisions were made in the last 6 months, how often did your child's doctors or other health providers ask you to tell them what choices you prefer?
Always, Usually, Sometimes, Never
Q50 When decisions were made in the last 6 months, how often did your child's doctors or other health providers involve you as much as you wanted?
Always, Usually, Sometimes, Never
Family Centered Care: Parents' experiences with getting needed information about their child's care
Q43 In the last 6 months, how often did your child's doctors or other health providers make it easy for you to discuss your questions or concerns?
Always, Usually, Sometimes, Never
Q44 In the last 6 months, how often did you get the specific information you needed form your child's doctors and other health providers?
Always, Usually, Sometimes, Never
Q45 In the last 6 months how often did you have your questions answered by your child's doctors or other health providers?
Always, Usually, Sometimes, Never
Parents’ experiences with coordination of their child’s care Q54 In the last 6 months, did you get the help you needed from your
child's doctors or other health providers in contacting your child's school or daycare?
Yes, No
Q72 In the last 6 months, did your child get care from more than one kind of health care provider or use more than one kind of health care service?
Yes, No
Q73 In the last 6 months, did anyone from your child's health plan doctor's office or clinic help coordinate your child's care among these different providers or services?
Yes, No
Note: Question numbers correspond to the CAHPS 3.0H Child Medicaid mail survey.

2008 CAHPS-HP 3.0/4.0 Child Medicaid Sponsor Report C-11
Table 5. CAHPS 4.0 Chronic Conditions Questions by Category
Chronic Conditions Questions by Category Response Grouping
for Presentation Parents’ Experiences With Prescription Medicine Q53
In the last 6 months, how often was it easy to get prescription medicines for your child through his or her health plan?
Always, Usually, Sometimes, Never
Parents’ Experiences Getting Specialized Services for Their Children
Q17 In the last 6 months, how often was it easy to get special medical equipment or devices for your child?
Always, Usually, Sometimes, Never
Q20 In the last 6 months, how often was it easy to get this therapy for your child?
Always, Usually, Sometimes, Never
Q23 In the last 6 months, how often was it easy to get this treatment or counseling for your child?
Always, Usually, Sometimes, Never
Family Centered Care: Parents' experiences with the child's personal doctor or nurse
Q35 In the last 6 months, did your child’s personal doctor talk with you about how your child is feeling, growing, or behaving?
Yes, No
Q38 Does your child’s personal doctor understand how these medical, behavioral, or other health conditions affect your child’s day-to-day life?
Yes, No
Q39 Does your child’s personal doctor understand how your child’s medical, behavioral, or other health conditions affect your family’s day-to-day life?
Yes, No
Family Centered Care: Parents' experiences with shared decision-making
Q9 Choices for your child’s treatment or health care can include choices about medicine, surgery, or other treatment. In the last 6 months, did your child’s doctor or other health provider tell you there was more than one choice for your child’s treatment or health care?
Yes, No
Q10 In the last 6 months, did your child’s doctor or other health provider talk with you about the pros and cons of each choice for your child’s treatment or health care?
Yes, No
Q11 In the last 6 months, when there was more than one choice for your child’s treatment or health care, did your child’s doctor or other health provider ask you which choice was best for your child?
Yes, No
Family Centered Care: Parents' experiences with getting needed information about their child's care
Q8 In the last 6 months, how often did you have your questions answered by your child’s doctors or other health providers?
Always, Usually, Sometimes, Never
Parents’ experiences with coordination of their child’s care Q15 In the last 6 months, did you get the help you needed from your
child’s doctors or other health providers in contacting your child’s school or daycare?
Yes, No
Q26 In the last 6 months, did anyone from your child’s health plan, doctor’s office, or clinic help coordinate your child’s care among these different providers or services?
Yes, No
Note: Question numbers correspond to the CAHPS 4.0 Child Medicaid mail survey.

2008 CAHPS-HP 3.0/4.0 Child Medicaid Sponsor Report C-12
Sampling Methodology The CAHPS sampling recommendation is to achieve a minimum of 300 completed responses per plan, with a 50 percent response rate. If there are multiple plans in a sponsor’s portfolio, the recommendation is to draw equal sample sizes from each of the plans, regardless of the size of the plan membership, so as to achieve 300 completed responses. Plan samples are not adjusted for unequal probabilities of selection. This logic stems from the principle that the precision of the estimates depends primarily on the size of the sample and not on the size of the population from which it is drawn. Therefore, the given sample size will give the same precision for means or rates regardless of the overall size of the population. For the chronic conditions items, plans have the option of oversampling to collect a sufficient number of respondents that meet the screener criteria. The over sample can be representative of the population or selected from a diagnosis-based algorithm constructed to identify a group having a higher probability of meeting the screening criteria. Within this report, all respondents that met the screening criteria are reported.
Response Rate Calculation In its simplest form, the response rate is the total number of completed questionnaires divided by the total number of respondents selected. Following CAHPS guidelines, the CAHPS Database adjusts response rates according to the following formula:
Number of completed returned questionnaires Total number of respondents selected – (deceased + ineligible)
In calculating the response rate, the CAHPS Database does not exclude respondents who refused, had bad addresses or phone numbers or were institutionalized or incompetent. The tables below present definitions for the categories included and excluded in the response rate calculation.
Numerator Definitions
Inclusions Exclusions
Completed questionnaires - A questionnaire is considered complete if it was coded as complete and has at least one question completed. (For Sponsors that submit to NCQA and the CAHPS Database, the CAHPS Database will include those records marked with a disposition of M10, T10, or I10 – completed by mail, telephone, or internet, respectively).
Surveys not marked with a disposition of M10, T10 or I10 will be excluded, even if the survey is complete.

2008 CAHPS-HP 3.0/4.0 Child Medicaid Sponsor Report C-13
Denominator Definitions
Inclusions Exclusions
♦ Refusals. The sample member refused in writing, or refused to be interviewed.
♦ Nonresponse. The sample member was always unavailable and is presumed to be eligible.
♦ Institutionalized or incompetent respondents. The caregiver or guardian received the survey or was contacted by phone, and the sample member was institutionalized or incompetent and could not be contacted directly.
♦ Bad addresses/phone numbers. The sample member was never located and is considered “nonlocatable” and included in the denominator.
♦ Deceased. Deceased sample members are excluded from the denominator. In some cases a household or family member may have provided information about the death of the sample member.
♦ Ineligible - not enrolled in the plan. The sample member disenrolled from the plan, was never in the plan, or was enrolled in the plan for less than 6 months.
Case Mix Adjustment Several methodological problems complicate the measurement and reporting of health care data, particularly when reports draw comparisons among health plans, as is the case in this report. Among these challenges is the need to adjust appropriately for case-mix differences. Case-mix adjustment takes into account enrollee characteristics that are not under the control of the plan but may affect measures of outcomes or processes, such as demographic and social characteristics or health status. Many of the CAHPS questions ask about aspects of access or processes of care that should not vary by enrollee characteristics. Therefore, case-mix adjustment may be less important for CAHPS data than for outcomes of care, which are known to be influenced by enrollee characteristics in a way that is independent of plan performance. Nonetheless, there are at least two reasons why case-mix adjustment might still be necessary. First, there are certain processes that one would expect to vary according to the characteristics of enrollees. For example, one CAHPS question is "how much of a problem did you have finding or understanding the information from your health plan?" Although it is desirable to communicate clearly with all enrollees, it probably is harder to do so with enrollees who have less education than with other enrollees. Second, enrollee characteristics might influence the response to questions, even if the process of care is the same for different enrollees. For example, individuals' expectations might strongly influence their response to questions asking for evaluations, such as "how often did you get an appointment as soon as you wanted." If an enrollee has very low expectations for the quality of care, he or she might be very satisfied with poor quality. Also, certain types of enrollees may have a general tendency to give positive ratings or have biases that are not associated with the quality of care. For example, some groups of enrollees may generally have more trust and confidence in authority figures and institutions, even if there are no differences in their care.

2008 CAHPS-HP 3.0/4.0 Child Medicaid Sponsor Report C-14
In this report, consumer reports and ratings results were case mix adjusted but item level data and frequencies were not case mix adjusted. Mean scores for composite and ratings measures were adjusted using a linear regression model. The case mix adjustment model included plans members’ age, self-reported health status, and education. These variables were entered into the adjustment model as ordered categories. The resulting case-mix adjusted means were tested for significance as described in the next section.
Testing for Statistical Differences The Sponsor Reports test for statistically significant differences between mean consumer report scores and ratings of individual health plans and the mean of all plan means in the CAHPS Database using the t-test. A significance level of 0.05 or less is considered statistically significant. As described in the previous sections, the mean scores are adjusted for case-mix differences before the statistical tests are applied. To compute the means, reports and rating responses are grouped into three categories and assigned a score of 1, 2 or 3. Then, significance tests for both the reports and ratings are conducted on the mean scores. Individual plan results that differ significantly from the overall mean are denoted by arrows, either pointing up (significantly higher than the overall mean) or down (significantly lower than the overall mean). Readers should note that sample size affects significance testing in at least two important ways. First, due to the large sample sizes in the CAHPS Database, not all statistically significant differences may reflect meaningful differences in plan performance. For example, consider the following data: Composite: Customer Service Plan A - 54.2% CAHPS Database - 56.4% Because of the large sample size for the CAHPS Database, it is possible for Plan A to be statistically below the CAHPS Database distribution. However, purchasers and consumers may not consider a difference of 2.2 percentage points to be an important or meaningful difference in performance. Second, differences in sample size among health plans may mean that two plans with an identical result, but different sample sizes, may produce different results on the statistical significance tests. This is because smaller sample sizes at the plan level yield less precise measures of performance and may be insufficient to achieve statistical significance. Therefore, readers should take sample size into account when interpreting the results of statistical tests. Please refer to the CAHPS Survey and Reporting Kit for more information on substantive or practical significance. Finally, note that this method of determining statistical differences does not translate into plan-to-plan comparisons. For example, if one plan has an up arrow on a particular item and another plan has no arrow for that item, it does not necessarily mean that the first plan’s result is significantly higher than the second because both results were compared to the overall mean.

2008 CAHPS-HP 3.0/4.0 Child Medicaid Sponsor Report C-15
The CAHPS Database Compared to NCQA Quality Compass® While the CAHPS Database is the national repository for CAHPS Health Plan Survey results, the National Committee for Quality Assurance (NCQA) also collects CAHPS results from health plans. NCQA is an independent, non-profit organization that evaluates and reports on the quality of the nations managed care organizations. NCQA evaluates health care through Accreditation (a rigorous on-site review of key clinical and administrative processes) and through the Health Plan Employer Data and Information Set (HEDIS® -- a tool used to measure performance in key areas like immunization and mammography screening rates). Before the development of CAHPS, NCQA collected plan satisfaction data using a HEDIS Member Satisfaction Survey. In 1998, NCQA worked with AHRQ to develop CAHPS 2.0H, a version of the survey with a specified protocol for managed care plans to use to report results to NCQA for accreditation or HEDIS. Effective with HEDIS® 2007, NCQA adopted the 4.0H version of the CAHPS Health Plan Survey, Adult Version to collect information on the experiences of adult members with the health plan. The 3.0H version of the CAHPS Health Plan Survey, Child Version is used to collect information on the experiences of child members with the health plan. Detailed information on the requirements for HEDIS/CAHPS survey reporting is available directly from NCQA (www.ncqa.org). Beginning in 2007, the CAHPS Database entered into a partnership with NCQA to obtain commercial sector CAHPS Health Plan Survey data submitted to NCQA by health plans. Health plans were given the option to approve the use of the data they submitted to NCQA by the CAHPS Database. The purpose of this partnership is to streamline the submission of data for health plans and vendors, and to move to a single, common database for commercial health plan enrollees. Medicaid and SCHIP sponsors still submit CAHPS survey data directly to the CAHPS Database. Many of these sponsors also submit 3.0H data to NCQA. Because NCQA’s purposes for the data differ from those of the CAHPS Database, there are corresponding differences in survey administration, analysis methods, and presentation of the data. The table on the following pages presents differences between the CAHPS Database and the CAHPS 3.0H Medicaid survey data in NCQA’s Quality Compass.

2008 CAHPS-HP 3.0/4.0 Child Medicaid Sponsor Report C-16
CAHPS Health Plan Survey Database NCQA Quality Compass®
Database Participation
Criteria Open to all sponsors of CAHPS surveys that choose to participate (including public and private purchasers and health plans).
Includes health plans that use the HEDIS survey specifications to collect and report results, including plans that are part of NCQA’s accreditation process and those that choose to publicly report their HEDIS results.
Survey Administration
Survey Instrument Standards CAHPS 3.0, CAHPS 3.0H or CAHPS 4.0 CAHPS 3.0H Administration Standards ♦ Administration Survey must be conducted by a third party
vendor according to CAHPS guidelines or the HEDIS protocol.
Survey must be conducted by a NCQA-Certified HEDIS Survey Vendor, using the HEDIS protocol.
♦ Collection mode
Mail, telephone or mixed mode protocols are accepted. Internet enhancement is accepted.
The standard HEDIS protocol includes two options: 1) Mail-only methodology 2) Mixed methodology (mail with telephone follow up). Internet enhancements, other enhancements and alternative protocols must receive prior approval by NCQA.
♦ Sample size Large enough to yield 300 completed surveys per health plan product, a cost-effective method shown to produce statistically useful survey comparisons.
Required sample sizes are set with the goal of achieving 411 completed surveys per health plan product.
♦ Response Rates Target rates are 60% for commercial health plans and 50% for Medicaid, but lower rates are accepted.
Target rate is 55% for commercial and 45% for Medicaid, but lower rates are accepted if HEDIS protocol is followed exactly.
♦ Completion criteria The CAHPS Database includes all records that have been coded as a complete and have at least one completed question.
Surveys used in the calculation of plan level results must have Question 1 and at least 80% of total pertinent questions answered or skipped. Responses to survey questions indicate the member meets the eligible population criteria.

2008 CAHPS-HP 3.0/4.0 Child Medicaid Sponsor Report C-17
National CAHPS® Benchmarking Database NCQA Quality Compass®
Data Analysis and Reporting
Audit Requirements for Data Submission
No formal audit required. The CAHPS Database ensures the quality of submitted data through extensive contact with sponsors and vendors and thorough data cleaning and review of submitted member level files.
Only HEDIS survey measures that have been validated through a HEDIS Compliance Audit™ are eligible for use in Accreditation scoring or for inclusion in NCQA information products (Quality Compass). The focus of the audit is to verify that the sample frame has been prepared correctly.
Survey Results Calculation The CAHPS Database calculates survey results from member-level data files submitted by each sponsor’s vendor.
NCQA receives member-level files from certified vendors and then centrally calculates HEDIS survey results and creates validated member-level data files and plan-level survey results on behalf of each vendor.
Calculation of National Distribution/Average
National distribution is calculated using respondent-level data.
National Average is calculated using plan-level data. Summary averages comprise both publicly and non-publicly reporting plans who submit data to NCQA.
Case Mix Adjustment The CAHPS Database comparisons of reports and ratings are adjusted for respondent age, education, and self-reported health status.
No case mix adjustment used.
Summary Comparisons Statistical differences between plan means and the mean of all plan means are indicated by an arrow up (above the national plan distribution), down (below the national plan distribution), or no arrow (no difference). Summary results also are presented by grouping plans into five percentile categories. (90th -100th ; 75th -89th ; 50th -74th; 25th-49th; below 25th )
Plans are grouped into percentile rate categories. Percentiles are plan rates sorted by score, from lowest to highest. The percentile rates are segmented into 10th, 25th, 50th, 75th, and 90th, with the corresponding rate for the plans that fall within those categories.
Consumer Report Results/Individual Question Items
Consumer report results are presented in three-part bar charts showing the results for “Always”, “Usually” and “Sometimes + Never” or “Not a problem,” “A small problem” and “A big problem.”
Three types of consumer report results are presented: percentage responses for each question option, question summary rates, and global proportions (“always+usually” or “not a problem” depending on the composite).

2008 CAHPS-HP 3.0/4.0 Child Medicaid Sponsor Report C-18
Ratings Ratings are presented using a three-category display for the 0-10 scale questions: 0-6, 7-8, 9-10.
Percent responding to each category are presented as well as the percent responding 8-10 and the percent responding 9-10.
Question Numbering Numbering of questions based on CAHPS 3.0H. Numbering of questions based on CAHPS 3.0H.
CAHPS Health Plan Survey Database NCQA Quality Compass® Summary Reports CAHPS Database Chartbook:
• Published annually in the fall. • Compares consumer reports and ratings for
commercial, Medicaid, SCHIP and Medicare populations.
• Results include consumer reports and ratings, individual question items that make up the composite as well as sections related to key findings, background on CAHPS and the CAHPS Database, and data sources and limitations.
Quality Compass: Published annually in July for Commercial data and
September for Medicaid data sets. Web-based product that compares health plans’
performance and benchmarks of public reporting plans. Detailed and summary level responses are displayed for specific CAHPS measures.
Data are available for Commercial and Medicaid populations.
State of Health Care Quality Report: • Published annually in September. • Compares adult commercial survey reports and ratings
by top and bottom regions and by 90th and 10th percentiles.
Sponsor Reports Participating Medicaid and SCHIP sponsors receive a free, customized Sponsor Report that compares their own results (adjusted for respondent age, education, and self-reported health status) to appropriate benchmarks derived from the CAHPS Database. Comparisons include national, regional, and plan type distributions.
Plans who submit data receive a report that compares their current year results to benchmark results from the previous year.
Access to Data Files • Authorized access to respondent-level data files open to researchers free of charge upon approval by the Executive Research Committee.
• Access requires agreement to maintain confidentiality of sponsor and plan identities.
• Special provisions apply to Medicare data files.
Access to summary and plan-level data files by purchase of Quality Compass® license agreement. Non-identifying respondent level data are also available for purchase.