oregon state university crop & soil science...no 3 ammonium-n nh 4 crop n uptake ammonia loss nh...
TRANSCRIPT
Soil sampling and interpretation
Dan M. Sullivan Oregon State University
Crop & Soil Science
Soil School Multnomah Conservation Districts
April 4, 2015
Why do chemical analysis of soils? • Establish baseline nutrient status
• Determine application rates
• Assess pH and need for liming
• Measure changes over time
• Avoid excess nutrient application
How often to test soil
• Preplant for perennial crops, very important. • Some nutrients (P and K) and lime application
work best if incorporated into top 6 inches of soil (preplant)
• Usually, soil testing every 4 years or so is sufficient
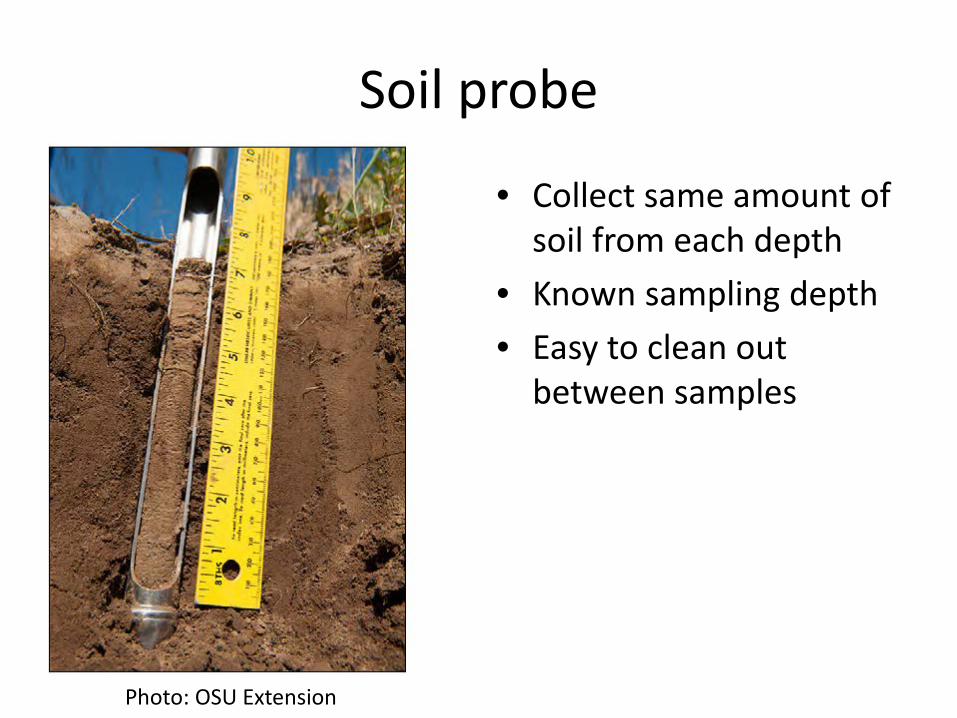
Soil probe
• Collect same amount of soil from each depth
• Known sampling depth • Easy to clean out
between samples
Photo: OSU Extension
Soil sampling depth
• Usually tillage depth (6 to 8 inches)
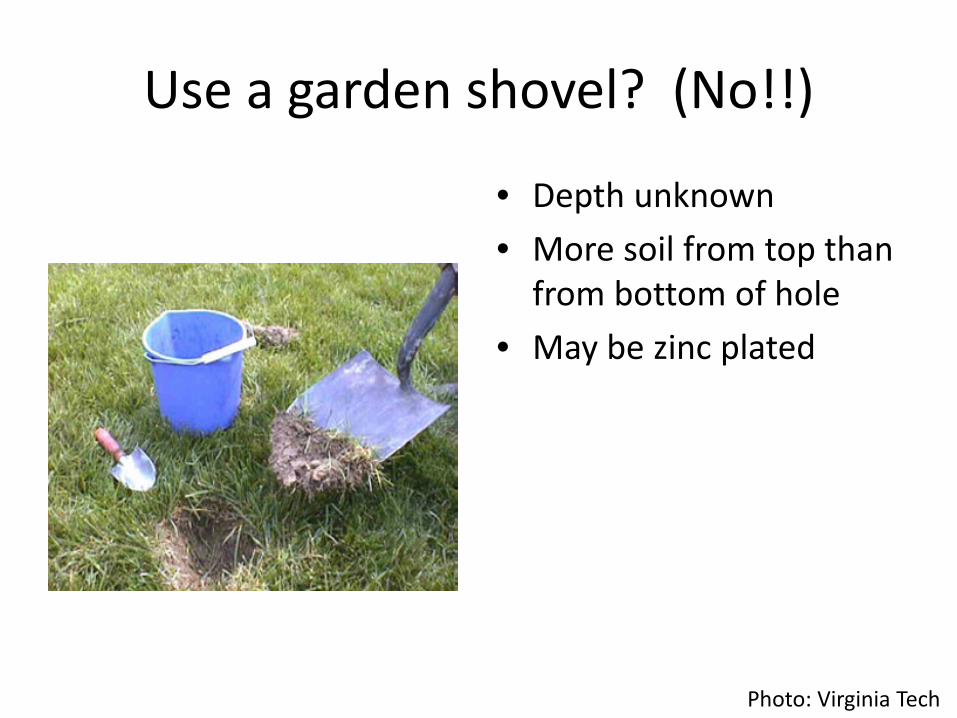
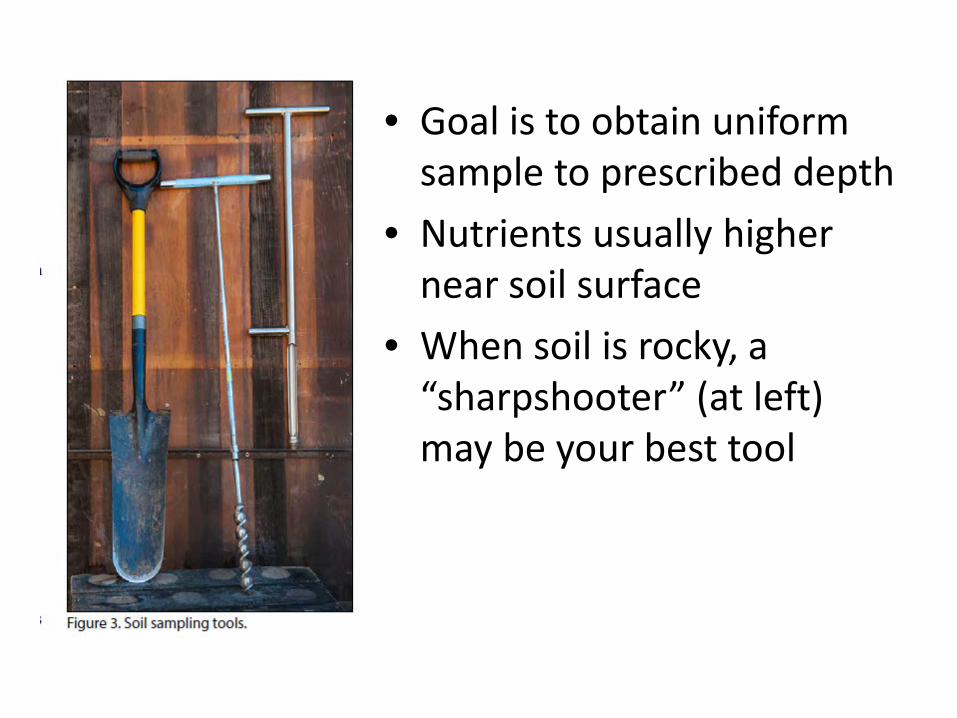
Use a garden shovel? (No!!)
• Depth unknown • More soil from top than
from bottom of hole • May be zinc plated
Photo: Virginia Tech
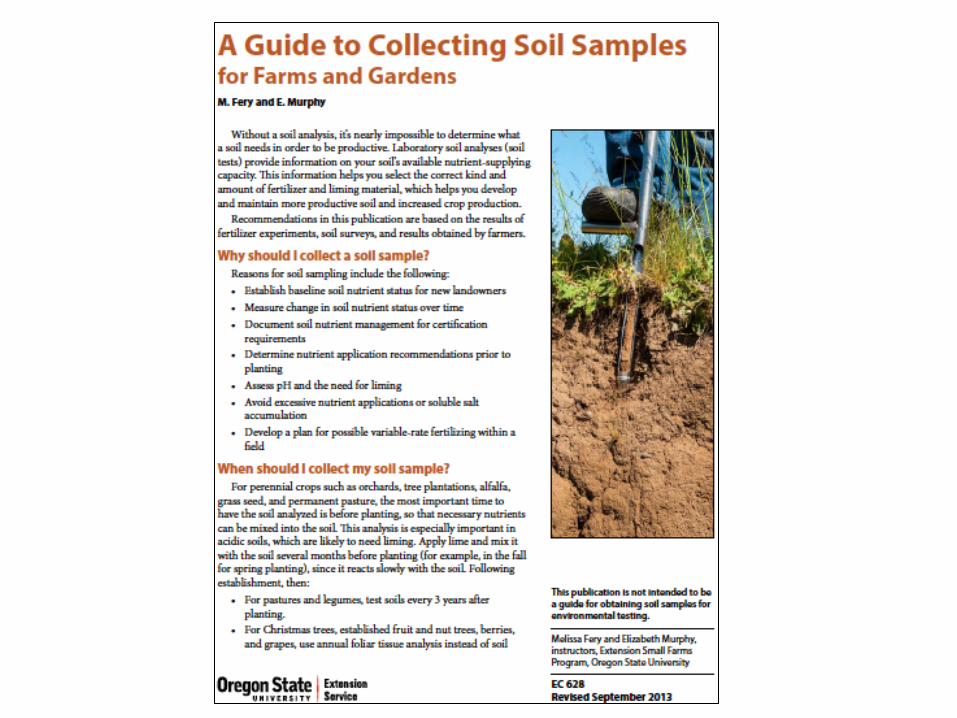
EC 628
• Goal is to obtain uniform
sample to prescribed depth • Nutrients usually higher
near soil surface • When soil is rocky, a
“sharpshooter” (at left) may be your best tool
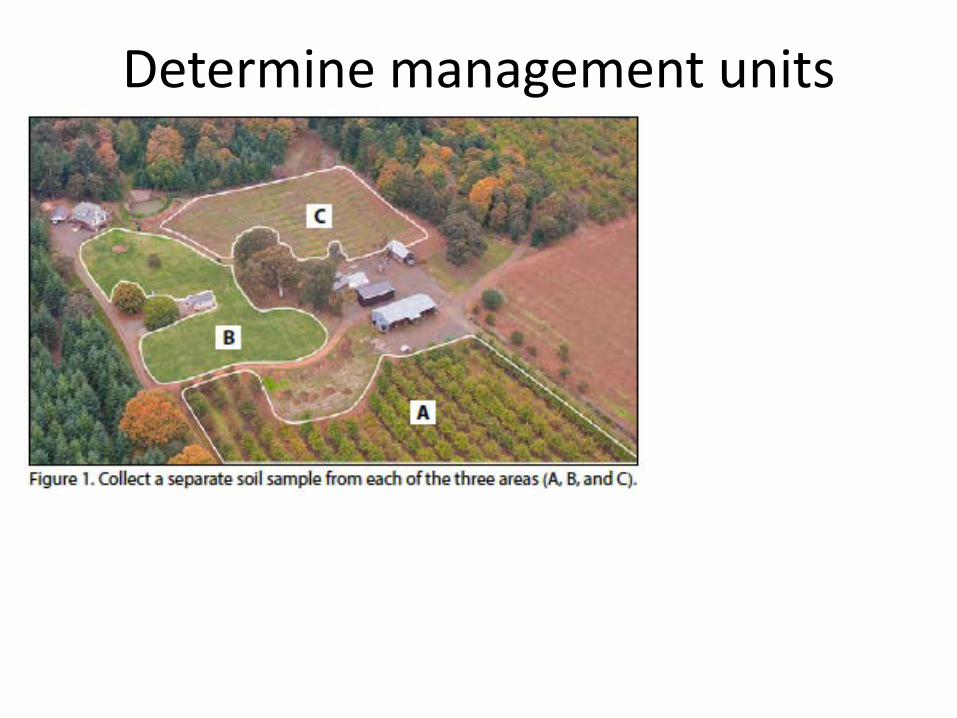
Determine management units
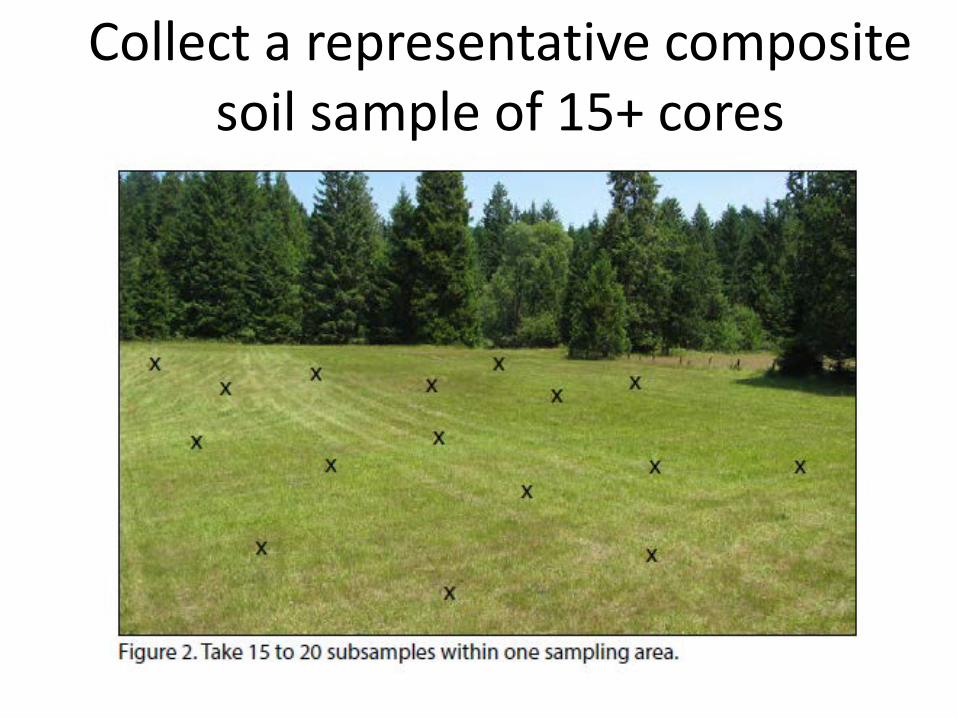
Collect a representative composite soil sample of 15+ cores
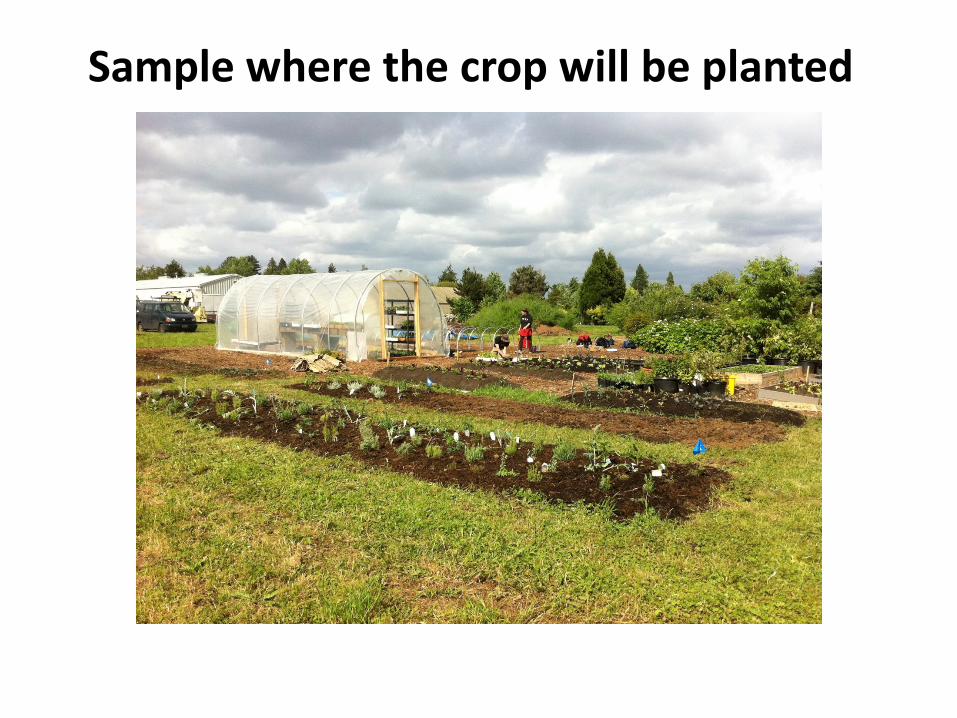
Sample where the crop will be planted
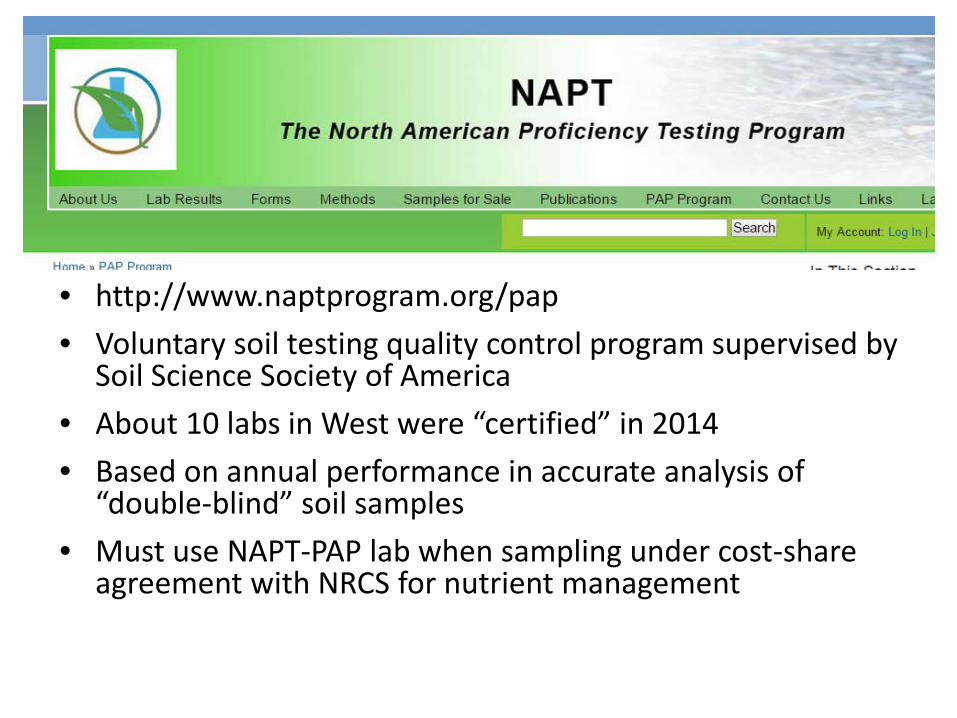
• http://www.naptprogram.org/pap • Voluntary soil testing quality control program supervised by
Soil Science Society of America • About 10 labs in West were “certified” in 2014 • Based on annual performance in accurate analysis of
“double-blind” soil samples • Must use NAPT-PAP lab when sampling under cost-share
agreement with NRCS for nutrient management
Suggestions for best value from soil testing
• Review OSU fertilizer/nutrient guide before you sample. Note sampling depth(s) and recommended soil tests
• Keep soil sampling method consistent (depth, month)
• Send samples to labs that are certified by North American Proficiency Testing Program http://www.naptprogram.org/pap/labs
• Keep records field by field in a database
How are soil tests interpreted?
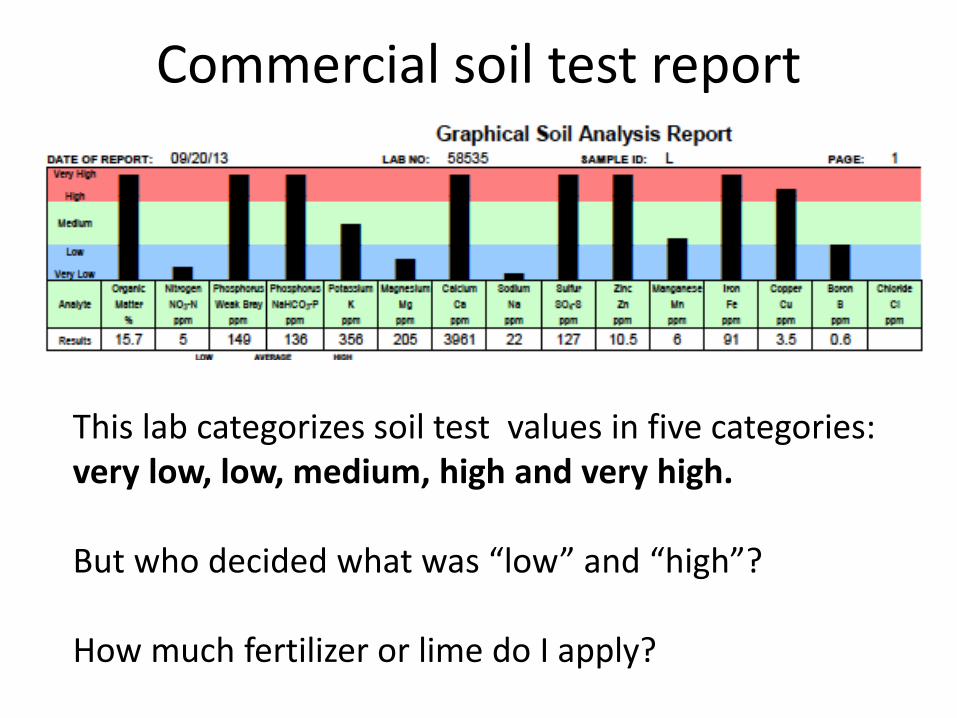
Commercial soil test report
This lab categorizes soil test values in five categories: very low, low, medium, high and very high. But who decided what was “low” and “high”? How much fertilizer or lime do I apply?
• OSU EC 1478-E • Most recent summary of applicable soil test methods
used in the Pacific Northwest • General reference: “approved” method, general
interpretation: low, medium, high, excess • More specific information provided in crop/region
specific nutrient management guides
Secrets of soil test calibration
• Soil test value related to crop yield response for soils in a specific region
• Soil test values by themselves (no calibration to crop yield response) are interesting, but not very useful
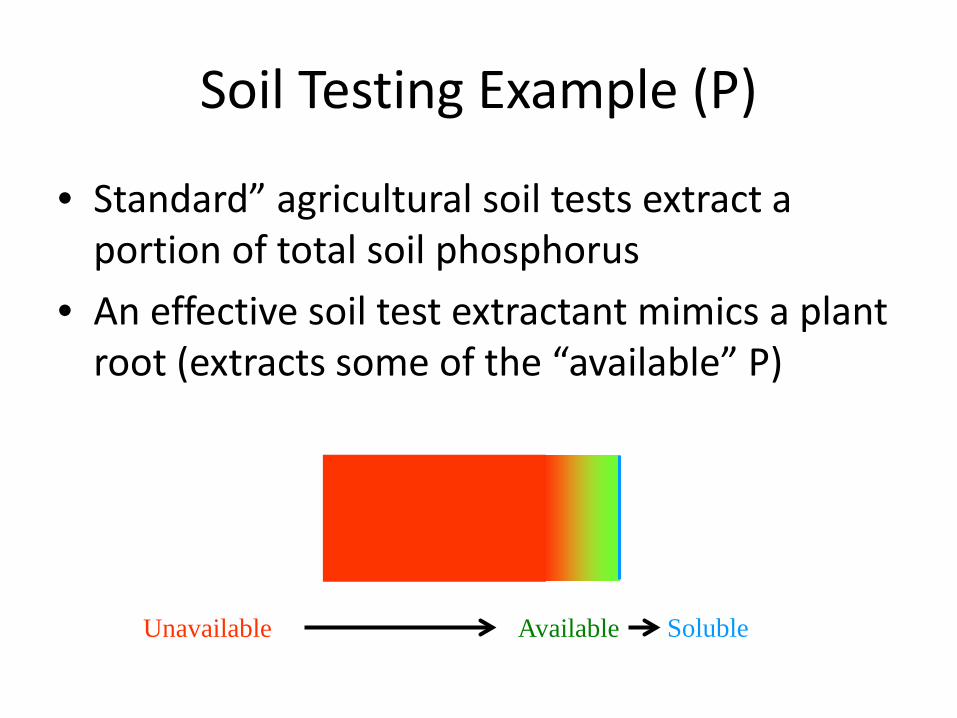
Soil Testing Example (P)
• Standard” agricultural soil tests extract a portion of total soil phosphorus
• An effective soil test extractant mimics a plant root (extracts some of the “available” P)
Available Unavailable Soluble
Soil test value
• “Index” value • Just like you can’t compare Dow vs. NASDAQ
stock indexes, you can’t compare soil test P values obtained with different soil test extractants.
• To have value in diagnosing nutrient need, soil test value needs to be calibrated to crop response to nutrient addition
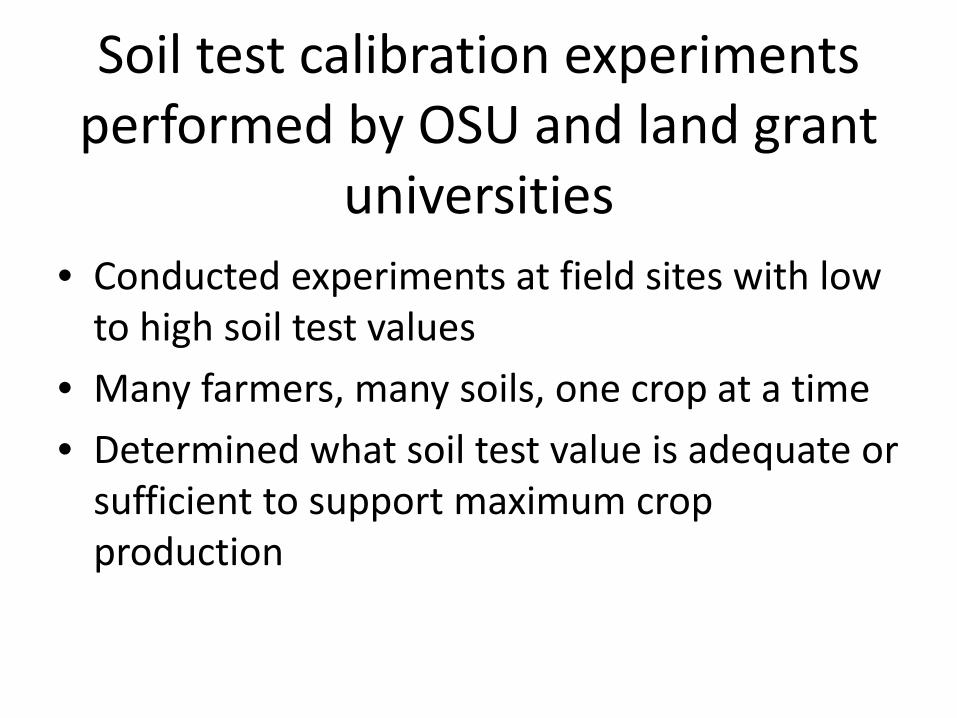
Soil test calibration experiments performed by OSU and land grant
universities • Conducted experiments at field sites with low
to high soil test values • Many farmers, many soils, one crop at a time • Determined what soil test value is adequate or
sufficient to support maximum crop production
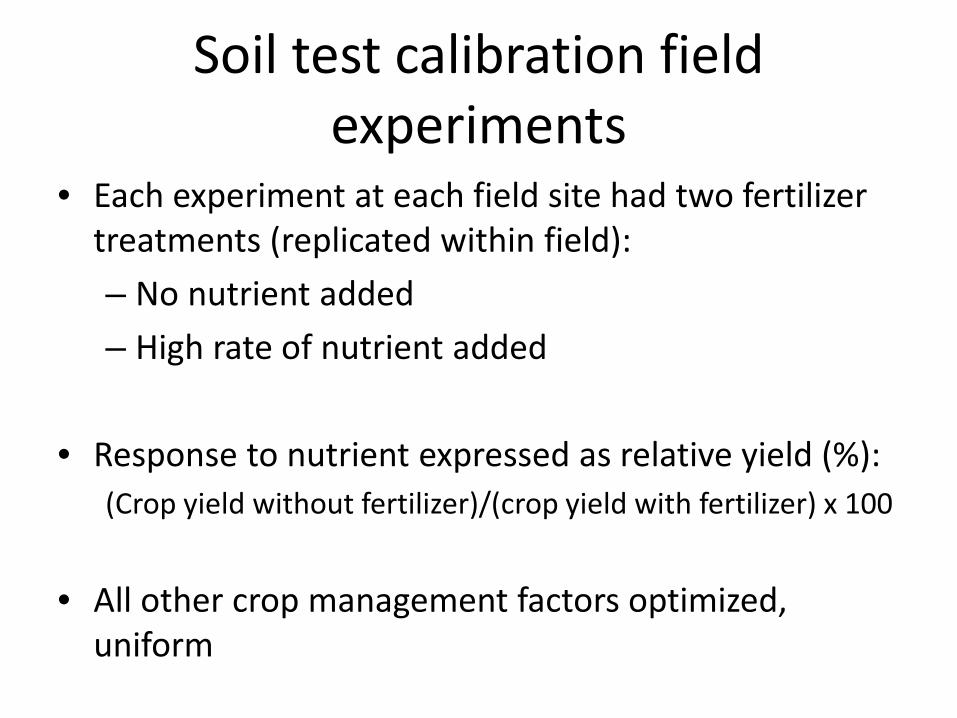
Soil test calibration field experiments
• Each experiment at each field site had two fertilizer treatments (replicated within field): – No nutrient added – High rate of nutrient added
• Response to nutrient expressed as relative yield (%): (Crop yield without fertilizer)/(crop yield with fertilizer) x 100
• All other crop management factors optimized, uniform
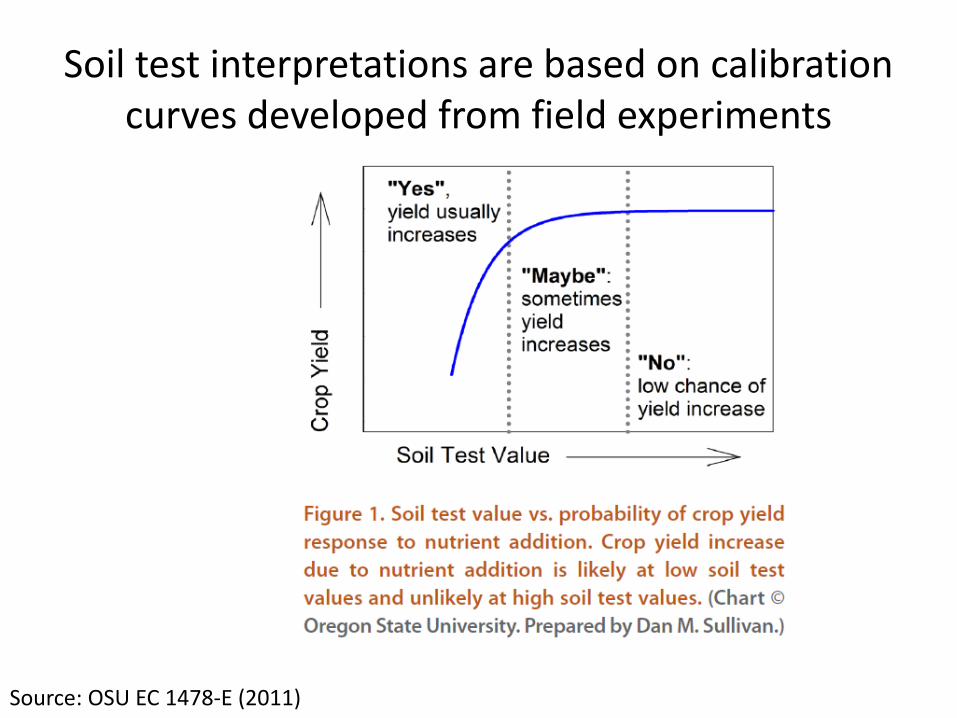
Soil test interpretations are based on calibration curves developed from field experiments
Source: OSU EC 1478-E (2011)
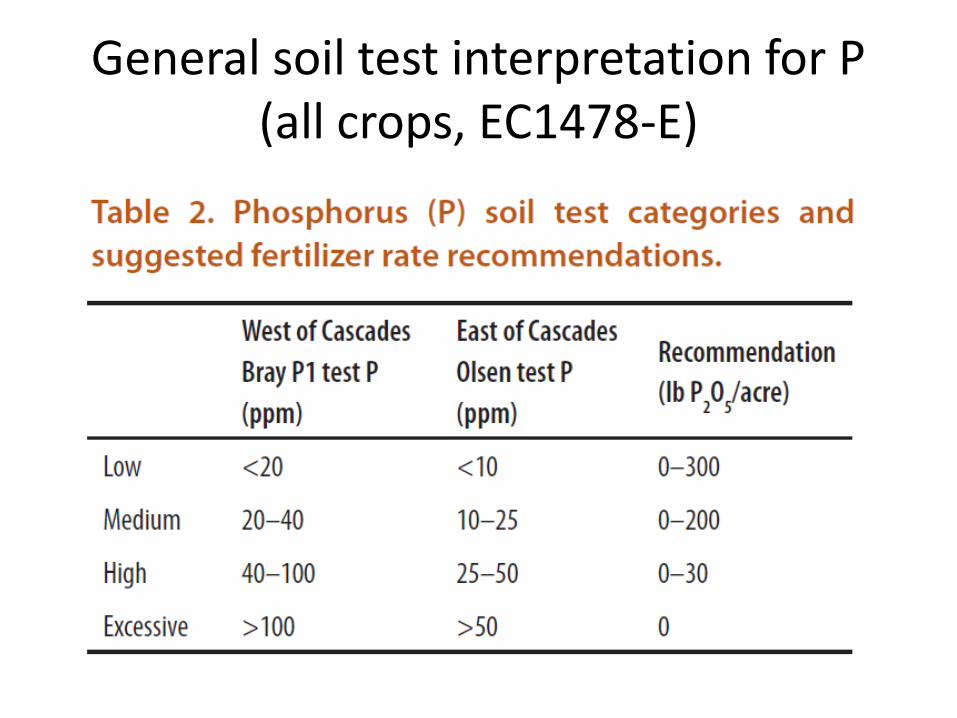
General soil test interpretation for P (all crops, EC1478-E)
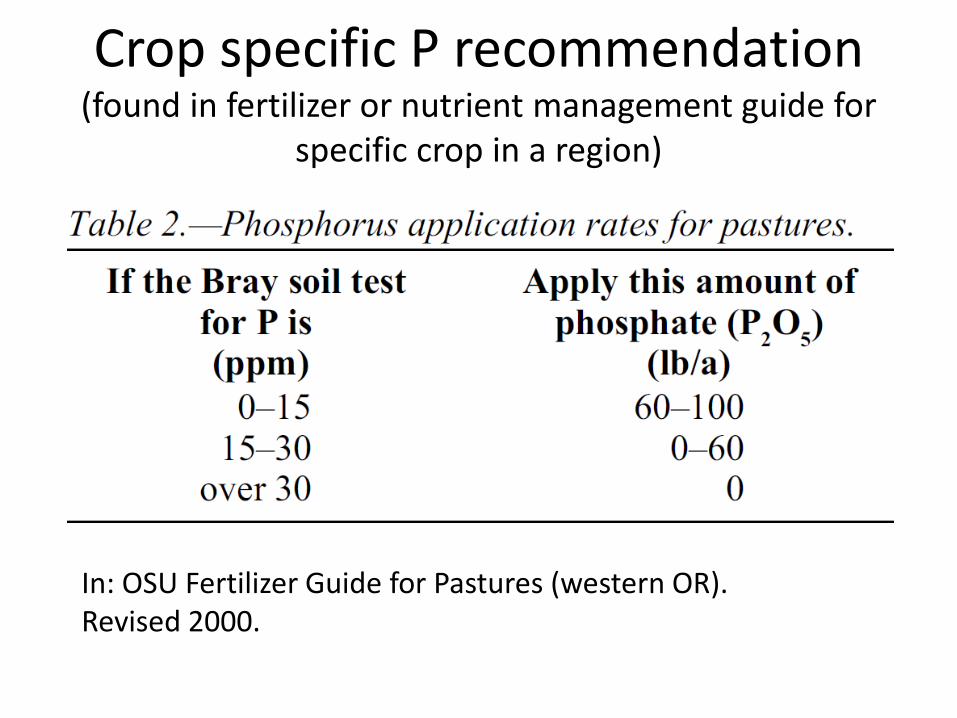
Crop specific P recommendation (found in fertilizer or nutrient management guide for
specific crop in a region)
In: OSU Fertilizer Guide for Pastures (western OR). Revised 2000.
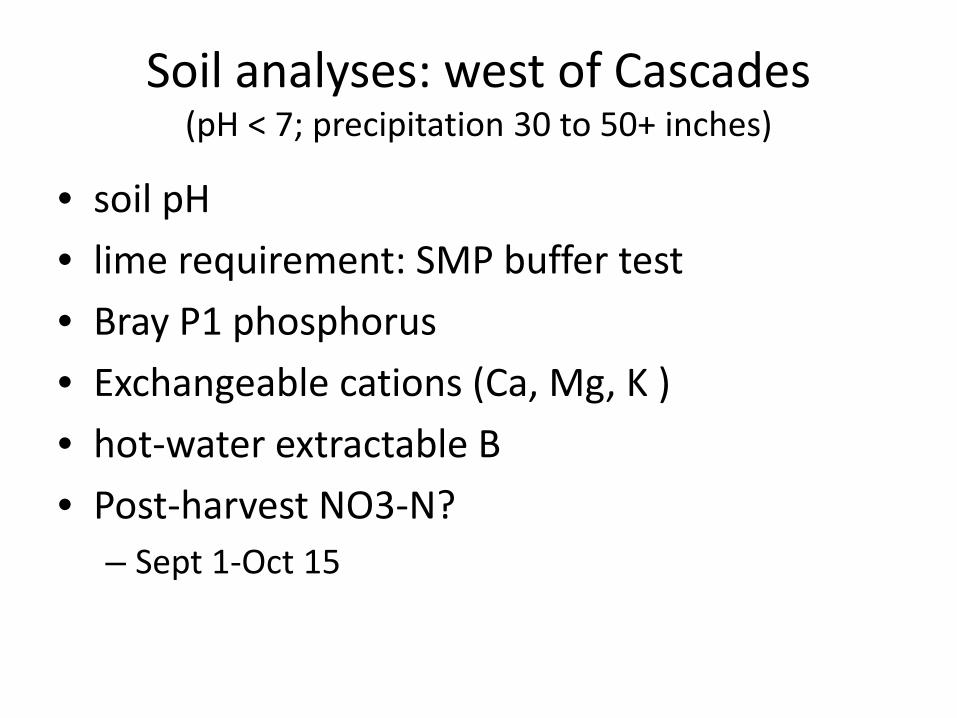
Soil analyses: west of Cascades (pH < 7; precipitation 30 to 50+ inches)
• soil pH • lime requirement: SMP buffer test • Bray P1 phosphorus • Exchangeable cations (Ca, Mg, K ) • hot-water extractable B • Post-harvest NO3-N?
– Sept 1-Oct 15
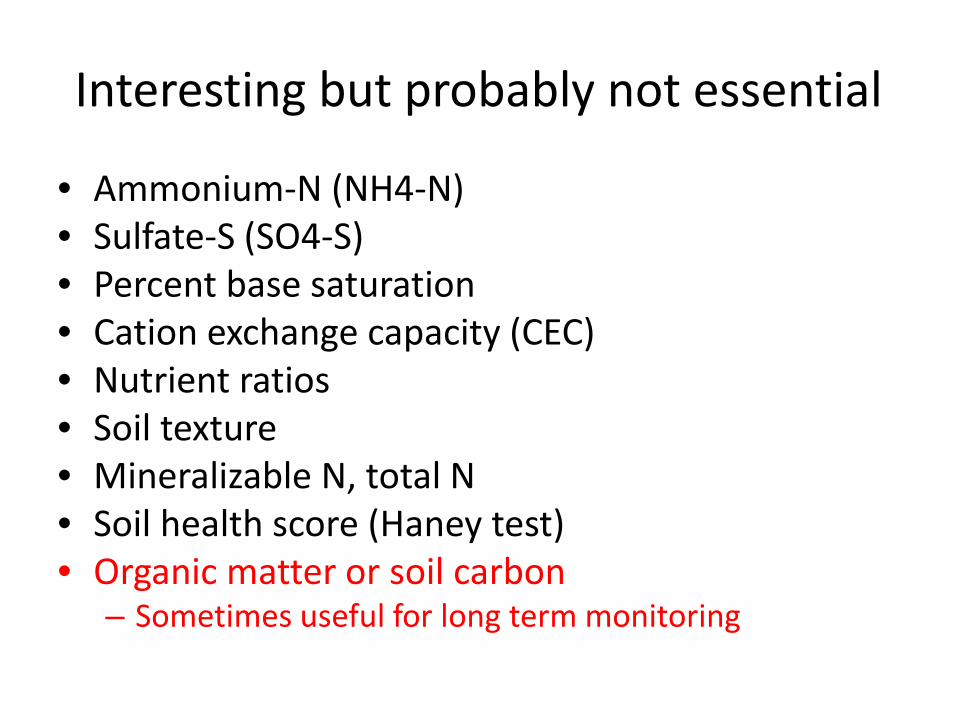
Interesting but probably not essential
• Ammonium-N (NH4-N) • Sulfate-S (SO4-S) • Percent base saturation • Cation exchange capacity (CEC) • Nutrient ratios • Soil texture • Mineralizable N, total N • Soil health score (Haney test) • Organic matter or soil carbon
– Sometimes useful for long term monitoring
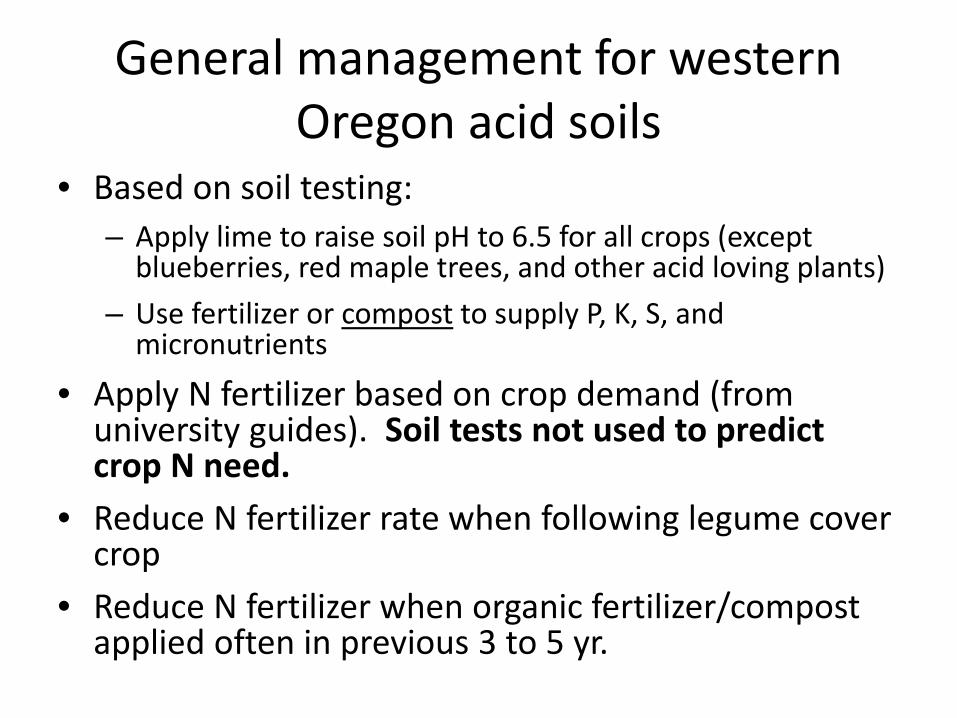
General management for western Oregon acid soils
• Based on soil testing: – Apply lime to raise soil pH to 6.5 for all crops (except
blueberries, red maple trees, and other acid loving plants) – Use fertilizer or compost to supply P, K, S, and
micronutrients
• Apply N fertilizer based on crop demand (from university guides). Soil tests not used to predict crop N need.
• Reduce N fertilizer rate when following legume cover crop
• Reduce N fertilizer when organic fertilizer/compost applied often in previous 3 to 5 yr.
Nitrogen
• N fertilizer application is usually essential • Soil testing is not used to predict crop N need • Nitrogen recommendations in OSU guides are
based on crop response to N fertilizer in field trials
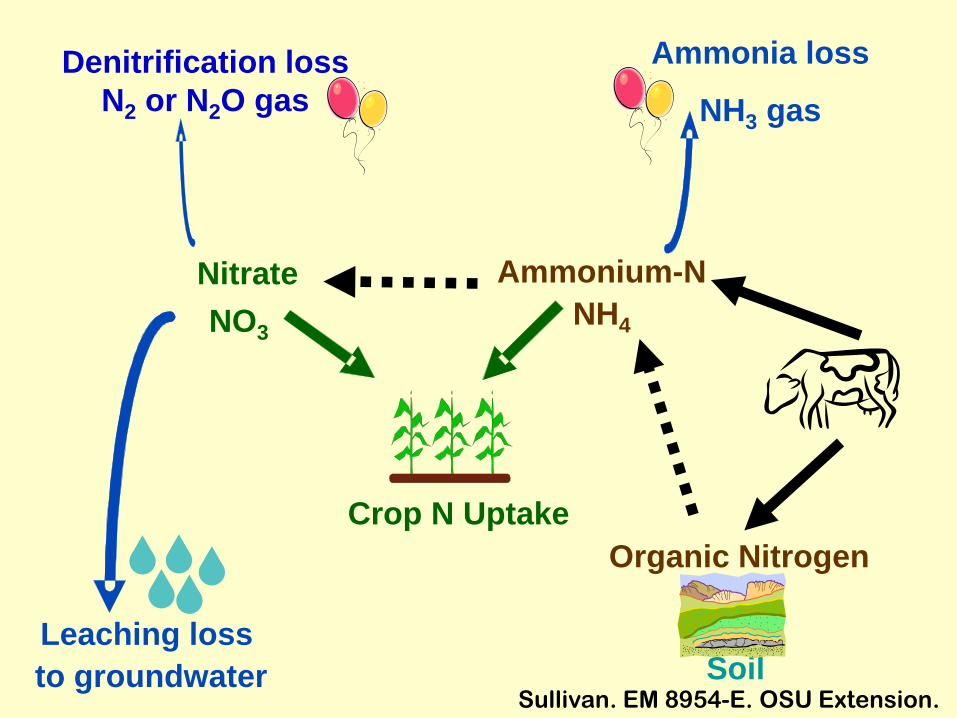
Organic Nitrogen
Leaching loss to groundwater
Nitrate NO3
Ammonium-N NH4
Crop N Uptake
Ammonia loss
NH3 gas Denitrification loss
N2 or N2O gas
Soil Sullivan. EM 8954-E. OSU Extension.
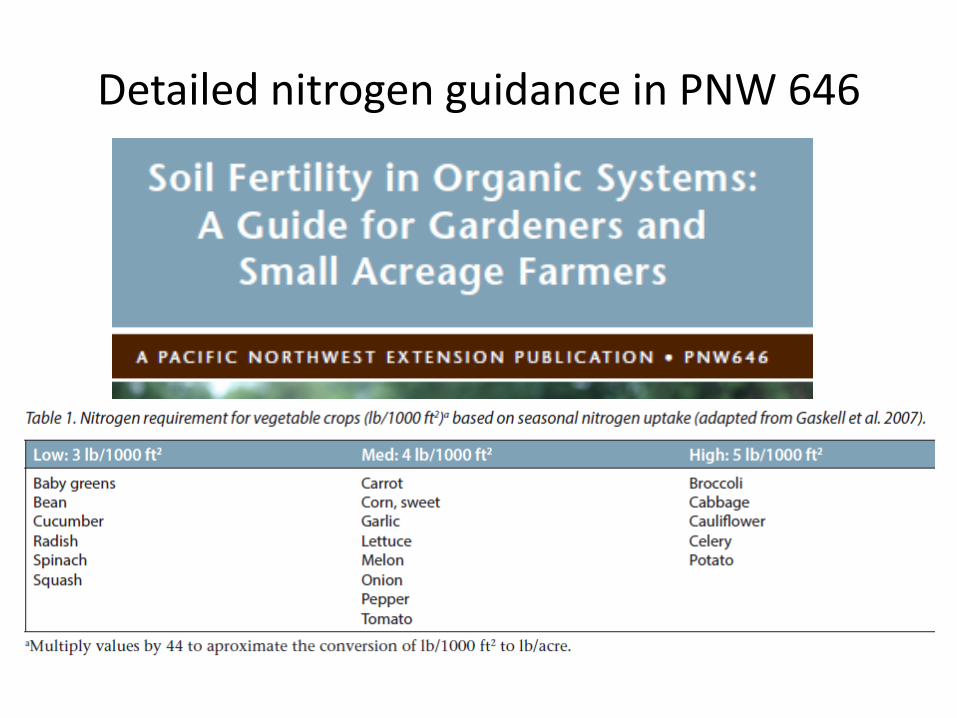
Detailed nitrogen guidance in PNW 646
Soil organic matter
• More N release from soils with frequent manure or compost application
• OSU nutrient management guides already allow for typical N release from soil organic matter
• So, soil organic matter number on your soil test report is interesting, but probably not useful to N management decision
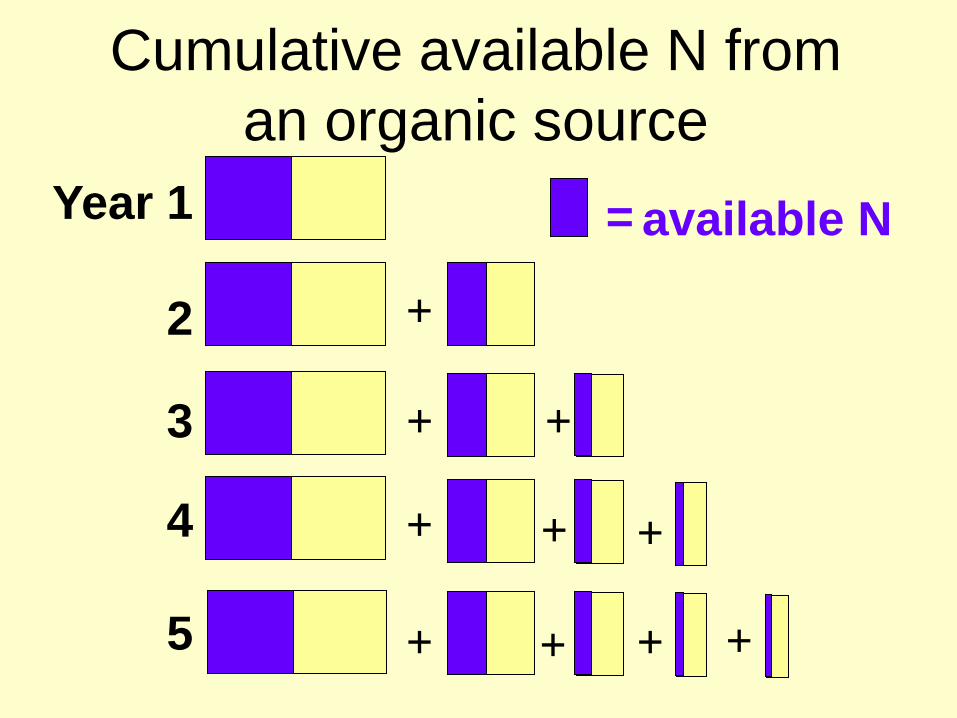
Cumulative available N from an organic source
=
+
+
+ +
+
+ + + +
+
Year 1
2
3
4
5
available N
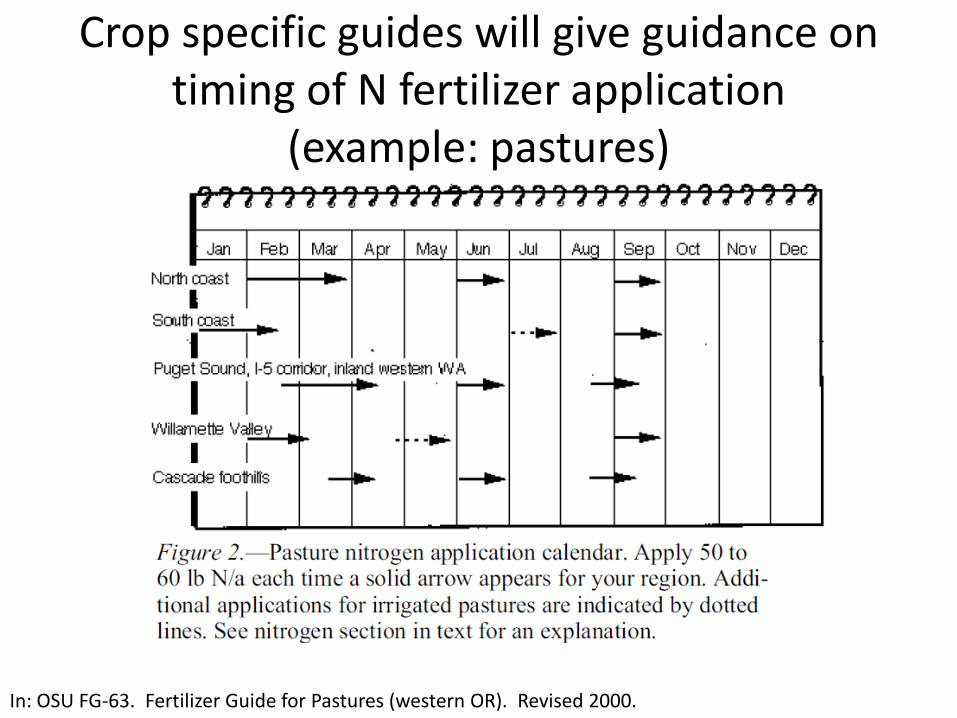
Crop specific guides will give guidance on timing of N fertilizer application
(example: pastures)
In: OSU FG-63. Fertilizer Guide for Pastures (western OR). Revised 2000.
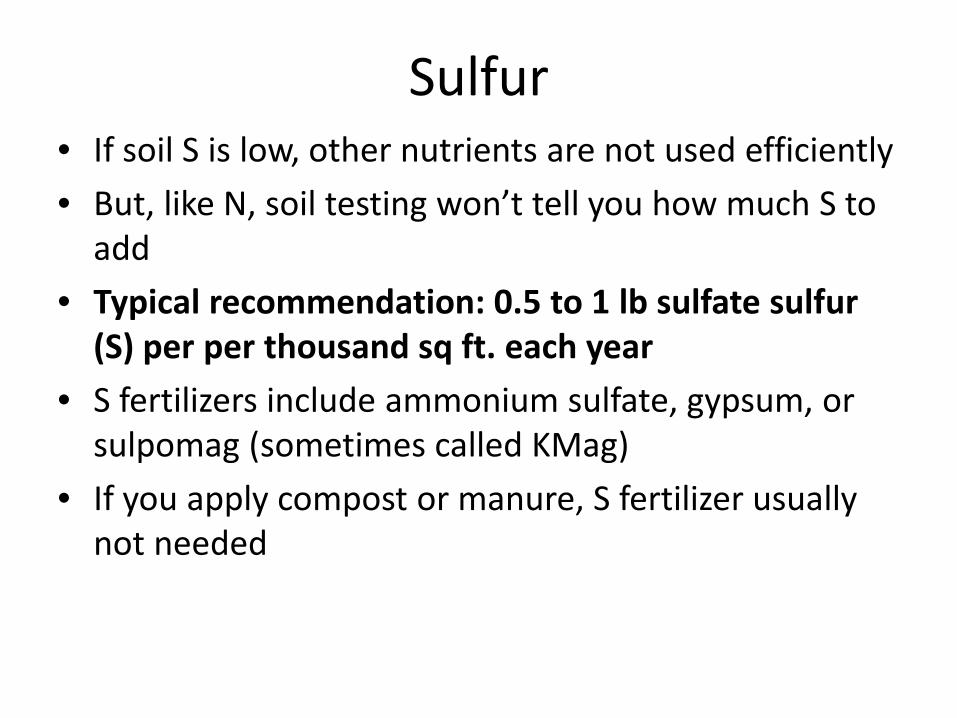
Sulfur • If soil S is low, other nutrients are not used efficiently • But, like N, soil testing won’t tell you how much S to
add • Typical recommendation: 0.5 to 1 lb sulfate sulfur
(S) per per thousand sq ft. each year • S fertilizers include ammonium sulfate, gypsum, or
sulpomag (sometimes called KMag) • If you apply compost or manure, S fertilizer usually
not needed

Orchardgrass – S response
Three most important nutrient management decisions based on soil
testing • Apply lime as needed • Apply lime as needed • Apply lime as needed
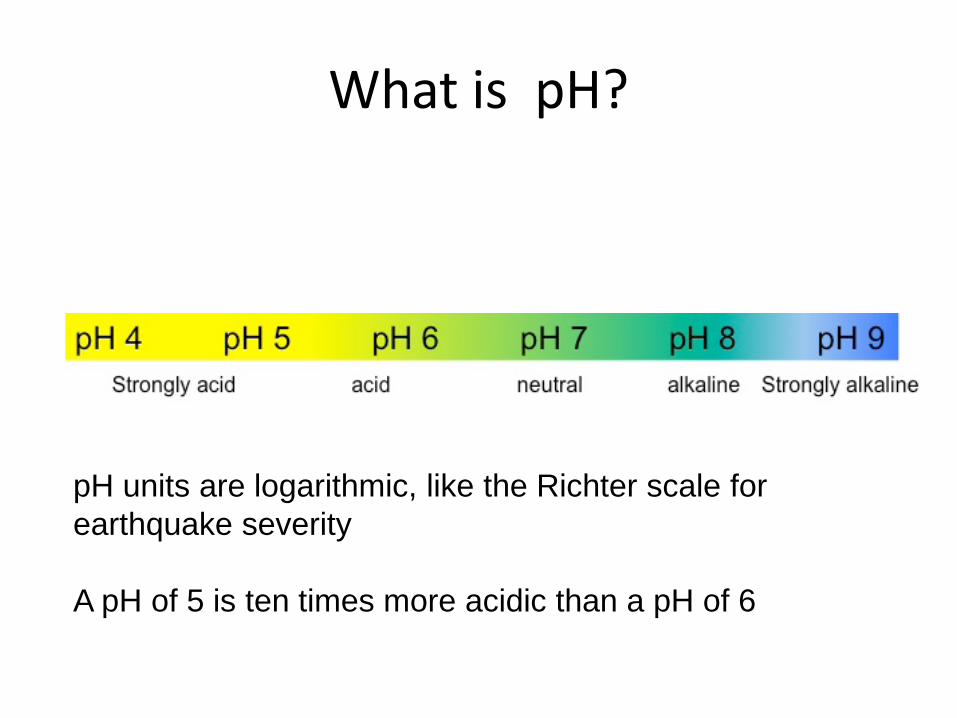
What is pH?
pH units are logarithmic, like the Richter scale for earthquake severity A pH of 5 is ten times more acidic than a pH of 6
What is the effect of soil pH on plants?
When soil is too acidic (low pH): • Plant root growth and crop yield is reduced • Legumes are especially sensitive to acid soil Crops differ in their tolerance to acid soil (low pH)
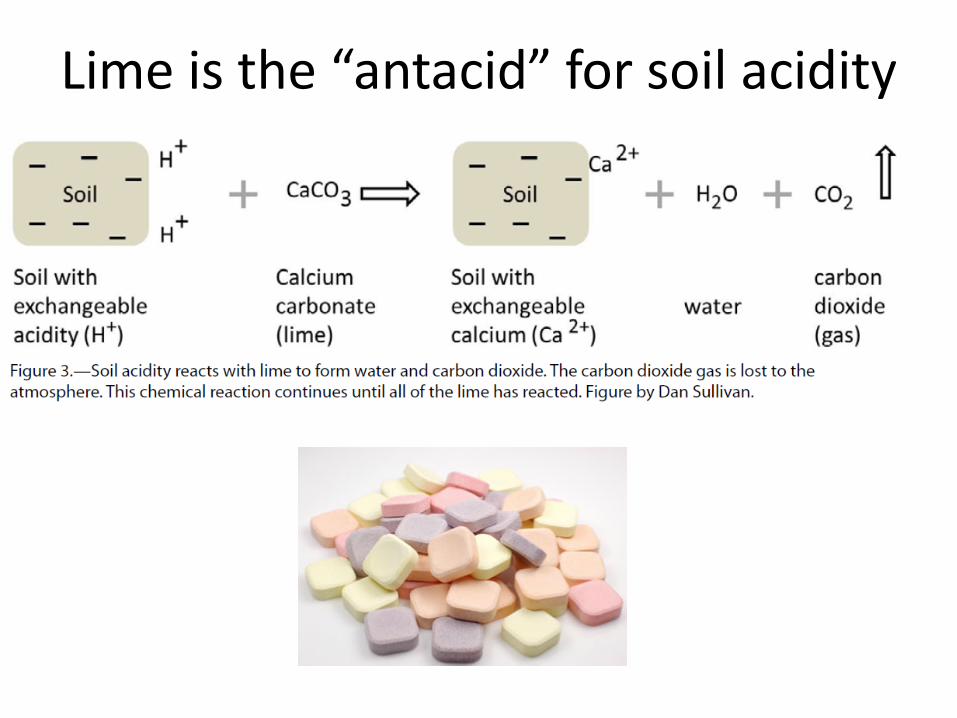
Lime is the “antacid” for soil acidity
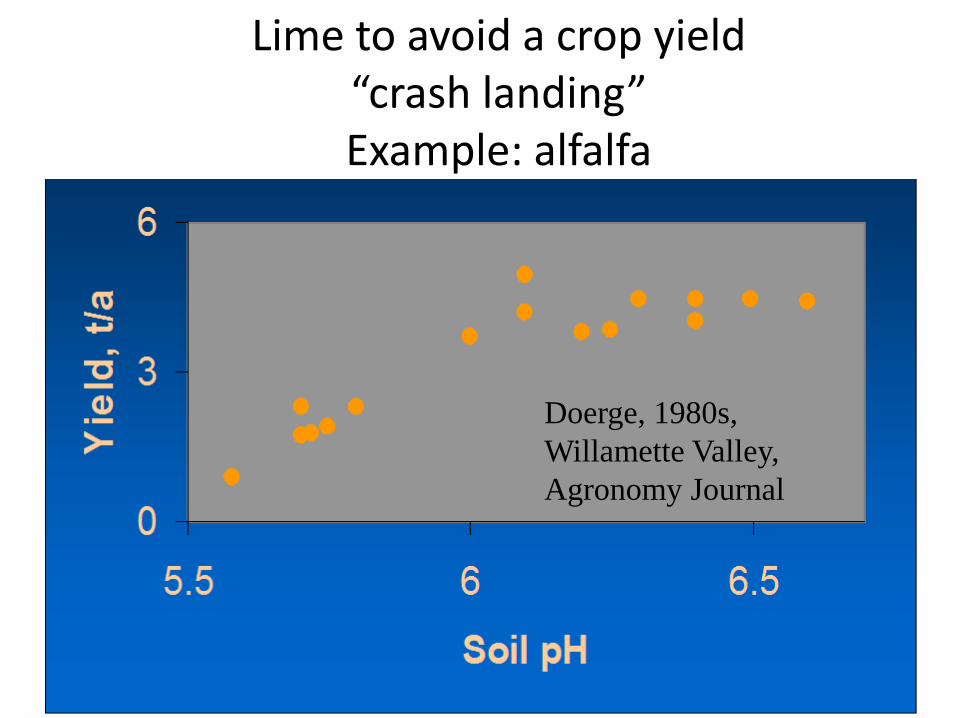
Doerge, 1980s, Willamette Valley, Agronomy Journal
Lime to avoid a crop yield “crash landing” Example: alfalfa
n
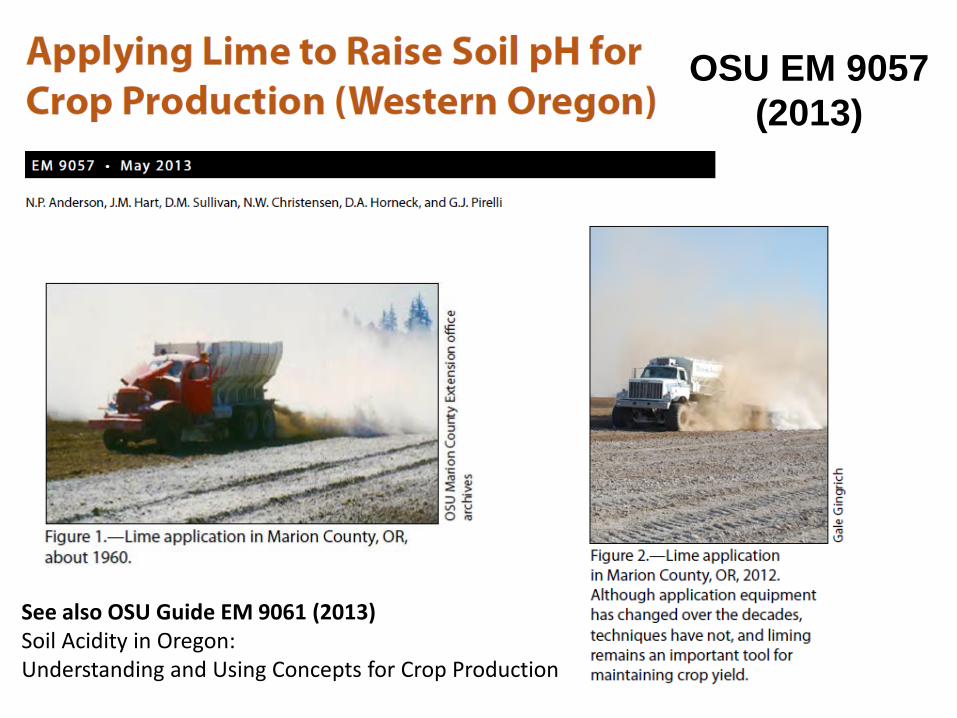
OSU EM 9057 (2013)
See also OSU Guide EM 9061 (2013) Soil Acidity in Oregon: Understanding and Using Concepts for Crop Production

Target for soil pH: above minimum value
Source: OSU EM 9057
When is liming needed?
• Liming “fixes” (increases) soil pH slowly • It takes 6 to 12 months for full reaction with
soil • Lime has to be tilled into soil to get best
results • So plan ahead • If you are planting a perennial agronomic
crop, apply enough lime for the life of the crop
How much lime to apply?
• Goal is to keep soil pH from getting too low. • Use soil testing to determine lime need. • Get on a schedule, like going to the dentist… • Consider applying modest rate of lime every 4
years, rather than a high rate of lime every 10 years.
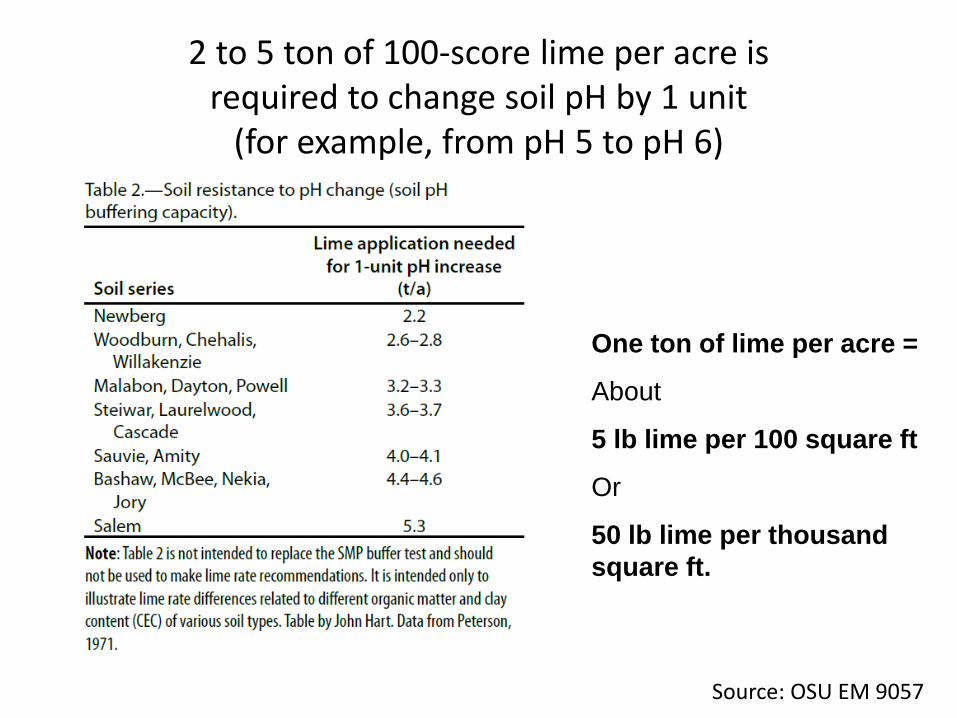
2 to 5 ton of 100-score lime per acre is required to change soil pH by 1 unit
(for example, from pH 5 to pH 6)
One ton of lime per acre =
About
5 lb lime per 100 square ft
Or
50 lb lime per thousand square ft.
Source: OSU EM 9057

Thanks to Jason Faucera, Heidi Noordijk, Weston Miller for their help and encouragement in preparing this presentation.