oregon’s carbon sinks an oregon wild report localizing
TRANSCRIPT

Oregon’s Carbon Sinks an Oregon Wild report localizing national analysis
by the Woods Hole Research Center
June 2011
Electronic copies of this report can be obtained from www.oregonwild.org
Oregon Wild, 5825 N Greeley Blvd, Portland, OR 97217

Clackamas Wilderness, Mount Hood National Forest – Bob
Holmstrom
Key Findings
- Private industrial forests in Oregon are largely
carbon deserts. This is the result of converting
natural forests hundreds of years old to tree
farms that are rarely allowed to grow beyond 40-60 years old before being clear-cut again.
- Public forest lands managed by the US Forest
Service and BLM currently store far more
carbon than private industrial forests. Despite widespread logging on federal lands, they have
been logged less intensively than private lands.
- Both public and private forest lands have the
potential to store much more carbon.
- The highest levels of carbon storage tend to be
found in old-growth forests such as those found
in roadless areas, Wilderness areas, and
protected forest reserves in western Oregon.
- Proposals to increase logging or sell public
BLM lands in western Oregon would have
significant consequences for carbon storage and
climate change. Logging under the WOPR will release 180 million tons of carbon over the next
century compared to letting the forests grow.
This is equivalent to: A) operating the 585 Mw
Boardman Coal-fired power plant for 132 years,
or B) adding one million cars to the road for 132 years.
Carbon desert - post
logging
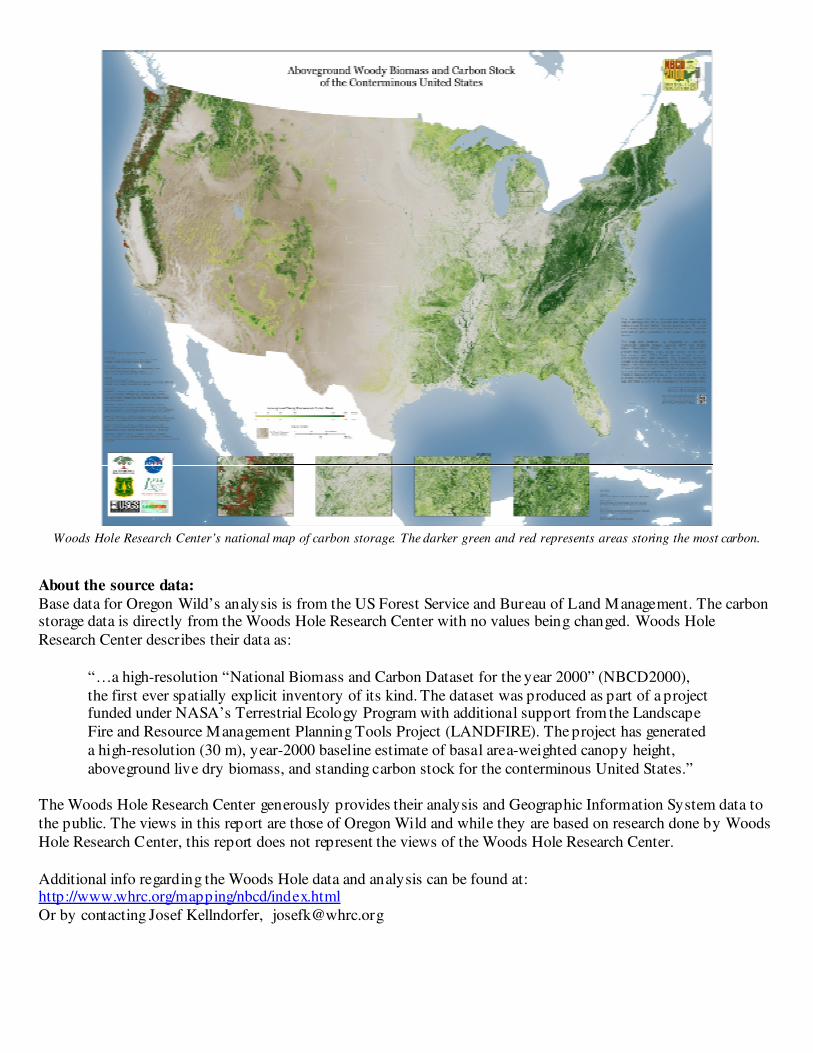
Woods Hole Research Center’s national map of carbon storage. The darker green and red represents areas storing the most carbon.
About the source data:
Base data for Oregon Wild’s analysis is from the US Forest Service and Bureau of Land Management. The carbon storage data is directly from the Woods Hole Research Center with no values being changed. Woods Hole
Research Center describes their data as:
“…a high-resolution “National Biomass and Carbon Dataset for the year 2000” (NBCD2000),
the first ever spatially explicit inventory of its kind. The dataset was produced as part of a project funded under NASA’s Terrestrial Ecology Program with additional support from the Landscape
Fire and Resource Management Planning Tools Project (LANDFIRE). The project has generated
a high-resolution (30 m), year-2000 baseline estimate of basal area-weighted canopy height,
aboveground live dry biomass, and standing carbon stock for the conterminous United States.”
The Woods Hole Research Center generously provides their analysis and Geographic Information System data to
the public. The views in this report are those of Oregon Wild and while they are based on research done by Woods
Hole Research Center, this report does not represent the views of the Woods Hole Research Center.
Additional info regarding the Woods Hole data and analysis can be found at: http://www.whrc.org/mapping/nbcd/index.html
Or by contacting Josef Kellndorfer, [email protected]

Map 1
The upper Mill Creek (tributary to the Umpqua River) watershed in the Oregon Coast Range has a combination of ownerships including the Bureau of Land Management and private timber companies. Map 1 demonstrates a
substantially lower level of carbon storage on private lands in stark contrast to the adjacent public lands managed
by the BLM. This map demonstrates the high levels of potential carbon storage in the Coast Range mountains of
Douglas County. Despite the BLM lands storing vastly higher quantities of carbon, there is still considerable
potential for additional carbon storage if managed for that purpose. Currently there are proposals to sell off or drastically increase logging on many of the publicly owned BLM lands in western Oregon. Based on this analysis,
the areas being considered for sale and/or increased logging would undergo a management change that would
result in storing considerably less carbon. Conclusion: The Oregon Coast Range Mountains have the potential to
store vast amounts of carbon if they aren’t logged and will store very little carbon on private lands under current
practices.
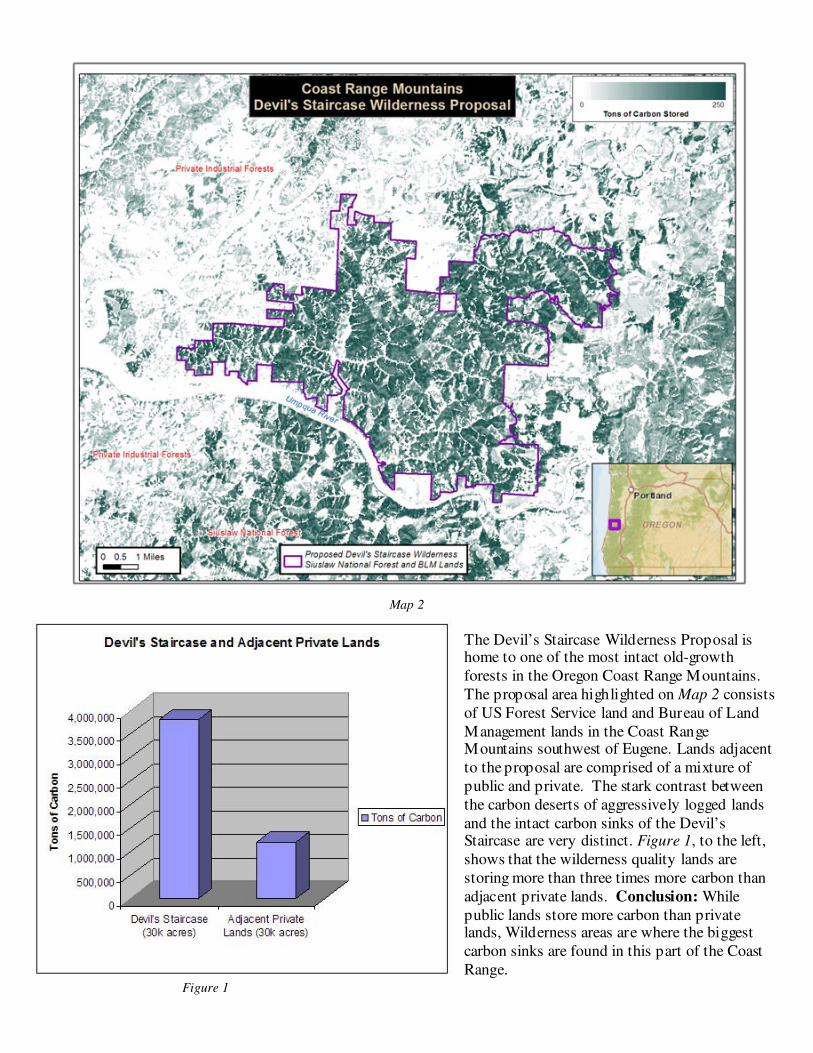
Map 2
The Devil’s Staircase Wilderness Proposal is home to one of the most intact old-growth
forests in the Oregon Coast Range Mountains.
The proposal area highlighted on Map 2 consists
of US Forest Service land and Bureau of Land
Management lands in the Coast Range Mountains southwest of Eugene. Lands adjacent
to the proposal are comprised of a mixture of
public and private. The stark contrast between
the carbon deserts of aggressively logged lands
and the intact carbon sinks of the Devil’s Staircase are very distinct. Figure 1, to the left,
shows that the wilderness quality lands are
storing more than three times more carbon than
adjacent private lands. Conclusion: While
public lands store more carbon than private lands, Wilderness areas are where the biggest
carbon sinks are found in this part of the Coast
Range. Figure 1
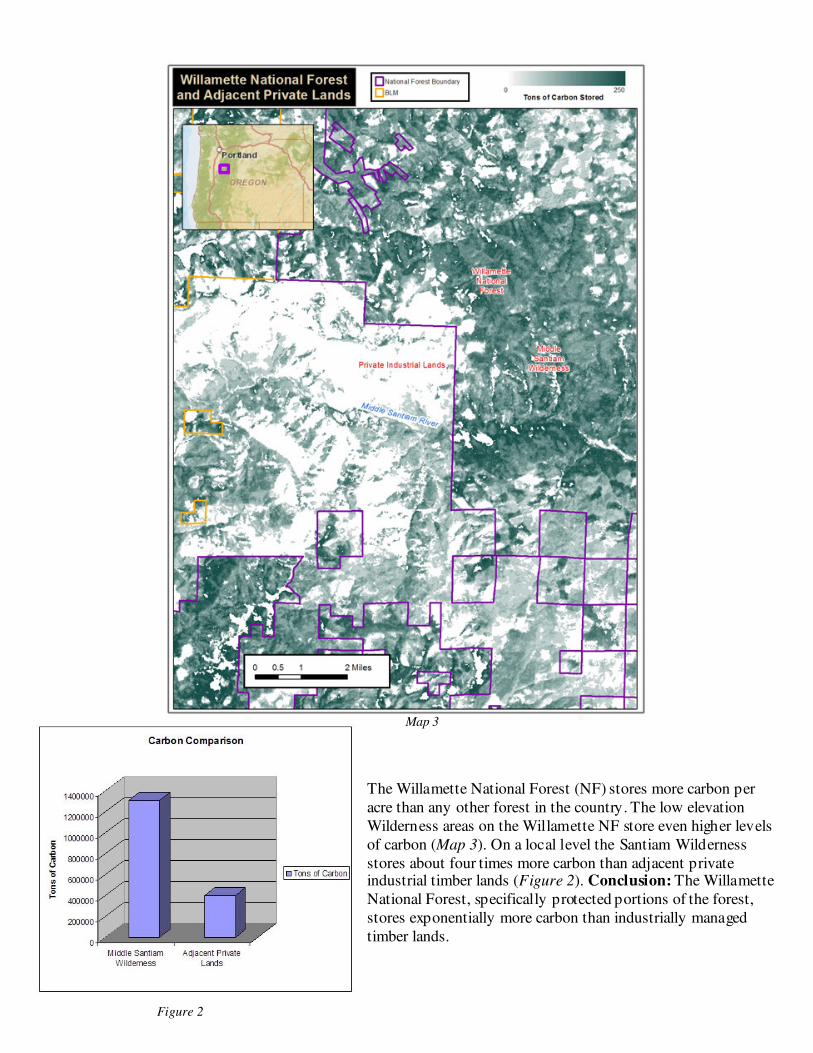
Map 3
The Willamette National Forest (NF) stores more carbon per
acre than any other forest in the country. The low elevation
Wilderness areas on the Willamette NF store even higher levels
of carbon (Map 3). On a local level the Santiam Wilderness
stores about four times more carbon than adjacent private industrial timber lands (Figure 2). Conclusion: The Willamette
National Forest, specifically protected portions of the forest,
stores exponentially more carbon than industrially managed
timber lands.
Figure 2

Map 4
The temperate rain forests of the northern Oregon Coast Range have the capacity to store large amounts of carbon.
The northern Oregon Coast Range Mountains have a mixture of ownership consisting primarily of state forests
(Tillamook and Clatsop) and private industrial timberlands. Map 4 highlights the contrast between carbon storage
on the Clatsop State Forest and adjacent privately managed lands in the Nehalem River watershed. Conclusion:
The northern Oregon Coast Range mountains have far more potential for carbon storage than current management is providing for.

Map 5
Map 5 highlights the Coos Bay and Coquille River watershed region of the southern Oregon Coast Range
Mountains. This portion of the Coast Range has historically been aggressively logged. Conclusion: The relatively
low amount of public lands in this region of the Coast Range highlights the resulting carbon deserts when private
industry manages the majority of a region.

Map 6
Carbon storage in Lincoln County and the Siletz River watershed region of the NW Oregon Coast Range
Mountains is highlighted in Map 6. The northern and southern edges of this map highlight public lands
management in two units of the Siuslaw National Forest. While portions of these units have been logged in the past, these areas are storing exponentially more carbon than the adjacent private lands. Conclusion: Public lands
management has room for improvement, but private lands management by the timber industry has produced
carbon deserts in this region.

Map 7 contrasts the varying levels of carbon storage between the Oregon Coast Range and the Washington Coast
Range. These maps specifically highlight the deep carbon sinks in the Olympic Peninsula and the carbon deserts in
the forests of Coos County (Coquille River watershed) that have been intensively logged. While the Olympic
National Park is clearly better managed for carbon storage than the adjacent US Forest Service and private
timberlands, the biggest contrast is between WA and OR. In these two regions, Oregon’s forests actually have slightly more potential for storage as they are all lower elevation whereas portions of the Olympics are high
elevation and unable to store as much carbon. Conclusion: Oregon’s coastal forests are being managed in a
manner that minimizes carbon storage yet have the potential to store vast amounts of carbon as demonstrated in
Washington.
Map 7
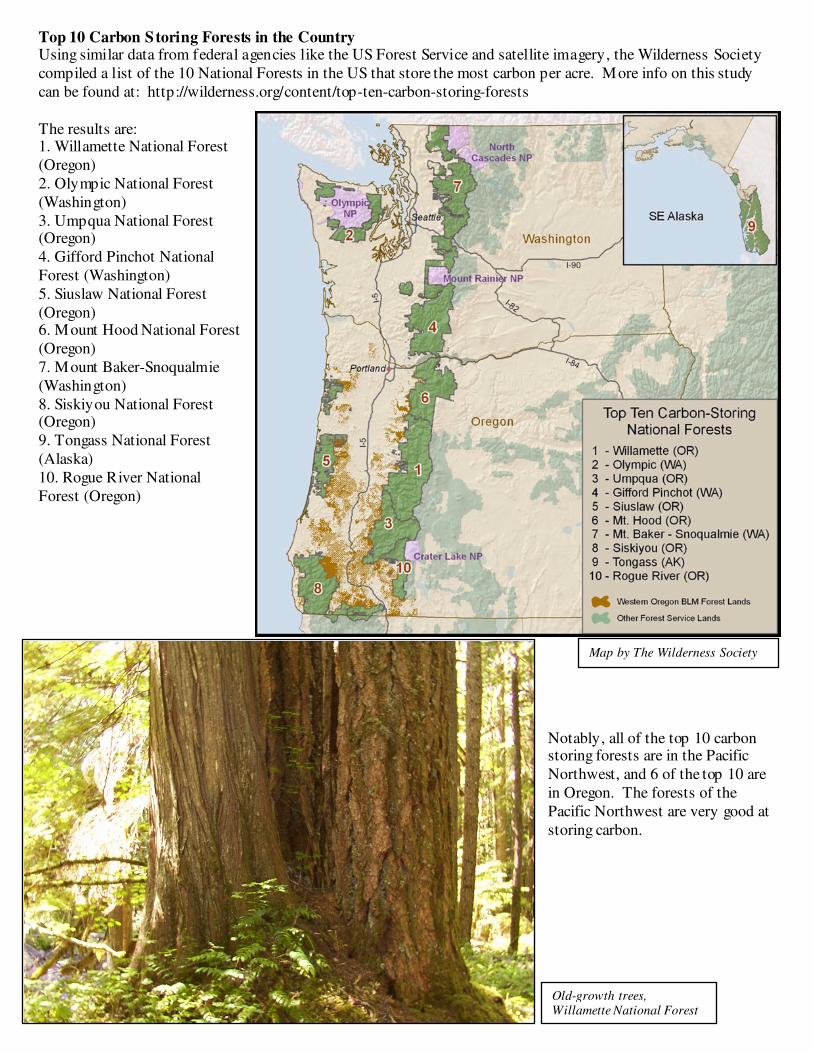
Top 10 Carbon Storing Forests in the Country Using similar data from federal agencies like the US Forest Service and satellite imagery, the Wilderness Society
compiled a list of the 10 National Forests in the US that store the most carbon per acre. More info on this study
can be found at: http://wilderness.org/content/top-ten-carbon-storing-forests
The results are: 1. Willamette National Forest
(Oregon)
2. Olympic National Forest
(Washington)
3. Umpqua National Forest (Oregon)
4. Gifford Pinchot National
Forest (Washington)
5. Siuslaw National Forest
(Oregon) 6. Mount Hood National Forest
(Oregon)
7. Mount Baker-Snoqualmie
(Washington)
8. Siskiyou National Forest (Oregon)
9. Tongass National Forest
(Alaska)
10. Rogue River National
Forest (Oregon)
Notably, all of the top 10 carbon storing forests are in the Pacific
Northwest, and 6 of the top 10 are
in Oregon. The forests of the
Pacific Northwest are very good at
storing carbon.
Old-growth trees, Willamette National Forest
Map by The Wilderness Society

Carbon Storage and Logging
Logging transfers most of the carbon in the forest to the atmosphere as logging slash, mill waste, and as processing
and transportation emissions. Only 15% of a tree goes into wood products. Furthermore, much of this is short term
storage in materials such as wood pallets for shipping.
Where did the carbon go?
Only 15% of a tree is stored in wood products after logging.
• More recent analysis by the Bureau of Land Management in the Western Oregon Plan Revision FEIS shows even more compelling evidence that decades of converting old-growth forests to plantations has reduced current
stores of forest carbon. On BLM lands in western Oregon carbon stores were reduced by 149 million tons (even
after accounting for decades of forest re-growth on logged sites). While some of that carbon was converted into

wood products, most wood products do not last very long. Of the 149 million tons of carbon missing from the forest, only 11 million tons of that carbon remains stored in wood products today. This means that logging our
public forests to make wood products resulted in approximately 13 times more carbon emissions than carbon
storage. Put another way, for every ton of carbon in wood products, there are 13 tons emitted to the atmosphere.
See WOPR FEIS Figures 3-17 (p 3-221) and Figure 3-18 (p 3-224).