organic compounds in unsaturated soil - uoguelph.ca b., stiver, w.h. and zytner, r.g. (2002) a...
TRANSCRIPT

Organic Compounds in Unsaturated Soil
for
ENGG*6670Fall 2002
Richard G. Zytner, Ph.D., P.Eng.School of EngineeringUniversity of Guelph

ACKNOWLEDGEMENTS
The information contained in this document has been prepared for private study only. It has been excerptedfrom the following documents.
Arthurs, P.A., Stiver, W.H. and Zytner, R.G. (1995) Passive Volatilization of Gasoline From Soil,Journal of Soil Contamination, 4(123-135).
Biswas, N., Zytner, R.G. and Bewtra, J.K. (1992) Model for Predicting PCE Desorption fromContaminated Soils, Water Environment Research, Vol. 64(170-178).
Biswas, N., Zytner, R.G., McCorquodale, J.A. and Bewtra, J.K. (1991) A Numerical Model to Predictthe Movement of PCE in Unsaturated Soil, WASP, 60(361-380).
Brook, T.R., Stiver, W.H. and Zytner, R.G. (2000) Biodegradation of Diesel Fuel under VariousNitrogenAddition Regimes, submitted J. of Soil and Contamination.
Gidda, T., Stiver, W.H. and Zytner, R.G., (1999) Passive Volatilization Behaviour of Gasoline inUnsaturated Soils, Journal of Contaminant Hydrology, 39:137-159.
Guigard, S., Stiver, W.H. and Zytner, R.G. (1996) The Fate of Immiscible Chemicals in Unsaturated Soil,Environmental Technology, 17:1123-1130.
Guigard, S., Stiver, W.H. and Zytner, R.G. (1996) Retention Capacity of Immiscible Chemicals inUnsaturated Soils, Water, Air and Soil Pollution, 89(277-289).
Harper, B., Stiver, W.H. and Zytner, R.G. (1998) The Influence Of Water Content In ContaminantRemoval By SVE In A Silt Loam Soil, ASCE Journal of Environmental Engineering,124(11):1047-1053.
Harper, B., Stiver, W.H. and Zytner, R.G. (2002) A Non-Equilibrium NAPL Mass Transfer Model forSVE Systems, Journal of Environmental Engineering, accepted Sept., 2002
Laplante, T., Zytner, R.G. and Stiver, W.H. (2000) Supercritical Fluid Extraction From Soil Slurries, J.of Supercritical Fluids.
Scheibenbogen, K., Zytner, R.G., Lee, H. and Trevors, J. (1994) Enhanced Removal of SelectedHydrocarbons From Soil By PSEUDOMONAS AERUGINOSA UG2 Biosurfactants and SomeChemical Surfactants, Chemical Technology & Biotechnology, 59(53-59).
Shewfelt, K. and Zytner, R.G. (2001) The Effects of Nitrogen Source and Supply on Bioventing ofGasoline Contaminated Soil, NGWA Conference on Petroleum Remediation, Houston, TX,Nov., pp. 265-272.
Zytner, R.G. (1994) Sorption of Benzene, Toluene, Ethylbenzene and Xylenes To Various Media,Journal of Hazardous Materials, 38 (113-126).
Zytner, R.G., Biswas, N. and Bewtra, J.K. (1993) Retention Capacity of Dry Soils for NAPLs,Environmental Technology, 14 (1073-1080).
Zytner, R.G. (1992) Adsorption - Desorption of Trichloroethylene in Granular Media, Water, Air andSoil Pollution, 65(245-255).
Zytner, R.G., Biswas, N. and Bewtra, J.K. (1989) PCE Volatilized From Stagnant Water and Soil, ASCEJournal of Environmental Engineering, 115(1199-1212).
Zytner, R.G. (1988) Fate of Perchloroethylene in Unsaturated Soil, Ph.D. Dissertation, Dept. of CivilEngineering, University of Windsor.Smyth, T.J., Zytner, R.G. and Stiver, W.H. (1999) Influenceof Water on Supercritical Fluid Extraction Of Naphthalene From Soil, J. of Hazardous Materials,

B67:183-196Zytner, R.G., Salb, A., Brook, T., Leunissen, M. and Stiver, W.H. (2001) Bioremediation Of Diesel Fuel
Contaminated Soil, Canadian Journal of Civil Engineering, 28(Suppl. 1)131-140.Zytner, R.G., Hallman, M., Fernández Giménez, B., Jennings, R. and Leek, K. (2002) The Use of
Anhydrous Ammonia for Bioventing, Remediation Technologies Symposium 2002, Oct. 16 to18, 2002, Banff, AB.

TABLE OF CONTENTS
1.0 OVERVIEW . . . . . . . . . . . . . . . . . . . . . . . . . . . . . . . . . . . . . . . . . . . . . . . . . . Page 1 of 68
2.0 SOIL ENVIRONMENT . . . . . . . . . . . . . . . . . . . . . . . . . . . . . . . . . . . . . . . . . . Page 1 of 71
3.0 SORPTION OF CHEMICALS BY SOIL . . . . . . . . . . . . . . . . . . . . . . . . . . . . . Page 3 of 73.1 Adsorption Isotherms . . . . . . . . . . . . . . . . . . . . . . . . . . . . . . . . . . . . . . . Page 6 of 713.2 Adsorption Results . . . . . . . . . . . . . . . . . . . . . . . . . . . . . . . . . . . . . . . . . Page 9 of 713.3 Soil-Water Partition Coefficient . . . . . . . . . . . . . . . . . . . . . . . . . . . . . . Page 12 of 713.4 Desorption of Chemicals from Soils . . . . . . . . . . . . . . . . . . . . . . . . . . . Page 14 of 713.5 Application of Isotherm Data . . . . . . . . . . . . . . . . . . . . . . . . . . . . . . . . Page 16 of 71
4.0 RESIDUAL SATURATION OF NAPLS IN SOIL . . . . . . . . . . . . . . . . . . . . Page 17 of 714.1 Theory . . . . . . . . . . . . . . . . . . . . . . . . . . . . . . . . . . . . . . . . . . . . . . . . . Page 18 of 714.2 Infiltration . . . . . . . . . . . . . . . . . . . . . . . . . . . . . . . . . . . . . . . . . . . . . . . Page 21 of 71
5.0 VOLATILIZATION FROM SOIL . . . . . . . . . . . . . . . . . . . . . . . . . . . . . . . . . Page 23 of 715.1 Passive Volatilization . . . . . . . . . . . . . . . . . . . . . . . . . . . . . . . . . . . . . . Page 24 of 715.2 Soil Vapour Extraction . . . . . . . . . . . . . . . . . . . . . . . . . . . . . . . . . . . . . Page 25 of 715.3 Soil Vapour Extraction - Mass Transfer Coefficients . . . . . . . . . . . . . . . Page 27 of 71
6.0 BIOREMEDIATION OF HYDROCARBONS . . . . . . . . . . . . . . . . . . . . . . . Page 34 of 716.1 Nutrient Addition . . . . . . . . . . . . . . . . . . . . . . . . . . . . . . . . . . . . . . . . . Page 35 of 716.2 Use of Anhydrous Ammonia . . . . . . . . . . . . . . . . . . . . . . . . . . . . . . . . . Page 42 of 716.3 Use of Biosurfactants . . . . . . . . . . . . . . . . . . . . . . . . . . . . . . . . . . . . . . Page 47 of 71
7.0 SUPERCRITICAL FLUID EXTRACTION . . . . . . . . . . . . . . . . . . . . . . . . . . Page 47 of 71
8.0 MODEL DEVELOPMENT and NUMERICAL SOLUTION . . . . . . . . . . . . . Page 53 of 718.1 Aqueous Phase . . . . . . . . . . . . . . . . . . . . . . . . . . . . . . . . . . . . . . . . . . Page 53 of 718.2 Vapour Phase . . . . . . . . . . . . . . . . . . . . . . . . . . . . . . . . . . . . . . . . . . . Page 54 of 718.3 Immiscible Phase . . . . . . . . . . . . . . . . . . . . . . . . . . . . . . . . . . . . . . . . . Page 54 of 718.4 Sorbed Phase . . . . . . . . . . . . . . . . . . . . . . . . . . . . . . . . . . . . . . . . . . . Page 55 of 718.5 Total Mass . . . . . . . . . . . . . . . . . . . . . . . . . . . . . . . . . . . . . . . . . . . . . . Page 55 of 718.6 Non-Equilibrium . . . . . . . . . . . . . . . . . . . . . . . . . . . . . . . . . . . . . . . . . . Page 56 of 71
BIBLIOGRAPHY . . . . . . . . . . . . . . . . . . . . . . . . . . . . . . . . . . . . . . . . . . . . . . . . . . . . Page 59 of 71

soil_overview_03.wpd Page 1 of 70
1.0 OVERVIEW
Organic chemicals enter the unsaturated soil environment through various activities including accidentalspills, leaking underground storage tanks, improper waste disposal and landfill leachate. The spilledchemical then poses an immediate threat to air, soil, surface water and groundwater quality throughvolatilization into the atmosphere, retention of the spilled chemical by the soil, runoff to surface waters andinfiltration to groundwater.
Spilled organic chemicals are often immiscible with water and are often thus are present as a non-aqueousphase liquid (NAPL). The factors that influence a NAPL’s behaviour and fate in the unsaturated soilenvironment can be physical, chemical or biological. Significant processes involved are advection, diffusion,adsorption, desorption, volatilization and chemical and biological degradation. The relative importance ofeach process is dependant on the site conditions. This includes soil type, water content and temperature.
The following sections are overviews on the processes and conditions that affect NAPL behaviour in thesubsurface.
2.0 SOIL ENVIRONMENT
The soil environment consists of solid, liquid and gaseous phases, which combine to form various physical,biological and chemical environments. In addition, different interfaces exist, gas:liquid, liquid:solid andsolid:gas, which increase the complexity of the soil environment [Walker, 1984].
The solid phase or aggregates as referred to by many, consists of minerals, amorphous precipitates andorganic particles. These constituents vary in composition, particle size distribution and particle surface area,which also change with depth [Alexander, 1977 and Alrichs, 1972]. By noting the variation of soil withdepth, one is able to classify a particular soil. There are essentially three horizons in the soil profile, A, Band C. The horizon A or the surface layer contains roots, small animals and the highest quantity ofmicroorganisms as the organic matter concentration is the highest. The concentration of these componentsdecreases in layers B and C as depth increases, with C being the parent material [Black, 1965 and Foth,1978]. The organic matter contained in the soil is the remains of decomposed plants and animals. As the remainsdecompose, complex substances are formed. These complexes include aromatic and unsaturated ringstructures, carboxyl, phenolic hydroxyl, alcoholic hydroxyl, carbonal, methoxyl and amino groups [Alrichs,1972]. Felsot and Dahm, [1979] observed that because of these functional groups, organic mattercontributes 25-90 percent of the cation exchange capacity, CEC, in many types of soils. The CEC isdefined as the sum of the exchangeable cations of a soil [Black, 1965]. The measurement is usuallyexpressed as milli-equivalents of ions exchangeable per 100 grams of soil. This value indicates the numberof cations held by the organic matter and clay of the soil, which can be replaced reversibly by cations ofacid and salt solutions.
The physical parameters of the soil can be broken down into individual particles of silt, sand and clayaccording to size: clay, 0-2 :m; silt, 2-50 :m; sand, 0.05-2 mm [Bouwer, 1978]. These particles make

soil_overview_03.wpd Page 2 of 70
up only 40-80 percent of the soil matrix. The remaining volume is comprised of pores filled with water,air and other gases.
The amount of pores in the soil matrix is dependent the soil classification. Clays generally have high percentages of small pores, whereas sand has a low percentage. Organic matter also contributes small pores tothe soil matrix. These small pores, or micropores as they are often called, can greatly enhance the soilcapabilities to hold water [Hamaker and Thompson, 1972], as they are not free draining. Roberts etal., [1982], reports that the water held in the micropores is called the immobile domain, whereas the largerpores which are free draining are classified as the mobile domain.
It should also be noted that many researchers refer to aggregates when discussing unsaturated soil.Essentially, aggregates are a combination of physical and organic solids. They cause a challenge to siteremediation and modelling as the micro pores contained in aggregates can trap contaminant and water,making the contaminant inaccessible to remediation processes.
Related to the physical characteristics of soil are various parameters. Table 1 gives an overview of theparameters for different soil.
Table 1: Typical Soil Properties
Soil Type Particle Dia.mm
Porosity%
Dry Bulk Densitykg/m3
Hydraulic Conductivitya
m/s
gravel 8 - 16 32 1800 - 2300 3 x 10⁻² - 3 x 10⁻⁴
coarse sand 0.5 - 1.0 39 1400 - 2200 6 x 10⁻³ - 5 x 10⁻⁴
fine sand 0.125 - 0.25 43 1300 - 2000 2 x 10⁻⁴ - 2 x 10⁻⁷
silt 0.004 - 0.062 46 1100 - 1800 2 x 10⁻⁵ - 1 x 10⁻⁹
clay < 0.004 42 800 - 1600 5 x 10⁻⁹ - 1 x 10-11
a - hydraulic conductivity refers to water movement through saturated soil, when soil unsaturated,water movement referred to as capillary conductivity
The water phase in the soil matrix, consists of two components. One is the capillary water and the otheris the gravitational water. The gravitational water is affected only by gravity, while capillary water dependson the polar nature of the water molecules and hydrogen bonding with the polar surface of the soil.Capillary water is held with a tension of roughly one-third atmosphere [Alrichs, 1972]. When the watercontent of the soil equals that of the capillary, the pores will contain large amounts of air and the soil willbe considered unsaturated. However, if the pore space is completely filled with water and has onlynegligible amounts of air, the soil is considered saturated. Therefore, it can be seen that the gas and liquidphases of the soil are closely tied together.
As the gas phase moves through the soil, water is displaced, while the reverse is true when water entersthe soil. However, it should be noted that the gas composition in the soil is different from the atmosphere.This difference is mainly due to the oxygen consumption and carbon dioxide production by plant roots and

soil_overview_03.wpd Page 3 of 70
soil microorganisms. The oxygen level in the soil hovers around 21 percent, with decreases related directlyto increases in carbon dioxide [Alrichs, 1972]. Studies have shown that the carbon dioxide in the soil airvaries from 0.3 to 3.0 percent, whereas in the atmosphere it remains around 0.03 percent. Furthermore, as one travels deeper into the soil profile, the oxygen content decreases even further through restricted airexchange [Hamaker and Thompson, 1972].
The microorganisms that exist in the soil include all types from the five major groups; bacteria,actinomycetes, fungi, algae and protoza [Alexander, 1977], with bacteria being the most dominant. Theirrespective concentrations depend on soil type, moisture content and concentration of organic matter. Table2 shows the changes in concentrations of microorganisms with depth, which are directly related to theorganic matter present at each layer. Since organisms are attached to the soil particles either byelectrostatic attractions or their extracellular secretions, the number of microorganisms that move with thewater is severely restricted. This results in minimal biodegradation as one proceeds further down the soilprofile.
Table 2: Concentration of Microorganisms with Depth for a Typical Mineral Soil[Alexander, 1977]
Depth Organisms/gram of soil [thousands] m Aerobic Anaerobic Actinomycetes Fungi Algae
0.03-0.08 7,800 1,950 2,080 119 25 0.20-0.25 1,800 379 245 50 5 0.35-0.40 472 98 49 14 0.5 0.65-0.75 10 1 5 6 0.1
1.35-1.45 1 0.4 - 3 -
Goring et al., [1974] report that the optimum water content for microorganism growth is 50-75 percentof field capacity. Therefore as the water content changes, so does the number of microorganisms. Aneutral pH is also favourable for most microorganisms, but some have been found to exist at a pH of3.0. Furthermore, the microorganisms often exist in a substrate limited growth pat tern which takes offwhen a new source of organic matter is present. An increase in temperature also stimulates activity up toa point, whereas lower temperatures decrease their activity. One other important element is nutrients. Iffor example insufficient nitrogen exists in the soil, a nitrogen source will be needed to increase themicroorganism biodegradation activity. A major challenge in in situ remediation is providing sufficientamounts of nutrients and oxygen to the lower levels of the soil profile.
3.0 SORPTION OF CHEMICALS BY SOIL
Braids [1981] reports that majority of chemicals entering the soil environment are removed throughadsorption. This is also referred to as sorption, which is the combined affect of adsorption and absorption[Burns et al., 1982]. However, in most studies absorption is considered minimal in soil and the sorptionprocess refers to adsorption. Adsorption can be stated as the condensation of gases on the soils freesurfaces, or the fixation of solutes from a solution on the surface of a solid [Morrill, et al., 1982]. Theseinteractions involve the interface between two phases; liquid:liquid, gas:liquid, gas:solid or liquid;solid[Weber and Morris, 1963]. Since soil is the environment being studied, the interface of most concern is

soil_overview_03.wpd Page 4 of 70
liquid:solid. With liquid:solid adsorption, the two main driving forces are [Walker, 1984],(i) solvophobic (or hydrophobic in aqueous systems) nature of the solute within the solvent(ii) degree of affinity of a solute (or adsorbate) for the solid surface (or adsorbent)
There are three different types of adsorption: exchange, physical and chemical. Rarely can soil adsorptionbe limited to only one type. Adsorption can be positive or negative [Morrill et al., 1982]. Positiveadsorption occurs when there is an attraction between the adsorbate and the adsorbent, resulting in a higherconcentration of adsorbate at the surface-liquid interface than in the bulk solution. Negative adsorption,commonly referred to as desorption, is the opposite situation with repelling of the adsorbate.
The interaction of the various adsorption mechanisms depends on the chemical family and soil type[Darcel, 1984]. For example, hydrophobic chemicals will tend to accumulate in the soil organic phase[Weber et al., 1983], as the water molecules are repelled. Preference is then given to these non-polarchemicals, with high molecular mass, resulting in the weakly hydrophobic chemicals being rapidlytransported to the groundwater [Gambrell et al., 1984]. This phenomenon has also been observed byValocchi [1985]. The majority of chemicals found in the groundwater are weakly or moderatelyhydrophobic, including PCE [Roberts et al., 1982]. Solubility is also vital as reported by Voice et al.[1983]. The higher solubility makes it easier for the chemical to dissolve and percolate with water to thegroundwater. In other words, higher the insolubility, greater the adsorption [Isaacson and Sawhney, 1983and Kenaga, 1980]. Solubility has been shown to increase with temperature, resulting in a loweradsorption rate [Chiou et al., 1977].
With the soil matrix consisting of solid, liquid and gaseous phases, the heterogeneous nature greatlyinfluences the physical and chemical properties of the soil [Travis and Etnier, 1981]. The organic fractionis very important, with the majority of adsorption occurring in it [Jury et al., 1984, Melcer, 1982, Kahnet al., 1975 and Rippen et al., 1984]. Organic matter is also important in desorption, as it is seen that thepercentage of desorption decreases with an increase in organic matter [Dekkers, 1977]. Dekkers [1977]reports that it would be desirable to know the composition of the soil organic matter to accurately predictadsorption for a particular chemical. However, at present little is known about humic substances whichare the largest fraction of organic matter in soils. They are relatively high molecular mass [300 to 30000]complex materials that are generally regarded as polymers of aromatic compounds having large surfaceareas [Chiou et al., 1979]. Other organic substances are fulvic and humic acids which themselves canrapidly adsorb organic compounds [Wang et al., 1978]. However, in some instances, adsorption by theorganic fraction may not apply and cation exchange capacity, CEC, pH or some other soil property mayinfluence adsorption [Zamani et al., 1984].
The cation exchange capacity, usually given in terms of milligram equivalents per 100 grams of soil, is ameasure of the readily exchangeable cations neutralizing negative charge in the soil. These charges may beviewed as being balanced by either (i) an excess of ions of opposite charge and a deficit [or negativeadsorption] of ions of like charge, or (ii) the excess of ions of like charge, or (iii) the excess of ions ofopposite charge over those of like charge [Page et al., 1982]. Total CEC in arable soils varies from 0.5to 50, being higher in organic soils [Roberts et al., 1982]. Some of the CEC sites change in number withpH. The dominate exchange cations are Ca, Mg, K, N and Al [Cohen and Ryan, 1985]. Felsot andDahm [1979] report that the higher the CEC, the greater the adsorption. It is also reported that theadsorption capability of a soil was more related to the organic content of the CEC than to CEC itself.

soil_overview_03.wpd Page 5 of 70
Walker [1984] reports that the organic content contributes 25-90 percent of the CEC.
While change in pH affects the number of CEC sites, no correlation between changes in soil pH andadsorption of non-polar chemicals has been reported [Walker, 1984]. The only change in adsorption,related to pH variation, results when a change in soil components occurs. Many studies report pH valuesbut do not discuss how any change would affect adsorption. Hamaker and Thompson [1972] and Walker[1984] eport that the effects of pH, organic matter, CEC and other soil properties are so interrelated thatit becomes extremely hard to separate their influences.
Organics can also be adsorbed by inorganics like sand and clay, when organic matter content is low[McCarty et al., 1981]. This occurs through cation and anion exchange. In Canadian soils, anionexchange is considered negligible as soil particles are predominantly negatively charged [Gambrell et al.,1984]. The size of these particles is also important because the smaller the particle size, the more surfacearea per unit volume is provided. This is especially evident with clay in which many binding sites areprovided [Walker, 1984]. Schwarzenbach and Westall [1984] observed reduced adsorption when theywashed the soil prior to use and observed reduced adsorption. The decrease in adsorption was attributedto the washing out of the fines, which decreased the total surface area available for adsorption. However,it should be noted that generally no agreement exists in the literature on particle size effect on adsorption[Walker, 1984]. Karickhoff [1981] and Karickhoff et al. [1979] have stipulated that adsorption can alsobe increased with an increase in organic carbon content as it also provides for additional binding sites.
As mentioned earlier, there are three types of adsorption; exchange, chemical and physical. Exchangeadsorption is the electrical attraction between the adsorbate and adsorbent, which allows ions in solutionto bind with sites on the soil surface [Weber, 1972]. Exchange adsorption includes both cationicexchange and anion exchange [Morrill et al., 1982]. In chemical adsorption, a chemical bond is formedbetween the adsorbate and adsorbent, preventing free movement of the molecule. In short term chemicaladsorption, less than twelve hours, the amount of adsorption is minimal with importance increasing withtime. Another term for chemical adsorption is chemisorption.
While chemisorption fixes a molecule, a physically adsorbed molecule can freely move around the surface.Usually the first layer is chemically fixed and all succeeding layers are held by physical means. Physicaladsorption is attributed to van der Waals forces. These forces are weak and decrease rapidly with increasein distance from the surface. Never the less, physical adsorption is very important for large moleculeswhose shapes conform to adsorbing surfaces [Rao et al., 1979].
Besides these three types of major forces, there exist other minor forces such as hydrogen bonding andhydrophobic interaction. Morrill et al. [1982] report that hydrogen bonding is significant for binding polarorganic molecules to clay surfaces. Even though various types of adsorption are known, no singlemechanism fully explains the adsorption of an organic molecule on soil particles. Instead it is felt that acombination of different types of phenomenon affect the adsorption process and these can not be easilydifferentiated, especially with heterogeneous soil [Bohn et al., 1979, Hamaker and Thompson, 1972 andHamaker, 1972].

soil_overview_03.wpd Page 6 of 70
(1)
(2)
3.1 Adsorption Isotherms
Equilibrium equations or isotherms have been developed to help explain the adsorption process and allowcomparisons. These equations give a relationship between the solute in the liquid and solid phases whenequilibrium is reached. The equation relates the mass of solute adsorbed per unit mass of adsorbent to theequilibrium concentration in the liquid phase. These equilibria are established by adding a known amountof adsorbate to a known amount of adsorbent and determining the amount of adsorbate removed from theliquid phase. The observed data are then used to generate appropriate correlation equations such as theLangmuir Isotherm and the Freundlich Isotherm [Banerji et al., 1985, Briggs, 1981, Walker, 1984, LaPoe, 1985 and Elliot and Stevenson, 1977]. The Langmuir Isotherm was initially developed by Langmuir in 1916 for the adsorption of gases on solids[Harter and Baker, 1977]. The development was based on three assumptions [Morrill et al., 1982]; (i)energy of adsorption remains constant and independent of surface coverage, (ii) adsorption is on localizedsites with no interaction between adsorbate molecules and (iii) the maximum adsorption possible is acomplete monolayer. The original equation has been modified to explain adsorption from solution, andis in the form:
where, X/M = mass of solute adsorbed per unit mass of adsorbent, :g/gQ* = mass of adsorbed solute per unit mass of adsorbent required to form a complete
monolayer on the surface, :gb = constant indicative of the energy of adsorptionC = equilibrium concentration of solute in solvent, g/m3
However, limited use for this equation is found in the literature when discussing organic adsorption on soil.La Poe [1985] reasoned that the Langmuir Isotherm was basically limited to monolayer adsorption, andnot multilayer, which occurred with organic chemicals.
The Freundlich Isotherm has been frequently used for the adsorption of organics on soil. It has the form;
where, X = mass of adsorbate adsorbed on adsorbent, :gM = mass of adsorbent, gKf = equilibrium constant indicative of adsorptive capacity,[ug/g][L/mg]1/nf Ce = solution concentration at equilibrium after adsorption, mg/Lnf = constant indicative of adsorption intensity
Theoretically, this equation predicts that the adsorption will increase indefinitely. As a result, Eq. 2 shouldnot be extrapolated past the range of solute concentrations for which it was developed [Bohn et al., 1979,Weber, 1972 and Belfort, 1980]. Furthermore, it does not reduce to a linear equation at lowconcentrations as does the Langmuir Isotherm. Still, it has be used extensively in soil adsorption studies

soil_overview_03.wpd Page 7 of 70
(3)
for a variety of organic chemicals, including PCE. Table 2 shows some of the constants found for variouschemicals in different soils [Friesel et al., 1984]. The reported correlation coefficients are quite goodindicating that the Freundlich Isotherm can be used successfully in soil adsorption for PCE and otherorganics.
Many studies that used the Freundlich Isotherm, have reported nf values close to unity. In fact, the smallerthe value of 1/nf the higher the affinity between the adsorbate and adsorbent. However, when nf equalsone, the isotherm equation describes the distribution or partitioning between the two phases in terms of thelinear relationship:
whereCe = equilibrium concentration of solute, mg/LKp = linear partition coefficient, [L/mg][:g/g].
Table 3: Freundlich Constants for Various Soils Soil Chemical Kf 1/nf r Acid Peat TCE 6.6 1.08 0.98 PCE 12.9 1.04 0.96
1,1,1-TCE 5.1 1.03 1.00
Acid Humic TCE 3.0 1.16 0.99 Topsoil PCE 10.4 1.12 0.94 1,1,1-TCE 5.1 1.01 0.99
Calcareous TCE 2.0 0.93 1.00 Humic PCE 5.8 0.91 1.00 Topsoil 1,1,1-TCE 1.3 1.00 0.98
Subsoil TCE 1.3 0.88 0.87 rich in PCE 2.3 0.98 0.95 iron oxides 1,1,1-TCE 2.7 0.81 0.80
Clay TCE 1.9 0.70 0.81 subsoil PCE 0.5 0.95 0.70
Sand TCE 1.5 0.71 0.91 subsoil PCE 0.9 0.60 0.90
The linear partition equation has found wide use in describing organics in soil, especially in lowconcentrations [Schwartzenbach and Westall, 1981, Kenaga, 1982 and Melcer, 1982] including PCE [LaPoe, 1985 and Roy and Griffen, 1985]. Karickhoff et al. [1979] report that Kp is relatively independent

soil_overview_03.wpd Page 8 of 70
(4)
(5)
(6)
(7)
of soil mass present but is directly related to the organic carbon content. However, Weber et al. [1983]and Karickhoff et al. [1979] report that solids concentrations affect Kp, while Bredehoft and Pinder[1973] indicate that as adsorbates differ, so do correlation factors. Furthermore, Bredehoft and Pinder[1973] also believe that Kp is inversely related to the solubility. These conflicting opinions reveal that eachorganic chemical behaves differently in changing soil conditions, requiring appropriate studies for eachsituation.
Due to differing opinions on the effect of soil type on Kp, several researchers attempted and were successfulin correlating adsorption with soil organic carbon content, OC, [Darcel, 1984b]. This was done bynormalizing Kp with OC, resulting in a soil-water partition coefficient, Koc. Koc is a measure of thepartitioning of a compound between an aqueous phase and a stationary phase, consisting mainly of humus[Gambrell et al., 1984]. This is called a hydrophobic tendency in which the more hydrophobic a moleculeis, the greater it partitions from aqueous to organic media [McCall et al., 1981]. Non-polar moleculeslike PCE primarily adsorb on soil through this mechanism [DeWalle et al., 1982].
Schwarzenbach and Westall [1981] and others have indicated that another parameter can also be used toestimate Kp [Chiou et al., 1977 and Kahn et al., 1975]. This coefficient is called octanol water partitioncoefficient, Kow. Karickhoff [1981] states that organic carbon in soil acts similarly to a solvent in a water:immiscible solvent extraction. Therefore, a correlation was developed between Kp and Koc. This wascompleted for a series of polycyclic aromatic compounds and chlorinated hydrocarbons that had watersolubilities ranging from 1 mg/L to 1000 mg/L. On correlation it was determined that;
where, Koc = organic carbon partition coefficient, L/mgKow = octanol water partition coefficient.
Then by applying organic carbon content, this equation can be written as;
Similarly, Schwarzenbach and Westall [1981] obtained the following relationship for natural aquifermaterial;
All these equations predict Kp within a factor of two for non-polar organics in soil or sediment. However,they are only truly valid for the type of compounds and their concentrations that were studied. Anyextrapolation beyond the upper limit can greatly increase the magnitude of error [Walker, 1984]. Another advantage of using Kow is that it may be calculated directly from water solubility by using thesimple relationship developed by Chiou et al. [1977]:

soil_overview_03.wpd Page 9 of 70
where S = aqueous solubility of chemical in :mol/L. For PCE, Chiou et al. [1977] determined a log[Kow] of 2.60 with a solubility of 3820 :mol/L at 25°C.The World Health Organization, WHO, reported a log[Kow] of 2.88 at a temperature of 20°C [WHO,1984]. While the majority of organics are within one order of magnitude, Mingelgrin and Gerstl [1983]have shown that the less polar an organic, the more applicable is Kow for indication of soil uptake, sincechemicals with higher log[Kow] values are more readily adsorbed by soil [Kahn et al., 1975]. Jaffe andFerrara [1983] also report that the higher the Kow coefficient, the more accurate is the equilibrium modelfor adsorption. Furthermore, if it is greater than 100, i.e. log[Kow] is between 2 to 3, the chemical canbe considered moderately hydrophobic [Roberts et al., 1982].
3.2 Adsorption Results
Zytner [1992] determined Freundlich Isotherms for the various soils listed in Table 4, with the adsorptionresults in Table 5. The adsorption/desorption processes of TCE in different granular media are wellrepresented by the Freundlich Isotherm, for the range of aqueous concentrations studied. The organiccarbon content of the medium appears to be the most significant controlling factor in adsorption anddesorption. Both the adsorption and retention potentials of TCE increased with an increase in organiccarbon content. GAC had the highest retention potential of adsorbed TCE.
Table 4: Properties Of Media Used For Sorption/desorption Studies
Organic CEC Surface AreaMedium C - % meq/100 g m2Cg-1
Clay Soil 0.25 30.1 91Sandy Loam Soil 1.0 14.2 22Organic Top Soil 11.7 23.3 N.A.Peat Moss 49.4 Approx. 150 0.4GAC 74.1 N.A. 1300
N.A. Not available
Table 5: Freundlich Coefficients For TCE Adsorption on Different MediaMedium Kf 1/nf r
[mg/kg][L/mg]1/nf
Sandy Loam Soil 0.5 1.1 0.83Organic Top Soil 13.5 0.81 0.96Peat Moss 93.4 0.75 0.98GAC 81076 0.526 0.98
Zytner [1994] determined the sorption and desorption characteristics of the major components of gasolinefor granular media listed in Table 4. Emphasis was placed on the sorption of benzene, toluene,ethylbenzene and xylenes [BTEX], the aromatic hydrocarbons contained in gasoline. As shown in Figure1 and Table 6, the Freundlich Isotherm satisfactorily described the sorption and desorption of dissolved

soil_overview_03.wpd Page 10 of 70
BTEX on the media tested. The organic carbon content of the media was an important factor in bothsorption and desorption, with the order of sorption preference being GAC, peat moss, organic top soil, claysoil and sandy loam soil. The order of preferential sorption on component basis when comparing Kf valuesfor different media is toluene, m-, p- and o-xylene, ethylbenzene and benzene. This trend follows the logKow predications.

soil_overview_03.wpd Page 11 of 70
10
100
1000
10000
100000
Mas
s S
orbe
d -
ug/g
10 100 1000 Equilibrium Concentration - mg/L
Peat Moss
Organic Top Soil
Clay
Sandy Loam Soil
Figure 1: Sorption of Total BTEX on Different Media
Table 6: Freundlich Sorption Coefficients Media Coef. Benzene Toluene Ethylbenzene M, P-Xylene O-Xylene Totala
BTEX1/nf 1.55 0.66 1.01 1.22 1.22 0.87
Clay Kf 0.17 8.47 1.64 0.80 0.81 3.08r 0.89 0.94 0.89 0.95 0.87 0.96
1/nf 0.51 1.03 *.* *.* *.* *.*GAC Kf 19649 115974 *.* *.* *.* *.*
r 0.98 0.91 *.* *.* *.* *.*
Organic 1/nf 0.78 0.83 0.34 0.60 0.79 0.81Top Kf 2.97 7.58 18.74 30.82 11.49 10.36Soil r 0.96 0.98 0.89 0.99 0.99 0.99
Peat 1/nf 1.0 0.83 0.93 1.49 1.56 0.97Moss Kf 13.0 74.06 63.99 13.89 9.25 39.44
r 0.96 0.95 0.96 0.98 0.97 0.94
Sandy 1/nf 0.95 0.94 1.20 1.24 1.17 1.00Loam Kf 0.58 0.82 0.45 0.44 0.38 0.66Soil r 0.89 0.91 0.93 0.97 0.93 0.95 *.* Value not determined
a Total BTEX - sum of all compounds

soil_overview_03.wpd Page 12 of 70
3.3 Soil-Water Partition Coefficient
The soil-water partition coefficient, Koc, is useful in determining the mobility of organic chemicals in soil.Koc is determined by normalizing the linear partition coefficient, Kp, with the organic carbon content of thesoil [Kenaga, 1980]. The soil-water partition coefficient becomes an important factor in adsorption studiesas adsorption is now related to a single factor, organic carbon content, which is independent of soil type.Studies have shown that compounds with a Koc value of about 1000 are quite tightly bound to the organicmatter in the soil and are considered to be immobile [Kenaga, 1980]. Those chemicals with a Koc below100 for a certain soil are considered moderately to highly mobile. Therefore, Koc is valuable in determiningthe potential leachability of compounds through soil or their potential to bind to the soil. Koc values reported in the literature for TCE include; Roy and Griffen [1985], Koc = 152 L/mg; La Poe[1985], Koc = 183 L/mg and Jaffe et al [1983], Koc = 123 L/mg. However, Garbarini and Lion [1986],Seip et al. [1986] and ORNL, 1980 all reported Koc values less than 100. Such a variation in Koc isexpected, as each soil consists of a complex matrix, i.e., organic carbon, content, surface area, CEC andetc..
Comparison of the average Koc value [118 L/mg] determined by Zytner [1992] study to Kenaga's limits,suggest that TCE has high mobility in soil. Therefore, based on the Koc values determined in this study andreported elsewhere, TCE will quickly migrate into the groundwater, requiring quick action if a spill occurs.For a comparison of mobility between TCE and PCE, their respective Koc values can be used. The TCEsKoc value was 118 L/mg, while in Zytner et al. [1989], a Koc of 330 L/mg was determined for PCE.Comparing these two Koc values suggests that TCE has a higher mobility in soil than PCE. The increasedmobility for TCE assists in explaining the higher incidence of TCE groundwater contamination for volatileorganic compounds [VOCs] [Fischer et al., 1987; Pye et al., 1983 and U.S. EPA, 1982]. In fact,Kerfoot and Barrows [1981] reported that TCE had the highest ranking of all hazardous substancesidentified in the groundwater at 546 Superfund Sites. A similar trend was observed in the Netherlands,where 25% of all pumping stations tested positive for VOCs, with TCE being the most frequent at 67%[Zoeteman et al., 1981]. These trends indicate that response to a TCE spill should be quick, to ensureminimum migration of TCE into the soil and eventually the groundwater.
Zytner [1994] determined the soil-water partition coefficient for BTEX compounds as shown in Table 7.The values ranged between 26 and 656 LCkg-1, indicating that the BTEX compounds have high tomoderate mobility in soil. According to the Koc values measured, benzene has the greatest migrationpotential, followed by toluene, m-, p- and o- xylene and ethylbenzene.

soil_overview_03.wpd Page 13 of 70
Table 7: Koc Values [L@mg-1] For The Different Compounds Medium Koc
a Lit. Koc[29]
Benzene 26 - 59 12 - 340 Toluene 65 - 151 13 - 710 Ethylbenzene 45 - 656 95 - 1095 M-, P-Xylene 44 - 320 110 - 1200 O-Xylene 38 - 324 48 - 540 Total BTEX 66 - 1232 Unavailable
a - X/M in :g/g
3.4 Desorption of Chemicals from Soils
Very few desorption studies have been performed on synthetic organics because considerable time isrequired to conduct such studies [La Poe, 1985]. Desorption is determined by first allowing a solute toattain equilibrium with a known mass of soil by adsorption. After equilibrium, the solution is removed andreplaced with a fresh solvent containing no solute. This new system is re-equilibriated and new X/M valuesdetermined. The data are plotted to produce a desorption isotherm. The desorption is believed to be a slower process than adsorption and losses due to volatilization anddegradation can occur [La Poe, 1985]. This can lead to an over estimation of the quantity of solute stillremaining adsorbed [Rao et al., 1979 and Rogers et al., 1980]. As a result of these difficulties,Schwarzenbach and Westfall [1981] did not perform any desorption studies for the volatile organics theystudied, which included PCE. They felt the more one handled the adsorbent, the more errors could arise,affecting the reliability of the results. Therefore, for desorption tests the methodology used is vital as hassignificant impact on the results.
When the desorption studies are properly carried out, the isotherms do not necessarily overlap theadsorption isotherm. This noncoincidence is referred to as hysteresis. The usual effect of hysteresis is thatdesorption isotherms show higher desorptive capacity than adsorption capacity at lower equilibriumconcentrations [Felsot and Dahm, 1979, Hamaker, 1972, Koskinen, 1979 and Schwarzenbach andWestall, 1981]. Other than unknown experimental losses, hysteresis can be attributed to non-attainmentof equilibrium or to changes in strength of adsorption during desorption over time. These two causes canbe interrelated and are hard to separate due to the soil's heterogeneity [Hamaker and Thompson, 1972].Occasionally studies have been done to evaluate the breakthrough and elution curves. When they exhibittail curves, or asymemetrical curves, nonequilibrium is believed to exist [Rao et al., 1980]. Thisnonequilibrium is also attributed to soil hysteresis. Schwarzenbach and Westall [1981] determined theextent of hysteresis from the tailing effect without performing desorption tests.
Felsot and Dahm [1979] report that organic carbon content is important in desorption. They observed forinsecticides that the quantity of desorption decreased as organic carbon increased. More evidence for thispattern was obtained by oxidizing organic matter and observing an increase in desorption. Others[Hamaker et al., 1969, Hilton and Yuen, 1963 and Saha et al., 1969] have reported that if soil is driedand then rewetted after the sorption phase, the sorbed chemical may be hard to extract. La Poe [1985]

soil_overview_03.wpd Page 14 of 70
reported desorption isotherms above the sorption isotherm for PCE. This was not caused by slowdesorption kinetics but rather by slow adsorption kinetics. La Poe [1985] showed that the longer thesorption study, the closer was the agreement between the adsorption and desorption isotherms, indicatingreversible action at concentrations between 0 and 150 :g/L. La Poe [1985] also suggests that thenegative adsorption of PCE can be attributed to the very hydrophobic nature of the soil being studied. Thiscauses the water molecules to be strongly attracted to the soil surfaces, producing significant portions ofthe soil zones containing solute free water.
Zytner [1992] showed that the organic carbon content, CEC and surface area impacted the mass of TCEdesorbed. The ability to retain an organic chemical is based on the strength of bond developed betweenthe sorbent and sorbate [Roy and Griffen, 1985]. To understand or gain a feel for the retention capacityof TCE by the media tested, the ratio of Kf to Kfd can be determined [Zytner et al., 1989]. The higher theratio, the greater is the retention of the chemical by the medium. However, when this ratio approaches unitsor less, the medium has no retention capabilities. In other words, the medium exhibits total reversibleadsorption.
Table 8 contains the Kf to Kfd ratios for this study. As expected, GAC has the highest Kf/Kfd value becauseof the high organic carbon content and large surface area. Likewise, sandy loam soil has the lowestretention ratio as it has low adsorption and retention capacity of dissolved TCE.
Table 8: TCE Kf/Kfd Values For Media StudiedMedium Kf/Kfd
Sandy Loam Soil 0.2Organic Top Soil 2.0Peat Moss 2.6Granular Activated Carbon 1016
Table 9 gives the desorption coefficients for the BTEX experiments. Table 9 shows that the FreundlichIsotherm worked well as the r value was very high. Review of the coefficient values and the soil propertiesgiven in Table 4, suggests that the mediums organic carbon content, CEC and surface area all affecteddesorption. The ability to retain an organic chemical is based on the strength of the bond developedbetween the sorbent and sorbate. To gain an understanding of the strength, the ratio of Kf/Kfd is used. SeeTable 10. Higher the ratio, greater the retention. When the ratio approaches 1, the medium in questionhas no retention capabilities. Based on the values in Table 10, GAC has the highest retention, consistentwith the organic carbon content. Similar trends follow for the remaining media, except for peat moss, whichshould have been next. It is expected that experimental error occurred. Further investigation is warranted.

soil_overview_03.wpd Page 15 of 70
Table 9: BTEX Freundlich Desorption Coefficients
Media Coef Benzene Toluene Ethylbenzne M, P-Xylene O-Xylene1/nfd 1.07 1.01 *.* 1.01 1.00
Clay Kfd 2.53 2.88 *.* 2.82 2.81r 0.98 1.00 *.* 0.99 1.0
1/nfd 0.96 0.97 *.* *.* *.* GAC Kfd 1981.0 1596.0 *.* *.* *.*
r 0.91 0.99 *.* *.* *.*
Organic 1/nfd 1.0 1.0 1.0 1.0 1.0 Top Kfd 2.48 2.54 2.6 2.42 2.54 Soil r 1.0 1.0 1.0 1.0 1.0
Peat 1/nfd 1.0 1.0 1.01 1.0 0.99 Moss Kfd 38.74 39.33 40.76 37.80 40.13
r 1.0 1.0 1.0 0.99 1.00
Sandy 1/nfd 1.0 1.0 1.0 1.0 1.0 Loam Kfd 2.12 2.18 2.30 2.07 2.18 Soil r 1.0 1.0 0.98 1.0 1.0 *.* Value not determined
Table 10: BTEX Kf/Kfd Values For Media Studied
Media Benzene Toluene Ethylbenzene M, P-Xylene O-Xylene Clay 0.1 3.0 *.* 0.3 0.3 GAC 9.9 72.0 *.* *.* *.* Organic Top Soil 1.2 3.0 7.2 11.9 4.8 Peat Moss 0.3 1.9 1.6 0.4 0.2 Sandy Loam Soil 0.3 7.1 0.3 0.2 0.2
3.5 Application of Isotherm Data
Adsorption isotherms can be used to determine the mass of soil contaminated with a dissolved organiccompound. By knowing or estimating the mass of chemical spilled and the dissolved chemicalconcentration, the mass of contaminated soil can be calculated. This mass of soil can then be treated insitu or excavated for disposal. If necessary, it is also possible to determine the mass of chemical spilledif the mass of contaminated soil can be estimated.

soil_overview_03.wpd Page 16 of 70
4.0 RESIDUAL SATURATION OF NAPLS IN SOIL
Non-aqueous phase liquids (NAPLs) are constantly being released into the environment through chemicalspills, improper waste disposal practices and leaking underground storage tanks [Asano, 1985; Pye et al.,1983]. Once released into the soil environment, these NAPLs migrate toward the groundwater. Thenature and quantity of NAPL reaching the groundwater depends upon the properties of the NAPL and thesoil [Short, 1985; Palmer, 1987; Feenstra and Cherry, 1988].
When a NAPL is released into the subsurface, it flows through the unsaturated zone of the soil toward thegroundwater under the influence of gravity. This migration is a complex process as the NAPL may existin gaseous, sorbed, dissolved and immiscible phases in the unsaturated zone. Several complex modelsrequiring numerical solutions have been developed to explain this migration [Pinder and Abriola, 1986; Zhuet al., 1991].
The problem with a NAPL release into the subsurface is that a fraction of it will eventually reach thegroundwater, causing groundwater contamination. To minimize the amount of NAPL reaching thegroundwater, it is necessary to remove the immiscible phase from the subsurface as soon as possible.Therefore, the knowledge of the maximum penetration of the chemical into the soil is of great interest.However, it is difficult to predict the migration of the NAPL in the unsaturated zone because it must reacha minimum saturation concentration in the porous medium before flow begins [Schwille, 1984]. This cannotbe generalized for every situation as the residual capacity values of the NAPLs differ for different soilcombinations. The lack of experimental data further complicates the issue [Thomson et al., 1992; Schwille,1988].
The NAPL migration in unsaturated soil is dependant on a number of factors: properties of the soil,properties of the NAPL, volume of NAPL spilled, time period over which the spill occurred and area ofinfiltration of the chemicals.
Soil properties that affect chemical behaviour are the soil's intrinsic permeability, the soil's pore sizedistribution and the soil-chemical interfacial tensions. The intrinsic permeability controls the flux for a givenpressure head. The pore size distribution and interfacial tensions contribute to the pressure potential of theliquids present.
Important NAPL properties include density, kinematic viscosity, surface tension and vapour pressure. Thedensity of the chemical will dictate its behaviour once it reaches the groundwater table. Once a lighter-than-water non-aqueous phase liquid (LNAPL) reaches the groundwater it will spread laterally along thecapillary fringe and may eventually depress natural groundwater levels. Whereas, a denser-than-water non-aqueous phase liquid (DNAPL) will displace water and continue its downward migration under pressureand gravity forces.
The kinematic viscosity (<) of a fluid is the key factor in determining the fluid's velocity (conductivity) in drysoil. The conductivity of the soil for a specific fluid is given by the intrinsic permeability of the soil multipliedby the acceleration due to gravity and divided by the fluid's kinematic viscosity. Freeze and Cherry [1979]provide that the intrinsic permeability of a soil is a property of the media only and therefore, in a givenmedia, less viscous fluids will have higher conductivities. A NAPL with low viscosity will penetrate into the

soil_overview_03.wpd Page 17 of 70
unsaturated zone more rapidly than a NAPL with a high viscosity. Using this information, Schwille [1984]has shown that light heating oil with <=4 mm2s-1 would migrate four times slower than water, whiletrichloroethylene with <=0.4 mm2s-1 would move 2.5 times faster that water. Kinematic viscosity of wateris 1 mm2s-1.
The surface and interfacial tensions will effect the pressure potentials in the soil and thus the driving forcefor migration. The vapour pressure will control the soil-air migration of chemicals in the subsurface.
Mercer and Cohen [1990] have reviewed a number of models for predicting NAPL behaviour in theunsaturated zone. The models are useful for conceptualization but the data for their application is generallylacking. The models can be divided into three classes: (i) interphase mass transfer approach, whichconsiders interphase partitioning of NAPL between water and vapour phases [Abriola and Pinder, 1985;Corapcioglu and Pinder, 1987], (ii) immiscible phase approach, which couples the equations for the water-NAPL-gas system and includes constitutive relations for saturation and relative permeability, and (iii) sharpinterface approach, or a piston flow model, which develops a time-distance profile for NAPL transportbased on Darcy's Law. The last approach is similar to the approach employed in the Green and Amptmodel for water flow.
Kessler and Rubin [1985] proposed a model for the short term migration of oil spills and found thatavailable data concerning water infiltration was useful for determining parameters needed to describe oilflow in the unsaturated zone. In a subsequent study, Rubin and Mechrez [1989] performed laboratoryexperiments to validate this approach of using water infiltration data to determine oil infiltration. Theconversion of water infiltration parameters to oil infiltration parameters was based on the physical propertiesof water and oil, such as surface tension and viscosity.
Reible et al. [1990] outlined a simplified model for one dimensional infiltration of NAPL through theunsaturated zone. They found that the infiltration of an immiscible chemical into the unsaturated zone couldbe predicted using only the spill volume and area, the intrinsic permeability, the retention capacity and thecapillary rise height of the infiltrating liquid. The model was validated by carrying out experiments and agood correlation was found between the predicted and experimental results.
Cary et al. [1989] modelled a number of soil column infiltration experiments using a simplified explicit finitedifference code for three phase flow in a one-dimensional system. Model predictions were good forinfiltration experiments in loamy sand and silt loam but less satisfactory for experiments in sand. Cary etal. [1989] also used simple multiphase flow code to predict oil infiltration and redistribution in unsaturatedsoils. The calculated infiltration times were greater than those measured experimentally. The model underpredicted the infiltration and redistribution curves for water but accurately predicted the curves for mineraloil. However, the authors recognized the need for more experimental data concerning the organic liquidconductivity in unsaturated soils at a variety of soil water contents.
As a NAPL migrates downward in the unsaturated zone, it leaves behind residual liquid in the soil pores[residual saturation] due to the surface tension effects. This residual saturation may become a future sourceof contamination through transport by infiltrating water and the migration of vapour plumes originating fromthe residual saturation [Mercer and Cohen, 1990, Mackay and Cherry, 1989 and Cohen et al., 1987].
soil_overview_03.wpd Page 18 of 70
The ability of the unsaturated zone to retain NAPL has been measured and reported as [de Pastrovich etal., 1979; Schwille, 1984; Wilson and Conrad, 1984]:
RC = srC0oC1000 (8)where
RC = retention capacity, litres of NAPL per m3 of mediumsr = residual saturation, volume of NAPL/volume of voids0o = soil porosity, fraction
Values of residual saturation, sr, have been reported between 0.1 to 0.2 in the unsaturated zone and 0.15to 0.5 in the saturated zone [Schwille 1984; Hoag and Marley 1986; Anderson 1988]. In the unsaturatedzone, residual saturation increases with decreasing intrinsic permeability, effective porosity and moisturecontent. Schwille [1988] reports that while there exists numerous measurements of residual oil retentionin porous media, information is limited for other chemicals and solvents.
4.1 Theory
Retention capacity [RC] is defined as the volume [or mass] of NAPL retained by a volume [or mass] ofsoil. Consider that the bulk soil volume, Vs, is given by:
Vs = Vw + Va + Vss (9)where,
Vw = Volume of water, LVa = Volume of air, LVss = Volume of solids, L.
If the soil is dry, i.e. no bound water is present, the volume of voids in the soil, Vv, L is given by:Vv = Va (10)
orVv = 0oVs (11a)
= 0oCM/Ds (11b)where,
M = dry mass of soil, gDs = bulk dry density of soil, g/L
Letting the volume of pure chemical retained by a soil, Vc, L, be proportional to the soil void volume, Vv,the retention of chemical can be expressed as:
Vc % Vv (12)
Defining fv as the fraction of voids filled with chemical, and using Eq. 11a in Eq. 13, Vc can be expressedas:
Vc = fv0o[M/Ds] (13)
Since the volume of a spilled chemical is usually reported on a mass basis,Mc = DcVc (14)
soil_overview_03.wpd Page 19 of 70
where,Mc = mass of chemical, gDc = density of chemical, g/L
Combining Eq. 13 and Eq. 14,Mc = fv0oDc[M/Ds] (15)
orMc/M = fv0o[Dc/Ds] (16a)
orRC = fv0o[Dc/Ds] (16b)
The Mc/M relationship given in Eq. 16a is defined as the retention capacity, RC, of a chemical in dry soilin g/g. The term fv in Eq. 16a is the same as the residual saturation, sr, term defined earlier [Schwille, 1984;Hoag and Marley, 1986; Anderson, 1988].
Zytner et al. [1993] measured retention capacity values in the laboratory for three non-aqueous phaseliquids [NAPLs], PCE, TCE and gasoline. The dry soils studied were sandy loam, clay, organic top soiland peat moss. For the conditions tested, it was determined that higher the NAPL's density and the soil'sporosity and lower the soil bulk density, greater is the retention capacity. Consistently higher retentioncapacities were obtained for PCE with a density of 1622 g/L, than TCE and gasoline, with respectivedensities of 1456 g/L and 750 g/L. Similar behaviour has been observed by other researchers [Schwille,1984; Hoag and Marley, 1986; Anderson, 1988]. Similar trends were also observed by Schwille [1984],Hoag and Marley [1986] and Anderson [1988], who reported that retention capacity increased with anincrease in soil porosity.
To obtain a correlation between the retention capacity, soil properties and NAPL properties, the retentioncapacity (Mc/M) values were plotted versus 0o(Dc/Ds). The data showed that the retention capacityincreased linearly with an increase in the 0o(Dc/Ds) values, and can be expressed by the followingcorrelation:
RC = 1.05[0o[Dc/Ds] - 0.15 (17)
where, RC = retention capacity [mass of chemical/ mass of soil] - g/g.
The r2 value of the 42 observations used to obtain Eq. 17 is 0.997, suggesting a good fit. Equation 17 canbe simplified by forcing the regression through zero and changing the coefficient [1.05] to 1.0 to obtain:
RC = [0o[Dc/Ds] (18)
with an r2 value of 0.993.
Equations 17 and 18 satisfactorily correlate the retention capacity with the soil and NAPL properties,indicating that retention capacity is a function of the soil's physical properties and the NAPL's chemicalproperties. This has also been suggested by other researchers [Feenstra and Cherry, 1988; Schwille,1984]. Further investigation is required to see if Eq. 18 can be applied to NAPLs not tested in this study.Additional investigation is also required to more clearly define the inter-relationships between soil's

soil_overview_03.wpd Page 20 of 70
physical/chemical properties and the NAPL's chemical properties.
Guigard et al. [1995] showed that an important parameter in the movement of immiscible chemicalsthrough soil is the retention capacity, by studying the retention capacities for two chemicals, n-hexane andtetrachloroethylene [PCE] in three soils at varying soil water contents. The retention capacities weredetermined using prepared laboratory scale soil columns using two experimental techniques: (i)saturation/drainage experiments where the soil columns were saturated with the chemicals and allowed todrain freely for 24 h, and (ii) spill simulations where a known amount of chemical was spilled on the surfaceof the soil column and allowed to infiltrate for one hour. Results show that the retention capacities on avolume basis were independent of chemical type. However, the retention capacities did decrease withdecreasing porosity and increasing soil water content. The decrease of retention capacity with respect tomoisture was significant, with the decreases ranging from 38% to 94%. The implications of this are rapidpenetration into the subsurface. Retention capacities obtained from spill simulations were consistently lowerthan those obtained by the saturation/drainage experiments due to hysteresis.
4.2 Infiltration
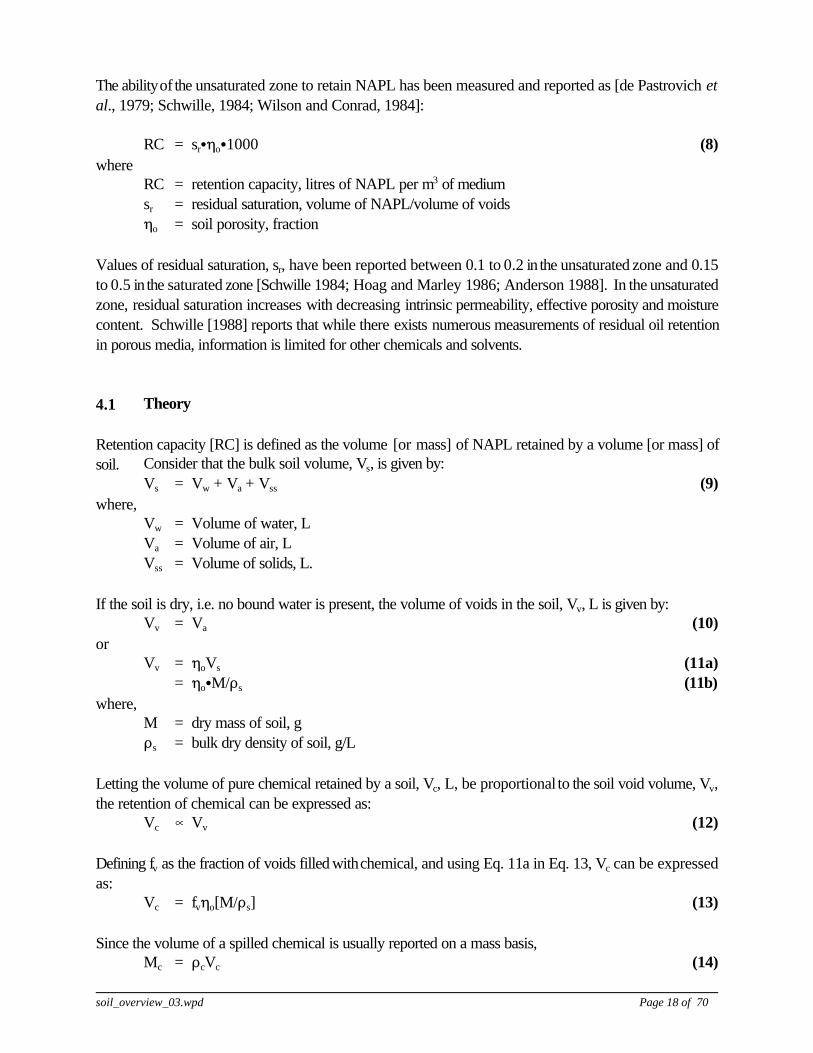
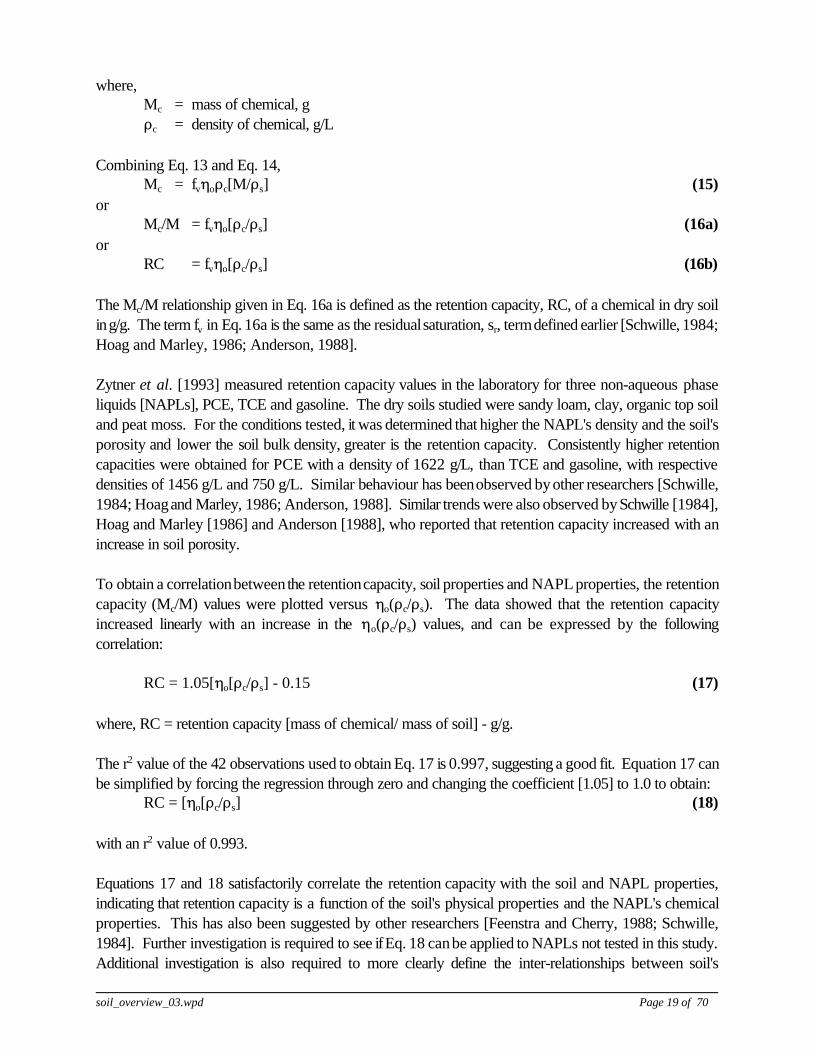
Guigard et al. [1996] completed laboratory simulations with hexane and PCE in prepared soil columns.Both infiltration times and liquid front movement were measured as was the influence of soil type and soilwater content on the spill behaviour. Infiltration times for both chemicals into a given soil were similar. Thechemicals infiltrated fastest into the more permeable soil. The liquid front movement in air dry soils followeda log-log relationship with time that is similar to the Green and Ampt model.
Figures 2 and 3 show that the wetting front movement can be described by the Green and Ampt model ifchemical is present at the top of the soil column. The assumptions are that the moving front is sharp withuniform concentrations across the horizontal from. A 1D expression can be used to represent themovement, which some call “plug flow”. Normally the Green and Ampt model limit its applicability to frontmovement while liquid remains present at the surface (i.e., ponding). From Figures 2 and 3, it is clear thatafter ponding has ceased, the front movement slows down appreciably during a period referred to asredistribution. During this redistribution period, the value in the Green and Ampt model is limited to aconservative or knowingly over predictive estimation of the position of the wetting front.
Increasing the soil water content had a significant effect on both the infiltration times and liquid frontmovement: the infiltration times increased, while the chemical front moved faster through the soil column.
soil_overview_03.wpd Page 21 of 70
Figure 2: Hexane Liquid Front Movement in Air Dry Soil
Figure 3: PCE Liquid Front Movement in Air Dry Soil

soil_overview_03.wpd Page 22 of 70
5.0 VOLATILIZATION FROM SOIL
Volatilization can be defined as the loss of chemicals from any surface to the vapour phase, followed bymovement in to the atmosphere [Spencer et al., 1982]. The potential to volatilize depends on thechemicals vapour pressure as well as environmental conditions and factors that exist at the solid-air-waterinterface.
Henry's law is used to explain the transfer between the liquid and gas phases due to volatilization. It is avalid approximation for many environmental applications which take place at atmospheric pressure andtemperature. The law states that at a constant temperature, the mass of gas dis solved in a given volumeof a solvent is directly proportional to its partial pressure in the gas phase in equilibrium with the solution[Yurteri et al., 1987]: pi = KHi @CLi (19)
At atmospheric pressures the gas phase approaches ideal behaviour, allowing one to express the law as: Hi = KHi /RTe = CGi/CLi (20)
where, pi = partial pressure of component i, atm KHi = Henry's law constant for i, m3-atm/mole
CLi = equilibrium liquid phase concentration of i, mole/m3 CGi = equilibrium gas phase concentration of i, mole/m3
R = universal gas constant, atm-m3 /mole KTe = equilibrium temperature, KHi = dimensionless Henry's law constant for i.
Namkung and Rittmann [1987] studied two publicly owned treatment works and observed that the higherthe Henry's law constant, the greater the rate of volatilization. However, Yurteri et al. [1987] observedthat Henry's law constant could be affected by the presence of salts, surfactants and humic material.Therefore, it is important to understand the nature of the impurities present and their effects on Henry's Lawconstant and the volatilization rate.
When a synthetic chemical is spilled on an impervious surface or soil that does not drain quickly,volatilization can be expressed by Ficks first law of diffusion [Gowda and Lock, 1984]:
F = KL [CSL -CL] = KG [CG - CSG ] (21)
whereKL = mass transfer coefficients, m/dayKG = mass transfer coefficients, m/dayCL = concentrations in the bulk liquid, g/m3
CG = concentrations in the bulk gas phase, g/m3
CSL = liquid phase concentrations at the interface, g/m3
CSG = liquid phase concentrations at the interface, g/m3

soil_overview_03.wpd Page 23 of 70
5.1 Passive Volatilization
Gasoline spilled into unsaturated soil migrates into the subsurface under the influence of gravity until theentire volume is dispersed into the soil pores [Zytner et al., 1993]. This gasoline, commonly referred toresidual saturation, remains present in the soil until it volatilizes into the atmosphere, is transported furtherinto the subsurface by infiltrating water, or is biologically degraded.
Numerous options for cleanup of gasoline-contaminated surface soils exist [Kostecki and Calabrese,1989]. Options include soil vapour extraction [Khan and Cruse, 1990], chemical degradation [Khan andCruse, 1990], excavation and landfill, in situ bioremediation [Dean-Ross et al., 1992; English and Loehr,1991], bioventing [Dupont, 1993], surfactant flushing [Zalidis et al., 1991] and through passivevolatilization. Passive volatilization describes the natural evaporation of the contaminant from soil, andincludes the following engineered modifications; covering excavations to facilitate venting and excavatingthe soil and land spreading it [Donaldson et al., 1992].
A significant spill fate is passive volatilization. It is the natural evaporative loss that can lead to atmospherichealth and explosion risk. Passive volatilization is also an important remediation option in itself or as partof a soil vapour extraction system; the most common remediation technique for gasoline. In soil vapourextraction, air preferentially flows through the higher permeability material, rendering the removal of gasolinefrom low permeability zones an essentially passive volatilization process. Having reliable passivevolatilization rates would assist in understanding and quantitatively predicting the behaviour of a spill.
To date, experimental work on passive volatilization is limited. Fine and Yaron [1993], Galin et al. [1990]and Acher et al. [1990] all reported that the increased volatilization in sand is directly related to increasedpermeability. Soils such as clays, which exhibit higher porosities but have pore size distributions skewedtowards smaller pores, show lower volatilization rates than sand. Johnson and Perrott [1990] showed thatin a fine silty clay contaminated with gasoline, at water contents approaching 90% of saturation, there wasreduced vapour-phase diffusion of the contaminant. Goss [1993], Batterman et al. [1995] and Shonnardand Bell [1993] showed that volatilization fluxes increased with the addition of small amounts of water todry soils due to reduced sorption.
Experimental evidence also suggests that convective movement can enhance volatilization from soil. Twosuch effects are noted. Spencer et al. [1982] showed that water evaporation can create sufficient suctionto pull contaminated water to the surface of the soil. This increases the flux of dissolved contaminantstowards the surface and aids volatilization into the atmosphere. Accordingly, the effect applies moststrongly to more polar contaminants that have an appreciable solubility in water. A second capillary riseeffect was noted by Arthurs et al. [1995] and Smith et al. [1994], who found that the immiscible phaseitself can rise in soils. This 'wicking' effect can transport chemicals to the soil surface without the aid ofwater evaporation, making it easier for the contaminants to volatilize into the atmosphere.
In general, studies on the volatilization of gasoline from soils are limited. Donaldson et al. [1992]conducted gasoline volatilization experiments on a loamy sand during both spring and summer seasons.Overall volatilization losses were consistently higher during the summer experiments, a result of higher soiltemperatures and the resulting increase in vapour pressure of the gasoline components. Jarsjo et al. [1994]compared volatilization rates of kerosene from various soils at 27oC and 5oC, and found that the fraction
soil_overview_03.wpd Page 24 of 70
of kerosene volatilized was 2 to 3 times higher at 27oC than 5oC. Passive volatilization is an inexpensiveremediation option as natural mechanisms are used to remove the bulk of gasoline. The gasoline migratesto the soil surface by convection due to bulk gasoline concentration gradients and due to diffusion in thegaseous or liquid gasoline due to individual component concentration gradients. However, limitedinformation is available in the literature on the volatilization rates.
Research completed by Arthurs et al. [1994] showed that passive volatilization rate of gasoline isdependent on the soil and chemical type, wicking behaviour, and depth of gasoline in soil. Wicking is asignificant mechanism. The time required to deplete the overall gasoline concentration in the soil to 40%of the initial concentration ranged from 0.25 to 10 days for the three soils. Ottawa Sand was the fastest[6 h], followed by Delhi Loamy Sand [160 h] and Elora Silt Loam [240 h]. Observation of individualcomponents indicated that a wicking mechanism was contributing to the gasoline flux towards theatmosphere. Based on the results, volatilization rate volatilization rate increases with increasing vapourpressure [n-Heptane, followed by Toluene, n-Octane, Ethylbenzene, m-Xylene and n-Hexadecane].
Gidda et al [1999] reported some interesting findings that are applicable to the passive volatilization ofgasoline from unsaturated soil. Immiscible phase movement to the surface, commonly referred to aswicking, is a significant contributor to passive volatilization, and most significant at higher initial gasolinecontents. The initial gasoline content, and hence wicking, plays a larger part in volatilization behaviour thansoil type. There appears to be a threshold level of approximately 5% residual gasoline content in soil atwhich this process ceases. Findings also show that wicking occurs for an extended period of time in undersub-zero temperatures as it takes longer to reach the threshold level.
Solubility limits and freezing of gasoline components cause precipitation to occur at the soil surface. As aresult, the surface gasoline fraction consists of both solid and liquid gasoline, which maintains the drivingforce necessary for wicking to continue until the threshold level of 5% is attained.
Volatilization behaviour from wet soils is dependent on the soil type, where water impacts both the diffusiveand wicking movement of the gasoline. Soils with larger pores, like Delhi Loamy Sand and Elora Silt Loammaintain the interconnected pore structure more easily, allowing for increased volatilization. However forWindsor Clay Loam, at water contents of 20 and 30%, the water enters the many fine pores which in turncan trap gasoline, reducing the passive volatilization rate.
Sub-zero temperatures result in a decrease in the total fraction of gasoline lost when compared to the roomtemperature experiments. This also holds true for the wet soil. Sub-zero temperatures impact diffusionbased on reduced chemical vapour pressures.
5.2 Soil Vapour Extraction
Soil vapour extraction (SVE) is an attractive technique for the remediation of unsaturated soilscontaminated with volatile petroleum products. Conceptually, SVE is a simple process in which vacuuminduced airflow is used to enhance the removal of volatile organic compounds (VOCs). Field studies haveshown that SVE can remove large quantities of VOCs from a variety of soil types [Coia et al., 1985;Crow et al., 1987; Hutzler et al., 1988; Gibson et al., 1993]. Unfortunately, SVE performance often

soil_overview_03.wpd Page 25 of 70
deteriorates rapidly as evidenced by an appreciable decline in soil vapour concentrations and contaminantmass removal rates, sometimes within days after start-up [DiGuilo, 1992; Crow et al., 1987]. Whenairflow is interrupted for a period of time and then restarted, the observed vapour concentrations on restartreturn to high levels but again decline rapidly as air flow continues. As such, it is difficult to predict the timerequired to achieve a given cleanup level.
To gain a better understanding of the SVE process, the removal of VOCs from coarse grained soils bySVE has been investigated in a number of laboratory scale studies [Thornton and Wooten, 1982; Baehret al., 1989]. The experimental evidence suggests that in the presence of a non-aqueous phase liquid(NAPL), venting behaviour is controlled by equilibrium. Several numerical and analytical models basedon the assumption of local phase equilibria have been developed for coarse grained soils to predictcontaminant removal by SVE [Baehr et al., 1989; Rathfelder et al., 1991; Ho and Udell, 1994].
Non-equilibrium behaviour has been investigated in recent experimental studies with coarse grained soils.Wilkins et al. [1996] showed that the rate of mass transfer from the NAPL decreased with decreasingmean grain size of the soil particles. Hayden et al. [1994] in an investigation of multi-component NAPLremoval, indicated that mass transfer limitations begin to develop when a compound was nearly depletedfrom the NAPL. Ho and Udell [1994] investigated the effects of permeability differences on mass transferin a two-layered soil system. Berdnston and Bunge [1991] suggested that in the absence of a NAPL, masstransfer was limited by diffusion at the air-water interface.
With respect to fine grained soils, there have been comparatively few experimental investigations of SVE.Gierke et al. [1992] investigated the effect of water content on chemical removal from sand and amanufactured aggregated soil material. For the aggregated soil in the absence of a NAPL, both the airvelocity and water content were important factors limiting the rate of mass transfer. Fine and Yaron [1993]showed that both the water content and the degree of aggregation influence the venting of kerosene froma variety of soils.
Several non-equilibrium contaminant transport models have been developed to gain insight into masstransfer limitations. The simplest models employed first-order mass transfer relationships to describe masstransfer between the vapour and NAPL or dissolved phases [Rathfelder et al., 1991; Armstrong et al.,1994]. It is believed that the mass transfer limitations were the result of a combination of diffusion from lowto high permeability soil layers associated with advective air flow, diffusion through water filled pores, masstransfer resistance at the air-water interface and desorption kinetics [Brussseau, 1991; Gierke et al., 1992;Hayden et al., 1994]. More complicated models were developed based on a 2-domain [mobile/immobile]approach to account for differences in behaviour between the air filled macropores and the water filledmicropores [Brusseau, 1991; Gierke et al., 1992; Ng and Mei, 1996].
Harper et al. [1998] studied the extraction of single and binary volatile organic contaminants from a siltloam soil at three different water contents. Transport of chemicals through the soil columns was stronglyinfluenced by the water content. Figures 4 shows the venting behaviour of the binary system experiments.The breakthroughs for both components were quite sharp. The observed dimensionless breakthrough times(dotted vertical lines) for toluene and m-xylene, 6500 and 16000, compare favourably with their respectiveideal values of 7100 and 14000, where dimensionless time corrects for differences in air flow rate and theinitial amount of a contaminant. Further, this ideal dimensionless breakthrough time is equal to the liquid

soil_overview_03.wpd Page 26 of 70
0.00001
0.0001
0.001
0.01
0.1
1
Toluene
m-Xylene
0.00001
0.0001
0.001
0.01
0.1
1
0.00001
0.0001
0.001
0.01
0.1
1
C/C
*
16% WC
22% WC
static period
ideal Toluene time (7100)
static period
ideal m-Xylene time (14000)
J20 40 60 80 100 120 140
ideal Toluene time (7100)
ideal m-Xylene time (14000)
Air Dry
x 1000
Figure 4: SVE Dimensionless EffluentConcentrations for Binary Mixture
density divided by the saturated vapour density.
When equilibrium conditions exist as well asideal plug flow behaviour with no dispersion,breakthrough occurs as a step function goingfrom 1 to 0 in an instant. As shown in Figure 4,under air dry conditions, the dimensionlessconcentration stayed at 1 until breakthrough oftoluene. Then the dimensionless m-xyleneconcentration fluctuates around 0.9 untilbreakthrough. It can again be concluded thatequilibrium conditions were attained while thebulk of the contaminant was removed. Postanalysis revealed that the concentrations in thesoil had fallen to less than 10 :g/g which wasbelow most clean-up levels (Oliver et al.,1996). Thus, when ideal breakthrough occurs,it can be stated that equilibrium conditionsprevailed throughout the extraction procedure.This results in almost complete removal of thecontaminant with minimal tailing. At theintermediate water content [16 wt%],equilibrium conditions were predominant for theearly removal but mass transfer limits wereapparent as NAPL saturations were reduced.At the highest water content [22%], masstransfer limitations controlled even with the majority of the initial NAPL contamination still present.
5.2 Soil Vapour Extraction - Mass Transfer Coefficients
In practice, the performance of SVE systems is less than ideal. An appreciable decline in effluent vapourconcentrations and mass removal rates is often observed within days after start up, followed by extendedtailing (DiGiulio, 1992; Stinson, 1989). As a result of deteriorating SVE performance, contaminant levelsremain above clean up targets and increased clean up costs are incurred from pumping large volumes ofair at low contaminant concentrations for extended time periods. Predicting SVE performance and cleanuptime is difficult due to limited information on site characteristics, complexities of the subsurface, factorscausing tailing, and control of contaminant mass transfer by several interacting processes. Currently, designand operation is still based on empirical knowledge and a better understanding of the complexities isrequired (Poulsen et al., 1998).
Early SVE contaminant transport models, based on venting experiments involving the removal of NAPLcontaining contaminants from granular soils, employed local phase equilibria to describe interphase masstransfer (Marley and Hoag, 1984; Baehr et al.,1989; Ho et al, 1994). Experimental results suggested thatin the presence of NAPL, there was sufficient contact between the flowing air and immobile NAPL to attainchemical equilibrium. Although attractive for their computational efficiency and ease of implementation, local

soil_overview_03.wpd Page 27 of 70
equilibrium models provide an incomplete description of most field scenarios. These models, however, arevaluable screening tools to evaluate the potential use of SVE as a remedial option.
The next generation of SVE contaminant transport models were non-equilibrium based incorporatingvarious rate limiting mechanisms to explain field observations and improve predictive capabilities. Theseearly non-equilibrium contaminant transport models considered the effects of soil heterogeneity oncontaminant mass transfer in the creation of preferential airflow pathways. The controlling mechanism forcontaminant mass transfer was diffusion through a low permeability non-advective layer adjacent to a layerof higher permeability with advective air flow (Johnson et al., 1990; Ho and Udell, 1991). These modelsoffered a simple yet effective description of the influence of soil heterogeneity on mass transfer limitationsat the field scale.
A number of SVE non-equilibrium models have been presented employing first order interphase masstransfer kinetics to describe single and multicomponent contaminant removal from unstructured soils(Rathfelder et al., 1991; Lingineni and Dhir, 1992; Armstrong et al.1994; Karan et al. 1994). The firstorder models were applied to both NAPL and non-NAPL containing systems and incorporated masstransfer resistances involving single and multiple-phase pairs. With the exception of Karan et al. (1994),constant mass transfer coefficients were assumed in all cases. A requirement of this modelling approachwas the evaluation of mass transfer coefficients, which in the absence of effective correlations for soils, hadto be determined by curve fitting.
Other non-equilibrium model efforts adopted a more rigorous mechanistic approach to quantify the effectsof aggregate formation on contaminant mass transfer in structured soils. These models employed a twodomain (mobile/immobile) approach incorporating several mass transfer resistances including radialdiffusion, interphase mass transfer kinetics and desorption kinetics to describe the removal of singlecomponents from three phase (air-water-solid) containing systems. The mobile domain consisted of the air-filled macropores and the immobile domain consisted of the water-filled micropores. Gierke et al. (1992)considered advection and diffusion in the air-filled domain, radial diffusion in water-filled sphericalaggregates and first order mass transfer kinetics between the two domains. Ng and Mei (1996) presenteda similar model to Gierke et al. (1992), but differed by assuming instantaneous inter-domain mass transfer.Brusseau (1991) assumed first order kinetics between the immobile water and air-filled pore domains withinstantaneous and rate limited desorption within domains. Campagnolo and Akgerman (1995) presenteda comprehensive multi-component, multi-domain model, which included a NAPL phase and 4 solid phasedomains: gas-filled mineral particles, water-filled mineral particles, microbial aggregates and organic matter.The two multi-domain models all performed well when tested against laboratory data and in the case ofCampagnolo and Akgerman (1995) against field data.
Contaminant mass transfer in SVE systems is controlled by a complex series of inter-related processesdependent on several parameters including soil type, permeability, particle size distribution, organic carboncontent, water content, contaminant composition, contaminant physical and chemical properties and airpore velocity amongst others. Although much insight into the factors controlling contaminant mass transferin SVE has been derived from previous investigations, the scope of conditions investigated, is still somewhatnarrow. Process data is especially lacking for the removal of NAPL containing contaminants fromstructured soils, even though such conditions are likely to be encountered in the field.

soil_overview_03.wpd Page 28 of 70
5.3.1 Model Development
The contaminant transport model developed for the column venting experiments describes the removal ofa multicomponent organic contaminant from soil distributed amongst four phases: vapour, NAPL, aqueousand solid. The wetting fluid, as is typical for almost all air- NAPL-water-systems, was water, which wasassumed to engulf the solid particles. The NAPL phase as the fluid of intermediate wettability, forms a layeradjacent to the water layer with the remainder of the pore space filled by air.
The vapour, NAPL and aqueous phases were assumed to follow applicable ideal behaviour. Ideal gasbehaviour was assumed for the soil vapour as the venting experiments were performed at room temperatureand the pressure drops across the soil columns were less than 500 Pa (Massman, 1989). The soil gas, dueto the low column pressure drops, was treated as an incompressible fluid. The aqueous phase was treatedas a Henry’s Law ideal solution considering the low aqueous solubilities of the four organic compoundsused in the venting experiments and the corresponding negligible deviations from ideal behaviour. TheNAPL phase was assumed to obey Raoult’s Law ideal solution behaviour based on the similarities inchemical structure for toluene, m-xylene and trimethylbenzene, all being methyl substitute single ringaromatic compounds. Hexane as part of the quaternary mixture will exhibit slight non-ideal character, butfor simplicity was assumed to behave ideally within the NAPL mix. Isothermal conditions were assumed.
Evaporative water losses and bio-degradation of the organic compounds were negligible. Post-experimental water contents measured across the length of the soil columns differed from pre-experimentalvalues by less than 5%. Biological activity was monitored by the measurement of CO2 levels in influent andeffluent air over the course of a venting experiment and negligible differences were observed. Theobserved overall mass balance was excellent.
The soil vapour was assumed to be the only mobile phase as the applied external pressure gradient wastoo low to induce flow in either the NAPL or aqueous phases (Falta et al.,1989). Constant superficial gasvelocity was assumed as constant air flow rates were maintained over the course of the ventingexperiments. The air-filled porosity was set as a constant as the effects of NAPL depletion werenegligible.
The other process contributing to vapour phase contaminant transport was molecular diffusion. Mechanicaldispersion, an important process affecting liquid transport in porous media, was assumed to make anegligible contribution to vapour phase contaminant transport, on the basis of the almost 4 order ofmagnitude difference between gaseous and liquid molecular diffusivities (Benson et al.,1993).Contaminant transport by molecular diffusion was assumed to obey Fick’s Law and Knudsen diffusionalong with species coupling effects associated with multi-component diffusion were ignored. Fick’s Lawprovides an accurate description of transport by molecular diffusion for the dilute vapour phaseconcentrations and the medium textured soil encountered in the venting experiments (Thorstenson andPollock, 1989). The binary molecular diffusion coefficient was corrected for the porosity and tortuosityof the porous medium based on the empirical relationship of Millington and Quirk (1961).
Local equilibrium has been applied between the NAPL, water and solid phase concentrations. Linearequilibrium partition coefficients have been used to relate the concentrations in these three phases at alltimes. The aqueous/NAPL partition coefficient was defined as the molar aqueous solubility divided by the

soil_overview_03.wpd Page 29 of 70
molar NAPL density. Equilibrium partitioning between the aqueous and solid phases was assumed to bedominated by sorption of the organic compounds to the soil organic matter. This process was describedby the linear adsorption isotherm model where the sorption partition coefficient is given as the product ofthe organic carbon partition coefficient and the organic carbon fraction of the soil (Karickhoff et al., 1979).
Mass transfer limitations in the contaminant transport model were described using an overall volumetricmass transfer coefficient. The rate of mass transfer is expressed as the product of concentration drivingforce and an overall volumetric mass transfer coefficient. The overall volumetric mass transfer coefficientincorporates in a lumped manner the resistance that prevails in each of the phases of the system and theinterfacial contact area between the phases. This lumped resistance combines the diffusional resistancewithin the soil’s organic matter, diffusional resistances within water-filled pores, diffusional resistance withinthe NAPL layer and resistances across the various phase interfaces. However, as a lumped parameter noattempt is made to quantify, or provide resolution between these resistances.
Contaminant removal in the soil venting columns was thus described by two contaminant transportequations including one for the mobile vapour phase and a second for the immobile NAPL-aqueous-solid-phases. The vapour phase contaminant transport equation is given by Equation 22:
(22)
where,2g = air volumetric fraction (m3"m-3)q = superficial air velocity (m"h-1)x = spatial coordinate (m)Dej = effective molecular diffusion coefficient (m2 "h-1)Kga = overall air/NAPL volumetric mass transfer coefficient (h-1)t = time (h)Cgj = vapour phase concentration (mol"m-3)Kgl = air / NAPL partition coefficient (m3 "m-3)Clj = NAPL concentration (mol"m-3)j = species index
In the second contaminant transport equation for the NAPL, aqueous and solid phases, the localequilibrium assumption allowed the accumulation term to be expressed in terms of the NAPL concentrationas follows:
(23)
where2l = volumetric NAPL content (m3"m-3)2w = volumetric water content (m3"m-3)Kwl = NAPL / aqueous phase partition (m3"m-3)Ksl = sorbed / NAPL partition coefficient (m3"kg-1)

soil_overview_03.wpd Page 30 of 70
Figure 5: Toluene Behaviour
Db = bulk density of the porous medium (kg"m-3)
The overall volumetric mass transfer coefficient has been modelled as a linear function of the local NAPLcontent as described in Equation 24:
(24)
where2l
o = initial NAPL volumetric fraction (m3"m-3 )m = adjustable parameter capturing dependence of the overall volumetric mass transfer
coefficient on the NAPL content (h-1) Kgamin = overall volumetric mass transfer coefficient in the absence of a NAPL, which essentially
describes the air-water transfer resistance (h-1)
The above equation was selected for a number of simple reasons. First was the inability of a constant masstransfer coefficient to capture the observed venting behaviour as will be discussed later. This included aninability to capture the observed outlet concentrations while a substantial NAPL content remained in thesystem. Thus, it was recognized that a declining mass transfer coefficient was necessary. During the periodin which the NAPL remains in the system the bulk of the contamination is in this NAPL phase. Thus, themass transfer coefficient must be linked to the prevailing NAPL content. The simplest two-parameterrelationship is a linear one between the mass transfer coefficient and the NAPL content. As the volumetricNAPL content changes with time, the overall mass transfer coefficient has an indirect temporal dependence.
5.3.2 Mass Transfer Coefficients
Table 11 gives all the calculated mass transfer coefficients obtained for the single, binary and quaternarycases run at the various water contents. Figures 5, 6, 7 and 8 show the resulting fits using these coefficients. The figures show that the variable mass transfer coefficient provided an excellent fit of all nine data sets.The relationship could fit the sharp breakthroughs of the air dry experiments (2.7wt%), the increasespreading of the middle water content(15-16 wt%) experiments and theextended tailing of the high water content (20-22 wt%) experiments. Theoverall mass transfer coefficient and the corresponding fitting parameters weredependent on the soil’s water content.
For the binary and quaternary experiments, the same two fitting parameterswere used for all of the components within a given experiment.

soil_overview_03.wpd Page 31 of 70
Table 11: Mass Transfer Coefficients Parameters (m and Kgamin ) and Fitting Parameters (ASSRD)
Air Dry Middle Water Content High Water Content
Experiment Replicate m(h-1)
Kgamin (h-1)
ASSRD m(h-1)
Kgamin (h-1)
ASSRD m(h-1)
Kgamin
(h-1)ASSRD
Single A 950 80 1.3 380 2.1 0.32 120 0.1 0.88
B 285 65 2.3 210 8 0.12 38 1 0.1
avg 617 72 295 5 79 0.55
Binary A 450 75 0.4 225 8 0.49 35 0.8 1.2
B 360 120 0.6 315 18 0.52 125 0.8 1.24
C 420 35 1.2 NA NA NA NA NA NA
avg 410 77 270 13 80 0.8
Quaternary A 130 0.4 0.41 205 0.3 0.38 115 0.02 5.05
B 148 1.7 0.4 148 0.6 0.27 120 0.01 1.47
C 265 0.45 0.45 330 7 0.88 95 0.05 2.33
avg 181 0.85 228 2.6 110 0.03NA = not applicableASSRD = Average sum of squared relative deviations

soil_overview_03.wpd Page 32 of 70
Figure 6: Quaternary Dry
Figure 7: Quat. Semi-wet
Figure 8: Quat. Wet
Figure 9: m and Kgamin
For the binary case both components (toluene and m-xylene) were fit equally wellwith this single set of parameters. For the quaternary, three of the fourcomponents were fit very well while the tailing of the fourth component (hexane)was poorly handled in the middle water and high water content experiments. Thegreater mass transfer resistance observed for hexane was attributed to its muchlower affinity for the water phase relative to the other three components. Toextend the success of this model to handle complex mixtures requires thedevelopment of a relationship for the two parameters as a function of the physical-chemical properties of each component. The overall trend is a slight decline in themagnitude of the initial mass transfer coefficient with increasing soil water contentand a nearly two orders of magnitude decline for the final mass transfercoefficient. The final mass transfer coefficient for the quaternary air dry case is theonly exception to these trends. Further work is necessary to explore thisdifference.
Figure 9 illustrates the observed mass transfer coefficient parameters as a functionof the soil’s water content for the three different contaminant mixtures. Theparameters presented are the overall volumetric mass transfer coefficient at aNAPL content of 0.04 m3"m3 (i.e., m /2 o
l+ Kgamin) and the overall volumetricmass transfer coefficient at a NAPL content of 0 m3"m3 (i.e., Kgamin). Forcomparison purposes, the value for single AD cases were normalized to a NAPLcontent of 0.04 m3"m3 (actual experiment run at 0.17 m3"m3). These essentiallyrepresent the initial and final values for the overall volumetric mass transfercoefficient. As a first approximation there was excellent agreement for the threedifferent contaminant mixtures between the initial and final mass transfercoefficients over the range of water contents investigated. The overall trend trendis a slight decline in the magnitude of the initial mass transfer coefficient withincreasing soil water content and a nearly two orders of magnitude decline for thefinal mass transfer coefficient. The final mass transfer coefficient for the quaternaryair dry case is the only exception to these trends. Further work is necessary toexplore this difference.
It is valuable to compare the observed mass transfer coefficients to valuesreported in the literature even though differences in soils, soil packing, flowratesand contaminant mixtures may be substantial. Karan et al. (1994) reportedair/NAPL overall volumetric mass transfer coefficients of 252 to 432 h-1 for theremoval of n-octane from a silt clay soil and glass beads. It is encouraging thatthese values are of the same order as the initial mass transfer coefficient observedin this work. The range of Kgamin values are comparable to the values of air/watermass transfer coefficients for TCE removal from sand reported by Armstrong etal. (1994), 0.036 to 36 h-1 and by Cho and Jaffe (1990), 0.02 to 63 h-1.
The good agreement of the variable Kga model with the experimental data suggests that for theseexperimental conditions, the mass transfer resistance declined as a function of the NAPL content. Twopossible explanations for the decline in the overall mass transfer coefficient are the diminishing contact area

soil_overview_03.wpd Page 33 of 70
between the vapour and NAPL phases and the increasing path length from the interface between these twophases to the bulk airflow pathways. If the NAPL was present as a perfect sphere then the interfacial areawould follow a 2/3 power on the NAPL content. If the NAPL is present as a film around a sphericalparticle the power relationship would be expected to be lower than 2/3. If the NAPL is present in aperfectly cylindrical capillary tube then the path length would increase linearly with decreasing NAPLcontent. In the field the NAPL will prevail in the soil pores in a number of different spatial configurationsleading to a power dependency that is a weighting of all of the possible simplistic pictures. The success ofthe linear model should be interpreted as a clear case for inclusion of a mass transfer coefficient functionalityon the prevailing NAPL content. The success should not be interpreted as evidence that the correct poweris 1.0. A better fit may be achieved by making the power an additional parameter in the fitting exercise.
6.0 BIOREMEDIATION OF HYDROCARBONS
Diesel fuel contaminated soil is a major environmental concern. It is the second most frequently treatedcontaminant after benzene at USEPA superfund projects [Buswell, 1994]. A typical source is leakingunderground storage tanks at service stations [Atlas et al., 1995]. Diesel fuel is a complex mixture ofhydrocarbons consisting of approximately 30% alkanes, 45% cyclic alkanes and 24% aromatics[Frankenberger et al., 1989]. As a complex mixture, all aspects of the site cleanup process fromassessment to remediation become more difficult.
Bioremediation is an attractive remediation technique for diesel fuel and it can be accomplished as eitheran in situ and ex situ process. In situ treatment can include many different types of enhancements. Themost common include increasing oxygen availability and the addition of nutrients. Increasing oxygenavailability may be accomplished by air sparging (bioventing), the addition of hydrogen peroxide throughinjection wells or an infiltration gallery [Fiorenza et al., 1991; Ryan et al., 1991], tilling in a land farm styleoperation, or amending the soil with bulking agents such as straw, mulch, or wood chips. In a few cases,a site is enhanced through the addition of microbial strains that are specifically capable of degrading thecontaminant.
Ex situ or bioreactors, involve similar enhancements as in in situ but also include the excavation of the soiland transferring it to a reactor. The advantage of a reactor situation is that through mixing it becomes easierto uniformly distribute oxygen and nutrients and it is possible to run at elevated temperatures. Thus,increased degradation rates can be realized at the expense of greater capital and operating costs.
Selection of the appropriate technology and enhancement depends on solubility, volatility and sorptiveability of the contaminant, location and extent of the contamination, hydrogeology of the site and goal ofthe remediation project, i.e., source remediation or plume control [Fiorenza et al., 1991]. However,treatment effectiveness can be poor if an incorrect enhancement has been chosen. Thus, it is important tohave a good understanding of the bioremediation process and specific site characteristics in order toincrease the odds of success. To aid in understanding the process, biodegradability tests are conductedin the laboratory. One of the techniques available is respirometry [Steinhart, 1995].
Respirometry allows the measurement of hydrocarbon biodegradation rates through changes in O2 and CO2

soil_overview_03.wpd Page 34 of 70
levels via stoichiometry [Hickey, 1995]. This can be accomplished with a variety of techniques such aspressure changes in sealed bioreactors or the direct measurement of oxygen addition [Mahendraker andViraraghavan, 1995; Naziruddin et al., 1995]. Subsequent monitoring O2 and CO2 in the field allows forpossible timing of tilling events.
However, the literature has shown that diesel fuel is more persistent in the field than in the lab. Compoundsreadily degraded in the lab in a few weeks were still found in actual contaminated soil samples even aftera number of years [Steinhart, 1995]. Following successful lab trials, Cutright [1995] reported minimaldegradation in the field. Sturman et al. [1995] and Atlas [1995] indicate that these failures result from afailure to account for and understand the scale-dependant variables like mass transport limitations, spatialheterogeneity and competing microorganisms.
An additional challenge facing some northern sites [including northern Canada, Scandinavia and northernRussia] is low temperatures. Biodegradation is frequently temperature-limited at most times during the year[Kerry, 1993]. Additional research at low temperatures is needed, including whether nutrients arerequired [Sparrevik and Breedveld, 1997; Reynolds et al., 1997].
Zytner et al. [2000] completed field and laboratory studies to study the influence of temperature andoxygen on the bioremediation of diesel fuel contaminated soil. Field data was obtained from a landfarmlocated in Northern Ontario, while the laboratory experiments were conducted using bioreactors containingdiesel spiked soil and contaminated soil from the field site.
Table 12 contains the average TPHC concentrations (wet basis) measured in the field and thecorresponding standard deviation. Using these average TPHC concentrations, an overall TPHC mass lossof 21% was observed between the two sampling intervals for the various depths. The largest losses (58%)occurred in the top 10 cm, while for the lower two soil depths, losses were approximately 10%.

Table 12: Average TPHC Data Measured in Field on a Wet BasisVisit #1 - June 22-23, 1996
Segment No. a 0 to 10 cm Below Grade 10 to 20 cm Below Grade 20 to 30 cm Below Grade
Conc. [mg/kg] Std. Dev. Conc. [mg/kg] Std. Dev. Conc. [mg/kg] Std. Dev.
1 12300 3590 18200 3580 25300 8370
2 9840 2360 21500 840 22600 4040
3 10000 3790 30300 6850 29600 11400
4 8320 2420 15400 4500 17500 2970
5 13400 3220 20400 2960 23600 2200
6 12700 1810 18400 2770 18200 1440
7 13900 3250 14800 2080 18700 2340
8 12800 870 22500 4040 25400 3610
9 8750 1220 20400 3780 23000 5070
Avg for depth 11300 2500 20200 3490 22700 4600
Avg for Landfarm 18000
Visit #2 - August 4, 1996 Segment No b 0 to 10 cm Below Grade 10 to 20 cm Below Grade 20 to 30 cm Below Grade
Conc. [mg/kg] Std. Dev. Conc. [mg/kg] Std. Dev. Conc. [mg/kg] Std. Dev.
1 7320 2970 14200 8330 6920 5120
2 3350 810 16400 3380 25800 10800
3 3130 60 17200 2650 36000 2570
4 2060 470 21200 1830 13200 3600
5 10300 6860 18900 1520 25400 5620
6 6320 200 14200 1020 13400 9190
7 5070 660 17800 2900 18000 5010
8 2450 260 11100 4370 17500 7210
9 3730 1240 23200 4890 29000 4820
Avg for depth 4850 1500 17100 3430 20600 5990
Avg for Landfarm 14200
Decay Rates (1/d)Avg for depth 0.022 0.009 0.0038 0.007 0.0043 0.01
Avg for Landfarm 0.005
a - five samples for each segment; b - three samples for each segment

soil_overview_03.wpd Page 36 of 70
(25)
Table 12 also gives the average first order rate constants as a function of depth based on the observedlosses of TPHC. First order rate constants were used as they best describe field degradation [Kampbelland Wilson, 1991 and Naziruddin et al., 1995]. For all depths, the average TPHC first order rateconstants ranged from 0.022 to 0.0043 d-1. Similar rate constants were obtained for the individualcompounds. Finally, the overall rate constant was calculated as 0.005 d-1, which indicates that the overallrate was impacted by the lower losses at the 10 to 20 cm and 20 to 30 cm depths.
The observed contaminant loss is due to a combination of abiotic and biotic mechanisms. Abioticmechanisms are volatilization and leaching. Volatilization was measured, in a related project, atapproximately 0.5% of the original contamination [Fitzgerald, 1997]. Modelling of volatilization using amodification of the Behaviour Assessment Model [Jury et al., 1984] projected a 2% loss. This lowvolatilization loss is consistent with a full scale bioventing operation, in which over 90% of the dieselremoval could be attributed to biodegradation, while only 10% was due to volatilization [Downey et al.,1995].
Laboratory degradation rates were quantified based on changes in the total petroleum hydrocarbonsconcentrations and some individual components, and by monitoring oxygen consumption and carbondioxide evolution. The first order rate constants were obtained and seen to be a strong function of oxygenlevels and operating temperature. Modest degradation continued at 2°C.
Using the degradation data, correlation was developed based on a combination of a Monod typeexpression to account for oxygen dependencies and a modified form of van’tHoff- Arrhenius relationship[Tchobanoglous and Schroeder, 1987] to account for the temperature dependencies.
where, k = first order rate constant, 1/dO2 = oxygen content in soil, v%T = desired temperature, °C
Figure 10 gives a comparison of the field results with the laboratory results and shows for the upper level,warm conditions, the TPHC losses are in reasonable agreement. Essentially, the lab first order rateconstants at high oxygen content and 25°C are within a factor of 1.5 of the field degradation constants forthe surface soil. At the lower depths, comparison of rates was within a factor of 10. The slowerdegradation rate was due to the lower oxygen levels measured in the deeper soils. As such, more frequentor possibly more effective tilling is required to bring the contaminants closer to the surface and to maintainporosity and thus oxygen diffusion. Alternatively, additional bulking agents may be of value or spreadingof the soil over a larger area to have less depth.
Review of the literature revealed similar studies. Reynolds et al. [1997] reported two diesel degradationrates for a landfarm in Alaska. The site was monitored for 1 year, in which it was frozen from late

soil_overview_03.wpd Page 37 of 70
FIELD k1*
* temps from 15 to 28 C
LAB k1*
* temps at 25 C
10
High O2
Low O2
0 to 10 cm
10 to 20 cm
20 to 30 cm
(0.022)
(0.0038)
(0.0144)
(0.0084)
-3
10-1
(0.0043)
(0.0112)
Figure 10: Field and Laboratory Rate Constants (1/d)
September to late May; 0.003 d-1 withoutnutrients and 0.005 d-1 with nutrients.Sparrevik and Breedveld [1997] alsostudied diesel in the field for 1 year inNorway and reported a degradation rateof 0.004 d-1 (average temperature 8°C).For comparison on lab studies,Elektorowicz [1994] reported a dieseldegradation rate of 0.03 d-1 [roomtemperature], while Margesin andSchinner [1997] reported degradationrates varying from 0.019 d-1 to 0.027 d-1
at 25°C. All these values comparefavourably, suggesting that thebioreactor/respirometer used in this studyis capable of providing useful data..However, Geerdink et al. [1996] measured first order rate constants in the lab [at 30 °C] of approximately13 d-1 for fresh diesel and for n-hexadecane. This range in degradation rate reinforces the importance ofaccurately simulating biodegradation rates in the lab as a function of site conditions, including soil type, ageof contamination, nutrient addition, temperature and availability of oxygen. If not, incorrect decisions maybe made in the field.
6.1 Nutrient Addition
Diesel fuel is a major soil contamination problem. It is estimated that over 250,000 underground storagetanks are leaking diesel fuel in the United States alone (Buswell, 1994; Atlas et al., 1995). Researchershave found that bioremediation is an effective method at removing diesel fuel from contaminated soil (Bakeret al., 1993; Downey et al., 1995; Frankenberger et al., 1989; Shen and Bartha, 1994; Walworth andReynolds, 1995; Widrig and Manning, 1995).
Bioremediation is a process whereby micro-organisms use the organic substances in soil (including dieselfuel) as a carbon and energy source. The organisms require an electron acceptor such as oxygen (aerobicenvironment), to produce carbon dioxide and water while degrading the contaminants. The growth of newcells may also occur, with the intake of nutrients such as nitrogen, phosphorous, potassium, and essentialmicro-nutrients.
Many soils contaminated with petroleum hydrocarbons are nutrient limited. This phenomenon is causedby excessive carbon loading from the fuel without any significant nutrient inputs. Nitrogen and phosphorusare often identified as the limiting factors for biodegradation (Walworth & Reynolds, 1995). Nitrogen isof particular concern since it is mobile in the environment. Soils can lose nitrogen in the form of nitrateleaching, ammonia volatilization, and denitrification to gaseous species including N2O and N2 (Hamid &Mahler, 1994; Ismailov, 1983; Whitehead & Raistrick, 1990). In fact, Xu et al. (1995) found that soilscontaminated with petroleum fuels lose nitrogen at faster rates than uncontaminated soils, primarily due todenitrification.

soil_overview_03.wpd Page 38 of 70
Nitrogen may be added in a variety of forms including nitrate and ammonium compounds, urea, and ureaoligomers (controlled release fertilizers). The nitrate and ammonium ions are the readily available forms ofnitrogen responsible for microbial nutrition (Gottscalk,1985), whereas urea and urea oligomers must beinitially degraded to release ammonium ions.
The various forms of nitrogen have unique advantages and disadvantages in the bioremediation field.Nitrate, ammonia and urea have been used extensively in the agricultural industry for years and thebehaviour of these compounds is well documented. All have relatively high water solubilities and areavailable to the microbial consortium in soil (Walworth & Reynolds, 1995). Urea oligomers have beenused in the horticultural community (i.e. turf grass industry) for about a decade, but information regardingtheir behaviour in soil is limited. Some of the different forms of nitrogen that have been used by researchersfor bioremediation are listed in the Table 13.
Table 13: Various Nitrogen Sources Listed in the Bioremediation Literature
Nitrogen Source Contaminant Degraded ReferenceNH4Cl Fuel Oil Bauer et al., 1994
Diesel Fuel Elektorwicz, 1994Widrig and Manning, 1995
NH4NO3 Oil Sludge Dibble and Bartha, 1979Diesel Fuel Frankenberger et al., 1989
Huessmann, 1995Walworth and Reynolds, 1995
KNO3 Phenol Hoyle et al., 1995Gasoline Kampbell and Wilson, 1991
NaNO3 Petroleum Mix Jain et al., 1992Urea Diesel Fuel Shen and Bartha, 1994
Wang et al., 1990Urea Oligomers Fuel Oil Flathman et al., 1994
Currently, there is limited standardized information that allows for comparison of the various nitrogensources at different levels for effective bioremediation. Consequently, Brook et al.[2000] conductedlaboratory studies using respirometers containing field contaminated soil that were amended with differentsources and levels of nitrogen. The contaminated soil was monitored for oxygen consumption, carbondioxide generation and depletion of total petroleum hydrocarbon (TPHC) levels.
The respiration data for all of the experiments was converted to equivalent TPHC degradation assumingn-hexane as a typical compound in the mixture of total petroleum hydrocarbons. Many authors believeTPHC degradation is best described as a first order reaction and as such the raw TPHC and convertedrespiration data were used to calculate first order rate constants (Hickey, 1995; Kelly and Cerniglisa,

soil_overview_03.wpd Page 39 of 70
1995). The first order rate constants are presented in Table 14 for all nitrogen sources and carbon tonitrogen ratios.
Table 14: TPHC, O2 and CO2 First Order Rate Constants (x 10-4 1/d)
C:N NitrogenSource^
TPHC O2 CO2
NN 26 2.6 1.90.83403 U 250 13 34
UO 72 8.5 25AN 39 0.65 11KN 45 1 9.1AS 320 20 14
40:1 U 110 13 16UO 92 8.9 19AN 120 4.1 19KN 57 1.8 1.6AS 190 9.9 19
^ NN– no nitrogen; U–urea; UO– urea oligomers;AN– ammonium nitrate; KN– potassium nitrate; AS– ammonium sulfate
The degradation rate constants measured by loss of TPHC were consistently higher than the degradationrate constants determined based on oxygen consumption and carbon dioxide evolution data. The carbondioxide rates ranged from a factor of 3 to 30 times lower than the rates measured by TPHC loss. The ratesmeasured by oxygen consumption ranged from a factor of 8 to 60 times lower than the rates measured byTPHC loss.
The rate constants measured by TPHC loss, oxygen consumption and carbon dioxide generation will agree,provided that the hydrocarbons are all completely mineralized through the degradation process. In practicalterms for a fuel containing largely carbon and hydrogen atoms only, mineralized means that all of the carbonis released as carbon dioxide and all of the hydrogen as water. Reasons for discrepancy include incompletemineralization, denitrification processes and soil carbonate interactions.
Incomplete mineralization of the diesel fuel generates hydrocarbons that are partially stabilized and thatgenerally become more polar. Once the sample extraction process can no longer efficiently extract thesecompounds they become considered completely degraded, even though they have not consumed their fullcomplement of oxygen nor released all of their carbon as carbon dioxide. The result is higher observeddegradation rates based on TPHC loss than observed based on respiration rates. The TPHC degradationrates may be considered to overestimate the cleaning rates as some of the non-extractable compounds maystill represent an incremental environmental risk. The respiration based degradation rates underestimatethe process as some of the non-extractable compounds have become stable (or nearly so) constituents of

soil_overview_03.wpd Page 40 of 70
0
0.01
0.02
0.03
0.04
TP
HC
Dec
ay R
ate
(1/d
)
NN U UO AN KN ASNitrogen Treatment
C:N=20:1 C:N=40:1
Figure 11: TPHC Decay rates vs Nitrogen Treatment
the soil’s ‘natural’ organic matter.
One of the possible interferences with the measurement of oxygen consumption as measured by thepressure sensors is denitrification. Any reactors that contained a significant quantity of nitrate may besusceptible to denitrification, such that the nitrates are converted to gaseous nitrogen compounds, such asN2, N2O and NO2. The use of nitrate as an electron acceptor would decrease the quantity of diatomicoxygen utilized by the microbes during degradation. Furthermore, any gaseous nitrogen formed woulddecrease the calculated oxygen consumption, by increasing the pressure in the reactors. However, if allof the nitrogen in the fertilizer used in the 20:1 applications was released as nitrogen gas, the result wouldbe to decrease the observed oxygen based rate constants by only 5 x10⁻⁴ d-1. Measurements of nitrogencontent of the soil clearly show that nitrogen losses were modest and thus denitrification could not havebeen a significant factor in influencing the oxygen measurements.
In contrast, the low carbon dioxide production may have resulted from reactions between the carbondioxide and soil carbonates found in the alkaline soil (Baker et al., 1993; Brady, 1990; Hickey, 1995).The carbon dioxide generated may react with the carbonates in the soil and consequently will not beabsorbed in the potassium hydroxide solution. This would result in the pH analysis of the KOH in the testtubes underestimating the actual carbon dioxide evolution. This process is less likely to be responsible forthe difference in the rate constants since the pH of the soil is not extremely high (Hickey, 1995).
Review of the TPHC rate constants showed that all treatments resulted in increased degradation above thecontrol experiments with no nitrogenaddition. As seen in Figure 11, thedegradation rate constants weredependent on both the source of nitrogenand the C:N ratio. At the 20:1 carbon tonitrogen ratio, the nitrogen supplementenhanced degradation rates by between afactor of 1.5 (ammonium nitrate) to 12(ammonium sulphate) times relative to thecontrol (no nitrogen). While urea,ammonium and nitrate have all beenreported as being available to themicrobial consortium in soil; ammonium isthe preferred source of nitrogen from anenergy standpoint. This is due to the factthat it is already in a reduced form, whereas nitrate must be first reduced prior to assimilation into amino acids (Walworth & Reynolds, 1995).
For three of the nitrogen supplements decreasing the nitrogen supply (a C:N ratio of 40:1) increased thedegradation rates. This is suggestive of an optimal supply of nitrogen with the optimal level dependent onthe nitrogen source.
Figure 11 also illustrates the dependence of the TPHC decay rate constant on the source of nitrogen and

soil_overview_03.wpd Page 41 of 70
shows the impact the average total nitrogen level has on decay. For each level of total nitrogen there is anindication of the split between the ammonia and nitrate forms as percentage of total nitrogen that is NH3
(see Table 4 for the value). For the 40:1 carbon-to-nitrogen ratio, it is apparent that the degradation rateconstant increases only when the average ammonia levels increases. Nitrogen treatments that have lowerlevels of ammonia (AN and KN) do not have the same degree of rate enhancement. The same trends areapparent for the 20:1 carbon-to-nitrogen ratio. Wren et al. (1994), in the study of crude oil, noted thatdegradation starts faster when in the presence of ammonia as compared to nitrate, provided that the soilis alkaline. The soil used in this study would be considered alkaline as the pH was 7.9.
Dibble and Barth (1979) and Huessman (1995) raise the question regarding microbial inhibition to nitrates.To further interpret the results the data was analysed using SYSTAT (1992) to explore the best fit of thedegradation rate constant as a function of nitrate, ammonia and total nitrogen.
First all the k values as a function of NH3 and NO3 were analysed for both carbon to nitrogen ratios. Theregression resulted in:
(26)[ ] [ ]k NH NO r= − + =0032 0003 0 004 0 803 32. . . .
wherek = TPHC decay rate (1/d)NH3 = ammonia concentration in soil (mg/g)NO3 = nitrate concentration in soil (mg/g)
Even though small, the coefficient for the nitrate term is negative, supporting the hypothesis of nitrateinhibition. Figure 2 was then plotted to see how well the measured and predicted k values compare, withthe straight line being the desired fit. While the comparisons appear favourable, it was believed that thetotal nitrogen values high in nitrate were impacting the regression The r2 value improved and the coefficientfor the nitrate value increased, with minimal change to the other coefficients. While the trend is encouraging,further research is required to confirm the occurrence of nitrate inhibition and evaluate the concentrationat which it starts to dominate.
The completed study on weathered diesel fuel in silt-clay soil has shown that nitrogen is an importantparameter in biodegradation reactions, since nitrogen addition increased the biodegradation rates in allcases. Furthermore, ammonia-nitrogen was seen to be responsible for the highest degradation rates, withammonium sulfate and urea treatments showing the highest decay rates. The analysis also suggests theoccurrence of nitrate inhibition, but further research is required determine the seriousness of the inhibitionand the concentration at which it occurs.
6.2 Use of Anhydrous Ammonia
Bioventing was first developed in the 1970’s to address some of the problems associated with SVE(Leeson and Hinchee, 1997). Like SVE, it is an in situ remediation technology that uses air extraction toremove contamination. However, where the intent of SVE is to volatilize as much of the contaminant aspossible, bioventing uses low or intermittent air flow rates to produce oxygen-rich conditions in the vadose
soil_overview_03.wpd Page 42 of 70
zone (Hickey, 1995) and stimulate indigenous microbial degradation of the hydrocarbon contaminant.Bioventing has several advantages over SVE including reduced operating costs, elimination of the need forpost-treatment of the air stream, and degradation of residual contamination left by SVE so that clean upcriteria can be met. In addition, bioventing is a true remediation technology in that the contaminant isdegraded rather than removed.
There are several environmental parameters that influence bioventing performance. These include soilmoisture content, pH, nutrient content and availability, oxygen content, temperature, toxicity andbioavailability of the contaminant, and physical characteristics of the soil matrix. Although the design ofbioventing systems is necessarily site-specific to some extent, researchers have reached a general consensuson the optimum values of some of the important environmental conditions. For example, there is generalagreement in the literature that many bioventing sites are nutrient limited, especially in terms of nitrogen andphosphorous. Reported carbon-nitrogen-phosphorous (CNP) ratios presented in many papers vary widely,from 100:10:1 to 1000:10:1. However, a major question that exists is how to deliver the appropriateamount of nutrient to produce optimum biodegradation conditions in the field.
Several nitrogen sources such as ammonium nitrate, ammonium sulphate, potassium nitrate and ureaoligimers have been investigated. Ammonia based nitrogen has a shorter lag time and higher degradationrate because the microorganisms require less energy for microbial metabolism (Walworth and Reynolds,1995; Jorio, 2000). Unfortunately, ammonium salts cause the soil pH to decrease in poorly bufferedsystems (Wrenn et al., 1994; Jackson and Perdue, 1999; Foght et al., 1999). The benefit of nitratecompounds is no pH change, while more nitrate is required to achieve the same degradation with a longerlag time (Wrenn et al., 1994). However, the addition of excess nitrate-nitrogen can be inhibitory in somecases (Brook et al., 2001). All these sources of nitrogen can be solubilised for subsurface injection.Unfortunately, practice has shown that the application is non-uniform, especially when the contaminatedsite is kept operational. One of the options for providing the required nitrogen is the use of anhydrousammonia.
Anhydrous ammonia (AA) is popular in agricultural applications and can be added in either gaseous orliquid form (Cronce and Cagnetta, 1996). Of the two forms, gaseous has the greatest potential as it couldbe applied through an existing SVE/bioventing system and should easily disperse through the soil. Thenupon contact with the water, the AA dissolves and becomes ammonium as shown in Equation 1, the idealform for microorganisms (Shewfelt and Zytner, 2001) .
NH3 + H2O <------> NH4+ + OH-
The disadvantages of using AA are the potential rise in soil pH as the reaction causes an initial alkalineenvironment in the ammonia retention zone, where the pH of the soil can temporarily rise above 9 at thepoint of highest concentration. Since ammonia has a pka value of 9.3 (McVickar et al, 1966), at a pH of6 the equilibrium of ammonia (NH3) to ammonium (NH4
+) is 0.1% to 99.9% respectively, while at a pHof 9 the equilibrium is 50% to 50% (Whitman, 2002).
One additional concern is the safety of using AA in terms of handling because of potential dangersassociated with the gaseous form (MSDS, 2001). However, AA is the second highest form of nitrogen

soil_overview_03.wpd Page 43 of 70
P l u g V a l v e
P r e s s u r e T r a n s d u c e r
C o r d t o D a t a l o g g e r
T e f l o n S t o p p e r
1 L G l a s s B o t t l e
A e r a t i o n T u b e
K O H S o l u t i o n
C o n t a m i n a t e d S o i l
Figure 12: Schematic of Respirometer
fertilizer sold in Canada as 635,388 metric tonnes of AA were sold in Canada in 2000 (Agriculture andAgri-food Canada, 2001). Thus, proper safety procedures are well established and widely available(Johnston et al, 2002) and should not hinder the use of AA.
Upon receiving the soil, it was sieved to remove larger soil particles, then mixed to ensure homogeneity.The water content of the soil was adjusted to 15% by adding the appropriate amount of ultra-pure water.The nitrogen content of the soil was then adjusted by adding the appropriate amount of NH4Cl or AA toattain a C:N ratio of 10:1. This level was based on the previous work of Shewfelt and Zytner (2001),where it was determined that ammonium worked best at a 10:1 ratio for a different soil.
To add the NH4Cl to the soil, calculations were performed to determine the amount of NH4Cl powderrequired to obtain a C:N ratio of 10:1. Once calculated, the powder was dissolved in the water to beadded to bring the soil water content to 15%. Calculation of the required amount of AA assumed that itwould all be converted to NH4
+ once in the soil based on the work of Cronce and Cagnetta (1996) onTCE contaminated soil. Addition of the AA to the soil was accomplished through extraction of AA froma Tedlar bag using a 50mL gas-tight syringe, and subsequent injection beneath the soil layer. The soil wasthen gently mixed to distribute the AA.
After the addition of the nitrogen, the soil was divided into approximately 150 g samples for use in therespirometers. At each stage of sample preparation, two 30 g samples of soil were removed to provideinformation on the initial conditions. The samples were sealed and stored at 4oC if intended for microbialanalysis, and at –15oC if intended for TPH analysis.
Biodegradation rates for the conditions tested were measured in respirometers originally designed anddeveloped by Law (1996). The respirometers (Figure 12) function by measuring oxygen consumed andcarbon dioxide produced by the aerobic respiration of the indigenous soil microbial population. Therespirometers consist of Teflon-sealed 1L glass jars equipped with pressure transducers, which tookreadings every 30 minutes that were recorded via a data-logging program. These readings were laterconverted to an amount of oxygen remaining in the headspace of the jar. All respirometers were placedin an incubator set at 25oC.
The carbon dioxide evolved during microbial metabolismof the gasoline is trapped in a vial of KOH solution.Oxygen consumption as measured by the calibratedtransducers, which measure the decrease in pressureinside the respirometer over a specified length of time.Bioventing conditions were maintained through an aerationtube, which could be opened to the atmosphere by a plugvalve once oxygen concentration inside the respirometerdropped below 18%.
In total, 27 respirometers were available to run simultaneously. Each of the completed experimentsemployed 11 bioreactors. Ten of these reactors contained soil samples with identical treatments and wereincubated in duplicate for 2, 5, 10, 15 or 30 d. One reactor contained no soil, and acted as a

soil_overview_03.wpd Page 44 of 70
thermobarometer to account for fluctuations of internal pressure due to atmospheric changes.
Normally the amount of carbon dioxide evolved through the degradation process would be determined bymeasuring the pH shift of the KOH solution (Shewfelt and Zytner, 2001). Similarly, the amount of oxygenconsumed during degradation could be related to TPH degradation through the stoichiometric reaction ofa representative hydrocarbon. However, for this study, the intent was only to measure the TPH decay andcompare the results of AA and NH4Cl. Accordingly, the only purpose of the KOH solution was to ensurethe proper functioning of the respirometers by preventing the build-up of CO2. The extent of TPH degradation was determined by measuring the difference between the initial and finalTPH content of the soil in each reactor. Soil samples were extracted using methylene chloride, and the TPHcontent was determined using a gas chromatograph equipped with a flame ionization detector (GC-FID).The GC-FID was calibrated by constructing a five-point calibration curve using known concentrations ofcommercial gasoline (aged for 24 h) in methylene chloride.
In order to observe any acidification of the soil, the soil pH was measured before and after each incubationas well. Soil pH was measured in a 1:1 slurry of soil and ultra-pure water using a pH meter.
The microbial population of the soil samples before and after incubation was measured by plating serialdilutions of sodium pyrophosphate-extracted soil. R2A growth medium was used for heterotrophic platecounts, and Bushnell-Haas (BH) media was used for counts of hydrocarbon degrading bacteria. The BHplates were incubated in the presence of commercial gasoline as the sole carbon source. No attempt wasmade to isolate or characterize the bacteria; only population data was obtained for total heterotrophic andpetroleum hydrocarbon degraders.
The use of a mathematical model confirmed that AA could easily be injected into the soil through thebioventing well. The results indicated that sparge times of approximately 30 minutes at 2 atm (absolute)were required to attain an AA concentration of 0.15 kg/m3 at the outer edge of the radius of influence (7.5m), having a pressure of 1 atm. The radius of influence for the subsurface condition being simulated wasbased on field measurements for SVE. Increasing the inlet pressure increased the resulting concentration,but safety concerns and ammonium needs were exceeded. Consequently, the choices of inlet concentrationshould be based on the contaminant concentration in the system, while the pressure should be based onthe available equipment and/or time constraints.
The degradation component of the model worked very well. The time to consume the AA in the systemdepends on the ammonia and contaminant concentrations in the system. Based on an assumed contaminantlevel of 1500 mgcontaminant/kgsoil and an AA application of 0.15 kg/m3, the levels of AA in the system dropto approximately 80% of the starting value in 30 days, indicating a reasonable residual for effectivedegradation.
The NH4Cl experiment showed very little decrease in pH with time, with the biggest pH drop being to 7.7.Similar trends were observed by Shewfelt and Zytner (2001) who studied the effectiveness of ammonium-nitrogen vs. nitrate-nitrogen, and combinations of the two. All the values are within the pH rangeconsidered ideal for bacterial growth (Huesmann, 1994). However, the AA experiment developed some

soil_overview_03.wpd Page 45 of 70
acidification, with the pH getting as high as 9.2, which is not an uncommon result when dealing with theapplication of this particular compound (Whitman, 2002).
The first-order biodegradation rates calculated from the TPH analysis, giving the following values:< NH4Cl: 0.028 d-1
< AA: 0.023 d-1
< Shewfelt and Zytner (2001) for NH4Cl: 0.081 d-1
With both treatments having identical application rates, it can be seen that AA has potential. Comparisonof the NH4Cl results with the earlier work of Shewfelt and Zytner (2001). Comparison of the values showsthat the current study had a lower degradation rate. However, it must be noted that the two soils were fromseparate sites with dissimilar contamination levels; current study approximately half the contamination. Itis also highly likely that the two soils have differing ages of contamination. Soil that has been contaminatedfor a longer period of time makes bioremediation more difficult, thus affecting the overall degradation rate.
Microbial tests showed that there was an increase in microbial activity of the total heterotrophs (R2Agrowth media) and hydrocarbon degraders (BH growth media) for the NH4Cl, with the population goingto 105 to 106 cfu/g. Similar growth was observed by Shewfelt and Zytner (2001). Similar tests done withthe AA treatments showed a reduction of microbial activity, with about 104 cfu/g measured. Even thoughless microbial activity, the AA had reasonable degradation.
For this test, the amount of AA added was controlled. However, analytical results of the amended soilshowed that approximately half the amount of the desired ammonium was present. Review of theapplication procedure suggests that sufficient AA gas escaped from the treated soil, reducing the amountof ammonium in the soil. Future tests will need to adjust for this in order to provide satisfactory nutrientconditions in the respirometers. However, it must be noted that the AA test attained similar degradationresults when compared with the current NH4Cl, with only half as much ammonium present in the soil. Thissuggests that AA is a promising candidate for the use in bioventing.
The modelling results showed that AA could easily be injected into the soil at a reasonable pressure of 2atm to supply nitrogen to the indigenous microorganisms. The simulations also showed that a sparge timeof 30 minutes would suffice and provide a reasonable AA concentration of 0.15 kg/m3 in the soil. Usinga conservative contamination level, the simulations showed that the AA would decrease to 80% of the initialvalue after 30 d.
Laboratory results demonstrate that AA is successful in acting as a primary nitrogen source, with adegradation rate equal to that of NH4Cl, even with half as much ammonium. Two challenges seem to bethe level of acidification that develops and the amount of AA that needs to be added to the soil to obtainthe desired concentration. The loss of AA from the soil, which is associated with easy migration needs tobe overcome for enhanced success in the future.
soil_overview_03.wpd Page 46 of 70
6.3 Use of Biosurfactants
Biosurfactants have the potential to remove hydrocarbons from soil. Their application increases solubilityand reduces surface tension to permit their washing from soil. Thsy also biodegrade afterwards leaving notraces. Scheibenbogen et al. [1994] demonstrated that rhamnolipid biosurfactants, produced byPseudomonas aeruginosa [UG2] have the ability release hydrocarbons from soil, making pump and treata possible option again. Both aliphatic and aromatic hydrocarbons were effectively removed from soilcolumns without clogging, a typical problem for chemical surfactants.
7.0 SUPERCRITICAL FLUID EXTRACTION
Supercritical Fluid Extraction (SFE) is one of a number of innovative soil remediation technologies beingdeveloped. SFE is an extraction process which utilizes the solubilizing power and the rapid mass transfercharacteristics of supercritical fluids (SCFs) to remove contaminants. McHugh and Krukonis [1994]provide an excellent introduction to the field of supercritical fluids.
The supercritical fluid chosen is almost always carbon dioxide as supercritical carbon dioxide (SCCO2)requires modest operating conditions (Tc = 31°C; Pc = 7.4 MPa) and it can easily be separated from thesolute by depressurization [Laitinen et al., 1994]. Additionally, carbon dioxide is cheap, available, and hasminimal environmental impact.
On an analytical scale, various contaminants have been removed from soil using SFE, including PCBs,PAHs, DDT, phenolics and metals [Brady et al., 1987; Andrews et al., 1990; Akgerman et al., 1992].With respect to soil remediation, Groves et al. [1985] indicated that the focus of research has been onfactors that control the rate of extraction on a small scale. Laitinen et al.[1994] recently reviewed the latestadvancements on site remediation. Information is still lacking on thermodynamic and kinetic data.
The distribution coefficient is a fundamental parameter of interest with regard to the development of theSFE process as it indicates the feasibility of the extraction process [Roop et al., 1989]. It also can be usedto estimate the amount of CO2 required. The literature contains limited information on SCCO2-soildistribution coefficients [Andrews et al., 1990; Erkey et al., 1992; Gray et al., 1995].
Mass transfer coefficients between the soil and bulk supercritical fluid depend on both an internal resistanceand an external film resistance. The internal resistance is often characterized as an effective diffusioncoefficient through a porous structure [Wu and Gschwend, 1986]. The external film resistance isdependent on Reynold’s and Schmidt’s numbers as in most solvent extraction systems but also dependson the Grashof number owing to a greater importance of natural convection [Debenedetti et al., 1986].Measurements of mass transfer coefficients for soil - supercritical fluid systems are limited. Madras et al.[1994] and Montero et al. [1995] have fitted breakthrough curves for extraction from a dry soil.
Water content of the soil is one factor which has not yet been studied in any detail. Low et al. [1994]found little impact as a result of water contents up to 10% by weight on SFE of diesel from loam and siltsoils. Champagne and Bienkowski [1995] found no statistical differences in the equilibrium distribution with

soil_overview_03.wpd Page 47 of 70
soils up to 10% by weight water content. However, Akgerman and Yeo [1993] were only able to recover11% of the naphthalene from a soil slurry. Water is believed to hinder extraction of non-polar compoundsby acting as a barrier to carbon dioxide penetration [Camel et al., 1993].
Soil at a contaminated site may have a water content that is nearly dry through to 40% by mass. Dryingsoil in a laboratory setting may be viable but drying tonnes of soil is unlikely to be practical. In addition,a soil washing operation may be one of the first units in an overall treatment process and this will lead towater contents well in excess of 50%. Therefore, the influence of water on the supercritical fluid extractionof soil needs to be addressed.
Smyth et al., (1999)determined the distribution coefficient, Kcs (gsoil/gCO2), for Delhi Loamy Sand fordifferent water content and mixing conditions. The results are summarized in Table 15. All calculationswere done on a mass basis to avoid any discrepancies that may arise due the variability in the volume ofCO2 as a result of changes in temperature and pressure.
Static periods were included in six of the twelve experiments. For the water contents of 10% and less, theconcentration in the exhaust carbon dioxide was the same following the static period as before the staticperiod, indicating that the system was operating at equilibrium between the soil and the carbon dioxide atthe point of initiating the static period. Therefore, the distribution coefficients provided, in Table 14, areequilibrium descriptors of the system for water contents of 10% and less.
The average equilibrium distribution coefficient for water contents between 0% and 10% was 0.92 (±0.31)g/g. This compares favourably with the value of 1.7 (±0.7) g/g for the same soil, air dry, measured at 35°Cand 10.7 MPa by Gray et al.. The difference in the two observed partition coefficients is largely explainedby the difference in solubility at the two different supercritical conditions (0.014 mol/mol at 35°C/10.7MPavs 0.0096 at 42°C/10MPa ).

soil_overview_03.wpd Page 48 of 70
Table 15: Distribution and Mass Transfer Results
WaterContent
(%)
ExperimentLabel
Distribution Coefficient (g/g) Mass Transfer Coefficient(kov a) x 109 m3 s-1 g-1
dsMaximum Average
0 0/M/C 1.5 10.5 1A/M/C 1.7 1
1B/M/S 0.8 0.59 1.43 3/M/C 1 0.815 5A/M/C 1.5 1.1
5B/M/S 1 0.68 1.35C/NM/S 1.6 1.6 2.15D/NM/S 2.1 1.2 1.8
10 10A/NM/C 0.65 0.5310B/NM/S 1.3 0.73 1.2
20 20A/NM/C 0.64 _20B/NM/S 0.15 0.09 0.0073
M - mixed; NM - nonmixed; C - continuous; S - static period
The equilibrium distribution coefficient for bone dry soil (0/M/C) is the same as the other low water contentvalues. This is unexpected as it is recognized that sorption to bone dry soil increases due to the availabilityof mineral sites [Chiou and Shoup, 1985]. The oven dried soil likely absorbed some moisture during thenecessary handling to contaminate the soil and transfer it to the extraction vessel. In a test, the oven driedsoil increased to a water content of 0.11% when exposed to ambient air for 43 minutes. Since the handlingof 0/M/C soil was less than 43 minutes, the partition coefficient is independent of water content over thewater content range of 0.11% to 10%.
The observed distribution coefficients for water contents of 20% are lower than the Kcs values for 10%water or less. The reported distribution coefficients have included the unknown naphthalene with thecarbon dioxide samples. Although this has been done for consistency, it is likely somewhat less valid forthe 20% water content situation. The efficiency of the carbon dioxide sampling was running at around 60%during the lower water content cases. To explain the unknown naphthalene the carbon dioxide samplingefficiency would have to have dropped to about 40% for run 20B and to about 0.2% for run 20A. Inaddition, with the higher concentrations in the residual soil it is reasonable that modest errors in soil samplingcould explain a substantial portion of the unknown naphthalene. Thus, the distribution coefficients reportedin Table 5 for the 20% case are likely overestimates.
The mass transfer of the contaminant from the soil to the supercritical fluid is crucial to the development ofSFE as a full scale process. The effect of water on mass transfer coefficients has not been quantified.Therefore, an attempt was made to determine values for the mass transfer coefficients for water contents

soil_overview_03.wpd Page 49 of 70
(27)
from air dried to 20%.
Overall mass transfer coefficients were calculated for each of the experimental runs involving a static period.Table 15 summarizes the values determined for each experiment with the mass transfer coefficient definedbased on:
whereN = mass transfer rate (gN/s),Mds = mass of dry soil (gds),Ds = soil density (gds/m3),Cs = naphthalene soil concentration (gN/gds),CCO2 = naphthalene concentration in SCCO2 (gN/gCO2), andkov a = overall mass transfer coefficient (m3@s-1@g-1
ds).
Equation 27 is consistent with the conventional form of a mass transfer equation but has been written toexplicit identify that all of the parameters are to be used on a mass basis rather than the conventional volumebasis. A mass basis is preferred in this application for three reasons: one, the amount of soil in a systemis usually measured by mass rather than by volume; two, the area for transfer likely scales with the massof soil in the system rather than the volume of the system particularly when the relevant domain extends allthe way to soil slurries; and three, for supercritical fluids specifying the mass of the fluid is open to lessambiguity than specifying the volume of the fluid.
The resulting overall mass transfer coefficients for the low water content cases averaged 1.6 x10⁻⁹ m3 s-1
g-1ds. For the 20% water content case the value is 7.3 x10⁻¹² m3 s-1 g-1
ds. This decrease by at least a factorof 200 as the water content increases from 10% to 20% is believed that this lower value is largely due towater bridging between particles of a packed bed of soil. These results indicate that the soil tested allowsfor easy extraction of contaminants when the soil water content is below 10%.
LaPlante et al. (2000) complete SFE work with a soil slurry. Experiments were operated two modes; no-mix during dynamic flow and mixing during static periods. The no mix operating mode achieved equilibriumfor water contents from 0 to 10 wt%. Mixing during static periods achieved equilibrium for water contentsfrom 15 to 50 wt%, while continuous mixing achieved equilibrium for water contents from 50 to 200 wt%.
The average equilibrium distribution coefficient obtained for soil water contents up to 10% dry mass basiswas 2.4 gs/gCO2 (± 43 %). These values were all measured using the no mixing mode of operation. Thevariability is fairly large and is due to a combination of variability between the small batches of soil used,the experimental noise within a run and the variability in supercritical conditions between experiments. Thisvalue is in excellent agreement with the values reported in the literature for similar extraction conditions.Smyth (1996) reported distribution coefficients of 0.81 to 2.1 gs/gCO2 for the extraction of naphthalene fromDelhi loamy sand of up to 10% water content. Extracting naphthalene from a similar soil matrix, Gray etal. (1995) reported equilibrium distribution coefficients ranging from 1.7 to 3.9 gs/gCO2. Using a silt/clay

soil_overview_03.wpd Page 50 of 70
Figure 13: Mass Transfer Coefficients -No Mix
soil with a moisture content of 17.2%, Montero et al. (1996) reported an equilibrium distribution coefficientof 1.3 gs/gCO2.
The average equilibrium distribution coefficient for the water contents between 15% and 50%, measuredusing mixing during the static periods, was 3.9 gs/gCO2 (±29%). This value is higher than that observed forthe lower water content range (0-10%) and there may be evidence of a weak trend with water contentwithin the 15 to 50% range. However, given the variability observed it is difficult to conclude whether thedifference is real.
Theoretically the equilibrium distribution coefficient will be affected by the soil’s water content as a resultof water competing for active sorption sites and some water dissolving in the SCF (Reindl et al.1994; Firuset al., 1997; Laitinen et al., 1994). However, the maximum affect should be realized with only a modestamount of water in the soil. In addition, both affects will be relatively small due to the non-polar characterof naphthalene as a solute. Thus, a strong continually increasing dependence on the soil’s water contentwould not be anticipated.
Equilibrium was achieved without the use of a static period for dynamically operated, mixed systems, inwhich baffles were employed to improve the mixing regime within the extractor. This was observed for soilwater contents of 50% to 200% dry mass basis. The improved mixing system was capable of providingsufficient soil / SC-CO2 contact to allow the mass transfer process to proceed at a significant rate.
The average equilibrium distribution coefficient for the experiments operated with continuous mixing was8.1 gs/gCO2 (±25%). This value is much higher than measured for the drier soils and than measured whenoperating under the different modes of operation. Based on the level of experimental noise observed atthe end of these runs as discussed earlier it is doubtful that the equilibrium distribution coefficients areindeed this high.
Upon obtaining equilibrium distribution coefficients for allsoil water content extractions up to 200% dry mass basis,it was then possible to calculate mass transfer coefficientsfrom the resulting concentration data. In the fewexperiments in which a reliable equilibrium distributioncoefficient was not measured, an assumed value was used.The calculated mass transfer coefficient was found to changeless than 10% based on changing the assumed value by afactor of 2.
The no mix mode lead to a fairly steady decline in masstransfer coefficients as the water content increased from air
dried to 50 wt% as shown in Figure 13. Similarily, Akgerman et al. (1993), Camel et al. (1993) andScheussinger et al. (1996) have observed increasing soil water contents hindering the extraction processby introducing a barrier between the extracting fluid and the contaminant. Smyth et al. (1999) argue thatwater bridging between soil aggregates is a plausible reason for the strong dependence on water content.

soil_overview_03.wpd Page 51 of 70
Figure 14: Mass Transfer Coefficients -Mixed Static
Figure 15: Mass Transfer Coefficients - Dynamic
The next mode of operation involved mixing during thestatic periods. This second mode of operation did notrequire any modifications to the vessel and thus wasreadily implemented to test whether mass transfercoefficients could be improved. As can be seen inFigure 14, the mass transfer coefficients wereobserved to be approximately an order of magnitudehigher for the water contents tested using this mixing.
In this second mode of operation, the mixing wascreated using a stir bar in an unbaffled extractor. It isrecognized that this form of mixing leads to vortex
formation an is generally regarded as fairly ineffective in both two and three phase systems (Oldshue, 1983;Wong et al., 1987). However, the significant improvement in mass transfer observed motivated thedevelopment of a continuous mixing system.
The third mode of operation involved modification of the vessel to introduce baffles, to introduce SC-CO2
to the bottom and to provide deentrainment. The baffles were added to break up the vortex and thusimprove mixing effectiveness. The introduction of the SC-CO2 to the bottom was to avoid short-circuiting.The deentrainment device was added to separate the SC-CO2 from the soil slurry and thus allowcontinuous operation.
The deentrainment system worked well as the glasswool at the vessel outlet remained free of soil in allsix experiments. Also the effectiveness of mixing andcontact was significantly improved as evidenced bythe observed mass transfer coefficients (Figure 15).At the 50% water content, the mass transfercoefficients are approximately the same as the airdried values. As the water content increases to200%, the coefficients decrease but do remain withina factor of two of the air dried values. This suggeststhat slurried soil extraction can be achieved withminimal effort, indicating the potential for a
continuously operated SFE system exists. A continuously operated SFE system, in which contaminantsmay be extracted at a rate similar to that of the dry soil condition, will substantially reduce supercritical soilremediation costs. It is recommended that further supercritical soil remediation research focus on thedevelopment of pilot or full scale, SFE systems in which slurried soil is continuously pumped to the extractorunit.

soil_overview_03.wpd Page 52 of 70
Figure 16: Soil Cross-Section
(28)
8.0 MODEL DEVELOPMENT and NUMERICAL SOLUTION
The contaminant transport model to be presented considers a uniform soil system in which a chemicalcontaminant is distributed among four phases: NAPL, vapours, aqueous or sorbed. The wetting fluid, asfor most air/NAPL/water systems in soil, is assumed to be water.
Figure 16 shows a typical soil cross-sectionafter a NAPL spill. Following the spill, allthe chemical will disperse in the soil,eventually coming to rest. Then if it isassumed that water is applied at thesurface, e.g., rainfall, there will bemovement of the dissolved phase. If it isfurther assumed that the water is movingslow enough to ensure equilibriumconditions, a 1 D transport equation can bedeveloped to represent the migration of thedissolved phase in the vertical direction.
Following is the development of such anequilibrium model, where a total massbalance is completed for each phase.
8.1 Aqueous Phase
A dissolved chemical moving through soil will be affected by dispersion and advection. In addition theirmay be some mass transfer limitations and decay. The resulting equation describing 1 D transport is givenby:
whereCa = aqueous concentration, kg m-3
qa = superficial velocity of aqueous phase through soil, m s-1
Da = dispersion coefficient of dissolved chemical in soil, m2 s-1 t = time, s
z = spatial coordinate, m:a = decay rate of dissolved chemical, s-1
Now, by assuming constant dispersion and knowing the moisture content [2], the mass of chemical per unitvolume of soil can be determined by:

soil_overview_03.wpd Page 53 of 70
(29)
(30)
(31)
(32)
8.2 Vapour Phase
Similar to the aqueous phase, a transport equation can developed to account for dispersion, advection andmass transfer, giving:
whereCv = vapour concentration, kg m-3
qv = superficial or Darcian velocity of vapour through soil, m s-1
Dv = dispersion coefficient of dissolved chemical in soil, m2 s-1 t = time, s
z = spatial coordinate, m:v = decay rate of dissolved chemical, s-1
Again, by assuming constant dispersion, knowing the volumetric air content [0] and applying Henry’s Lawfor partition between the aqueous and vapour phase, Cv=KHCa, the mass of chemical per unit volume ofsoil can be determined by:
8.3 Immiscible Phase
Similar to the aqueous phase, a transport equation can developed to account for dispersion, advection andmass transfer, giving:
whereCi = immiscible phase concentration, kg m-3
qi = superficial velocity of immiscible phase through soil, m s-1
Di = dispersion coefficient of dissolved chemical in soil, m2 s-1 t = time, s
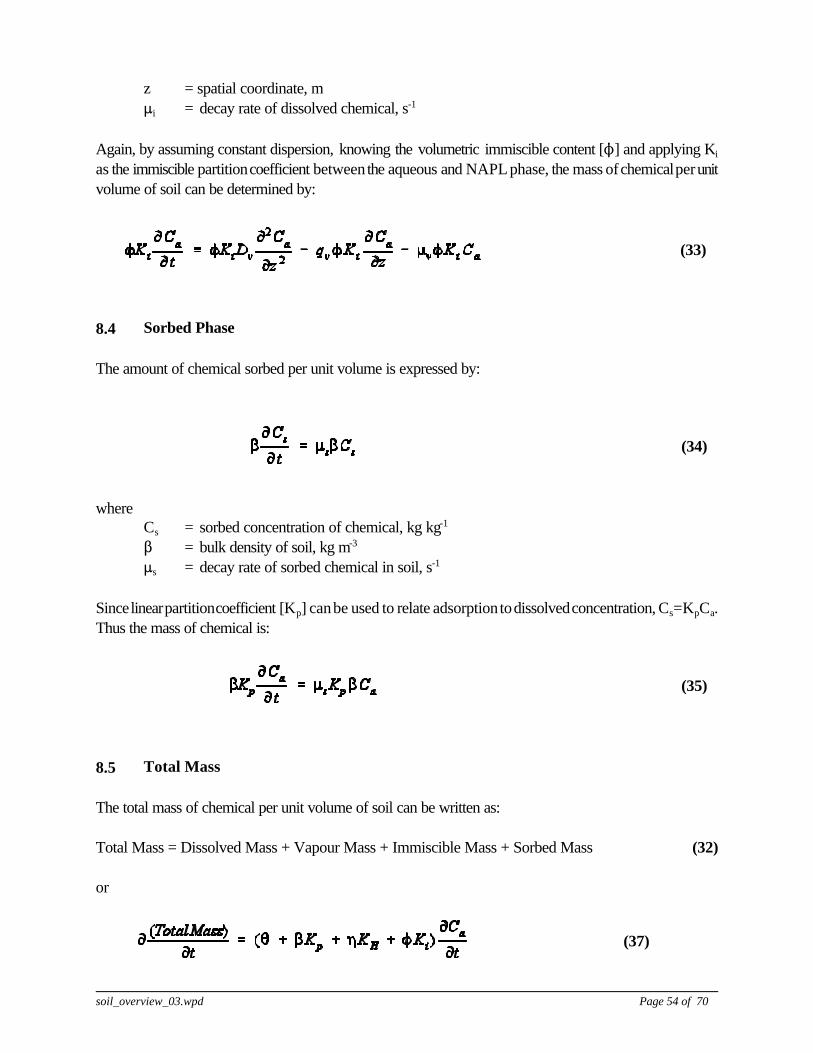
soil_overview_03.wpd Page 54 of 70
(33)
(34)
(35)
(37)
z = spatial coordinate, m:i = decay rate of dissolved chemical, s-1
Again, by assuming constant dispersion, knowing the volumetric immiscible content [N] and applying Ki
as the immiscible partition coefficient between the aqueous and NAPL phase, the mass of chemical per unitvolume of soil can be determined by:
8.4 Sorbed Phase
The amount of chemical sorbed per unit volume is expressed by:
whereCs = sorbed concentration of chemical, kg kg-1
$ = bulk density of soil, kg m-3
:s = decay rate of sorbed chemical in soil, s-1
Since linear partition coefficient [Kp] can be used to relate adsorption to dissolved concentration, Cs=KpCa.Thus the mass of chemical is:
8.5 Total Mass
The total mass of chemical per unit volume of soil can be written as:
Total Mass = Dissolved Mass + Vapour Mass + Immiscible Mass + Sorbed Mass (32)
or

soil_overview_03.wpd Page 55 of 70
(38)
(39)
(40)
(41)
(42)
(43)
or
The development of the local equilibrium model is based on the instantaneous attainment of chemicalequilibrium in the 4 phases. This requires additional constraints, including Raoult’s Law of ideal solutionbehaviour, equilibrium partitioning between the vapour and NAPL phases:
Raoult’s Law is appropriate for describing vapour liquid phase equilibria where components haveappreciable mole fractions. A dimensionless Raoult’s Law partition coefficient dependent on the NAPLconcentration was obtained by combining Equation 39 with the ideal gas law and the definition of a molefraction. From the ideal gas law, the molar concentration is related to partial pressure by:
The NAPL phase mole fraction can be expressed in terms of molar concentrations by:
where Nc = number of components
In addition, the NAPL volumetric fraction must sum to unity as expressed in the following equation for theNAPL phase:
where vj is the molar specific volume [m3 mol-1 ].
Finally, there is the need of mass balance, where:
where R = soil porosity
8.6 Non-Equilibrium
Many situations arise where equilibrium conditions do not apply. As such mass transfer relationships mustbe incorporated into the transport model. Specifically,

soil_overview_03.wpd Page 56 of 70
(44)
(45)
(46)
(47)
(48)
where(a = mass transfer coefficient for NAPL to water, s-1
Csat = maximum solubility of NAPL, kg m-3
(v = mass transfer coefficient for water to air, s-1
Cv-sat = maximum vapour solubility of NAPL, kg m-3
(i = mass transfer coefficient for NAPL to air, s-1
Many forms of the mass transfer coefficient exist. For example, Thomson [1991] believes that the masstransfer coefficient is function of each phases pore volume raised to an exponent. The following equationgives the mass transfer relationship for NAPL to water:
In work completed by Harper et al. [2000] on soil vapour extraction, it was conceptualized, based on theexperimental observations, that as the NAPL is being removed, the remaining NAPL becomes moreisolated from the air flow pathways. As a result, the mass transfer resistance, in the form of diffusionthrough immobile water and stagnant air in both the micropores and the macropores increases. The effectsof NAPL depletion was taken into account by expressing the mass transfer coefficient, Kga , as a linearfunction of the fractional NAPL volume relative to the initial NAPL volume:
whereNt = NAPL volumetric fraction at any time t, m3/m3
No = initial NAPL volumetric fraction, m3/m3
(amax = maximum mass transfer coefficient for NAPL to water, s-1
(amin = minimum mass transfer coefficient for NAPL to water, s-1
Although this expression is arbitrary with no specific physical basis, it seems reasonable that in the absenceof a NAPL, conditions would remain more or less constant. Further work on this expression byZytner[2000] has suggested further modifications as seen below:

soil_overview_03.wpd Page 57 of 70
(49)
0
10
20
30
40
50
Con
cent
ratio
n - g
/m^3
0 5 10 15 20 25 Time - h
Mod-T
Exp-T
Figure 17: Sandy Loam Soil - Air Dry
where
0t = vapour volumetric fraction at any time t, m3/m3
0o = initial vapour volumetric fraction, m3/m3
pkmax = exponentpkmin = exponent
Using Eq. 49 it was possible to reasonably model the behaviour of SVE in a sandy loam under air dryconditions as shown in Figure 17. The coefficients used are: (amax = 18 h-1; pkmax = 3; (amin = 440 h-1
and pkmin = 5. Further work is ongoing to obtain a more universal experession.
soil_overview_03.wpd Page 58 of 70
BIBLIOGRAPHY
Abriola, L.M. and Pinder, G.F., A multiphase approach to the modelling of porous media contamination by organiccompounds. 1. Equation Development. Water Resources Research, 21:11-18 [1985].
Acher, A.J., Boderie, P. and Yaron, P. [1990] Soil Pollution by Petroleum Products, I. Multiphase Migration of KeroseneComponents in Soil Columns. J. of Contaminant Hydrology, 4: 333-345.
Agriculture and Agri-food Canada (2001) Canadian Fertilizer Consumption, Shipments and Trade 1999/2000,http://www.agr.gc.ca/policy/cdnfert/text99-00.pdf.
Akgerman A. and Yeo S.-D. (1993) Supercritical Extraction of Organic Components from Aqueous Slurries, ACSSymposium Series #514, p294-304.
Akgerman, A., Erkey, C. and Ghoreishi, S.M. (1992) Supercritical Extraction of Hexachlorobenzene from Soil, Ind. Eng.Chem. Res., 31:333-339.
Al-Awadhi, N., Al-Daher, R., ElNawawy, A., & Balba, M.T. (1996). Bioremediation of oil-contaminated soil in Kuwait.I. Landfarming to remediate oil-contaminated soil. Journal of Soil Contamination, 5(3):243-260.
Alexander, M. [1977] Introduction to Soil Microbiology. New York, N.Y.: Wiley.
American Petroleum Institute, Literature Survey, Hydrocarbon Solubilities and Attenuation Mechanisms, APIPublication No. 4414 [1985].
Anderson, M.R. 1988, The dissolution and transport of dense non-aqueous phase liquids in saturated porous media,Ph.D. Dissertation, Oregon Graduate Centre, Beaverton, Oreg., 260p.
Anderson, T.A., Beauchamp, J.J. and Walton, B.T. [1990] Organic Chemicals in the Environment, J. Environ. Qual.,20:420-424.
Andrews, A.T., Ahlert, R.C., and Kosson, D.S. (1990) Supercritical Fluid Extraction of Aromatic Contaminants from aSandy Soil, Environ. Prog. 9:204-210.
Armstrong, J. E., Frind, E. O. and McClellen, R. D. (1994) Non-equilibrium mass transfer between the vapour, aqueousand solid phases in unsaturated soils during vapour extraction. Water Resources. Research, 30 (2):355-368.
Asano, T. 1985, Artificial Recharge of Groundwater, Butterworth, Pub. Stoneham, MA., 767p.
Atlas, R.M. [1995] Bioremediation, Chemical and Engineering News, 73[14]:32-42.
Atlas, R.M. [1981] Microbial degradation of petroleum hydrocarbons: An environmental perspective. MicrobiologicalReviews, 45[1]:180-209.
Aurelius, M.W. and Brown, K.W. [1987], Fate of Spilled Xylene as Influenced by Soil Moisture Content , Water Air andSoil Pollution, 36:23-31.
Baehr A.L., Hoag, G.E. and Marley, M.C. [1989] Removing volatile contaminants from the unsaturated zone by inducingadvective air-phase transport, J. Contam. Hydrol. 4: 1-26.
Baehr, A. L. and Corapcioglu, M. Y. (1987) A compositional multiphase model for groundwater contamination bypetroleum products 2. numerical solution. Water Resources Research, 23 (1):201-213.
Baker, J. N., Nickerson, D. A., Guest, P. R., and Portele, T. E. (1993) Use of horizontal air-dispersion system to enhancebiodegradation of diesel fuel contaminated soils. Petroleum Hydrocarbons and Organic Chemicals in Groundwater:

soil_overview_03.wpd Page 59 of 70
Proceeding of the National Conference, Houston, Texas, 383-395.
Banerjee, S. and Howard, P.H. [1988] Improved Estimation of Solubility and Partitioning Through Correction of UNIFAC-Derived Activity Coefficients, E.S.& T., 22:839-841.
Barbash, J. and Roberts, P.V. [1986] J. WPCF, 58, 5:343-348.Batterman, S., Kulshrestha, A. and Cheng, H. [1995] Hydrocarbon Vapor Transport in Low Moisture Soils.Environmental Science and Technology, 29[1]: 171-180.
Bauer, E., Pennerstorfer, Ch., Renner, S., Slavica, B., Braun, R. [1994] Factors influencing biological soildecontamination. Proc. 6th European Congress on Biotech., 1223-1226.
Benson, D. A., Huntley, D. and Johnson, P. C. (1993) Modelling vapor extraction and general transport in the presenceof NAPL mixtures and nonideal conditions. Ground Water, 31 (3):437-44.
Berndston, M.K. and Bunge, A.L. [1991] A mechanistic study of forced aeration for in-place remediation of vadose zonesoils, Proceedings Petroleum Hydrocarbons and Organic Chemicals in Groundwater - Prevention, Detection andRestoration, NWWA/API, Houston, TX, Nov. 20-22, 249-263.
Black, C.A. [1965] Methods of Soil Analysis: Part I, American Society of Agronomy, 770 p.
Bossert, I., Barth, R. [1984] The Fate of Petroleum in Soil Ecosystems [453-474]. Atlas, R.M. Petroleum Microbiology.New York, N.Y.: Macmillan Publ..
Bouchard, D.C., Mravik, S.C. and Smith, G.B., Benzene and Naphthalene Solution on Soil Contaminated with HighMolecular Weight Residual Hydrocarbons from Unleaded Gasoline, Chemosphere, 21[1990], pp. 975-989.
Brady, B.O., Kao, C.P.C., Dooley, K.M., Knopf, F.C. and Gambrell, R.P. (1987) Supercritical Extraction of Toxic Organicsfrom Soils, Ind. Eng. Chem. Res., 26:261-268.
Brady, N. C. (1990). The nature and properties of soils. 10th ed. MacMillan Publishing Company, New York, NY. 8-19,279-303.
Braids, O.C. 1981, Subsurface Seminar on the Fundamentals of Groundwater Quality Protection, Geraghty and MillerInc. and Am. Ecology Services Inc., Oct. 5-6.
Brook, T.R., Stiver, W.H. and Zytner, R.G. (2001) Biodegradation of Diesel Fuel in Soil Under Various NitrogenAddition Regimes, Journal of Soil and Sediment Contamination, 10(5):539-553..
Broughton, C.C. [1981] Principles of Liquid-Phase Adsorption, in Application of Adsorption to WastewaterTreatment, Ed. by Eckenfelder, W.W. Jr. [1981], Enviro Press Inc., Nashville, pp. 29-66.
Brusseau, M. L. (1991) Transport of organic chemicals by gas advection in structured or heterogeneous porousmedia: Development of a model and application to column experiment. Water Resources Research, 27 (12):3189-3199.
Brusseau, M. L. and Rao, P. S. C. (1989) The influence of sorbate-organic matter interactions on sorption non-equilibrium. Chemiosphere, 18 (9/10):1691-1706,.
Brussseau, M.L., Rao, P.S., C., Jessop, R.E. and Davidson, J.M. [1989] A method for investigating sorptionnonequilibrium, J. Contam. Hydrol.,4[3]: 223-240.
Buswell, J.A. [1994] Potential of spent mushroom substrate for bioremediation purposes. Compost Science andUtilization, 2[3]: 31-36
Camel V., Tambuté A., Caude M. [1993] Analytical-scale supercritical fluid extraction: a promising technique for thedetermination of pollutants in environmental matrices, J. Chromatography, 642:263-281.

soil_overview_03.wpd Page 60 of 70
Campagnolo, J. F. and Akgerman, A. (1995) Modelling of soil vapour extraction (SVE) systems - part I. WasteManagement, 15 (5/6):379-389.
Cary, J.W., Simmons, C.S. and McBride, J.F. [1989] Predicting Oil Infiltration and Redistribution in Unsaturated Soils. Soil Science Society of America Journal, 53:335-342.
Champagne A.T. and Bienkowski P.R. [1995] The Supercritical Fluid Extraction of Anthracene and Pyrene from aModel Soil: An Equilibrium Study, Separation Science and Technology, 30:1289-1307.
Chiou C.T. and Shoup T.D. [1985] Soil Sorption of Organic Vapors and Effects of Humidity on Sorptive Mechanismand Capacity, Environ. Sci. Technol., 19:1196-1200.
Cho, H.R. and Jaffe, P.R. (1990) The volatilization of organic compounds in unsaturated porous media duringinfiltration, J. Contaminat Hydrology, 6:387-410.
Cohen, R.M., Rabold, R.R., Faust, C.R., Rumbaugh, III, J.O. and Bridge, J.R., 1987, Investigation and hydrauliccontainment of chemical migration: Four Landfills in Niagara Falls, Civil Eng. Practice, Vol. 2[1], pp. 33-58.
Coia, M. F., Corbin, M. H. and Anastos, G. [1985] Soil decontamination through in situ of volatile organics: A pilotdemonstration, Proceedings Petroleum Hydrocarbons and Organic Chemicals in Ground Water - Prevention,Detection and Restoration, AWWA/API, Houston TX, 555-564.
Corapcioglu, M.Y. and Baehr, A.L. [1987] A Compositional Multiphase Model for Groundwater Contamination byPetroleum Products 1. Theoretical Considerations. Water Resources Research, 23:191-200.
CRC, 1973, CRC Handbook , edited by R.E. Boltz and G.L. Tuve, pp. 389.
Cronce, R., and Cagnetta, R. 1996. In-Situ Biodegradation of TCE Through Anhydrous Ammonia and Methane Injection.Proceedings of the 1996 28th Mid-Atlantic Industrial and Hazardous Waste Conference, Jul 14-17 1996: 8-14.
Crow, W.L., Anderson, E.P. and Minugh, E. [1987] Subsurface venting of vapors emanating from hydrocarbonproduct on ground water, Ground Water Monit. Rev., 7[1]: 51-57.
Cutright, T.J. [1995] A feasible approach to the bioremediation of contaminated soil from lab scale to field test,Fresenius Env. Bull. 4[2]: 67-73.
Daubert, T.E. and Danner, D.P. [1989] Physical and Thermodynamic Properties of Pure Chemicals: DataCompilation, Design Institute for Physical Property Data [DIPPR] and American Institute of Chemical Engineers,Hemisphere Publishing Corporation, New York, NY.
de Pastrovich, T.L., Baradat, Y., Barthel, R., Chiarelli, A. and Fussel, D.R., 1979, Protection of Groundwater from OilPollution, CONCAWE [Conservation of Clean Air and Water - Europe], 61p.
Dean-Ross, D., Mayfield, H. and Spain, J. [1992]. Environmental Fate and Effects of Jet Fuel JP-8, Chemosphere,24:219-228.
Debenedetti P. and Reid R.C. [1986] Diffusion and Mass Transfer in Supercritical Fluids, AIChE J., 32:2034-2046.
Dibble, J. T., and Bartha, R. (1979). Effect of environmental parameters on the biodegradation of oil sludge. Appliedand Environmental Microbiology, 37(4):729-739.
Dibble, J.T., and Bartha, R. [1979] Rehabilitation of oil-inundated agricultural land: a case history, Soil Science,128:56-61.
DiGiulio, D.C. [1992] Evaluation of soil venting application, J Hazard. Materials , 32:279-291.

soil_overview_03.wpd Page 61 of 70
Dominguez Laseca, F., Bergueiro Lopez, J.R. and Rivera Julia, A. [1990]. Evaluation of the effects of hydrocarbonspills. IV. Evaporation on beach sand, Ing. Quim. [Madrid], 22:133-138.
Donaldson, S.G., Miller, G.C. and Miller, W.W. [1992]. Remediation of Gasoline-Contaminated Soil by PassiveVolatilization, J. Environ. Qual., 21:94-102.
Downey, D.C., Guest, P.R., and Ratz, J.W. [1995] Results of a two-year in situ bioventing demonstration,Environmental Progress, 14[2]: 21-125.
Dupont, R.R. [1993]. Fundamentals of Bioventing Applied to Fuel Contaminated Sites, Environ. Prog., 12:45-53.
Dzombak, D.A. and Luthy, R.G. [1984] Estimating Adsorption of Polycyclic Aromatic Hydrocarbons on Soils, SoilScience, 137:292-308.
El-Kadi, A.I. [1992] Applicability of Sharp-Interface Models for NAPL Transport:1. Infiltration. Ground Water ,30:849-856.
Elektorowicz, M. [1994] Bioremediation of petroleum contaminated clayey soil with pretreatment, Environ. Tech.,15:373-380.
English, C.W. and Loehr, R.C. [1991] Degradation of Organic Vapours in Unsaturated Soils, J. Hazard. Mater., 28:55.
Erkey C., Madras G., Orejeula M, Akgerman A. [1993] Supercritical Fluid Extraction of Organics from Soil,Environmental Science and Technology, 27:1225-1231.
Falta, R. W., Javandel, I., Preuss, K. and Witherspoon, P. A. (1989) Density-driven flow of gas in the unsaturatedzone due to the evaporation of volatile organic compounds. Water Resources Research, 25 (10):2159-2169.
Feenstra, S. and Cherry, J.A. [1988] Subsurface Contamination by Dense Non-Aqueous Phase Liquid [DNAPL]Chemicals, Int. Groundwater Symp., Halifax, N.S., May 1-4.
Felsot, A. and Dahm, P.A., Sorption of Organophosphorous and Carbmate Insecticides by Soil, J. Agri. Food Chem.,27[1979], pp. 394.
Fine, P. and Yaron, B. [1993] Outdoor experiments on enhanced volatilization by venting kerosene components fromsoil. J. Contam. Hydrol. 12: 355-374.
Fiorenza, S., Duston, K.L., Ward, C.H. [1991] Decision making -- Is bioremediation a viable option? J. HazardousMaterials, 28:171-183.
Fischer, A.J. et al. 1987, Ground Water , 25, pp. 407.
Flathman, P.E., Jerger, D. E. and Exner, J. H. (1994). Bioremediation: Field Experience. Lewis Publishers, CRC PressInc. 59-63,81-87,177-185.
Foght, J., K. Semple, C. Gauthier, D.W.S. Westlake, S. Blenkinsopp, G. Sergy, Z. Wang, M. Fingas. (1999) Effect ofnitrogen source on biodegradation of crude oil by a defined bacterial consortium incubated under cold, marineconditions. Environmental Technology 20: 839-849.
Frank, U. and Barkley, N. (1995) Remediation of Low Permeability Subsurface Formations by FracturingEnhancement of Soil Vapor Extraction. Journal of Hazardous Materials , 40: 91-201.
Frankenberger Jr., W.T., Emerson, K.D., Turner, D.W. [1989] In situ bioremediation of an underground diesel fuelspill: A case history. Environ. Management, 13[3]:325-332.
Franzmann, Peter D., L.R. Zappia, T.R. Power, G.B. Davis, B.M. Patterson (1999) Microbial mineralization of benzene and

soil_overview_03.wpd Page 62 of 70
characterization of microbial biomass in soil above hydrocarbon contaminated groundwater. FEMS MicrobiologyEcology 30: 67-76.
Freeze, R.A. and Cherry, J.A. [1979], Groundwater , Prentice Hall Inc., Englewood Cliffs, New Jersey, USA, 604p
Friesel, P., Milde, G. and Steiner, B. [1984] Interactions of Halogenated Hydrocarbons with Soils , Springer-Verlag,Berlin, West Germany, pp. 160-164.
Galin, T., McDowell, C. and Yaron, B. [1990] The Effect of Volatilization on the Mass Flow of a Non-AqueousPollutant Liquid Mixture in an Inert Porous Medium: Experiments with Kerosene. Journal of Soil Science, 41: 631-641.
Garbarini, D.R., Lion, L.W. 1986, Environmental Science Technology, 20, pp. 1263-1269.
Geankoplis, C. J. (1993) Transport Processes and Unit Operations, 3rd ed., Prentice Hall, Engelwood Cliffs, N. J., 921p.
Geerdink, M.J., van Loosdrecht, M.C.M., Luyben, K.Ch.A.M. [1996] Biodegradability of diesel oil. Biodegradation,7:73-81.
Gibson, T. L., Abdul, A. S., Glasson, W. A., Ang, C. C., and Gatlin, W. G. (1993) Vapour extraction of volatilecompounds from clay soil: A long-term field pilot study. Ground Water , 31 (4):616-626.
Gierke, J. S., Hutzler, N. J. and McKenzie, D.B. [1992] Vapor transport in unsaturated soil columns: implications forvapour extraction, Water Res. Res., 28[2]: 323-335.
Goss, K. 1993. Effects of Temperature and Relative Humidity on the Sorption of Organic Vapors on Clay Minerals. Environmental Science and Technology, 27: 2127-2132.
Gottscalk, G. (1985). Nutrition of bacteria. In: Bacterial Metabolism, 2nd ed., pp. 1-10. New York. Springer-Verlag.
Gray D.J., Zytner R.G., Stiver W.H. (1995) Supercritical Carbon Dioxide - Soil Partition Coefficients, J. SupercriticalFluids, 8:149-155.
Groves, F.R., Brady, B., and Knopf, F.C. (1985) State-of-the-Art on the Supercritical Extraction of Organics fromHazardous Waste, CRC Critical Reviews in Environmental Review, 15:237-274.
Guigard S.E., Stiver W.H. (1998) A Density-Dependent Solute Solubility Parameter for Correlating Solubilities inSupercritical Fluids, Ind. Eng. Chem. Res., 37:3786-92.
Guiguer, N., Franz, T. and Zaidal, J. (1995) Airflow/SVE: Axisymmetric Vapour Flow and Transport Simulation Model.Waterloo Hydrogeologic Software. 2/1 – 3/17.
Gundlach, E.R., Boehm, P.D., Marchand, M., Atlas, R.M., Ward, D.M., Wolfe, D.A. [1983] The Fate of Amoco CadizOil. Science, 221[8 July]:122-129.
Hamid, A. and Mahler, R.L. (1994). The potential for volatilization losses of applied nitrogen fertilizers from northernIdaho soils. Communications in Soil Science and Plant Analysis, 25(3&4):361-373.
Hansch, C. and Leo, A. 1979, Substituent Constants for Correlation Analysis in Chemistry and Biology, Wiley andSons.
Hansch, C., Quinlan, J.E. and Lawerence, G.L., The Linear Free-energy Relationship Between Partition Coefficientsand the Qqueous Solubility of Organic Liquids, J. Am. Chem. Society, 4[1968], pp. 345-350.
Harper, B., Stiver, W.H. and Zytner, R.G. (1998) The Influence Of Water Content In Contaminant Removal By SVE In A

soil_overview_03.wpd Page 63 of 70
Silt Loam Soil, ASCE Journal of Environmental Engineering, 124(11):1047-1053.
Harper, B. M., (1999) An experimental and numerical modelling investigation of soil vapour extraction in a siltloam soil. PhD thesis, School of Engineering, University of Guelph, 380p.
Harper, B. M., Stiver, W. H. and Zytner, R. G., (1998) Influence of water content on SVE in a silt loam soil. J.Environmental Engineering, 124 (11):1047-1053.
Hayden, N.J., Voise, T.C., Annable, and Wallace, R.B. [1994] Change in gasoline constituent mass transfer duringsoil venting, J. Env. Eng., 120[6]: 1598-1614.
Hayward, G. [1998] Personal Communication, Associate Professor, School of Engineering, University of Guelph, Jan..
Hickey, W.J. [1995] In situ respirometry: Field methods and implications for hydrocarbon biodegradation in subsurfacesoils. J. Environmental Quality, 24:583-588.
Hinchee, R.E. and Reisinger, H.J., A Practical Application of Multiphase Thransport Theory to GroundwaterContamination Problems, Ground Water Monitoring Review, 84[1987], pp. 84-92.
Ho, C. K., Liu, S-W. And Udell, K. S. (1994) Propagation of evaporation and condensation fronts during multicomponentsoil vapor extraction. J. Contaminant Hydrology, 16:381-401.
Ho, C. K. and Udell, K. S. (1991) An experimental investigation of air venting of volatile liquid hydrocarbon mixtures fromhomogeneous and heterogeneous porous media. J. Contaminant Hydrology, 11:291-311.
Hoag, G.E. and Marley, M.C. [1986], Gasoline Residual Saturation in Unsaturated Uniform Aquifer Materials, J ofEnviron, Eng., ASCE, Vol. 112[3], pp. 586-604.
Hoyle, B. L., Scow, K. M., Fogg, F. E., and Darby, J. L. (1995). Effect of carbon:nitrogen ration on kinetics of phenolbiodegradation by Acinetobacter johnsonii in saturated sand. Biodegradation, 6:283-293.
Huesemann, M. H. [1994]. Guidelines for land-treating petroleum hydrogen-contaminated soils. Journal of SoilContamination, 3(3):299-318.
Huesemann, M.H. [1995] Predictive model for estimating the extent of petroleum hydrocarbon biodegradation incontaminated soils, Environmental Science and Technology, 29:7-18.
Huesmann, Michael H. (1994) Guidelines for land-treating petroleum hydrocarbon-contaminated soils. Journal of SoilContamination 3(3): 299-318.
Hutzler, N.J., Murphy, B.E. and Gierke, J .S. [1989] State of Technology Review: Vapor Extraction Systems, Rep No EPA 600/2-89-024.
Ismailov, N.M. (1983). Effect of oil pollution on the nitrogen cycle in soil. Mikrobiologiya, 52(6):1003-1007.
IUPAC (1989) Solubility Data Series Vol. 37 : Hydrocarbons with water and seawater, Part I Hydrocarbons C5 toC7 , Part II Hydrocarbons C5 to C7 ,edited by D. G. Shaw and A. S. Kertes, Pergamon Press, Toronto.
Jackson, W.A. and J.H. Pardue. (1999). Potential for the enhancement of biodegradation of crude oil in Louisiana saltmarshes using nutrient amendments. Water, Air and Soil Pollution 109: 343-355.
Jaffe, P.R. and Ferrara, R.A. 1983, J. Environmental Eng. ASCE, 109, 4, pp. 859-867.
Jain, D. K., Lee, H. and Trevors, J., T. (1992). Effect of addition of Pseudomonas aeruginosa UG2 inocula orbiosurfactants on biodegradation of selected hydrocarbons in soil. Journal of Industrial Microbiology, 10:87-93.

soil_overview_03.wpd Page 64 of 70
Jarsjo, J., Destouni, G. and Yaron, B. 1994. Retention and Volatilisation of Kerosene: Laboratory Experiments on Glacialand Post-Glacial Soils. Journal of Contaminant Hydrology, 17: 167-185.
Johnson, P. C., Kemblowski, M. W. and Colthart J. D. (1990) Quantitative analysis of hydrocarbon-contaminated soilsby in-situ soil venting.Ground Water , 28(3):413-428.
Johnson, P.C., Hertz, M.B. and Byers, D.L. [1990a] Estimates for hydrocarbon vapour emissions resulting from servicestation remediations and buried gasoline-contaminated soils. Kostecki, P.T. and Calabrese, E.J., eds., PetroleumContaminated Soils, Lewis Publishers, Chelsea, MI, 295-326.
Johnson, R.L. and Perott, M. 1990. Gasoline Vapor Transport Through a High-Water-Content Soil. Journal ofContaminant Hydrology, 8: 317-334.
Johnson, P.C., Kemblowski, M.W. and Colthart, J. D. [1990b] Quantitative analysis of hydrocarbon-contaminated soilsby in-situ soil venting. Groundwater , 28[3]: 413-428.
Johnston, A., Lafond, G., Harapiak, J. and Head, K. (2002). Use of Anhydrous Ammonia in a One-Pass Direct SeedingSystem. Feb. 26, http://paridss.usask.ca/factbook/soilcrop/johnston.html#ref.
Jorio, H. (2000) Biofiltration of air contaminated by styrene: effect of nitrogen supply, gas flow rate, and inletconcentration. Environmental Science and Technology 34(9): 1764-1771.
Jury, W.A., Spencer, W.F. and Farmer, W.J., Behaviour Assessment Model for Trace Organics in Soil: IV Review ofExperimental Evidence, JEQ, 13[1984], pp. 580-586.
Kaluarachchi, J.J. and Parker, J.C. [1990] Modelling Multicomponent Organic Transport in Three-Fluid-Phase Porous. Journal of Contaminant Hydrology, 5:349-374.
Kampbell, D.H., Wilson, J.T. [1991] Bioventing to treat fuel spills from underground storage tanks. J. HazardousMaterials, 28:75-80.
Karan, K., Chakma, A. and Mehrotra. A. K. (1994) Air stripping of hydrocarbon-contaminated Soils: Investigation ofmass transfer effects. Canadian J Chemical Engineering, 73:196-203. Karickhoff, S. W., Brown, D. S. and Scott, T. A. (1979) Sorption of Hydrophobic Pollutants on Natural Sediments,Water Research, 13:241-248.
Kaufman, D.D., Russell, B.A., Helling, C.S. and Kayser, A.J. 1981, J. Agricultural Food Chem., 29, 2, pp.239-245.
Kelly, I. and Cerniglia, C. E. (1995). Degradation of a mixture of high-molecular-weight poycyclic aromatichydrocarbons by a mycobacterium strain pyr-1. Journal of Soil Contamination, 4(1):77-91.
Kenaga, E.E., Predicted Bioconcentration Factors and Soil Sorption Coefficients of Pesticides and Other Chemicals,Ecotoxicology and Environmental Safety, 4[1980], pp. 26-38.
Kerfoot, H.B. and Barrows, L.J. 1981, Soil Gas Measurements for the Detection of Subsurface OrganicContamination, U.S. EPA, Las Vegas, NV.
Kerry, E. [1993] Bioremediation of experimental petroleum spills on mineral soils in the Vestfold Hills, Antartica. Polar Biology, 13:163-170.
Kessler, A. and Rubin, H., On the Simulation of Unsaturated Oil Flow in Soils, in Scientific Basis for WaterResources Management, Proceedings of the Jerusalem Symposium, IAHS Publ. no. 153 [1985].
Khan, K.A. and Cruse, H. 1990. Soil and Groundwater Remediation - a case study, Proc. Air and Waste ManagementAssoc. Annual Mtg., 83rd[Vol. 1], 90/15.3, 18pp.

soil_overview_03.wpd Page 65 of 70
Kia, S.F., Modelling the Retention of Organic Contaminants in Porous Media of Uniform Spherical Particles. WaterResearch, 22:1301-1309 [1988].
Kirk-Othmer. 1990. Encyclopedia of Chemical Technology, 3rd Ed. John Wiley & Sons, New York.
Koorevaar, P., Menelik, G. and Dirsken, C., Elements of Soil Physics, 3rd Edition. Elsevier Science Publishers, NewYork, New York, USA, 229p [1983].
Kostecki, P.T. and Calabrese, E.J. 1989. Petroleum Contaminated Soils, Volume 1, Remediation Techniques,Environmental Fate, Risk Assessment. Lewis Publ. Inc., Chelsea, MI.
La Poe, R.G. [1985] Sorption and Desorption of Volatile Chlorinated Aliphatic Compounds by Soils and SoilComponents, Ph.D. Dissertation, Cornell University, 306p.
Laitinen A., Michaux A., and Aaltonen O. (1994) Soil Cleaning by Carbon Dioxide Extraction: A Review,Environmental Tech., 15:715-727.
Laplante T. (1998) Supercritical Fluid Extraction of Naphthalene from Soil Slurries, M.Sc. Thesis, University ofGuelph.
Law, A.M.J. [1996] Development of a respirometer to measure contaminant concentration effects in soils undergoingbioventing, M.Sc. Thesis, University of Guelph, 167p.
Lee, D.Y. and Chang, A.C., Evaluating Transport of Organic Chemicals in Soil, 46th Annual Purdue Waste Conference,[1991].
Leeson, Andrea and Robert E. Hinchee (1997) Soil Bioventing Principles and Practice. Lewis Publishers, Boca Raton,FL.
Leismann, H. M., Herrling, B and Krenn, V. (1988) A quick algorithm for the dead-end pore concept for modellinglarge-scale propagation processes in groundwater. in Computational Methods in Water Resources, vol. 2., edited byM. A. Celia, L. A. Ferrand, C. A. Brebbia and W. G. Gray, Elsevier, New York, NY, pp. 275-280.
Lesley, M.P. and Chakravarthi, R.R. (1997) Integrating Biofiltration with SVE: A Case Study. Journal of SoilContamination, 6(1): 95-112.
Lingineni, S. and Dhir, V. K. (1992) Modelling of soil venting processes to remediate unsaturated soils. J.Environmental Engineering, 118 (1):135-150,.
Low G.K.C., Duffy G.J., Sharma S.D., Chenesse M.D., Weir S.W., and Tibbett A.R. (1994) Transportable SupercriticalFluid Extractor Unit for Treating of Contaminated Soils, In Proceedings of the 3rd International Symposium onSupercritical Fluids, Volume 2, Ed. Brunner G. and Perrut M., October 17-19, p275-280.
Mackay, D. [1988] in Soils Contaminated by Petroleum: Environmental and Public Health Effects, ed. by E.J.Calabrese and P.T. Kostecki, 458p;
Mackay, D.M. and Cherry, J.A. 1989, Groundwater Contamination: Pump and Treat Remediation, ES&T., Vol. 23[6],pp. 620-636.
Mackay D., Shiu W.Y. and Ma K.C. [1992] Illustrated Handbook of Physical-Chemical Properties andEnvironmental Fate for Organic Chemicals, Volume II, Polynuclear Aromatic Hydrocarbons, PolychlorinatedDioxins, and Dibenzofurans, Lewis Publishers, Boca Raton, Table 2.2.
Mackay, D., Shiu, W. Y. and Mi, K.C.(1992) Illustrated Handbook of Physical Chemical Properties andEnvironmental Fate for Organic Chemicals, Vol. I, Lewis Publishers, Ann Arbor, MI, p.

soil_overview_03.wpd Page 66 of 70
Madras G., Thibaud C., Erkey C., Akgerman A. [1994] Modelling of Supercritical Extraction of Organics from SolidMatrices, AIChE J., 40:777-785.
Mahmood, S.K., and Rao, P.R. [1993] Microbial abundance and degradation of polycyclic aromatic hydrocarbons insoil. Bull. Environmental Contamination and Toxicology, 50:486-491.
Malina, G., J.T.C.Grotenhuis, W.H.Rulkens, S.L.J.Mous, J.C.M de Wit (1998) Soil vapour extraction vs. bioventing oftoluene and decane in bench-scale soil columns. Environmental Technology 19: 977-991.
Margesin, R. and Schinner, F. [1997] Laboratory bioremediation experiments with soil from a diesel-oil contaminatedsite-significant role of cold adapted microorganisms and fertilizers. J. of Chemical Technology and Biotechnology,70[1]:92-98.
Marley, M. C. and Hoag, G. E. (1984) Induced soil venting for recovery/restoration of gasoline hydrocarbons in thevadose zone. Proc NWWA/API conf.On Petroleum Hydrocarbons and Organic Chemicals in Groundwater, 4734-501.
Massman, J. W., (1989) Applying groundwater flow models in vapor extraction system design. J. EnvironmentalEngineering, 115 (1):129-149.
McCann, M., Boersma, P., Danko, J., and Guerriero, M. (1994). Remediation of a VOC-Contaminated Superfund SiteUsing Soil Vapor Extraction, Groundwater Extraction, and Treatment: A Case Study. Environmental Progress, 13(3):208-213.
McHugh, M.A. and Krukonis, V.J. (1994) Supercritical Fluid Extraction, Principles and Practice, 2nd Edition,Butterworth-Heinmann, Boston, MA.
McVickar, M., Martin, W. P., Miles, I.E. and Tucker, H. H. (1966) NH3 Agricultural Anhydrous Ammonia: Technologyand Use. Agricultural Ammonia Institute Memphis.
Melcer, H. 1982, Biological Removal of Organic Priority Pollutants, Wastewater Technology Centre, EnvironmentCanada, 91 p.
Mercer, J.W. and Cohen, R.M. 1990, A Review of Immiscible Fluids in the Subsurface: Properties, Models,Characterization and Remediation, J of Contaminant Hydrology, Vol. 6, pp. 107-163.
Millington, R. J. and Quirk, J. P. (1961) Permeability of porous solids. Transactions Faraday Soc. 57:1200-1207.
Mills, S.A., and Frankenberger Jr., W.T. [1994] Evaluation of phosphorus sources promoting bioremediation of dieselfuel in soil. Bull. Environmental Contamination and Toxicology, 53:280-284.
Møller, J., Gaarn H., Steckel T., Wedebye, E.B., and Westermann, P. [1995] Inhibitory effects on degradation of dieseloil in soil-microcosms by a commercial augmentation product, Bull. Environmental Contamination and Toxicology,54:913-918.
Montero G.A., Giorgio T.D. and Schnelle K.B. Jr. (1995) Removal of Hazardous Contaminants from Soils bySupercritical Fluid Extraction, In Innovations in Supercritical Fluids: Science and Technology, Ed. HutchensonK.W. and Foster N.R., ACS Symposium Series #608, Ch 19, p 281-297.
Morrill, L.G., Mahilum, B.C. and Mohiuddin, S.H., 1982, Organic compounds in Soils: Sorption, Degradation andPersistence, Ann Arbor Science, 326p.
MSDS (2001) Anhydrous Ammonia Material Safety Data Sheet, Saskferco Products Inc., Belle Plaine, Saskatchewan,Product ID: UN-1005.
Naziruddin, M., Grady Jr., C.P.L., and Tabak, H.H. [1995] Determination of biodegradation kinetics of VOCs throughthe use of respirometry. WER, 67:151-158.

soil_overview_03.wpd Page 67 of 70
Ng, C.-O. and Mei, C. C. (1996) Aggregate diffusion model applied to soil vapour extraction in unidirectional andradial Flows. Water Resources Research, 32 (5):1289-1297.
Oliver, T., Kostecki, P. And Calabrese, E. [1996] State summaries of soil and groundwater cleanup standards, Soiland Groundwater Cleanup, November: 12-29.
ORNL, 1988, Toxicological Profile for Trichloroethylene, Oak Ridge National Laboratory, Contract No. 68-03-3268,p. 140.
Page, A.L. (1982). Methods of soil analysis: chemical and microbiological properties. Soil Science Society ofAmerica Inc., 643-703.
Palmer, C.D. 1987. Physical Processes. EPA Seminar, Transport and Fate of Contaminants in the Subsurface. USEPA, Chicago, Ill., Dec.
Pinder, G.F. and Abriola, L.M. 1986, On the Simulation of Non-Aqueous Phase Organic Compounds in theSubsurface, Water Res. Res., Vol. 22[9], pp. 109S-119S.
Poulsen, T.G., Massman J.W., Moldrup P. (1998) J. Environ. Eng’g, 122(8):700-706;
Pye, V.I., Patrick, R. and Quarles, J. 1983, Groundwater Contamination in the United States , Univ. of PennsylvanniaPress, Philadelphia, PA., p315.
Rathfelder, K., Yeh, W.W.G. and MacKay, D. [1991] Mathematical simulation of soil vapour extraction systems:model development and numerical examples, J. Contam. Hydrol., 8[3]: 263-297.
Reible, D.D., Illagasekare, T.H., Doshi, D.V., Malhiet, M.E., Infiltration of Immiscible Contaminants in the UnsaturatedZone. Ground Water , 28:685-692 [1990].
Reid, R. C., Prauanitz, R. C. and Poling, B. E. (1987) The properties of gases and liquids, 4th ed., McGraw-Hill, NewYork, NY, 741 pp.
Reynolds, T.D. [1982], Unit Operations and Processes in Environmental Engineering, Brooks/Cole Eng. Div., 576 p.
Reynolds, C.M., Bhunia, P. and Koenen, B. [1997] Soil Remediation Demonstration Project: Biodegradation of HeavyFuel Oils, Special Report 97-20, US Army Corps of Engineers, 8p.
Roberts, P.V., Reinhard, M. and Valocchi, A.J. [1982] Movement of Organic Contaminants in Groundwater:Implications for Water Supply, J. AWWA, 74, pp. 408-413.
Rogers, R.D. and McFarlane, S.C., 1981, Environmental Monitoring and Assessment, 1, pp. 155-162.
Roop R.K., Hess R.K., Akgerman A. (1989) Supercritical Extraction of Pollutants from Water and Soil, InSupercritical Fluid Science and Technology, ACS Symposium Series #406, Ed. Johnston K.P. and Penninger J.M.L.,Ch. 29, p468-476.
Roy, W.R. and Griffin, R.A., Mobility of Organic Solvents in Water Saturatd Soil Materials, Environmental GeologyWater Science, 7[1985], pp. 241-247.
Rubin, H. and Mechrez, E., Transport of Organic Pollutants in a Multiphase System, in Toxic Organic Chemicals inPorous Media, Springer-Verlag, New York, New York, USA, pp. 231-250 [1989].
Saito N., Ilkushima Y, Goto T. (1990) Liquid/Solid Extraction of Acetylacetone Chelates with Supercritical CarbonDioxide, Bull. Chem. Soc. Jpn., 63:1532-1534.
Sakoda, A., Kawazoe, K. and Suzuki, M. 1987, Water Res, 21, 6, pp. 717-722.

soil_overview_03.wpd Page 68 of 70
Salb, A. [1996] Personal Communication with attendees of the 11th Annual Conference on Soil Remediation,Association for Environmental Health of Soils, Amherst, MA., October.
Schwille, F. [1984] Migration of Organic Fluids Immiscible with Water in Pollutants in Porous Media: TheUnsaturated Zone between Soil Surface and Groundwater , edited by B. Yaron, G. Dagan and J. Goldschmid, pp. 27-48.
Schwille, F. [1988] Dense Chlorinated Solvents in Porous and Fractured Media, Lewis, Chelsea, Mich., 146p.
Schwille, F. [1981] Groundwater Pollution in Porous Media by Fluids Immiscible with Water. Science of the TotalEnvironment, 21:173-185.
Seip, H.M., Alstad, J., Carlberg, G.E., Martisen, K. and Skaane, R. 1986, Sci. Total Environ., 50, pp. 87-101.
Shen, J., and Bartha, R. [1994] On-site bioremediation of soil contaminated by No. 2 fuel oil. InternationalBiodeterioration and Biodegradation, 33:61-72.
Shewfelt, K. and Zytner, R.G. (2001) The Effects of Nitrogen Source and Supply on Bioventing of Gasoline ContaminatedSoil, NGWA Conference on Petroleum Remediation, Houston, TX, Nov., pp. 265-272.
Short, T.E. 1985, Modelling of Processes in the Unsaturated Zone, in Land Treatment: A Hazardous Waste ManagementAlternative, edited by R.C. Loehr and J.F.Malina, USEPA, 369p.
Smith, M., Stiver, W.H., and Zytner, R.G. 1994. The Effect of Varying Water Content on Passive Volatilization ofGasoline from Soil. Proc. of the 49th Annual Purdue Industrial Waste Conference, West Lafayette, IN., May 9-11.
Sparrevik, M. and Breedveld, G.D. [1997] In Situ Bioventing of Oil Contaminated Soil in Cold Climates, NorwegianGeotechnical Institute Oslo Norway, 0078-1193, 6p.
Spencer, W.F., Farmer, W.J. and Jury, W.A. 1982. Behavior of Organic Chemicals at Soil, Air, Water Interfaces asRelated to Predicting the Transport and Volatilization of Organic Pollutants. Environmental Toxicology and Chemistry,1: 17-26.
Steinhart, A. L. [1995] Biodegradation Studies of Hydrocarbons in Soils by Analysing Metabolites Formed.Chemosphere. 30[5]:855- 868.
Stinson, M. K. (1989) EPA site demonstration of the terra vac in situ vacuum extraction process in GrovelandMassachusetts. J. Air Pollution Control Assoc., 39 (8):1054-1062.
Stiver, W.H., Shiu, W.Y. and Mackay, D. [1989] Evaporation Times and Rates of Specific Hydrocarbons in Oil Spills,Environ. Sci. and Technol., 23:101-105.
Stuart, B.J., Bowlen, G.F. and Kosson, D.S., Competitive Soprtion of Benzene, Toluene, and Xylenes onto Soil, Environ.Progress, 10[1991], pp. 104-109.
Sturman, P.J., Stewart, P.S., Cunningham, A.B., Bouwer, E.J., Wolfram, J. H. [1995] Engineering scale-up of in situbioremediation processes: a review. J. Contaminant Hydrology, 19: 171-203.
Systat [1993]SYSTAT 5.02 for Windows, SYSTAT, Inc., 1800 Sherman Avenue, Evanston, Illinois 60201, U.S.A.
SYSTAT (1992) A Statistical Analysis Package for Windows, Ver. 5.02, by Systat Inc. Evanston, IL.
Tchobanoglous, G. and Schroeder, E.D. [1987] Water Quality, Addison-Wesley, Toronto, ON, 768p.
Thomson, N.R., Graham, D.N. and Farquhar, G.J. 1992, One-dimensional Immiscible Displacement Experiments, J ofContaminant Hydrology, 10[197-223].

soil_overview_03.wpd Page 69 of 70
Thorstenson D.C. and Pollock D. W. (1989) Gas transport in unsaturated zones: Multicomponent systems and theadequacy of Fick’s Laws, Water Resour. Res., 25 (3), 477-507.
Thorton, J.S. and Wooton, W. [1982] Venting for the removal of hydrocarbon vapours from gasoline contaminated soil,J. Environ. Sci and Health., A17[1]: 31-44.
U.S. EPA. 1982, Determination of the Quality of Groundwater Supplies, SRI Final Report, U.S EPA. Contract 68-3-31.
USEPA, 1988. Rules and Regulations Underground Storage Tank Management, December.
Van Rosenburg, D. U., (1969). Methods for the numerical solution of partial differential equations. Farrar, Tulsa, Okla.
Verschueren, K., Handbook of Environmental Data on Organic Chemicals , 2nd Edition, Van Nostrand ReinholdCompany, New York, New York, USA, 1310p [1983].
Walker, T.J, [1984] Fate and Disposition of Trichloroethylene in Surface Soils, Ph.D. Dissertation, Purdue University,350 p.
Walworth, J.L. and Reynolds, C.M. (1995). Bioremediation of a petroleum-contaminated cryic soil: effects ofphosphorus, nitrogen, and temperature. J. Soil Contamination, 4(3):299-310.
Wang, X., Yu, X., and Bartha, R. [1990] Effect of bioremediation on polycyclic aromatic hydrocarbon residues in soil,Environmental Science and Technology, 24:1086-1089.
Whitehead, D.C., and Raistrick, N. (1990). Ammonia volatilization from five nitrogen compounds used as fertilizersfollowing surface application to soils. J. Soil Science, 41(3):387-394.
Whitman, M. (2002) Water/Noncovalent Interactions/ pH/ buffers.http://www.cm.utexas.edu/academic/courses/Fall2001/H339K/Hackert/Water/Water_ch4.pdf
Widrig, D. L., & Manning, J. F. Jr. (1995). Biodegradation of no.2 diesel fuel in the vadose zone: a soil column study.Environmental Toxicology and Chemistry, 4(11):1813-1822.
Wilhoit, R. L. and Zwolinski, B. J. (1971) Handbook of Vapor Pressures and heats of Vaporizatioin of Hydrocarbonsand Related Compounds, Texas A&M University Thermodynamics research Centre, American Petroleum Institute.
Wilkins, M.D., Abriola, L.M. and Pennell, K.D. [1996] An experimental investigation of rate-limited nonaqueous phaseliquid volatilization in unsaturated porous media: Steady state mass transfer, Water Res. Res, 31[9]: 2159-2172.
Wilson, D. 1995. Modeling of In-Situ Techniques for Treatment of Contaminated Soils: Soil Vapour Extraction, Sparging,and Bioventing. Technomic Publishing, Lancaster.
Wilson, J.L. and Conrad, S.H. 1984, Is Physical Displacement of Residual Hydrocarbons a Realistic Possibility in AquiferRestoration? Proceedings of NWWA/API Conference on Petroleum Hydrocarbons and Organic Chemicals in GroundWater, Worthington, Ohio, PP. 274-298.
Wrenn, B.A., Haines, J.R., Venosa, A.D., Kadkhodayan, M. and Suidan, M.T. (1994) Effects of nitrogen source on crudeoil biodegradation, J of Industrial Microbiology, 13:279-286.
Wrenn, B.A., J.R. Haines, A.D. Venosa, M. Kadkhodayan, M.T. Suidan. (1994) Effects of nitrogen source on crude oildegradation. Journal of Industrial Microbiology 13: 279-286.
Wu S.-C., and Gschwend P.M. (1986) Sorption Kinetics of Hydrophobic Organic Compounds to Natural Sedimentsand Soils, Environ. Sci. Technol., 20:717-725.
Xu, J.G., Johnson, R.L., Yeung, P.Y. and Wang, Y. (1995). Nitrogen transformations in oil-contaminated,

soil_overview_03.wpd Page 70 of 70
bioremediated, solvent-extracted and uncontaminated soils. Toxicological and Environmental Chemistry,47(1):109-118.
Yang, X., Erickson, L.E., Fan, L.T. [1995] A study of the dissolution rate-limited bioremediation of soils contaminatedby residual hydrocarbons. J. Hazardous Materials , 41:299-313.
Zalidis, G.C., Annable, M.D., Wallace, R.B., Hayden, N.J. and Voice, T.C. [1991] A laboratory method for studyingthe aqueous phase transport of dissolved constituents from residually held NAPL in unsaturated soil columns, J.Contam. Hydrol., 8:143-156.
Zhu, J.L., Parker, J.C., Katyal, A.K., Kremesec, V.J., Hockman, E.L. and Gallagher, M.N. [1991] Effects of Delays inRecovery Systems Startup on Product Recovery at Hydrocarbon Spill Sites in Proceedings of PetroleumHydrocarbons in Groundwater , pp. 157.
Zoeteman, B.C.J. De Greef, E. and Brenhmann, F.J.J. [1981] The Sci. of the Total Env, 21:187-202.
Zwolinski, B.J., and Wilhoit, R.C. [1971] Handbook of Vapor Pressures and Heats of Vaporization of Hydrocarbonsand Related Compounds, API44-TRC Publications in Science and Engineering, College Station, Texas.