organic matter in large turbid rivers: the huanghe and its estuary
TRANSCRIPT
Marine Chemistry, 38 (1992) 53-68 53 Elsevier Science Publishers B.V., Amsterdam
Organic matter in large turbid rivers: the Huanghe and its estuary
Shuo Zhang ~, Wei-Bin Gan b and Venugopalan Ittekkot a alnstitute of Biogeochemistry and Marine Chemistry, University of Hamburg, Bundesstrafle 55,
D-2000 Hamburg 13,Germany bDepartment of Chemistry, Tianjin University, Tianjin, People's Republic of China
(Received 21 January 1991; revision accepted 10 October 1991 )
ABSTRACT
Zhang, S., Gan, W.-B. and Ittekkot, V., 1992. Organic matter in large turbid rivers: the Huanghe and its estuary. Mar. Chem., 38: 53-68.
To investigate the pattern of organic matter transport in large turbid rivers, we analyzed water samples from the Huanghe river and its estuary during the dry and wet seasons in 1987 for particulate and dissolved organic carbon (POC and DOC), sugars and amino acids. The dry season was charac- terized by POC contents of 1.5-9.1% of the total suspended matter (TSM), and particulate sugar and amino acid concentrations of 140-490/ag 1 -~ and 560-1270 pg 1 -~ respectively. Of total POC, 24- 46% was contributed by amino acids and sugars. During the wet season, POC contents were 0.6-1% of TSM; concentrations of sugars and amino acids were, respectively, 290-8660 #g I- i and 690- 11 560 pg 1- i, and their contributions to POC varied from 9 to 18%. DOC varied from 3.2 to 4.5 mg 1- l during the dry season and from 5.0 to 8.5 mg 1- l during the wet season. The corresponding con- centrations of dissolved sugars and amino acids were, respectively, 50-260 #g 1- l and 20-530 fig 1-1 during the dry season and 150-500/ag 1-t and 75-720 pg 1-m during the wet season. Together they contributed 1.1-6.2% to DOC during the dry season and 1.6-9.4% during the wet season. The spectral distribution of sugars and amino acids suggests transport of relatively fresh, autochthonous organic matter during the dry season, and of microbially reworked, soil-derived organic matter during the wet season. Thus, despite its highly turbid nature, the organic matter transport characteristics of the Huanghe are similar to those previously reported for other major world rivers. Annually, the Huanghe transports 6.1 X 10¹² g of POC and 0.2 × 10¹² g of DOC, of which about 17% and 3.0% respectively can be accounted for by sugars and amino acids.
INTRODUCTION
Rivers transport annually to the oceans about 500 × 1012 g of organic car- bon, about half of which occurs in particulate form (Spitzy and Ittekkot, 1991 ). Understanding the nature of this organic matter is of importance, as
Correspondence to: V. Ittekkot, Institute of Biogcochemistry and Marine Chemistry, University of Hamburg, BundesstraBe 55, D-2000 Hamburg 13, Germany.
0304-4203/92/$05.00 © 1992 Elsevier Science Publishers B.V. All fights reserved.

5 4 ~, ZH,~Nli EF &l
it participates in a wide range of biogeochemical processes which control the cycling of elements in rivers, estuaries and coastal seas. Riverine organic mat- ter also serves as a food source for heterotrophic organisms in rivers and es- tuaries (Van Es and Laane, 1982). Among the major world rivers, informa- tion on seasonal variations in the nature of organic matter is available, tbr example, from the Amazon (Hedges et al., 1986), the Indus (Ittekkott and Arain, 1986), and the Ganges and Brahmaputra (Ittekkot et al., 1985 ), which shows that ( 1 ) carbohydrates, amino acids and lignin-derived material form part of the riverine organic matter, and (2) their contribution to total organic matter exhibits large seasonal variability, with organic matter associated with high sediment discharge periods being less enriched in labile constituents such as carbohydrates and amino acids. Measurements of these labile constituents allow us to determine the amount of organic matter which might be utilized by heterotrophs within the rivers and estuaries, and to quantify the organic matter which might ultimately escape to the sea.
We report here on the nature of organic matter in the Huanghe river in the People's Republic of China, which is one of the largest turbid rivers of the world. Annually, the river transports more than one billion tons of sediments, which ranks it second among world rivers (Pang and Si, 1980). Although some data are available on trace metals, nutrients and phytoplankton distri- bution in the Huanghe estuary (e.g. Zhang et al., 1988; Turner et al., 1990), practically nothing is known about the nature of organic matter transported by the river. Our study thus represents the first of its kind for the Huanghe river.
We analyzed the organic carbon and its labile constituents, sugars and amino acids, in dissolved and particulate fractions of samples collected from the river and its estuary during the dry and wet seasons in 1987. Sugars and amino acids comprise 40-80% of the organic matter in most organisms and, as a consequence, constitute a large fraction of the organic input into aquatic sed- imentary environments (e.g. Degens and Mopper, 1976 ). Distribution of these constituents has been found to provide information on sources and biogeo- chemical processes affecting the nature and cycling of organic matter (Laane, 1983; Cowie and Hedges, 1984; Ittekkot et al., 1985; Liebezeit, 1987 ).
MATERIALS AND METHODS
The Huanghe river
The Huanghe river (Yellow River) is 5464 km long and originates in the Qinghai Province at an altitude of 4300 m. After flowing through the Loess Plateau, the Huanghe enters the Bohai Sea (Fig. l ). Its total drainage area is 752 400 km 2 and has a continental climate: i t is humid in its south-eastern section, subarid in the central section and arid in the north-western basin

ORGANIC MATTER IN THE HUANGHE AND ITS ESTUARY 5 5
.3,.~o ".3° ? ' ( ~ ,. / /' : ' ) . -,-)
~ , . ~ ...~-~X, "~ '~ ' ~'~'C;I - \~llX k
; / / i ' ~ 19
Fig. 1. Sampling stations along the Huanghe river and its estuary, 1987.
(Yuan, 1984). The hydrology of its catchment basin is characterized by well- defined dry and wet seasons. The wet season starts around July and continues to November. According to Pang and Si (1980), the annual suspended mat- ter discharge (1950-1977) measured about 110 km from the river-mouth, averages 1118 X 1012 g. The corresponding water discharge is 44.28 km 3 ( 1400 m 3 s - l ) . Sediment deposition within the river has been found to induce a progressive elevation of the bottom above the alluvial plain, resulting in a seaward shift of the coastline that averages 3 km year- l (1968-1983 ); this corresponds to a land area prograding at a rate of 38.8 km 2 year - ~ (Liu, 1986 ).
S a m p l i n g
We sampled the river twice during 1987, the first time during the dry sea- son and the second during the wet season. These sampling periods are char- acterized, respectively, by low and high water and sediment discharge (Table 1 and Fig. 1 ). In the dry season, water discharge was very low (about 150 m 3 s- ~ ) and the water level in the estuarine area was less than 1 m. At Stations l-11 surface samples were taken by a bucket at intervals of about 4-7 km over a total length of 54 kin. Salinities increased from 0.35 to 0.49%0 from Station 1 to Station l0 and to 4.62%0 at Station 1 l, about 18 km from the river-mouth, indicating the influence of seawater (Table 1 ). Further sam- pling in higher-salinity areas was not possible.
In the wet season, surface and bottom samples were collected simultane- ously during flood, at nine locations, from anchored ships along the estuary (Stations 12-20, Fig. 1 ). Salinities increased downstream from less than 0.5%0 (Station 12) to more than 27%0 (Stations 19 and 20). Salinity data from the wet season showed that the freshwater end-member of the river (Stations 12-

'FABLE 1
Results of organic geochemical analyses from samples in the dr), and wet seasons
Station Date S TSM DOC DCHO DCHOC DAA DAAC LDO(' POC no. ( % ) (gl J) (mgl - t ) (~zgl -n) (%) (#gl - I ) (%) (%) (%)
1 30May 0.35 0.030 4.2 211 2.0 88 0.9 29 6.1~) 2 30 May 0.42 0.027 4.0 73 0.7 533 5.5 6.2 7.07 3 30 May 0.39 0.021 3.4 48 0.6 260 3.1 3.7 9.07 4 30May 0.43 0.019 3.8 64 0.7 257 2~7 3.4 8.06 5 30 May 0.44 0.020 3.4 72 0.8 44 0.6 14 8.96 6 30May 0.51 0.026 3.4 79 0.9 17 0.2 1.1 7.47 7 31 May 0.43 0.074 3.2 53 0.7 231 2.8 3.5 3.05 8 31 May 0.42 0.032 3.5 101 1.2 67 0.8 2.0 6.78 9 31 May 0.46 0.070 3.2 116 1.5 119 1.8 3.3 ~.~6
10 31 May 0.49 0.122 3.4 176 2.1 70 0.9 3.0 1.52 11 31 May 4.62 0.011 4.5 259 2.3 226 2.2 4.5 6.37 12 11 Sept. 0.49 9.51 5.0 164 1.3 562 5.0 6.3 0.76 13 l lSept . 0.49 9.60 8.1 220 1.1 616 3.4 4.5 0.76 14 11 Sept. 0.51 9.74 5.7 195 1.4 75 0.6 2.0 0.66 15 11 Sept. 0.49 9.61 7.6 161 0.8 129 0.8 1.6 0.60 16 11 Sept. 0.48 9.24 8.5 503 2.4 108 0.6 2.9 0.64 17 11 Sept. 5.08 4.61 6.4 320 2.0 135 0.9 2.9 0.83 18 11 Sept. 25.32 3.94 5.0 366 2.9 724 6.5 9.4 0.94 19 l lSept . 27.31 2.51 7.0 431 2.5 534 3.4 5.9 0.95 20 11 Sept. 27.70 0.48 5.8 152 1.0 398 3.1 4.1 0.99
Salinity (S), total suspended matter concentration (TSM), dissolved and particulate organic carbon (DOC and POC ), sugars (DCHO and PCHO), amino acids (DAA and PAA) and particulate amino sugars (PAS). Contributions of dissolved sugars and amino acids to DOC (DCHOC, DAAC; L D O C = D C H O C + D A A C ) , and of particulate sugars, amino acids and amino sugars to POC (PCHOC, PAAC, PASC; LPOC=PCHOC+PAAC+PASC) , particulate nitrogen (PN), contribu- tions of amino acids and amino sugars to PN (PAAN, PASN ), C /N ratios and chlorophyll (Chl) in the Huanghe River and its estuary, 1987.
16 ) is relatively well mixed during this period. The estuary is stratified during the wet season, with the freshwater plume flowing seaward in the surface lay- ers (0-5 m) (Zhang et al., 1990).
Water samples were filtered through 0.45/~m precombusted glass fibre fil- ters (Schleicher and Schiill, Dass'el, Germany, No. 6 vg. 500 °C). The filtrate was fixed with 0.3 ml of saturated HgC12 solution, and the filters were dried at 40 ° C.
Analytical techniques
Dissolved organic carbon (DOC) was determined on a Shimadzu TOC- 10B Total Carbon Analyser (Kyoto, Japan). To remove inorganic carbon, filtered water samples were bubbled with nitrogen after adjustment to pH 2 with phosphoric acid. On subsequent combustion at 800 ° C, the released car- bon dioxide was detected using an IR detector.
Total particulate carbon (PC) and ni trogen (PN) contents were deter- mined on a Carlo Erba (Milan, I ta ly )CHN Analyzer. The particulate organic carbon (POC) was calculated by subtracting the carbonate-carbon (PIC)

ORGANIC MATTER IN THE HUANGHE AND ITS ESTUARY 57
PCHO PCHOC PAA PAAC PAS PASC LPOC PN PAAN PASN C / N Chl (.ug1-1 ) (%) (/2gl - l ) (%) (JLg1-1) (%) (%) (%) (%) (%) ( p g l - ' )
342 7.5 913 22.3 14 0.26 30.1 0.59 70.6 0.62 10.3 5.78 428 9.0 1003 23.4 22 0.39 32.8 0.82 64.2 0.76 8.6 10.53 490 10.3 933 21.8 21 0.37 32.5 0.99 63.4 0.80 9.2 5.88 332 8.7 770 22.4 21 0.45 31.5 0.92 62.3 0.91 8.8 3.80 469 10.5 1041 25.9 25 0.46 36.8 1.16 62.9 0.82 7.7 4.00 451 9.3 858 19.8 23 0.39 29.5 1.03 46.7 0.66 7.3 2.57 342 6.1 1163 23.1 29 0.43 29.6 0.44 52.4 0.70 6.9 5.62 456 8.4 1265 25.9 36 0.55 34.9 0.89 62.9 0.97 7.6 2.81 205 5.2 760 21.4 18 0.38 27.0 0.30 52.8 0.03 7.5 1.81 140 3.1 847 20.4 10 0.18 23.6 0.22 46.0 0.30 6.9 2.20 170 9.8 557 35.3 7 0.35 45.5 0.76 93.9 0.68 8.4 0.26
8645 4.8 11032 6.5 686 0.32 11.6 0.09 17.6 0.62 8.4 - 8218 4.5 11424 6.7 643 0.29 11.5 0.09 17.3 0.58 8.4 - 6428 4.0 11328 7.5 669 0.35 11.9 0.08 19.9 0.66 8.3 - 7198 5.0 11561 8.5 755 0.44 13.9 0.08 20.6 0.76 7.5 - 8667 5.9 11125 7.9 568 0.32 14.1 0.09 17.8 0.53 7.1 - 4089 4.3 6823 7.6 701 0.61 12.5 0.07 29.3 1.69 11.9 - 3499 3.8 7498 8.7 516 0.46 13.0 0.14 18.9 0.73 6.7 - 3210 5.4 6827 12.5 172 0.24 17.9 0.17 21.6 0.31 5.6 -
286 2.4 692 6.3 25 0.18 9.4 0.13 14.9 0.32 7.6 -
from the PC content. PIC ranged from 0.66 to 3.05% in the dry season and from 2.02 to 2.21% in the wet season. The standard deviation of total partic- ulate carbon analyses is better than 1.1%.
Dissolved sugars and amino acids were analyzed after acid hydrolysis of the filtered water samples by liquid chromatography on a Shimadzu Model LC-3A instrument equipped with a fluorescence detector (FLD-I). Hydrol- ysis conditions were 2 N HC1, 100°C and 3.5 h for sugars, and 6 N HC1, 110°C and 22 h for amino acids.
Particulate sugars and amino acids were determined after acid hydrolysis of the suspended sediment in the same way as for dissolved sugars and amino acids on automatic sugar and amino acid analyzers (Pharmacia-LKB, Cam- bridge, UK). Details of the analytical techniques used have been given by Michaelis and Ittekkot (1982). The reproducibility of chromatographic anal- yses is better than 5% for sugars and 15% for amino acids.
Chlorophyll pigments were measured with a Spectral Fluorometer (SFM 25, Kontron AG, Ziirich; EX 430 nm and Em 670 rim) after extracting the particulate matter with a methanol-dichloromethane mixture ( 1:9, v /v ) for

58 s 7H~XN{;~I gi
24 h at - 2 0 ° C (the method was modified after that of Liebezeit and Von Bodungen ( 1987 ) ). Results are expressed as chlorophyll a equivalents.
R E S U L T S
Between 1950 and 1977 about 70% of the annual water discharge in the Huanghe river occurred between July and November of each year (Pang and Si, 1980). This period also accounted for more than 85% of the annual sedi- ment discharge, with average suspended matter concentration of 34 g 1- ~.
During our first sampling period, i.e. in the dry season, the distribution of dissolved inorganic components remained uniform from Station 1 to Station 6, but exhibited variations downstream (Stations 7-11 ) (Table 2). For ex- ample, nitrate and silicate decreased, respectively, from 157/~mol 1-J and 78 /~mol 1- ~ at Station 7 to 98/ tmol 1- ~ and 13/tmol 1- ~ at Station 11. Nitrite increased from 1.19 to 3.23/~mol 1-~. Total suspended matter (TSM) con- centrations ranged from 11 to 122 mg 1-~ (Table 1) and their longitudinal distribution showed the prevalence of a turbidity maximum at Stations 7-10; this is normally a characteristic feature of well-mixed and partially mixed es- tuaries (Dyer, 1979 ). Chlorophyll concentrations decreased downstream from 5.8 #g 1-1 at Station 1 to 0.26 #g 1- ~ at Station 11 (Table 1 ) and were low in the turbidity maximum.
During the second sampling period, i.e. in the wet season, the freshwater- seawater interface was shifted about 20 km further downstream than in the dry season. Salinity increased from Station 12 to Station 17 from 0.49 to 5.08%o, and TSM concentrations decreased from 9.51 to 4.61 g 1-~. Beyond this point, TSM concentrations continued to decrease to a min imum value of 0.48 g 1-1, where salinity of more than 27.7%o was observed.
DOC concentrations during the dry season were between 3.2 and 4.5 mg
TABLE 2
Concentrat ions of silicate (Si [ SiO2 ] ), ni trate (N [ NO3 ] ), nitri te ( N [ NO2 ] ) and phosphate (P [ PO4 ] ) in the dry season
Station Si [ SiO2 ] N [ NO3 ] N [ NO 2 ] P [ PO4 ] no. (/~mol 1- ~ ) (#mol 1- i ) (#mol 1-1 ) (#mot 1- l )
l 86 145 0.68 0.02 2 87 149 0.86 0 3 81 145 0.98 0.03 4 81 185 0.86 0.02 5 79 145 1.05 - 6 81 150 1.19 - 7 78 157 1.19 0.02 8 67 137 1.86 0.05 9 52 139 2.60 -
I0 48 116 2.75 0.02 II 13 98 3.23 0.09

ORGANIC MATTER IN THE HUANGHE AND ITS ESTUARY 59
1- 1, and the corresponding values for dissolved amino acids (DAA) and dis- solved sugars (DCHO) were between 20 and 530 gg 1-1 and 50 and 260/zg 1-1, respectively. DOC and DCHO showed a decrease between Station 1 and Station 7, and an increase towards Station 11. Contributions of DAA and DCHO to the total DOC ranged, respectively, from 0.2 to 5.5% and from 0.6 to 2.3%. Their total contribution to the DOC (labile DOC) varied between 1.1 and 6.2%. The DAA spectra were dominated by the neutral amino acids (glycine, serine and alanine), which accounted for up to 90% of DAA. The DCHO spectra were dominated by glucose, which contributed more than 70% of total DCHO.
Concentrations of DOC, DCHO and DAA were higher during the wet sea- son (Table 1 ). They varied between 5.0 and 8.5 mg l - 1 for DOC, between 75 and 720/zg l - 1 for DAA, and between 150 and 500/zg l - 1 for DCHO. DCHO showed a peak value at Station 16 near the river-sea interface, where salinity was low (0.480/0o), and decreased with increasing salinity towards Station 20.
The POC and PN contents during the dry season were in the range 1.5- 9.1% and 0.2-1.2%, respectively. POC contents were negatively correlated with suspended matter (TSM) concentrations 2 (rpoc/xsM =0.803; P<0.001 ). POC and PN contents were much lower in the wet season, and varied between 0.60 and 0.99% and between 0.07 and 0.17%, respectively. Here too, POC decreased with increasing TSM concentrations 2 (r POC/TS M = 0.818, P < 0.002 ). The C /N ratios of organic matter associated with the TSM were between 6.9 and 10.3 during the dry season, and between 5.6 and 11.9 during the wet season.
During the dry season particulate amino acid (PAA) concentrations were between 560 and 1270 gg 1-1 (Table 1 ). Their spectra were dominated by aspartic acid, glutamic acids, alanine and glycine. The non-protein amino acids, fl-alanine and 7-aminobutyric acid were present in trace amounts (Ta- ble 3). Contributions of PAA to POC varied between 19.8 and 25.9% from Station 1 to Station 10 and increased to 35.3% as salinity increased to 4.62%0. Concentrations of particulate amino sugars (PAS) increased from 14/tg 1-1 at Station 1 to 36 #g 1-1 at Station 8 and decreased downstream to 7 gg 1-1 at Station 11 (Table 1 ). PAS made up 0.18-0.55% and 0.03-0.97% of POC and PN, respectively. Particulate sugars (PCHO) varied from 330 to 490 gg 1- from Station 1 to Station 8, and then decreased to 170 gg 1-1 at Station 11 (Table 1 ); the associated spectra were dominated by glucose, galactose and mannose (Table 4). The molar percentage contribution of glucose to total particulate sugars decreased downstream from 60 to 20%. The contribution of PCHO to the total POC ranged from 7.5 to 10.5% from Station 1 to Station 5, and decreased downstream to 3.1% at Station 10. Subsequently, it in- creased to 9.8% as salinity increased to 4.62%0 (Table 1 ).
During the wet season, PAA and PCHO concentration decreased down- stream from 11 030 to 690 gg 1-1 and from 8650 to 290 #g 1-1, respectively (Table 1 ). PAA spectra were dominated by aspartic acid, glycine, glutamic
(~ I S Zkt~;,N(; V~ X]
TABLE 3
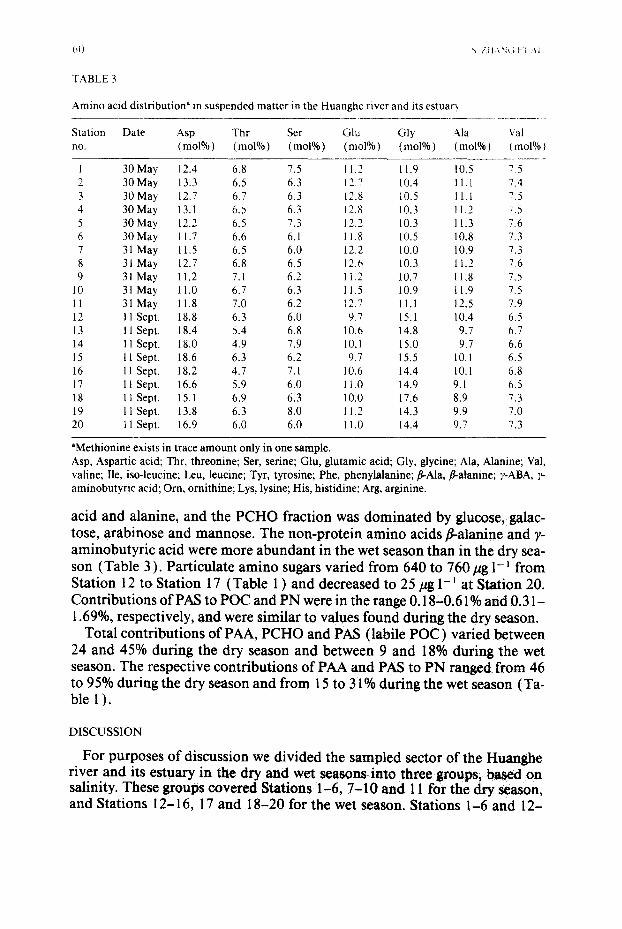
Amino acid distribution" in suspended matter in the Huanghe river and its estuar?
Station Date Asp Thr Ser Glu Gly A.la Val no. (tool%) (mol%) (tool%) (moP/o) (mol%) (mol%) (moP/o)
1 30 May 12.4 6.8 7.5 11,2 11,9 10.5 75 2 30May 13.3 6.5 6.3 12.7 10.4 11,1 7.4 3 30May 12.7 6.7 6.3 12.8 10.5 11.I 7.5 4 30May 13.1 6.5 6.3 12.8 10.3 11,2 7.5 5 30May 12.2 6.5 7.3 12.2 10.3 11.3 7.6 6 30May 11.7 6.6 6.1 11.8 10.5 10,8 7.3 7 31 May 11.5 6.5 6.0 12.2 10.0 10.9 7.3 8 31 May 12.7 6.8 6.5 12.6 10.3 11,2 7.6 9 31 May 11.2 7.1 6.2 11.2 10.7 11,8 7.5
10 31May l l . 0 6.7 6.3 11.5 10.9 11,9 7.5 11 31 May 11.8 7.0 6.2 12.7 11.1 12,5 7.9 12 11 Sept. 18.8 6.3 6.0 9.7 15.1 10.4 6.5 13 11 Sept. 18.4 5.4 6.8 10.6 14.8 9.7 6.7 14 11 Sept. 18.0 4.9 7.9 10°1 15.0 9.7 6.6 15 11 Sept. 18.6 6.3 6.2 9.7 15.5 10,l 6.5 16 11 Sept. 18.2 4.7 7.1 10.6 14.4 10.1 6.8 17 11 Sept. 16.6 5.9 6.0 11.0 14.9 9.1 6.5 18 11 Sept. 15.1 6.9 6.3 10.0 17.6 8.9 7.3 19 11 Sept. 13.8 6.3 8.0 t 1.2 14.3 9.9 7.0 20 l 1 Sept. 16.9 6.0 6.0 11.0 14.4 9.7 7.3
aMethionine exists in trace amount only in one sample. Asp, Aspartic acid; Thr, threonine; Ser, serine; Glu, glutamic acid; Gly, glycine; Ala, Alanine; Val, valine; Ile, iso-leucine; Leu, leucine; Tyr, tyrosine; Phe, phenylalanine; fl-Ala, fl-atanine; 7-ABA, ),- aminobutyric acid; Orn, ornithine; Lys, lysine; His, histidine: Arg, arginine.
acid and alanine, and the PCHO fraction was dominated by glucose, galac- rose, arabinose and mannose. The non-protein amino acids fl-alanine and 7- aminobutyric acid were more abundant in the wet season than in the dry sea- son (Table 3 ). Particulate amino sugars varied from 640 to 760 #g 1- ~ from Station 12 to Station 17 (Table 1 ) and decreased to 25 pg 1 -~ at Station 20. Contributions of PAS to POC and PN were in the range 0.18-0.61% and 0.31- 1.69%, respectively, and were similar to values found during the dry season.
Total contributions of PAA, PCHO and PAS (labile POC ) varied between 24 and 45% during the dry season and between 9 and 18% during the wet season. The respective contributions of PAA and PAS to PN ranged from 46 to 95% during the dry season and from 15 to 31% during the wet season (Ta- ble 1 ).
DISCUSSION
For purposes of discussion we divided the sampled sector of the Huanghe river and its estuary in the dry and wet seasons: into three groups, based on salinity. These groups covered Stations 1-6, 7 -10 and 11 for the dry season, and Stations 12-16, 17 and 18-20 for the wet season. Stations 1-6 and 12-

ORGANIC MATTER IN THE HUANGHE AND ITS ESTUARY 61
Ile Leu Tyr Phe fl-Ala ~ABA Orn Lys His Arg (tool%) (tool%) (tool%) (tool%) (tool%) (tool%) (tool%) (tool%) (tool%) (mol%)
5.1 8.5 2.8 4.4 0.2 0.3 0.5 4.5 1.5 4.4 4.5 7.2 2.8 4.4 0.1 0.2 0.1 5.0 1.4 6.6 4.4 7.3 2.8 4.5 0.2 0.2 0.1 5.0 1.4 6.5 4.4 7.2 2.8 4.5 0.2 0.2 0.1 5.0 1.3 6.6 4.4 7.4 2.9 4.5 0.2 0.2 0.4 4.7 1.4 5.9 4.9 8.0 2.6 4.4 0.2 0.2 0.1 5.4 1.5 7.7 4.8 7.9 2.7 4.2 0.2 0.2 0.1 5.7 1.6 8.1 4.5 7.2 2.8 4.4 0.2 0.2 0.2 5.1 1.2 6.6 4.7 7.7 2.6 4.1 0.3 0.4 0.2 5.4 1.6 7.4 4.7 7.6 2.6 3.9 0.6 0.4 0.2 5.7 1.5 7.1 4.3 7.0 2.9 4.1 0.2 0.2 0. I 4.7 1.4 5.9 3.6 6.0 0.5 2.7 4.2 2.5 0 3.6 1.3 2.9 3.7 6.4 0.6 3.1 4.3 2.7 0.5 4.0 1.0 1.3 3.6 6.2 0.6 3.0 4.3 1.6 0.9 4.0 1.4 2.5 3.6 6.0 0.4 2.7 4.2 1.7 0.4 3.7 1.2 3.0 3.7 6.4 0.5 3.1 4.4 1.9 0.5 3.9 1.0 2.7 3.6 6.4 0.5 2.9 4.2 2.6 0.5 4.2 1.3 3.6 4.1 6.7 1.0 3.0 2.8 1.6 0.2 4.0 0.8 3.8 4.8 7.7 1.8 3.9 1.4 0.5 0.8 4.2 0.9 3.4 4.2 6.7 0.5 3.3 3.6 2.3 0.4 4.1 0.6 2.8
TABLE 4
Monosaccharide distribution in suspended matter in the Huanghe river and its estuary
Station Date Rha Rib Man Fru Ara Fuc Gal Xyl Glc no. (mol%) (mol%) (tool%) (tool%) (tool%) (mol%) (tool%) (tool%) (mol%)
1 30May 5.7 0.8 9.3 2.3 2.1 2.9 6.9 2.6 67.4 2 30 May 2.4 1.3 7.6 3.3 0.7 1.5 7.9 1.8 73.6 3 30 May 2.6 1.2 9.6 3.0 1.2 2.5 8.5 2.6 68.9 4 30 May 2.8 1.5 10.2 3.3 1.1 1.7 9.6 2.3 67.7 5 30May 3.7 2.5 5.3 5.0 1.3 2.4 10.0 2.1 67.7 6 30 May 5.4 1.7 7.1 6.3 4.1 6.7 12.4 3.5 52.8 7 31 May 3.1 0.7 10.6 5.9 1.4 3.5 12.7 2.2 59.8 8 31 May 5.5 1.5 16.3 6.4 1.4 1.7 7.9 4.9 54.3 9 31 May 6.8 1.5 11.4 8.3 5.0 4.4 14.0 4.8 43.9
l0 31 May 9.3 2.9 13.8 8.4 2.8 12.0 18.9 4.9 26.9 II 31 May 8.9 3.5 18.1 7.9 5.5 l l .3 20.5 5.0 19.3 12 l l Sept. 5.1 1.0 12.2 5.0 20.7 4.0 26.0 5.8 20.3 13 11 Sept. 7.3 1.3 11.0 4.9 16.9 0 26.4 3.9 28.3 14 ! 1 Sept. 6.8 1.4 11.8 4.4 14.1 3.0 25.0 4.6 29.0 15 11 Sept. 8.8 0.8 16.2 3.5 13.0 2.2 20.8 5.0 29.6 16 !1 Sept. 6.0 1.0 12.4 4.5 19.5 3.3 23.9 6.5 22.8 17 11 Sept. 11.2 4.4 12.2 3.8 14.1 4.5 18.9 5.4 25.5 18 11 Sept. 5.4 2.3 13.2 4.2 11.8 0 21.0 5.3 36.9 19 11 Sept. 6.0 2.1 i l .0 3.3 10.7 4.0 18.0 5.8 39.0 20 11 Sept. 6.7 3.2 15.2 6.6 8.5 5.6 17.4 9.8 27.0
Rha, Rhamnose; Rib, ribose; Man, mannose; Fru, fructose; Am, arabinose; Fuc, fucose; Gal, galactose; Xyl, xyiose; Glc, glucose.

16 have salinities of less than 1%o, and thus represent areas not influenced by seawater. Stations 11 and 17, with salinities of about 5%o, represent brackish- water environments. The seawater-dominated region is represented by Sta- tions 18-20, where salinities exceeded 25%0. The area covered by Stations 7- 10, though it falls within the river end-member, is treated separately because of the observed turbidity maximum there.
In the following, data obtained from these three areas are discussed in terms of the nature and probable sources of organic matter. For this, we use differ- ences in the contribution of amino acids (AA) and sugars (CHO) to total organic carbon and nitrogen, as well as the ratios of individual monomers within the sugar and amino acid spectra, as these parameters have been used previously by several authors (e.g. Degens and Mopper, 1976; Cowie and Hedges, 1984; Ittekkot and Arain, 1986 ).
Briefly, higher contributions of PAA and PCHO to POC are indicative of relative freshness of organic matter (i.e. it is less biodegraded). The ratios of aspartic and glutamic acids and their respective decarboxylation products, fl- alanine and y-aminobutyric acid, are also indicators of the relative freshness of organic matter, with lower ratios indicating a higher degree of microbial reworking. Although amino sugars (glucoseamine and galactoseamine) are enriched in zooplankton relative to amino acids they are also important con- stituents of soil organic matter. Lower ratios of AA to amino sugars (AS) have been used as indicators of the contribution from soil organic matter in environments where predominant inputs from zooplankton can be excluded. The bacterial contribution to organic matter should exhibit glucoseamine/ galactoseamine ratios (GleN/GaIN) of less than four as such values are typ- ical for cell walls of various bacterial species (e.g. Reistad, 1975; Kandler, 1979). Lower ratios of AA/AS and of hexose/pentose in a sample indicate higher inputs from allochthonous (e.g. soils) than from autochthonous (in situ aquatic production) sources.
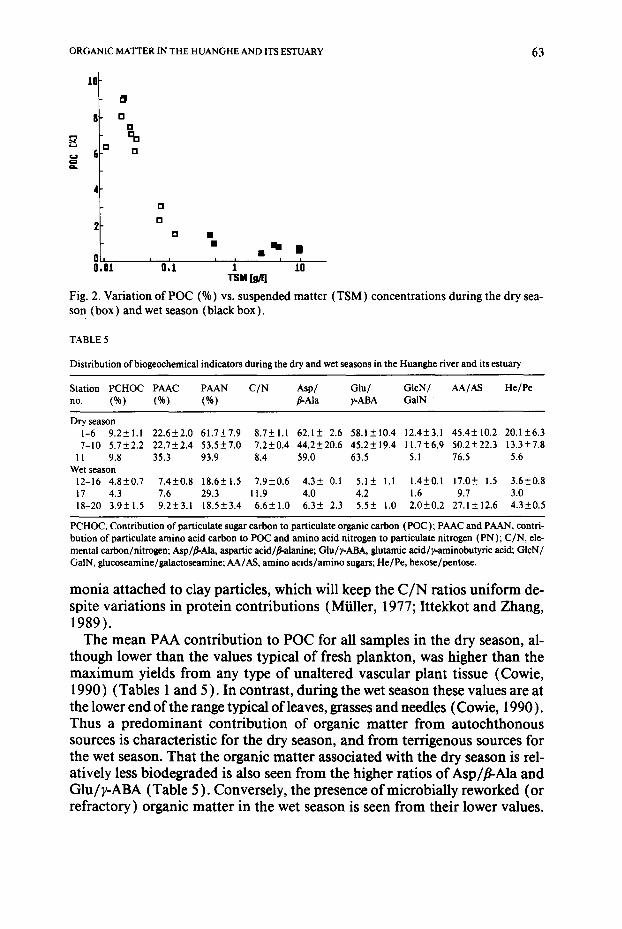
POC contents, as well as the contributions of PCHO and PAA to POC, were high in the dry season (low sediment load period), and low in the wet season (high sediment load period), as has been observed in other rivers (e.g. Ittek- kot, 1988 ). The observed significant negative correlation between POC con- tent and TSM concentrations may result from the dilution of both allochthon- ous (plants and woody materials) and autochthonous (riverine plankton) organic matter by mineral matter derived from rock and soil erosion in the drainage area (Meybeck, 1982) (Fig. 2). In the wet season, low chlorophyll concentrations (less than 0.1 ~g l - t ) further suggest that the contribution from riverine biological production was also low, probably because of high turbidity and the resulting reduced light penetration (e.g. Thurman, 1985 ).
These differences are not seen, however, in the C /N ratios, which were rel- atively uniform and were independent of the protein contents of the samples in both the dry and wet seasons (Table 1 ). Such behavior in the C/N ratios may be due to varying contributions from inorganic nitrogen, such as am-
ORGANIC MATTER IN THE HUANGHE AND ITS ESTUARY 63
E
10
8
4
O
O t3 %
[]
[]
o [] •
0 I I I o,ol o,l 1 ' f i )
TSM
Fig. 2. Variat ion o f POC (%) vs. suspended matter (TSM) concentrat ions during the dry sea- son ( b o x ) and wet season (black box) .
TABLE 5
Distribution of biogeochemieal indicators during the dry and wet seasons in the Huanghe fiver and its estuary
Station PCHOC P A A C PAAN C/N Asp/ Glu/ GIcN/ AA/AS He/Pe no. (%) (%) (%) fl-Ala y-ABA GaiN
Dry season I-6 9.2_+1.1 22.6__.2.0 61.7+_7.9 8.7_+1.1 62.1+_ 2.6 58.1+_10.4 12.4_+3.1 45.4__.10.2 20.1+_6.3 7-10 5.7+_2.2 22.7_+2.4 53.5__.7.0 7.2__.0.4 44.2_+20.6 45.2_+19.4 11.7_+6.9 50.2_+22.3 13.3_+7.8
11 9.8 35.3 93.9 8.4 59.0 63.5 5.1 76.5 5.6 Wet season
12-16 4.8+0.7 7.4+0.8 18.6+1.5 7.9+0.6 4.3+ 0.1 5.1+ 1.1 1.4+0.1 17.0+ 1.5 3.6+0.8 17 4.3 7.6 29.3 11.9 4.0 4.2 1.6 9.7 3.0 18-20 3.9+1.5 9.2+3.1 18.5+3.4 6.6+1.0 6.3+ 2.3 5.5+ 1.0 2.0+0.2 27.1+12.6 4.3+0.5
PCHOC, Contribution of paniculate sugar carbon to paniculate organic carbon (POC); PAAC and PAAN, contri- bution of paniculate amino acid carbon to POC and amino acid nitrogen to paniculate nitrogen (PN); C/N, ele- mental carbon/nitrogen; Asp/~Ala, aspartie acid/~-alanine; GIu/y-ABA, glutamic acid/~-aminobutyfic acid; GlcN/ GAIN, glucoseamine/galactoscamine; A/t/AS, amino acids/amino sugars; He/Pe, hexose/pentose.
monia attached to clay particles, which will keep the C / N ratios uniform de- spite variations in protein contributions (Miiller, 1977; Ittekkot and Zhang, 1989).
The mean PAA contribution to POC for all samples in the dry season, al- though lower than the values typical of fresh plankton, was higher than the maximum yields from any type of unaltered vascular plant tissue (Cowie, 1990) (Tables 1 and 5 ). In contrast, during the wet season these values are at the lower end of the range typical of leaves, grasses and needles (Cowie, 1990 ). Thus a predominant contribution of organic matter from autochthonous sources is characteristic for the dry season, and from terrigenous sources for the wet season. That the organic matter associated with the dry season is rel- atively less biodegraded is also seen from the higher ratios of Asp/fl-Ala and Glu/y-ABA (Table 5 ). Conversely, the presence of microbially reworked (or refractory) organic matter in the wet season is seen from their lower values.

~4
Furthermore, the low ratios of AA/AS and of hexose/pentose during the wet season show that this input is mostly from soils derived from decaying plato litter. The associated low ratios of GlcN/GalN would then indicate a contri- bution also from soil bacterial biomass.
A deviation from these general trends occurs in samples collected from the turbidity maximum within the dry season (Stations 7-10). There, the de- creases of Asp/fl-Ala and Glu/),-ABA ratios suggest relative enrichment in biodegraded organic matter, probably derived from resuspension of previ- ously deposited sediments (Table 5 ).
Comparison of the data from these two periods suggests that during the wet season the influence of highly biodegraded organic matter derived from ter- restrial sources can be traced towards regions of higher salinities. For exam- ple, the contribution from PAA and PCHO to total POC, and the ratios of
50
40
~0
20
~, 10
i • 0
i j ~F IH ll~ I H t J I j IA IS I 0 IN 1D t
1 9 5 0 - 1977
50
4O
~ 2o
~ 10
J F I1 A H J J A S 0 H O
1 9 6 0 - 1966
Fig. 3. Mean monthly discharge (Q) a n d s u s p e n d e d matter concentrations (TSM) in the Huanghe river (a)between 1950 and 1977 (Pang and Si, 1980), and (b)between 1980 and 1986 (The Huanghe Conservancy Committee, 1986). Arrows indicate the sampling time in 1987.

ORGANIC MATTER IN THE HUANGHE AND ITS ESTUARY 65
TABLE6
Transport rates of suspended material, and of dissolved and particulate organic carbon from the Huanghe river to the Bohai Sea (based on water and sediment discharge data from 1980 to 1986 (The Huanghe Conservancy Committee, 1986) and organic matter data from the river end-member sam- ples (Stations 1-10 in the dry season and Stations 12-16 in the wet season)
Dry Wet Total World % World
Q (km 3) 8.3 23.8 32.1 37384 a 0.09 Q (% of total) 25.9 74.1 100 TSM (Tg) 25 656 681 15000 a 4.5 TSM (% of total) 3.3 96.7 100 Average TSM (gl -~ ) 2.1 19.2 POC (%) 6.0 + 2.8 0.7 + 0.07 POC (Tg) 1.5 + 0.7 4.6 + 0.5 6.1 222 b 2.7 LPOC (%) 30.8+3.8 12.6+ 1.3 LPOC (Tg) 0.5+0.1 0.6+0.1 1.1 C/N 8.1 + 1.1 7.9+0.9 PN (%) 0.7+0.3 0.1 +0.01 PN (Tg) 0.2+0.1 0.6+0.07 0.8 33.3 c 2.3 PAAN (%) 58.4+8.3 18.6+ 1.5 PAAN (Tg) 0.1 +0.02 0.1 +0.01 0.2 7.3 3.0 DOC (mg 1 -I ) 3.6__. 0.3 7.0_+ 1.5 DOC (Tg) 0.03_+0.002 0.2_+0.03 0.20 LDOC (%) 3.1 _+ 1.4 3.5+ 1.9 LDOC (Tg) 0.001 0.005 -+0.003 0.006
aFrom Meybeck (1982) after correction for the Huanghe Q and TSM load data. bFrom Ittekkot (1988) after correction for the Huanghe TSM load data. CFrom Ittekkot and Zhang (1989). POC (%), Particulate organic carbon as percentage of total suspended matter; POC (Tg), amount of POC transport (in Tg); LPOC (%), contribution of labile particulate organic matter carbon to POC (%) ( including amino acid, amino sugar and sugar carbon ); LPOC (Tg), amount of LPOC transport (in Tg); C/N, elemental particulate carbon and nitrogen ratios; PN (%), particulate nitrogen as a percentage of total suspended matter; PN ( Tg ), amount of PN transport (in Tg); PAAN (%), contri- bution of amino acid nitrogen to PN, as a percentage; PAAN (Tg), amount of amino acid nitrogen transport (in Tg); DOC, dissolved organic carbon (mg 1- ~ ); DOC (Tg), amount of DOC transport (in Tg); LDOC (%), contribution of labile dissolved organic matter carbon to DOC (as a percent- age); LDOC (Tg), amount of LDOC transport (in Tg).
individual monomers within the sugar and amino acid spectra exhibit no sig- nificant variations throughout the river-sea transect sampledby us (Stations 12-20).
Transport rates of organic carbon and nitrogen
Because of the sampling techniques employed here, and of the possible ver- tical and lateral variations in suspended and dissolved loads along the course of a river (see e.g. Curtis et al., 1979 ), we used previously reported water and sediment discharge data for the calculation of transport rates of organic mat-
ter. According to these data, average annual sediment discharge from ! 950 to 1986 showed a continuous reduction for the last few years ( 1980-1986 ) ( from 1320 Tg between 1950 and 1959 to 681 Tg between 1980 and 1986) (The Huanghe Conservancy Committee, 1986) (Fig. 3). This decrease is partly due to sedimentation in the San-Man Gorge Reservoir, about 1000 km up- stream from the Bohai Sea.
To estimate the transport rates we used the average monthly water and sed- iment discharge data (for 1980-1986; The Huanghe Conservancy Commit- tee, 1986 ) from December to May for the dry season, and from June to No- vember for the wet season, and the averages of POC, DOC, PN and their labile components obtained in the freshwater compartment of the Huanghe during the dry and wet seasons in 1987. Annually, 6.1 × 10¹² g of POC is transported by the Huanghe river, of which 18% ( 1.1 × 10¹² g year-~ ) occurs as labile POC (amino acids and sugars) (Table 6 ). The annual PN transport rate is 0.8 X 10¹² g, of which 25% ( 0.2 X 10 J 2 g year-- 1 ) occurs as amino acids. The annual DOC load in the Huanghe is 0.20 × 10¹² g, and about 3.0% of this occurred as labile DOC. The chemical nature of riverine organic matter shows not only seasonal but also interannual variability, and elemental fluxes cal- culated from the analyses of samples collected during a single year may not be representative. However, the chemical characteristics of organic matter observed by us are similar to those previously reported for other major rivers and thus fit the pattern observed globally, The estimated present-day POC transport in the Huanghe is about 3% of the reported global annual riverine POC transport. For DOC, Gan et al. ( 1983 ) gave a flux of 0.54 × 10¹² g year- measured 280 km upstream from the river-mouth, close to Jinan, based on water discharge data for 1982; this result is about twice as high as the values obtained here and indicates a reduction of river input within 5 years.
ACKNOWLEDGMENTS
We thank The Huanghe Conservancy Committee and Ocean University of Qingdao (formerly Shandong College of Oceanology) for collecting samples in the Huanghe estuary, and Professor H.K. Wong for his assistance at Ham- burg University. We also thank the two anonymous reviewers and Professor Wangersky for their comments and criticism of our manuscript. The Federal German Ministry for Research and Technology (BMFT, Bonn) and The Tianjin University (Tianjin, China) provided partial financial support for this study.
REFERENCES
Cowie, O.L., 1990. Marine organic diag~aesis: a comparative study of amino acids, neutral sugars and lignin. Ph.D. Thesis, University of Washington, 189 pp.

ORGANIC MATTER IN THE HUANGHE AND ITS ESTUARY 67
Cowie, G.L. and Hedges, J.I., 1984. Carbohydrate sources in a coastal marine environment. Geochim. Cosmoehim. Acta, 48: 2075-2087.
Curtis, W.F., Meade, R.H., Nordin, Jr., C.F., Price, N.B. and Sholkovitz, E.R., 1979. Non-uni- form vertical distribution of fine sediment in the Amazon River. Nature, 280:381-383.
Degens, E.T. and Mopper, K., 1976. Factors controlling the distribution and early diagenesis of organic material in marine sediments. In: J.P. Wiley and R. Chester (Editors), Chemical Oceanography, Vol. 6. Academic Press, London, pp. 59-113.
Dyer, K.R., 1979. Estuaries and estuarine sedimentation. In: K.R. Dyer (Editor), Estuarine Hydrography and Sedimentation. Cambridge University Press, London, pp. 1-18.
Gan, W.B., Chen, H.M. and Hart, Y.F., 1983. Carbon transport by the Yangtze (At Nanjing) and Huanghe (at Jinan) Rivers, People's Republic of China. In: E.T. Degens, S. Kempe and H. Soliman (Editors), Transport of Carbon and Minerals in Major World Rivers, Part 2. Mitt. Geol. Pal[iontol. Inst. Univ. Hamburg, SCOPE/UNEP Sonderbd., 55: 459-470.
Hedges, J.I., Clark, W.A., Quay, P.D., Richey, J.E., Devol, A.H. and Santos, U. de M., 1986. Compositions and fluxes of particulate organic material in the Amazon River. Limnol. Oceanogr., 31: 717-738.
The Huanghe Conservancy Committee, 1986. Investigation report on water resources in the Huanghe drainage area (in Chinese). Unpublished.
Ittekkot, V., 1988. Global trends in the nature of organic matter in river suspensions. Nature, 332: 436-438.
Ittekkot, V. and Arain, R., 1986. Nature of particulate organic matter in the river Indus, Paki- stan. Geochim. Cosmochim. Acta, 50:1643-1653.
Ittekkot, V. and Zhang, S., 1989. Pattern of particulate nitrogen transport in world rivers. Global Biogeochem. Cycl., 3: 383-391.
Ittekkot, V., Safiullah, S., Mycke, B. and Seifert, R., 1985. Seasonal variability and geochemical significance of organic matter in the River Ganges, Bangladesh. Nature, 317: 800-803.
Kandler, O., 1979. Zellwandstrukturen bei Methan-Bakterien. Naturwissenschaften, 66: 95- 105.
Laane, R.W.P.M., 1983. Seasonal distribution of dissolved and particulate amino acids in the Ems-Dollart estuary. Oceanol. Acta, 6: 105-109.
Liebezeit, G., 1987. Early diagenesis of carbohydrates in the marine environment. I. Sediment trap experiments. In: E.T. Degens, E. Izdar and S. Honjo (Editors), Transport of Carbon and Minerals in Major World Rivers, Part 3. Mitt. Geol. Pai[iontol. Inst. Univ. Hamburg, SCOPE/UNEP Sonderbd., 62: 279-299.
Liebezeit, G. and von Bodungen, B., 1987. Biogenic fluxes in the Bransfield Strait: planktonic versus macroalgal sources. Mar. Ecol., Prog. Set., 36: 23-32.
Liu, F.Y. 1986. Geomorphologic characteristics of delta under the Huanghe estuary. Mar. Sci. Bull., 5: 24-29.
Meybeck, M., 1982. Carbon, nitrogen and phosphorus transport by world rivers. Am. J. Sci., 282: 401-450.
Michaelis, W. and Ittekkot, V., 1982. Biogeochemistry of rivers: Field and analytical tech- niques. In: E.T. Degens (Editor), Transport of Carbon and Minerals in Major World Rivers, Part 1. Mitt. Geol. Pal~iontol. Inst. Univ. Hamburg, SCOPE/UNPE Sonderbd., 52: 69-89.
Miiller, P.J., 1977. C/N ratios in Pacific deep-sea sediments: Effect of inorganic ammonium and nitrogen compounds sorbed by clays. Geochim. Cosmochim. Acta, 41: 765-776.
Pang, J.Z. and Si, S.H., 1980. Fluvial process of the Huanghe River Estuary. In: Proceedings of the UNESCO International Symposium on River Sedimentation, Vol. I. Guang Hua Press, Beijing, pp. 417-426.
Reistad, R., 1975. Amino sugars and amino acids constituents of the cell walls of the extremely halophilic cocci. Arch. Microbiol., 102:71-73.
Spitzy, A. and Ittekkot, V., 1991. Dissolved and particulate organic matter in rivers. In: R.F.C.

6 ~ '~ Z H A N ( ; E'I ~ -~,[
Mantoura, J.M. Martin and R. Wollast (Editors), Ocean Margin Processes in Global (:ha nge. Wiley, New York, pp. 5-17.
Thurman, E.M., 1985. Organic Geochemistry of Natural Waters. Martinus Nijhoff/Dr. W..lunk~ Dordrecht, 497 pp.
Turner, R.E., Rabalais, N.N. and Zhang, Z.N., 1990. Phytoplankton biomass, production and growth limitations on the Huanghe (Yellow River) continental shelf. Continental Shelf Res.. 10: 545-571.
Van Es, F.B. and Laane, R.W.P.M., 1982. The utility of organic matter in the Ems-Dollart estuary. Neth. J. Sea Res., 16: 300-314.
Yuan, J.J. (Editor), 1984. Control and Development of the Huanghe (in Chinese). Huanghe Conservancy Committee Publication. Shanghai Education Press, Shanghai, 280 pp.
Zhang, J., Huang, W.W. and Martin, J.M., 1988. Trace metals distribution in Huanghe (Yellow River) estuarine sediments. Estuarine Coastal Shelf Sci., 26:499-516.
Zhang, J., Letolle, R., Martin, J.M., Jusserand, C. and Mouchel, J.M., 1990. Stable oxygen iso- tope distribution in the Huanghe (Yellow River) and the Changjiang (Yangtze River) es- tuarine systems. Continental ShelfRes., 10: 369-384.