organic shrimp certification and carbon financing: an assessment
TRANSCRIPT

Organic Shrimp Certification and Carbon Financing: An Assessment for the Mangroves and Markets Project in Ca Mau Province, Vietnam May 2014 Angus McEwin and Richard McNally

Acknowledgements
This project is part of the International Climate Initiative (IKI). The German Federal Ministry for the Environment, Nature Conservation, Building and Nuclear Safety (BMUB) supports this initiative on the basis of a decision adopted by the German Bundestag.
The authors would like to thank Nhung Mien Forest Management Board, Jake Brunner of IUCN, Adam Gibbon and SNV staff, particularly Nguyen Thi Bich Thuy and Le Dinh Huynh, for their contributions to this report.

i
Executive summaryAquaculture is the fastest growing food production system in the world and shrimp the most highly valued aquaculture product traded. By the end of 2012, for the first time in history, aquaculture had overtaken capture fisheries as the largest source of global fish production such that more fish were farmed than caught.1 In Vietnam, aquaculture has grown into a major industry. Seafood is now one of the major export industries of Vietnam, worth over US$6 billion, of which exports of shrimp comprise over one third.2 As the SAQ industry has expanded, concerns have been raised about the environmental impacts and the long term sustainability of current farming models. In many areas, shrimp farming has expanded at the expense of mangrove forests. Healthy mangrove forests provide a wealth of environmental and economic benefits. However, the goods and services provided by mangroves have not always been well understood or appreciated. As such, despite their importance, mangrove forests worldwide have been destroyed at alarming rates. In Vietnam, the expansion of SAQ constitutes the largest threat to the remaining mangrove areas.
To help reverse the loss of mangroves, the Markets and Mangroves (MAM) project works with shrimp importers, traders and farmers to introduce ecologically sound shrimp production and support access to certified markets and potential carbon finance. The project will be conducted over three and a half years (from 2012-2015) with funding from the International Climate Initiative (ICI) of the German Federal Ministry for the Environment, Nature Conservation, Building and Nuclear Safety (BMUB). MAM has established a pilot mangrove forest site in Nhung Mien Forest (NMF) in southern Vietnam. This report explores the different options for the MAM site to access carbon finance to act as an additional revenue stream to support ecologically sound integrated shrimp-mangrove (ISM) production.
Based on the above analysis, the following conclusions are made about mangrove forests and SAQ in NMF:
• Large areas of mangrove forests in Vietnam, including NMF, have been deforested in recent decades with SAQ a primary driver of deforestation.
• Small-scale, low input, ISM farms on small forest plots subcontracted by the NMF-MB to individual households are the predominant farming system in NMF.
• Data on mangrove coverage changes in NMF in recent years is inconsistent across data sources which affects the projected baseline scenario over the next 10 years. Reported recent changes in mangrove management in NMF suggest that the current situation with regards mangrove forests in NMF may be different from the net deforestation experienced between 2004 and 2009 and there may indeed be net afforestation.
1. Source: FAO Fisheries & Aquaculture Information and Statistical Service * projections using 2000-10 average annual growth rate
2. http://www.eng.vasep.com.vn/Fishery-Statistics/123_6849/Vietnam-seafood-export-in-2012.htm

ii
With regards to greenhouse gas (GHG) emissions and removals:
• The actual current projected baseline deforestation rate in NMF is critical to determining the potential for interventions to reduce GHG emissions.
• The conversion of mangrove forests to aquaculture ponds has the potential to release significant quantities of GHGs to the atmosphere from carbon in soils; significantly more than reducing deforestation alone.
• There is potential to significantly reduce GHG emissions in NMF through initiatives that can effectively stop or reduce deforestation of mangroves.
• Besides deforestation, there may be potential to reduce GHG emissions/increase GHG removals through initiatives that reforest areas or improve the management of mangrove forests.
• While the MAM project is relatively small in terms of area, there is potential for scaling-up in other areas.
With regards to shrimp product certification schemes and links with carbon initiatives:
• Naturland (NL) has already been introduced in the project site in coordination with shrimp buyers and local farmers. It mandates a minimum of 50 percent mangrove coverage at the farm level.
• Synergies exist between NL and climate change mitigation initiatives related to maintaining (and perhaps increasing) mangrove forest cover in NMF and the provision of incentives to shrimp farmers to conserve mangrove forests.
• NL certification could be augmented to include climate change mitigation criteria, with or without formal linkage with a carbon scheme.
• Carbon financing and NL may offer an innovative way to turn SAQ from a driver of mangrove deforestation into an effective driver of mangrove conservation and perhaps reforestation.
With regards to carbon finance options:
• There is potential to secure financial support and/or carbon financing based on the climate change mitigation potential of the MAM project, via carbon markets, nationally appropriate mitigation action (NAMA) financing or direct performance-based funding.
• There is alignment between the MAM project and the UN-REDD Programme Phase II in Vietnam with Vien An Dong commune of Ca Mau included as a pilot commune for REDD+ interventions.
• The MAM project could be developed and registered as a REDD+ project with one of the voluntary carbon schemes and initial estimates of emissions reductions generated by the project appear to be of a feasible scale. Of the carbon schemes, the Voluntary Carbon Standard (VCS) appears the suitable, perhaps methodology VM0009, but further analysis is required to assess the baseline scenario and refine emission reduction estimates.
iii
• Carbon insetting appears to offer an interesting option for the MAM project and may be well aligned with the corporate and marketing objectives of NL and NL’s sponsors.
• Plan Vivo also seems well suited to the MAM project in NMF and could be applied as a carbon standard for a carbon insetting initiative.
• The MAM project could be expanded and developed as a NAMA but given the early stage of NAMA evolution and the provincial scope of NL, the other carbon finance opportunities listed above are more attractive.
• Measuring, reporting and verification (MRV) is a critical component for all carbon finance options and is the priority for further actions.
Recommendations
Based on the above conclusions, several recommendations and next steps for the MAM project in NMF are identified:
1. Undertake research to clearly establish the baseline scenario in NMF in accordance with the available guidance, particularly as contained in the relevant VCS methodologies.
2. Examine the existing MRV systems employed by NMF-MB, other government agencies and NL and the degree to which these methods could be combined and improved in order to comply with the requirements of applicable carbon schemes.
3. Assess carbon in soils in the mangroves of NMF and the fate of this carbon when forest is converted to aquaculture.
4. Examine forest degradation in NMF including the trends, drivers and possible interventions to reduce degradation, including improved forest management (IFM) activities.
5. Liaise with UN-REDD Programme Phase II which plans to work on similar activities.
6. Once the baseline scenario in NMF is established, identify the appropriate carbon methodology(ies) to estimate potential GHG emission reductions and assess in detail the feasibility of developing and registering the MAM project with the selected carbon scheme.
7. Consult with NL and NL’s buyers with regards the potential to expand the NL standards to specifically include climate change mitigation criteria and market the ‘low carbon’ benefits of NL shrimp from NMF.
8. Consult with NL and NL’s sponsors with regards to the potential for carbon insetting and the potential demand for carbon insets from within NL’s customer base (i.e. European buyers).

Contents
Executive summary i
Introduction 1 Background 1 Purpose of the study 3
1 MAM project site: Nhung Mien Forest 5 2 Shrimp farming in Vietnam 9 2.1 Shrimp aquaculture in Ca Mau province 9 2.2 Shrimp aquaculture and mangroves 10 2.3 Structure and socio-economics 11 2.4 Government policy and regulation 11 2.5 Description of the main shrimp farming models 11
3 Sustainable shrimp models and evolving market demands 15 3.1 Improved shrimp aquaculture practices and standards 15 3.2 Certification schemes and standards 16 3.3 Naturland 17
4 Mangroves and Vietnam 21 4.1 Mangrove management and regulation in Vietnam 21 4.2 Mangrove loss in Vietnam 24 4.3 Change in mangrove forest in the Mekong Delta 25 4.4 Change in mangrove forest area in Ngoc Hien district 26 4.5 Change in mangrove forest area in Nhung Mien Forest 26
5 Drivers of mangrove deforestation and degradation 31 5.1 Shrimp aquaculture and mangrove deforestation 31 5.2 Lack of forestry incentives and illegal logging 33 5.3 Demand for fuel-wood 34
6 Nhung Mien mangrove forest scenarios 35 6.1 Baseline scenario / Forest reference emission level 35 6.2 NMF baseline scenario / Forest reference level 36 6.3 Assumed forest REL 1: Deforestation 38 6.4 Assumed forest REL 2: Reforestation 39 6.5 MAM project scenario 40 6.6 Net impact on mangroves 41

7 Estimated mangrove carbon impacts 43 7.1 Carbon sequestration and mangroves 43 7.2 Carbon storage by mangroves 44 7.3 Annual carbon sequestration rates 47 7.4 Conversion of mangroves to aquaculture and release of carbon to the atmosphere 48 7.5 Estimated carbon impacts of the MAM project in NMF 48
8 Carbon markets and schemes 53 8.1 Jurisdictional and Nested REDD+ (JNR) Initiative 54 8.2 Insetting 55
9 Other carbon finance opportunities 57 9.1 NAMAs 57 9.2 National REDD funds 58 9.3 Forest Carbon Partnership Facility 60 9.4 Integrating carbon into shrimp certification standards 60
10 Best options and key issues 61 10.1 Linking MAM with UN-REDD Programme Phase II 62 10.2 Developing and registering a VCS carbon project 62 10.3 Alignment with shrimp certification and carbon insetting 62 11 Conclusions and recommendations for the MAM project 65 11.1 Conclusions 65 11.2 Recommendations 67
Annex 1: Carbon Market Schemes 68
Annex 2: Assessing the potential for developing a VCS project 73
References 77

vi
List of boxes, figures, maps and tables
Box 1: Naturland principles for organic aquaculture 18
Box 2: Assessment of mangrove forests, shoreline condition and feasibility for REDD in Kien Giang province 41
Box 3: Plan Vivo project eligibility criteria 72
Box 4: VCS definition of organic soils (VMD0021) 75
Figure 1: Area and production of aquaculture shrimp in Vietnam, 2000-2011 1
Figure 2: Nhung Mien Forest, area and zones (ha) 6
Figure 3: The proportion of different farming systems in Ca Mau in terms of area 12
Figure 4: Percentages of forest allocated and subcontracted to stakeholders in Ca Mau province 23
Figure 5: Percentages of forest allocated to stakeholders in Ngoc Hien district 23
Figure 6: The mangrove area of Vietnam 25
Figure 7: Mangrove forest area in the Mekong Delta 26
Figure 8: Aquaculture area and shrimp production in Ca Mau province, 1995 to 2012 32
Figure 9: REL 1 scenario, projected mangrove deforestation in the MAM project area to 2043 (ha) 39
Figure 10: REL 2 scenario, projected reforestation in the MAM project area to 2043 (ha) 39
Figure 11: Comparison of mangrove carbon storage with that of major global forest domains 44
Figure 12: Ecosystem carbon pools of a Rhizophora apiculata forest in Indonesia 45
Figure 13: Estimated reduction in GHG emissions due to the MAM project over
30 years (tCO2e) 51
Map 1: Location of Nhung Mien Forest 6
Map 2: Nhung Mien Forest and NMF-AQ 7
Map 3: Map of mangrove species and aquaculture in Ca Mau, 2010 10
Map 4: Landsat (2009 and 1989) and Remote Sensing (2013) images of Ngoc Hien district and NMF 27
Table 1: Economic analysis of different systems of shrimp farming in Ca Mau province 13
Table 2: Change in Mangrove Cover in NMF, 2004-2009 and 2009-2013 (ha) (IUCN) 29
Table 3: Mangrove forest area and change over the years in each region (ha) 37
Table 4: Forest REL 1 and project scenarios for deforestation and mangrove conversion 42
Table 5: Assumed indicative values for total carbon stored by mangrove forests in NMF 46
Table 6: Net primary production and annual carbon sequestration by mangrove forests 47
Table 7: Estimated total potential reduction in GHG emissions by the MAM project
over 30 years 50
Table 8: UN-REDD Programme Phase II planned interventions in Ca Mau province 59

vii
Abbreviations
ACR American Carbon Registry
AD activity data
AFOLU agriculture, forestry and other land uses
AGB above-ground biomass
ALM Agricultural Land Management
AQ aquaculture
ARR afforestation, reforestation and revegetation
ASC Aquaculture Stewardship Council
BAP Best Aquaculture Practices
BDS Benefit Distribution System
BGB below-ground biomass
BMUB German Federal Ministry for the Environment, Nature Conservation, Building and Nuclear Safety
CDM Clean Development Mechanism
CERs ‘Compliance Grade’ Carbon Credits
CPZ critical protection zone
EF/RF emission factor/removal factors
FAO Food and Agriculture Organization of the United Nations
FCPF Forest Carbon Partnership Facility
GAA Global Aquaculture Alliance
GAP Good Aquaculture Practices
GHG greenhouse gas
GS Gold Standard
GoV Government of Vietnam
ICI International Climate Initiative
IDH Dutch Sustainable Trade Initiative
IFM improved forest management
IMO Institute for Market Ecology
IPCC Intergovernmental Panel on Climate Change
ISM integrated shrimp-mangrove
ISO International Standards Organisation
IUCN International Union for Conservation of Nature
JNR Jurisdictional and Nested REDD+ initiative
MAM Markets and Mangroves
MARD Ministry of Agriculture and Rural Development
MC-IE monoculture improved extensive
MONRE Ministry of Natural Resources and Environment
MRV measurement reporting and verification
NAMAs Nationally Appropriate Mitigation Actions
NGOs Non-Governmental Organisations
NL Naturland
NMF Nhung Mien Forest
NMF-MB Nhung Mien Forest Management Board
NPP net primary productivity
REDD Reducing Emissions from Deforestation and Degradation
REL reference emission level
RL reference level
SAQ shrimp aquaculture
STI Space Technology Institute
UNFCCC United Nations Framework Convention on Climate Change
UN-REDD United Nations - Reducing Emissions from Deforestation and Forest Degradation
VASEP Vietnam Association of Seafood Exporters and Producers
VCS Verified Carbon Standard
VERs voluntary carbon credits
VietGAP Vietnam Good Aquaculture/ Agriculture Practices
WRC Wetlands Restoration and Conservation
WWF World Wide Fund for Nature

1
IntroductionBackground
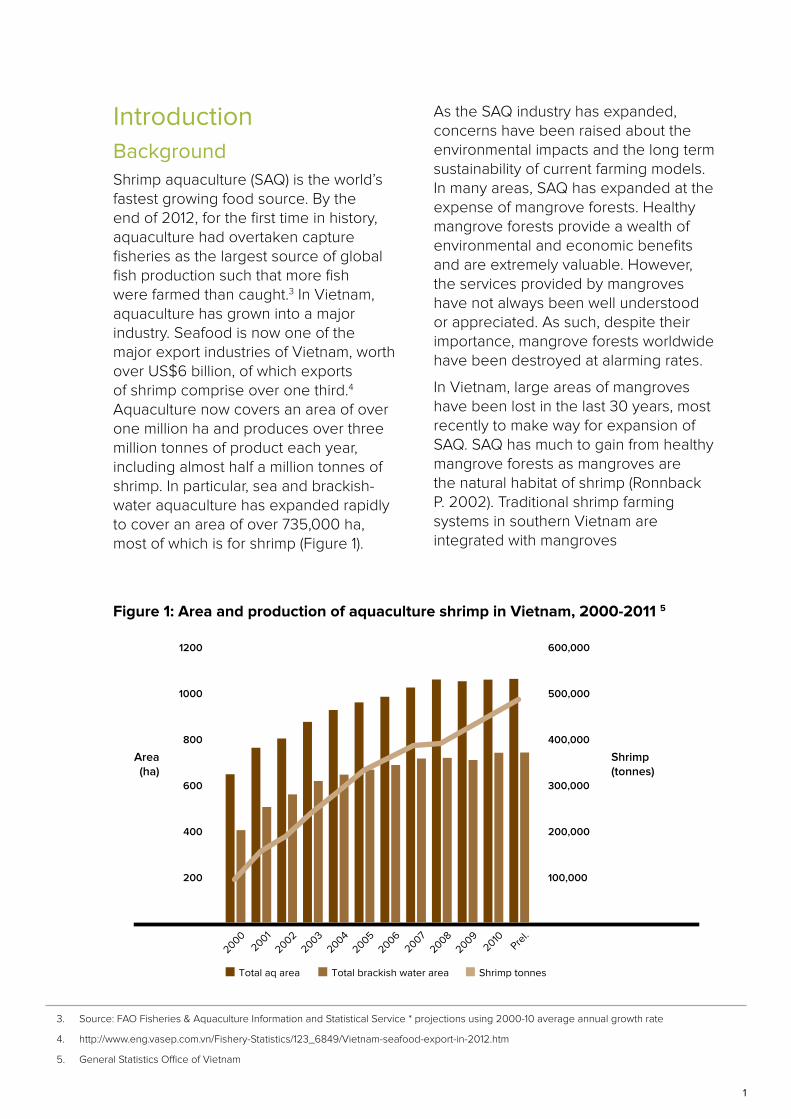
Shrimp aquaculture (SAQ) is the world’s fastest growing food source. By the end of 2012, for the first time in history, aquaculture had overtaken capture fisheries as the largest source of global fish production such that more fish were farmed than caught.3 In Vietnam, aquaculture has grown into a major industry. Seafood is now one of the major export industries of Vietnam, worth over US$6 billion, of which exports of shrimp comprise over one third.4 Aquaculture now covers an area of over one million ha and produces over three million tonnes of product each year, including almost half a million tonnes of shrimp. In particular, sea and brackish-water aquaculture has expanded rapidly to cover an area of over 735,000 ha, most of which is for shrimp (Figure 1).
As the SAQ industry has expanded, concerns have been raised about the environmental impacts and the long term sustainability of current farming models. In many areas, SAQ has expanded at the expense of mangrove forests. Healthy mangrove forests provide a wealth of environmental and economic benefits and are extremely valuable. However, the services provided by mangroves have not always been well understood or appreciated. As such, despite their importance, mangrove forests worldwide have been destroyed at alarming rates.
In Vietnam, large areas of mangroves have been lost in the last 30 years, most recently to make way for expansion of SAQ. SAQ has much to gain from healthy mangrove forests as mangroves are the natural habitat of shrimp (Ronnback P. 2002). Traditional shrimp farming systems in southern Vietnam are integrated with mangroves
3. Source: FAO Fisheries & Aquaculture Information and Statistical Service * projections using 2000-10 average annual growth rate
4. http://www.eng.vasep.com.vn/Fishery-Statistics/123_6849/Vietnam-seafood-export-in-2012.htm
5. General Statistics Office of Vietnam
Figure 1: Area and production of aquaculture shrimp in Vietnam, 2000-2011 5
Area(ha)
Shrimp(tonnes)
20002001
2002
2003
2004
2005
20062007
2008
20092010
Prel.
Total aq area Total brackish water area Shrimp tonnes
1200
1000
800
600
400
200
600,000
500,000
400,000
300,000
200,000
100,000
2
and function more in harmony with the natural ecosystems. These extensive, low-input shrimp farms are more environmentally friendly and are found to be more sustainable and more resistant to shrimp disease than new high-input, intensive farming systems. However, as the high potential financial return from SAQ has become apparent, there has been increased pressure to move towards more intensive mono-culture farming models and away from the more traditional extensive models. Although this can bring higher rewards it also brings considerable risks to the farmer.
Increased awareness among global consumers and companies of the adverse environmental impacts of aquaculture is resulting in changing market demands. Increasingly, consumers and companies are demanding choice and products that are produced in an environmentally friendly manner. There is a movement in Vietnam by farmers, processors, the government and international donors towards shrimp farm certification for sustainable, hygienic and environmentally friendly methods. Several schemes to produce and certify shrimp products as sustainable and environmentally friendly have emerged (these are discussed in detail in Section 3). In addition to fostering more sustainable systems with less environmental impacts, successful certification will improve access to different export markets and also provide a price premium. This demand-side force in the industry is driving a change towards more sustainable farming models.
The concept of environmentally sustainable or environmentally friendly aquaculture is evolving and gaining traction but so far has not focussed on the potential climate change impacts of aquaculture. In the last few decades, global awareness of, and efforts to combat, climate change have increased, as well as the international coordination of mitigation initiatives. Various schemes and initiatives have been developed, including the emergence of carbon markets and funding for mitigation actions. After combustion of fossil fuels, one of the largest sources of GHG emissions is deforestation and degradation of forest resources. Annual carbon emissions from tropical deforestation and degradation during the 2000s accounted for about 10-20 percent of the total anthropogenic emissions of greenhouse gases (cited in GOFC-GOLD 2012).6 Of the different forest types, mangrove forests are amongst the most carbon rich of tropical forests (Donato D.C. et al. 2011).
The benefits of mangroves for sustainable shrimp farming and the environment in general are increasingly recognised. However, the links between mangroves, SAQ and shrimp product certification schemes have not yet been explored. There is a market-driven shift towards certified sustainable shrimp farming in Vietnam and globally. However, subsidies and incentives are likely to be needed, particularly to encourage small-scale farmers to adopt the initiatives. As the new farming models will also promote mangrove protection, and even mangrove reforestation, there is a possibility that carbon finance might be harnessed to provide a further incentive and source of funding for this initiative.
6. GOFC-GOLD, 2012. A sourcebook of methods and procedures for monitoring and reporting anthropogenic greenhouse gas emissions and removals associated with deforestation, gains and losses of carbon stocks in forests remaining forests and forestation. GOFC-GOLD Report version COP18-1, (GOFC-GOLD Land Cover Project Office, Wageningen University, The Netherlands)
3
Purpose of the study
To help reverse the loss of mangroves, the Markets and Mangroves (MAM) project aims to support the authorities to access markets to pay for the multiple benefits which mangroves provide. This specifically includes the important contribution that mangroves make to both climate change adaptation and mitigation. MAM aims to achieve this by working with shrimp importers, traders and farmers to introduce ecologically sound shrimp production and support access to certified markets and potential carbon finance. The project will be conducted over three and a half years (from 2012-2015) with funding from the International Climate Initiative (ICI) of the German Federal Ministry for the Environment, Nature Conservation, Building and Nuclear Safety (BMUB).
MAM has established a pilot mangrove forest site in Nhung Mien Forest (NMF) in southern Vietnam (Map 1). While the study will examine the links between mangroves and shrimp farming generally, the focus will be on identifying practical actions and recommendations for the MAM site in Vietnam. Section 2 of this report examines shrimp farming in Vietnam; in particular the integrated mangrove-shrimp model and the evolving market demand for sustainably produced shrimps. In order to understand the potential emission reductions from the project intervention, an initial assessment of the mangrove cover change is provided. This allows different baselines to be established. Drawing on the literature on the carbon content in mangroves, initial estimates of GHG emissions under the different baseline scenarios are provided. The final sections of the report explore different carbon schemes to pay for emission reductions as well as recommendations moving forward.

4

5
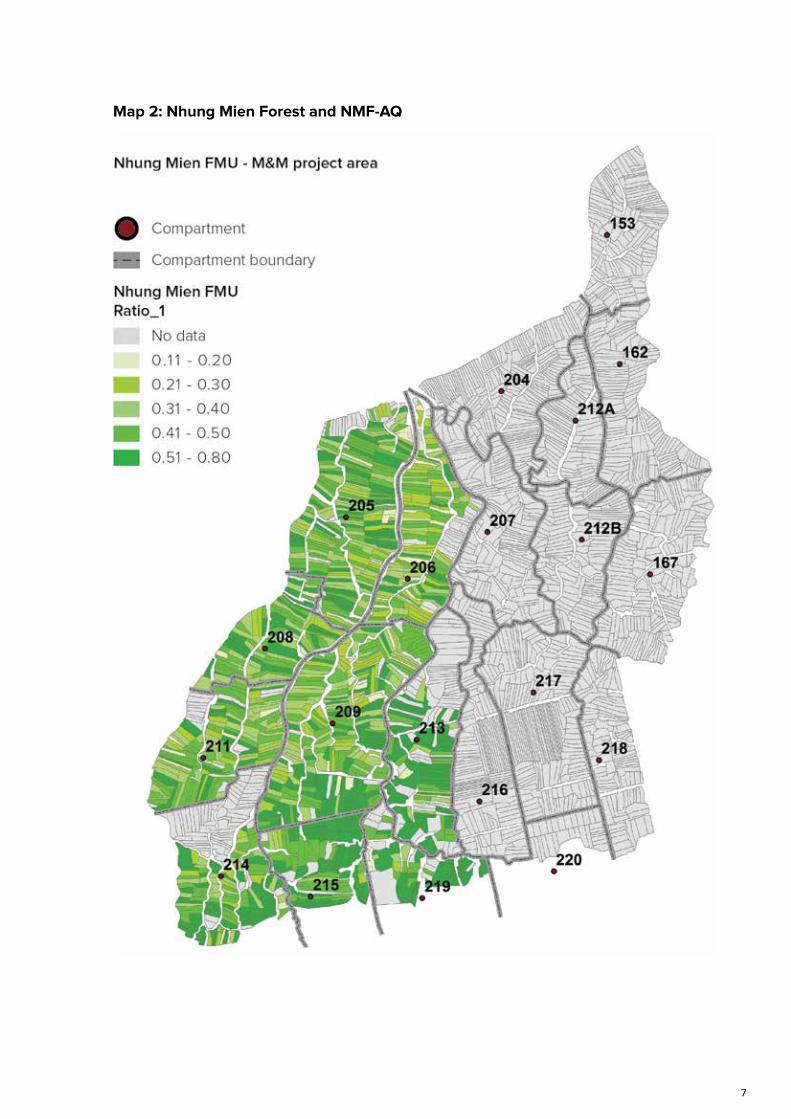
Section 1MAM project site: Nhung Mien Forest The MAM pilot site is located in Nhung Mien Forest (NMF) in Ngoc Hien district at the southern-most tip of Vietnam in Ca Mau province (Map 1). NMF is located in Vien An Dong commune of Ngoc Hien district and covers an area of 12,607 ha.7 Ngoc Hien district is almost entirely devoted to aquaculture and has large areas of mangrove forest. The forest is divided into three main zones, including a CPZ, or full protection zone, along the coast; a protection forest zone, or buffer zone, behind that; and then, furthest inland, a production forest zone, by far the largest zone (Figure 2).
The forest is further divided into compartments and sub-compartments and then individual plots (Map 2). NMF is managed by NMF Management Board (NMF-MB). Approximately 11,058 ha is allocated to 2,683 households, equivalent to an average of just over 4 ha per household. Integrated shrimp-mangrove (ISM) aquaculture is legally allowed in all areas of NMF except the CPZ (farms in this area are being relocated). The area of NMF excluding the CPZ (NMF-AQ) is the area of interest for this study as this area is used for integrated including shrimp-mangrove aquaculture and contains the MAM project site.
The Mangroves and Markets (MAM) project aims to assist selected shrimp farmers in NMF to achieve certification with Naturland (NL). MAM is working with Mien Phu seafood processing company, which wishes to buy NL-certified shrimp and is willing to pay a premium. The MAM project has selected 800 household plots totalling 3,371 ha within NMF to implement the NL certification scheme. These households have been selected based on several criteria including current mangrove coverage, accessibility and willingness to participate.
Within the selected plots, the total mangrove forest area is 1,715 ha, equivalent to an average of 50.1 percent coverage. Plots with as little as 40 percent mangrove coverage have been included with a plan to support these farmers to plant additional mangroves in order to meet the NL-mandated minimum of 50 percent. Selected farmers must protect and maintain their remaining mangroves and many farmers must increase their area of mangroves.
The MAM project will assist farms to meet the certification standards of NL. Farms will be supported to do this and will be incentivised by improved market access and a price premium for their shrimp product. Farms that fail to adhere to the NL standards will fail the NL audit, conducted annually and will thus lose their certification and the associated benefits. Therefore, if successful, the MAM project could have a significant impact on mangrove coverage in NMF.
7. Overview Organic Shrimp Farming Certification, MAM Project, Le Dinh Huynh, January 2013 (presentation)

6
Map 1: Location of Nhung Mien Forest 8
8. Wikipedia
1,420
3,606
8,651
Figure 2: Nhung Mien Forest, area and zones (ha)
Critical Protection Forest
ProtectionForest
Production forest
7
Map 2: Nhung Mien Forest and NMF-AQ

8
9
Section 2Shrimp farming in Vietnam
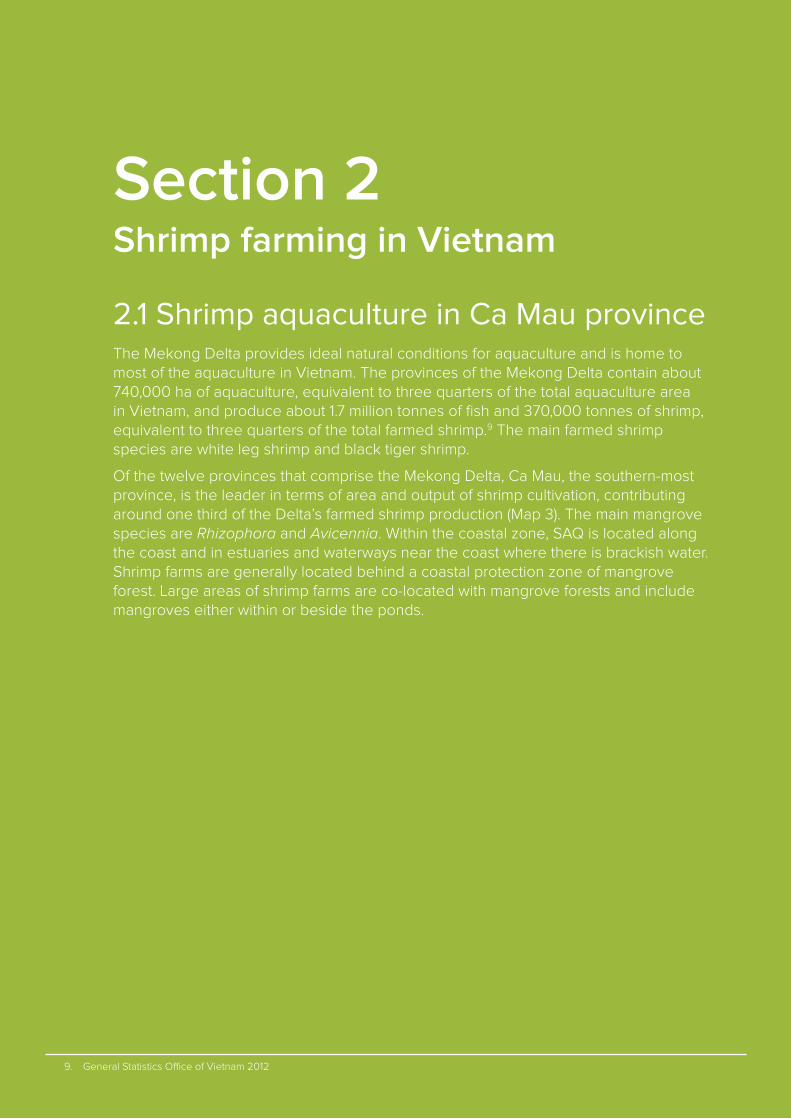
2.1 Shrimp aquaculture in Ca Mau provinceThe Mekong Delta provides ideal natural conditions for aquaculture and is home to most of the aquaculture in Vietnam. The provinces of the Mekong Delta contain about 740,000 ha of aquaculture, equivalent to three quarters of the total aquaculture area in Vietnam, and produce about 1.7 million tonnes of fish and 370,000 tonnes of shrimp, equivalent to three quarters of the total farmed shrimp.9 The main farmed shrimp species are white leg shrimp and black tiger shrimp.
Of the twelve provinces that comprise the Mekong Delta, Ca Mau, the southern-most province, is the leader in terms of area and output of shrimp cultivation, contributing around one third of the Delta’s farmed shrimp production (Map 3). The main mangrove species are Rhizophora and Avicennia. Within the coastal zone, SAQ is located along the coast and in estuaries and waterways near the coast where there is brackish water. Shrimp farms are generally located behind a coastal protection zone of mangrove forest. Large areas of shrimp farms are co-located with mangrove forests and include mangroves either within or beside the ponds.
2.2 Shrimp aquaculture and mangroves
9. General Statistics Office of Vietnam 2012

10
2.2 Shrimp aquaculture and mangroves Mangroves are important for SAQ. It is not known what percentage of mangrove cover is ideal for shrimp farming. A 1997 study found that ISM farms in Ca Mau province that retained mangroves in their ponds had higher productivity than those that didn’t, and those with 31 percent to 50 percent mangrove cover had higher annual economic returns than those with less cover or more cover. This was perhaps due to shading and build-up of tannins from high levels of leaf-litter associated with more dense and older mangroves (Johnston D. et al. 2000, Binh C.T. et al. 1997). However, for farms located within broad integrated systems, it is difficult to isolate the impacts of mangroves on SAQ. Mangrove forests adjacent and
seaward of aquaculture ponds likely provide many environmental services, such as storm protection, to shrimp farms, even if those farms have no mangroves within their ponds.
Mangroves do matter to local shrimp farmers. A recent study in Ca Mau found that 72 percent of those surveyed identified mangroves as valuable for shrimp and that shrimp farmers are generally willing to plant and to protect mangroves if they are given both economic incentives and greater management control to do so (Ha T. et al. 2013). However, currently, it is evident that while farmers in Ca Mau generally understand the ecological links between mangroves and shrimps, most perceive that much less than 60 percent mangrove coverage is optimal for SAQ. The same study described above found that many farmers believe that a high
10. http://www.wisdom.eoc.dlr.de/sites/wisdom/files/media/maps/72dpi/MangroveMap_2010_72dpi.pdf
Map 3: Map of mangrove species and aquaculture in Ca Mau, 201010

11
11. No.: 124/QD-TTg (2012) Decision approving master plan of production development of agriculture to 2020 and a vision toward 2030. Hanoi: MARD
density of mangroves and mangroves over the age of 15 years are not good for shrimp production (Ha T. et al. 2013).
2.3 Structure and socio-economicsWhile the authorities encourages the industry with low-cost loans and export incentives, the quantity and quality of the growth of the SAQ industry is largely driven by the private sector. SAQ is dominated by smallholders due to the physical and economic constraints of intensifying production. The Mekong Delta is home to the largest concentrations of shrimp farms in the world, 95 percent of which are small-scale farms, which the government defines as having less than 300 workers (Oxfam Novib 2013). In NMF, the average size of shrimp farms is between three and five ha and each farm is usually operated by one family.
The market for shrimp products is overwhelmingly export driven. Most farms sell their produce to shrimp processors and traders from whom they may also receive credit and other support.
2.4 Government policy and regulationThe regulations and policies related to mangrove forests are also important for SAQ; in particular, Decision No. 186/2006/QD-TTg, 2006, promulgating the regulation of forest management, allows households and organisations allocated submerged land in both protection and production forests to use up to 40 percent of the area for agriculture or aquaculture activities.
The government’s Agriculture Master Plan to 2020 includes plans to expand the area for aquaculture between 2010 and 2020, with most of it from reclaimed land. Aquaculture is planned to expand by 100,000 ha, including 7,000 ha from unused coastal delta land and 90,000 ha from converting low-lying, one-crop, rice agriculture land for SAQ. Seventy per cent of the expansion is planned to be in the Mekong Delta.11 The Agriculture Master Plan also calls for continuing progress towards certification of aquaculture products and improving the reputation and brand of Vietnamese aquaculture.
2.5 Description of the main shrimp farming modelsThere are four main SAQ farming models in Vietnam: MC-IE are the most common, accounting for over 60 percent of the total area in Ca Mau (Figure 3).
Intensive
Intensive systems have high yields but also high levels of inputs. Intensive farms are closed to the natural environment to give better control. The farms rely on artificial stocking and artificial feeding and can include use of chemicals to control disease and pollution. Intensive farms have very high stocking rates and are not integrated with mangroves. Productivity, income and net income are about 20 times higher than improved extensive farms and costs per hectare are over 40 times higher (Table 1).
The high costs and the technical capacity needed to effectively manage intensive farms are barriers to the more widespread adoption of this system. There are also concerns about the long-term sustainability of intensive farms,

12
due partly to the increased vulnerability to disease and high use of chemicals. Stevenson (1997) provided a review of the extent of abandoned shrimp ponds in South East Asia.
Monoculture improved extensive systems (MC-IE)
MC-IE systems are popular for some farmers because of the lower capital cost and lower risk due to lower virulence of disease. There is no need for antibiotics or supplemental feeds because the shrimp densities are close to natural levels and disease is less of an issue than in intensive farms. MC-IE is the most popular shrimp farming system in Ca Mau. MC-IE farms are non-forested. A recent study found that MC-IE farms have lower costs than the other systems and net income is about 20 percent
higher than for ISM farms (Table 1). MC-IE farms are characterised by:
• some natural recruitment of larvae through tidal exchange
• low density artificial stocking (1-3 fingerlings per square metre)
• no supplementary feeding
• some income from integrated farming of fish and crabs.
Integrated shrimp-mangrove
ISM systems are a form of improved extensive farms and are similar to MC-IE farms described above. In addition to the improved extensive attributes listed above, ISM farms are also characterised by:
• mangroves within and/or adjacent to ponds (10-70 percent mangrove cover)
12. Ha, Tran Thi Thu, Bush S. R, Mol A.P.J and van Dijk H., 2013. Organic coasts? Regulatory challenges of certifying integrated shrimp–mangrove production systems in Vietnam, Journal of Rural Studies, Vol. 28
Integratedshrimp - mangrove
Monocultureimproved extensive
Intensive Integrated shrimp - rice
Figure 3: The proportion of di�erent farming systems in Ca Mau in terms of area 12
20%
40%
60%

13
13. Ha, Tran Thi Thu, Bush S. R, Mol A.P.J and van Dijk H., 2013. Organic coasts? Regulatory challenges of certifying integrated shrimp–mangrove production systems in Vietnam, Journal of Rural Studies, Vol. 28
Shrimp-rice farms
Shrimp-rice farms are systems that combine both rice farming and extensive SAQ on a seasonal basis. They are located in estuaries and deltas that are flooded during the wet season.
• a relatively high share of income from crabs and fish (over a quarter of the total income)
• dependence on the mangroves for shrimp reproduction and food.
ISM can be considered a traditional form of extensive aquaculture that has been practised along the Ca Mau peninsula since the early 1980s. Although making up only 15 percent of the total pond area in the province, ISM systems have remained attractive to farmers and policy makers alike given their protection of mangrove forests. ISM farms are also relatively inherently stable and resilient and provide other ecological services and attributes not measured or shown in the table above. It is these characteristics that make improved extensive farms, and particularly ISM farms, amenable to organic and/or climate friendly certifications.
Most ISM farms are located within land zoned as either protection or production forest and are thus regulated in accordance with forestry laws. As such, many farms combine mangrove forestry with aquaculture in a silvo-fishery model. Farmers earn income from both fisheries products and timber. ISM farms are the main type of shrimp farm in NMF.
Table 1: Economic analysis of different systems of shrimp farming in Ca Mau province 13
Indicators
Integrated shrimp-mangrove (N=10)
Improved extensive monoculture shrimp (N=7)
Intensive shrimp (N=3)
Shrimp productivity (kg/ha) 228 218 4,366
Income from shrimp* 18,280 22,669 498,300
Income from fish & crab* 4,864 2,001 0
Total income* 23,143 24,670 498,300
Total cost* 5,886 3,631 251,584
Net income* 17,257 21,039 246,716
Benefit Cost Ratio (BCR per ha) 2.92 5.79 0.96
(Note: * unit VND 1000 per ha. (1 US$ = 20,000VND)

14

15
Section 3Sustainable shrimp models and evolving market demands
3.1 Improved shrimp aquaculture practices and standardsEvolving market demands and industry are driving a quality shift in global agri-food systems and the emergence of an international regulatory network. Standards for certification are becoming prominent aspects of international fish trading and marketing. In most cases, companies within the increasingly integrated and consolidated wholesaling and retailing sector are driving these demands rather than the consumers directly. Demands are increasingly linked to private firms’ corporate social responsibility strategies and protecting corporate reputations from negative publicity driven by civil society (FAO 2011). Originally emerging in response to food safety concerns, certification schemes have recently proliferated to target environmental sustainability and responsible fisheries management, among other factors (Wilkings 2012). Environmentally friendly relates to a broad and varying set of characteristics depending on the scheme or standard, but generally encompasses principles of organic farming and environmental and social sustainability.
Voluntary market standards and certification schemes provide an incentive for farmers to upgrade their production systems and also improve their marketability. Successful registration with a certified scheme generally ensures the shrimp farmer will have a dedicated buyer for the shrimp, thus reducing market risk. Certified shrimp usually also receives a price premium. Technical support to improve the sustainability of production is also often provided.
Aquaculture producing nations including Vietnam have implemented various schemes and standards to varying degrees, usually in response to demands from export markets. Certification with a reputable scheme or standard has been sought as a means to improve the international image of Vietnamese aquaculture and to reduce the market and production risk for farmers while improving sustainability. Conceptual guidelines, good practice and standards, together with training and auditing systems, have been established. In Vietnam, certification with reputable schemes is often driven by food processors and retailers with support from state management agencies and the Vietnam Association of Seafood Exporters and Producers (VASEP).

16
which is recognised in the international market. VietGAP was only first officially recognised by GlobalGAP in 2011 and is still at an infancy stage. The scheme’s assessment processes confirm the compliance of fishery production in accordance with Good Aquaculture Practices (GAP). The Ministry of Agriculture and Rural Development (MARD) expects VietGAP to have certified 30 percent of the intensive and semi-intensive aquaculture farms by 2015, and forecasts 80 percent certification by 2020. The Vietnamese government has shown strong support for VietGAP, agreeing to use its national budget to invest 100 percent expenditure in determining viable production areas and to initiate seafood production projects under VietGAP. However, VietGAP is recognised in the domestic market but not the international export market and is suited to intensive and semi-intensive farms rather than the small-scale, improved extensive shrimp mangrove farms in NMF.
Aquaculture Stewardship Council (ASC)
The ASC was founded in 2010 by the World Wide Fund for Nature (WWF) and Dutch Sustainable Trade Initiative (IDH) to manage the global standards for responsible aquaculture, which are developed by the Aquaculture Dialogues, a programme of roundtables initiated and coordinated by WWF. The ASC’s mission is to transform aquaculture towards environmental sustainability and social responsibility using efficient market mechanisms that create value across the chain. The ASC has standards and manuals to support sustainable certification.
VASEP is committed to WWF Vietnam
In general, certification is assessed against pre-determined criteria and an internal control system is implemented by the farmers and independently verified. The costs of compliance and certification can be significant. The scope and detail of the various schemes and standards varies and not all are suitable for small-scale shrimp farming.
The various schemes and standards do not as yet have specific criteria directly addressing climate change impacts of shrimp farming and processing. However, organic certification of mangrove SAQ is being sought as a means to conserve the coastal landscape, particularly mangrove forests and the associated broader benefits of mangroves, including carbon.
3.2 Certification schemes and standardsThere are several environmentally friendly certification schemes and standards for shrimp production, some of which have been applied to varying degrees in Vietnam, as described below. Details are provided in the next section (3.3) on NL, which was identified as a promising standard for the MAM project site.
VietGAP
The Government of Vietnam (GoV) is promoting certification with VietGAP (Vietnam Good Aquaculture/ Agriculture Practices) for agriculture products including aquaculture. VietGAP is affiliated with the Global Aquaculture Alliance (GAA), the Aquaculture Stewardship Council (ASC) and GlobalGAP and is seen as a step towards certification with GlobalGAP

17
and stakeholders on a roadmap for implementation of ASC in Vietnam. The pangasius (catfish) sector recently achieved its target to certify ten per cent of the country’s pangasius production for export under the ASC’s farmed responsibly programme.14 The certification by the ASC recognises fish farms that have met rigorous environmental and social criteria and have organised their farming methods in a demonstrably responsible manner. This includes conservation of water resources, no misuse of antibiotics and responsible use of feed.
An ASC system for shrimp farming is under development. However, ASC certification of shrimp farmers as it currently stands would do nothing to protect the existing mangroves but would provide market-based incentives that financially benefit the already highly profitable larger shrimp producers. A recent study concluded that ASC certification is not currently viable for the majority of Mekong Delta shrimp farmers due to financial and technical capacity constraints, at least not without significant support and subsidies for small-scale farmers (Oxfam Novib 2013).
Global Aquaculture Alliance (GAA)
GAA is an international, non-profit trade association dedicated to advancing environmentally and socially responsible aquaculture. The GAA runs one of the most significant aquaculture schemes in terms of volumes and global coverage. The GAA first developed a voluntary best practice programme for aquaculture producers. The Responsible Aquaculture
Programme included various guiding principles, codes of practice and best practice standards. The GAA aligned with the Aquaculture Certification Council, a non-governmental body based in the United States, to develop a certification system for aquaculture production processes. The GAA’s Best Aquaculture Practices (BAP) Standards are applied in a certification system that combines site inspections and effluent sampling with sanitary controls and traceability. Standards cover a range of considerations including: food safety, traceability, animal welfare, community and social welfare and environmental sustainability. Both farms and processing facilities can be certified. However, like the ASC, GAA’s BAP is not specifically tailored to small-scale shrimp farming in mangrove areas.
3.3 Naturland NL15 is active the world over in promoting organic agriculture and aquaculture. Organic agriculture safeguards the existence of smallholders and helps with the sustainable management of what are often fragile ecosystems. NL has developed standards for organic aquaculture16 which includes nine principles, related mainly to ensuring organic processes (Box 1).
14. http://www.asc-aqua.org/index.cfm?act=update.detail&uid=136&lng=1
15. www.naturland.de
16. http://www.naturland.de/fileadmin/MDB/documents/Richtlinien_englisch/Naturland-Standards_Aquaculture.pdf

18
A pre-condition, however, is that in any case the relevant legal requirements for land use and reforestation have to have been observed.
• The former mangrove area in property of the farm shall be reforested to at least 50 percent during a maximum period of five years.
As such, NL is aligned with small-scale, improved extensive shrimp mangrove farming systems. By requiring a minimum coverage of mangroves, NL certification is also aligned with the MAM project and also with climate change mitigation initiatives. NL is being actively promoted by seafood processors in Vietnam and is being successfully adopted in Ca Mau. For these reasons, NL is of particular interest to the MAM project.
17. Under specific geographical or historical conditions exceptions can be made for extensive mangrove aquaculture systems
The standards describe the criteria for certification with NL and include specific regulations for the pond culture of shrimps. Compliance with the standards, and thus certification, is assessed and audited at the individual farm level by an external accredited auditor. Unique among the certification schemes and standards, NL also has specific criteria with regards to mangrove coverage within farms:
• It is not permitted to remove or damage mangrove forest for purposes of construction or expansion of shrimp farms.
• Any measure carried out by the farm or on the farm’s demand likely to influence adjacent mangrove forest (e.g. construction of pathways and channels to the farm area) shall be announced to and approved by NL.
• Farms which in parts occupy former mangrove areas can be converted to organic aquaculture according to NL standards if the former mangrove area does not exceed 50 percent of total farm area.17
Box 1: Naturland principles for organic aquaculture
1. Careful selection of sites for aquaculture farms
2. Protection of adjacent ecosystems
3. Active avoidance of conflicts with other users of the aquatic resources (e.g. fishermen)
4. Prohibition of chemicals (e.g. as anti-fouling agents in net pens)
5. Natural remedies and treatments in the case of disease
6. Feedstuff from organic agriculture
7. Fishmeal and fish oil in feed derived from by-products of fish processed for human consumption (no dedicated feed fishery)
8. Prohibition of genetically modified organisms (GMOs), either in feedstuff or in the stock itself
9. Processing according to organic standards

19
Naturland in Vietnam
NL was first implemented in Vietnam in 2002 in Tam Giang commune of Nam Can district, Ca Mau province. The farms are in a production forest area managed by the state-owned Forestry Company 184. Once implemented the organic certification network expanded to include an external auditor, the Institute for Market Ecology (IMO) and the Ca Mau Frozen Seafood Processing Import Export Corporation (CAMIMEX) to export the shrimp to Co-op supermarkets in Switzerland. The number of certified farms increased to over 850 between 2002 and 2006 (but then declined to 784 by 2009).
The scheme was expanded to Tan An commune in neighbouring Ngoc Hien district in 2009. There, 335 farms on 2,100 ha were enrolled in the programme in partnership with the Nam Can Sea-products Import Export Join Stock Company (SEANAMICO). At both sites, the forest management entity along with the processing company is responsible for organising and implementing certification schemes in the field. The organic NL certification scheme appears to meet environmental, social and economic development aspirations and has therefore received widespread support by the provincial and district government. Buoyed by the success to date, the Ngoc Hien district people’s committee plans to enlarge the organic certification site to all integrated shrimp mangrove systems in Ca Mau by 2015 (Ha T. et al. 2013).
NL’s requirement for 50 percent mangrove coverage is not consistent with the government’s Decision 186, which mandates a minimum of 60 percent mangrove coverage. However, given that most farms in NMF currently have less than 50 percent mangrove coverage, the NL standards provide an incentive for an increase in forest cover or at least the maintenance of 50 percent forest cover.

20

21
Section 4Mangroves and Vietnam
4.1 Mangrove management and regulation in VietnamSeveral national plans and strategies are important for mangrove management. The National Forest Development Strategy 2006-2020 (Decision No. 18/2007/Q-TTg, 2007) calls for enhanced scattered tree planting on aquaculture and agricultural land and addressing of the link between protection of mangrove forest and aquaculture in the Mekong Delta. The government’s Agriculture Master Plan to 2020 includes plans to expand the area for forestry between 2010 and 2020, with most of it apparently from reclaimed land. According to the master plan, forest areas are planned to increase by 880,000 ha, mostly for production forests, but mangrove forests are not specifically mentioned. The plan also calls for allocation of land and contract forests and implementation of policies to encourage village communities and people to participate in protection of natural forests.
The regulatory and management authority over Vietnam’s mangroves can in some places be unclear due to overlapping mandates of the MARD, the Ministry of Natural Resources and Environment (MONRE) and the People’s Committees at the provincial, district and commune levels. Mangrove forests are part of the general forest ecosystem and thus there is no separate administration of mangrove forests at any level. Currently, about 50 percent of the mangrove forest areas in Vietnam are allocated as protection forests and are under the management of forest management boards. The remaining forest areas are allocated evenly between special use forests and production forests (Ha T. et al. 2013).

22
the law,18 or, in some cases, have been allocated land with less than 60 percent coverage. Adhering to NL standards would provide a needed incentive to support these farmers to increase their mangrove cover.
It should also be noted that along the coastal fringe adjacent the sea, there is often a coastal belt of mangroves that is planted and/or protected as a barrier against storm surges and coastal erosion. These belts are usually classified as protection forests and within this classification are often zoned as critical areas to be strictly protected.
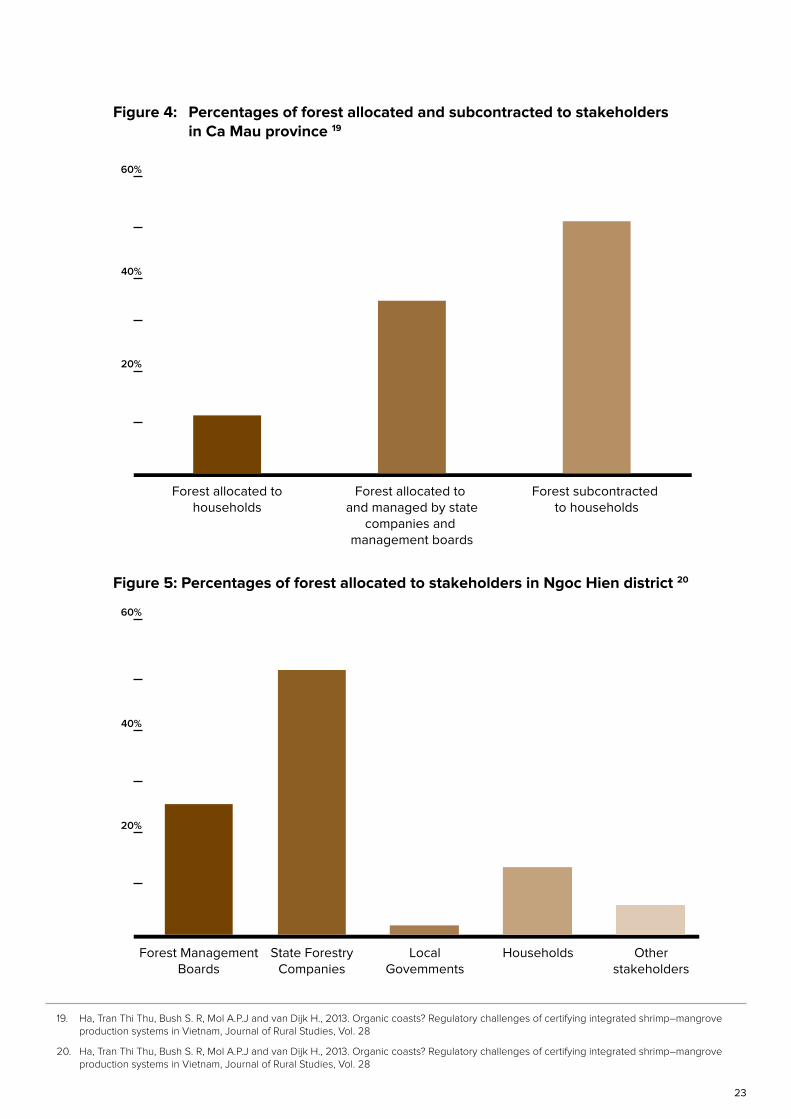
Land management and use rights can be granted via forest contracts. This occurs where a state-owned economic organisation or state-owned management board that has been allocated forest land enters into contracts with households, organisations or communities to manage the forest. The rights and responsibilities of the forest user are defined in the contract. In Ca Mau, only about 12 percent of the mangrove forest area is allocated to households, but over 50 percent of the mangrove forest area is subcontracted to households. In Ngoc Hien district, most mangrove forest land is allocated to state forestry companies and then mostly subcontracted to households (Figure 4, Figure 5).
Special use forests include national parks and are the most strictly protected, with clearing of trees only allowed in special cases. In protection and production forests, limited timber extraction and integrated use of the land is allowed. According to the Decision 186/2006/QĐ-TTg on 14/8/2006 of the prime minister on forest management, areas of such forests can be assigned or leased to economic organisations, households or individuals. In production forests, those assigned the use rights can earn revenue from forestry while in protection forests, a small salary is earned for protecting the forests. Timber can be exploited in a protection forest to a limited extent, with prior approval, so long as the protection function of the forest is not compromised and so long as at least 60 percent of forest canopy cover is maintained. Timber exploitation such that the canopy cover is reduced below 60 percent is not allowed. In production forests, there is no requirement to maintain 60 percent canopy coverage but timber exploitation must be sustainable.
In both protection and production forests, households and organisations allocated submerged land can use up to 40 percent of the area for agriculture or aquaculture activities. That is, by government regulation, shrimp mangrove farmers in protection and production forests must maintain at least 60 percent of their farm area for forestry, and in protection forests, 60 percent mangrove canopy cover must be maintained (Decision 186). Failure to comply with this law may result in the household’s lease being revoked before it expires, or not renewed after 20 years. However, in practice it is evident that many farmers have cleared and converted to ponds much more than the maximum 40 percent allowed by
18. Across Vietnam’s forests, it is estimated that about 70% of local people have not complied with the law on using the forest resources on their land (Pham et al. 2012)
23
19. Ha, Tran Thi Thu, Bush S. R, Mol A.P.J and van Dijk H., 2013. Organic coasts? Regulatory challenges of certifying integrated shrimp–mangrove production systems in Vietnam, Journal of Rural Studies, Vol. 28
20. Ha, Tran Thi Thu, Bush S. R, Mol A.P.J and van Dijk H., 2013. Organic coasts? Regulatory challenges of certifying integrated shrimp–mangrove production systems in Vietnam, Journal of Rural Studies, Vol. 28
Figure 4: Percentages of forest allocated and subcontracted to stakeholders in Ca Mau province 19
Forest subcontracted to households
Forest allocated to and managed by state
companies and management boards
Forest allocated tohouseholds
20%
40%
60%
State ForestryCompanies
LocalGovemments
Forest ManagementBoards
Households Otherstakeholders
Figure 5: Percentages of forest allocated to stakeholders in Ngoc Hien district 20
20%
40%
60%

24
21. See official CDM definition of VN forests at http://cdm.unfccc.int/DNA/ARDNA.html?CID=233. Note that contrary to the official definition provided to the CDM for A/R projects, the Ministry of Agriculture and Rural Development provided specific guidance on the criteria for forest identification in Circular 34/2009/TT-BNNPTNT dated June 10th 2009 whereby a forest is defined as having at 10% canopy cover
22. Verified Carbon Standard, VM0007 REDD Methodology Modules
23. Pham Trong Thinh (2012) Study report on formulating the policy on payment for the services of spawning grounds, food sources and natural seeds and environment from mangrove forest for aquaculture. Hanoi: Vietnam Administration of Forestry/GIZ/IUCN
24. www.gso.gov.vn; www.kiemlam.org.vn
4.2 Mangrove loss in Vietnam
Deforestation is the direct, human-induced conversion of forest land to non-forest land. The Vietnamese government defines a forest as an area of at least 0.5 ha, with a minimum crown cover of 30 percent and a minimum tree height at maturity of 3 metres. 21
Forest degradation is defined as the persistent reduction of canopy cover and/or carbon stocks in a forest due to human activities such as animal grazing, fuel-wood extraction, timber removal or other such activities, but which does not result in the conversion of forest to non-forest land (which would be classified as deforestation), and falls under the IPCC 2003 Good Practice Guidance land category of forest remaining forest.22 Degradation is more difficult to measure but can be a significant issue that is not measured in statistics based on forest cover, particularly when average forest canopy cover is measured over large areas that may hide pockets of non-forest. There is very little reliable data on forest degradation in Vietnam.23
In 1943 there were approximately 408,500 ha of mangroves in Vietnam, most of which (329,000 ha) were found in the south of the country. The area of mangrove forest has since declined significantly, primarily due to herbicide spraying during the Vietnam-American War, in-migration, the expansion of rice farming, the over-exploitation of timber for construction and charcoal and, more recently, the expansion of shrimp farming.
Data on the extent of mangrove forests in Vietnam is scarce, with estimates from different institutions ranging widely. The Forest Inventory shows that the area of mangroves in Vietnam was reduced to 290,000 ha in 1962 and again to 252,000 in 1985, and that by 2000 only 155,290 ha remained (FAO 2007). According to national statistics on forest lands, the total area of natural mangrove forests in Vietnam now stands at 58,227
ha, with a further 73,293 ha of mangrove plantations (a total of 131,520 ha)24 (see Figure 6).
As the area of mangrove forest continued to decline significantly, deforestation bans were imposed in the mid-1990s and forest enterprises were established to replant and protect mangrove forests. As a result, overall net mangrove deforestation in Vietnam slowed from an annual average loss of over 5,820 ha of mangroves from 1990 to 2000 to approximately 1,980 ha since 2000. Today, the total area of mangrove forest is increasing gradually, but this is due to new forest plantations, often planted primarily for coastal protection, which are often monoculture and poor in biomass and biodiversity. This has led to a change in mangrove diversity with the highly diverse mangrove forests being turned into monoculture forests consisting primarily of planted

25
Rhizophora apiculata. The government is therefore under pressure to balance wider aspirations of an export-led economy with the conservation of the remaining mangrove forests. Against these competing agendas ISM systems have emerged as an opportunity to maintain production while ensuring a minimum area of forest cover (Ha T. et al. 2013).
4.3 Change in mangrove forest in the Mekong DeltaIn the Mekong Delta, mangrove forest is mainly distributed along the coastal saline swamps and estuaries in Ca Mau Peninsular, and partly in coastal areas of Tra Vinh and Ben Tre provinces. Between 1961 and 1973, about 105,000 ha of mangrove forest in Southern
Vietnam were destroyed by American herbicide spraying during the Vietnam-American War. 25 Immediately after this period and after re-unification, natural regrowth and government-sponsored replanting saw the area of mangrove forest increase in the late 1970s. However, during the 1980s and until the mid-1990s, there was another period of rapid loss of mangroves due to over-exploitation. In the late 1990s, mangrove forest area increased, at least partly due to donor-funded replanting projects, including the World Bank’s Coastal Wetlands Protection and Development Project and the Dutch funded Rehabilitation of Mangrove Forests project. Since the mid-1990s, the area of mangrove forest in the Mekong Delta has gradually increased (Pham Trong Thinh 2012, Miller F et al. 1999) (Figure 726).
25. Hong, Phan Nguyen and H.T. San, 1993. Mangroves of Vietnam. IUCN, Bangkok.
26. Adapted from Miller et al., 1999 and Pham Trong Thinh, 2012
64.5%
Figure 6: The mangrove area of Vietnam
450,000
400,000
350,000
300,000
250,000
200,000
150,000
100,000
50,000
1943 1962 1982 1990 2000 2010 2012

26
The net changes in mangrove forest area in the Mekong Delta over the last 50 years described above provide a broad picture for the region. However, as a broad description of net changes, it hides changes in mangrove area in some smaller locations within the region and particularly changes within the period from 2002 until 2010.
4.4 Change in mangrove forest area in Ngoc Hien districtConsistent with the experience in Mekong Delta, mangrove deforestation has also occurred in Ngoc Hien district. Forest cover was reduced from 95.7 percent in 1965 to only 28.7 percent in 1996. 27
More recently, it is estimated that the mangrove forest area declined from 50,918 ha in 1990 to 43,346 ha in 2000, a loss of over 7,570 ha, equivalent to 15 percent (Dien V.T. et al. 2011). A remote sensing study by the Space Technology Institute (STI) estimates that the area of mangroves was reduced further between 2004 and 2009, declining from
36,271 ha to 30,028 ha, a decline of 17 percent.28 Landsat images show that there was significant loss of mangroves in Ngoc Hien district including NMF between 1989 and 2009 (Map 4).
Since 2009, the trend of deforestation seems to have been reversed to one of afforestation. A later study by International Union for Conservation of Nature (IUCN) and STI estimated that the area of mangroves in Ngoc Hien increased by 14 percent between 2009 and 2013, an average annual increase of 313 ha and a reversal of the previous trend.
27. As cited in Benthem W., 199?. First steps towards integrated mangrove rehabilitation in the coastal Mekong Delta, Vietnam. Water Praxis Document, Nr. 10
28. Space Technology Institute, 2011. Land Cover Change Assessment in the Coastal Areas of the Mekong Delta 2004-2009, Technical Report. Department of Remote Sensing Technology-GIS-GPS, Space Technology Institute (STI), Vietnam Academy of Science and Technology (VAST)
64.5%
Figure 7: Mangrove forest area in the Mekong Delta
250,000
200,000
150,000
100,000
50,000
1960 1975 1980 1983 1989 1992 1995 1997 2002 2010
4.5 Change in mangrove forest area in Nhung Mien ForestWithin NMF, the NMF-MB has detailed forest cover data at the level of the individual farm. This data is based on field survey samples undertaken every five years with data then updated based on official records of mangrove harvesting and replanting. Data for 2006 and mid-2012 is available and this data indicates that mangrove cover in NMF

27
Map 4: Landsat (2009 and 1989) and Remote Sensing (2013) images of Ngoc Hien district and NMF 29
2013
29. IUCN
2009 1989

28
30. IUCN 2013 (a), Presentation: Mangrove Loss and Valuation: Ngoc Hien district, Ca Mau Province
31. 23ha were lost in the Critical Protection Zone
32. Interviews with FMB staff; IUCN workshop 2013 (IUCN 2013b)
33. FMB data, MAM Project
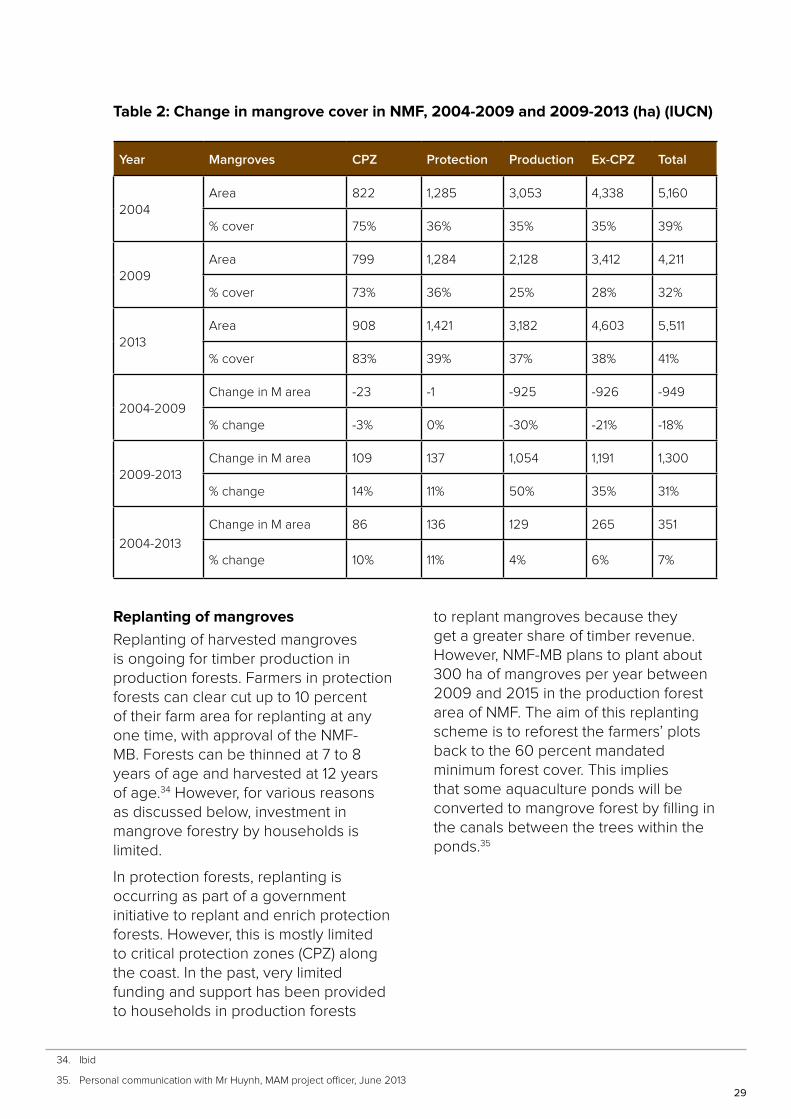
The IUCN study estimates that this trend of relatively significant deforestation between 2004 and 2009 was reversed between 2009 and 2013, when the total mangrove area increased by 1,300 ha, the great majority of which in the production forest zone. Overall, between 2004 and 2013, the net area of mangroves increased by 315 ha, equivalent to 7 percent (Table 2). The validity of these trends is generally supported by government officials and NMF FMB staff.32
The remote sensing method used by IUCN to determine forest cover and thus forest area is based on disaggregated data and thus recognises small changes in area within a larger forest area.
While almost all of the deforestation and subsequent afforestation of mangroves in NMF occurred in the larger production forest zone, there has also been a significant increase in forest cover in the protection zone since 2009 (136 ha, or approximately 11 percent). Notwithstanding this increase, currently in NMF, many of the household plots in both the production and protection forest zones have less than the mandated minimum 60 percent mangrove forest coverage and indeed, some plots have less than 10 percent remaining coverage. Overall, the latest available data indicates that NMF has about 43 percent mangrove forest cover, consisting of 40 percent in the production forest zone and 48 percent in the protection forest zone. Most of the remaining area is developed as aquaculture ponds.33
declined from approximately 53 percent in 2006 to 43 percent in 2012. This represents a decline of 19 percent over six years and an average annual decline of over 3 percent on 2006 levels. It appears that almost all of this loss of mangroves was due to conversion of mangrove forest to aquaculture ponds. This data indicates that during this period farmers continued to encroach upon the mangroves within their plots, or new plots were developed, gradually reducing the area of mangroves and expanding the area of aquaculture.
Other NMF data for the production forest zone suggests that forest cover in this zone was as low as 29 percent in 2008 and, with state-funded reforestation, was expected to reach 51 percent by end of 2013, though this assumes 100 percent survival and success rate of planned plantings.
The NMF-MB forest cover data is broadly consistent with the findings of a detailed study based on satellite imagery and remote sensing conducted by IUCN.30 The IUCN study assessed land change in NMF between 2004, 2009 and 2013. Between 2004 and 2009, an estimated 949 ha (18 percent) of mangroves was lost, almost all of which was in the production forest zone.31 About half of this loss was accounted for by a 474 ha increase in the area of aquaculture, equivalent to a 10 percent increase in the total aquaculture area. Most of the rest of the lost area of mangroves was accounted for by an increase in the area of sparse mangroves. This suggests that sparse mangroves are indeed areas of degraded mangrove forest, most likely aquaculture farms. More detailed analysis is needed.
29
34. Ibid
35. Personal communication with Mr Huynh, MAM project officer, June 2013
Replanting of mangroves
Replanting of harvested mangroves is ongoing for timber production in production forests. Farmers in protection forests can clear cut up to 10 percent of their farm area for replanting at any one time, with approval of the NMF-MB. Forests can be thinned at 7 to 8 years of age and harvested at 12 years of age.34 However, for various reasons as discussed below, investment in mangrove forestry by households is limited.
In protection forests, replanting is occurring as part of a government initiative to replant and enrich protection forests. However, this is mostly limited to critical protection zones (CPZ) along the coast. In the past, very limited funding and support has been provided to households in production forests
to replant mangroves because they get a greater share of timber revenue. However, NMF-MB plans to plant about 300 ha of mangroves per year between 2009 and 2015 in the production forest area of NMF. The aim of this replanting scheme is to reforest the farmers’ plots back to the 60 percent mandated minimum forest cover. This implies that some aquaculture ponds will be converted to mangrove forest by filling in the canals between the trees within the ponds.35
Table 2: Change in mangrove cover in NMF, 2004-2009 and 2009-2013 (ha) (IUCN)
Year Mangroves CPZ Protection Production Ex-CPZ Total
2004Area 822 1,285 3,053 4,338 5,160
% cover 75% 36% 35% 35% 39%
2009Area 799 1,284 2,128 3,412 4,211
% cover 73% 36% 25% 28% 32%
2013Area 908 1,421 3,182 4,603 5,511
% cover 83% 39% 37% 38% 41%
2004-2009 Change in M area -23 -1 -925 -926 -949
% change -3% 0% -30% -21% -18%
2009-2013Change in M area 109 137 1,054 1,191 1,300
% change 14% 11% 50% 35% 31%
2004-2013
Change in M area 86 136 129 265 351
% change 10% 11% 4% 6% 7%

31
Section 5Drivers of mangrove deforestation and degradation
5.1 Shrimp aquaculture and mangrove deforestationConversion of forest areas to aquaculture farms is officially recognised as a major driver of deforestation in some areas of Vietnam.36 The rapid loss of mangroves in the Mekong Delta during the 1980s and 1990s was due to overexploitation for human use, including timber extraction for construction and charcoal and the conversion of forest land into shrimp-farming land (Vo Q. et al. 2013, Clough B. et al. 2002). SAQ began to expand rapidly in Ca Mau in the 1980s and continued to expand incentivised by financial returns linked to export shrimp markets and land re-categorisation. The potential income source shrimp provided quickly became evident and led to indiscriminate expansion, with over 76,000 ha used for shrimp farming.37 This period witnessed widespread loss of mangrove forests in the south of the province. For example, in Ngoc Hien district, during the 10 year period from 1982 to 1992, the area of mangroves decreased by about 40,000 ha (48 percent) while the area of shrimp ponds increased to more than 30,000 ha and the population almost doubled (Binh, C.T. 1994).
The large scale allocation of forest land and large scale clearing of mangroves of the 1980s and 90s has abated. Since 2007, the area of aquaculture has expanded only slightly while shrimp production has continued to increase rapidly, indicating a marked intensification of shrimp farming (Figure 8).
36. Decision 799/QD-TTg (National REDD+ Strategy)
37. Ha et al., 2013b

32
38. Vietnam Government Statistics Office 2013; 2010-2012 from Ca Mau Statistical Yearbook 2012
Not only were mangrove areas converted to aquaculture, but rice farming land also. In response to the fact that the benefits offered by SAQ were much higher than that by rice farming, the Government of Vietnam issued resolution 09/2000/CP in 2000 that allowed provinces in the Mekong Delta to consider and re-structure production between agriculture, forestry and fishery. The resolution enabled Ca Mau province to issue Decision No 14/2000 concerning re-structuring the economic mechanism from agriculture to fishery, considering fishery as the most critical economic industry. Under this decision, farmers of Ca Mau province were allowed to convert rice fields, which were characterised by sulphate and saline soil and low productivity, into shrimp farming or mixed rice-shrimp farming. By 2004, across the whole province, 130,000 ha of rice fields were converted to SAQ and the mixed rice-shrimp model.
However, in the rush to switch, in many regions farmers themselves broke dykes to take saline water in for their aquaculture without waiting for the instruction from the provincial government. This, and the lack of use of adequate inputs and adhering to basic environmental standards, led to negative impacts on the environment, leading to failures in both rice and shrimp ponds. The deltas are marked by many areas of failed shrimp ponds that were abandoned after only a few seasons due to high costs and decreasing returns related to pond wall erosion, acid sulphate soils, shrimp disease and pollution. Parts of the mangrove forest were also converted into shrimp farms and uncontrolled expansion continued into them.
While the government encourages the SAQ industry with low-cost loans and export incentives, the quantity and quality of the growth of the SAQ industry is largely driven by the private sector and export prices. SAQ is dominated by smallholders for whom shrimp farming
Figure 8: Aquaculture area and shrimp production in Ca Mau province, 1995 to 201238
350
300
250
200
150
100
50
0
140
120
100
80
60
40
20
0
1995 1996 1997 1998 1999 2000 2001 2002 2003 2004 2005 2006 2007 2008 2009 2010 2011 2012
Aquaculture Area (ha) Shrimp production (’000 t)

33
39. Interview with NMF FMB staff, 15 January 2014, Mr Huynh of MAM project
and catching natural fish resources in tide operated sluice gates on the shrimp ponds remain the main sources of income. Households allocated forest lands to protect are encouraged by the high income from shrimp farming to increase the area of aquaculture by clearing mangroves (Vo Q. et al. 2013).
It is well known that mangrove forests provide an important habitat for shrimp. Mangroves provide wild feedstock of shrimp, fish and crabs for aquaculture farms and provide organic detritus for food and shade and root structures for shelter (Beveridge H.C.M. 1997, Ronnback P. 1999). The productivity and sustainability of SAQ is directly dependent on the continuous support of mangroves goods and services such as water quality maintenance and erosion control (Ronnback P. 2002). It is not known what percentage of mangrove cover is ideal for shrimp farming. Farmers interviewed in Ca Mau believe that mangrove coverage of less than 60 percent is optimal for their farms (Ha T. et al. 2013). This opinion underlies the clearing of mangroves by farmers beyond the 40 percent regulatory limit and is a factor in the deforestation experienced in NMF between 2004 and 2009. The deforestation and degradation and subsequent reforestation in NMF is mosaic. Mosaic configurations are described as any landscape in which no patch of forest in the project area exceeds 1,000 ha and the forest patches are surrounded by anthropogenically cleared land (Pearson et al. 2011). The deforestation and subsequent reforestation in NMF has occurred at many farms within the forest, rather than along a frontier.
The deforestation and degradation that occurred between 2004 and 2009 was also unplanned and illegal. Deforestation in NMF during this period generally did not occur due to official rezoning of the land for clearance or for sanctioned logging. While clearing of up to 40 percent of the mangrove area in a given plot is permitted, clearing beyond this level is not planned by the government and it is illegal. Clearing of a plot up to the minimum legally allowed limit of 60 percent remaining coverage is legally sanctioned and thus represents planned deforestation. However, almost all plots already had less than 60 percent mangrove coverage remaining in 2004 and so the additional deforestation and degradation that occurred was unplanned and illegal.
Since 2009, awareness raising has led to an increased recognition and understanding of the value of mangroves by both government agencies and farmers and this has contributed to the mangrove afforestation in recent years. A NMF-MB budget for reforestation has also been a factor in the reforestation.39
5.2 Lack of forestry incentives and illegal loggingThe low financial returns from mangrove timber and wood, and a restrictive management system, provide little incentive for farmers to plant mangroves. A recent study estimated that a farmer’s potential income from mangrove forestry in Ca Mau was less than 3 percent of shrimp income per hectare (Ha et al. 2013). Hence, most farmers are keen to expand their ponds by encroaching on areas set aside for mangroves rather than invest in forestry (Clough B. et al. 2002).

34
However, while there are inadequate incentives to encourage farmers to engage in productive mangrove forestry in NMF, there is also reportedly very limited illegal timber extraction because extracting and selling the timber without detection by the authorities is difficult.40 Mangrove timber is useful for local purposes and, in the past at least, it was used for rural houses (Clough et al. 2002). Such timber is legally available when forest areas are thinned. Although it is not clear, it seems that illegal timber extraction is not a significant driver of deforestation in NMF though it may be a driver of forest degradation as forest density is reduced.
5.3 Demand for fuel-wood Demand for wood for cooking by households is significant and thus is likely a driver of mangrove deforestation. Clough et al. (2002) estimated that based on the projected fuel-wood demand in Ca Mau province, the mangrove forests could not sustain demand for fuel-wood let alone timber. Today, households in NMF mostly use charcoal for cooking, sourced from legal charcoal enterprises.41 Farmers in protection and production forests are allowed to harvest dead wood and wood from approved forest thinning, which can be used as fuel-wood. The extent to which demand for fuel-wood for cooking is a driver of deforestation is not clear, however, at minimum it is likely a driver of forest degradation as forest density can be reduced if harvesting of fuel-wood is unsustainable. There are recent reports of illegal felling of mangroves for timber and for charcoal in the mangrove forests of Ca Mau.42
40. Interview with Mr Huynh, SNV MAM project officer, 24 June 2013
41. Interview with Mr Huynh, SNV MAM project officer, 24 June 2013
42. http://www.thanhniennews.com/index/pages/20130613-poor-people-burn-mangrove-home-for-charcoal-in-southern-vietnam.aspx
35
Section 6Nhung Mien mangrove forest scenarios
6.1 Baseline scenario / Forest reference emission levelVarious agencies have developed forest carbon principles and protocols, including guidelines and principles for measuring, reporting and verifying (MRV) GHG emissions or removals generated by forests and by forestry projects and initiatives. In order to estimate the potential for reducing GHG emissions, or removing GHGs from the atmosphere, it is necessary to determine the baseline, or business as usual, GHG emissions or removal level. Any GHG removals or reduction in emissions is then measured against this baseline, or forest reference emission level (REL), or forest reference level (RL) as it is known.
However, detailed methodological guidance or modalities have not yet been decided by the United Nations Framework Convention on Climate Change (UNFCCC) for developing a RL or MRV system, which countries can adopt or apply in their REDD+43 programmes. However, the basic concepts and guidelines were accepted by UNFCCC at the Conference of the Parties in Warsaw in November 2013, and a mechanism to assess submitted RELs established.44 The Intergovernmental Panel on Climate Change (IPCC) is recognised as the key source of scientific information to assist MRV and most protocols and carbon scheme methodologies refer to the IPCC Guidelines.45 Robust scientific methods have been developed and applied and further work is ongoing.46
43. Reducing Emissions from Deforestation and Forest Degradation in developing countries and the role of conservation, sustainable management of forests and enhancement of forest carbon stocks in developing countries; discussed in more detail in later sections
44. A draft decision on guidance forest reference emissions levels and/or forest reference levels as well as for MRV was reached at the thirty-ninth sessions of SBSTA followed by recommendation for a draft decisions for consideration and adoption by COP 19 in late November 2013 (UNFCC/SBSTA/2013/L.12)
45. The UNFCCC has formally adopted the IPCC 2006 “Guidelines for National Greenhouse Gas Inventories for the reporting of National Communications”. Chapter 4 deals with Agriculture, Forestry and Other Land Uses (AFOLU)
46. Not surprisingly, much of the effort by governments and donors has to date focussed on building the capacity of local stakeholders to undertake MRV. There are currently several MRV initiatives for REDD and forestry in Vietnam being supported by the national government and various donors, including the UN-REDD Programme and the Japan International Cooperation Agency (JICA)

36
In line with methodological guidance from the UNFCCC, the REL can be determined by: i) first establishing historical emissions, and then, ii) projecting emissions based on consideration of national circumstances. This entails selecting the historical reference period and the forest reference region relevant for the particular forest type and/or location.
This historical reference period is not yet defined by the UNFCCC. However, the Clean Development Mechanism (CDM), administered by the UNFCCC, has many rules and guidelines for forest carbon projects (though not yet for REDD+ projects). With regards to identifying the baseline scenario, which is essentially a project-level forest reference level, the CDM provides guidance on how to identify “realistic and credible land use scenarios” that would occur, or would have occurred in the project area in the absence of a project intervention.47 The scenarios should be feasible for the project participants or similar project developers taking into account relevant national and/or sectoral policies and circumstances, such as historical land uses, practices and economic trends. For CDM forestry projects, the reference period is from the beginning of 1990 and the reference region is the project area in question.
Voluntary carbon schemes are also paving the way with regards to detailed practical guidance (see Section 8 for more detail on carbon schemes). Perhaps the most reputable and commonly used voluntary carbon scheme for forestry projects is the Verified Carbon Standard (VCS).48 The VCS guidelines are similar to the CDM guidelines but the VCS generally
prescribes a historical reference period of at least ten years prior to the start of a project.49, 50 For improved forest management (IFM) methodologies, operating records for at least five years are needed. The VCS guidelines state that, for identifying baseline scenarios, factors such as historical deforestation and/or degradation rates should be taken into account, including in some cases the annual rate of forest conversion based on the recent historical practice of the most likely class (i.e. how much forest is typically cleared each year by similar baseline activities) and a projection of the rate of their deforestation activities in the area. With regards to the reference region, baseline determination may also require analysing a reference area (which need not be contiguous to the project area) that shall be similar to the project area in terms of drivers and agents of deforestation and/or degradation, landscape configuration and socio-economic and cultural conditions.51
6.2 NMF baseline scenario / Forest reference levelBased on the guidance described above, the reference period could be either since 1990 (23 years) or over the last 10 years (since 2003). The reference region for NMF could be either NMF itself, or a larger region encompassing Ngoc Hien district or Ca Mau province, for example. The analysis of mangrove deforestation presented above provides estimates for historical mangrove deforestation rates in these
47. A/R Methodological tool “Combined tool to identify the baseline scenario and demonstrate additionality in A/R CDM project activities” (Version 01) http://cdm.unfccc.int/methodologies/ARmethodologies/tools/ar-am-tool-02-v1.pdf
48. www.v-c-s.org
49. VCS AFOLU Additionality Tool, V3.0
50. VCS, AFOLU Requirements, v3.3
51. ibid

37
regions. Based on this data, an estimate of the average annual deforestation rate can be calculated. For Vietnam as a whole, the mangrove deforestation rate between 1989 and 2012 is estimated to be 2.1 percent, while for Ngoc Hien district, between 1990 and 2011, the deforestation rate is estimated to be 1.8 percent. Applying a shorter historical reference period of about 10 years, the trend in the annual average rate of forest cover change is positive for the Mekong Delta (0.47 percent) and NMF (0.7 percent), implying a rate of afforestation rather than deforestation (Table 3).
However, net changes in forest cover over large jurisdictions and periods can hide different forest cover change trends within smaller areas or periods. Also, data is not available for all years in all regions, so the deforestation rates between regions are not always directly
comparable. Data sources are also varied and inconsistent between regions and years, with estimates of mangrove cover often varying wildly. National statistics have not been consistently collected and methods, classifications and definitions have changed over this period, frustrating attempts to compile consistent reliable time-series data. Therefore, these estimates must be treated as indicative only.
Clearly, the trend in mangrove forest change is significantly different depending on the reference region and also the historical reference period. The trend in mangrove cover change has not been consistent during the reference periods, reflecting the importance of national circumstances, in the form of policies, regulations, funding and incentives. Market forces, such as international shrimp prices and shrimp
52. The data on mangrove cover for different areas are available for different periods
Table 3: Mangrove forest area and change over the years in each region (ha)
Year/ Change Vietnam Mekong Delta Ngoc Hien NMF
1989-90 213,500 93,500 50,918
1999-2000 155,290 43,347
2002 88,530
2004 36,271 5,160
2009 4,211
2010 139,956 91,906
2011 0 35,013
2012 131,520
2013 5,511
Starting from 1989-90 ending52 2010-13
Change (Ha) -81,980 -1,594 -15,905
Av annual change -3,564 -159 -757
% Change -38.4% -1.7% -31.2%
Av annual % change* -2.1% -0.1% -1.8%
2002-2004 to 2010-13
Change (ha) -23,770 3,376 -1,258 351
Av Annual Change -1,981 422 -180 39
% Change -15.3% 3.8% -2.9% 6.8%
Av Annual % Change* -1.4% 0.47% -3.0% 0.7%
*Compound average annual deforestation rates, declining balance

38
53. In fact, because the areas of remaining mangroves in the farms selected from the MAM project are relatively high, incremental loss may be higher in these farms than in non-selected farms
disease outbreaks, likely also play a role in incentivising deforestation. In this study, it has not been attempted to project future mangrove cover change based on these national circumstances. The estimated forest REL is based only on the historical deforestation and reforestation rates.
Two forest RELs or baseline scenarios are assumed and assessed for the purposes of this study:
• REL 1: The average annual deforestation rate experienced in Ngoc Hien since 1990 (to 2011), of 1.8 percent
• REL 2: The average annual net reforestation rate experienced in NMF in the last 10 years (2004 - 2013), of 0.7 percent.
Forest degradation
In addition to, or instead of, deforestation, forest degradation may also occur. That is, within the areas officially classified as mangrove forest, the density and quality of mangroves may be reduced. Based on assessment at the small-scale areas of individual farms, losses of mangroves are more likely to impact measurements of average mangrove canopy cover and thus be defined as deforestation rather than degradation. However, degradation of remaining mangrove areas is difficult to assess and baseline data is not available so degradation is not considered in the forest RELs in this study.
Forest management practices
Some of the plots selected for the MAM project are located in the production forest zone. As such, the areas of mangroves in these areas can be (and are) managed for forestry. Logging is allowed and is occurring. Harvesting of timber is permitted only if it is sustainable
and if areas logged are replanted. In the protection forest area of NMF, up to 10 percent of a farmer’s plot can also be clear cut and replanted with approval of NMF-MB. However, for a variety of reasons, current forest management practices in these areas are not optimal (Clough et al. 1999, 2002, Ha, van Dijk and Bush 2013). Forestry management practices influence forest productivity and also standing biomass (and thus carbon sequestration and storage – see below). For the purposes of this study, the baseline scenario is the continuation of existing sub-optimal forest management practices. However, it is recognised that IFM practices could significantly increase carbon sequestration rates.
6.3 Assumed forest REL 1: DeforestationFuture deforestation is assumed to continue to take the form of unplanned, mosaic deforestation as farmers stealthily and illegally reduce the area of mangroves in the plots in order to increase the area of aquaculture. An annual rate of deforestation of 1.8 percent in NMF-AQ due to conversion to aquaculture is assumed for the purposes of this study. Based on this annual baseline rate of deforestation, in the next 30 years it is projected that approximately 5,149 ha (42 percent) of mangroves will be lost in NMF-AQ. It is assumed that the baseline rate of deforestation in the MAM project area is the same as in the rest of NMF-AQ,53 and therefore the MAM project area is projected to lose 736 ha of mangrove forest over the next 30 years, or an average of 24.5 ha per year. It is assumed that all this area will be converted to aquaculture (Figure 9).
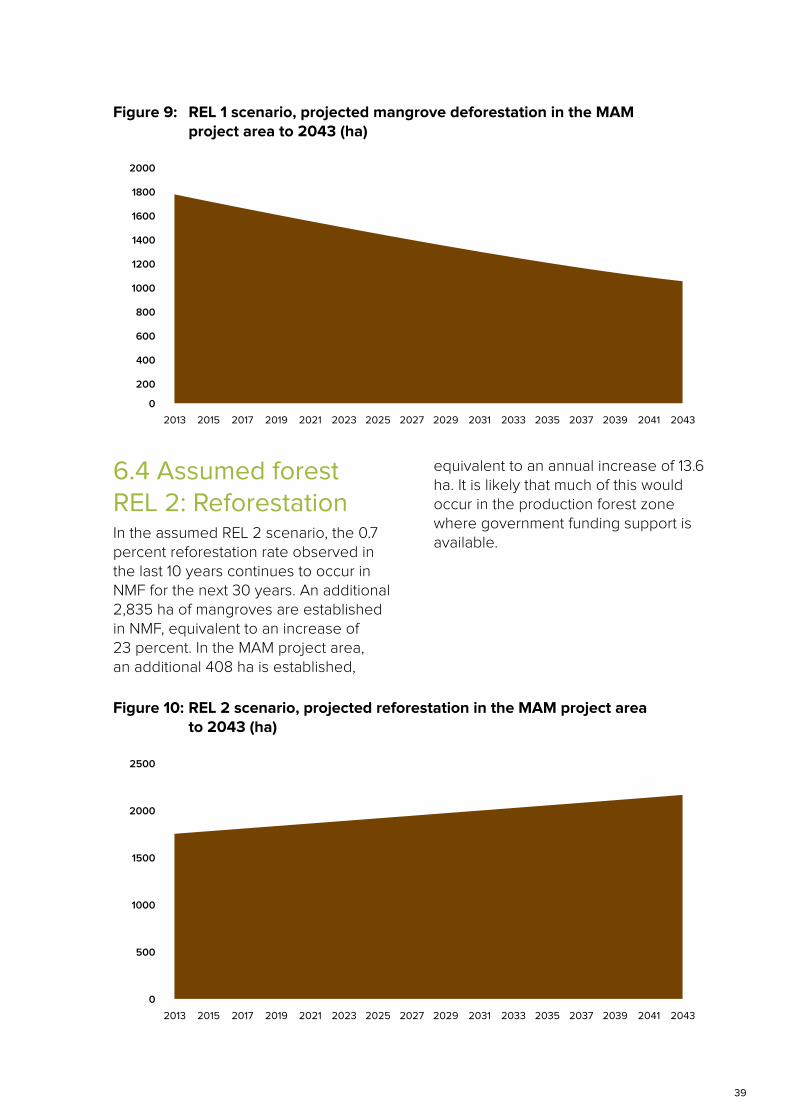
39
6.4 Assumed forest REL 2: ReforestationIn the assumed REL 2 scenario, the 0.7 percent reforestation rate observed in the last 10 years continues to occur in NMF for the next 30 years. An additional 2,835 ha of mangroves are established in NMF, equivalent to an increase of 23 percent. In the MAM project area, an additional 408 ha is established,
equivalent to an annual increase of 13.6 ha. It is likely that much of this would occur in the production forest zone where government funding support is available.
Figure 9: REL 1 scenario, projected mangrove deforestation in the MAM project area to 2043 (ha)
2000
1800
1600
1400
1200
1000
800
600
400
200
0
2013 2015 2017 2019 2021 2023 2025 2027 2029 2031 2033 2035 2037 2039 2041 2043
Figure 10: REL 2 scenario, projected reforestation in the MAM project area to 2043 (ha)
2500
2000
1500
1000
500
0
2013 2015 2017 2019 2021 2023 2025 2027 2029 2031 2033 2035 2037 2039 2041 2043

40
mangroves at the level of the individual farm, as required by NL, will make it more difficult for small losses of mangroves to go unnoticed and to not be officially classified as deforestation. MAM will have an impact on forest degradation though, primarily through IFM initiatives.
Improved forest management
The farmers selected for inclusion in the MAM project can still actively engage in mangrove forestry in accordance with national regulations so long as they maintain at least 50 percent mangrove coverage. NL does not provide incentives for the improved forestry management of the remaining mangroves within farms. However, the MAM project aims to improve forest cover and quality and training is being provided to selected farms on this. Improved practices, such as appropriate thinning and planting regimes, are expected to increase forest density and productivity.
It is difficult to estimate the extent to which the MAM project could increase forest productivity and biomass (see Box 2). Data on the current biomass productivity of the mangroves in NMF is not available. Studies of mangrove forests in the Mekong Delta have suggested that the productivity of mangrove forests could be significantly improved by IFM interventions, such as changes to planting densities and thinning regimes (Clough et al. 2002, 1999, Duke et al. 2010). Due to the lack of data, the potential increase in productivity of the mangroves in NMF is not estimated here and not included in the estimated impact of MAM interventions on GHG removals (see the following section).
6.5 MAM project scenario
Deforestation
In order to be certified with NL, farms are not permitted to remove or damage mangrove forest for purposes of construction or expansion of shrimp farms. Therefore, all farms selected for inclusion in the MAM project must ensure that no further deforestation occurs (at least not to make way for aquaculture ponds). It is recognised that stopping deforestation in all selected farms will be difficult and will depend on many factors and variables including, most critically, providing adequate incentives for farmers. However, for the purposes of this study, it is assumed that the MAM project will successfully stop deforestation in the MAM project area.
Reforestation
Farms must have a minimum of 50 percent mangrove coverage, and if not, they must reach this level within five years. Farms with less than 50 percent coverage will be incentivised and supported to plant mangroves to make up the deficit and to then protect and maintain this mangrove coverage. Based on current plot selection data, 313 of the selected plots covering 1,135 ha currently have less than 50 percent mangrove coverage. The mangrove forest in these plots covers 504.5 ha (44 percent). In total, an additional 63 ha of mangrove forest must be planted across these plots to reach the minimum 50 percent coverage required for NL certification (an average annual rate of 12.6 ha for the first five years).
Forest degradation
The NL standards are concerned with mangrove area as measured by forest canopy cover and not the density or health of the forest areas beyond this. However, measurement of remaining

41
6.6 Net impact on mangroves
Forest REL 1
The MAM project would stop deforestation across the whole 3,371 ha of the selected area. Based on the predicted annual rate of deforestation in the REL 1 scenario of one percent, the MAM project would thus reduce deforestation by an average of 23.5 ha per year and a total of 704 ha over a 30 year period. In the REL 1 scenario, it is assumed that all of this forest area would have converted to aquaculture. In addition, the MAM project would result in an additional 63 ha of mangrove forest being planted over the first five years, most likely by converting aquaculture ponds to mangroves (Table 4).
Forest REL 2
Under Forest REL 2, it is projected that NMF and the MAM project area would be reforested at an annual average rate of 0.7 percent. Data indicates that this would likely be a net reforestation rate and that there would in fact be
some areas of mangroves converted to aquaculture but larger areas of aquaculture reforested to mangroves. However, for the purposes of this study, the net reforestation rate is applied. This REL 2, business as usual reforestation rate is a higher rate than the expected reforestation that would occur due to the MAM project. As such, the MAM project would not be undertaking or incentivising any reforestation other than that which would have occurred anyway. Therefore, the MAM project would have no net impact on mangrove forest cover in NMF under the projected Forest REL 2 scenario.
This is a simplified analysis and a more detailed analysis of areas planned for reforestation within the MAM site might reveal that reforestation is not expected without the MAM project. Also, the MAM project would likely have an impact on forest density and productivity through support to IFM practices.
Box 2: Assessment of mangrove forests, shoreline condition and feasibility for REDD in Kien Giang province
A study by GIZ estimated the current standing biomass and carbon stock in Kien Giang province in the Mekong Delta, neighbouring Ca Mau province (Duke et al. 2010). The GIZ study also estimated the potential increase in productivity and thus carbon storage and sequestration that might be achieved through protection and restoration interventions. The Kien Giang mangroves are mostly on the coastal fringe, mostly comprised of Avicennia species and are in relatively poor overall condition, therefore the Kien Giang mangrove forests are not directly comparable to the mangroves in NMF. The mangroves in Kien Giang were also found to be subject to a high level of cutting. GIZ estimated that with protection, mangrove forest biomass in Kien Giang has the potential to increase by 3.5 times the current level due to improvements in the condition of the mangroves only. However, this was based on the different biomass per hectare of mature R.apiculata mangroves compared to the current mangrove forest in Kien Giang, which is mostly comprised on Avicennia species.

42
Table 4: Forest REL 1 and project scenarios for deforestation and mangrove conversion
Forest REL 1 scenario Rate MAM project area
Average annual deforestation rate 1.8% 23.5 ha
Proportion of lost mangrove area converted to aquaculture ponds 100% 23.5 ha
Annual rate of net reforestation 0 0 ha
MAM project scenario
Average annual deforestation rate 0% 0 ha
Average annual rate of conversion of mangroves to aquaculture ponds 0% 0 ha
Annual rate of net reforestation (first 5 years) 0.72% 12.6 ha
Total change over 30 years
Avoided deforestation
Reforestation
796 ha
63 ha

43
Section 7Estimated mangrove carbon impacts
7.1 Carbon sequestration and mangroves It is internationally recognised that carbon sequestration - removing carbon from the atmosphere and storing it in vegetation and soils - is a key part of the strategy to mitigate changes to the world’s climate. Deforestation and land use change currently account for 8-20 percent of global anthropogenic carbon dioxide (CO
2) emissions,
second only to fossil fuel combustion (van der Warf et al. 2009). Global GHG emissions from conversion of mangroves worldwide have been estimated at up to 0.45 Pg CO
2e
per year, roughly equivalent to the United Kingdom’s annual fossil fuel CO2 emissions,
and equivalent to an estimated annual economic cost of U$3.6 to U$18.5 billion (Pendleton L. et al. 2012).
Blue Carbon is the term used to describe carbon stored and sequestered in coastal wetlands and the oceans. Known as blue carbon sinks, mangroves, seagrass and saltmarsh can sequester and store carbon in their sediments and biomass at higher rates than those of tropical forests. Blue Carbon is significant and unlike most terrestrial ecosystems, the carbon stored in coastal wetland ecosystem sediments has extremely long residence times, potentially for millennia.54 It is estimated that Australia’s coastal wetland ecosystems sequester and bury carbon at rates of up to 66 times higher and store five times more carbon in their soils than those of Australia’s terrestrial ecosystems, including forests, on a per hectare basis (Lawrence A. et al. 2012).
54. The average time spent in a reservoir by an individual atom or molecule. With respect to greenhouse gases, residence time refers to how long on average a particular molecule remains in the atmosphere or locked up within the environment such as within a tree or in the soil

44
55. Donato D.C., Kauffman J.B., Murdiyaso D., Kurnianto S., Stidham M. and Kanninen M., 2011. Mangroves among the most carbon-rich forests in the tropics. Nat Geoscience 4:293–297
7.2 Carbon storage by mangrovesIn the context of carbon dioxide (CO
2)
sequestration, the relevant carbon sinks to consider are:
1. Carbon in soils Carbon in soils refers to carbon buried in sediments locally or in adjacent systems generated by annual turnover of small litter such as flowers, leaves, twigs and small branches, as well as trapped sediment. Mangroves in particular sequester a relatively large amount of carbon in soils, which is stored for relatively long periods of time (i.e. a long-term carbon sink).
2. Living biomass Living biomass refers to standing stock of forest biomass, both above- and below-ground, which increases
as trees develop (grow). Mangroves have a relatively large proportion of below-ground biomass (BGB) compared to above-ground biomass (AGB) due to their relatively large root structure (Komiyama A. et al. 2008).
Compared to other tropical forests, mangroves have a relatively high productivity and potential to sequester and store carbon (Donato D.C et al. 2011). A study was carried out to measure carbon storage (above- and below-ground, including soils) in mangroves across a broad tract (spanning 30° of latitude and 73° of longitude) of the Indo-Pacific region (Donato D.C et al. 2011). This study found the total carbon storage to be very high relative to most forest types, with a mean of 1,043 tonnes of carbon per ha and range of 437 to 2,186 tonnes of carbon per ha. Above-ground carbon storage was estimated at 159
Figure 11: Comparison of mangrove carbon storage with that of major global forest domains 55
1400
1200
1000
800
600
400
200
Temperate TropicalBoreal MangroveIndo-Pacific
Above-ground live + dead
Soils 0-30cm depth + roots
Soils below 30cm depth
Eco
syst
em
C s
tora
ge
(M
g h
a-1)
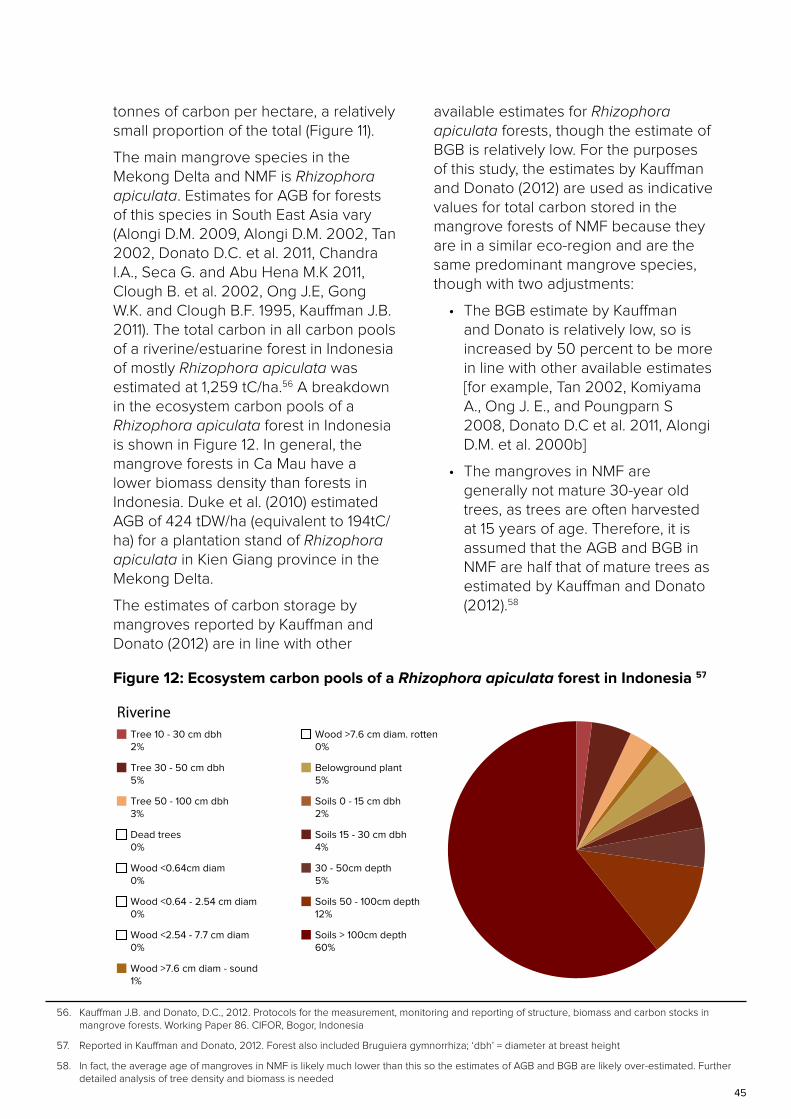
45
56. Kauffman J.B. and Donato, D.C., 2012. Protocols for the measurement, monitoring and reporting of structure, biomass and carbon stocks in mangrove forests. Working Paper 86. CIFOR, Bogor, Indonesia
57. Reported in Kauffman and Donato, 2012. Forest also included Bruguiera gymnorrhiza; ‘dbh’ = diameter at breast height
58. In fact, the average age of mangroves in NMF is likely much lower than this so the estimates of AGB and BGB are likely over-estimated. Further detailed analysis of tree density and biomass is needed
tonnes of carbon per hectare, a relatively small proportion of the total (Figure 11).
The main mangrove species in the Mekong Delta and NMF is Rhizophora apiculata. Estimates for AGB for forests of this species in South East Asia vary (Alongi D.M. 2009, Alongi D.M. 2002, Tan 2002, Donato D.C. et al. 2011, Chandra I.A., Seca G. and Abu Hena M.K 2011, Clough B. et al. 2002, Ong J.E, Gong W.K. and Clough B.F. 1995, Kauffman J.B. 2011). The total carbon in all carbon pools of a riverine/estuarine forest in Indonesia of mostly Rhizophora apiculata was estimated at 1,259 tC/ha.56 A breakdown in the ecosystem carbon pools of a Rhizophora apiculata forest in Indonesia is shown in Figure 12. In general, the mangrove forests in Ca Mau have a lower biomass density than forests in Indonesia. Duke et al. (2010) estimated AGB of 424 tDW/ha (equivalent to 194tC/ha) for a plantation stand of Rhizophora apiculata in Kien Giang province in the Mekong Delta.
The estimates of carbon storage by mangroves reported by Kauffman and Donato (2012) are in line with other
available estimates for Rhizophora apiculata forests, though the estimate of BGB is relatively low. For the purposes of this study, the estimates by Kauffman and Donato (2012) are used as indicative values for total carbon stored in the mangrove forests of NMF because they are in a similar eco-region and are the same predominant mangrove species, though with two adjustments:
• The BGB estimate by Kauffman and Donato is relatively low, so is increased by 50 percent to be more in line with other available estimates [for example, Tan 2002, Komiyama A., Ong J. E., and Poungparn S 2008, Donato D.C et al. 2011, Alongi D.M. et al. 2000b]
• The mangroves in NMF are generally not mature 30-year old trees, as trees are often harvested at 15 years of age. Therefore, it is assumed that the AGB and BGB in NMF are half that of mature trees as estimated by Kauffman and Donato (2012).58
Soils > 100cm depth60%
Tree 10 - 30 cm dbh2%
Tree 30 - 50 cm dbh5%
Tree 50 - 100 cm dbh3%
Dead trees0%
Wood <0.64cm diam0%
Wood <0.64 - 2.54 cm diam0%
Wood <2.54 - 7.7 cm diam0%
Wood >7.6 cm diam - sound1%
Wood >7.6 cm diam. rotten0%
Belowground plant5%
Soils 0 - 15 cm dbh2%
Soils 15 - 30 cm dbh4%
30 - 50cm depth5%
Soils 50 - 100cm depth12%
Riverine
Figure 12: Ecosystem carbon pools of a Rhizophora apiculata forest in Indonesia 57

46
Table 5: Assumed indicative values for total carbon stored by mangrove forests in NMF*
Carbon poolTonnes of carbon per
hectare
Tonnes of CO2e per ha59
(potential emissions)
Above-ground biomass 7060 257
Below-ground (plant) biomass 45 165
Soils (0-100cm depth)
Soils (>100cm depth)
Soils (total)
300
760
1,060
1,100
2,790
3,890
Total 1,175 4,312
*Values rounded
Based on the above, the total carbon stored per hectare of mangroves is 1,175 tonnes, equivalent to 4,312 tonnes of carbon dioxide (Table 5). These estimates are very broad and based on many assumptions and so are indicative only. Site specific measurements in NMF are needed to provide more accurate estimates.
59. 1 tonne of carbon is equivalent to 3.67 tonnes of carbon dioxide (tCO2)
60. The carbon content of Rhizophora apiculata wood biomass is approximately 45.9%, implying an AGB of 152 t Dry Weight per hectare (Kauffman et al., 2011)
61. Alongi D.M., 2009. Paradigm shifts in Mangrove Biology, in Coastal Wetlands: An Integrated Ecosystem Approach, eds. Perillo, Wolanski, Cahoon and Brinson, Chapter 22; Twilley R. R., Chen R.H. and Hargis T., 1992. Carbon sinks in mangroves and their implications to carbon budget of tropical coastal ecosystems. Water, Air, and Soil Pollution 64: 265-288, 1992
62. Laffoley, D.d’A. & Grimsditch, G. (eds), 2009. The management of natural coastal carbon sinks. IUCN, Gland, Switzerland. 53 pp
63. Ong J.E. and Gong W.K., 2013. Structure, Function and Management of Mangrove Ecosystems, ISME Mangrove Educational Book Series No. 2, available at http://www.mangrove.or.jp/isme/english/books/educational-series.book2.pdf
7.3 Annual carbon sequestration ratesThe growth rate and thus the amount of carbon sequestered annually by mangroves have been estimated in several studies (Alongi D.M. 2009, Donato D.C. et al. 2011, Clough B. et al. 2002, Tan 2002, Donato, D.C et al. 2011, Komiyama A., Ong J. E. and Poungparn S. 2008).
The carbon sequestration or GHG removal capacity of mangrove forests varies considerably depending on a number of factors including species and site location and importantly the frequency and duration of tidal inundation. Productivity is greatest at latitudes of less than 100, such as in South East Asia including the Mekong Delta.61 At least one study indicates
that productivity of restored mangrove stands (both above- and below-ground) is similar to those of natural stands, and any variability is more likely to be related to environmental conditions rather than to the natural or replanted status.62
Gross primary production of a plant is the total energy it fixes during the process of photosynthesis. The plant uses much of this for metabolic energy and the remainder is net primary productivity (NPP) which consists of the growth in biomass as well as losses from the tree as litter production and root exudates. Estimates of net productivity thus include annual turnover such as leaf-litter and dead trees and branches.63 Mangroves function as a net carbon sink if the rate of carbon entry to a system via photosynthetic transformation to plant material and eventually the soil, is greater than the rate at which it leaves
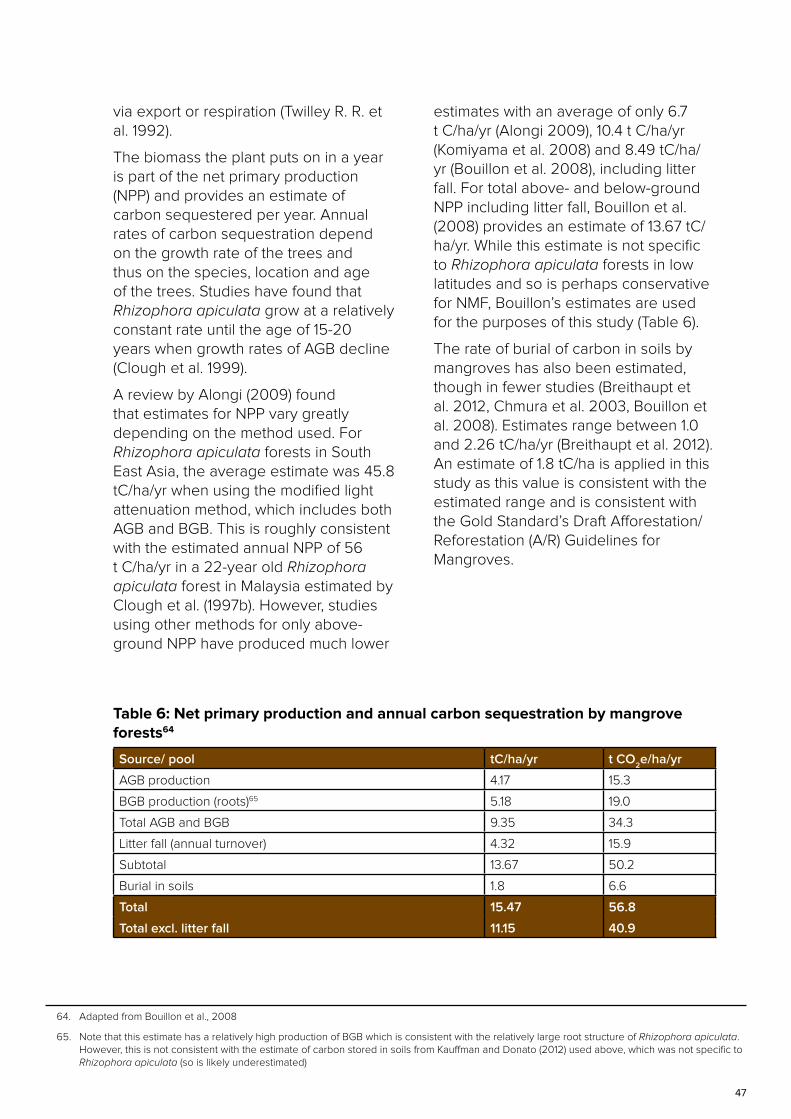
47
64. Adapted from Bouillon et al., 2008
65. Note that this estimate has a relatively high production of BGB which is consistent with the relatively large root structure of Rhizophora apiculata. However, this is not consistent with the estimate of carbon stored in soils from Kauffman and Donato (2012) used above, which was not specific to Rhizophora apiculata (so is likely underestimated)
via export or respiration (Twilley R. R. et al. 1992).
The biomass the plant puts on in a year is part of the net primary production (NPP) and provides an estimate of carbon sequestered per year. Annual rates of carbon sequestration depend on the growth rate of the trees and thus on the species, location and age of the trees. Studies have found that Rhizophora apiculata grow at a relatively constant rate until the age of 15-20 years when growth rates of AGB decline (Clough et al. 1999).
A review by Alongi (2009) found that estimates for NPP vary greatly depending on the method used. For Rhizophora apiculata forests in South East Asia, the average estimate was 45.8 tC/ha/yr when using the modified light attenuation method, which includes both AGB and BGB. This is roughly consistent with the estimated annual NPP of 56 t C/ha/yr in a 22-year old Rhizophora apiculata forest in Malaysia estimated by Clough et al. (1997b). However, studies using other methods for only above-ground NPP have produced much lower
estimates with an average of only 6.7 t C/ha/yr (Alongi 2009), 10.4 t C/ha/yr (Komiyama et al. 2008) and 8.49 tC/ha/yr (Bouillon et al. 2008), including litter fall. For total above- and below-ground NPP including litter fall, Bouillon et al. (2008) provides an estimate of 13.67 tC/ha/yr. While this estimate is not specific to Rhizophora apiculata forests in low latitudes and so is perhaps conservative for NMF, Bouillon’s estimates are used for the purposes of this study (Table 6).
The rate of burial of carbon in soils by mangroves has also been estimated, though in fewer studies (Breithaupt et al. 2012, Chmura et al. 2003, Bouillon et al. 2008). Estimates range between 1.0 and 2.26 tC/ha/yr (Breithaupt et al. 2012). An estimate of 1.8 tC/ha is applied in this study as this value is consistent with the estimated range and is consistent with the Gold Standard’s Draft Afforestation/Reforestation (A/R) Guidelines for Mangroves.
Table 6: Net primary production and annual carbon sequestration by mangrove forests64
Source/ pool tC/ha/yr t CO2e/ha/yr
AGB production 4.17 15.3
BGB production (roots)65 5.18 19.0
Total AGB and BGB 9.35 34.3
Litter fall (annual turnover) 4.32 15.9
Subtotal 13.67 50.2
Burial in soils 1.8 6.6
Total 15.47 56.8
Total excl. litter fall 11.15 40.9

48
7.4 Conversion of mangroves to aquaculture and release of carbon to the atmosphereWhen an area of mangroves is cleared or harvested, the annual carbon sequestration by mangroves is foregone (i.e. 15.47 tC/ha/yr). In addition, depending on how the harvested AGB is used, the carbon stored in AGB is released (i.e. 70 tC/ha).
Depending on what the cleared land is used for, there are often also losses of BGB and losses from the soil carbon pool, particularly from the surface sediment carbon pool (often assumed to be in the top one metre of soil). There are also potentially large, but not well understood carbon losses from deep sediments (as per Lawrence et al. 2012, Donato et al. 2011).
Digging up mangrove soils for the construction of aquaculture ponds not only stops carbon fixing by the plants but also oxidises stored carbon into carbon dioxide. When mangroves are harvested, only the AGB is removed. The BGB however, remains underground (in anoxic or almost anoxic conditions) and eventually becomes peat or even coal. Here the sequestration could be for hundreds or thousands of years. If, on the other hand, mangrove land is dug up and converted to aquaculture ponds, much of the large amounts of carbon stored in the soil, perhaps 75 percent, are released (Ong and Gong 2013).
A recent study estimated that 4.7 billion tonnes of CO
2 has been emitted from the
Mekong Delta due to land use change (World Bank et al. 2010).
7.5 Estimated carbon impacts of the MAM project in NMF
Measuring carbon impacts
For forest carbon measurement against the forest REL, information is needed to generate and estimate:
• Activity data (AD), defined as the extent to which a human activity takes place. AD portrays the magnitude of human intervention on the land use/land cover change leading to GHG emissions and/or removals and therefore AD is driver-specific66
• Emission factor/removal factors (EF/RF), defined by the IPCC (2006) as the emission or removal rate of GHG per unit of the activity. EF/RF’s are directly linked to the activity that results in GHG emissions and are the coefficients which quantify the emissions or removals per activity unit.
In the MAM case, AD refers to the reduction of deforestation and the reforestation of farm plots. Given that under forest REL 2 the MAM project has no net effect on mangrove cover, only REL 1 is considered here.
Avoided deforestation
As discussed above, the MAM project would stop deforestation of mangroves in NMF-AQ and thus avoid deforestation of an average of 23.5 ha per year.67 In the REL 1 scenario there would have been an initial loss of carbon associated with the release of AGB due to clearing of mangroves. It is assumed here that no BGB would be released to the atmosphere, though this is conservative in the case of excavation activities for
66. Casarim et al., 2013
67. Note that the area deforested is higher in the initial years and declines each year, based on 1.8% of a declining remaining area

49
68. 3 years is applied by VCS REDD methodologies for short-term wood products
69. The time-scale of CO2 release from soil carbon is not well known but 10 years has been estimated (Ong and Gong 2013, Pendleton et al. 2012);
IPCC Guidelines indicate a 20-year period, though this is likely conservative in the case of excavated tropical soils (GOLD-GOFC, 2012)
aquaculture ponds. This loss would occur once for each hectare cleared. However, exactly when the carbon stored in the mangrove timber is released depends on what the timber is used for. Mangrove timber is often used for local buildings and structures but much is also used for fuel-wood and charcoal. As such, it is expected that the timber is destined mostly for short-term use and thus would be released over three years.68
There would also be an annual loss of carbon that would have been sequestered by these trees. As such, for each year of the project, there is an additional area of mangroves that are sequestering carbon such that the total amount of additional carbon sequestered as a result of the MAM project will increase each year. Carbon accounting methodologies generally allow inclusion of the sequestration in AGB, BGB and soil carbon pools but not leaf-litter fall, so leaf-litter fall (annual turnover) is excluded from sequestration estimates here. As per Table 6, it is estimated that 40.9 tCO
2/ha/yr would
be sequestered by the conserved mangroves.
Conversion to aquaculture
In the aquaculture farms of NMF, aquaculture ponds are usually at least one metre deep and the excavated soil is usually dumped on neighbouring areas or (illegally) dumped into the waterways (Clough et al. 1999). Therefore, oxidisation and release of soil carbon to the atmosphere is likely to occur for mangrove areas converted to aquaculture, though further research is needed to confirm oxidisation rates in such cases. Assuming that only the first metre of soil is excavated for shallow aquaculture ponds such that deeper
soil carbon remains undisturbed, up to 300tC per ha could be released. Assuming that the release of carbon occurs over a 10-year period,69 30 tC/ha/yr is estimated to be released into the atmosphere equivalent to 110 tCO
2e/ha/yr. This is more than twice the
estimated annual carbon sequestration by mangroves per hectare. However, a conservative estimate of 75 percent of this soil carbon being released to the atmosphere and a release period of 20 years is applied here.
The MAM project will avoid the conversion of 23.5 ha of mangroves each year. Therefore, the project will result in the avoidance of conversion to aquaculture and avoidance of the release of GHGs from carbon in the soil. The avoided GHG emissions would otherwise have been released from the soil over 20 years and so emissions from soil carbon that are avoided by the project will increase each year of the MAM project for the first 20 years.
Reforestation
The MAM project would also ensure an average of 12.5 ha of mangroves to be reforested during the first five years of the project, in order for those farms that currently have less than 50 percent mangrove coverage to meet the Naturland standards. These trees would sequester carbon each year. As the area of mangroves thus reforested increases for the first five years of the project, the total annual amount of carbon sequestered by these additional trees also increases for the first five years.

50
Total
In total, over a 30-year period, based on the assumed rates of avoided deforestation and the afforestation and on the assumed carbon sequestration by mangroves in NMF, the MAM project could result in an estimated reduction of over 1.154 million of tC0
2e being released
to the atmosphere, an average of over 38,475 tCO
2e per year (Table 7).
Emission reductions are greater in earlier years, then they gradually increase as the area and thus emissions accumulate and then level off as the annual increment in deforestation declines (Figure 13). Avoided conversion refers to avoidance of conversion of mangrove areas to aquaculture and the associated avoidance of the release of soil carbon.
This estimate is indicative only and is based on the assumptions above. It also does not account for any leakage of the project. That is, any GHG emissions caused by the project activities indirectly outside of the project area, such as displacement of mangrove loss and conversion to aquaculture to areas outside the project boundary. However,
given that each aquaculture farm is independent from other farms and the actors in the project area cannot simply move their activities to another area, this form of leakage is expected to be minimal. Leakage associated with mangrove timber and fuel-wood, however, could be important. The above estimate also does not account for the setting aside of a buffer area required by most carbon accounting methodologies to account for impermanence and uncertainty associated with the project (i.e. conserved and reforested mangroves could subsequently be cut down in later years and the carbon released). However, it is noted that continued NL certification requires ongoing maintenance of at least 50 percent mangrove cover.
Table 7: Estimated total potential reduction in GHG emissions by the MAM project over 30 years
Avoided emissions or removal Activity tCO2e
Baseline - GHG emissions Clearing mangroves - release of carbon in AGB 176,214
Conversion to aquaculture - release of soil carbon 423,147
Project - GHG removal Sequestration by conserved mangroves 483,300
Sequestration by additional planted mangroves 71,586
TOTAL 1,154,246

51
Figure 13: Estimated reduction in GHG emissions due to the MAM project over 30 years (tCO
2e)
60,000
50,000
40,000
30,000
20,000
10,000
1 3 5 7 9 11 13 15 17 19 21 23 25 27 29
Avoided Conversion
A�orestation
Additional Seqestion
Avoided Deforestation

52

53
Section 8Carbon markets and schemes
There are several carbon schemes or standards, both for compliance and voluntary markets. Projects or programmes successfully registered with such schemes can earn carbon credits in accordance with the reduction in GHG emissions they generate. The carbon credits can then be sold in the market to provide a source of sustainable, performance-based carbon financing. To register with one of the carbon schemes, a project must:
• Demonstrate that it meets the eligibility criteria for the scheme and project type and that the emission reductions will be additional to what would occur in the baseline
• Apply one of the approved scientific methodologies for the estimation and monitoring of the carbon credits claimed by the projects
• Be validated by an accredited third-party auditor.
Projects can be grouped or bundled together or developed as part of an over-arching programme of activities. Actual emission reductions must again be verified by an auditor before carbon credits are issued to the project. There are several different carbon schemes, including the Clean Development Mechanism (CDM) of the UNFCCC and various voluntary carbon schemes. Emissions reduction projects or programmes registered with the CDM generate ‘compliance grade’ carbon credits (CERs), while those registered with a voluntary carbon scheme generate voluntary carbon credits (VERs). CERs can be formally used to meet a country’s GHG commitments under the Kyoto Protocol. VERs tend to be bought as a preparation for the possibility of future compliance-based requirements and to offset personal and corporate emissions, for example from flights. These projects are often promoted as providing higher environmental or social co-benefits than projects in the compliance market.
While REDD+ is not yet incorporated in the CDM, REDD+ has been incorporated into voluntary carbon schemes and standards. Methodologies have been developed and the first REDD projects have been registered and are receiving verified carbon credits. In particular, the VCS, Plan Vivo and the American Carbon Registry (ACR) are potentially relevant to the MAM project. The VCS is the leading international voluntary carbon scheme and has approved several REDD+ methodologies. Plan Vivo is an innovative scheme targeting small-scale farmers and communities dependent on natural resources (Box 3 and Annex 1). A preliminary assessment of the potential to apply VCS methodologies and the Plan Vivo framework to the MAM project is undertaken in Section 10 and Annex 2.
54
The price received for VERs has historically been lower than the price received for CERs, but prices for VERs are now considerably higher. However, the market for VERs is relatively small and buyers must be found on a project basis. It is estimated that in 2011 the global market for carbon credits from forestry projects totalled about US$237 million and 26 million tCO
2e, mostly in over-the-counter
voluntary carbon schemes. Prices ranged from less than $1/tCO
2e to over
$100/tCO2e, highlighting the bespoke
nature of the voluntary carbon markets and the importance of the particular carbon scheme, location and other environmental and social co-benefits of the project. REDD+ credit transaction volumes fell by 62 percent in 2011 as projects came to terms with the unexpected complexities and costs of newly available methodologies; decreased demand from recession-constrained European buyers; and the intricacies of tenure, community building and evolving policy environments that characterised global challenges to REDD+ project implementation and finance.
8.1 Jurisdictional and Nested REDD+ (JNR) Initiative The methodologies above are for accounting and crediting of project-level REDD activities. In order to scale up REDD activities, and in part due to concerns over project level leakage, policymakers and governments are currently considering accounting and crediting of REDD+ at sub-national and national (i.e. jurisdictional) levels. In early 2011, the VCS launched the Jurisdictional and Nested REDD+ (JNR) Initiative to develop accounting frameworks for crediting REDD+ activities at the state, provincial and national ( jurisdictional)
levels, including frameworks for “nesting” or integrating project level activities. Some methodologies defer to jurisdictional baselines covering the project area if and when developed. Under the JNR Initiative, there are several possible scenarios:
• Scenario 1: Jurisdictional baseline with crediting to projects only
• Scenario 2: Jurisdictional REDD+ programme with crediting to the jurisdiction and direct crediting of nested projects
• Scenario 3: Jurisdictional REDD+ programme with crediting only to jurisdiction and no direct crediting of nested projects
In October 2012, ACR published a Nested REDD+ Standard, along the same lines as the VCS nested REDD initiative. ACR defines a nested REDD+ project as a REDD+ project that includes activities occurring at a level below the national or sub‐national level at which a jurisdictional accounting framework operates, and which is accounted for and monitored in reference to the jurisdictional accounting framework in which the project takes place.
A JNR approach may prove to be an innovative and suitable approach for the MAM project, as farms selected for participation in NL are within a broader area of mangrove forest managed by the NMF-MB and within the jurisdiction of Vien An Dong commune and Ca Mau province. However, at this stage, there are no JNR baselines and initiatives for Ca Mau province.

55
8.2 InsettingInsetting is a relatively recent and innovative initiative to reduce GHG emissions. Insetting is similar to voluntarily off-setting the GHG emissions of a company by purchasing VERs. However, rather than purchasing off-sets from a third-party emissions reduction project, insetting aims to reduce GHG emissions generated by the company itself, including emissions associated with activities in the company’s supply chain, staff and customers.
Carbon insetting has been defined as a partnership or investment in an emission reducing activity within the sphere of influence or interest of a company, whereby the GHG reductions are acknowledged to be created through partnership and where mutual benefit is derived (Tipper et al. 2009).
It is consistent with the Plan Vivo model described above where primary suppliers such as farmers are engaged in the process of reducing GHG emissions, and thereby generate carbon revenue and other sustainability benefits. It is a way to not only offset a company’s GHG emissions, but to also engage a company’s staff, suppliers and customers in climate change efforts and contribute to behaviour change. Insetting may also offer a way for companies to provide some other immediate benefits to their customers, suppliers or staff while at the same time off-setting the GHG emissions of their operations. As such, companies may be more prepared to fund insetting initiatives even when purchasing offsets from third-party projects may be cheaper. This could be very important for determining the feasibility of the carbon project.
Insetting projects generally rely on other existing carbon standards and methodologies to quantify and validate the GHG emissions from the project(s). However, insetting projects do not necessarily have to be registered with a carbon scheme or validated and verified in accordance with such schemes, thus transaction costs can be avoided. Registering such projects with a reputable carbon scheme would however, ensure a rigorous and reliable approach to estimating GHG emissions reductions is applied and thus provide creditability to GHG reduction claims.
For MAM, insetting appears to offer an interesting opportunity for shrimp processing companies, such as Minh Phu, that are keen to reduce the GHG emissions associated with their operations, improve the general sustainability of their operations and provide some additional incentives and benefits to the farmers in their supply chain. There appears to be scope to integrate the product certification requirements of schemes such as NL with GHG reduction initiatives. There also appears to be some scope to align insetting initiatives with Plan Vivo.

56

57
Section 9Other carbon finance opportunities
9.1 NAMAsNationally Appropriate Mitigation Actions (NAMAs) were introduced at the Bali-UN Conference of the Parties in 2007 as a voluntary mitigation-contribution of the developing and transition countries, supported by industrialised countries with financial and technological promotion as well as capacity building. NAMAs were devised to overcome some of the perceived problems with a project-based approach. NAMAs are usually sector-based or policy-based rather than project-based, are national in scope and can include policies, strategies or large-scale projects. NAMAs are established and funded by the public sector, with governments of developing countries seeking finance from donors and markets in the case of credited NAMAs in exchange for demonstrated reductions in GHG emissions. While public sector funding is usually required to establish a NAMA, NAMAs generally aim to promote private sector investment in the actual activities.
However, NAMAs share many of the same elements of project-based approaches, such as the need for robust MRV of GHG emission reductions. In some cases, NAMAs can be similar to an extension of GHG reduction programmes of activities (POAs) or jurisdictional REDD approaches.
The framework for developing NAMAs, and for NAMA financing, is not yet clearly established. NAMAs are a new instrument to be made operational under the new legally binding climate agreement currently being drawn up. However, significant work is already underway to develop structures and approaches for NAMAs and NAMA financing. At present, 50 countries have submitted NAMAs to the UNFCCC, ranging from projects to policies, as well as strategies and with varying degrees of detail. Almost one fifth of submitted NAMAs are related to forestry (Tilburg et al. 2012). Nearly all activities associated with NAMAs currently under development are preparatory in nature. The support presently being provided for NAMAs is mostly focused on creating ‘readiness’ by building capacity and raising awareness, by setting up processes and institutions, and by developing NAMA proposals.

58
Funding for NAMAs is expected through the Green Climate Fund (GCF), which came into operation in 2012.70 However the GCF has not yet received pledged funds and has not yet developed a method or protocols for disbursing funds.
It is possible that the MAM project’s efforts to increase and maintain mangrove forests could be expanded and developed into a NAMA or become part of a NAMA. For example, a NAMA might be structured as a strategy to achieve the objective of the currently ineffective existing government regulation to maintain mangrove forest cover of at least 60 percent in protection and production mangrove forests (in Ca Mau province or nation-wide). Appropriate economic incentives for farmers are needed, perhaps with funding support from donors and/or the government. Initiatives to support shrimp farmers comply with the shrimp product certification standards of NL (or a variant of NL) could also be part of the NAMA strategy.
However, given the early stage of evolution of NAMAs the MAM project as a NAMA is considered a less suitable option than the others examined in this report.
9.2 National REDD fundsIn June 2012, the Government of Vietnam (GoV) approved the National Action Programme on “Reducing Emissions from Deforestation and Forest Degradation, Sustainable Management of Forests, Conservation of Forests and Enhancement of Forest Carbon Stocks” in the period 2011-2020 under the Decision 799/QD-TTg. The goal of this REDD+ programme is to contribute to the successful implementation of the
National Climate Change Strategy and the poverty reduction goals towards sustainable development. The MARD appointed the Vietnam Administration of Forestry, with support from various international organisations and projects, to organise and implement several key activities related to REDD+. These include: the development of RELs/RLs for application in forestry based on historical input data from 1991 to date; research to design an appropriate benefit distribution system (BDS) for REDD+; development of a MRV system; and establishment of a national forest inventory and assessment process.
The UN-REDD Programme is the main donor assisting Vietnam to implement the National REDD+ Programme. Vietnam was one of the original UN-REDD “pilot” countries. The UN-REDD Programme has assisted the GoV in establishing a national REDD+ Network, where various stakeholders come together to coordinate REDD+ related issues, and the Vietnam REDD+ Office. Phase I of the programme was focussed on REDD readiness including awareness raising and capacity building and was completed in October 2012.
The UN-REDD Vietnam Phase II Programme, “Operationalising REDD+ in Vietnam”, was initiated in November 2012 with funding from Norway. The overall goal of the programme is to ensure that the “forestry sector contributes to the 2020 target for agriculture and rural development emission reductions (Decision MARD 3119 of 2011)”. Working with provincial, district and commune authorities, local communities, and the private sector, Phase II will formulate and implement the REDD programme framework. The programme aims to reduce forestry related emissions in six pilot provinces,
70. http://gcfund.net/home.html

59
including Ca Mau. One of the identified drivers of deforestation in Ca Mau is conversion of mangroves to aquaculture. (UN-REDD 2012a).
In Ca Mau, planned interventions under Phase II are organised across seven “packages” targeting different drivers of deforestation, with a total budget of about US$5 million over five years (Table 8). Package 7, “forest conversion for shrimp farming” and perhaps Package 8, “control of coastal land erosion”, appear to be the most relevant to the MAM project in NMF. Vien An Dong commune, which contains NMF, is one of the communes targeted for the intervention packages 2, 3, 6, 7 and 8. Planned activities include five-yearly forest inventory measurement, training for forest managers, and for conversion to shrimp farms, alternative livelihood strategies and promotion of shrimp farms on barren land. Only 131 ha is earmarked for interventions related to conversion of forest to aquaculture while 400 ha are targeted for protection against illegal logging and 300 ha for more sustainable harvesting (UN-REDD 2012b).
Table 8: UN-REDD Programme Phase II planned interventions in Ca Mau province
Package Planned interventions in Ca Mau
Funding budget
(USD)
Planned interventions and areas in Vien An
Dong commune (ha)
Package 1: Illegal forest land encroachment for agricultural crops $205,000
Package 2: Protection against illegal logging $203,000 400
Package 3: Restoration of heavily degraded forest land $1,480,000 100
Package 4: Addressing risks of forest fire $1,020,000
Package 6: Legal unsustainable harvesting $176,000 300
Package 7: Forest conversion for shrimp farming $1,000,000 131
Package 8: Control of coastal land erosion $1,000,000 168
The MAM project and the UN-REDD Programme Phase II appear to be well aligned. It is expected that as well as funding activities which will help to reduce emissions there will also be further funds available to pay for performance, through the REDD+ Fund (see below). If this comes available it could provide a mechanism to scale up MAM activities to other areas – if emission reductions can be clearly shown.
Vietnam REDD+ Fund
The Vietnam Government, in collaboration with the UN-REDD Programme in Vietnam, is planning the establishment of a REDD+ Fund, established as part of the National REDD+ Strategy. The REDD+ Fund will build on Vietnam’s experiences with Payments for Environmental Services and the Vietnam Forest Protection and Development Fund. The fund will be administered by the REDD+ Fund Trust Office under MARD and funds will be drawn from the national budget and also multilateral and bilateral donors. The REDD+ Fund will make payments for participation and performance based on emission reductions and carbon stock enhancement at demonstration projects in pilot provinces until 2016. After 2016, this is extended to projects and projects

60
in other provinces. Payments from the fund will be made directly, in accordance with results-based payments or ex-ante participation payments related to emission reductions achieved, and also indirectly to stakeholders without forest land but important for the REDD+ outcomes.
9.3 Forest Carbon Partnership Facility The Forest Carbon Partnership Facility (FCPF) assists developing countries in their efforts to reduce emissions from deforestation and forest degradation and foster conservation, sustainable management of forests, and enhancement of forest carbon stocks providing value to standing forests. The FCPF has a Readiness Fund and a Carbon Fund. Vietnam is already receiving support through the Readiness Fund (US$3.6million) and will submit an application to be included in the Carbon Fund. The Carbon Fund will provide payments upon verification that emissions have been reduced from large-scale REDD+ programmes. However, in early discussions it is likely that any submission to the Carbon Fund will focus on the Central Highlands provinces and not the Mekong Delta. For this reason this option is not further explored.
9.4 Integrating carbon into shrimp certification standardsAs discussed, the NL standards mandate the maintenance of at least 50 percent mangrove coverage in certified shrimp farms. This is in recognition of the ecological importance of mangroves as much as their climate change mitigation benefits. Whatever the objective, NL thus provides an incentive for farmers to maintain and possibly increase
mangrove coverage and therefore aligns with climate change mitigation objectives.
There is potential to combine efforts to increase NL certification of farms with a mangrove carbon project or initiative in NMF (or indeed on a larger scale). NL certification provides an incentive to farmers in the form of increased access to markets and higher prices, while a further incentive could be derived in the form of carbon revenue or further increases in price premiums associated with adding a climate change criterion to the NL brand. In combination, the two incentives could have a significant influence on the management of ISM farms in Vietnam (and elsewhere).
There are likely to be synergies in aligning NL with climate change mitigation initiatives with regards to MRV and technical support that would serve to reduce the transaction costs. In practice, the MRV system of the applicable carbon scheme will almost certainly be more robust and rigorous than the NL’s MRV system for mangroves. It is noted that while NL provides an incentive for REDD and A/R activities, a carbon project could also possibly include IFM activities. A simple model might be the incorporation of climate change benefits of NL certification into the branding of NL. GHG emission reductions and removals could be estimated simply and conservatively using the area of increased mangrove coverage and/or avoided mangrove loss as a proxy. However, validation and verification of the climate change benefits of a combined NL-Carbon certification or initiative by an external reputable carbon scheme would also likely increase the credentials and profile of the NL brand. This could also allow carbon revenue to be earned from, for example, carbon insetting or from carbon credit markets. This could provide a further incentive for shrimp farmers to maintain mangrove forests.

61
Section 10Best options and key issues
The above analysis indicates that there is potential for the MAM project to reduce GHG emissions in NMF. The best options appear to be:
a. Linking the MAM project with UN-REDD Programme Phase II
b. Integrating carbon into shrimp certification standards and possible development of a carbon insetting project (potentially linked to c and/or d)
c. Developing and registering the MAM project with Plan Vivo (potentially linked to b and/or d)
d. Developing and registering a carbon programme or project with a voluntary carbon scheme such as the Verified Carbon Standard (VCS).
For all the above options, key issues will include:
• Ensuring that the planned interventions increase food security (and/or incomes) of shrimp farmers and that the prior informed consent of the shrimp farmers is attained
• Establishing the baseline scenario or forest REL in NMF and the extent to which conversion of mangroves to aquaculture is likely to be a driver of deforestation going forward
• The role of government policy and regulation in influencing incentives for shrimp farmers
• Measurement/monitoring, reporting and verification
• Benefit sharing mechanisms to share the carbon revenue and other benefits fairly with shrimp farmers.
These options are discussed in more detail below.

62
10.1 Linking MAM with UN-REDD Programme Phase IIConversion of mangroves to aquaculture ponds is identified by the UN-REDD Programme as an important driver of deforestation. Proposed measures to address this include recognition of a role that could be played by certification of farms with an international shrimp product standard. Therefore, there is potential to link the MAM project with the interventions and funding planned under Phase II of the UN-REDD Programme and subsequent payments for performance. In addition to the above issues, key issues include:
• The alignment of planned MAM activities with UN-REDD interventions, including activities to restore mangroves and enhance carbon stocks
• Acceptance of NL as an appropriate shrimp certification standard
• Determining the MRV method and mechanism for financial support
10.2 Developing and registering a VCS carbon projectThe MAM project in NMF could be eligible and feasible to be developed as a carbon project or programme via one of the carbon schemes. This is dependent on the forest or baseline as only additional emissions reductions generated by the project can be claimed. The VCS appears to offer the best potential in terms of existing approved methodologies, maturity and marketability. The project might also be developed and registered as a programme of activities or a group of projects. Four key criteria to assess the feasibility of registering a project with a
carbon scheme are scale, methodology eligibility, additionality, and data availability/ practicality. This is further assessed in Annex 1.
Registration of the MAM project with the VCS is an interesting and possibly viable option and VM0009 appears to be the most suitable methodology. However, there are several complexities and issues in applying the existing VCS REDD methodologies and, if this option is pursued, further work is required to determine eligibility and a more accurate estimation of the emission reductions that might be thus claimed. Guidelines, such as Shoch et al. (2013) and Pearson et al. (2011) can assist with this process.
In the event that the existing VCS methodologies are not suitable or are too difficult or restrictive to apply to the MAM project, a specific shrimp-mangrove methodology could be developed. However, this would entail much time and cost. Other carbon schemes, such as Plan Vivo, may allow more flexibility to develop and apply a simpler, custom-fit carbon accounting methodology for the MAM project while avoiding some of the costs involved in having this methodology formally approved by the VCS.
10.3 Alignment with shrimp certification and carbon insettingThere is potential to integrate carbon criteria into shrimp certification standards, which may be attractive for shrimp buyers and processors. This may be done simply and with minimal carbon accounting or rigour in the estimation of GHG emissions reductions and removals. However, there is also the potential to go further than just a cursory alignment. Given that NL is a certification framework championed by shrimp processors and buyers, an initiative based on
63
carbon insetting may prove attractive for NL and NL’s sponsors. An insetting programme may allow shrimp buyers to offset the GHG emissions generated by their downstream supply chain via a reputable and robust mechanism, while also benefitting from the heightened environmental profile of the shrimp product.
Key elements of any alignment or combination of efforts will include:
• Arrangements for collaboration between the various institutions (i.e. NL, NL buyers, NMF-MB, MAM, etc.)
• Development of an MRV system that satisfies all objectives and requirements
• Development of a mechanism to share the carbon revenue and NL benefits with the farmers.
Certification with NL could go hand in hand with registration with a carbon scheme and verification of the GHG emission reductions achieved. Given that the emission reductions will be generated and bought by NL’s buyers, then official external verification via VCS or another scheme may not be necessary as the carbon credits would not necessarily be traded. To provide a carbon project framework, or in the case that trading is preferred or required, Plan Vivo may provide a practical, appropriate and low-cost approach in this case. The first steps are to determine:
• Whether NL is interested in adding a climate change criterion to the NL brand and standard
• The level of interest in carbon in-setting among NL’s buyers, and the willingness to pay for the offsets (i.e. what price per tCO
2 offset)
• The suitability of applying the Plan Vivo framework to GHG emissions and for alignment with NL’s framework.

64

65
Section 11Conclusions and recommendations for the MAM project
11.1 ConclusionsBased on the above analysis, the following conclusions are made about mangrove forests and SAQ in NMF:
• Large areas of mangrove forests in Vietnam including NMF have been deforested in recent decades.
• A primary driver of this deforestation has been the expansion of SAQ.
• Small-scale, low input, ISM farms on small forest plots subcontracted by the NMF-MB to individual households are the predominant farming system in NMF.
• Data on mangrove coverage changes in NMF in recent years is inconsistent across data sources which affects the projected baseline scenario over the next 10 years.
• Reported recent changes in mangrove management in NMF suggest that the current situation with regards mangrove forests in NMF may be different from the net deforestation experienced between 2004 and 2009 and there may indeed be net afforestation.

66
With regards to GHG emissions and removals:
• The actual current projected baseline deforestation rate in NMF is critical to determining the potential for interventions to reduce GHG emissions.
• Depending on the forest REL applied, there is potential to significantly reduce GHG emissions in NMF through initiatives that can effectively stop or reduce deforestation of mangroves.
• The conversion of mangrove forests to aquaculture ponds has the potential to release significant quantities of GHGs to the atmosphere from carbon in soils; significantly more than reducing deforestation alone.
• Besides deforestation, there may be potential to reduce GHG emissions and increase GHG removals through initiatives that reforest areas or improve the management of mangrove forests.
• While the MAM project is relatively small in terms of area, there is potential for scaling-up in other areas.
With regards to shrimp product certification schemes and links with carbon initiatives:
• NL is the most relevant and suitable shrimp certification scheme for the small-scale, ISM farms in NMF.
• NL has already been introduced in the project site in coordination with shrimp buyers and local farmers.
• NL is unique among the certification schemes in that it mandates a minimum of 50 percent mangrove coverage at the farm level.
• Synergies exist between NL and climate change mitigation initiatives related to maintaining (and perhaps
increasing) mangrove forest cover in NMF and the provision of incentives to shrimp farmers to conserve mangrove forests.
• NL certification could be augmented to include climate change mitigation criteria, with or without formal linkage with a carbon scheme.
• Carbon financing and NL may offer an innovative way to turn SAQ from a driver of mangrove deforestation into an effective driver of mangrove conservation and perhaps reforestation.
• Different carbon schemes could be linked or integrated with NL in NMF.
With regards to carbon finance options:
• There is potential to secure financial support and/or carbon financing based on the climate change mitigation potential of the MAM project.
• There is significant alignment between the MAM project and UN-REDD Programme Phase II in Vietnam with Vien An Dong commune of Ca Mau included as a pilot commune for REDD+ interventions, and therefore funding from this programme should be sought.
• The MAM project could be developed and registered as a REDD+ project with one of the voluntary carbon schemes and initial estimates of emissions reductions generated by the project appear to be of a feasible scale.
• Of the carbon schemes, the VCS appears the suitable, perhaps methodology VM0009, but further analysis is required to assess the baseline scenario and refine emission reduction estimates.
• Carbon insetting appears to offer an interesting option for the MAM project and may be well aligned
67
with the corporate and marketing objectives of NL and NL’s sponsors.
• Plan Vivo also seems well suited to the MAM project in NMF and could be applied as a carbon standard for a carbon insetting initiative.
• A grouped project approach seems suitable for the MAM project as this would facilitate adding additional farms or areas to the carbon project over time.
• The MAM project could be expanded and developed as a NAMA but given the early stage of NAMA evolution and the provincial scope of NL, the other carbon finance opportunities listed above are more attractive.
• MRV is a critical component for all carbon finance options and is the priority for further actions.
11.2 RecommendationsBased on the above conclusions, several recommendations and next steps for the MAM project in NMF are identified:
1. Undertake research to clearly establish the baseline scenario/ REL in NMF in accordance with the available guidance, particularly as contained in the relevant VCS methodologies.
2. Clearly identify and plan the activities of the MAM project with regards to REDD+ and forestry activities, with reference to the relevant carbon methodologies.
3. Examine the existing MRV systems employed by NMF-MB, other government agencies, and NL and the degree to which these methods could be combined and improved in order to comply with the requirements of applicable carbon schemes.
4. Assess carbon in soils in the mangroves of NMF and the fate of this carbon when forest is converted to aquaculture.
5. Examine in detail forest degradation in NMF including the trends, drivers and possible interventions to reduce degradation, including IFM activities.
6. Approach the UN-REDD Programme with a proposal for collaboration and funding for REDD+ activities in NMF, particularly as listed here.
7. Collaborate with other agencies and initiatives in Vietnam and elsewhere to build capacity in MRV for NMF and NMF stakeholders.
8. Once the baseline scenario/ REL in NMF is established, identify the appropriate carbon methodology(ies) to estimate potential GHG emission reductions and assess in detail the feasibility of developing and registering the MAM project with the selected carbon scheme.
9. Consult with NL and NL’s buyers with regards to the potential to expand the NL standards to specifically include climate change mitigation criteria and market the ‘low carbon’ benefits of NL shrimp from NMF.
10. Consult with NL and NL’s sponsors with regards to the potential for “carbon insetting” and the potential demand for carbon ‘insets’ from within NL’s customer base (i.e. European buyers).

68
Annex 1:
Carbon Market Schemes
Clean Development Mechanism
The Clean Development Mechanism (CDM) is one of the flexible market mechanisms that developed nations can use to meet their emissions reductions targets under the Kyoto Protocol via clean development projects and programmes in developing countries. The CDM is administered under the United Nations Framework on Climate Change (UNFCCC). Almost 7,000 projects in developing countries, including Vietnam, have been registered with the CDM. CERs are termed compliance grade credits as they are recognised under the UNFCCC as eligible towards a nation’s emissions reductions. The CDM is generally recognised as the most rigorous and robust of the current carbon schemes and methodologies to estimate and measure GHG emissions and removals that have been approved by the CDM executive board are generally recognised by other carbon market schemes.
The CDM has mostly been focussed on industrial projects and energy projects that reduce GHG emissions. However, there are several CDM methodologies for afforestation and reforestation (A/R) with 45 A/R projects around the world have been registered so far. CDM forest methodologies include small-scale CDM afforestation and reforestation project activities implemented on wetlands (including mangroves) [AR-AMS0003]; and large scale projects related to afforestation and reforestation of degraded mangrove habitats, [AR-
AM0014]. The CDM does not currently accept projects or programmes related to REDD and there are not yet any approved CDM REDD methodologies. However, REDD continues to be debated in international climate change negotiations and may be officially included in the CDM or UN schemes in the future.
CERs are equivalent to one tonne of carbon dioxide emissions (tCO
2e). CER
prices collapsed from about 12 Euros in 2011 to currently less than one 1 Euro currently, due mainly to excess supply and reduced demand for CERs associated with the economic downturn in Europe and uncertain future of the post Kyoto Protocol.
Verified Carbon Standard
The VCS is the leading international voluntary carbon scheme. The VCS is one of the pioneering and leading standards for projects related to agriculture, forestry and other land uses (AFOLU). Currently, there are a total of 34 registered VCS AFOLU projects, 15 of which are REDD projects. . Six categories of AFOLU project activities are eligible under the VCS and are pertinent to mangrove projects:
i. Afforestation, Reforestation and Revegetation (ARR)
ii. Agricultural Land Management (ALM)
iii. Improved Forest Management (IFM)
iv. Reducing Emissions from Deforestation and Degradation (REDD)
v. Avoided Conversion of Grasslands and Shrublands (ACoGS)
vi. Wetlands Restoration and Conservation (WRC)
A project may include several types of intervention. For example, a project might aim to reduce deforestation and

69
also improve forest management (i.e. REDD plus IFM or ARR). Such projects are often referred to as REDD+ projects.
WRC is a relatively recent addition to the VCS. Within WRC, project types that conserve intact wetlands are most relevant to the MAM project. Eligible WRC activities are those that increase net GHG removals by restoring wetland ecosystems or that reduce GHG emissions by rewetting or avoiding the degradation of wetlands. Many land use activities on wetlands (e.g. aquaculture) involve the exposure of wetland soils to aerobic decomposition through piling, dredging, etc. and associated GHG emissions. WRC baseline scenarios account for such processes. Emissions from organic matter may continue for years. However, carbon accumulated in sedimentation is not eligible for crediting under WRC. WRC methodologies are required to consider wetland erosion and/or migration resulting from sea level rise in the baseline scenario, where relevant, and how changes in management would impact carbon stocks.71
The VCS has approved many AFOLU methodologies and also accepts approved methodologies from the CDM and selected methodologies from other voluntary carbon schemes including those of the Climate Action Reserve (see below). The MAM project will avoid unplanned deforestation and degradation of mangroves and also unplanned conversion of mangroves wetlands. Therefore, some of VCS’s REDD+ methodologies and modules are relevant to the MAM project. The relevant methodologies include:
• Methodology for Carbon Accounting in Project Activities that Reduce Emissions from Mosaic Deforestation and Degradation, [VM0006] 72
• REDD Methodology Modules [VM0007]
• Methodology for Avoided Deforestation [VM0009]
• Methodology for Avoided Unplanned Deforestation, [VM0015] 73
If the MAM project plans to have a significant impact on IFM in NMF, then different VCS methodologies will apply (i.e. instead of, or in addition to the above). A new methodology titled “Avoiding Planned Deforestation of Undrained Peat Swamp” is under development but does not appear applicable to the MAM baseline or project scenario. Peat is defined as soils with greater than 50 percent organic carbon content. Mangrove soils generally have much less than this (Kauffman et al. 2011, Ceron-Breton et al. 2011). Other than this, there are not yet any VCS WRC methodologies.
71. VCS “AFOLU Requirements”, version 3.3
72. Including a proposed revision that would cater for grouping of projects and specific drivers of DD. However this methodology is currently not valid until updated/ replaced with a revised version
73. Developed with support from the World Bank’s BioCarbon Fund

70
The Gold Standard
The Gold Standard74 (GS) was established a decade ago by WWF to define, demonstrate and drive best practice in the carbon markets. The GS aims to certify carbon projects that have a higher level of sustainability and “carbon+” benefits. The GS accepts a subset of the approved CDM methodologies and has also developed several of its own methodologies. If the former are applied for a project, that project is able to register with the CDM and the GS and generate GS CERs. If the latter are applied, that project needs only to register with the GS and will generate VERs.
The GS has recently decided to establish guidelines and standards to cater for forestry projects. In May 2013, the GS published for public comment draft GS Land Use and Forests Framework, GS A/R Requirements, and A/R Guidelines – Mangroves. However, to date, the GS is focussed on adding methodologies for A/R and IFM projects and does not have a framework or methodology for REDD projects.
Plan Vivo
Plan Vivo is a voluntary framework for supporting communities to manage their natural resources more sustainably, with a view to generating climate, livelihood and ecosystem benefits. Participants are smallholder farmers and communities dependent on natural resources for their livelihoods. Activities are implemented on smallholder or community land (owned or long-term user rights). Plan Vivo projects work closely with rural communities and the system and standard emphasises participatory design, ongoing stakeholder consultation and the use of native species. Plan Vivo includes requirements
and processes to ensure projects benefit livelihoods and ecosystems and provide ethical and fairly traded climate services.
Plan Vivo strives to keep levels of bureaucracy and rigidity at a minimum and enable project coordinators to start activities at a small scale and then increase them as they build capacity. Projects are managed by locally based non-governmental organisations (NGOs) who function as project developers (“project coordinators”). They coordinate sales of Plan Vivo Certificates to carbon buyers, and coordinate continued monitoring and community consultation with the farmers. Based on revenue from the carbon buyers, the project coordinators administer staged payments for ecosystem services to project participants based on achieved “monitoring targets”. Monitoring targets relate to GHG emissions or removal targets.
To date, there are 11 registered Plan Vivo projects and a further 9 projects at earlier stages of development. Eligible activities (for generating Plan Vivo Certificates) are:
• Afforestation/ reforestation (A/R)• Agroforestry• Forest restoration • Avoided deforestation
The process for estimating and monitoring the reduction or removal in GHG emissions is not clearly defined by Plan Vivo and thus project developers would likely apply suitable elements from the carbon standards and methodologies of other schemes, such as the VCS (see above). Plan Vivo does not require registration with another carbon scheme and allows some flexibility in the application of measurement, monitoring, reporting and verification processes.
The MAM project seems well-suited to the Plan Vivo framework and is
74. www.cdmgoldstandard.org

71
compliant with the basic project eligibility criteria (Box 3). The MAM project works with individual shrimp farmers to improve livelihoods as well as reduce GHG emissions, and is administered by SNV who could act as the Plan Vivo project coordinator. Plan Vivo also has a new Payment for Environmental Services (PES) initiative that could be interesting for the MAM project.
American Carbon Registry
The ACR is a leading non-profit U.S. carbon market standard and registry affiliated with Winrock International. As the first private voluntary GHG registry in the U.S., the ACR is one of the largest and most respected online registries in the U.S. voluntary and pre-compliance carbon markets. The ACR accepts projects from locations worldwide. In addition to its voluntary carbon market activities, the ACR is an approved Offset Project Registry for the California Cap-and-Trade Program. The ACR publishes standards, methodologies, protocols and tools for GHG accounting, which are all based on International Standards Organisation (ISO) 14064 and sound scientific practice. The ACR generally accepts methodologies and tools published by the CDM and ACR-reviewed and approved methodologies from other programs to the extent that they comply with ACR’s Standards. ACR Standards and Methodologies that are relevant to the MAM project include the REDD Methodology Modules, particularly for unplanned deforestation and forest degradation caused by extraction of wood for fuel.

72
Box 3: Plan Vivo project eligibility criteria
Producers:
• Must be small-scale farmers, land users or forest dwellers in developing countries with recognised land tenure or user rights (see below)
• Must be organised into cooperatives, associations, community-based organisations or other organisational forms able to contribute to the social and economic development of their members and communities and democratically controlled by the members
• Must be able to use existing forest, woodland or other land for project activities without undermining livelihood needs
• Must have a registered Plan Vivo for their own piece of land or be part of a group with a Plan Vivo for a piece of community-owned or managed land. Producers should not be structurally dependent on permanent hired labour and should manage their land mainly with their own and their family’s labour force
Project coordinators:
• Must have a strong in-country presence and the respect and experience required to work effectively with local communities and partners
• Must be focused and have the organisational capability and ability to mobilise the necessary resources to develop the project
• Must have the capability to negotiate and deal with government, local organisations and institutions, and buyers of ecosystem services
• Must have the ability to mobilise and train participants, implement and monitor project activities and carry out technical functions
• Must recognise that the decision of producers to participate in project activities is entirely voluntary
• Must recognise that producers own the carbon benefits of the project activities they choose to undertake
• Must ensure that the PES producers receive are fair and equitable and that payments are made in a transparent and traceable manner
Land tenure rights:• Must be secure (land tenure or use rights) so that there can be clear ownership,
traceability and accountability for carbon reduction or sequestration benefits
Project activities:• Must enable communities to plan and take control of their resources in a sustainable
way that promotes rural livelihoods and other environmental and social co-benefits• Must be eligible to receive payments for ecosystem services (PES) under the
Plan Vivo system• Must be additional, not liable to cause leakage and provide foundations for
permanence, as described in the Plan Vivo standards• Must involve the planting and/or promote the restoration or protection of native or
naturalised tree species. The use of naturalised (i.e. non-invasive) species is acceptable in some cases
• Must encourage the development of local capacity and minimise dependency on external support
Project landscape:• Must have clear boundaries that can be mapped• Must be suited to the replication and expansion of project activities into new areas
Expansion ambitions:• Must be based on a commitment to initiating activities on a pilot basis, gaining
experience and identifying improvements (“learning by doing”)• Must be based on practical capabilities “on the ground”, not on high level targets
imposed from above (plant x no. of trees in y years)

73
Annex 2:
Assessing the potential for developing a VCS projectThere are four key criteria pertinent to the potential to develop and register the MAM project with a voluntary carbon scheme such as the VCS:
1. Scale
There are significant upfront one-off costs of developing and registering a project with a carbon scheme such as the VCS, including project costs associated with project preparation, design and implementation and third party fees for validation. In addition, there are ongoing costs for monitoring and administering the project and for periodic third party verification (though as discussed, there are likely synergies with the costs of complying with NL). Therefore, to be worthwhile, the carbon revenue from development and registration must be at least enough to cover these costs and also provide a return to the project participants. The carbon revenue depends on the amount of emission reductions or credits that the project will generate and the price received per credit.
Preliminary estimates indicate that the scale of the MAM project in terms of annual and total GHG emission reductions achieved may be large enough to justify the transaction costs of developing and registering the project with a carbon scheme. As estimated in Section 7, the project might generate over 1.154 million credits over 30 years, an average of 38,475 credits per year. Assuming an average price of US$10 per credit indicates annual gross carbon revenue of US$384,750. This might be just sufficient to justify development and registration of the project with the VCS, particularly if
the MAM project area is expanded over time. However, further detailed assessment is needed to confirm this and to develop a conservative accurate estimate of emission reductions that could be generated by the project. The amount of emission reductions will depend on several factors, including the eligible carbon pools (particularly soil carbon; see below), leakage effects , the rate of carbon loss from mangrove wood pools; and the requirement to lay aside a buffer area of forest to account for impermanence and uncertainty of emission reductions achieved.
Grouping of projects is allowed by some methodologies. Grouping increases flexibility and reduces transaction costs per project. This is useful for the MAM project where discrete areas of additional farms or groups of farms within the same region (NMF) can be added to the project at later dates as they join the programme. The grouping and reference region approach is also consistent with Jurisdictional REDD (as described above).
2. Methodology eligibility
The project must be eligible with an existing approved carbon methodology as developing and approving a new methodology is difficult and costly. The project baseline, planned activities and circumstances must be clearly confirmed against the eligibility criteria of the carbon methodologies. As discussed, there are several VCS methodologies that could be applied to the MAM project’s activities in NMF. The most suitable VCS methodology depends on the baseline scenario or forest REL in NMF, once clearly determined, and the activities planned by the MAM project. Depending on the REL, the MAM project could apply REDD and/or A/R methodologies. There may also be potential to develop a project related to IFM in NMF, though this was not assessed in detail in this study. A

74
methodology that incorporates emission reductions from the main carbon pools relevant to the MAM project is required, particularly soil carbon.
Assuming a baseline scenario of continued unplanned mosaic deforestation, there are several methodologies that could apply. However, the methodologies are quite specific and each has restrictions and applicability criteria. For all REDD projects, land in the project area must have qualified as forest at least 10 years before the project start date and land in the project area must meet the forest definition, such as those based on UNFCCC host-country thresholds or FAO definitions. Possible methodologies are further examined below:
• VM0006 is now being revised by a new proposed methodology called Carbon Accounting for Grouped Mosaic and Landscape Scale REDD Projects (referred to here as VM0006v2). This methodology includes deforestation and degradation and applies several approaches attractive to the MAM project, such as a baseline reference region and grouping. This methodology applies to projects where deforestation is caused by conversion of land to “crop-land” - it is not clear if conversion to aquaculture would meet this criterion. Importantly, VM0006 does not apply to projects where commercial timber harvesting occurs during the project, and thus it appears it is not applicable to the MAM project, at least not to areas within the production forest zone.
• VM0007 REDD Modules Methodology applies a modular approach that allows the selection and application of different modules within the methodology. This methodology is applicable to planned and unplanned
deforestation and degradation, including mosaic and frontier configurations. Three forms of baseline are included under the methodology modules: planned deforestation, unplanned deforestation and degradation through fuel-wood extraction. VM0007 provides detailed and comprehensive guidance in the form of tools or modules for MRV. VM0007 has a module for most carbon pools, including soil carbon modules (VMD004 or VMD0021). However, these modules are not applicable to organic soils which may exclude mangrove soils (Box 4). The project area can include forested wetlands (such as mangrove forests) as long as they do not grow on peat.
• VM0009 Methodology for Avoided Deforestation is also perhaps applicable to the MAM project. VM0009 is relatively complex but appears to allow accounting for both deforestation and degradation and does not have the same limitations as the above methodologies with regards to conversion to aquaculture and logging activities. Also unique to VM0009 is the soil carbon loss model used in estimating baseline emissions, which does not require an extensive field inventory of soil carbon stocks in the project area (although monitoring is required), as do all other currently approved REDD methodologies that include soil carbon. The soil carbon loss model uses parameters (exponential soil decay rate and maximum loss value), possibly sourced from a conservative default provided by the methodology for tropical soils (Shoch et al. 2013).
• VM0015 Methodology for estimating reductions of GHG emissions from unplanned deforestation caters

75
to project activities that reduce GHG emissions from unplanned deforestation in either the mosaic or frontier configuration. The methodology is applicable to a wide range of unplanned deforestation configurations and baseline land uses. VM0015 includes soil carbon and also carbon in litter. Three options are provided for projecting the future baseline rate of deforestation. The simplest is the historical average approach whereby the average historical rate deforestation is projected into the future (as per the REL estimates provided in Section 6). A second approach is to model future deforestation rate based on historic trends using a fitted regression equation (useful where there is a clear upward or downward trend in the rate of deforestation). The third is through using covariates to model the rate of deforestation from drivers of deforestation (e.g., population). The approach chosen is based on the analysis of agents and drivers of deforestation in the specific project area. VM0015 is
potentially applicable to the MAM project but emissions from planned or unplanned degradation cannot be included in the baseline and therefore need to be excluded from project accounting.
If the MAM project is expected to reforest mangroves at a rate above the rate projected in the REL, then the above REDD+ methodologies need to be combined with an afforestation/reforestation (A/R) methodology.
Box 4: VCS definition of organic soils (VMD0021)
Soils are organic if they:
• Are saturated with water for less than 30 days (cumulative) per year in normal years and are not artificially drained, but contain more than 20 % (by weight) organic carbon; or
• Are saturated with water for 30 days or more cumulative in normal years (or are artificially drained) and, excluding live roots, have an organic carbon content (by weight) which is:
a. 18 percent or more, if the mineral fraction contains 60 percent or more clay; or
b. At least 12 percent, if the mineral fraction contains no clay; or
c. Greater than 12 percent plus 0.1 multiplied by the clay percentage (12%+0.1*clay%), if the mineral fraction contains less than 60% clay.

76
3. Additionality
For all VCS projects, demonstration of additionality of the emission reductions achieved is required. That is, it must be demonstrated that any emission reductions claimed are in addition to those that would be achieved in the business-as-usual scenario, or project REL. The tool for the demonstration and assessment of additionality in VCS AFOLU project activities must be applied. In the case of the MAM project, it must be demonstrated that although there is a government regulation that requires maintaining 60 percent mangrove forest canopy cover in NMF, this regulation is not strictly enforced (so reforestation to 60 percent will not occur anyway as part of legal requirements, in the absence of the project).
4. Monitoring and data availability
If a carbon project is to be feasible, it must be possible and practical to monitor the project in accordance with the methodology requirements. MRV is a key part of any carbon project and usually entails significant data requirements and data collection capacity. Historical data is also required. Further analysis of specific data requirements and availability is necessary for the MAM project as MRV is a critical part of any carbon project.

77
ReferencesADB (Asian Development Bank), 2011. Socialist Republic of Viet Nam: Climate change impact and adaptation study in the Mekong Delta, Technical Assistance Consultant’s Final Report, Project No. 43295
Adhikari S., Lal R. and Sahu B. C., 2012. Carbon sequestration in the bottom sediments of aquaculture ponds of Orissa, India, Ecological Engineering Volume 47, October 2012, Pages 198–202
Alongi D.M., 2009. Paradigm shifts in Mangrove Biology, in Coastal Wetlands: An Integrated Ecosystem Approach, eds. Perillo, Wolanski, Cahoon and Brinson, Chapter 22.
Alongi D.M., 2002. Present state and future of the world’s mangrove forests, Environmental Conservation 29 (3): 331–349
Alongi D.M., Johnston D.M. and Xuan T. T., 2000a. Carbon and nitrogen budgets in shrimp ponds of extensive mixed shrimp-mangrove farms of the Mekong Delta, Vietnam, Aquaculture Research, 31, 387-399
Alongi D.M., Tirendi F., Trott L.A. and Xuan T.T., 2000b. Benthic decomposition rates and pathways in plantations of the mangrove Rhizophoraapiculata in the Mekong delta, Vietnam. MARINE ECOLOGY PROGRESS SERIES, Mar Ecol Prog Ser, Vol. 194: 87-101.2000, Mar 17
Benthem W. First steps towards integrated mangrove rehabilitation in the coastal Mekong Delta, Vietnam. Water Praxis Document, Nr. 10. Mott Macdonald, EuroConsult.
Beveridge H.C.M., Phillips M.J., Macintosh D.J., 1997. Aquaculture and the environment: the supply of and demand for environmental goods and services by Asian aquaculture and the implications for sustainability. Aquaculture Research 28 (10): 797-808.
Binh C.T. 1994. An assessment of integrated shrimp-mangrove farming systems in the Mekong Delta of Vietnam. M.Sc. Thesis, Asian Institute of Technology, Bangkok.
Binh C.T., Phillips M.J. and Demaine H., 1997. Integrated shrimp-mangrove farming systems in the Mekong delta of Vietnam. Aquaculture Research 28: 599–610.
Bouillon S., Borges A.V., Castaneda-Moya E., Diele K., Dittmar T., Duke N.C., Kristensen
E., Lee S.Y., Marchand C. Middleburg J.J., Rivera-Monroy V.H., Smith III T.J. and Twilley
R.R. 2008. Mangrove production and carbon sinks: a revision of global budget estimates. Global Biogeochemical Cycles. Available at http://www.vub.ac.be/ANCH/publications/Bouillon_etal_GBC2008.pdf
Bosma R., Pham Thi Anh, and Potting J., 2011. Life cycle assessment of intensive striped catfish farming in the Mekong Delta for screening hotspots as input to environmental policy and research agenda, Int J Life Cycle Assess (2011) 16:903–915
Boyd C.E., Wood W.C, Chaney P.L, and Queiroz J. F., 2011. Role of aquaculture pond sediments in sequestration of annual global carbon emissions, CRSP Research Report 10-269, AQUAFISH COLLABORATIVE RESEARCH SUPPORT PROGRAM
Breithaupt J.L., Smoak, J.M. , Smith T.J. III, Sanders C.J. and Hoare A., 2012. Organic carbon burial rates in mangrove sediments: Strengthening the global budget. GLOBAL BIOGEOCHEMICAL CYCLES, VOL. 26, GB3011, doi: 10.1029/2012GB004375, 2012
Chandra I.A., Seca G. and Abu Hena M.K., 2011. Aboveground biomass production of Rhizophora apiculata Blume in Sarawak Mangrove Forest, American Journal of Agricultural and Biological Sciences 6 (4): 469-474, 2011
Christensen B., 1978. Biomass and productivity of Rhizophora apiculata Bl. in a mangrove in southern Thailand. Aquatic Botany, 4, 43–52.
Clough B., Johnston D., Tran T.X., Phillips M.J., Pednekar S., Nguyen H.T., Truong H.D., and Pham L.T., 2002. Silvofishery farming systems in Ca Mau province Vietnam, Report Prepared for the World Bank, Network of Aquaculture Centres in Asia-Pacific, World Wildlife Fund and Food and

78
Agriculture Organization of the United Nations Consortium Program on Shrimp Farming and the Environment
Clough, B.F., Tan, D.T., Buu, D.C. & Phuong, D.X., 1999. Mangrove forest structure and growth. In: Mixed Shrimp Farming-Mangrove Forestry Models in the Mekong Delta, Termination Report, Part B: Technical Appendices, ed. B. Clough, pp.235–251. Canberra, ACT, Australia: Australian Centre for International Agricultural Research.
Clough B. F, Dixon P. and Dalhaus, 1997a. Allometric relationships for estimating biomass in multi-stemmed mangrove trees, Australian Journal of Botany 45(6) 1023 - 1031
Clough B.F., Ong J.E., and Wong W.K., 1997b. Estimating leaf area index and photosynthetic
production in canopies of the mangrove Rhizophora apiculata, MARINE ECOLOGY PROGRESS SERIES Mar Ecol Prog Ser, Vol. 159: 285-292, 1997
De Silva, S.S. and Soto, D., 2009. Climate change and aquaculture: potential impacts, adaptation and mitigation. In K. Cochrane, C. De Young, D. Soto and T. Bahri (eds). Climate change implications for fisheries and aquaculture: overview of current scientific knowledge. FAO Fisheries and Aquaculture Technical Paper. No. 530. Rome, FAO. pp. 151-212.
Dien V.T., Takeuchi W., Van A. N., Oo K.S., Nukui T., and Sobue S., 2011. Carbon stock calculating and forest change assessment towards REDD+ activities for the mangrove forest in Vietnam. SAFE
Donato D.C., Kauffman J.B., Murdiyaso D., Kurnianto S., Stidham M., and Kanninen M., 2011. Mangroves among the most carbon-rich forests in the tropics. Nat Geoscience 4:293–297.
Duke N., Wilson N., Mackenzie J., Hai H.N., and Puller D., 2010. Assessment of mangrove forests, shoreline condition and feasibility for REDD in Kien Giang province, Vietnam. A technical report. Published by Deutsche Gesellschaft für Technische Zusammenarbeit (GTZ) GmbH
Food and Agriculture Organization of the United Nations (FAO), 2011. Private standards and certification in fisheries and aquaculture, Current practice and emerging issues. Washington S. and Ababouch L. Fisheries and Aquaculture Technical Paper 553
Food and Agriculture Organization of the United Nations (FAO), 2009. Climate change implications for fisheries and aquaculture, Fisheries and Aquaculture Technical Paper 530, ftp://ftp.fao.org/docrep/fao/012/i0994e/i0994e.pdf
Food and Agriculture Organization of the United Nations (FAO), 2005. Global forest resources assessment 2005 – Thematic study on mangroves, Vietnam country profile
Food and Agriculture Organization of the United Nations (FAO), 1992. Guidelines for the promotion of environmental management of coastal aquaculture development, FAO Fisheries Technical Paper T328, http://www.fao.org/docrep/T0697E/T0697E00.htm
GOFC-GOLD, 2012. A sourcebook of methods and procedures for monitoring and reporting anthropogenic greenhouse gas emissions and removals associated with deforestation, gains and losses of carbon stocks in forests remaining forests, and forestation. GOFC-GOLD Report version COP18-1, (GOFC-GOLD Land Cover Project Office, Wageningen University, The Netherlands)
IFAD 2012. Climate change analysis and adaptation responses, Prepared for Informing IFAD’s Country Strategic Opportunities Program 2012 – 2017 for Viet Nam
Ha, Tran Thi Thu, Bush S. R, Mol A.P.J and van Dijk H., 2013. Organic coasts? Regulatory challenges of certifying integrated shrimp–mangrove production systems in Vietnam, Journal of Rural Studies, Vol. 28
Ha, Tran Thi Thu, Bush S. R. and van Dijk H., 2013. Mangrove conservation or shrimp farmer’s livelihood? The devolution of forest management and benefit sharing in the Mekong Delta, Vietnam, Ocean & Coastal Management, Volume 69, December 2012, Pages 185–193

79
Hai, Nguyen Thanh Danh, 2012. Presentation: Management, protection and development of the mangrove forest in Vietnam, Forest Protection Department, Ministry of Agriculture and Rural Development, for Space Applications for Environment (SAFE) http://www.safe.iis.u-tokyo.ac.jp/
Hong, Phan Nguyen and San H.T., 1993. Mangroves of Vietnam. IUCN, Bangkok.
ISPONRE, 2012. Report on change in ecosystem in Ca Mau. Institute of Strategy and Policy on Natural Resources and the Environment of Vietnam, ProEcoServ, GEF, UNEP
IUCN, 2013 (a). Presentation: Mangrove loss and valuation: Ngoc Hien district, Ca Mau province
IUCN, 2013 (b). Land cover change Nhung Mien 2004-2009-2013, Mangroves and Markets Steering Committee Meeting, Ca Mau, 14 June 2013
Johnston D., Ngyuen V. T., Doan V. T. and Tran T. X., 2000. Shrimp yields and harvest characteristics of mixed shrimp–mangrove forestry farms in southern Vietnam: factors affecting production, Aquaculture 188 _2000. 263–284
Kauffman J.B., Adame M.F. and Donato D.C., 2012. Exceptionally high carbon stocks of mangroves and their potential conservation through global carbon markets, presentation from 9th Intecol International Wetlands Conference proceedings (available at http://www.conference.ifas.ufl.edu/intecol/presentations/109/1120%20B%20Kauffman.pdf)
Kauffman J.B. and Donato, D.C., 2012. Protocols for the measurement, monitoring and reporting of structure, biomass and carbon stocks in mangrove forests. Working Paper 86. CIFOR, Bogor, Indonesia.
Kauffman, J.B., Heider, C., Cole, T., Dwire, K.A. Donato, D.C. 2011. Ecosystem C pools of Micronesian mangrove forests: implications of land use and climate change. Wetlands 31:343- 352.
Komiyama A., Ong J. E. and Poungparn S., 2008. Allometry, biomass and productivity of mangrove forests: A review, Aquatic Botany 89 (2008) 128–137
Lawrence A., Baker E. and Lovelock C., 2012. Optimising and managing coastal carbon comparative sequestration and mitigation opportunities across Australia’s landscapes and land uses, Fisheries Research and Development Corporation (Australia), Project 2011/084, http://frdc.com.au/research/Documents/Final_reports/2011-084-DLD.pdf
Laffoley, D.d’A. and Grimsditch, G. (eds). 2009. The management of natural coastal carbon sinks. IUCN, Gland, Switzerland. 53 pp
Ministry of Fisheries (MoFI), Vietnam, 2004. Annual report on aquaculture achievements in 2003 and implementation plan for 2004. 15 pp. (in Vietnamese). (cited by FAO http://www.fao.org/fishery/countrysector/naso_vietnam/en)
McNally R, McEwin A and Holland T, 2011. The potential for mangrove carbon projects in Vietnam, SNV
Ngai N. B., Nguyen Q.T., Sunderlin W.D. and Yasmi Y, 2009. Forestry and poverty data in Vietnam: Status, gaps and potential uses. RECOFTC, IRR, Vietnam Forestry Unit. Available at: http://www.recoftc.org/site/uploads/content/pdf/Forestry_and_Poverty_Data_in_Vietn_Nam_web_21.pdf
Miller F, Nguyen V.T. and Do T.M.D, 1999. Resource management in the Vietnamese Mekong Basin. Mekong Working Papers, Working Paper No. 74, April 1999. National Library of Australia. Available at: http://www.usyd.edu.au/ su/geography/Hirsch
Mohanty B.P, Mohanty S, Sahoo J.K. and Sharma A.P, 2010. Climate change: impacts on fisheries and aquaculture, in Climate Change and Variability, Edited by Suzanne Simard, www.intechopen.com
MoNRE, 2010. Vietnam-Netherlands Mekong Delta Masterplan Project. Research and assessment of water and environment in Mekong River Delta: Living environment, ecosystem, mangrove and natural preservation. Draft Report. Ministry of Natural Resources and the Environment, Sub-Institute of Hydro-Meteorology and Environment of South Vietnam. Available at http://wptest.partnersvoorwater.nl/wp-content/uploads/2011/06/WATER-AND-ENVIRONMENT-final-draft_1.pdf
80
Murdiyarso, D., Donato, D.C., Kauffman, J.B., Stidham, M., Kurnianto, S. and Kanninen, M. 2010. Carbon storage in mangrove and peatland ecosystems in Indonesia – A preliminary account from plots in Indonesia. Working paper 48. Center for International Forest Research. Bogor, Indonesia. 35p.
Parker R, 2012. Review of life cycle assessment research on products derived from fisheries and aquaculture, A report for Seafish as part of the collective action to address greenhouse gas emissions in seafood. Fish Industry Authority, Edinburgh, UK
Pearson, TRH, Brown, S. and Walker, S. 2011. Guidance document: Avoided deforestation partners VCS REDD methodology modules. Published by Climate Focus, LLP.
Pham Trong Thinh, 2012. Study report on formulating the policy on payment for the services of spawning grounds, food sources & natural seeds, and environment from mangrove forest for aquaculture. Hanoi: Vietnam Administration of Forestry/GIZ/IUCN.
Pham,T.T., Moeliono, M., Nguyen,T.H., Nguyen, H.T. and Vu, T.H., 2012. The context of REDD+ in Vietnam: Drivers, agents and institutions. Occasional Paper 75. CIFOR, Bogor, Indonesia.
Ong J.E. and Gong W.K., 2013. Structure, function and management of mangrove ecosystems, ISME Mangrove Educational Book Series No. 2, available at http://www.mangrove.or.jp/isme/english/books/educational-series.book2.pdf
Ong J.E., Gong W.K. and Wong C.H., 2004. Allometry and partitioning of the mangrove, Rhizophora apiculata, Forest Ecology and Management, Volume 188, Issues 1–3, 5 February 2004, Pages 395–408
Ong J.E, Gong W.K. and Clough B. F., 1995. Structure and productivity of a 20-year-old stand of Rhizophora apiculata Bl. Mangrove Forest, Journal of Biogeography, Vol. 22, No. 2/3, Terrestrial Ecosystem Interactions with Global Change, Volume 1 (Mar. - May, 1995), pp. 417-424
Ong J.E., 1993. Mangroves – a carbon source and sink, Chemosphere, Vol.27, Issue 6, Sept 1993, p1097-1107
Oxfam Novib, SNV and IUCN, 2012. Squaring the circle: An analysis of the business case for certification for small-scale shrimp farmers in Vietnam
Pearson, TRH, Brown, S. and Walker, S. 2011. Guidance document: Avoided deforestation partners VCS REDD methodology modules. Published by Climate Focus, LLP.
Pendleton L, Donato DC, Murray BC, Crooks S, Jenkins WA et al., 2012. Estimating global “Blue Carbon” emissions from conversion and degradation of vegetated coastal ecosystems. PLoS ONE 7(9): e43542. doi:10.1371/journal.pone.0043542
Pham,T.T., Moeliono, M., Nguyen,T.H., Nguyen, H.T. and Vu, T.H. 2012. The context of REDD+ in Vietnam: Drivers, agents and institutions. Occasional Paper 75. CIFOR, Bogor, Indonesia.
Powell, Neil, Maria Osbeck, Sinh Bach Tan and Vu Canh Toan. World resources report case study. Mangrove restoration and rehabilitation for climate change adaptation in Vietnam. World Resources Report, Washington DC. Available online at http://www.worldresourcesreport.org
Ronnback P., 2002. Environmentally sustainable shrimp aquaculture, prepared for the Swedish Society for Nature Conservation, (available online at http://mangroveactionproject.org/files/map-asia/Environmentally%20Sustainable%20Shrimp%20Aquaculture.pdf)
Ronnback P., 1999. The ecological basis for the economic value of mangrove forests in seafood production. Ecological Economics 29: 235-252.
Schmitt K., 2010. Effective mangrove conservation through co-management in the Mekong Delta, Viet Nam, in Co-management/Shared Governance of Natural Resources and Protected Areas in Viet Nam, Proceedings of the National Workshop on Co-management Concept and Practice in Viet Nam, Soc Trang, 17 – 19 March 2010
Shoch D., Eaton J. and Settelmyer S., 2013. Project developers’ guidebook to VCS REDD methodologies. Conservation International
81
Siikamäki J, Sanchirico JN, Jardine SL, 2012. Global economic potential for reducing carbon dioxide emissions from mangrove loss. Proc Natl Acad Sci USA 109: 14369–14374.
Sinh, Le Xuan, 1994. Mangrove forests and shrimp culture in Ngoc Hien district, Minh Hai provice, Vietnam. NAGA, the ICLARM Quarterly.
Southern Institute for Water Resources Planning (SIWRP) and Deltares, 2011, Draft report on water for food in the Mekong Delta, Vietnam-Netherlands Mekong Delta Masterplan Project
Space Technology Institute, 2011. Land cover change assessment in the coastal areas of the Mekong Delta 2004-2009, Technical Report. Department of Remote Sensing Technology-GIS-GPS, Space Technology Institute (STI), Vietnam Academy of Science and Technology (VAST)
Stevenson N.J., 1997. Disused shrimp ponds: Options for redevelopment of Mangrove. Coastal Management. 25 (4) 423-425
Swan, Steven, 2010. Co-management: concepts and practices in Viet Nam, in Co-management/Shared Governance of Natural Resources and Protected Areas in Viet Nam, Proceedings of the National Workshop on Co-management Concept and Practice in Viet Nam, Soc Trang, 17 – 19 March 2010
Tan, 2002. Mangrove forest of Ca Mau, Scientific report, Forest Science Institute of Viet Nam (unpublished and in Vietnamese).
Tilburg X.V, Röser F., Hänsel G., Cameron L. and Escalante D., 2012. Status report on Nationally Appropriate Mitigation Actions (NAMAs), Mid-year update May 2012
Tipper R., Coad N. and Burnett J., 2009. Is ‘Insetting’ the new ‘Off-Setting’? Technical Paper TP‐090413‐A, Ecometrica Press (available at http://www.ecometrica.com/assets//insetting_offsetting_technical.pdf)
Tong PHS, Auda Y, Populus J, Aizpuru M, Al-Habshi A et al. 2004. Assessment from space of mangrove evolution in the Mekong Delta, in relation to extensive shrimp farming. Int. J. Remote Sens. 25: 4795–4812.
Twilley R. R., Chen R.H.,and Hargis T., 1992. Carbon sinks in mangroves and their implications to carbon budget of tropical coastal ecosystems. Water, Air, and Soil Pollution 64: 265-288, 1992.
UNEP Bilateral Finance Institutions Climate Change Working Group, 2012. NAMA finance study: Examples from the UNEP Bilateral Finance Institutions Climate Change Working Group. https://www.kfw-entwicklungsbank.de/migration/Entwicklungsbank-Startseite/Entwicklungsfinanzierung/Umwelt-und-Klima/Zahlen-Daten-Studien/Studien-und-Publikationen/NAMA-Finance-Study-Examples-from-Bilateral-Finance-Institutions.pdf
van der Werf G.R., Morton D.C., DeFries R.S., Olivier J.G.J., Kasibhatla P.S. et al. 2009. CO
2 emissions from forest loss. Nature Geoscience 2: 737–738.
Vietnam Academy of Science and Technology (VAST), Space Technology Institute (STI), Department of Remote Sensing Technology-GIS-GPS, 2011. Land cover change assessment in the coastal areas of the Mekong Delta 2004-2009, Technical Report
Vo Q.T., Oppelt, N. Leinenkugel, P. Kuenzer, C., 2013. Remote sensing in mapping mangrove ecosystems — An Object-Based Approach. Remote Sensing 5, 183–201.
Vo Q. T., Kuenzer C. and Oppelt N., 2013. How remote sensing supports mangrove ecosystem service valuation: A case study in Ca Mau province, Vietnam, unpublished thesis
UN-REDD Programme Vietnam, 2012a. Phase II programme document, Operationalising REDD+ in Vietnam
UN-REDD Programme Vietnam, 2012b. Phase II programme document, Annex G
Wilkings A., 2012. Fisheries and aquaculture certification: Implications for South East Asia. Fisheries Transitions in Southeast Asia, 2011-2014. SSHRC PI Melissa Marschke. Working Paper Number 2
World Bank, IUCN, ESA PWA 2010. Capturing and conserving natural coastal carbon: Building mitigation, advancing adaptation.

Richard McNallySNV Global REDD Coordinator, [email protected]: @SNVREDDwww.snvworld.org/redd