organisational structure - til.co.za report 2010/2011 5 province’s export destinations •...
TRANSCRIPT


ANNUAL REPORT 2010/2011 1
Organisational Structure
Board of Directors
BusinessDevelopment
InvestmentServices
EconomicPlanning
Marketing and Communications
CorporateServices
InternationalOperations
Chief Executive
Company Secretary
Finance ResearchTrade and Exports
MiningCorporateMarketing
Municipal Capacity Building
Administration International
Marketing Asia
Agri-businessCorporate
Communication
Business Retention Services
Human Resources
Information Technology
Supply Chain Management
Manufacturing and Services
Stakeholder and Channel Management
International Marketing
America and the EU
Tourism
International Marketing
Africa and the Middle East

2 ANNUAL REPORT 2010/2011
VisionTo make Limpopo the major destination for trade and investment, thus creating a better life for all.
MissionPromotion of Limpopo as the preferred trade and investment location through marketing of its competitive advantages.
Values • Integrity
• Professionalism
• Botho
• Transparency
• Batho Pele
• Partnerships
• Excellence
• Innovation
Five agreements • That we are committed to the ideal of creating a better
life for the people of Limpopo through the TIL mandate;
• That we agree with the values of Batho Pele (people first);
• That we are committed to soaring together to greater heights of accomplishment, delivery and service;
• That we together will create a “Trust Organisation” – an organisation that delivers value to its customers and to its shareholders with integrity; and
• That we are a family of Giraffes and Ants; we envisage the future and work as a team.
Strategic objectives • Seek increased added-value from existing and new
projects;
• Increase the Limpopo added-value content of exported products;
• Create sustainable new jobs and maintain existing jobs;
• Increase equity and Broad-Based Black Economic Empowerment (B-BBEE);
• Create a competitive environment in Limpopo through improved capacity and by removing obstacles to competitiveness; and
• Make TIL the most effective learning organisation in Limpopo through knowledge management and sharing.
Corporate Profile

ANNUAL REPORT 2010/2011 3
Investment Sectors and Activities
Sector Investors/Projects OpportunitiesAgriculture • ZZ2tomatoproducers
• Sapikoeteaplantation• TshivhaseAgriDam• Willards• McCain• GiantFoods• MiamiCanners
• Considerableinvestmentopportunitiesinprocessingandpackagingoffruits,vegetablesandnuts,aswellasredandwhitemeat,chickeneggsandfurniture
• Additionalproductionofsunflowers,soyabeansandmaizeunderdry-landconditions• Greenhouseproductionofvariousagriculturalproduce
Manufacturing and services
• Siliconsmelters• AngloPlatinum• Eskom• GranorPassi• Bonanza• Kanhym
• Cultivationoffruitandvegetables• Manufacturingofjewellery• Furnitureandindustrialchemicals• Renderingoflighttomedium-sizedengineeringservices• Manufacturingandutilisationofmagnesiumoxide,cement,lime-basedproductsand
granite
Mining sector • AngloPlatinum• Invensil• Foskor• DeBeers(Venetia)• Exxaro• ImpalaPlatinum• Xstrata• RioTinto• Lonmin
• Manufacturingandsupplyoftools,uniforms,machineryandplantequipment• Beneficiationandtransformationofplatinumandothermetalsintovariousother
products• Small-scalemining• Basemetalssmelting• Diamondcutting
Tourism • XhakadziSafariLodge• KondoweConservancy• MabosegoGameFarm• Ga-molekwa• SaltLakeConservancy• Miningthemeparks
• Opportunitiesfordevelopmentofnature-basedtourismwithstrongappealtointernationaltourists
• Potentialforinvestmentintermsofownership,managementandconcessionaryactivity• Opportunitiesforindependenthospitalityproviders• Tourism;familyrecreation
Green economy • Renewableenergy• Recycling

4 ANNUAL REPORT 2010/2011
The Gateway to Africa and the World
An emerging African hubLimpopo is upgrading Polokwane International Airport, enabling it to handle the biggest, fully laden aircraft and to develop into a major cargo hub serving sub-Saharan markets and Europe. In addition, Limpopo is planning to develop an Industrial Development Zone (IDZ) around the airport, creating opportunities for exporters who add value to the province’s raw materials.
The upgrading of Maputo port in neighbouring Mozambique means that Limpopo-based exporters and importers can use the facility with growing confi dence. Maputo is much closer to Limpopo as compared to other ports where congestion often hampers trade. Limpopo exporters estimate they will save about one-third of their transportation costs by using the facility. Linked to Limpopo by road and rail, Maputo port is situated between 300 and 400 kilometres from the main mining and agricultural centres of Limpopo.
Approach to market • Outward selling missions – to promote Limpopo value-added products and commodities into the international markets;
• Inward buying missions – to promote Limpopo value-added products into the international markets; and
• Exhibitions – locally, nationally and internationally – to promote Limpopo value-added products and commodities.
Top 10 export destinations
Top 10 countries of import origin

ANNUAL REPORT 2010/2011 5
Province’s export destinations • European Union, Eastern Europe, Russian Federation
• United Kingdom
• Scandinavian countries
• Africa and the Middle East
• North America
• Australasia: Australia, China, Hong Kong, India, Indonesia, Japan, Korea, Republic of Malaysia, Singapore, Sri Lanka, Taiwan, Thailand, New Zealand
• Central America
• South America
The Gateway to Africa and the World
Export products and sectors • Animal by-products
• Art
• Beverages
• Clothing
• Fertiliser
• Food and by-products
• Fruit or nut purées
• Sauces, mixed condiments and seasonings
• Mustard flour
• Starch
• Sugar confectionery
• Sweetening substances
• Fruits, nuts and other edible parts of plants, prepared or preserved
• Dried fruit
• Fresh fruit
• Furniture
• Glass and by-products
• Glue
• Industrial/building/electrical tools, equipment and materials
• Mining
• Motor industry
• Oils
• Packaging
• Paper and by-products
• Plastic and by-products
South Africa’s Top 10 export destinations
• India
• China
• Taiwan/Chinese Taipei
• Netherlands
• Japan
• United States of America
• Germany
• Zimbabwe
• Italy
• United Kingdom
South Africa’s Top 10 countries of import origin
• Canada
• United Arab Emirates
• Togo
• Zimbabwe
• Congo, DRC
• India
• Saudi Arabia
• China
• Kuwait
• Zambia

6 ANNUAL REPORT 2010/2011
Board of Directors
NH MkhumaneChairperson of the Interim Board
HA NgobeniBoard Member
Dr MN KgathiBoard Member
NM MatlalaDeputy Chairperson
D KourtoumbellidesBoard Member
MMP MaletaBoard Member
V V MkhomboBoard Member
M MaphuthaBoard Member
M LekotaBoard Member
M BroderickHead of Department
MC SetlhakoBoard Member
WR MilneBoard Member
PJ MadunaBoard Member
PJ MalabelaBoard Member
LJ SenneloBoard Member

ANNUAL REPORT 2010/2011 7
Executive Management
M ShogoleGM – International Operations
M Monakedi Chief Executive Of� cer
PJ Moloisane GM – Economic Planning
C Mokoma DGM – International Operations
A ShiburiGM – Business Development
S Rakumako GM – Investment Services
K MahoaiGM – Marketing and Communications

8 ANNUAL REPORT 2010/2011
MEC’s Foreword
By combining and harnessing skills developed by these agencies over more than a decade, we plan to offer carefully selected potential investors a compelling case for investment in and trade with Limpopo.
We envisage adopting a highly targeted approach with one objective: to attract high-value investment to Limpopo. Thorough and precise research will enable us to identify and target foreign and domestic corporations that have a real need to use Limpopo’s competitive advantages in agriculture and agri-processing, mining and minerals benefi ciation, manufacturing and eco-tourism.
This means that our drive for new trade and investment will become more sector-specifi c, with more research and thought being applied to identify the most attractive opportunities in each sector. This will hopefully lead to more effective use of our human and fi nancial resources. In addition to packaging and marketing trade and investment opportunities, a unifi ed economic development agency will also be able to provide more effective aftercare services required by investors and traders, to unblock obstacles hindering their operations and possible expansion.
A more pivotal role will also be played by Limpopo’s political leadership which will use its infl uence and networking capabilities to pave the way for the economic development agency to develop relationships with investors. By working together more effectively, we will be able to leverage skills built up over many years to meet our most demanding challenges: economic growth, social development, job creation and poverty alleviation.
TIL has vast experience in trade and investment promotion and marketing. It has facilitated numerous investments and has established a wide range of contacts and forged alliances with counterparts in the Americas, Europe, Asia and in the Southern African Development Community. As this Annual Report demonstrates, TIL will be able to make a major contribution to Limpopo’s new economic development agency.
I wish to thank the Chairperson and Board, the HOD, TIL Chief Executive Offi cer, divisional managers and staff for the support they have given the department and Limpopo.
As outlined by the Chairman and Chief Executive Offi cer in this Annual Report, Northern Province Investment Initiative t/a Trade and Investment Limpopo (TIL) is being positioned by my department to play a more pivotal role in a concerted drive by Limpopo to attract high-value investment.
We are forming a single economic development agency that will bring together the experience and expertise of TIL, Limpopo Economic Development Enterprise, the Limpopo Business Support Agency and the Limpopo Agricultural Development Corporation, which have hitherto operated as independent agencies of the Limpopo Provincial Government.
Honourable Pitsi MolotoMEC for Economic Development, Environment and Tourism

ANNUAL REPORT 2010/2011 9
The Board of the merging entities is preparing to provide innovative leadership to guide and support the new economic development agency, which will need to be smart and well capacitated to meet the challenges presented by the tightening competition for trade and investment.
Chairperson’s Report
The year under review has marked many administrative and strategic milestones for Northern Province Investment Initiative t/a Trade and Investment Limpopo (TIL). Key among these was the Board’s active role in appointing and guiding a new Chief Executive, and ensuring a fi ne balance between operational continuity and accommodating a new strategic outlook. The Board was instrumental in ensuring cost management through the streamlining and tighter confi guration of programmes while paying close attention to stricter target setting and performance audits.
Central to operational challenges was management of the process in which TIL is joining three other agencies to form a single economic development agency for our province. Historical and future trading dynamics will, of course, defi ne the scope and priorities of the Board’s mandate and, by extension, those of TIL as a key component of the new institutional set-up.
The Board of the merging entities is preparing to provide innovative leadership to guide and support the new economic development agency, which will need to be smart and well capacitated to meet the challenges presented by the tightening competition for trade and
investment. These are tough times. The persistent international recession and consequent caution and uncertainty among investors means that Limpopo has to work that much harder to attract attention.
The challenge is clearly set out in this Annual Report by our MEC for Economic Development, Environment and Tourism. He states that we need to focus on attracting high-value investment by adopting a highly targeted approach. We need to clearly identify and target foreign and domestic corporations that have a real need to invest in developing Limpopo’s competitive advantages in agriculture and agri-processing, mining and minerals benefi ciation, manufacturing and eco-tourism. The MEC also expresses the hope that this tightly targeted approach will lead to more effective use of our human and fi nancial resources.
The duty of the new Board will be to create an environment in which the four formerly independent agencies work together as a seamless unit, and to provide as much guidance, advice and support as is needed to achieve the goals set for our new economic development agency.
Nombulelo MkhumaneChairperson of the Interim Board

10 ANNUAL REPORT 2010/2011
Chairperson’s Report
The Board will work to ensure that the new agency delivers the human and fi nancial resources effi ciencies envisaged by our political leadership. The development of an effi cient and unifi ed single agency will, in turn, place the political leadership in a better position to perform its vital oversight role. Above all, the Board will work to ensure that our province extracts maximum benefi ts from these effi ciencies, thus greatly contributing to service delivery and enterprise development for the people of Limpopo.
The Board will participate in the development of strategies to build on Limpopo’s success in developing enterprises in agri-processing, mining and minerals benefi ciation, manufacturing and eco-tourism.
In addition, the Board will facilitate where possible the forging of partnerships with key players in South Africa, Southern Africa and the rest of our continent. This will hopefully further raise Limpopo’s profi le and enable us to share information on trade and investment opportunities and trends, and experiences and expertise in dealing with traders and investors.
A great challenge lies ahead, and the Board looks
forward with great anticipation to playing a positive and
constructive role in meeting it head on.
AppreciationAs this Annual Report amply demonstrates, TIL has again
made a major contribution to economic development in
Limpopo. On behalf of the Board, I wish to welcome and
thank the Chief Executive, the management and staff
for their dedication. We now look forward to a dynamic
contribution from TIL as an integral part of our new
economic development agency.
Nombulelo MkhumaneChairperson of the Interim Board
The duty of the new Board will be to create an environment in which the four formerly independent agencies work together as a seamless unit, and to provide as much guidance, advice and support as is needed to achieve the goals set for our new economic development agency.

ANNUAL REPORT 2010/2011 11
Chief Executive Offi cer’s Report
I have taken over as Chief Executive Offi cer at a time when TIL is taking another big step in its development through its merger with Limpopo Economic Development Enterprise, the Limpopo Business Support Agency and the Limpopo Agricultural Development Corporation. These agencies of the Limpopo Provincial Government are being mandated to work together in a more focused effort to build our province’s economy and develop its potential as a trade and investment destination in the heart of the Southern African Development Community.
It is envisaged that the merger will facilitate a more effective alignment between the economic resources of Limpopo, the Provincial Government’s Limpopo Employment Growth and Development Programme, and National Government’s New Growth Path. These ambitious programmes and policies aim to develop our abundance of human and natural endowments to underpin economic growth that will generate critically needed jobs and new wealth creation, leading to systematic poverty alleviation.
The imminent conclusion of the merger could not have come at a more opportune time. It will hopefully
place Limpopo in a stronger position to meet its most demanding challenge in attracting new trade and investment. This comes as turmoil in developed world economies shows no signs of abating. Following the 2008 US economic meltdown, triggered by the implosion of over-leveraged property and banking sectors, the contagion has spread to include major fi scal challenges in Europe, initially in Britain, then in Euro-zone economies, starting with Ireland and Greece, and now Italy. This instability means only one thing: foreign direct investment from our traditional business partners will be harder to come by.
Unpredictability in world affairs calls for new approaches and strategies. I foresee a pressing need to align TIL’s mandate and services to cater for both unforeseen challenges as well as fi erce competition for trade and investment. I have identifi ed three pillars on which to anchor a new strategic approach.
Firstly, we need to ensure that our efforts to attract investment focus not merely on our well-known competitive advantages in agriculture and agri-processing, mining and minerals benefi ciation, manufacturing and tourism, but we need to focus strongly on packaging
Starting out as the fl edgling Northern Province Investment Initiative in 1995, Northern Province Investment Initiative t/a Trade and Investment Limpopo (TIL) has transformed into a vigorous economic development agency that has played a central role in supporting Limpopo’s drive for growth, job creation and poverty alleviation.
Motalane MonakediChief Executive Offi cer

12 ANNUAL REPORT 2010/2011
Chief Executive Offi cer’s Report
compelling propositions that will persuade multinationals to make high-value investments in Limpopo. This should, of course, be coupled with investment incentives tailored for each of our key economic sectors.
Secondly, we need to adapt TIL’s structure in order to extract maximum benefi t from this new strategy. This means greater focus on sector-specifi c business units; each of which must have its own capacity to undertake research, project packaging, marketing and business development services, and to provide aftercare to investors. This will greatly reduce lag time in intra-divisional project referrals, and improve operational effi ciency.
Thirdly, there is a pressing need to develop public sector trade and investment facilitation skills through partnerships with the private sector and institutions of higher learning. This will ensure that people responsible for marketing Limpopo are adequately skilled and aware of trends and shifts in the global environment.
I look forward to playing a role in the transformation of TIL and contributing to the focused marketing of Limpopo as a highly desirable destination for high-value investment.
AppreciationI wish to thank Mr Pitsi Moloto, MEC for the Department of Economic Development, Environment and Tourism, for his support and for providing strong leadership in transforming Limpopo’s economic landscape. I am most grateful, too, for the support we receive from the Head of the Department, Ms Maylene Broderick.
I also thank the interim Board of Directors under the Chairmanship of Ms Nombulelo Mkhumane, and TIL’s executive management and staff for their dedication and hard work.
Motalane MonakediChief Executive Offi cer
We need to focus strongly on packaging compelling propositions that will persuade multinationals to make high-value investments in Limpopo.
PackagingCompelling propositions to persuade multinational investors to make high-value investments
PartnershipsDevelop public sector trade and investment facilitation skills through partnerships with the private sector and institutions of higher learning
FocusEach sector-specifi c business unit must have its own capacity to do research, project packaging, marketing, business development and investor aftercare
Strategic approach to attract
investment

ANNUAL REPORT 2010/2011 13
Economic Planning Division
Global foreign direct investment (FDI) flows began to bottom out in the latter half of 2009. This was followed by a modest recovery in the first half of 2010 sparking some cautious optimism for FDI prospects in the short term. In the longer term the recovery in FDI flows is set to gather momentum.
Global inflows are expected to pick up to over US$1,2 trillion in 2010, rise further to US$1,3 – US$1,5 trillion in 2011, and head towards US$1,6 – US$2 trillion in 2012. However, these FDI prospects are fraught with risks and uncertainties, including the fragility of the global economic recovery.
The current FDI recovery is taking place in the wake of a drastic decline in FDI flows worldwide in 2009. After a 16% decline in 2008, global FDI inflows fell a further 37% to US$1,114 billion, while outflows fell some 43% to US$1,101 billion. There are some major changes in global
FDI patterns that preceded the global crisis and that will most likely gain momentum in the short and medium term.
FDI in sub-Saharan AfricaOutside of South Africa, foreign private capital flows into sub-Saharan Africa come almost exclusively in the form of FDI. And while such flows represent as much as 20% of total gross capital formation in the region, for many years FDI inflows have been almost exclusively focused on the extractive sector. Indeed, the high commodity prices of recent years have supported large capital inflows to many resource-rich African countries and helped to sustain these flows even during the crisis.
Sub-Saharan African countries appear to be better positioned to receive more international capital flows in the current cycle. The investment climate in most countries is improving, and many have improved their macroeconomic policies and debt sustainability. In fact, for global investors, several countries in the region represent relatively untapped large and rapidly growing markets (regional GDP is projected to grow by more than 5% annually between 2010 and 2012).

14 ANNUAL REPORT 2010/2011
Economic Planning Division
Foreign trade and paymentsGlobal growth moderated in the third quarter of 2010, following an expansion in output at an average annualised rate of around 5% in the preceding four quarters. According to the October 2010 IMF World Economic Outlook, the global economy is projected to grow by 4,8% in 2010 and 4,2% in 2011. This outlook was revised upwards by 0,2 percentage points for 2010, while the forecast for 2011 was revised downwards by 0,1 percentage points.
Economic growth in advanced economies was revised upwards to 2,7% in 2010 and downwards to 2,2% in 2011, while growth in emerging market and developing economies was revised upwards to 7,1% in 2010 and left unchanged at 6,4% in 2011. The IMF noted that the global economic recovery remained fragile and uneven with risks to the outlook mainly on the downside.
The relatively strong growth performance and positive outlook for emerging-market economies after the crisis, combined with fairly large interest rate differentials and generally healthier fiscal positions favouring emerging economies over advanced economies, have resulted in a surge in capital flows to emerging-market economies. According to the Institute of International Finance, net private capital flows to emerging market economies are expected to rebound from US$581 billion in 2009 to US$825 billion in 2010 and US$833 billion in 2011.
The waning of post-2010 FIFA World Cup tournament activities during the third quarter of 2010 contributed to a contraction in travel receipts from foreign tourists and caused, among other factors, the deficit on the overall services, income and current transfer account with the rest of the world to widen again over the period. This larger shortfall more than neutralised the improvement in the trade balance, causing the overall current account deficit to widen from 2,5% of gross domestic product in the second quarter of 2010 to 3,0% in the third quarter.
The widening in the deficit on the overall account was further exacerbated by an increase in net current transfers to members of the Southern African Customs Union during the third quarter of 2010. Owing primarily to an increase in the prices of services rendered to non-residents, the rand price of exports of goods and services increased in the third quarter of 2010, whereas a decline was recorded in the import prices of goods and services. This resulted in a further improvement in South Africa’s terms of trade over the period.
South African financial accountThe more accommodative monetary and fiscal policy measures adopted and maintained by many developed countries to deal with the aftermath of the global financial crisis, continued to bolster investment flows into high-yielding emerging-market assets.
With capital flows to emerging-market countries likely to persist for some time due to favourable growth prospects among other factors, governments of recipient economies are faced with the challenge of dealing with such flows and their impact on exchange rates, sectoral profitability and resource allocation. South Africa attracted capital to an amount of R27,6 billion in the third quarter of 2010. This sizeable capital inflow exceeded the net inflow of capital in the second quarter of 2010 and brought the net cumulative inflow of capital in the first three quarters of 2010 to R98,7 billion.
Foreign direct investment into South Africa receded from an inflow of R2,9 billion in the second quarter of 2010 to an inflow of R1,1 billion in the third quarter. The inflow of capital in the third quarter was mainly due to an increase in loan finance extended by non-resident holding companies to domestic subsidiaries and equity investment in a domestic paint manufacturing company.
Inward portfolio investment increased from R28,4 billion in the second quarter of 2010 to R45,8 billion in the third quarter as non-resident investors continued to acquire South African securities. Non-resident investors’ enhanced appetite for domestic debt securities, which had become evident since the fourth quarter of 2009, continued to dominate portfolio inflows in the third quarter of 2010.
Other investment flows into South Africa registered an inflow of R15,1 billion in the third quarter of 2010 compared with an outflow of R1,5 billion recorded in the preceding quarter. Whereas non-residents’ deposits with domestic banks remained subdued up to and until the second quarter of 2010, these inflows rebounded materially during the third quarter, partly on account of the expiry of some of the government bonds held by non-residents. These inflows were further supplemented by an increase in foreign loans drawn upon by South African banks in the third quarter of 2010, as well as further drawings by parastatals to finance domestic capital expenditure.
ANNUAL REPORT 2010/2011 15
Economic Planning Division
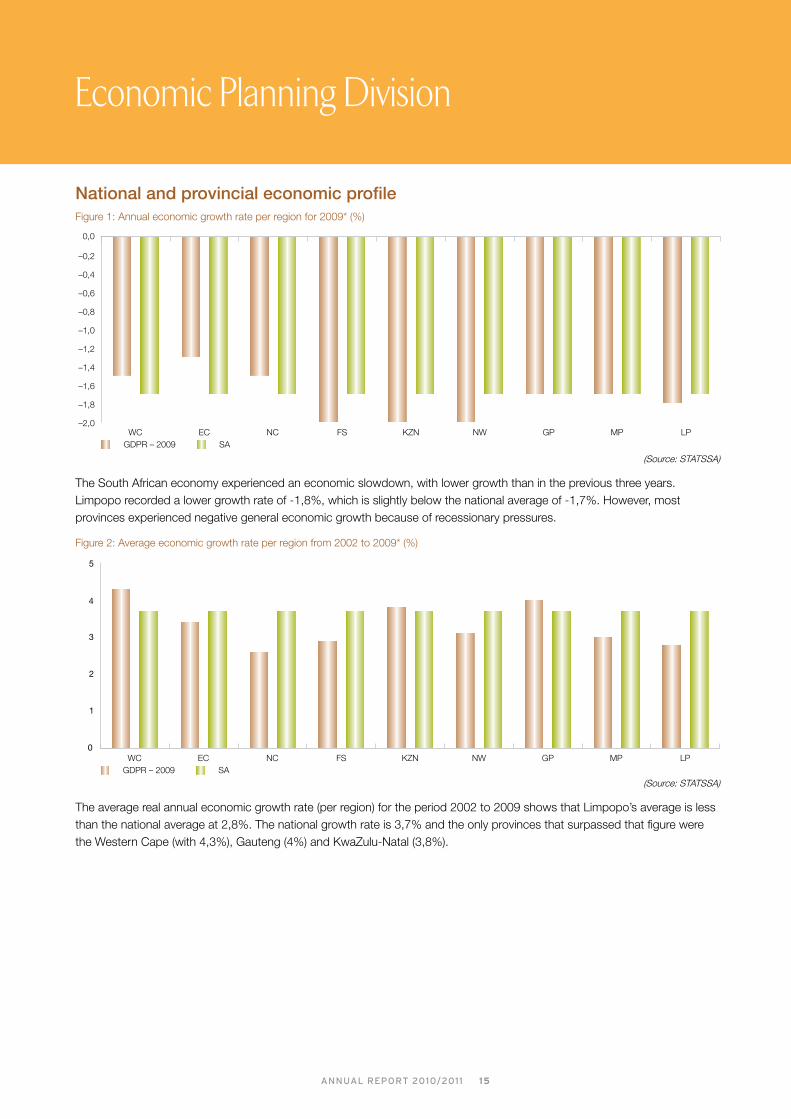
National and provincial economic profileFigure 1: Annual economic growth rate per region for 2009* (%)
(Source: STATSSA)
The South African economy experienced an economic slowdown, with lower growth than in the previous three years. Limpopo recorded a lower growth rate of -1,8%, which is slightly below the national average of -1,7%. However, most provinces experienced negative general economic growth because of recessionary pressures.
Figure 2: Average economic growth rate per region from 2002 to 2009* (%)
(Source: STATSSA)
The average real annual economic growth rate (per region) for the period 2002 to 2009 shows that Limpopo’s average is less than the national average at 2,8%. The national growth rate is 3,7% and the only provinces that surpassed that figure were the Western Cape (with 4,3%), Gauteng (4%) and KwaZulu-Natal (3,8%).
–2,0
–1,8
–1,6
–1,4
–1,2
–1,0
–0,8
–0,6
–0,4
–0,2
0,0
WC EC NC FS KZN NW GP MP LPGDPR – 2009 SA
0
1
2
3
4
5
WC EC NC FS KZN NW GP MP LPGDPR – 2009 SA

16 ANNUAL REPORT 2010/2011
Figure 3: Provincial contributions to economic activity for 2009
(Source: STATSSA)
The sectors that contributed significantly to regional GDP are mining and quarrying (with 27%), followed by general government services (17%), then finance, real estate and business services at 15%.
The contribution of mining in the province points to the structural importance of its predominance in the economy and has not changed significantly for some years. Finance, real estate and business services stand at 15% due to increased demand for credit by household and corporate agents.
The high contribution from the general government services sector reflects the province’s continued heavy reliance on government expenditure.
Manufacturing, as the most punted sector in the provincial growth plan due to its labour-absorptive capacity, continued to take a knock. This can be attributed to the fact that the province exports raw materials/commodities as opposed to beneficiated products.
Figure 4: Provincial contribution to South African economy in 1999, 2005 and 2009 (%)
0
5
10
15
20
25
30
35
1999 2005 2009WC EC NC FS KZN NW GP MP LP
(Source: STATSSA)
Comparing the provincial contribution to the national aggregate growth for the 10-year period from 1999 to 2009 (with 2005 serving as a base year), regional GDP rose from 5,7% to 7%. This can be described as a 22,8% change from 1999 to 2009, which signifies positive growth as compared to other leading provinces like KwaZulu-Natal, the Western Cape and Gauteng. However, Limpopo can achieve more if efforts are made to promote industries focused on adding value.
Economic Planning Division
Mining and quarrying 27%
Manufacturing 3%
Electricity, gas and water 3%
Wholesale, retail, motor trade and accommodation 10%
Construction 2%
Transport, storage and communication 7%
Finance, real estate and business services 15%
Community, social and other personal services 4%
General government services 17%
Taxes less subsidies on products 9%
Agriculture, forestry and �shing 3%

ANNUAL REPORT 2010/2011 17
Figure 5: Comparison of district contributions between 1999 and 2009
(Source: Global Insight)
Figure 5 shows that as the economic structure of Limpopo evolves, the contribution of the districts also changes. This is because of various economic developments taking place in certain districts.
What is notable is that the Capricorn district has improved from last year’s 24% to 26%, placing the district in top spot in terms of contribution to provincial GDP. Waterberg is on par with Mopani at approximately 24%, but the former has decreased from a higher base as compared to Mopani. Vhembe ranks fourth, but its contribution declined marginally from 17% to 16% during the period under review.
Economic Planning Division
District contribution to provincial GDP: 1999
Mopani 23%
Vhembe 17%
Capricorn 24%
Waterberg 27%
GreaterSekhukhune 24%
District contribution to provincial GDP: 2009
Mopani 24%
Vhembe 16%
Capricorn 26%
Waterberg 24%
GreaterSekhukhune 10%
District contribution to provincial GDP: 1999
Mopani R18,8bn
Vhembe R13,5bn
Capricorn R19,7bn
Waterberg R21,8bn
GreaterSekhukhune R7,3bn
District contribution to provincial GDP: 2009
Mopani R26,8bn
Vhembe R17,0bn
Capricorn R29,0bn
Waterberg R26,9bn
GreaterSekhukhune R10,8bn
The high contribution from the general government services sector reflects the province’s continued heavy reliance on government expenditure.

18 ANNUAL REPORT 2010/2011
Economic Planning Division
Limpopo fixed capital investment According to the Northern Province Investment Initiative t/a Trade and Investment Limpopo (TIL) investment tracking system, Limpopo attracted R30,689 billion worth of investment from January 2010 compared to R32,4 billion of investment flows in 2009. Of the R30,689 billion, TIL facilitated investments of R1,467 billion, which resulted in 1 500 jobs being created.
Figure 6: Fixed capital investment by district 2008, 2009 and 2010 (R billion)
(Source: TIL investment tracking system)
During 2010, Waterberg was the major contributor with R17,7 billion, although its contribution declined from R21,6 billion in the previous year. The second highest inflow of capital during 2010 took place in the Sekhukhune District which accounted for R8,3 billion of overall capital formation in Limpopo. Mopani District experienced a decline of R927 million in 2010 compared to R1,5 billion in 2009.
Figure 7: District percentage share of fixed capital investment 2010
(Source: TIL investment tracking system)
Waterberg’s contribution amounted to 60% compared to 67% in 2009. Sekhukhune experienced an increase from 2% in 2009 to 28% in 2010. Vhembe’s contribution declined from 22% in 2009 to 6% in 2010, and Mopani’s contribution declined from 5% in 2009 to 3% in 2010.
Figure 8: Fixed capital investment by sectors 2010
(Source: TIL investment tracking system)
Mining was the major contributor, increasing its contribution from 51% in 2009 to 76% in 2010 due to mining projects taking place in the Sekhukhune and Waterberg districts. However, some of these projects have not yet been implemented.
Government’s contribution increased from 11% in 2009 to 15% in 2010 due to more emphasis being placed on health and social development. The agriculture sector contribution remained unchanged at less than 1% in 2010 as a percentage of total investment flow even though five projects to the value of R137 million were recorded for the 2010 financial year as compared to three projects in 2009.
Mopani 3%
Vhembe 6%
Capricorn 3%
Waterberg 60%
GreaterSekhukhune 28%
Manufacturing 6%
Mining 76%
Retail 3%
Agriculture 0%
Government 15%
0
5 000
10 000
15 000
20 000
25 000
30 000
35 000
Sekhukhune Waterberg Capricorn Vhembe Mopani Total2008 2009 2010
ANNUAL REPORT 2010/2011 19
Economic Planning Division
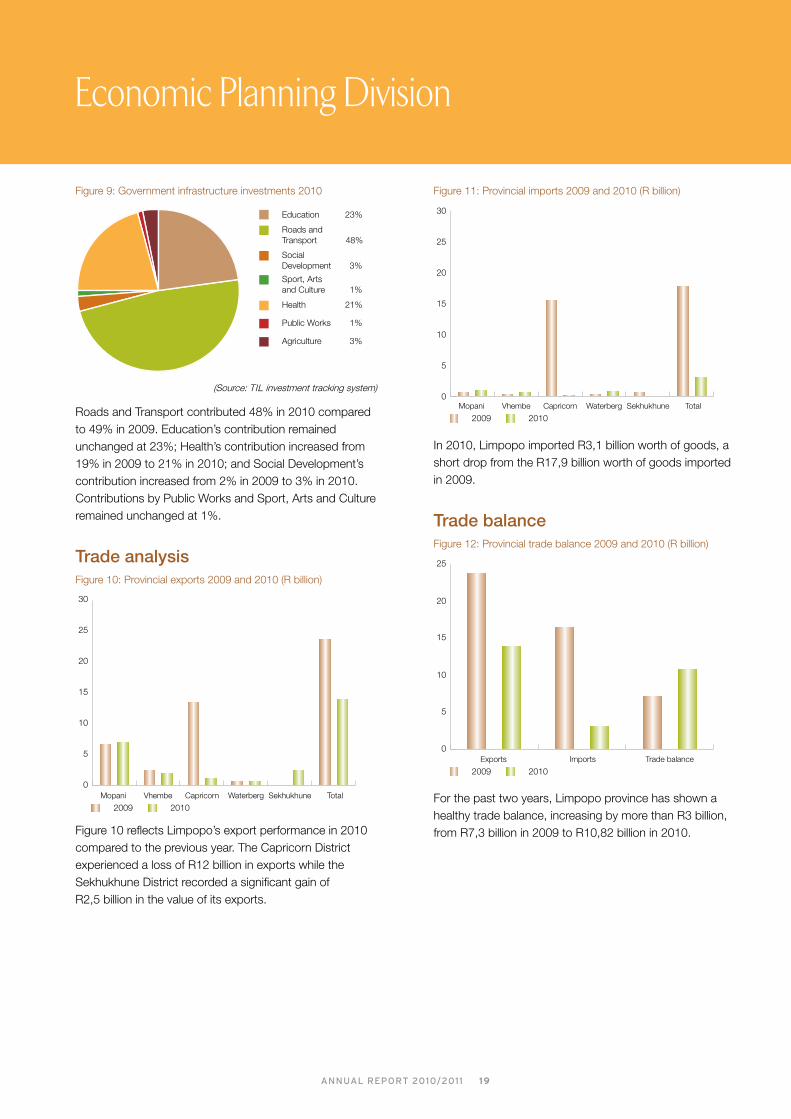
Figure 9: Government infrastructure investments 2010
(Source: TIL investment tracking system)
Roads and Transport contributed 48% in 2010 compared to 49% in 2009. Education’s contribution remained unchanged at 23%; Health’s contribution increased from 19% in 2009 to 21% in 2010; and Social Development’s contribution increased from 2% in 2009 to 3% in 2010. Contributions by Public Works and Sport, Arts and Culture remained unchanged at 1%.
Trade analysisFigure 10: Provincial exports 2009 and 2010 (R billion)
Figure 10 reflects Limpopo’s export performance in 2010 compared to the previous year. The Capricorn District experienced a loss of R12 billion in exports while the Sekhukhune District recorded a significant gain of R2,5 billion in the value of its exports.
Figure 11: Provincial imports 2009 and 2010 (R billion)
In 2010, Limpopo imported R3,1 billion worth of goods, a short drop from the R17,9 billion worth of goods imported in 2009.
Trade balanceFigure 12: Provincial trade balance 2009 and 2010 (R billion)
For the past two years, Limpopo province has shown a healthy trade balance, increasing by more than R3 billion, from R7,3 billion in 2009 to R10,82 billion in 2010.
Education 23%
Roads andTransport 48%
SocialDevelopment 3%
Health 21%
Sport, Artsand Culture 1%
Public Works 1%
Agriculture 3%
2009 2010Mopani Vhembe Capricorn Waterberg Sekhukhune Total
0
5
10
15
20
25
30
2009 2010Mopani Vhembe Capricorn Waterberg Sekhukhune Total
0
5
10
15
20
25
30
2009 2010Exports Imports Trade balance
0
5
10
15
20
25

20 ANNUAL REPORT 2010/2011
GoalKey performance indicator Target Performance results Reason for variance
Increased investments InvestmentsReportstartingfromaminimumofaR1millioninvestment
ImplementationoftheInvestmentModel
SurveyMediaauditVerificationofprojects
InvestmenttrackingLekgotla
AnnualInvestmentFlowReport
Implementationandreviewofthemodelusageatdistrictandmunicipallevels
TotalinvestmentofR30,689billionhasbeenrecordedTotalinvestmentsfacilitatedbyTILfor2010/11amountedtoR1,467billionwith1500jobscreated
HostedinvestmentLekgotlaon24March2011inSekhukhune
AnnualInvestmentFlowdone
Reviewofthemodelnotdone
Nil
Nil
Nil
ModelnotyetcompletedduetodelayinappointmentofSupplyChainOfficer
2010/11AnnualEconomicReports
EconomicSummitsquarterly
Economicreports
EconomicimpactanalysisofMapungubweandMarulaFestival
Quarterlyeconomicnewsletters
Annualeconomicreport
Seminaroncurrenteconomicissues
ImpactanalysisforMaruladone
Quarterlyeconomicnewsdone
Annualeconomicreportdone
SeminaroncurrenteconomicissuesdoneinconjunctionwithLekgotla
LateapprovalforparticipationinMapungubweFestival
Nil
Nil
Nil
ParticipationontheLRFanditsCommittees
CreationofBusinessSectionwithinlibraries
ParticipatingandreportingontheLRFdevelopmentprocess
Publicawarenesscampaign
Equippinglibrariesandbranding
Launchingofthebusinesssection
Participationisongoingandeventsreportedasandwhentherearenewdevelopments
BoughtfurnitureforSeshegolibrary,publicawarenessandbrandingnotdone
Launchnotdone
Nil
Brandingofthelibrariesdelayedduetolackofstaff(SCO)
Delayeduntilbrandingisdone
ImplementationofInvestmentTargetingStrategyrecommendationsandupdated2010/11
InvestmentTargetingMatrix
Implementationofprovincialincentives
ImplementationofInvestmentTargetingStrategyrecommendation
2010/11InvestmentTargetingMatrixreport
Implementationofprovincialincentivesrecommendations
StrategyonlyimplementedinVhembeDistrictandtheMopaniDistrict
InvestmentTargetingMatrixnotcompleted
ProvincialincentivesimplementedinVhembeandMopani
Lackofcooperationinotherdistricts
Lackofstaff
Lackofcooperationinotherdistricts
Economic Planning Division

ANNUAL REPORT 2010/2011 21
Economic Planning Division
GoalKey performance indicator Target Performance results Reason for variance
Increased investments ImplementationoftheFuelCell,MetalOxideandAutoCatalystConvertorsStudies
Carryoutonefeasibilitystudy
Implementationandfollow-upsofthestudies
Draftfeasibilitystudy
Studiesimplemented
Nothingdonesincenoprojectisplannedforminingin2010/11
Nil
Nonewopportunitiesidentifiedunderminingasthereisnobudgetunderthisitem
Implementationofdriedtomatoandpotatomashandcanningstudies
Carryoutonefeasibilitystudyinpharmaceutical
Implementationandfollow-upsofthestudies
Draftfeasibilitystudy
Studiesimplemented
ToR-approved,howeverbriefbusinessplanshavebeencompletedforAloe
Nil
TenderadvertnotdoneastheSupplyChainManagerpositionisvacant
Feasibilitystudiesontwosectorstudiesidentifyingbeneficiationinvestmentopportunities
Finalreportonthelasttwosectorstudies
ToRforAguarandAgaveapprovedandyettobeputontenderadvert
TenderadvertnotdoneastheSupplyChainManagerpositionisvacant
Grow exports PreparationoftheAnnualTradeReport
Continuousupdatingofinformationandreportsfromsourcesidentified
AnnualTradeReport
AnnualTradeReportcompleted Nil
AnalysisreportonFreeTradeAgreementsinvolvingSouthAfrica
DistrictsummitsonSA-USAtradebenefitsandbarriers
Completionofthedatabase
DonefortheVhembeandMopaniDistricts
Theexportdatabaseisaworkinprogress
Lackofcollaborationfromotherdistricts
Lackofcollectiveorganisingandplanningapproachindevelopingthedatabase
Increased investments and grow exports
DevelopmentoftheMarketPenetrationStrategy
CompletionofMPSstudywithimplementationplans
Notdone Notbudgetedforin2010/11

22 ANNUAL REPORT 2010/2011
The international financial crisis generally constrained the ability of investors to raise funds to undertake projects. Nevertheless, the Division exceeded its target to facilitate the investment of R450 million and to create at least 800 jobs during the year under review.
A notable achievement was the Division’s role as a facilitator in the acquisition of Phalaborwa-based fertiliser and chemicals company Sasol Nitro by Farmers’ World Limpopo, a group that includes Limpopo farmers and other investors from the United States and Malawi. The Division assisted in resolving a number of issues that helped to pave the way for the transaction.
Retail centre developmentThe Division’s long-standing project to bring modern shopping facilities to Limpopo’s rural citizens continues to
yield excellent results, with three new retail centres now
under development.
The process began in 2004 when Northern Province
Investment Initiative t/a Trade and Investment Limpopo
(TIL) undertook market research which identified 17 areas
in Limpopo that had good potential for the establishment
of retail centres. Presenting the research to developers,
TIL set about persuading them that investment in
rural areas was a good proposition. This led to such
developments as Makhado Crossing, the Hubyeni
shopping complex in Elim, and the Malamulele complex.
TIL commissioned a further study in August 2008
to update the original research and identify not only
other rural and semi-rural areas with potential for the
establishment of retail complexes, but also potential
commercial centre growth points in urban areas.
Construction of the R75 million Phangami Mall in
Thohoyandou followed in 2009, with the creation of some
250 permanent jobs.
Development of another three shopping centres started
during the year under review. The R70 million Siloam
Shopping Centre is scheduled to open late in 2011,
leading to the creation of an estimated 250 permanent
Business Development Division

ANNUAL REPORT 2010/2011 23
jobs. Another shopping centre is being planned in Malamulele involving investment of R75 million and creation of about 300 jobs. A further investment of R75 million and the creation of another 300 jobs is envisaged in the planned development of Senwabaranwa Shopping Centre.
TIL facilitates investments by, for example, assisting developers to comply with the Development Facilitation Act, 1995 (Act 67 of 1995) which requires them to secure the support of tribal authorities in rural developments.
Business Process Outsourcing and Offshoring (BPO&O)The Division launched the TIL Business Plan during the year, to attract investment in Business Process Outsourcing and Offshoring (BPO&O), more popularly known as the call centre industry.
BPO&O ranks as one of South Africa’s fastest-growing sectors, with average annual growth of 8% leading to the establishment in the country of some 1 800 call centres employing between 150 000 and 175 000 people.
Limpopo’s share of the market is confined to two large BPO&O installations: the regional MTN call centre which employs 250 people in Lebowakgomo, and the Eskom call centre based in Polokwane where 100 people are employed. In addition, a small I-Community Call Centre operates in Mogalakwena.
The TIL BPO&O Business Plan aims to expand Limpopo’s share of the market, and indicates that the province has the potential to attract call centre investment that could create between 2 500 and 5 000 jobs within five years.
The purpose of the Business Plan is to request suitably qualified service providers to assist the province with technical and professional expertise in developing a BPO&O value proposition for investment in Limpopo, a skills development plan, and a marketing strategy.
BPO&O is seen as an anchor industry in the establishment of an Information and Communications Technology (ICT)value chain in Limpopo. With the introduction of the Limpopo Living Lab Hub, BPO&O can assist the creation of a conducive climate for local and multinational ICT companies to invest in Limpopo.
MiningThe Division has been engaged in implementing two key projects involving potential investment of some R2 billion and creation of an estimated 800 jobs.
The Division initiated the undertaking of a study into the feasibility of establishing a chrome chemicals beneficiation plant based around the chromitite-rich Eastern Bushveld Complex in Limpopo.
The project envisages securing chemical grade chrome resources as raw material that would be beneficiated into various chrome-related chemicals, such as sodium dichromate, chromium sulphate, chromic acid, chromium oxide and aluminium hydroxide, which can be used in the tannery and paint industries. The plant would require investment of R1,2 billion and would create 300 direct and 1 000 indirect jobs. The Division facilitated consultations and interviews with a wide range of parties and established contact with technology owners and potential investors.
The Division also facilitated the buy-in of various local mining companies into a project to establish a Mining Supply Park in Limpopo. The project would require investment of R800 million and would create 500 jobs.
This project involves the establishment of an industrial park accommodating various factories which would produce mining supplies and products such as pumps, electrical components, valves, bolts and nuts, and moulds and steel fabrications for the Limpopo mining industry.
Business Development Division
Construction of the R75 million Phangami Mall in Thohoyandou followed in 2009 with the creation of some 250 permanent jobs.

24 ANNUAL REPORT 2010/2011
Business Development Division
GoalKey performance indicator Target Performance results Reason for variance
Increased investments Facilitatetheestablishmentofchrome chemicalprocessingplantsinNorthamandDilokongregions
Mobiliseinvestors PromotedtheprojectduringtheMiningIndabaheldinFebruary2011.MeetingwasheldwithoneinterestedChinesecompany.AnothermeetingheldwithNEFasthelocalfundingpartners
Nil
Facilitatealternative energyproductionprojectsinLephalaleincollaborationwithSasol(CTL)andAnglo-Coal(CBM)
FacilitateEIAandothergovernmentapprovals
MonitoringdevelopmentsfromSasoltore-prioritisetheprojectin2011
Nil
Establishmentofadimension stoneprocessingplantinPolokwane
Mobiliseinvestorsandpartners Done Nil
EstablishmentofaMining Supply Park(MSP)inSteelpoort
MobiliseothermininghousestocommittoMSP
Constructionunderwayand fundedbyXstrataminingcompany
Nil
Establishmagnetite beneficiationplantinPhalaborwa
Facilitatebeneficiationlicenceandelectricity
NegotiationswithEskomandFoskorareongoing
Nil
Explorationprogrammesfornew PGM projectsintheEasternLimbNorthernLimb
Facilitatesupportfromhostcommunities,landownersandgovernment
MonthlymeetingstookplacebetweengovernmentandhostcommunitiesinboththeEasternandWesternlimbs
Nil
Explorationprogrammesfornewcoal-identifiedprojects
Participationinmissionsforsecuringinvestmentfortargetedprojects
TooktheownersoftargetedprojectstotheMiningIndabaformatchmakingprocesswithinternationalinvestors
Nil
ExplorationprogrammeatBakenberg graniteprojectbyTiyakaneMining
Mobilisefundsandinvestmentfortargetedprojects
Noprogress Projectdossiernotcompleted
ExplorationprogrammeatLetsitele graniteprojectbySolarSpectrumTrading
Mobiliseinvestment ProjectforwardedtoIDCforfunding
Nil
ExplorationprogrammeforMatlala granitebyXminResources
Mobiliseinvestment InvestmentmobilisedfromXminResources
Nil
Explorationprogrammeforvermiculite and clay miningatModjadjibyPhalalaResources
Mobiliseinvestment Noprogress Budgetforfeasibilitystudynotavailable
ExplorationprogrammeintheGravellotteandGiyaniareasbyNkgapuResourcesforgold mining
Mobiliseinvestment Investormobilisedandexplorationisongoing
Nil
DevelopmentofabusinessplanforGiyani stone crusherbyBautheniInvestments
Mobiliseinvestment InvestorbeingmobilisedApplicationforfundinglodgedwiththeIDC
Nil
DevelopmentofabusinessplanforBahananwa pebbles
Feasibilitystudyfortheevaluationofthepebbles
Noprogress Stakeholderbuy-innotcompleted

ANNUAL REPORT 2010/2011 25
Business Development Division
GoalKey performance indicator Target Performance results Reason for variance
Increased investments EstablishmentofanewagaveprocessingplantinSekhukhune
Mobilisationofstakeholdersanddevelopmentofasteeringcommitteetomanagetheproject
Appointmentofaserviceprovidertoconductfeasibilitystudyfortheproject
ProjectSteeringCommitteeestablishedcomprisingSDM,MakhuduThamagaMunicipalitySEDAandTIL
TORforserviceproviderdevelopedbutnotadvertised
Nil
SlowSCMprocess
Continuoussupportoftheco-opandgeneralprojectmanagement
Seekmorefundingandcontractmanagement
Continuous Nil
Securemarketsfororganicproducts
Facilitatefeasibilitystudyforapackhouse
Assistinacquiringproductiontoolsandothersupportingmachinery
Mobilisationofstakeholdersanddevelopmentofasteeringcommitteetomanagetheproject
ProjectSteeringCommitteeestablishedcomprisingMopaniDistrictMunicipality,GreaterTzaneenMunicipality,LDA,SEDAandTIL
Feasibilitystudytobeconductednextfinancialyear
Nil
Secureamentorfortechnical,marketingandsalesforcrocodileproducts
Businesssetupandfacilitatingprojectmanagement
None.Projectclosed Projectcompleted Nil
Toassessthemarketandeconomicviabilityofthebusinesstobepurchasedonbehalfofrestitutionbeneficiaries
Evaluationonaneedsbasis NorequestwasreceivedfromtheRLCCduringthequarter
Nil
Constructionoftheoilextractionandbiodieselplant,trainingofincubatesandproductionoffeedercropsbyincubates
ParticipatingontheBoardtoassistwithgovernanceandstrategyoftheregisteredentity
Boardmeetingsheldduringthequarter
Nil
Mobiliseoperatorsandowners
ParticipateinProjectSteeringCommittee
Planimplementation TaskTeamestablishedbyLEDETandTILrepresented
Nil
Facilitatebusinessdevelopment,planningandfundingfortheproject
Preparationforimplementationoftheprojectandcommissioningofafeasibilitystudy
LandfinalisationwithMolepoTribalCouncil
ProjectmanagementcommitteecomprisingTIL,LIMDEV,MolepoTribalAuthorityestablished
Appointmentofaserviceprovidertoconductfeasibilitystudytobedoneduringthenextfinancialyear
SlowSCMprocess
FacilitateSAFINTRArequirementsofelectricity,landandrailwaylineforsteelmanufacturingplantinMokopane
FacilitatelandatMokopanewithrailwayline
InvestorhaswithdrawnduetopowershortageinthecountryandoptedforZimbabwe
Nil
26 ANNUAL REPORT 2010/2011
Business Development Division
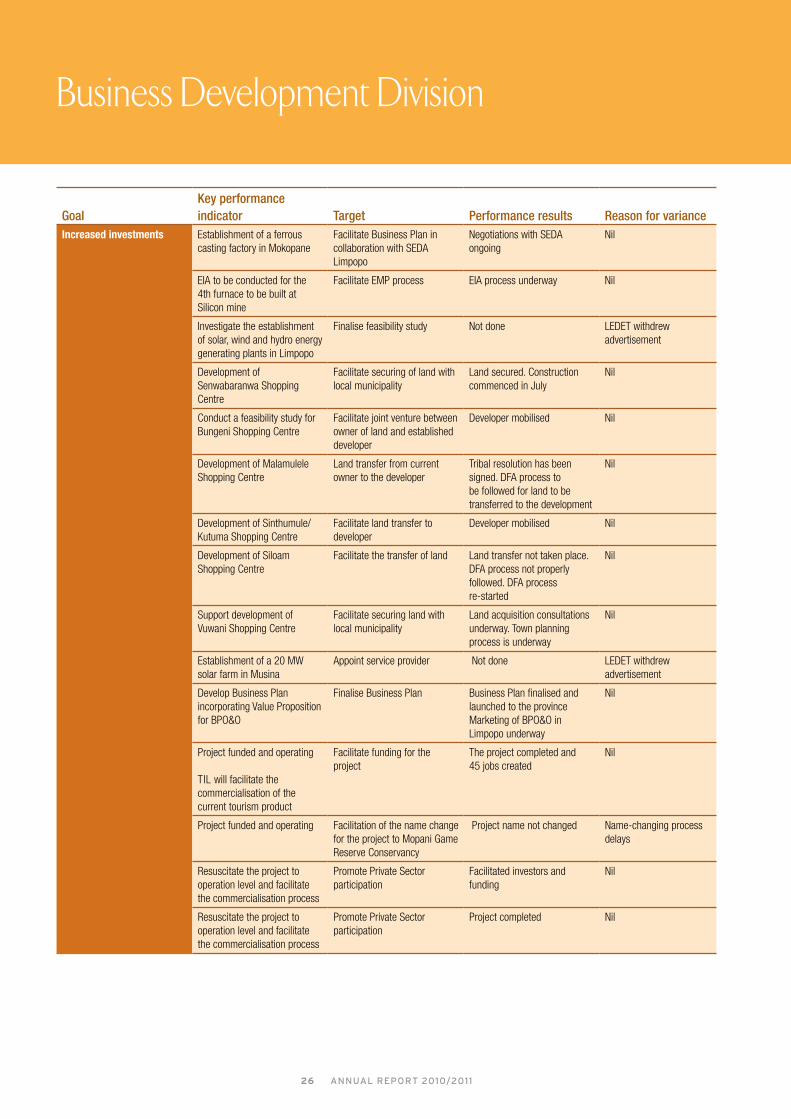
GoalKey performance indicator Target Performance results Reason for variance
Increased investments EstablishmentofaferrouscastingfactoryinMokopane
FacilitateBusinessPlanincollaborationwithSEDALimpopo
NegotiationswithSEDAongoing
Nil
EIAtobeconductedforthe4th furnacetobebuiltatSiliconmine
FacilitateEMPprocess EIAprocessunderway Nil
Investigatetheestablishmentofsolar,windandhydroenergygeneratingplantsinLimpopo
Finalisefeasibilitystudy Notdone LEDETwithdrewadvertisement
DevelopmentofSenwabaranwaShoppingCentre
Facilitatesecuringoflandwithlocalmunicipality
Landsecured.ConstructioncommencedinJuly
Nil
ConductafeasibilitystudyforBungeniShoppingCentre
Facilitatejointventurebetweenowneroflandandestablisheddeveloper
Developermobilised Nil
DevelopmentofMalamuleleShoppingCentre
Landtransferfromcurrentownertothedeveloper
Tribalresolutionhasbeensigned.DFAprocesstobefollowedforlandtobetransferredtothedevelopment
Nil
DevelopmentofSinthumule/KutumaShoppingCentre
Facilitatelandtransfertodeveloper
Developermobilised Nil
DevelopmentofSiloamShoppingCentre
Facilitatethetransferofland Landtransfernottakenplace.DFAprocessnotproperlyfollowed.DFAprocessre-started
Nil
SupportdevelopmentofVuwaniShoppingCentre
Facilitatesecuringlandwithlocalmunicipality
Landacquisitionconsultationsunderway.Townplanningprocessisunderway
Nil
Establishmentofa20MWsolarfarminMusina
Appointserviceprovider Notdone LEDETwithdrewadvertisement
DevelopBusinessPlanincorporatingValuePropositionforBPO&O
FinaliseBusinessPlan BusinessPlanfinalisedandlaunchedtotheprovinceMarketingofBPO&OinLimpopounderway
Nil
Projectfundedandoperating
TILwillfacilitatethecommercialisationofthecurrenttourismproduct
Facilitatefundingfortheproject
Theprojectcompletedand45 jobscreated
Nil
Projectfundedandoperating FacilitationofthenamechangefortheprojecttoMopaniGameReserveConservancy
Projectnamenotchanged Name-changingprocessdelays
Resuscitatetheprojecttooperationlevelandfacilitatethecommercialisationprocess
PromotePrivateSectorparticipation
Facilitatedinvestorsandfunding
Nil
Resuscitatetheprojecttooperationlevelandfacilitatethecommercialisationprocess
PromotePrivateSectorparticipation
Projectcompleted Nil

ANNUAL REPORT 2010/2011 27
Business Development Division
GoalKey performance indicator Target Performance results Reason for variance
Increased investments Projectfundedandoperating
TILwillfacilitatetheproductdefinitionandfunding
PromotePrivateSectorparticipation
Facilitatefundingfortheproject
InvolvedTEPintheprojectfor training
Nil
Interesttodeveloptourisminthecommunity
Assistedwithprojectawareness
Advertisedforaserviceprovidertodotheprojectawareness
Nil

28 ANNUAL REPORT 2010/2011
The International Operations Division is responsible for contributing to economic growth that is capable of establishing long-term, sustainable jobs, reducing poverty, and creating a better life for the people of Limpopo.
The Division implements a two-pronged strategy: Investment Promotion and Export-Trade Promotion.
The Investment Promotion Division consists of a European Union Desk, an Asia Desk, an Africa and Middle East Desk, and an Americas Desk.
The Export-Trade Promotion Division consists of one desk that services the export needs of Limpopo. The Division has identified key strategic areas in which it facilitates the attracting of inward domestic and foreign direct investment, and promotes value-added export products.The areas are:
• Strategic Alliances/Smart Partnerships;
• Regional Economic Integration; and
• Operation Follow-up.
The Trade and Investment Promotion Division bases its operations on the Limpopo Employment Growth and Development Plan. It targets foreign markets through extensive research and promotes trade and investment in the following sectors, which have been identified as being key to the creation of long-term, sustainable jobs in Limpopo:
• Coal Mining and Petro-chemicals;
• Agri-processing;
• Tourism;
• Information and Communications Technology; and
• Business Processing and Outsourcing.
The Division participated in numerous foreign missions to attract investment to Limpopo, hosted missions that visited the province, and promoted trade across a broad front during the year under review.
Regional cooperation
Outward missionsUnited Republic of Tanzania: 27 June – 7 July 2010
The mission attended the Dar es Salaam International Trade Fair (SabaSaba Show), and sought to facilitate
International Operations Division

ANNUAL REPORT 2010/2011 29
strategic alliances with counterparts in Tanzania, including the Tanzania Investment Centre, Tea Blenders of Tanzania, East Africa Business Council, Export Processing Authority of Tanzania, and Zanzibar Investment Promotion Agency.
Swaziland: 25 August – 7 September 2010
The mission attended the Swaziland International Trade Fair in Manzini, serviced the Memorandum of Understanding (MoU) between TIL and the Swaziland Investment Promotion Agency, and facilitated business-to-business meetings, particularly in agri-processing.
Swaziland marula processors, Swazi Secrets, expressed interest in partnerships with Limpopo counterparts. The mission met with the Swaziland Sugar Association to address the interests of Limpopo businesses wishing to buy sugar from Swaziland.
Zimbabwe: 20 – 25 September 2010
The mission finalised the signing of a MoU between Northern Province Investment Initiative t/a Trade and Investment Limpopo (TIL) and the Zimbabwe Investment Authority (ZIA), and discussed benchmarking between Zimbabwe and Limpopo in platinum mining and agri-business.
Inward missionsMozambique: 17 – 19 May 2010
The Mozambique High Commissioner in South Africa, Mr Dikgang Moopeloa, visited Limpopo to investigate projects in agriculture, mining and tourism focused on Phalaborwa, Tzaneen, Capricorn and Lephalale municipalities.
Kenya: 22 – 25 May 2010
The High Commission of Kenya in South Africa and the Kenya Investment Authority visited Limpopo to strengthen relations and finalise a draft Cooperation Agreement between TIL and KenInvest.
Mozambique: 11 – 12 August 2010
A business mission from Maputo visited Limpopo to look at benchmarking the abattoir industry in the province and to present an investment opportunity in Maputo for stakeholders in the Limpopo meat industry.
World CupConsistent with its mandate to build relationships with Limpopo’s Southern African Development Community (SADC) neighbours, TIL participated in the launch in May 2010 of the African Cultural Village established in Polokwane as a World Cup initiative. The cultural village included depictions of cultural life in the SADC region.
Asia Desk
Outward missionsJapan: 9 – 30 April 2010
This mission was undertaken under the auspices of the United Nations Industrial Development Organisation, Investment and Technology Promotion Tokyo Office (UNIDO ITPO). The aim was to investigate how to capacitate Limpopo to penetrate the Japanese market in agri-processing, mining and tourism. The mission emerged with several leads from Japanese companies, including:
• Mitsubishi Corporation which wants to investigate possible investment in the MALT (Mango Orange Litchi & Tomato) processing project in Hoedspruit, Limpopo. Information for a feasibility study is being exchanged between the TIL Business Development Division and Mitsubishi Corporation Johannesburg office;
• Kusakuen Green Tea which wants to explore investment in Limpopo;
• A-Wing International which is looking to invest in generating renewable energy in Limpopo, focusing on wind power. The interest is being followed up through the Central Energy Fund’s South African National Energy Research Institute;
• NID DAF Japan, the biggest importer of macadamia nuts in Japan, which has identified Limpopo as the biggest exporter of macadamias after Australia; and
• Co-Road, Lead-Off Japan, Jun Trading and Eiko Boiki which are interested in importing dried fruits from Limpopo.
China: August, 2010
As part of its participation in the China-South Africa celebrations in Shanghai, TIL co-hosted with the Department of Trade and Industry a seminar on trade and investment opportunities in Limpopo’s agriculture sector. TIL also met with the Shanghai Investment and Trade Development Board and Invest in Shanghai which are willing to enter strategic partnerships with the Limpopo and North West provinces.
China: 14 – 20 November 2010
TIL accompanied the MEC for Economic Development, Environment and Tourism, Mr Pitsi Moloto, to the annual Mining Congress in Beijing and discussed investment opportunities for Chinese companies in mineral exploration
in Limpopo.
International Operations Division
30 ANNUAL REPORT 2010/2011
International Operations Division
Japan: 17 – 25 March 2011
This mission followed up on TIL’s visit to Japan in April 2010. It was again undertaken under the auspices of UNIDO ITPO and was combined with TIL’s participation in the Foodex Japan 2011 exhibition. Contacts made and prospects that emerged during the mission include:
• A follow-up meeting with Kusakuen Green Tea Estate, which is keen to invest in green tea technology expansion in South Africa. This could take place in partnership with Limpopo’s Tshivhase Tea Estate, Mukumbani Tea Estate and the resuscitated Magoebaskloof Tea Estate; KwaZulu-Natal’s Ntingwe Tea Estate; and the Eastern Cape’s Magwa and Majola tea estates;
• Prospects of two twinning agreements with Limpopo province, one with Chizuoka Prefecture, a major green tea production province and home to Kawasaki Motorcycle, the other with Yamanashi Prefecture, where the Hiko Mizonu Private Jewellery Design School is located;
• Interest from Tama Art University in Japan to explore textile manufacturing from banana fibre waste in Limpopo; and
• KomaiHaltec Co., which is looking for opportunities to invest in renewable energy. TIL is following up with the Central Energy Fund in South Africa on Japanese interest in renewable energy investment.
Indonesia: 4 – 12 May 2011
This mission elicited interest in buying fresh produce from Limpopo and in investment in the province’s agriculture sector.
Inward missionChina: 27 October 2010
TIL hosted a mission from China with the Office of the Premier for China Coal and Technology Group (CCTEG), focusing on coal prospects in Limpopo and benchmarking with Exxaro’s Grootegeluk Coal Mine in Lephalale.
European Union Desk
Outward missionsNetherlands, France and Russia
Among achievements during this mission, TIL signed a Memorandum of Understanding (MoU) with PUM, an organisation of senior experts in the Netherlands who contribute to small business development in developing nations. TIL also negotiated the terms of a MoU with Enterprise Rhone-Alpes International, the business development council of this French region with which TIL hopes to establish a strategic partnership based on economic cooperation.
TIL’s longstanding association with the Southern African-Netherlands Chamber of Commerce (SANEC) was formalised with the signing by the two organisations of a Service Level Agreement. In terms of the agreement, SANEC undertakes to facilitate TIL activities in the Netherlands and to send at least two business missions from the Netherlands to Limpopo each year.
TIL held trade and investment promotion seminars in the Netherlands and Russia, and participated in the renowned SIAL food exhibition in Paris. Business meetings held by TIL resulted in investment leads in pectin manufacturing based on citrus waste from the MALT citrus processing project in Limpopo, as well as a “green” coal technology-based mini power station and a bamboo construction venture, both of which could be developed in partnership with Limpopo companies.
Inward missionsTIL’s missions to Europe generated visits to Limpopo, including a Russian buying mission.
TIL also hosted a Netherlands mission led by Yente, a foundation that puts Dutch women entrepreneurs in touch with counterparts in developing countries and provides a forum for them to share insights and tips on running their businesses. Some 15 women from Yente networked with Limpopo counterparts.
TIL has registered as a member on the Yente Network with the intention of establishing a more formal relationship with the organisation. TIL is investigating the possibility of hosting a workshop with Yente on deal structuring and negotiating principles for women entrepreneurs in the mining sector. This would be particularly valuable for Limpopo entrepreneurs who are new to this sector and therefore need assistance in a tough industry, especially when they are negotiating joint partnerships.
Northern Province Investment Initiative t/a Trade and Investment Limpopo (TIL) has identified 10 new emerging exporters who are undergoing training.

ANNUAL REPORT 2010/2011 31
International Operations Division
TIL also hosted a Spanish company which looked into setting up a yoghurt processing plant in South Africa. Delegates were taken on a tour of fruit processors and met with four Limpopo companies. TIL will also be part of a team that will host the Spanish Tourism Hunting Association, which proposes to sign a MoU with the Professional Hunters’ Association of South Africa.
As part of preparations to host the 2010 Soccer World Cup, TIL held a seminar in Johannesburg with a delegation from the Netherlands. Contacts were made especially in the safety and security, and corporate social responsibility sectors in tourism.
Trade promotions
Export developmentTIL made excellent progress in its relationship with the Dutch business development organisation PUM. The organisation provided training to five Limpopo companies: Limpopo Ceramics, Limburg farming, APOL, Thohoyandou Peanut Butter and Valley Farms. The companies were able to increase their profit margins and contribute to job creation. Limburg was enabled to secure funding from government and also created 33 jobs as a result of the intervention of PUM.
The organisation conducted an export development workshop attended by 20 Limpopo companies. In addition, 27 exporters and emerging exporters have been interviewed and profiled through the assistance of PUM. TIL also assisted seven companies to apply for PUM assistance service. Of the seven applications that have been approved, five businesses have received training and two will be trained in the 2011/12 financial year.
Belgium Ex-change also conducted an export development workshop attended by 33 companies who underwent business assessments on their export readiness.
Japanese importers visited Limpopo in August 2010 and met with 30 emerging exporters in Tzaneen. The exporters were given training on the requirements of Japan’s edible products markets.
TIL undertook export development training for 150 companies in Capricorn, Mopani and Vhembe districts. A further 100 emerging exporters in the agriculture and arts and crafts sectors received training during the year under review. In addition, 16 craft sector emerging exporters were trained and attended workshops
organised for them during the South African Handmade
Collections exhibition.
TIL has identified 10 new emerging exporters who are
undergoing training. These are Thohoyandou Cooperative,
Mzala Creations, Moradu Farming, Village Beads, Ravele
Farms, Audie Drilling Company, Louis de Wet Boerdery,
Mariveni Farms, Musa Grace Trading, and Green Nut
Company.
Export promotionsTIL facilitated participation of Limpopo companies in
13 exhibitions. They were:
• South African Handmade Collection in Johannesburg
and Cape Town, and Ambiente, which focused on arts
and crafts;
• Africa’s Big Seven, SIAL France, Fruit Logistica, Gulf
Food, Singapore Food and Foodex, focused on
agriculture;
• Tanzania International Fair, Zimbabwe International
Trade Fair and Swaziland International Trade Fair, which
targeted multi-sectors; and`
• Shanghai Expo 2010, a national mandated show of the
Department of International Relations and Cooperation.
Inward buying missionsTIL facilitated four missions:
A Netherlands delegation met with three Limpopo citrus
growers in the Hoedspruit and Letsitele areas with a view
to importing fruit.
A Spanish delegation investigated the possibility of buying
Limpopo-processed fruits for their yoghurt-processing
plant in Johannesburg.
Russian buyers met with several Limpopo companies
with a view to sourcing products.
A Japanese buyer investigated the potential to increase
imports from a macadamia company in the Levubu area.
Export statisticsCompanies assisted and supported by TIL during the year
under review recorded exports of approximately
R106 million, based on a sample of four assisted
companies. These exports were generated mainly by
the agriculture and agri-processing sectors. The arts
and crafts sector made a modest contribution to exports
but this was nevertheless a considerable achievement,
given its struggle to position itself in highly competitive
international markets.

32 ANNUAL REPORT 2010/2011
International Operations Division
Job creationThrough export facilitation, export development and trade promotions, 187 jobs have been created. Valley Farms created 102, Limburg farming 33, Devine Inspiration 49, and Hassa Craft and Limpopo Ceramics three each.
Stakeholder management
• A new relationship with Belgium Exchange under the UNIZO programme has been started, enabling Limpopo companies to receive assistance in export development. UNIZO is the largest Flemish organisation for self-employed entrepreneurs.
• Limpopo has been strategically favourably positioned in trade promotion activities. The TIL Trade Desk has continued to build and strengthen relationships with such stakeholders as the Department of Trade and Industry (dti), the Limpopo Business Support Agency and the Small Enterprise Development Agency.
• A growing number of Limpopo exporters are being selected under dti’s Export Marketing and Investment Assistance Scheme to participate in international exhibitions. During 2010, Limpopo was represented in the following shows: Shanghai Expo 2010, in which seven Limpopo companies participated; Singapore Show (one); Japanese Show (one); SIAL France (five); Gulf Food (three); and Ambiente (three).
• A relationship with the Department of International Relations and Cooperation was formed and strengthened during preparation meetings for the Shanghai Expo 2010.
• The relationship built with the National Agricultural Marketing Council has resulted in a Limpopo farmer being nominated to attend a quality management course in Cape Town.
• The relationship with the Dutch organisation PUM has strengthened. During the financial year, five companies received assistance from PUM. Through these interventions, more jobs are created and emerging exporters are increasing their profit margins.
• A partnership has been formed with the Japan External Trade Organisation (JETRO). A Japanese buying mission to Limpopo was funded by JETRO, which also funded participation by Limpopo companies in Foodex 2011.
• South African International Business Linkages (SAIBL), which aims to link black enterprises to domestic and international markets, approved Limpopo companies for entry to its development programme. Four companies have participated in a SAIBL workshop.
• Other relationships have been successfully managed with the Swaziland Investment Promotion Agency, ZIA, ZimTrade,the Association for Business in Zimbabwe, and the Zimbabwe Chamber of Commerce.
• As a full member of the World Association of Investment Promotion Agencies, TIL participated in the organisation’s Annual General Meeting and Trade and Investment Conference in Argentina. TIL came away with a number of leads on investment and trade.
GoalKey performance indicator Target Performance results Reason for variance
Increased investments Focus:CoalminingandPetro-chemicals,Agro-processing,Tourism
Targetedmarkets:KuwaitandSaudiArabia
Expectedoutcome:seetargetsasperBusinessDevelopments’InvestmentProjects
PreparationsforoutwardinvestmentmissiontoKuwaitandSaudi Arabia
HostabusinessdelegationfromKuwaitandSaudiArabiaforsitevisits
Done
Notdone
Nil
TheRSAmissioninSaudiArabiaadvisedTILthattheywouldnotbeabletoassistwitharrangementsastheywereduetohostahigh-profilevisitwhichneededtheirfullattention
Companies assisted and supported by Northern Province Investment Initiative t/a Trade and Investment Limpopo (TIL) during the year under review recorded exports of approximately R106 million.

ANNUAL REPORT 2010/2011 33
International Operations Division
GoalKey performance indicator Target Performance results Reason for variance
Increased investments Focus:CoalminingandPetro-chemicals,Tourism,Agro-processing
Targetedmarkets:Russia,Ireland,Spain
Expectedoutcome:seetargetsasperBusinessDevelopments’InvestmentProjects
HostabusinessdelegationfromRussiaforsitevisits
ExecutethemissiontoIrelandandSpainandprepareforreciprocalvisits
Done
Done• Participatedinoutward
missiontoSpain;• HostedSpanishcompany
(Espaul),lookingintosettingupayoghurt-processingplant.Tookthedelegatesonatouroffruitprocessors
Nil
Nil
Focus:CoalminingandPetro-chemicals,ICT&BPOandTourism
Targetedmarkets:ChinaandKorea
Expectedoutcome:seetargetsasperBusinessDevelopments’InvestmentProjects
ExecutemissiontoChinaandKorea
HostabusinessdelegationfromChinaandKoreaforsitevisits
FollowuptotheJapanoutwardmissionandUNIDOITPOTokyoprogramme
Partiallydone(visitedonlyChina)
DoneDelegationfromChina,namely,ChinaCoalEngineeringandTechnologyGroup(CCETG)visitedearlierthanhadbeenplanned,tookthemtoLephalaleforcoal-relatedissues
Done
Limitedresourcesandbudgetconstraints
Nil
Nil
Grow Limpopo’s exports Focus:Artsandcrafts,Curio,JewelleryandAgro-processedproducts
Targetedinternationalplatforms:Foodex,Ambiente,FruitLogistica,Anuga,SIALFrance,SIALChina,AFL’ArtigianoinFeira,ZimbabweTradeExhibition
Targetednationalplatforms:AfricaBig7,Natural&Organic,SAHandmade,DesignIndaba
Train80newexporters
Preparationsandparticipationatthefollowingexhibitions:Foodex,Ambiente,FruitLogistica,SouthAfricanHandmadeCollections,DesignIndaba
Followupandarrangeforreciprocalinwardbuyingmissions
Capacitybuildingforatleast80newexporters
Done(AfricaBig7,SIALFrance,Foodex,Ambiente,FruitLogistica,SAHandmadeCollections,DesignIndaba,ZimTrade)
Notdone(Anuga,AFL’ArtigianoinFeira)
Notdone(SIALChina)
Done:InwardmissionsfromRussia,Japan,Belgium(Ex-Change),Belgium(Unizo)andNetherlands(PUM)
Done
Nil
Budgetaryconstraints
NoSIALChinain2010/11financialyear
Nil
Nil
Establishment of strategic alliances to grow Limpopo’s value-added exports
SignedMemorandumofUnderstandingorServiceLevelAgreementswithrealisticdeliverables(concreteprojects/programmes)
NegotiatewithTILcounterpartsinAfricatosignMoU/SLA
Partiallydone• MoUwithZimTradetobe
signedduringTIL’svisittoZimbabwedueApril-May2011
• MoUwithLNDCtobesignedduring1stquarterof2011
HadbeenrequestedbyTIL’scounterpart(ZimTrade)todefersigningtonextfinancialyear2011/12Budgetaryconstraints(re-prioritisation)

34 ANNUAL REPORT 2010/2011
At the beginning of 2010, the Office of the Premier initiated a mutually beneficial relationship between the Limpopo Provincial Government and International Business Machines (IBM), resulting in a number of parastatals participating in several IBM-initiated projects in the province.
One of the projects in which Northern Province Investment Initiative t/a Trade and Investment Limpopo (TIL) was involved related to institutional capacity building for developing, implementing and managing a Business Retention and Expansion (BR&E) Programme in Limpopo.
BR&E is an economic development strategy involving public-private-partnerships designed to assist businesses to retain and expand their operations in Limpopo by offering tailor-made solutions to their growth impediments. This strategy is aimed at supporting existing businesses to develop and expand in today’s highly competitive global environment.
Through the BR&E Programme, government would be able to identify businesses which are ready to expand and those which are at risk of closure, and formulate intervention strategies to assist them to survive and prosper. In addition, results of several recent studies have consistently demonstrated that between 60% and 80% of new jobs in a particular economy are created by growth of existing businesses. Further, it is easier, quicker and less expensive to save an existing job than to create a new one.
The success of the BR&E Programme requires a partnership across a wide spectrum of key role players, including municipalities, organised business, academia, multinational companies and government departments.
To this end, TIL has embarked on a rigorous stakeholder consultation process to solicit commitments to participate in the BR&E Programme and contribute towards successful implementation of institutional and operational frameworks developed by IBM consultants. This has resulted in the Division making presentations and leading or facilitating workshops involving district municipalities and their local municipalities.
The Division was also invited to make a presentation at the South African Local Government Association Limpopo conference in October 2010 as well as the Makhado Local
Investment Services Division

ANNUAL REPORT 2010/2011 35
Economic Development (LED) Summit in March 2011. Agreements were reached at these meetings to enable the Division to assist participating municipalities to include the BR&E Programme as a component of their LED strategies.
The Division will also seek to make a presentation on BR&E to mayoral and municipal forums with the view to establishing the Programme as a core component of job creation within broader service delivery contexts.
The BR&E Programme, if implemented successfully, can contribute immensely to retaining jobs and investments as well as creating new jobs through company expansion programmes. This will assist in meeting job creation targets envisaged in the Limpopo Employment, Growth and Development Programme and the New Growth Path.
Aftercare StrategyThe Division has completed the review of the three-year Aftercare Strategy which resulted in the development of an implementation plan for an expansion programme. Over 40 company visits were undertaken, resulting in identification of companies with expansion programmes and the services these enterprises would require from State departments and agencies.
The Division takes cognisance of the issues raised by these enterprises on an ongoing basis and, in some instances, cases are taken up with relevant authorities and State utility agencies with a view to providing solutions to identified problems. Over 70% of the issues raised by these companies have been resolved or attended to satisfactorily, resulting in retention of jobs and investments and possible new job creation.
2010 FIFA World CupTM
The Division represented TIL on the 2010 FIFA World Cup Provincial Inter-ministerial Committee, which drew participation across provincial government departments, parastatals, organised business and other stakeholders in Limpopo and beyond.
The committee’s mandate was to coordinate all preparatory work undertaken by participating member organisations and to oversee the implementation action plan for the World Cup.
In addition, TIL was mandated to showcase business and investment opportunities in Limpopo during the World Cup. TIL drew up a programme to enable prospective investors to attend networking sessions in which they
were able to exchange information on investment opportunities and related topics.
Through the relationship between TIL and the Southern African-Netherlands Chamber of Commerce, the Dutch team used a tourism facility in Limpopo as its base camp during the World Cup event.
The World Cup attracted visitors from the Southern African Development Community and other countries, subsequent to annual business seminars held in the three years preceding the 2010 event. These drew participation of investment promotion agencies and business communities from Botswana, Zimbabwe, Mozambique and Swaziland.
Freight logisticsThe Division continues to make efforts to resolve freight logistics and related problems confronting Limpopo companies, by means of annual needs analysis surveys of companies, company visits and meetings with organised business.
During the year under review, the five freight logistics related problems identified during the needs analysis survey were resolved.
The Division continued to participate in a number of freight logistics initiatives to reduce costs of doing business in Limpopo. The Division participated in Maputo Corridor Logistics Initiative (MCLI), National Transport Masterplan and monthly National Transport Forum meetings. These initiatives create platforms for all spheres of government, State enterprises and a host of other stakeholders to engage with one another with a view to finding solutions to freight logistics problems which impact on the ability to conduct business in the country. These range from rail and road freight to aviation, pipelines and bulk commodity terminals at ports.
The Division participated in the provincial task team mandated to provide the Limpopo Provincial Government’s contribution towards finalising the National Transport Master Plan, which has since been completed. The Division also participated in the MCLI annual conference.
Municipal study and exposure toursDuring the period under review, the Division conducted desk-top research into resource endowment-based compatibility between Limpopo municipalities and foreign counterparts. A municipal industry tour and an exposure proposal document has been completed.
Investment Services Division

36 ANNUAL REPORT 2010/2011
GoalKey performance indicator Target Performance results Reason for variance
Increased investments ReviewInvestmentAftercareStrategy
Undertakecompanyaftercareandneedsvisitations
Sharingofthestrategywithindustryandotherstakeholders
Compileaprofileofthesecompanies
Conduct10companyaftercarevisitations
Continuousupdateoftheexpansionprogramme
Done
AftercareStrategycompletedanddistributedtorelevantparties
Thereisnovariance
Increased investments and grow exports
ProvidetechnicalsupporttoLimpopoFreightLogisticsForum(LFLF)
ContinuousparticipationinLFLF
Done Thereisnovariance
Increased investments Participatein2010ProvincialInter-ministerialCommittee
Ongoingparticipationin2010ProvincialInter-ministerialCommitteemeeting
Done
TheDivisionfulfilledthemandatefromtheProvincialInter-ministerialCommittee.NofurthermandatewasgiventoTILafterthehostingofthe2010FIFAWorldCupgames
Thereisnovariance
Increased investments and grow exports
Continuoussupporttoinvestorsonutilityissues
Continuoussupporttoinvestorsonissuesofwater, landandenergy
Done
Attendedtoallutilityproblemsraisedbycompaniesduringtheaftercarevisits
Thereisnovariance
Investment Services Division

ANNUAL REPORT 2010/2011 37
Marketing and Communications Division
The Marketing and Communications Division provides ongoing public relations and brand promotion support to various Northern Province Investment Initiative t/a Trade and Investment Limpopo (TIL) programmes and activities. The Division plays a key role in ensuring that the work carried out by TIL is effectively communicated to internal and external stakeholder groups.
Key focus areasIn line with marketing and communications as a
professional discipline, the Division focuses on the
following programmes and sub-programmes:
Sub-programme 5.1 Corporate Marketing
This sub-programme entails activities and projects
aimed at developing and promoting TIL’s corporate
brand, as well as achievements in the discharging of the
organisation’s mandate. The programme includes sub-
programmes such as advertising, strategic marketing
events and exhibitions, branding as well as management
of the Corporate Social Investment (CSI) programme.
Sub-programme 5.2 Corporate Communications
This sub-programme focuses on communicating the
TIL mandate to a cross-section of stakeholders,
including media, government departments, corporate
companies as well as investors. Also included in the
programme is special focus to profiling work done by
the Office of the Premier, the Department of Economic
Development, Environment and Tourism, and TIL’s work
in relation to other provincial economic development
sister agencies. Sub-programmes under this programme
include media and publishing partnerships, development
of ICT infrastructure, publications and website
management.
Sub-programme 5.3 Stakeholder and Channel Management
The above interchangeable programmes are concerned
with enabling TIL to participate at reputable internationally
recognised trade and investment forums and platforms.

38 ANNUAL REPORT 2010/2011
Marketing and Communications Division
It includes the Johannesburg Office, interactions with provincial and national chambers of business, as well as members of the diplomatic community.
Programme highlights for the year under review included:
Marketing and Communications Strategy review The industry standard for Marketing and Communications Strategy lifespan is three years. The TIL Marketing and Communications Strategy was developed in 2006, and is therefore dated. The three-yearly review is necessitated by, among other factors:
• Changing economic sector priorities in mainstream commerce;
• Changes in national government policies in relation to global trade patterns;
• Evolution of the organisational/stakeholder strategic plans;
• Shifts in media and technological industries; and
• Nature of collaborative programmes between TIL and other IPAs.
Revision and implementation of the new strategy will greatly assist the organisation in:
• Taking advantage of mass media platforms and corporate business focused social networking sites;
• Identification of cost-effective ways of achieving internal and external communications while simultaneously aligning TIL messages with leading industry trends and the post-merger communications environment; and
• Consultations with TIL divisions and industry specialists in the field of marketing and communications.
TIL Johannesburg Office The Office has been moved from Wierda Valley to Sandton Office Towers, and is therefore situated in a prime location of the Sandton central business district. Most trade and investment aligned institutions and role players across the economic spectrum are either headquartered or represented in Sandton. The immediate radius boasts media and business-to-business support services that ensure sustained high-density business traffic in the area. The office is best positioned to:
• Serve as a Marketing and Communications satellite or support office for the Chief Executive and his Board of Directors;
• Serve as a host venue for TIL programmes and activities in Gauteng; and
• Function as a media, communications and stakeholder management nerve centre for investors and the wider business community.
TIL BDFM corporate reportA corporate report was published in accordance with TIL’s Memorandum of Understanding with BDFM to produce specialist content/analysis of provincial economic activity. The publication focused on Limpopo’s unique selling points with regard to trade and investment; including but not limited to the province’s energy security and sufficiency, moves to develop a liquid fuels industry.
Advertising and Media RelationsThe division profiled provincial government pronouncements on the Limpopo Employment Growth and Development Plan (LEGDP) through interviews with Premier Mathale and Economic Development, Environment and Tourism MEC, Honourable Pitsi Moloto. Targeted media engagements were aimed at introducing Motalane Monakedi as incoming TIL Chief Executive to the trade and investment fraternity. Interviews and CEO profiles were secured in the Financial Mail, BBQ and CEO magazines, and various networking platforms such as the Premiers’ Gala Dinner. Adverts profiling TIL services were also placed in Leadership, Opportunity and Equinox magazines.

ANNUAL REPORT 2010/2011 39
Marketing and Communications Division
Top and bottom: Premier Mathale at the Premiers’ Gala Dinner

40 ANNUAL REPORT 2010/2011
Marketing and Communications Division
GoalKey performance indicator Target Performance results Reason for variance
Sub-programme 1: Corporate Marketing
Increased investment Strategic/Smartpartnerships
DevelopcorporatebrandforTIL/ManageCorporateSocialInvestmentprogramme
Effectivemarketingplatformsandevents
TILcorporateimageenhanced
• Participatedinexhibitionsatstrategicprovincialevents,suchastheMapungubweCulturalFestival,MarulaFestival&BathoPeleday
• HostedasuccessfulopeningoftheProvincialLegislaturePremierGalaEvent&GolfDay,whichprovidedanetworkingenvironmentforbothbusinessandGovernment
• SupportedGovernmentpriorityineducationbyawardingthreeschoolswithfinancialsupport
Nil
Nil
Sub-programme 2: Corporate Communications
Increased investment Growprofileofinternal/externalcommunicationsthroughspecificprojects
Participateincommunicationsandbrandingforums
Engagetopfivemediacompanies
Well-maintainedTILwebsite
SoundrelationshipwithIMC,ProudlySouthAfrican,etc.
TILcorporatereportpublishedinhigh-profilemediahouse
• Thewebsitemaintenanceisaworkinprogress
• TILphotographiclibrarynotdesigned
• Thesectorbrochureswerenotprinted
• TheAnnualReportwasproducedanddistributedontime
• Participatedinallthemeetingsoftheforums
• TILcorporatereportwaspublishedintheFinancialMail
• ThedevelopmentofeditorialcalendarandcommissioningofmarketingcampaignsforSouthernAfricantradeandinvestmentactivitywasnotachieved
Serviceproviderdeviatedfromtheservicelevelagreement.TwoissueswerehoweverproducedThelibraryisdependentonthewebsiteTheservicesofagraphicdesignercouldnotbeprocuredduetotheabsenceofSupplyChainStaffNilNilNilAusteritymeasuresforcross-borderactivitiesledtotheabandonmentofthisproject
Sub-programme 3: Channel Management
Increased investment ImplementationofChannelManagement
Soundrelationshipswithstakeholders
• ParticipatedinChambersofBusinessnetworksessionsofPolokwane,Lephalale,Tzaneen,Makhado,Bela-BelaandPhalaborwa
• ParticipatedinSANECJCCIprogrammes
• PlayedacrucialroleintheactivitiesoftheannualAfrica/AsiaSocietySeminar
Nil

ANNUAL REPORT 2010/2011 41
The primary aim of this Division is to ensure that all activities of Northern Province Investment t/a Trade and Investment Limpopo (TIL) are executed within a framework of sound controls and the highest standards of corporate governance and that efficient and effective service is delivered to the organisation with regard to finances and all aspects of corporate services.
Improving corporate governance and efficiency in service delivery are key requirements for public entities. Currently corporate services are not appropriately capacitated or geared to service core business and deliver on their mandate. If this is not prioritised and addressed, any service delivery improvement plans being implemented by management in addressing deficiencies to effectively implement policies, enforce compliance and ensure that internal controls are not compromised will be jeopardised.
Finance and AdministrationThe Finance department is responsible for effective preparation and implementation of a financial plan and budget for the organisation and the judicious application and control of public funds. These include ensuring that accurate financial records are kept and that financial procedures and controls are being adhered to for proper, effective and efficient use and accountability of resources as required by the Public Service Act, 1994 and the Public Finance Management Act, 1999 (Act 1 of 1999) (PFMA).
AchievementsOur achievements this year included:
• Developing and updating a risk register and risk management plan;
• Developing a fraud prevention and detection plan;
• Developing, reviewing and implementing effective financial policies, systems and processes;
• Completion of Corporate Services’ three-year Business Plan (2011-2014);
• Completion of Corporate Services’ 2011/12 Annual Performance Plan and Budget;
• Conducting internal audits and implementation of recommendations thereof; and
• Payroll administration and tax year run.
Corporate Services Division

42 ANNUAL REPORT 2010/2011
Finance
Looking aheadKey focus areas for the new reporting year will include the following:
• Keeping 100% accurate accounting records;
• Developing and implementing effective financial policies, systems and processes to support the core business and contributing to efficient, timeous and targeted service delivery and monitoring;
• Streamlining and eliminating all manual processes, upgrading existing accounting system and facilitating configuration of existing applications to interface with the accounting system;
• Proper coordination of month-end and quarterly reports and financial year-end with clear documented completion guidelines and in compliance with the PFMA, Treasury Regulations, GRAAP and Accounting Standards;
• Ensuring that good governance is practised throughout the TIL financial and administration processes;
• Implementing budgetary process in compliance with the PFMA; and
• Safeguarding company assets.
Administration
Looking aheadKey focus areas for the new reporting year will include the following:
• Developing, reviewing, updating and implementing administration policies and processes to ensure alignment to all applicable regulations;
• Maintaining effective registry processes and a proper filing system;
• Conducting an annual health and safety compliance audit;
• Effectively managing Service Level Agreements in respect of operating leases, maintenance contracts and other outsourced administration services;
• Maintaining an effective security system and internal controls to safeguard company assets; and
• Developing and maintaining a loss register.
Supply Chain ManagementSupply Chain Management is an integral part of financial management. This function is the collaborative strategy that integrates the planning, procurement and provisioning processes in order to eliminate non-value-adding cost infrastructure, time and activities, whilst at the same time addressing government’s preferential procurement policy objectives and serving the end-users and customers efficiently.
AchievementsEven though we faced critical challenges during the reporting year in terms of service delivery due to capacity challenges, we managed many achievements, including the following:
• Development of accredited supplier database;
• Providing uninterrupted flow of goods/services within the legal framework – Preferential Procurement Policy Framework, 2000 (Act 5 of 2000) (PPPFA) and Black Economic Empowerment (BEE);
• Providing administrative support services and professional secretariat services to the Bid Committees;
• Ensuring that good governance is practised throughout the TIL supply chain processes;
• Ensuring that the resources required to support the strategic objectives and satisfaction of needs are delivered;
• Appointment of internal auditors; and
• Conducting SCM training which was attended by 80% of staff members and was very successful.
Looking aheadKey focus areas for the new reporting year will include the following:
• Developing, reviewing, updating and implementing supply chain policies and processes to ensure alignment to all applicable regulations;
• Eliminating manual processes by sourcing, procuring and implementing a web-enabled purchase order system;
• Matching purchase to purpose in order to reduce wasteful and fruitless expenditure;
• Implementing PPPFA and BEE policy in the selection of service providers;
• Designing strategies, processes and methods to implement and promote BEE and for HDI development; and
Corporate Services Division

ANNUAL REPORT 2010/2011 43
Corporate Services Division
• Enhancing systems for integrated planning and implementation and developing an effective reporting framework for all stakeholders in compliance with the PFMA and applicable regulations.
Information Technology (IT)The primary aim of IT is to provide an integrated support service with regard to Information Technology and Systems with a special focus on IT infrastructure and architectural development, which enables the organisation to deliver on its organisational objectives.
AchievementsOur achievements this year included:
• Successfully implemented VPN access for users;
• Effectively streamlined the Help Desk system, which increased the efficiency of service delivery within TIL;
• Continuously reviewing and enforcing IT security, backup and compliance systems; and
• Continuing to provide a secure and stable network infrastructure.
Looking aheadIn the new reporting year, the IT department will assist with the implementation of the planned financial, procurement and asset systems to increase efficiency within these departments. Other deliverables include the following:
• Ensuring sound IT/IS Governance (Compliance, Security, Backup and Disaster recovery);
• Providing a reliable and appropriate technology foundation that supports TIL’s current and future IS/IT needs;
• Developing and implementing a disaster recovery plan and policy;
• Effectively managing IT outsourced service in terms of the Service Level Agreement;
• Developing and implementing a replacement cycle plan and a disposal plan for IT equipment; and
• Replacing old hardware and software and phasing over a four-year period.
Human ResourcesHuman Resource Management is responsible for developing a culture that utilises human potential by creating an enabling environment for people development through strategic corporate initiatives that focus on coaching and mentoring, ongoing performance
management and proactive workforce practices, such as succession planning, recruitment and selection and sound employee relations.
Objectives
In the 2010/11 reporting year, the strategic objectives of the Human Resources department were:
• To ensure compliance with all the relevant legislative frameworks;
• To continuously review human resources policies and systems and ensure the implementation and monitoring thereof;
• To fully implement a performance management system;
• To conduct a skills audit, identify skills gaps and provide the necessary training to staff;
• To facilitate internship programmes; and
• To conduct job evaluation.
AchievementsDue to capacity challenges in the Human Resources department some of the 2010/11 objectives were not achieved:
• Some key and critical positions were filled during the year;
• As part of the training and development programme study loans were granted to those staff members who needed to pursue their studies; and
• The service provider to conduct job evaluation, a skills audit and implement performance management system was appointed.

44 ANNUAL REPORT 2010/2011
Corporate Services Division
Looking aheadCapacity challenges continue to be a problem in TIL. Key focus areas for the new reporting year will include some of the following:
• Filling of key and critical positions in the organisation;
• Developing, reviewing, updating and implementing human resources policies and processes to ensure alignment to all applicable regulations;
• Conducting the job evaluation process and implementing recommendations thereof;
• Conducting a skills audit and developing and implementing a skills development and training plan;
• Developing and implementing a retention, succession and talent management plan;
• Developing and implementing a Performance Management System; and
• Developing and implementing a mentorship programme and knowledge management plan.
TIL employment equity statistics as at 31 March 2011
Male FemaleOccupational level African Coloured Indian White Total African Coloured Indian White Total Total
Top Management 6 – – – 6 2 – – – 2 8Middle Management 4 – 1 – 5 3 – – – 3 8Professionals 2 – – – 2 8 – – 1 9 11Admin and Support Staff – – – – – 7 – – – 7 7General Staff 3 – – – 3 3 – – – 3 6
Total 15 – 1 – 16 23 – – 1 24 40
Resignations during 2010/11
Male FemaleOccupational level African Coloured Indian White Total African Coloured Indian White Total Total
Top Management 1 – – – 1 – – – – – 1Middle Management 1 – – 1 2 – – – – – 2Professionals 1 – – – 1 – – – 1 1 2Admin and Support Staff – – – – – – – – – – –General Staff 1 – – – 1 – – – – – 1
Total 4 – – 1 5 – – – 1 1 6

ANNUAL REPORT 2010/2011 45
Corporate Services Division
GoalKey performance indicator Target Performance results Reason for variance
Sub-programme 1: Corporate Finance
100% compliance with the relevant legislative and regulatory framework
Unqualifiedauditreport
Proactivemanagementandcontrolofriskareas
Disasterrecoveryplananddocumentmanagementsystem
Externalaudit
Monthlyfinancialstatements
Updatefraudpreventionplan
Updatedisasterrecoveryplans
Continuousimplementationandmonitoring
Internalaudit
Continuousimplementationandmonitoringofdocumentmanagementsystem
Externalauditcompleted
Monthlyfinancialstatementsandreconciliationsarebeingdone.Finalisationofthree-yearBusinessPlan(2011–2014)and2011/12AnnualPerformancePlanandBudget
Fraudpreventionplanupdated
Databackupsdoneonadailybasis
Riskregisterhasbeenupdated
InternalauditorswereappointedinDecember2010
Internalauditsconductedaccordingtoapprovedinternalauditplan
Recommendationsbyinternalauditorsimplemented
Offsitedatabackupsaredoneonadailybasis
Accountantpositionvacant.Approvaltofillthepositionreceivedon25March2011fromLEDET,positionadvertisedinApril2011
Lateappointmentofinternalauditors
Sub-programme 2: Supply Chain Management
100% compliance with the relevant legislative and regulatory framework
CompliancewithTreasuryregulations
Updatedatabasewithadditionalsuppliers
Continuousimplementationandmonitoring
Advertforregistrationondatabasedone
StreamliningofsupplychainprocessesandimplementationofSCMpolicy ongoing
Supplierdatabaseisupdated onaregularbasis
Supplychainpositionvacant
ConductedSupplyChainManagementtrainingforallTILstaff;80%ofstaffattended
NoSCMcomponentfrom1March2011;incumbentresigned
Approvaltofillvacantpositiononlyreceivedon25March2011fromLEDET;positionadvertisedin April2011
46 ANNUAL REPORT 2010/2011
Corporate Services Division
GoalKey performance indicator Target Performance results Reason for variance
Sub-programme 3: Human Resource Development
100% compliance with the relevant legislative and regulatory framework
Compliancewithalltherelevantlegislativeframework
Performancemanagementsystems
Internshipprogrammes
Humanresourcesdevelopment
Continuousimplementationandmonitoringofpoliciesand systems
Year-endperformanceappraisals
Half-yearlyperformanceappraisals
Skillsauditreport
Stafftraining
Jobevaluation
Continuousimplementationandmonitoringofpoliciesand systems
Policiesnotyetreviewedand updated
Year-endperformanceappraisalsdone
Half-yearperformanceappraisalsdone
Performancemanagementsystemnotyetimplemented
Skillsauditnotdone
Keyskillsgapsareidentifiedonongoingbasis,andtrainingneedsidentifiedandtrainingprovidedaccordingly
Certainkeypositionsfilled
Internshipnotdone
Trainingprovidedcontinuously
OngoingdiscussionsbetweenManagementandUnion
ThereisnoHRcomponentwithintheorganisation.AwaitingapprovalfromLEDETforthecreationofanHR ManagerpositionHRactivitiesarebeingcarriedoutonanad hocbasis
Theserviceproviderwhowillconducttheskillsaudit,jobevaluation,jobgradingandinternshipprogrammewillbe appointedinthenewfinancialyear

47 ANNUAL REPORT 2010/2011
Annual Financial Statements for the year ended 31 March 2011
CONTENTS PAGEGeneral Information 48
Report of the Accounting Authority 49
General Financial Review 50
Statement on Corporate Governance 51
Accounting Authority’s Responsibilities and Approval 55
Report of the Board Audit Committee 56
Report of the Auditor-General 57
Statement of Financial Position 62
Statement of Financial Performance 63
Statement of Changes in Net Assets 64
Cash Flow Statement 65
Notes to the Annual Financial Statements 66
Thefollowingsupplementaryscheduledoesnotformpartofthefinancialstatementsandisunaudited:
Unaudited Detailed Statement of Financial Performance 89
Abbreviations 91
Corporate Information 92

48 ANNUAL REPORT 2010/2011
General Information
Countryofincorporationanddomicile South Africa
Natureofbusinessandprincipalactivities Investment and marketing activities
Auditors Auditor-General SA
Chartered Accountants (SA)
Registered Auditors
Secretary C Mokoma
Polokwane
Companyregistrationnumber 1997/007461/08

ANNUAL REPORT 2010/2011 49
Northern Province Investment Initiative t/a Trade and Investment Limpopo Annual Financial Statements for the year ended 31 March 2011
Report of the Accounting Authority
1. Reviewofactivities Mainbusinessandoperations The operating results and state of affairs of the company are fully set out in the attached financial statements and do not in
our opinion require any further comment.
The plan to merge LimDev, LIBSA, LADC and TIL is underway and the proposed commencement date is 1 April 2012.
2. Eventsafterthereportingperiod The directors are not aware of any matter or circumstances arising since the end of the financial year.
3. Authorisedandissuedsharecapital There were no changes in the authorised or issued share capital of the company during the year under review.
4. Dividends No dividends were declared or paid to shareholders during the year.
5. DirectorsThe directors of the company during the year and to the date of this report are as follows:N Matlala (appointed February 2010)V Mkhombo (appointed February 2010)M Maponya (resigned 23 March 2011)K Ramokgopa (lapsed 22 March 2011)NH Mkhumane (re-appointed 23 March 2011)PJ Malabela (re-appointed 23 March 2011)NH Mkhumane (re-appointed 23 March 2011)D Kourtoumbellides (re-appointed 23 March 2011)M Lekota (re-appointed 23 March 2011)MP Maleta (re-appointed 23 March 2011)HA Ngobeni (re-appointed 23 March 2011)M Maphutha (re-appointed 23 March 2011)MN Kgathi (re-appointed 23 March 2011)L Sennelo (appointed 28 April 2011)PJ Maduna (re-appointed 23 March 2011)RW Milne (re-appointed 23 March 2011)CM Setlhako (re-appointed 23 March 2011)
6. Secretary The secretary of the company is Ms Cathy Mokoma.
7. Holdingcompany The Enterprise’s parent entity is the Limpopo Department of Economic Development, Environment and Tourism.
8. Auditors Office of the Auditor-General South Africa will continue to be auditors of the entity.

50 ANNUAL REPORT 2010/2011
Northern Province Investment Initiative t/a Trade and Investment Limpopo Annual Financial Statements for the year ended 31 March 2011
General Financial Review
The Northern Province Investment Initiative t/a Trade and Investment Limpopo is a statutory organisation established in terms of the Northern Province Development Corporation Act, 1994 (Act 5 of 1994), primarily to make a contribution to economic growth and development, and job creation in the Province through Investment Promotion and Trade Promotion.
The fi nancial position of the business and activities of the Northern Province Investment Initiative t/a Trade and Investment Limpopo is clearly refl ected in the attached fi nancial statements. There was no change in the nature of the business.
In the current fi nancial year, the net defi cit for the year amounted to R6,2 million (2010: R6,7 million surplus), and cash and cash equivalents decreased from R13,4 million to R6,6 million. This defi cit is as a result of a reduction of R6 million in the government grant received in the 2010/11 fi nancial year.
The increase in operational costs is largely due to trade shows exhibitions costs, visiting delegation expenses, foreign and local promotional expenses, general facilitation expenses, employee benefi t costs, accounting authority costs and communication costs as shown on the detailed Income Statement of the Annual Financial Statements.
The short-term fi nancial position is reasonable, but in the medium and long term, the organisation’s ability to meet all of its mandates will be reliant on obtaining additional funding for core expenditure. Suffi cient funding for trade investment promotion and business development remains a problem. Management believes that the Northern Province Investment Initiative t/a Trade and Investment Limpopo has adequate resources in place to continue to operate for the year ahead, but at current levels of delivery.
MotalaneMonakediChief Executive Offi cer

ANNUAL REPORT 2010/2011 51
ComplianceNorthern Province Investment Initiative t/a Trade and Investment Limpopo (TIL) is listed as a schedule 3C public entity in the Public Finance Management Act, 1999 (Act 1 of 1999) and as such endorses the principles as set out in the Protocol on Corporate Governance, and where applicable, the King III Code on Corporate Governance and has endeavoured to comply with the principles incorporated in the Code of Corporate Practices and Conduct.
Northern Province Investment Initiative t/a Trade and Investment Limpopo has a formalised system of Corporate Governance as set out below.
Governing bodies
BoardofDirectorsNorthern Province Investment Initiative t/a Trade and Investment Limpopo has a unitary board structure that is made up of a majority of non-executive members who are appointed by the MEC for Economic Development, Environment and Tourism in Limpopo. The Board meets at least once a quarter.
The framework for the payment of directors’ remuneration is approved by the MEC for Economic Development,
Environment and Tourism in Limpopo. Directors of TIL
attend induction programmes which are organised by the
Executive.
The Board of Directors has appointed two sub-committees to assist in carrying out its responsibilities.In line with the Premier’s pronouncement a new single
Accounting Authority was appointed on 23 March 2011.
BoardcommitteesAll committees carry out responsibilities on behalf of the
Board and must appoint at least three Board members per
committee to give expertise on matters pertaining to that
committee’s mandate.
BoardAudit,FinanceandRiskManagement CommitteeThe Board Audit, Finance and Risk Management
Committee consists of non-executive Board members and
independent members. The chairperson is appointed by
the Board. The authority of the committee is detailed in a
charter which is reviewed and approved annually by the
Board. The committee’s duties include reviewing financial
reports and cash flow projections, overseeing financial
Statement on Corporate Governance

52 ANNUAL REPORT 2010/2011
governance issues and recommending financial policies for approval to the Board. The report of the Board Audit, Finance and Risk Management Committee is included in the annual financial statements and sets out the responsibilities covered by this committee.
BoardHumanResourcesandRemuneration CommitteeThe Board Human Resources Committee consists of non-executive Board members and is chaired by a non-executive member who is appointed by the Board. The committee reviews and recommends annual staff remuneration increases, terms and conditions of employment, the payment of incentives and bonuses, general fringe benefits, remuneration policies and appointment of senior staff.
ChiefExecutiveOfficerandGeneral ManagersThe Chief Executive Officer is appointed by the Board, as are the General Managers. Both the Chief Executive Officer and General Managers are involved in the day-to-day business activities of the organisation and are responsible for ensuring that decisions, strategies and objectives of the Board are implemented in accordance with the approved corporate performance plan and budget. The terms of reference for the Chief Executive Officer are approved by the Board.
Materiality and Significant FrameworkA Materiality and Significant Framework is in place and is still to be submitted to the Board for approval. Its purpose is to regulate disclosures of material facts to the MEC of Economic Development, Environment and Tourism in Limpopo, disclosure in the company annual financial statements and approval from the MEC of Economic Development, Environment and Tourism in Limpopo for participation in certain transactions.
Internal AuditThe Internal Audit function is performed by an appointed audit company which is headed by a director who is accountable to the Board Audit, Finance and Risk Management Committee.
The Internal Audit functions in terms of an Internal Audit Charter that is approved by the Board. The Charter defines the purpose, authority and responsibility of the Internal Audit function. Internal Audit carries out its work
in terms of a work plan which is based on the risk profile
of the company and which is approved annually by the
Board Audit, Finance and Risk Management Committee.
The Internal Auditors have full access to the chairperson of
the Board Audit and Risk Management Committee.
Management reportingComprehensive management reporting disciplines are in
place. These include the annual preparation of a corporate
performance plan and budget which is approved by
the Board and the MEC of Economic Development,
Environment and Tourism in Limpopo.
Capacity challenges in Corporate Services are being
addressed to ensure consistent and timeous reporting of
monthly results to Management and quarterly results to
the Board, Board Audit, Finance and Risk Management
Committee, Provincial Treasury and Department of
Economic Development, Environment and Tourism in
Limpopo.
Code of EthicsThe company has a code of ethics which requires
employees and Board members to observe high
ethical standards to ensure that business practices
are conducted in a manner which is beyond reproach.
Non-financial information
EmploymentEquityNorthern Province Investment Initiative t/a Trade and
Investment Limpopo has achieved an employment equity
target of 93% black representation across all job levels
and categories. This criterion is applied as a target for all
new appointments and promotions within the organisation.
The process is monitored on an ongoing basis and is
evaluated regularly by the Board Human Resources and
Remuneration Committee. Going forward, this target will
be further reviewed and refined.
BlackEconomicEmpowermentThe company is committed to the achievement of
the objectives laid out in Government’s Broad-Based
Black Economic Empowerment (B-BBEE) strategy. The
company has policies and procedures in place which
address preferential procurement practices which support
black economic empowerment.
Statement on Corporate Governance

ANNUAL REPORT 2010/2011 53
Statement on Corporate Governance
CorporateSocialInvestmentThe company has a corporate social investment programme in place which sees the entity becoming involved in the community through support, fi nancial or in kind, of deserving causes, organisations, institutions or projects.
WorkerparticipationA process has been activated where employees of TIL participate in discussions on staff welfare and policy formulation through the relevant employee consultative forum.
Informationonthenon-executiveandexecutivedirectorsofthecompany
The Board members and Directorate of the Board during the accounting period were as follows:
Boardmember Comments
Interim members appointed from 11 February 2010 until 22 March 2011
10 N Matlala (Chair) Appointed on 11 February 201011 K Ramokgopa Appointed on 11 February 2010 and appointment lapsed on 22 March 201112 M Maponya Appointed on 11 February 2010 and resigned on 22 March 201113 V Mkhombo Appointed on 11 February 201014 S Thobakgale Appointed on 11 February 2010 and appointment lapsed on 22 March 2011
Members appointed from 23 March 2011 to date
10 N Matlala Appointed on 23 March 201113 V Mkhombo Appointed on 23 March 201115 PJ Malabela Appointed on 23 March 201116 NH Mkhumane Appointed on 23 March 201117 D Kourtoumbellides Appointed on 23 March 201118 M Lekota Appointed on 23 March 201119 MP Maleta Appointed on 23 March 201120 HA Ngobeni Appointed on 23 March 201121 M Maphutha Appointed on 23 March 201122 MN Kgathi Appointed on 23 March 201123 L Sennelo Appointed on 23 March 201124 PJ Maduna Appointed on 23 March 201125 RW Milne Appointed on 23 March 201126 CM Setlhako Appointed on 23 March 2011
Executive Directors
1 J Mapatha (Acting CEO) up to August 2010 Resigned on 30 September 2010 2 MD Monakedi (CEO) Appointed in August 2010

54 ANNUAL REPORT 2010/2011
Statement on Corporate Governance
BoardandBoardcommitteemeetingsThe record of attendance by each Board member at TIL ordinary Board meetings for the period under review is set out in the table below:
Member 21/04/10 28/05/10 31/05/10 19/07/10 10/08/10 13/08/10 17/09/10 10/11/10 10/12/10 08/02/10 22/03/11
N Matlala (Chair) ✓ ✓ ✓ ✓ ✗ ✓ ✓ ✓ ✓ ✓ ✓
K Ramokgopa (Dep)
✗ ✓ ✓ ✓ ✗ ✓ ✓ ✗ ✗ ✗ ✗
S Thobakgale ✓ ✓ ✓ ✓ ✓ ✓ ✓ ✗ ✗ ✗ ✗
M Maponya ✓ ✓ ✓ ✓ ✓ ✓ ✓ ✓ ✗ ✓ ✗
V Mkhombo ✓ ✓ ✓ ✓ ✓ ✓ ✓ ✓ ✓ ✓ ✓
✓ indicates attendance✗ indicates absence with apology
BoardAudit,FinanceandRiskManagementCommitteemeetings
Member 06/05/10 07/06/10 19/07/10 01/02/11
M Maponya (Chair) ✓ ✓ ✓ ✓
V Mkhombo ✓ ✓ ✓ ✓
K Ramokgopa ✗ ✗ ✓ ✗
✓ indicates attendance
✗ indicates absence with apology
BoardHumanResourcesandRemunerationCommitteemeetings
Member 04/05/10 11/05/10 28/05/10 17/09/10
K Ramokgopa (Chair) ✓ ✓ ✓ ✓
V Mkhombo ✓ ✓ ✓ ✓
S Thobakgale ✓ ✓ ✓ ✓
✓ indicates attendance
✗ indicates absence with apology

ANNUAL REPORT 2010/2011 55
Accounting Authority’s Responsibilities and ApprovalThe Board (Accounting Authority) is required by the Public Finance Management Act, 1999 (Act 1 of 1999) to maintain adequate accounting records. It is also responsible for the content and integrity of the annual fi nancial statements and related fi nancial information included in this report. It is the responsibility of the Board to ensure that the annual fi nancial statements fairly present the state of affairs of the entity as at the end of the fi nancial year and the results of its operations and cash fl ows for the period then ended. The external auditors are engaged to express an independent opinion on the annual fi nancial statements and were given unrestricted access to all fi nancial records and related data.
The annual fi nancial statements have been prepared in accordance with Standards of Generally Recognised Accounting Practice (GRAP).
The annual fi nancial statements are based upon appropriate accounting policies consistently applied and supported by reasonable and prudent judgements and estimates.
The Board acknowledges that it is ultimately responsible for the system of internal fi nancial control established by the entity and places considerable importance on maintaining a strong control environment. To enable the Board to meet these responsibilities, the Accounting Authority sets standards and implements systems of internal control aimed at reducing the risk of error in a cost effective manner. These standards include the proper delegation of responsibilities within a clearly defi ned framework, effective accounting procedures and adequate segregation of duties to ensure an acceptable level of risk. These controls are monitored throughout the entity and all employees are required to maintain the highest ethical standards in ensuring the entity’s business is conducted in a manner that in all reasonable circumstances is above reproach. The focus of risk management in the entity is on identifying, assessing, managing and monitoring all known forms of risk across the entity.
While operating risk cannot be fully eliminated, the entity endeavours to minimise it by ensuring that appropriate infrastructure, controls, systems and ethical behaviour are applied and managed within predetermined procedures and constraints.
The Board is of the opinion, based on the information and explanations given by management, that the system of internal control provides reasonable assurance that the fi nancial records may be relied on for the preparation of the annual fi nancial statements. However, any system of internal fi nancial control can provide only reasonable, and not absolute, assurance against material misstatement.
The Board has reviewed the entity’s cash fl ow forecast for the year to 31 March 2012 and, in the light of this review and the current fi nancial position, it is satisfi ed that the entity has or has access to adequate resources to continue in operational existence for the year ahead.
The entity is wholly dependent on the Limpopo Department of Economic Development, Environment and Tourism for continued funding of operations. The annual fi nancial statements are prepared on the basis that the entity is a going concern and that the Limpopo Department of Economic Development, Environment and Tourism has neither the intention nor the need to liquidate or materially curtail the scale of the entity.
The external auditors are responsible for independently reviewing and reporting on the entity’s annual fi nancial statements. The annual fi nancial statements have been examined by the entity’s external auditors and their report is presented on page 57.
NHMkhumane MDMonakediChairperson Director

56 ANNUAL REPORT 2010/2011
Audit Committee Responsibility
The audit committee was established in order to assist in improving management reporting by overseeing internal and external audit functions, internal financial controls, financial reporting process, and compliance with accounting policies, legal requirements, risk management, internal control systems and other policies within the entity. It interacts with and evaluates the effectiveness of the external and internal audit processes and reviews compliance with the code of ethics.
In meeting its responsibilities and in executing its duties, the Board Audit Committee is required to consider the adequacy and effectiveness of the entity’s internal controls and the quality of its financial information.
In order to discharge its responsibilities, the Committee has reviewed, on a regular basis during the year under review, the following:
• The risk areas of the entity’s operations to be covered in the scope of internal audits;
• Activities of the internal audit function to determine the effectiveness thereof;
• Internal audit reports, including the response of management to issues raised therein;
• The external audit scope to ensure that the critical areas of the business are being addressed;
• The external auditor’s report and management letter;
• The operational effectiveness of the entity’s policies, systems and procedures;
• The effectiveness of the system for monitoring compliance with laws and regulations; and
• The annual financial statements.
The effectiveness of internal controls
In line with the PFMA and the King III Report on Corporate Governance requirements, internal audit activity (IAA) and management provides the Audit Committee with assurance that the internal controls are appropriate and effective. This is achieved by means of the risk management process, as well as the identification of corrective actions and suggested enhancement to the controls and processes.
From the various reports of the internal auditors, audit report on the Annual Financial Statements and the management reports from the Auditor-General, it was noted that the internal control systems were not entirely effective for the year under review. During the current financial year, several deficiencies in the system of internal control and/or deviations were reported by the internal auditors as well as the external auditors as highlighted in the qualified audit report. Management has been tasked with ensuring that these deficiencies are addressed so as to ensure that the systems of internal controls are more effective.
Evaluation of Financial Statements
The audit committee has reviewed the unaudited financial statements to be included in the annual report with the Accounting Officer and is in agreement with the external auditors qualified report.
On behalf of the Board Audit Committee
LJSenneloChairperson
Report of the Board Audit Committee in terms of Regulation 27.1.10(b) and (c) of the Public Finance Management Act, 1999 (Act 1 of 1999) (“the PFMA”)
ANNUAL REPORT 2010/2011 57
Report on the Financial Statements
Introduction1. I have audited the accompanying financial statements of the Northern Province Investment Initiative t/a Trade and
Investment Limpopo which comprise the statement of financial position as at 31 March 2011 and the statement of financial performance, statement of changes in net assets and cash flow statement for the year then ended, a summary of significant accounting policies and other explanatory information and directors’ report as set out on pages 49 to 50 and 62 to 88.
Accountingauthority’sresponsibilityforthefinancialstatements2. The Accounting Authority is responsible for the preparation and fair presentation of these financial statements in
accordance with South African Standards of Generally Recognised Accounting Practice (SA Standards of GRAP) and the requirements of the Public Finance Management Act of South Africa, 1999 (Act 1 of 1999) (PFMA), and Companies Act of South Africa, 1973 (Act 61 of 1973) and for such internal control as management determines necessary to enable the preparation of financial statements that are free from material misstatement whether due to fraud or error.
Auditor-General’sresponsibility3. As required by section 188 of the Constitution of the Republic of South Africa, 1996 (Act 108 of 1996) and section 4 of
the Public Audit Act of South Africa, 2004 (Act 25 of 2004) (PAA), my responsibility is to express an opinion on these financial statements based on my audit.
4. I conducted my audit in accordance with International Standards on Auditing and General Notice 1111 of 2010 issued in Government Gazette 33872 of 15 December 2010. Those standards require that I comply with ethical requirements and plan and perform the audit to obtain reasonable assurance about whether the financial statements are free from material misstatement.
5. An audit involves performing procedures to obtain audit evidence about the amounts and disclosures in the financial statements. The procedures selected depend on the auditor’s judgement, including the assessment of the risks of material misstatement of the financial statements, whether due to fraud or error. In making those risk assessments, the auditor considers internal control relevant to the entity’s preparation and fair presentation of the financial statements in order to design audit procedures that are appropriate in the circumstances, but not for the purpose of expressing an opinion on the effectiveness of the entity’s internal control. An audit also includes evaluating the appropriateness of accounting policies used and the reasonableness of accounting estimates made by management as well as evaluating the overall presentation of the financial statements.
6. I believe that the audit evidence I have obtained is sufficient and appropriate to provide a basis for my qualified audit opinion.
BasisforqualifiedopinionTradeandotherpayables7. The entity could not provide sufficient appropriate audit evidence to support reconciling items totalling R4 548 164
between trade payables stated in the statement of financial position and the creditors’ statement provided for audit. The entity’s records did not permit the application of alternative procedures regarding the amount payable to the creditor. Consequently, I did not obtain sufficient appropriate audit evidence to satisfy myself as to the completeness, valuation and allocation of and obligations pertaining to trade payables.
Irregularexpenditure8. Section 51 (a)(iii) of the PFMA requires the entity to implement and maintain an appropriate procurement and
provisioning system which is fair, equitable, transparent, competitive and cost-effective. The entity procured goods and services amounting to R9 713 164 in contravention of the supply chain management requirements. The amount was not included in irregular expenditure, disclosed in note 31 to the financial statements, resulting in irregular expenditure being understated by R9 713 164.
Report of the Auditor-General to the Limpopo Provincial Legislature on the Financial Statements of the Northern Province Investment Initiative t/a Trade and Investment Limpopo

58 ANNUAL REPORT 2010/2011
Report of the Auditor-General to the Limpopo Provincial Legislature on the Financial Statements of the Northern Province Investment Initiative t/a Trade and Investment Limpopo
Qualifiedopinion9. In my opinion, except for the effects of the matters described in the basis for qualified opinion paragraphs, the financial
statements present fairly, in all material respects, the financial position of the Northern Province Investment Initiative as at 31 March 2011, and its financial performance and cash flows for the year then ended in accordance with South African Standards of Generally Recognised Accounting Practice (SA Standards of GRAP) and the requirements of the Public Finance Management Act of South Africa, 1999 (Act 1 of 1999) (PFMA) and Companies Act of South Africa, 1973 (Act 61 of 1973).
EmphasisofmattersI draw attention to the matters below. My opinion is not modified in respect of these matters:
Restatementofcorrespondingfigures10. Misstatements in the corresponding figures were identified during our audit of the financial statements of the current
year relating to property, plant and equipment, trade and other receivables, trade and other payables, leave pay accrual, accumulated depreciation, depreciation, other income, operating expenditure and accumulated surplus. Management corrected the misstatement by restating the corresponding figures for the 2010 financial year. The restatements are disclosed in note 25 to the financial statements.
Goingconcern11. The current mid-term budget statement and the mandate provide for Northern Province Investment Initiative (NPII)
to continue to operate in its current form during the financial year ending 31 March 2012. However, the Provincial Government has pronounced that a single economic development agency will be established for the Limpopo Province by incorporating the mandates of Limpopo Business Support Agency (LIBSA), Northern Province Investment Initiative (NPII) and Limpopo Economic development Enterprise (LimDev). The structure of the single entity and status of NPII, LIBSA and LimDev have not been finalised. The entity has prepared its financial statements on a going concern basis and we did not find any significant indicators that its financial sustainability is under threat.
Additionalmatter12. I draw attention to the matter below. My opinion is not modified in respect of this matter:
Prior-yearauditconductedbyapredecessorauditor13. The financial statements of the prior year were audited by a predecessor auditor in terms of section 4(3) of the
Public Audit Act on 25 August 2011. An unqualified opinion was expressed.
Unauditedsupplementaryschedules14. The supplementary information set out on pages 89 to 90 does not form part of the financial statements and is
presented as additional information. I have not audited these schedules and accordingly, I do not express an opinion thereon.
REpoRT oN oThER lEGAl AND REGulAToRy REquIREMENTS15. In accordance with the PAA and in terms of General Notice 1111 of 2010, issued in Government Gazette 33872 of
15 December 2010, I include below my findings on the annual performance report as set out on page 50 and material non-compliance with laws and regulations applicable to the entity.
PredeterminedobjectivesMaterial findings on the report on predetermined objectives, as set out on pages 20 to 46 are reported below:
Usefulnessofinformation16. The reported performance information was deficient in respect of the following criteria:
• Consistency: The reported objectives, indicators and targets are not consistent with the approved strategic plan and annual performance plan.
• Measurability: The targets are not time-bound.

ANNUAL REPORT 2010/2011 59
Report of the Auditor-General to the Limpopo Provincial Legislature on the Financial Statements of the Northern Province Investment Initiative t/a Trade and Investment Limpopo
17. The following audit findings relate to the above criteria:
• Reported performance against predetermined indicators and targets is not consistent with the approved strategic plan and the annual performance plan.
• For the selected programmes, 95% of the planned and reported targets were not time-bound in specifying the time period or deadline for delivery.
Reliabilityofinformation18. The reported performance information was deficient in respect of the following criteria:
• Validity: The reported performance did not occur and does not pertain to the entity.
• Accuracy: The amounts, numbers and other data relating to reported actual performance have not been recorded and reported appropriately.
• Completeness: All actual results and events that should have been recorded have not been included in the reported performance information.
19. The following audit findings relate to the above criteria:
• For the selected programmes the validity, accuracy and completeness of 84% of the reported indicators and targets could not be established as sufficient appropriate audit evidence and relevant source documentation could not be provided.
Compliance with laws and regulations 20. Included below are findings on material non-compliance with laws and regulations applicable to the entity.
PublicFinanceManagementAct,1999(Act1of1999)andTreasuryRegulationsof2005
Strategicplanningandperformancemanagement21. The executive authority of the public entity did not approve the strategic plan submitted by the accounting authority as required
by TR 30.1.1.
22. The accounting authority did not ensure that the public entity has, and maintained, an effective, efficient and transparent system of internal control regarding performance management which described and represented how the entity’s processes of performance planning, monitoring, measurement, review and reporting was conducted, organised and managed as required by section 51(1)(a)(i) of the PFMA.
Budgets23. The accounting authority did not submit a budget of estimated revenue and expenditure for that financial year for approval
by the executive authority responsible for that public entity, at least six months before the start of the financial year of the department designated in terms of subsection (2) or another period agreed to between the executive authority and the public entity as per the requirements of PFMA section 53(1).
24. In the budget for the financial year ending 31 March 2011, the entity budgeted for a deficit in contravention of the requirements of section 53(3) of the PFMA.
Annualfinancialstatements,performanceandannualreport25. The accounting authority did not submit the financial statements for auditing within two months after the end of the financial
year as required by section 55(1)(c)(i) of the PFMA.
26. The accounting authority did not submit the annual report, financial statements and audit report for the 2010/11 year to the executive authority within five months of the end of the financial year as per the requirements of section 55(1)(d) of the PFMA.
27. The accounting authority submitted financial statements for auditing that were not prepared, in all material respects, in accordance with generally recognised accounting practices and supported by full and proper records as required by section 55(1)(a) and (b) of the PFMA.
Certain material misstatements identified by the AGSA with regards to the following were subsequently corrected:
• Class of transactions: other revenue, employee costs, operating expenditure; and
• Account balances: accounts receivables, accounts payables.
However, certain uncorrected material misstatements resulted in the financial statements receiving a qualified audit opinion in contravention of section 55(2)(a).

60 ANNUAL REPORT 2010/2011
Internalaudit28. The accounting authority did not ensure that an internal audit function was in place as per the requirements of Treasury
Regulations 27.2.2.
Procurementandcontractmanagement29. Goods and services with a transaction value of between R10 000 and R500 000 were procured without inviting at least
three written price quotations from prospective suppliers as per the requirement of TR 16A6.1 and National Treasury Practice Note 8 of 2007/08 issued in terms of section 76(4)(c) of the PFMA.
30. Awards were not always made to suppliers based on criteria that are consistent with the original invitations for quotations as per the requirement of a fair supply chain management system in TR 16A3.2.
31. The preference point system was not applied in all procurement of goods and services above R30 000 as required by section 2(a) of the Preferential Procurement Policy Framework Act.
32. Awards were made to suppliers who failed to provide written proof from the South African Revenue Service that their tax matters were in order as per the requirements of Preferential Procurement Regulations 16 and TR 16A9.1(d)
33. Awards were made to bidders who did not submit an SBD 4 as per the requirements of Practice Note 7 of 2009/10.
34. The prospective suppliers list for procuring goods and services through quotations was not updated at least quarterly to include new suppliers that qualify for listing.
Expendituremanagement35. Expenditure was incurred without approval of a delegated official as per the requirements of section 57 of the PFMA.
36. The accounting authority did not take effective and appropriate steps to prevent irregular expenditure as per the requirements of section 51(1)(b) of the PFMA.
37. The accounting authority did not take effective and appropriate steps to prevent fruitless and wasteful expenditure as per the requirements of section 51(1)(b) of the PFMA.
38. All payments due to creditors were not settled within 30 days from receipt of an invoice as per the requirements of section 38(1)(f) of the PFMA and TR 8.2.3.
INTERNAl CoNTRol39. In accordance with the PAA and in terms of General Notice 1111 of 2010, issued in Government Gazette 33872 of
15 December 2010, I considered internal control relevant to my audit, but not for the purpose of expressing an opinion on the effectiveness of internal control. The matters reported below are limited to the significant deficiencies that resulted in the basis for qualified opinion, the findings on the annual performance report and the findings on compliance with laws and regulations included in this report.
• Leadership The accounting authority did not exercise oversight responsibility regarding financial and performance reporting,
compliance and related internal controls.
The accounting authority did not implement effective HR management policies to ensure that adequate and sufficiently skilled resources were in place and that performance was monitored.
The accounting authority did not establish and communicate policies and procedures to enable and support understanding and execution of internal control objectives, processes and responsibilities.
The accounting authority did not develop and monitor the implementation of action plans to address internal control deficiencies.
Report of the Auditor-General to the Limpopo Provincial Legislature on the Financial Statements of the Northern Province Investment Initiative t/a Trade and Investment Limpopo

ANNUAL REPORT 2010/2011 61
• Financialandperformancemanagement Management did not implement controls over daily and monthly processing and reconciling of transactions/account
balances.
Management did not prepare regular, accurate and complete financial and performance reports that were supported and evidenced by reliable information.
Management did not review and monitor compliance with applicable laws and regulations.
• Governance Governance committees did not implement appropriate risk management activities to ensure that regular risk
assessments, including consideration of IT risks and fraud prevention, are conducted and that a risk strategy to address the risks was developed and monitored.
The accounting authority did not ensure that the Audit Committee promoted accountability and service delivery through evaluating and monitoring responses to risks and providing oversight over the effectiveness of the internal control environment including financial and performance reporting and compliance with laws and regulations.
The Audit Committee did not ensure that there was a performance management system in place as well as a risk management strategy to ensure effective and efficient management of risks.
Polokwane 19 October 2011
Report of the Auditor-General to the Limpopo Provincial Legislature on the Financial Statements of the Northern Province Investment Initiative t/a Trade and Investment Limpopo

62 ANNUAL REPORT 2010/2011
Statement of Financial Position as at 31 March 2011
Figures in Rand Note(s)31March
2011
Restated31 March
2010
AssetsNon-currentassetsProperty, plant and equipment 4 3198989 3 489 118 Intangible assets 5 20782 39 072
3219771 3 528 191
CurrentassetsPre-payments 8 241678 39 651 Receivables 9 483179 473 420Cash and cash equivalents 10 6572557 13 450 209
7297414 13 963 281
Totalassets 10517185 17 491 471
EquityandliabilitiesEquityShare capital 13 155842 155 842 Accumulated surplus 8232689 14 479 725
Totalequity 8388531 14 635 567
CurrentliabilitiesTrade and other payables 11 2128653 2 855 904
Totalequityandliabilities 10517185 17 491 471

ANNUAL REPORT 2010/2011 63
Statement of Financial Performancefor the year ended 31 March 2011
Figures in Rand Note(s)31March
2011
Restated31 March
2010
Revenue 15 34383343 40 468 808 Operating expenses (40631682) (34 338 199)
Operating(deficit)/surplus 16 (6248339) 6 130 609 Investment income 18 1507 58 729Finance costs 19 (204) (481)
(Deficit)/Surplusfortheyear (6247036) 6 188 857

64 ANNUAL REPORT 2010/2011
Statement of Changes in Net Assetsfor the year ended 31 March 2011
Figures in Rand Note(s)Share
capital
Accumulatedsurplus/
(deficit)Total
netassets
Balanceat01April2008 155 842 1 093 844 1 249 686Changes in net assetsSurplus for the year – 6 601 639 6 601 639
Total changes – 6 601 639 6 601 639
Balanceat31March2009 155 842 7 695 483 7 851 325AdjustmentsAssessment of residual values and useful life 25 – 594 381 594 381
Restatedbalanceat31March2009 155 842 8 289 864 8 445 706Changes in net assetsSurplus for the year – 6 098 123 6 098 123
Total changes – 6 098 123 6 098 123
Balanceat31March2010 155 842 14 387 987 14 543 829AdjustmentsAssessment of residual values and useful life 25 – 34 788 34 788 Prior-year adjustments 25 – 56 949 56 949
Restatedbalanceat31March2010 155 842 14 479 725 14 635 567Changes in net assetsDeficit for the year – (6 247 036) (6 247 036)
Total changes – (6 247 036) (6 247 036)
Balanceat31March2011 155 842 8 232 689 8 388 531

ANNUAL REPORT 2010/2011 65
Cash Flow Statementfor the year ended 31 March 2011
Figures in Rand Note(s)31March
2011
Restated 31 March
2010
CashflowsfromoperatingactivitiesReceiptsGovernment grant received 34 000 000 40 000 000 Other cash receipts 18 59 666 433 050 Interest income 1 507 58 729
34 061 173 40 491 779
PaymentsCash paid to suppliers (21 639 411) (17 240 145)Cash paid to employees (19 036 050) (17 224 834)Finance costs 19 (204) (481)
(40675665) (34 465 460)
Netcashflowsfromoperatingactivities 21 (6 614 492) 6 026 319
Cashflowsfrominvestingactivities Purchase of property, plant and equipment 4 (258 727) (161 704)Purchase of intangible assets 5 (4 433) (32 811)Proceeds from sale of property, plant and equipment – 25 094
Net cash flows from investing activities (263 160) (169 420)
Netincrease/(decrease)incashandcashequivalents (6 877 652) 5 856 899 Cash and cash equivalents at the beginning of the year 13 450 209 7 593 311
Cashandcashequivalentsattheendoftheyear 10 6 572 557 13 450 210
66 ANNUAL REPORT 2010/2011
Notes to the Annual Financial Statementsfor the year ended 31 March 2011
Accounting policies
1. Presentationofannualfinancialstatements The annual financial statements have been prepared in accordance with the effective Standards of Generally Recognised
Accounting Practice (GRAP) including any interpretations, guidelines and directives issued by the Accounting Standards Board.
These annual financial statements have been prepared on an accrual basis of accounting and are in accordance with historical cost convention unless specified otherwise. They are presented in South African Rand.
A summary of the significant accounting policies, which have been consistently applied, is disclosed below.
These accounting policies are consistent with the previous period.
1.1 Basisofmeasurement Accounting policy developments include new standards issued, amendments to standards and interpretations issued
on new standards. These developments resulted in the first time adoption of new standards and the restatement of prior year amounts where applicable. Management assessed the impact of all new standards issued, amendments to standards and interpretations issued on current standards.
1.2 Adoptionofnewandrevisedstandards In the current year, Northern Province Investment Initiative t/a Trade and Investment Limpopo has adopted the
following new and revised standards and interpretations issued by the Accounting Standards Board that are relevant to Northern Province Investment Initiative t/a Trade and Investment Limpopo’s operations. The adoption of these new and revised standards and interpretations has resulted in changes to Northern Province Investment Initiative t/a Trade and Investment Limpopo’s accounting policies that have affected the amounts reported for the current and prior period.
GRAP 23 Revenue from Non-exchange Transactions
GRAP 24 Presentation of Budget Information in the Financial Statements
1.3 Significantjudgementsandsourcesofestimationuncertainty In preparing the annual financial statements, management is required to make estimates and assumptions that affect
the amounts represented in the annual financial statements and related disclosures. Use of available information and the application of judgement are inherent in the formation of estimates. Actual results in the future could differ from these estimates which may be material to the annual financial statements. Significant judgements include:
Tradereceivables The entity assesses its trade receivables for impairment at the end of each reporting period. In determining whether
an impairment loss should be recorded in surplus or deficit, the entity makes judgements as to whether there is observable data indicating a measurable decrease in the estimated future cash flows from a financial asset.
Fairvalueestimation The carrying value less impairment provision of trade receivables and payables are assumed to approximate their
fair values.

ANNUAL REPORT 2010/2011 67
Notes to the Annual Financial Statementsfor the year ended 31 March 2011
Accounting policies (continued)
1. Presentationofannualfinancialstatements(continued) 1.3 Significantjudgementsandsourcesofestimationuncertainty(continued) Allowancefordoubtfuldebts On debtors an impairment loss is recognised in surplus and deficit when there is objective evidence that it is impaired.
The impairment is measured as the difference between the debtors’ carrying amount and the present value of estimated future cash flows discounted at the effective interest rate, computed at initial recognition.
1.4 Property,plantandequipment Property, plant and equipment are tangible non-current assets (including infrastructure assets) that are held for use in
the production or supply of goods or services, rental to others, or for administrative purposes, and are expected to be used during more than one period.
The cost of an item of property, plant and equipment is recognised as an asset when:
• it is probable that future economic benefits or service potential associated with the item will flow to the entity; and
• the cost of the item can be measured reliably.
Property, plant and equipment is initially measured at cost.
Recognitionandmeasurement The cost of an item of property, plant and equipment is the purchase price and other costs attributable to bring
the asset to the location and condition necessary for it to be capable of operating in the manner intended by management. Trade discounts and rebates are deducted in arriving at the cost.
Where an asset is acquired at no cost, or for a nominal cost, its cost is its fair value as at date of acquisition.
Costs include costs incurred initially to acquire or construct an item of property, plant and equipment and costs incurred subsequently to add to, replace part of, or service it. If a replacement cost is recognised in the carrying amount of an item of property, plant and equipment, the carrying amount of the replaced part is derecognised.
Property, plant and equipment is carried at cost less accumulated depreciation and any impairment losses.
Property, plant and equipment are depreciated on the straight-line basis over their expected useful lives to their estimated residual value.
The useful lives of items of property, plant and equipment have been assessed as follows:
Item Oldaverageusefullife Revisedaverageusefullife
Land IndefiniteBuildings 60 yearsMotor vehicles 5 yearsFurniture and equipment 5 years 10 yearsComputer equipment 2 – 3 years 4 – 6 years

68 ANNUAL REPORT 2010/2011
Accounting policies (continued)
1. Presentationofannualfinancialstatements(continued) 1.4 Property,plantandequipment(continued) Changeinaccountingestimate The residual value, and the useful life and depreciation method of each asset are reviewed at the end of each reporting
date. If the expectations differ from previous estimates, the change is accounted for as a change in accounting estimate. The assessment for residual and useful life was not performed during the previous year and therefore resulted in the prior period error and this is disclosed in note 25.
Items of property, plant and equipment are derecognised when the asset is disposed of or when there are no further economic benefits or service potential expected from the use of the asset.
1.5 Intangibleassets For an asset is identified as an intangible asset when it:
• is capable of being separated or divided from an entity and sold, transferred, licensed, rented or exchanged, either individually or together with a related contract, assets or liability; or
• arises from contractual rights or other legal rights, regardless whether those rights are transferable or separate from the entity or from other rights and obligations.
An intangible asset is recognised when:
• it is probable that the expected future economic benefits or service potential that are attributable to the asset will flow to the entity; and
• the cost or fair value of the asset can be measured reliably.
Intangible assets are initially recognised at cost.
For an intangible asset acquired at no or nominal cost, the cost shall be its fair value as at the date of acquisition.
Intangible assets are carried at cost less any accumulated amortisation and any impairment losses.
The amortisation period and the amortisation method for intangible assets are reviewed at each reporting date.
Amortisation is provided to write down the intangible assets, on a straight-line basis, to their residual values as follows:
Item Usefullife
Computer software 2 years
1.6 Financialinstruments The entity classifies financial instruments, or their component parts, on initial recognition as a financial asset, a financial
liability or an equity instrument in accordance with the substance of the contractual arrangement.
Initialrecognitionandmeasurement Financial instruments are recognised initially when the entity becomes a party to the contractual provisions of the
instruments.
Notes to the Annual Financial Statementsfor the year ended 31 March 2011

ANNUAL REPORT 2010/2011 69
Accounting policies (continued)
1. Presentationofannualfinancialstatements(continued) 1.6 Financialinstruments(continued) Initialrecognitionandmeasurement(continued) Financial instruments are measured initially at fair value, except for equity investments for which a fair value is not
determinable, which are measured at cost and are classified as available-for-sale financial assets.
For financial instruments which are not at fair value through surplus or deficit, transaction costs are included in the initial measurement of the instrument.
Fairvaluemethodsandassumptions If the market for a financial asset is not active the entity establishes fair value by using valuation techniques. These
include the use of recent arm’s length transactions, reference to other instruments that are substantially the same, discounted cash flow analysis, and option pricing models making maximum use of market inputs and relying as little as possible on entity-specific inputs.
Theeffectiveinterestratemethod The effective interest rate method is a method of calculating the amortised cost of a financial asset or a financial
liability and of allocating the interest income or interest expense over the relevant period. The effective interest rate is the rate that exactly discounts estimated future cash payments or receipts through the expected life of the financial instrument or, when appropriate, a shorter period to the net carrying amount of the financial asset or financial liability.
Amortisedcost Amortised cost is the amount at which the financial asset or financial liability is measured at initial recognition minus
principal repayments, plus or minus the cumulative amortisation using the effective interest method of any difference between the initial amount and the maturity amount, and minus any reduction for impairment or uncollectability.
Loansandotherreceivables Loans and receivables are measured at initial recognition at fair value, and are subsequently measured at amortised
cost using the effective interest rate method. Appropriate allowances for estimated irrecoverable amounts are recognised in surplus or deficit when there is objective evidence that the asset is impaired. Significant financial difficulties of the debtor, probability that the debtor will enter bankruptcy or financial reorganisation, and default or delinquency in payments are considered indicators that the trade receivable is impaired. The allowance recognised is measured as the difference between the asset’s carrying amount and the present value of estimated future cash flows discounted at the effective interest rate computed at initial recognition.
Tradeandotherpayables Trade payables are initially measured at fair value, and are subsequently measured at amortised cost, using the
effective interest rate method.
Cashandcashequivalents Cash and cash equivalents comprise cash on hand and demand deposits, and other short-term highly liquid
investments that are readily convertible to a known amount of cash and are subject to an insignificant risk of changes in value. These are initially and subsequently recorded at fair value.
1.7 Taxation No provision has been made for SA income taxation, as the entity is exempt from income taxation in terms of
section 10(1)(A)(i) of the Income Tax Act, 1962 (Act 58 of 1962).
Notes to the Annual Financial Statementsfor the year ended 31 March 2011

70 ANNUAL REPORT 2010/2011
Accounting policies (continued)
1. Presentationofannualfinancialstatements(continued) 1.8 Leases A lease is classified as a finance lease if it transfers substantially all the risks and rewards incidental to ownership.
A lease is classified as an operating lease if it does not transfer substantially all the risks and rewards incidental to ownership.
Financeleases–Lessee Finance leases are recognised as assets and liabilities in the statement of financial position at amounts equal to the fair
value of the leased property or, if lower, the present value of the minimum lease payments. The corresponding liability to the lessor is included in the statement of financial position as a finance lease obligation.
Minimum lease payments are apportioned between the finance charge and reduction of the outstanding liability. The finance charge is allocated to each period during the lease term so as to produce a constant periodic rate of interest on the remaining balance of the liability.
Operatingleases–Lessee Operating lease payments are recognised as an expense on a straight-line basis over the lease term. The difference
between the amounts recognised as an expense and the contractual payments are recognised as an operating lease asset or liability.
1.9 Employeebenefits Short-termemployeebenefits The cost of short-term employee benefits (those payable within 12 months after the service is rendered, such as paid
vacation leave and sick leave, bonuses, and non-monetary benefits such as medical care) are recognised in the period in which the service is rendered and are not discounted.
Definedcontributionplans Payments to defined contribution retirement benefit plans are charged as an expense as they fall due.
Payments made to industry-managed (or state plans) retirement benefit schemes are dealt with as defined contribution plans where the entity’s obligation under the schemes is equivalent to those arising in a defined contribution retirement benefit plan.
1.10 Provisionsandcontingencies Provisions are recognised when:
• the entity has a present obligation as a result of a past event;
• it is probable that an outflow of resources embodying economic benefits or service potential will be required to settle the obligation; and
• a reliable estimate can be made of the obligation.
The amount of a provision is the best estimate of the expenditure expected to be required to settle the present obligation at the reporting date.
Where some or all of the expenditure required to settle a provision is expected to be reimbursed by another party, the reimbursement is recognised when, and only when, it is virtually certain that the reimbursement will be received if the entity settles the obligation. The reimbursement is treated as a separate asset. The amount recognised for the reimbursement does not exceed the amount of the provision.
Contingent assets and contingent liabilities are not recognised. Contingencies are disclosed in note 24.
Notes to the Annual Financial Statementsfor the year ended 31 March 2011

ANNUAL REPORT 2010/2011 71
Accounting policies (continued)
1. Presentationofannualfinancialstatements(continued) 1.11 Revenuefromnon-exchangetransactions Revenue comprises gross inflows of economic benefits or service potential received by an entity, which represents an
increase in net assets, other than increases relating to contributions from owners.
Liabilities are present obligations that result in the outflow of resources from the entity.
Stipulations on transferred assets are terms in laws or regulation, or a binding arrangement, imposed upon the use of a transferred asset by entities external to the reporting entity.
In a non-exchange transaction, an entity either receives value from another entity without directly giving approximately equal value in exchange, or gives value to another entity without directly receiving approximately equal value in exchange.
Resources transferred could be subject to certain conditions. Conditions specify that the entity must use the resources transferred to it in a particular way, or the resources must be returned to the transferrer which therefore gives rise to a present obligation. In assessing whether or not conditions exist, the entity considers the terms of each non-exchange transaction. The entity also evaluates the substance other than the legal form of the arrangement.
Control of the asset arises when the entity can use or otherwise benefit from the asset in pursuit of its objectives and can exclude or otherwise regulate the access of others to that benefit.
Recognition Revenue from non-exchange transactions is accounted for using the assets and liabilities approach. Assets arising
from non-exchange revenue transactions are recognised when the entity has an enforceable right to claim resources from another entity and the fair value of the asset can be determined reliably on initial recognition.
Liabilities are present obligations that result in the outflow of resources from the entity.
To the extent that no obligation exists, or as and when the conditions of the obligation are satisfied, the entity recognises revenue. Where no obligation exists, revenue is recognised at the fair value of the assets recognised. When a condition exists, revenue is recognised as the amount of the reduction in the liability.
Measurement Revenue from a non-exchange transaction is measured at the amount of the increase in net assets recognised by
the entity.
When, as a result of a non-exchange transaction, the entity recognises an asset, it also recognises revenue equivalent to the amount of the asset measured at its fair value as at date of acquisition, unless it is also required to recognise a liability. Where a liability is required to be recognised it will be measured as the best estimate of the amount required to settle the obligation at the reporting date, and the amount of the increase in net assets, if any, recognised as revenue. When a liability is subsequently reduced, because the taxable event occurs or a condition is satisfied, the amount of the reduction in the liability is recognised as revenue.
1.12 Judgementsandestimates The entity makes use of estimates and of assumptions concerning the future. The resulting accounting estimates
and assumptions that have a significant risk of causing a material adjustment to the carrying amounts of assets and liabilities within the next financial year are addressed as follows:
Notes to the Annual Financial Statementsfor the year ended 31 March 2011

72 ANNUAL REPORT 2010/2011
Accounting policies (continued)
1. Presentationofannualfinancialstatements(continued) 1.12 Judgementsandestimates(continued) Usefullivesandresidualvalues The estimated useful lives and residual values of items of property, plant and equipment are reviewed annually taking
cognisance of the forecasted commercial and economic realities and through benchmarking of accounting treatments in the specific industries where these assets are used. Refer to note 25 for the estimated useful lives for property, plant and equipment.
1.13 Financialriskmanagement Treasury regulations require the entity to facilitate a risk assessment to determine the material risks to which the
entity may be exposed and to evaluate the strategy for managing these risks. A risk assessment exercise is therefore conducted for the whole organisation on an annual basis; with the assistance of the entity’s internal auditors. These risk factors form the basis of the internal audit coverage plan. The use of financial instruments exposes an organisation to a number of risks.
The main financial risks are disclosed in note 27.
1.14 Relatedparties A related party is identified as a party which has the ability to control the other party or exercise significant influence
over the other party in making financial and operating decisions or if the related party entity and another entity are subject to common control.
Related parties include:
1. Entities that, directly or indirectly, through one or more intermediaries, control, or are controlled by the reporting entity;
2. Associates;
3. Individuals owning, directly or indirectly, an interest in the reporting entity that gives them significant influence;
4. Key management personnel, and close members of the family of key management personnel; and
5. Entities in which a substantial ownership interest is held, directly or indirectly.
Close members of the family of an individual are close relatives of the individual or members of the individual’s immediate family who can be expected to influence, or be influenced by, that individual in their dealings with the entity.
Key management personnel are:
1. All directors or members of the governing body of the entity; and
2. Other persons having the authority and responsibility for planning, directing and controlling the activities of the entity.
Where they meet this requirement key management personnel include:
a. Where there is a member of the governing body of a whole-of-government entity who has the authority and responsibility for planning, directing and controlling the activities of the reporting entity, that member;
b. Any key advisors of that member; and
c. Unless already included in (1), the senior management group of the reporting entity, including the chief executive or permanent head of the reporting entity.
Related party transactions and balances are disclosed in note 23.
Notes to the Annual Financial Statementsfor the year ended 31 March 2011

ANNUAL REPORT 2010/2011 73
Accounting policies (continued)
1. Presentationofannualfinancialstatements(continued) 1.15 Accumulatedsurplus In terms of section 53(3) of the Public Finance Management Act, surplus funds at close of the financial year shall be
paid to the Provincial Revenue Funds unless Treasury approval has been obtained to retain such funds.
1.16 Comparativefigures Where necessary, comparative figures have been reclassified to conform to changes in presentation in the current
year.
1.17 Unauthorisedexpenditure Unauthorised expenditure means:
• overspending of a vote or a main division within a vote; and
• expenditure not in accordance with the purpose of a vote or, in the case of a main division, not in accordance with the purpose of the main division.
All expenditure relating to unauthorised expenditure is recognised as an expense in the statement of financial performance in the year that the expenditure was incurred. The expenditure is classified in accordance with the nature of the expense, and where recovered, it is subsequently accounted for as revenue in the statement of financial performance.
1.18 Fruitlessandwastefulexpenditure Fruitless expenditure means expenditure which was made in vain and would have been avoided had reasonable care
been exercised.
All expenditure relating to fruitless and wasteful expenditure is recognised as an expense in the statement of financial performance in the year that the expenditure was incurred. The expenditure is classified in accordance with the nature of the expense, and where recovered, it is subsequently accounted for as revenue in the statement of financial performance.
1.19 Irregularexpenditure Irregular expenditure as defined in section 1 of the PFMA is expenditure other than unauthorised expenditure, incurred
in contravention of or that is not in accordance with a requirement of any applicable legislation, including:
• this Act; or
• the State Tender Board Act, 1968 (Act 86 of 1968), or any regulations made in terms of the Act; or
• any provincial legislation providing for procurement procedures in that provincial government.
National Treasury practice note no. 4 of 2008/2009 which was issued in terms of sections 76(1) to 76(4) of the PFMA requires the following (effective from 1 April 2008):
Irregular expenditure that was incurred and identified during the current financial year and which was condoned before year end and/or before finalisation of the financial statements must also be recorded appropriately in the irregular expenditure register. In such an instance, no further action is also required with the exception of updating the note to the financial statements.
Notes to the Annual Financial Statementsfor the year ended 31 March 2011

74 ANNUAL REPORT 2010/2011
Accounting policies (continued)
1. Presentationofannualfinancialstatements(continued) 1.20 Goingconcernassumption These financial statements have been prepared on the assumption that the entity will continue to operate as a going
concern for the year ahead.
1.21 Budgetinformation Entities are typically subject to budgetary limits in the form of appropriations or budget authorisations (or equivalent),
which is given effect through authorising legislation, appropriation or similar.
General purpose financial reporting by entities shall provide information on whether resources were obtained and used in accordance with the legally adopted budget.
The annual financial statements and the budget are not on the same basis of accounting therefore a reconciliation between the statement of financial performance and the budget have been included in the annual financial statements. Refer to note 33.
2. Changesinaccountingpolicy The annual financial statements have been prepared in accordance with Standards of Generally Recognised Accounting
Practice on a basis consistent with the revised prior year, except for the adoption of the following new or revised standards:
• GRAP 23: Revenue from Non-exchange Transaction; and
• GRAP 24: Presentation of Budget Information in the Financial Statement.
The adoption of the GRAP standards do not differ or result in material differences in items presented and disclosed in the annual financial statements. The implementation of the GRAP standards has resulted in changes in certain terminology used in the annual financial statements. They are consistent in all material aspects with accounting policies of previous years, except as otherwise stated.
3. Newstandardsandinterpretations 3.1 Standardsandinterpretationsthatareeffectiveandadoptedinthecurrentyear In the current year, the entity has adopted the following standards and interpretations that are effective for the current
financial year and that are relevant to its operations:
The entity has adopted the standard for the same time in the 2011 annual financial statements.
The impact of the standard is not material.
GRAP24:PresentationofBudgetInformationintheFinancialStatements Subject to the requirements of paragraph 19, an entity shall present a comparison of the budget amounts for
which it is held publicly accountable and actual amounts either as a separate additional financial statement or as additional budget columns in the financial statements currently presented in accordance with standards of GRAP. The comparison of budget and actual amounts shall present separately for each level of legislative oversight:
• the approved and final budget amounts;
• the actual amount on a comparable basis: and
• by way of a note disclosure, an explanation of material differences between the budget for which the entity is held publicly accountable and actual amounts, unless such explanation is included in other public documents issued in conjunction with the financial statements, and a cross-reference to those documents is made in the notes.
Notes to the Annual Financial Statementsfor the year ended 31 March 2011

ANNUAL REPORT 2010/2011 75
4. Property,plantandequipment
Restated2011 2010
Figures in RandCost/
ValuationAccumulateddepreciation
Carryingvalue
Cost/Valuation
Accumulated depreciation
RestatedCarrying value
Land 952000 – 952000 952 000 – 952 000 Buildings 1081932 (180216) 901716 994 939 (163 028) 831 911 Motor vehicles 1258785 (811685) 447100 1 258 785 (650 780) 608 004 Furniture and equipment 1241647 (812766) 428881 1 527 981 (967 084) 560 897 Computer equipment 1015212 (545919) 469292 1 261 355 (725 049) 536 306 Improvements to leased premises 200595 (200595) – 164 768 (164 768) –
Total 5750170 (2551181) 3198989 6 159 827 (2 670 709) 3 489 118
Reconciliationofproperty,plantandequipment–2011
Figures in RandOpeningbalance Additions Transfers Disposals Depreciation Total
Land 952000 – – – – 952000Buildings 831911 86993 – – (17188) 901716Motor vehicles 608004 – – – (160905) 447100Furniture and equipment 560897 19721 – (7027) (144711) 428881IT equipment 536306 116185 – (2179) (181020) 469292Improvements to leased premises – 35827 – – (35827) –
Total 3489118 258727 – (9205) (539650) 3198989
Reconciliation of property, plant and equipment – 2010
Figures in RandOpening balance
Prior yearadjustment Additions Disposals
Restated depreciation Total
Land 952 000 – – – 952 000 Buildings 848 475 – – (16 564) 831 911 Motor vehicles 794 842 – (25 094) (161 743) 608 004 Furniture and equipment 315 978 333 580 52 806 – (141 467) 560 897 IT equipment 327 126 261 714 108 991 (4 426) (157 099) 536 306 Improvements to leased premises – – – – –
Total 3 238 420 595 293 161 797 (29 520) (476 873) 3 489 118
Land is situated at Erf 5734 in Polokwane.
The amount of R161 797 for 2010 additions includes assets to the value of R94 which were brought into TIL’s record books at deemed cost and treated as prior year error. No cash payments were made.
Notes to the Annual Financial Statementsfor the year ended 31 March 2011

76 ANNUAL REPORT 2010/2011
Balance sheet
5. Intangibleassets
2011 2010
Figures in RandCost/
ValuationAccumulatedamortisation
Carryingvalue
Cost/ Valuation
Accumulated amortisation
Carrying value
Computer software 93480 (72699) 20782 92 176 (53 104) 39 072
Reconciliationofintangibleassets–2011
Figures in RandOpeningbalance Additions Disposals Amortisation Total
Computer software 39072 4433 – (22724) 20782
Reconciliation of intangible assets – 2010Opening balance Additions Disposals Amortisation Total
Computer software 34 054 32 811 – (27 792) 39 072
6. FinancialassetsbycategoryThe accounting policies for financial instruments have been applied to the line items below:
Figures in RandLoansand
receivables Total
2011Trade and other receivables 410556 410556Cash and cash equivalents 6572557 6572557
6983112 6983112
2010Trade and other receivables 437 279 437 279Cash and cash equivalents 13 450 209 13 450 209
13 887 488 13 887 488
Figures in Rand31March
2011
Restated 31 March
2010
7. EmployeebenefitsNorthern Province Investment Initiative t/a Trade and Investment Limpopo operates a remuneration system based on the total cost to company principle.
7.1 DefinedcontributionpensionplanIt is the policy of the company to provide retirement benefits for all of its eligible permanent employees. All eligible permanent employees are members of a defined contribution pension fund known as Wiz@rd Universal Pension Fund. This is charged to the statement of financial performance in the year to which it relates.
The fund is governed by Sanlam.
Contributions for the year paid to the Pension Fund amounted to 1833394 1 593 034
Notes to the Annual Financial Statementsfor the year ended 31 March 2011

ANNUAL REPORT 2010/2011 77
Income statement
Figures in Rand31March
2011
Restated 31 March
2010
8. Pre-payments 241678 39 651
9. TradeandotherreceivablesStaff study loans 87550 41 536 Advances: Subsistence and travelling and other 148899 46 539 Sundry receivables 410556 437 279
647005 525 355
Reconciliationofprovisionforimpairmentoftradeandotherreceivables:Opening balance (51934) (150 000)Movement during the year (111891) 98 066Closing balance (163826) (51 934)
483179 473 420
10. CashandcashequivalentsCash and cash equivalents consists of the following balance sheet amounts:Bank balances 6571557 13 449 209Cash on hand 1000 1 000
6572557 13 450 209
Cash and cash equivalents consist of cash on hand and balances with banks.
11. TradeandotherpayablesEmployee leave entitlement from non-exchange transactions 950401 512 84013th cheque cash portion from non-exchange transactions 162575 979 332 Sundry payables 526247 468 520Trade payables 489431 895 212
2128653 2 855 904
12. FinancialliabilitiesbycategoryThe accounting policies for financial instruments have been applied to the line items below:
Figures in RandFinancialliabilities Total
2011Trade and other payables 489431 489431
489431 489431
2010Trade and other payables 895 212 895 212
895 212 895 212
Notes to the Annual Financial Statementsfor the year ended 31 March 2011

78 ANNUAL REPORT 2010/2011
Figures in Rand31March
2011
Restated 31 March
2010
13. ContributionsfromownersThe entity was established in terms of section 21 of the Companies Act, 1973 (Act 61 of 1973) as amended and has no fixed authorised share capital.
IssuedOrdinary shares of R1,00 each issued to the Limpopo Provincial Government in respect of the net assets taken over from the Great North Marketing Corporation Limited 155842 155 842
14. InvestmentsUnlistedZebediela (Pty) LimitedNumberofsharesheld 20 20 At cost – –
Non-listed investments – –
Zebediela Mining (Pty) Limited is currently not trading, as a result no directors’ evaluation has been disclosed.
15. RevenueMonetary government grants received 34000000 40 000 000 Sponsorship received 285000 435 000 Other income 98343 33 808
34383343 40 468 808
15.1 Theamountincludedinrevenuearisingfromexchangesofgoodsorservicesisasfollows:Other income in respect of commitment fees 40042 33 808
15.2 Theamountincludedinrevenuearisingfromnon-exchangetransactionsisasfollows:Monetary government grants received 34000000 40 000 000 Sponsorship received 285000 435 000 Other income in respect of expenses recovered 58301 –
34343301 40 435 000
16. Operatingsurplus/(deficit)Operating (deficit)/surplus for the year is stated after accounting for the following:Audit fees – External 191520 126 301Bad debts 113324 (98 066)Consulting and technical fees 998030 1 061 252Depreciation on property, plant and equipment 539650 504 665Amortisation on intangible assets 22724 27 792 Deficit on assets written off 9205 4 426Employee costs 19036050 17 224 834 Operating lease rentals on buildings 590525 637 819 Operating lease rentals on office equipment 249531 790 798
Notes to the Annual Financial Statementsfor the year ended 31 March 2011

ANNUAL REPORT 2010/2011 79
Figures in Rand31March
2011
Restated 31 March
2010
17. EmployeerelatedcostsSalaries and wages 14914370 13 869 636Provisions for staff costs 3143029 2 782 219 Leave pay provision charge 517880 174 873 Training costs 460771 398 107
19036050 17 224 834
Number of employees 40 42
18. InvestmentincomeBank interest received during the year 1507 58 728
19. FinancecostsInterest charged during the year 204 481
20. TaxationNo provision has been made for taxation as the entity is exempt from tax in terms of section 10(1)(A) of the Income Tax Act, 1962.
21. CashgeneratedfromoperationsSurplus/(deficit) (6247036) 6 188 857Non-cashmovements:Depreciation and amortisation 562374 (504 665)Debt impairment 111891 (98 066)Deficit on assets written off 9205 4 426
683471 411 025
Changesinworkingcapital:Increase/(decrease) in trade and other payables (727251) (537 806)Increase in receivables and pre-payments (323677) (35 757)
(1050928) (573 563)
Netcashflowfromoperatingactivities (6614492) 6 026 319
Notes to the Annual Financial Statementsfor the year ended 31 March 2011

80 ANNUAL REPORT 2010/2011
Figures in Rand31March
2011
Restated31 March
2010
22. Commitments22.1 Operatingleasecommitments
22.1.1 BuildingsWithin one year 412553 277 026 In second to fifth year inclusive 402574 815 127 Later than five years – –
815127 1 092 153
22.1.2 EquipmentWithin one year 145966 158 049 In second to fifth year inclusive 42779 188 745 Later than five years – –
188745 346 794
BiccardStreetinPolokwane Northern Province Investment Initiative t/a Trade and Investment Limpopo leases office space from AC & GJ Diamond. This contract has been renewed for a period of one year ending 2012. The lease payment is fixed at R15 234,22 per month. The company has an option to renew the lease.
Johannesburg Northern Province Investment Initiative t/a Trade and Investment Limpopo leases office space from Liberty Properties for a period of three years ending 2013. The lease payment is fixed at R18 393,11 per month, with an escalation of 9% per annum.
OfficeequipmentforPolokwaneoffice Northern Province Investment Initiative t/a Trade and Investment Limpopo leases photo-copier machines from Konica Minolta for a period of three years ending 2012. The lease payment is fixed at R5 694,14 per month.
OfficeequipmentforPolokwaneandJohannesburgoffices Northern Province Investment Initiative t/a Trade and Investment Limpopo leases two photo-copier machines from Konica Minolta for a period of three years ending 2012 and 2013, respectively. The lease payments are fixed at R5 694,14 and R2 673,64 per month, respectively.
22.1.3 Authorisedcapitalandoperatingexpenditure
Property, plant and equipment – – Other – 562 051 Professional fees – 351 881
– 913 932
Notes to the Annual Financial Statementsfor the year ended 31 March 2011

ANNUAL REPORT 2010/2011 81
Figures in Rand31March
2011 31 March
2010
23. Relatedparties23.1 Identityofrelatedparties
The following parties have been identified as related parties with whom Northern Province Investment Initiative t/a Trade and Investment Limpopo interacted:
1. The members of the accounting authority (listed in the accounting authority’s report);
2. Entities that are related to the members of the accounting authority.
Relatedparty RelationshipBDFM Publisher Mr ME Ramono – Member of the
Accounting Authority– 304 532
Data Master Office Automation Mr J Nell – Managing Director – – Hihlurile Development Ms SH Masunga – Owner of – –
Hihlurile Development
23.2 MaterialrelatedpartytransactionsPurchase of goods and services from the related parties (refer note 23.1)
Other related party payment transactions made during the year under review were to Limpopo Economic Development Enterprises (LimDev) in respect of the following:
Limpopo Marula Festival 55000 –Sponsorship 1000 –Corporate gift ex Makgofane Construction 161000 –
217000 –
23.3 GrantreceivedDuring the year under review TIL received a grant of R34 million for operational costs from LEDET.
23.4 ProjectfundreceivedAn amount of R419 000 was received from LEDET and was transferred to Limpopo Tooling Initiative and Fabrication Laboratory (FABLAB).
23.5 Executivemanagementandtmembers’emolumentsandexpenses23.5.1 Executivemanagementemoluments
The following persons are employed by the Northern Province Investment Initiative t/a Trade and Investment Limpopo in their respective executive capacities during the financial year:
Figures in Rand Name Remuneration Emoluments
31March2011
31 March 2010
JM Mapatha (Acting CEO) (up to August) (resigned September 2010)* 402 045 240 979 643024 1 333 619 MD Monakedi (appointed in August 2010)* 817 792 20 536 838328 –
1 219 837 261 515 1481352 1 333 619
* Not for the full year
Notes to the Annual Financial Statementsfor the year ended 31 March 2011

82 ANNUAL REPORT 2010/2011
23. Relatedparties(continued)23.5 ExecutivemanagementandBoardmembers’emolumentsandexpenses(continued)
23.5.2 Boardmembers’emolumentsFigures in Rand 31March 31 March
Name Remuneration Emoluments 2011 2010
ME Ramano (Chairman) (terminated on 11 February 2010) – – – 32 535KS Mashalane (terminated on 11 February 2010) – – – 20 985ST Boya (terminated on 11 February 2010) – – – 35 623LM Maisela (terminated on 11 February 2010) – – – 43 059KZ Mbatha (terminated on 11 February 2010) – – – 23 145J Nell (terminated on 11 February 2010) – – – 18 025 M Nunes (terminated on 11 February 2010) – – – 21 025MI Nemaoroni (terminated on 11 February 2010) – – – 24 337SH Masunga (terminated on 11 February 2010) – – – 34 385N Matlala (Chairperson) (appointed 11 February 2010) 90 000 146 093 236093 42 029K Ramokgopa (lapsed 22 March 2011) 87 000 60 522 147522 32 116M Maponya, CASA (resigned 23 March 2011) 87 000 87 098 174098 15 875V Mkhombo (appointed 11 February 2010) 72 000 143 092 215092 33 618S Thobakgale (lapsed 22 March 2011) – – – – PJ Malabela (appointed 23 March 2011) – – – – NH Mkhumane (appointed 23 March 2011) – – – – D Kourtoumbellides (appointed 23 March 2011) – – – – M Lekota (appointed 23 March 2011) – – – – MP Maleta (appointed 23 March 2011) – – – – HA Ngobeni (appointed 23 March 2011) – – – – M Maphutha (appointed 23 March 2011) – – – – MN Kgathi (appointed 23 March 2011) – – – – L Sennelo (appointed 28 April 2011) – – – – PJ Maduna (appointed 23 March 2011) – – – – RW Milne (appointed 23 March 2011) – – – – CM Setlhako (appointed 23 March 2011) – – – –
336 000 436 805 772805 376 757
Notes to the Annual Financial Statementsfor the year ended 31 March 2011

ANNUAL REPORT 2010/2011 83
23. Relatedparties(continued)23.5 ExecutivemanagementandBoardmembers’emolumentsandexpenses(continued)
23.5.3 SeniormanagementemolumentsFigures in Rand 31March 31 March
Name Remuneration Emoluments 2011 2010
S Rakumako – General Manager: Investment Services 802 637 155 520 958157 780 641 A Shiburi – General Manager: Business Development 803 851 185 624 989475 804 110 M Shogole – General Manager: International Operations 816 858 123 284 940142 798 522 C Mokoma – Deputy General Manager: International Operations 803 971 378 808 1182779 783 522 PJ Moloisane – General Manager: Economic Planning 833 410 198 331 1031741 819 120 S Molobi – General Manager: Marketing and Communications (resigned in October)* – – – 426 031 EK Mahoai – General Manager: Corporate Marketing and Communications (appointed in June 2010)* 608 333 16 739 625072 – LD Madlala – General Manager: Corporate Services (appointed on 14 December 2010)* 234 526 496 235002 –
4 903 586 1 058 802 5962388 4 411 946
* Not for the full year
Transactions with related parties take place on terms no more favourable than transactions with unrelated parties.
24. ContingentliabilitiesThe following are Northern Province Investment Initiative t/a Trade and Investment Limpopo contingent liabilities as detailed below:
Figures in Rand Attorney’sreference Matterdescription
31March2011
31 March 2010
Bopape P Labour 68000 – Khunou E Labour 98000 – Mapatha J Labour 1840033 –
2006033 –
Bopape P is suing Northern Province Investment Initiative t/a Trade and Investment Limpopo for unfair labour practice emanating from Northern Province Investment Initiative t/a Trade and Investment Limpopo’s decline to pay performance bonus for 2006/07 financial year.
Khonou E, who is still employed by Northern Province Investment Initiative t/a Trade and Investment Limpopo is suing the company for unfair labour practice relating to non-payment of benefits of performance.
Mapatha J, the former Acting Chief Executive Officer of Northern Province Investment Initiative t/a Trade and Investment Limpopo, is suing the company for failure to pay him 18 months’ severance package upon termination of his contract of employment end of September 2010.
Notes to the Annual Financial Statementsfor the year ended 31 March 2011

84 ANNUAL REPORT 2010/2011
25.CorrectionofprioryearerrorsDuring the period under review the entity has reviewed the useful lives and residual values of movable assets as required by GRAP 17. The assessment for residual and useful lives was not performed during the previous year and therefore resulted in the prior period error.
In addition to the above the following prior period errors were rectified resulting in restatement of comparative figures:
• The liability for leave provision was overstated due to incorrect interpretation and application of the leave policy;
• Invoices relating to 2009/10 period were not accrued in the correct period; and
• Commitment fees due to the entity were not accounted for.
Financial statements were restated as result of errors not accounted in the published results.
The correction of error(s) results in adjustments as follows:
Figures in Rand
StatementoffinancialpositionIncrease in carrying value of movable assets 629 169 Increase in carrying value of movable assets 94Decrease in leave provision 140 935 Increase in trade and other payables (accrued expenses) (104 387)Increase in accounts receivable (accrued income) 20 308
Impact on opening accumulated surplus 686 118
StatementoffinancialperformanceDecrease in depreciation and amortisation 594 381 Decrease in leave expense 140 935 Increase in promotional expenses (40 650)Increase in directors’ travelling costs (15 927)Increase in administration costs (29 782)Increase in facilitation costs (18 027)Increase in commitment fees 20 308
651 237
StatementofchangesinnetassetsImpact on 2008/09 opening accumulated surplus 594 381Impact on 2009/10 opening accumulated surplus 34 788Prior year adjustment 56 949
686 188
26. GoingconcernThe current mid-term budget statement and mandate provides for Northern Province Investment Initiative t/a Trade and Investment Limpopo to continue to operate in its current form during the financial year 2011/12. The structure of the single entity and status of the affected public entities has not been finalised, although a single Accounting Authority has already been appointed. The Accounting Authority believes that Northern Province Investment Initiative t/a Trade and Investment Limpopo will continue as a going concern in the year ahead.
Notes to the Annual Financial Statementsfor the year ended 31 March 2011

ANNUAL REPORT 2010/2011 85
27. RiskmanagementFinancialriskmanagementThe entity’s activities expose it to a variety of financial risks, market risk (fair value interest rate risk, cash flow rate risk and price risk), credit risk and liquidity risk.
LiquidityriskThe entity’s risk to liquidity is a result of the funds available to cover future commitments. The entity manages interest liquidity risk through an ongoing review of future commitments and credit facilities.
Cash is managed prudently by keeping sufficient cash in bank accounts. Cash is mainly received from Government funding.
Figures in Rand31March
2011
Restated31 March
2010
28. FinancialinstrumentsCreditriskExposuretocreditriskThe carrying amount of financial assets represents the maximum credit exposure.
The maximum exposure to credit risk at the reporting date was:Trade and other receivables 410556 437 279Cash and cash equivalents 6572557 13 450 209
6983112 13 887 488
The maximum exposure to credit risk for trade and other receivables at the reporting date by type of customer was:Staff debtors 236449 88 075Sundry receivables 410556 437 279Pre-payments 241678 39 651
888683 565 006
29. FairvaluesThe fair values of all the financial instruments are substantially identical to the carrying amount reflected in the balance sheet. The fair values of financial statements and liabilities, together with the carrying amounts shown in the balance sheet, are as follows:
31March2011
31 March 2010
Figures in RandCarryingamount
Fairvalue
Carrying amount
Fair value
Non-derivativefinancialliabilitiesTrade and other receivables 724857 724857 513 072 513 072Cash and cash equivalents 6572557 6572557 13 450 209 13 450 209 Trade and other payable 2128653 2128653 2 855 994 2 855 994
9426067 9426067 16 819 185 16 819 185
Notes to the Annual Financial Statementsfor the year ended 31 March 2011

86 ANNUAL REPORT 2010/2011
30. ImpairmentlossesBased on past experience, the entity believes that no impairment allowance is necessary in respect of trade and other receivables not past due. At the balance sheet date none of the trade and other receivables were past due.
No impairment loss was recognised in the current or prior year.
LiquidityriskThe following are the contractual maturities of financial liabilities, including estimated interest payments and excluding the impact of netting arrangements:
Figures in RandCarryingamount
Contractualcashflows
0–12months
Morethanayear
31March2011Non-derivative financial liabilitiesTrade and other payables 2128653 2128653 2128653 –
2128653 2128653 2128653 –
31 March 2010Non-derivative financial liabilitiesTrade and other payables 2 855 904 2 855 904 2 855 904 –
2 855 904 2 855 904 2 855 904 –
CurrencyriskExposuretoriskThe entity is not exposed to foreign currency risk.
InterestrateriskThe entity generally adopts a policy ensuring that its exposure to changes in interest rate is on a floating rate basis. The entity does not use any financial instruments as hedges against interest rate risk. There were no significant interest bearing financial instruments at the reporting date.
Figures in Rand31March
2011
Restated 31 March
2010
31. IrregularexpenditureReconciliation of irregular expenditure:Opening balance – – Irregular expenditure – current year 2113613 – Condoned or written off by Board – – Transfer to receivables for recovery – not condoned – –
Irregular expenditure awaiting condonement 2113613 –
The following are details of irregular expenditure incurred:Invoice paid against open-ended purchase orders without details of supporting documentation 1512471 – Invoices paid without purchase orders 329713 – Invoices charged twice on different dates for the same service and with the same purchase order reference 271429 –
The ineffective implementation of Supply Chain Management policy and internal controls is attributed to the decentralisation of procurement processes due to lack of capacity in Corporate Services.
Investigations have been conducted and reports submitted but appropriate disciplinary steps are still to be undertaken.
Notes to the Annual Financial Statementsfor the year ended 31 March 2011

ANNUAL REPORT 2010/2011 87
31March Restated31 March
Figures in Rand 2011 2010
32. FruitlessandwastefulexpenditureReconciliation of fruitless and wasteful expenditure:Opening balance 27828 27 828 Fruitless and wasteful expenditure – current year 56502 – Condoned or written off by Board (7520) – Transfer to receivables for recovery – not condoned – –
Fruitless and wasteful expenditure awaiting condonement 76810 27 828
Fruitless and wasteful expenditure relates to hotel bookings not cancelled on time.
IncomenotaccountedforCommitment fees not accounted for due to lack of policy and internal controls on management and collection of fees. Amounts have been transferred to accounts receivables and a provision for doubtful debt has also been raised 15 692 20 308
Investigations have been conducted and reports submitted but appropriate disciplinary steps are still to be undertaken.
2010Fruitless and wasteful expenditure relates to:This relates to the 2008 medical aid contributions not recovered from the employees who resigned from the organisation. The main cause of these overpayments is the non-completion of monthly reconciliations due to lack of capacity in Corporate Services 7 520
33. ReconciliationbetweenbudgetandstatementoffinancialperformanceReconciliation of budget surplus/(deficit) with the surplus/(deficit) in the statement of financial performanceNet surplus/(deficit) per the statement of financial performance (6 247 036) 6 188 857
Adjustedforrevenue,otherincomeandinvestmentincome–(over)andunderrecovery (59 850) (58 737)
Other income (58 301) – Commitment fees (42) (8)Investment income (1 507) (58 729)
Operatingexpenditureandfinancecosts–Overand(under)incurred (2 412 318) (5 211 320)
Employee benefits (425 504) (1 105 515)Accounting authority emoluments 362 656 (74 834)Corporate marketing and communications (240 023) 161 768 Trade and investment promotion 155 985 (3 368 352)Business development (1 563 646) (262 953)Business retention services (1 194 844) (708 859)Research and knowledge management (1 086 293) (727 545)Administrative expenditure 1 248 061 495 520Professional and special services 322 085 375 024 Deficit on assets written off 9 205 4 426
Netsurplus/(deficit)perapprovedbudget (8 719 204) 918 801
Notes to the Annual Financial Statementsfor the year ended 31 March 2011

88 ANNUAL REPORT 2010/2011
31March Restated31 March
Figures in Rand 2011 2010
34.ActualcapitalexpenditureversusbudgetedcapitalexpenditureReconciliation of actual capital expenditure versus budgeted capital expenditureBudgetedcapitalexpenditure 300 000 450 000 Actualcapitalexpenditure 263 160 194 608
Property, plant and equipment 258 727 161 797 Intangible assets 4 433 32 811
Unspentcapitalexpenditure 36 840 255 392
35. OtherrelatedmattersThe following expenditure was incurred with regard to 2010 FIFA World CupTM activities:World Cup expenditure:Distribution of tickets acquired after year-end QuantityBafana Bafana T-shirts 50 – 31 000
50 – 31 000
36. EventsafterthereportingdateThe Accounting Authority is not aware of any circumstances arising since the end of the financial year which significantly affect the financial position of the entity and the results of its operations, other than the merger process which is ongoing.
Notes to the Annual Financial Statementsfor the year ended 31 March 2011

ANNUAL REPORT 2010/2011 89
Unaudited Detailed Statement of Financial Performance
Figures in Rand31March
2011
Restated31 March
2010
RevenueMonetary government grants received 34000000 40 000 000Sponsorship received 285000 435 000Otherincome 98343 33 808
– Commitment fees 40042 33 808– Other income 58301 –
Totalrevenue 34383343 40 468 808Finance income 1507 58 729
Totalrevenueincludingfinanceincome 34384850 40 527 536
ExpenditureEmployeebenefits 19036050 17 224 834
– Personnel costs 18575279 16 826 727– Staff training and development costs 460771 398 107
Accountingauthorityemoluments 1195156 583 766
– Fees for services 336000 221 850– Other expenses 859156 361 916
Corporatemarketingandcommunications 3049977 3 593 716
– Printing and electronic media 757122 755 737– Local and national events 1929403 2 443 680– General facilitation services 363452 394 300
Tradeandinvestmentpromotion 7655986 3 683 752
– Trade shows and exhibitions 3133223 1 548 394– Visiting delegations 1012461 298 768– Foreign promotion expenses 2652760 595 834– National and local promotion expenses 299446 604 703– General facilitation services 558096 636 053
Businessdevelopment 2048354 2 600 047
– Agriculture sector 72764 718 902– Mining sector 1001767 156 673– Manufacturing sector 323403 677 131– Tourism sector 32080 467 531– General facilitation services 618340 579 809
Businessretentionservices 495156 826 141
– Client relationship management 125885 489 733– Municipal capacity building 50000 21 813– General facilitation services 319271 314 595

90 ANNUAL REPORT 2010/2011
Figures in Rand31March
2011
Restated31 March
2010
Researchandknowledgemanagement 988707 733 955
– Research 691232 536 548– General facilitation services 297474 197 407
Administrativeexpenditure 4963746 3 900 490
– Communication costs 1100875 750 446– Rental of property 731937 621 567– Repairs, maintenance and pool vehicle costs 348289 478 849– Depreciation and amortisation 562374 504 665– Finance costs 204 481– Other 2220065 1 544 481
Professionalandspecialservices 1189550 1 187 552
– Audit fees 191520 126 301– Consulting, professional fees and technical fees 998030 1 061 252
Deficitonassetswrittenoff 9205 4 426
Totalexpenses 40631886 34 338 680
(Deficit)/surplusfortheyear (6247036) 6 188 857
Unaudited Detailed Statement of Financial Performance

ANNUAL REPORT 2010/2011 91
Abbreviations
B-BBEE Broad-Based Black Economic Empowerment
BPO&O Business Process Outsourcing and Off-Shoring
BR&E Business Retention and Expansion Programme
CII Confederation of Indian Industries
CILTSA Chartered Institute of Logistics and Transport of South Africa
CPI Centre of Investment Promotion
dti Department of Trade and Industry
FECC Federation of Swaziland Employers and Chamber of Commerce
FDI Foreign Direct Investment
FIFA Fédération Internationale de Football Association
GRAP Generally Recognised Accounting Practice
GDP Gross Domestic Product
IETF International Engineering and Technology Fair
JETRO Japanese External Trade Organisation
LEA Local Enterprise Authority
LEDET Limpopo Department of Economic Development, Environment and Tourism
LEGDP Limpopo Employment, Growth and Development Plan
MCLI Maputo Corridor Logistics Initiative
MEC Member of the Executive Council
PAA Public Audit Act of South Africa, 2004 (Act 25 of 2004)
PFMA Public Finance Management Act
SANEC Southern African – Netherlands Chamber of Commerce
SIPA Swaziland Investment Promotion Agency
STATSSA Statistics South Africa
TIL Northern Province Investment Initiative t/a Trade and Investment Limpopo
UNIDO United Nations Industrial Development Organisation

92 ANNUAL REPORT 2010/2011
Corporate Information
HeadOffice130A Marshall StreetPolokwaneLimpopo Province0700
Tel: +27 (0)15 295 5171 Tel: +27 (0)15 295 5197 Fax: +27 (0)15 295 5197
PO Box 3490PolokwaneLimpopo Province0700
JohannesburgSecond floorSandton Office TowersSandton City ComplexCnr 5th Street & Rivonia RoadSandton, 2196JohannesburgSouth AfricaTel: +27 (0)11 026 9576
ANNUAL REPORT 2011 92

