organization of visual inputs to the inferior temporal and ... · organization of visual inputs to...
TRANSCRIPT

The Journal of Neuroscience, January 1991, 17(l): 166-190
Organization of Visual Inputs to the Inferior Temporal and Posterior Parietal Cortex in Macaques
Joan S. Baizer,a Leslie G. Ungerleider, and Robert Desimone
Laboratory of Neuropsychology, National Institute of Mental Health, Bethesda, Maryland 20892
It has been proposed that visual information in the extrastri- ate cortex is conveyed along 2 major processing pathways, a “dorsal” pathway directed to the posterior parietal cortex, underlying spatial vision, and a “ventral” pathway directed to the inferior temporal cortex, underlying object vision. To determine the relative distributions of cells projecting to the 2 pathways, we injected the posterior parietal and inferior temporal cortex with different fluorescent tracers in 5 rhesus monkeys. The parietal injections included the ventral intra- parietal (VIP) and lateral intraparietal (LIP) areas, and the temporal injections included the lateral portions of cytoar- chitectonic areas TE and TEO. There was a remarkable seg- regation of cells projecting to the 2 systems. Inputs to the parietal cortex tended to arise either from areas that have been implicated in spatial or motion analysis or from pe- ripheral field representations in the prestriate cortex. By con- trast, inputs to the temporal cortex tended to arise from areas that have been implicated in form and color analysis or from central field representations. Cells projecting to the parietal cortex were found in visual area 2 (V2), but only in the far peripheral representations of both the upper and lower visual field. Likewise, labeled cells found in visual areas 3 (V3) and 4 (V4) were densest in their peripheral representations. Heavy accumulations of labeled cells were found in the dorsal pari- eto-occipital cortex, including the parieto-occipital (PO) area, part A of V3 (V3A), and the dorsal prelunate area (DP). In the superior temporal sulcus, cells were found within several motion-sensitive areas, including the middle temporal area (MT), the medial superior temporal area (MST), the fundus of the superior temporal area (FST), and the superior tem- poral polysensory area (STP), as well as within anterior por- tions of the sulcus whose organization is as yet poorly de- fined. Cells projecting to areas TE and TEO in the temporal cortex were located within cytoarchitectonic area TG at the temporal pole and cytoarchitectonic areas TF and TH on the parahippocampal gyrus, as well as in noninjected portions of area TE buried within the superior temporal sulcus. In the prestriate cortex, labeled cells were found in V2, V3, and V4,
Received May 30, 1990, revised Aug. 30, 1990; accepted Sept. 9, 1990.
We wish to thank Mortimer Mishkin for his support during all phases of this work and for his comments on the manuscript. Skillful technical assistance was provided by Thelma W. Galkin, John N. Sewell III, Joanna Lawrence, Amy R. Wolfson, and Janet Frensilli. This work was supported in part by NIMH Grant MH42 130 to J.S.B.
Correspondence should be addressed to Leslie G. Ungerleider, Laboratory of Neuropsychology, National Institute of Mental Health, Building 9, Room lN107, Bethesda, MD 20892.
a Present address: Department of Physiology, State University of New York at Buffalo, 4234 Ridge Lea Road, Amherst, NY 14226. Copyright 0 1991 Society for Neuroscience 0270-6474/9 l/010168-23$03,00/O
but, in contrast to the loci labeled after parietal injections, those labeled after temporal injections were concentrated in the fovea1 or central field representations. Although few double-labeled cells were seen, 2 regions containing inter- mingled parietal- and temporal-projection cells were area V4 and the cortex at the bottom of the anterior superior temporal sulcus. Based on the results of injections of anterograde tracers in one additional case, the latter region also appears to receive converging inputs from the 2 visual pathways and may therefore be a site of integration of spatial and object information.
The primate cortex contains at least 20 different cortical areas with visual functions (for reviews, see Fig. 1; Van Essen, 1985; Maunsell and Newsome, 1987; Desimone and Ungerleider, 1989). According to a scheme originally proposed by Ungerlei- der and Mishkin (1982), these visual cortical areas comprise 2 major processing pathways, or streams. One pathway begins with the primary visual cortex and continues through multiple prestriate areas into the posterior parietal cortex. This “dorsal stream” appears to play an important role in visuospatial and oculomoter function and in the perception of visual motion. The other pathway also begins with the primary visual cortex but continues through multiple prestriate areas into the inferior temporal cortex. This “ventral stream” appears to play an im- portant role in pattern vision, color vision, and object recog- nition. Although the original evidence for the 2 systems was the differential effects of posterior parietal and inferior temporal lesions on spatial and pattern discrimination tasks, the distinc- tion between the 2 systems is now also supported by physio- logical and anatomical evidence in both Old-world and New- world monkeys (for reviews of both “streams,” see Ungerleider and Mishkin, 1982; Van Essen and Maunsell, 1983; Desimone et al., 1985; Maunsell and Newsome, 1987; Weller, 1988; An- dersen, 1989; Desimone and Ungerleider, 1989) and by both neuropsychological (e.g., Newcombe et al., 1987) and cerebral blood flow (Haxby et al., 1988) studies in humans.
More recently, Livingstone and Hubel (1987b, 1988) have proposed that the dorsal and ventral streams are derived from the “magno” and “parvo” systems, respectively. Information in the magno system appears to flow preferentially along a path- way that includes the magnocellular layers of the lateral genic- ulate nucleus, layers 4Cc1 and 4B of the striate cortex, the thick cytochrome oxidase stripes of area V2, and areas V3d and MT (Hubel and Wiesel, 1972; Lund, 1973; Lund and Boothe, 1975; Maunsell and Van Essen, 1983a; DeYoe and Van Essen, 1985; Fitzpatrick et al., 1985; Shipp and Zeki, 1985, 1989a,b; Burk- halter et al., 1986; Ungerleider and Desimone, 1986b; Hubel and Livingstone, 1987; Livingstone and Hubel, 1987a). By con-

The Journal of Neuroscience, January 1991, 17(l) 169
trast, information in the parvo system appears to flow prefer- entially along a pathway that includes the parvocellular layers of the lateral geniculate nucleus, layer 4Cfi and layers 2 and 3 of the striate cortex (blob and interblob regions), the thin stripe and interstripe cytochrome oxidase zones of area V2, and area V4 (Hubel and Wiesel, 1972; Lund and Boothe, 1975; Living- stone and Hubel, 1984, 1987a; DeYoe and Van Essen, 1985; Fitzpatrick et al., 1985; Shipp and Zeki, 1985; Hubel and Liv- ingstone, 1987; Zeki and Shipp, 1989). Insofar as area MT pro- vides strong inputs to the posterior parietal cortex and V4 pro- vides strong inputs to the inferior temporal cortex, anatomy alone suggests some relationship between the dorsal/ventral and magno/parvo schemes. However, many of the anatomical and functional details of this relationship remain to be worked out.
Previous anatomical studies have revealed many of the inputs to the posterior parietal and inferior temporal cortex, but, except for one recent report (Morel and Bullier, 1990), none has directly compared inputs in the same animal. We were interested not only in identifying areas that provide inputs to the 2 systems, but also, within each area, the relative spatial arrangement of cells providing inputs to one or the other system. We therefore injected 2 different fluorescent tracers into the posterior parietal and inferior temporal cortex in the same animal and compared the distributions of labeled cells. The posterior parietal injec- tions covered the posterior bank of the intraparietal sulcus, in- cluding the ventral intraparietal (VIP) and lateral intraparietal (LIP) areas (Maunsell and Van Essen, 1983a; Andersen et al., 1985), which, as previous work has shown, receive direct pro-
jections from several prestriate visual areas, such as areas MT, MST, and V4 (Seltzer and Pandya, 1980; Rockland and Pandya, 198 1; Felleman and Van Essen, 1983; Maunsell and Van Essen 1983a; Ungerleider and Desimone, 1986b; Cavada and Gold- man-Rakic, 1989; Boussaoud et al., 1990). The inferior tem- poral injections included the lateral surface of area TE and por- tions of area TEO (Iwai and Mishkin, 1968, 1969; Desimone and Gross, 1979; Boussaoud et al., 1991), which, as previous work has shown, receive direct projections from area V4 (Kuy- pers et al., 1965; Desimone et al., 1980; Felleman and Van Essen, 1983; Fenstemaker et al., 1984; Weller and Kaas, 1985; Felleman et al., 1986; Ungerleider et al., 1986; Shiwa, 1987). The present results showed a remarkable degree of segregation of inputs to the 2 visual systems. There were only 2 major zones of overlap of cells projecting to the different destinations. One was in the prestriate cortex in area V4, and the other was located in a portion of the superior temporal sulcus, anterior to area MT. This portion of the superior temporal sulcus was also found to receive convergent inputs from the posterior parietal and inferior temporal cortex and thus may be a site of integration for spatial and object vision.
A preliminary report of this work has been presented previ- ously (Baizer et al., 1988).
Materials and Methods Five Macaca mulatta (cases 1-3, 5, 6), weighing 3.3-4.3 kg, and 1 Macaca fascicularis (case 4), weighing 6.4 kg, were used. Most had previously served as normal controls in behavioral studies. In cases I- 5, we made multiple injections of 2 different retrograde tracers into the lower bank of the intraparietal sulcus and into the inferior temporal cortex. In case 6, we made multiple injections of 2 different anterograde tracers into these same cortical regions.
Injections of tracers. All injections were made under direct visual observation during aseptic surgery. The monkey was initially tranquil- ized with ketamine (10 mg/kg, i.m.), then treated with atropine (0.04
mg/kg, i.m.) and anesthetized with pentobarbital(20 mg/kg initial dose, i.v., supplemented as needed). Brain swelling was controlled with man- nitol (20%). The bone over the parietal cortex was removed in a single flap, and the opening was then extended ventrally with rongeurs to expose the temporal cortex. In order to make injections of tracer deep into the lateral bank of the intraparietal sulcus, we removed the cortex of the upper bank by aspiration.
Multiple injections of tracers were made with a Hamilton microsy- ringe. The tip of the syringe needle was guided into the cortex with the aid of an operating microscope. In each case, we attempted to fill as much of the cortex as possible on the lateral bank of the intraparietal sulcus with one tracer and on the lateral surface of the inferior temporal cortex with another. In case 1, a total of 4 ~1 of 10% bisbenzimide (Bis; 0.1 rllinjection) was injected into the lateral bank of the intraparietal sulcus, and the same quantity of 10% nuclear yellow (NY) was injected into the inferior temporal cortex. In cases 2-5, a total of 5-7 ~1 of 2% fast blue (FB; 0.15-0.2 pi/injection) was injected into the lateral bank of the intraparietal sulcus, and a similar quantity of4% diamidino yellow (DY) was injected into the inferior temporal cortex. In case 6, a total of 7 rrl oftritiated amino acids (AA: 200 &i/u1 ofan eaual-Darts mixture of t&ated proline and leucine; New E&land Nuclea;; sp&ilic activity, loo-140 Ci/mmol; 0.2 &injection) was injected into the lateral bank of the intraparietal sulcus in one procedure, and 4 d later, 4 ~1 of 5% wheat germ agglutinin conjugated to horseradish peroxidase (WGA- HRP; 0.2 pi/injection) was injected into the inferior temporal cortex. In all cases, the injection volumes listed were greater than the effective injection volumes, as we observed considerable amounts of tracer leak- ing out of the cortex immediately after the syringe needle was withdrawn.
Following the injections, the injection sites were thoroughly rinsed with saline to remove any excess tracer, and Gelfoam was placed over the cortex of the lateral bank of the intraparietal sulcus and inferior temporal gyrus. The dura was sutured, the bone flap replaced, and the wound closed in anatomical layers. The animal was maintained post- operatively on dexamethasone phosphate (0.4 mg/kg, i.m.) to minimize cerebral edema, received acetaminophen for postoperative analgesia, and was given gentamicin sulfate (5.0 mg/kg, i.m.) prophylactically.
Histological processing. Survival times were 2 d for case 1 and 8-l 4 d for cases 2-5. For case 6, the survival time was 6 d following the AA injection and 2 d following the WGA-HRP injection. Cases 14 were given a lethal dose of pentobarbital and perfused transcardially with 0.9% saline followed by 4% paraformaldehyde in 0.1 M phosphate buffer (pH, 7.2), and then by 5% glycerol in buffered paraformaldehyde. The brains were blocked stereotaxically, removed from the skull, photo- graphed, and stored overnight in 10% glycerol in buffered paraformal- dehyde at 4°C. They were then put in a solution of 20% glycerol in buffered paraformaldehyde and placed on a shaker at 4°C for the next 3-4 d, after which, they were frozen and stored in 2-methyl butane (95%) at -70°C until they were cut (see Rosene et al., 1986). Case 6 was prepared in the same way, except that the fixative was 3% para- formaldehyde in phosphate buffer (pH, 7.2), and the glycerol solutions contained no fixative. The preparation of case 5 is described below.
For cases l-4 and 6, frozen sections were cut at 50 pm, either in the coronal plane (cases 1-3, 6) or in the horizontal plane (case 4). In cases 1-4, 3 sections in every 5 through both the prelunate gyrus and the superior temporal sulcus and every fifth section through the remainder of the brain were examined for the presence of retrogradely labeled fluorescent cells. These sections were mounted directly from 0.45% saline as the brain was cut, dried at 37”C, and stored without coverslips in light-tight boxes placed in plastic bags at 4°C. Tissue preservation was aided by desiccant capsules put in both the boxes and the bags. The remaining sections were stored in 4% paraformaldehyde. Subsequently, for cases 1-4, an adjacent series of sections, at l.O-mm intervals, was mounted and stained with thionin, and another series, also at 1 .O-mm intervals, was stained for myelin with the method of Gallyas (1979). For case 6, one set of sections, at 250~pm intervals, was stored overnight at - 30°C in a solution of 0.1 M phosphate buffer and 30% ethylene glycol and processed the next day for WGA-HRP histochemistry ac- cording to the procedure of Gibson et al. (1984). An adjacent series of sections, at 250-rrn intervals, was processed for autoradiography ac- cording to the procedure of Cowan et al. (1972). The latter were mount- ed, defatted, dipped in Kodak NTB2 emulsion, and exposed at 4°C for 20 weeks. Subsequently, the autoradiographs were developed in Kodak D 19, fixed, and conterstained with thionin. An additional set of sections, at l-mm intervals, was stained for myelin.
Case 5 was perfused with 0.9% saline followed by 1% paraformal-

170 Baker et al. l Visual Inputs to Temporal and Parietal Cortex
Figure 1. Location of visual areas that have been identified in occipital, temporal, and parietal lobes of macaques. Areas are shown on a 2-D unfolded cortical map at the left (adapted from Ungerleider and Desimone, 1986b). The striate cortex is not shown. Heavy lines indicate the boundaries of sulci. The thin line around the perimeter of the map indicates where the map was “cut” from the rest of the cortex; dashed lines on the perimeter indicate boundaries between the isocortex and the allocortex. The total extent of cortex included in the map is indicated by the shaded region on the lateral view of the brain at the upper left. Sulci (shaded) and sulcal labels are shown on the small map at the upper right. The map at the bottom right shows the location ofcentral (less than lo” eccentricity) and peripheral (greater than 10” eccentricity) visual field representations in areas with established retinotopic organizations (adapted from Colby et al., 1988).
dehyde in 0.1 M phosphate buffer (pH, 7.2). The brain was then removed, and, immediately thereafter, the occipital and temporal cortex were physically flattened in one piece. First, the lips of the superior temporal, lunate, inferior occipital, and occipitotemporal sulci were marked by injecting fluorescent latex beads at regular intervals along their lengths. We then cut off the striate cortex as well as the cortex both in the posterior banks of the lunate and inferior occipital sulci and above and anterior to the superior temporal sulcus. The white matter was dissected away from the remaining cortex, which was then flattened between 2 microscope slides. The slides and tissue were immersed in 10% formalin until the tissue hardened. The flattened cortex was split into 2 blocks, which were sectioned separately at 50 pm in a plane parallel to the pial
surface. Every section through the thickness of the cortex was examined for the presence of labeled fluorescent cells.
Data analysis. For cases 1 and 6, the locations of labeled cells or terminals were plotted onto enlarged photographs of thionin-stained sections at intervals of 1 mm or less. For cases 2-5, optical encoders mounted to the microscope stage were used to enter the section contours and locations of labeled cells into a computerized plotting system and database (Minnesota Datametrics). For all cases (except case 5, which was physically flattened), 2-D unfoldings or “maps” of the cortex were made from wire models using sections spaced 2 mm apart (Gattass and Gross, 198 1; Ungerleider and Desimone, 1986b), according to the prin- ciples described by Van Essen and Maunsell (1980). Intermediate sec-
The Journal of Neuroscience, January 1991, 17(l) 171
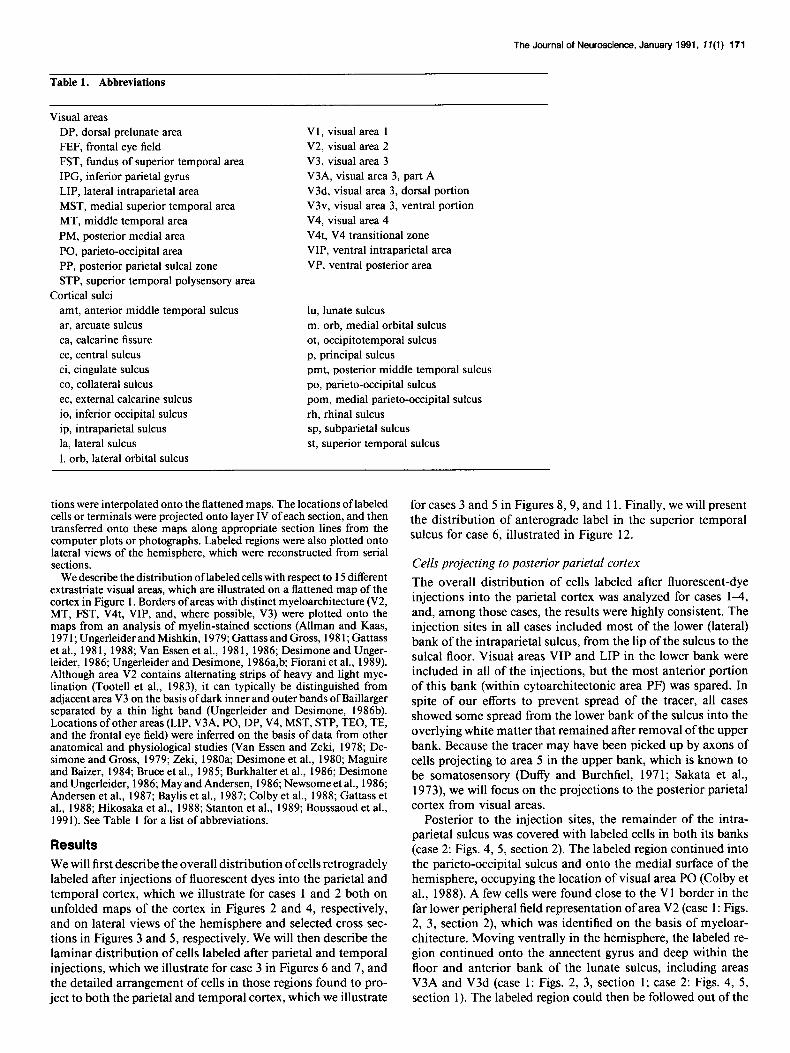
Table 1. Abbreviations
Visual areas DP, dorsal prelunate area FEF, frontal eye field FST, fundus of superior temporal area IPG, inferior parietal gyrus LIP, lateral intraparietal area MST, medial superior temporal area MT, middle temporal area PM, posterior medial area PO, parieto-occipital area PP, posterior parietal sulcal zone STP, superior temporal polysensoty area
Cortical sulci amt, anterior middle temporal sulcus ar, arcuate sulcus ca, calcarine fissure ce, central sulcus ci, cingulate sulcus co, collateral sulcus ec, external calcarine sulcus io, inferior occipital sulcus ip, intraparietal sulcus la, lateral sulcus 1. orb, lateral orbital sulcus
Vl, visual area 1 V2, visual area 2 V3, visual area 3 V3A, visual area 3, part A V3d, visual area 3, dorsal portion V3v, visual area 3, ventral portion V4, visual area 4 V4t, V4 transitional zone VIP, ventral intraparietal area VP, ventral posterior area
lu, lunate sulcus m. orb, medial orbital sulcus ot, occipitotemporal sulcus p, principal sulcus pmt, posterior middle temporal sulcus po, parieto-occipital sulcus porn, medial parieto-occipital sulcus rh, rhinal sulcus sp, subparietal sulcus st, superior temporal sulcus
tions were interpolated onto the flattened maps. The locations of labeled cells or terminals were projected onto layer IV of each section, and then transferred onto these maps along appropriate section lines from the computer plots or photographs. Labeled regions were also plotted onto lateral views of the hemisphere, which were reconstructed from serial sections.
We describe the distribution of labeled cells with respect to 15 different extrastriate visual areas, which are illustrated on a flattened map of the cortex in Figure 1. Borders of areas with distinct myeloarchitecture (V2, MT, FST, V4t, VIP, and, where possible, V3) were plotted onto the maps from an analysis of myelin-stained sections (Allman and Kaas, 197 1: Ungerleider and Mishkin, 1979; Gattass and Gross, 198 1; Gattass et al., 1981, 1988; Van Essen et al., 1981, 1986; Desimone and Unger- leider. 1986: Unaerleider and Desimone. 1986a.b: Fiorani et al.. 1989). Although area v’2 contains alternating strips of heavy and light mye- lination (Tootell et al., 1983), it can typically be distinguished from adjacent area V3 on the basis of dark inner and outer bands of Baillarger separated by a thin light band (Ungerleider and Desimone, 1986b). Locations of other areas (LIP, V3A, PO, DP, V4, MST, STP, TEO, TE, and the frontal eye field) were inferred on the basis of data from other anatomical and physiological studies (Van Essen and Z&i, 1978; De- simone and Gross, 1979; Zeki, 1980a; Desimone et al., 1980; Maguire and Baizer, 1984, Bruce et al., 1985; Burkhalter et al., 1986; Desimone and Unaerleider. 1986: Mav and Andersen. 1986: Newsome et al.. 1986: Anders& et al.,‘1987;‘Baylis et al., 1987; Colbykt al., 1988; Gattass et al., 1988; Hikosaka et al., 1988; Stanton et al., 1989; Boussaoud et al., 199 1). See Table 1 for a list of abbreviations.
Results We will first describe the overall distribution ofcells retrogradely labeled after injections of fluorescent dyes into the parietal and temporal cortex, which we illustrate for cases 1 and 2 both on unfolded maps of the cortex in Figures 2 and 4, respectively, and on lateral views of the hemisphere and selected cross sec- tions in Figures 3 and 5, respectively. We will then describe the laminar distribution of cells labeled after parietal and temporal injections, which we illustrate for case 3 in Figures 6 and 7, and the detailed arrangement of cells in those regions found to pro- ject to both the parietal and temporal cortex, which we illustrate
for cases 3 and 5 in Figures 8,9, and 11. Finally, we will present the distribution of anterograde label in the superior temporal sulcus for case 6, illustrated in Figure 12.
Cells projecting to posterior parietal cortex
The overall distribution of cells labeled after fluorescent-dye injections into the parietal cortex was analyzed for cases 1-4, and, among those cases, the results were highly consistent. The injection sites in all cases included most of the lower (lateral) bank of the intraparietal sulcus, from the lip of the sulcus to the sulcal floor. Visual areas VIP and LIP in the lower bank were included in all of the injections, but the most anterior portion of this bank (within cytoarchitectonic area PF) was spared. In spite of our efforts to prevent spread of the tracer, all cases showed some spread from the lower bank of the sulcus into the overlying white matter that remained after removal of the upper bank. Because the tracer may have been picked up by axons of cells projecting to area 5 in the upper bank, which is known to be somatosensory (Dufi and Burchfiel, 1971; Sakata et al., 1973) we will focus on the projections to the posterior parietal cortex from visual areas.
Posterior to the injection sites, the remainder of the intra- parietal sulcus was covered with labeled cells in both its banks (case 2: Figs. 4, 5, section 2). The labeled region continued into the parieto-occipital sulcus and onto the medial surface of the hemisphere, occupying the location of visual area PO (Colby et al., 1988). A few cells were found close to the Vl border in the far lower peripheral field representation of area V2 (case 1: Figs. 2, 3, section 2), which was identified on the basis of myeloar- chitecture. Moving ventrally in the hemisphere, the labeled re- gion continued onto the annectent gyrus and deep within the floor and anterior bank of the lunate sulcus, including areas V3A and V3d (case 1: Figs. 2, 3, section 1; case 2: Figs. 4, 5, section 1). The labeled region could then be followed out of the

172 Baker et al. * Visual Inputs to Temporal and Parietal Cortex
A Parietal Injection
Case 1
>
5
Figure 2. Case 1: distribution of retrogradely labeled cells following injections of fluorescent dye Bis into parietal cortex and NY into temporal cortex, shown on unfolded maps of cortex. “Cuts” in the map necessary for the unfolding are shown as dot-dashed lines. Injection sites are shown in solid black, and the regions surrounding the injection sites nonspecifically labeled by the injection (“halo”) are shaded. The cortex removed from the upper bank of the intraparietal sulcus is shown in cross-hatching. The visual areas containing labeled cells are indicated on the maps The density of dots indicates the relative density of labeled cells. The heavy dashed lines in the maps indicate some or all of the myeloarchitectural borders of areas V2, V3d, V4t, MT, FST, and VIP. In this case, and the cases shown in the subsequent figures, it was possible to localize the anterior myeloarchitectonic border of V3d for only a few millimeters of its total length. The 5 thin fines (labeled 1-5) running through the maps indicate layer IV contour lines from selected cross-sections whose locations are shown on the lateral views of the brain in Figure 3. Sulcal labels are shown on the small map at the lower left. For all other conventions, see Figure 1.

The Journal of Neuroscience, January 1991, Ii(l) 173
A Parietal Injection (Bid
B Temporal Injection (NY)
mt
Case 1
A Bis cells
A NY cells
Figure 3. Case 1: distribution of labeled cells following injections of Bis into parietal cortex and NY into temporal cortex, shown on cross-sections whose locations are shown on lateral views of hemisphere at top (labeled 1-5) and on unfolded maps in Figure 2. Bis-labeled cells are shown as open triangles, and NY-labeled cells as closed triangles. The density and locations of the triangles indicate, respectively, the relative density and laminar distribution of the labeled cells. Area V 1 on the cross-sections and the V l/V2 border on the lateral views of the hemisphere are indicated with a dashed line. The myeloarchitectural boundaries of areas V2, V3d, V4t, MT, FST, and VIP are indicated with arrows. The thick line through the lateral views of the brain represents the most anterior section unfolded in the maps in Figure 2. The cross-hatching along the upper bank of the intraparietal sulcus on the lateral views shows the location of the ablation. Other conventions are as in Figure 2.
174 Baker et al. - Visual Inputs to Temporal and Parietal Cortex
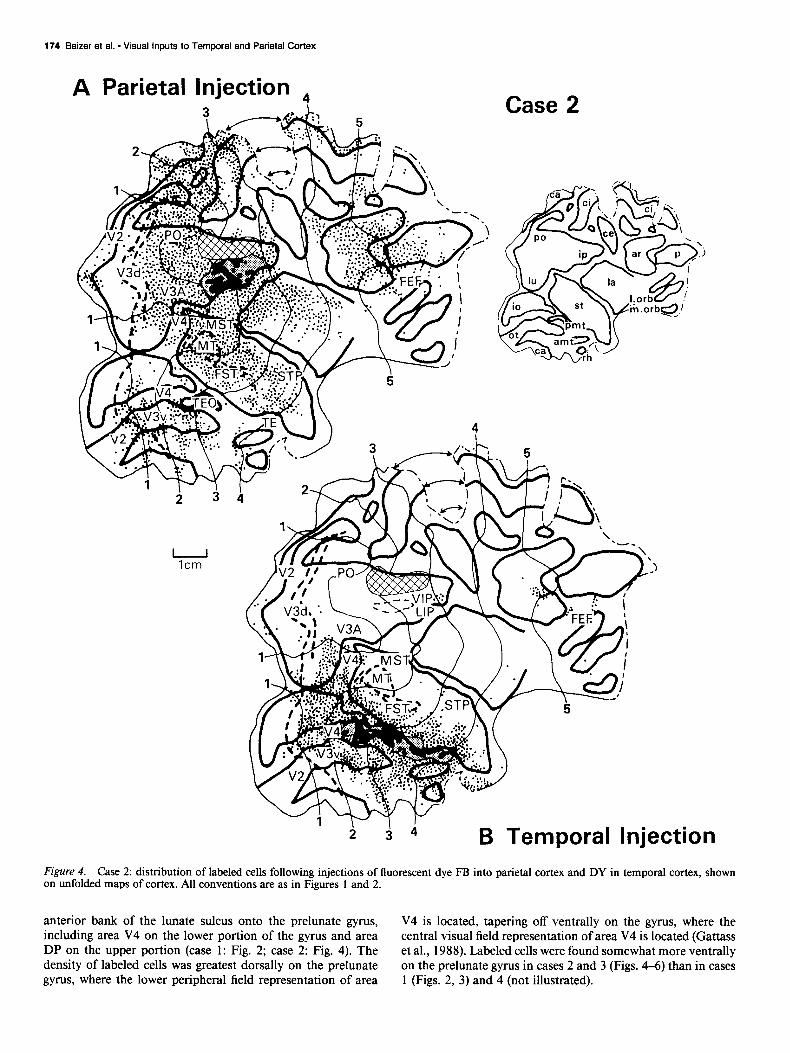
A Parietal Injection 4 Case 2
B Temporal Injection Figure 4. Case 2: distribution of labeled cells following injections of fluorescent dye FB into parietal cortex and DY in temporal cortex, shown on unfolded maps of cortex. All conventions are as in Figures 1 and 2.
anterior bank of the lunate sulcus onto the prelunate gyrus, V4 is located, tapering off ventrally on the gyrus, where the including area V4 on the lower portion of the gyrus and area central visual field representation of area V4 is located (Gattass DP on the upper portion (case 1: Fig. 2; case 2: Fig. 4). The et al., 1988). Labeled cells were found somewhat more ventrally density of labeled cells was greatest dorsally on the prelunate on the prelunate gyrus in cases 2 and 3 (Figs. 4-6) than in cases gyrus, where the lower peripheral field representation of area 1 (Figs. 2, 3) and 4 (not illustrated).

The Journal of Neuroscience, January 1991, 1 f(1) 175
A B Parietal Injection (FBI Temporal Injection (DY)
I I
5mm
rice
Case 2
A FB cells
A DY cells
Figure 5. Case 2: distribution of labeled cells following injections of FB into parietal cortex and DY into temporal cortex, shown on cross-sections whose locations are shown on lateral views of hemisphere at top and on unfolded maps in Figure 4. All conventions are as in Figure 3.
Within the caudal superior temporal sulcus, we identified 1986a,b). Within this portion of the sulcus, both banks were areas MT, FST, and portions of V4t on the basis of myeloar- covered with labeled cells, including area V4t in the lower bank, chitecture (Ungerleider and Mishkin, 1979; Gattass and Gross, area MT in the lower bank and floor, and area MST in the upper 198 1; Van Essen et al., 198 1; Ungerleider and Desimone, bank, just medial to area MT (case 1: Figs. 2, 3, section 2; case
176 Baizer et al. * Visual Inputs to Temporal and Parietal Cortex
Case 3
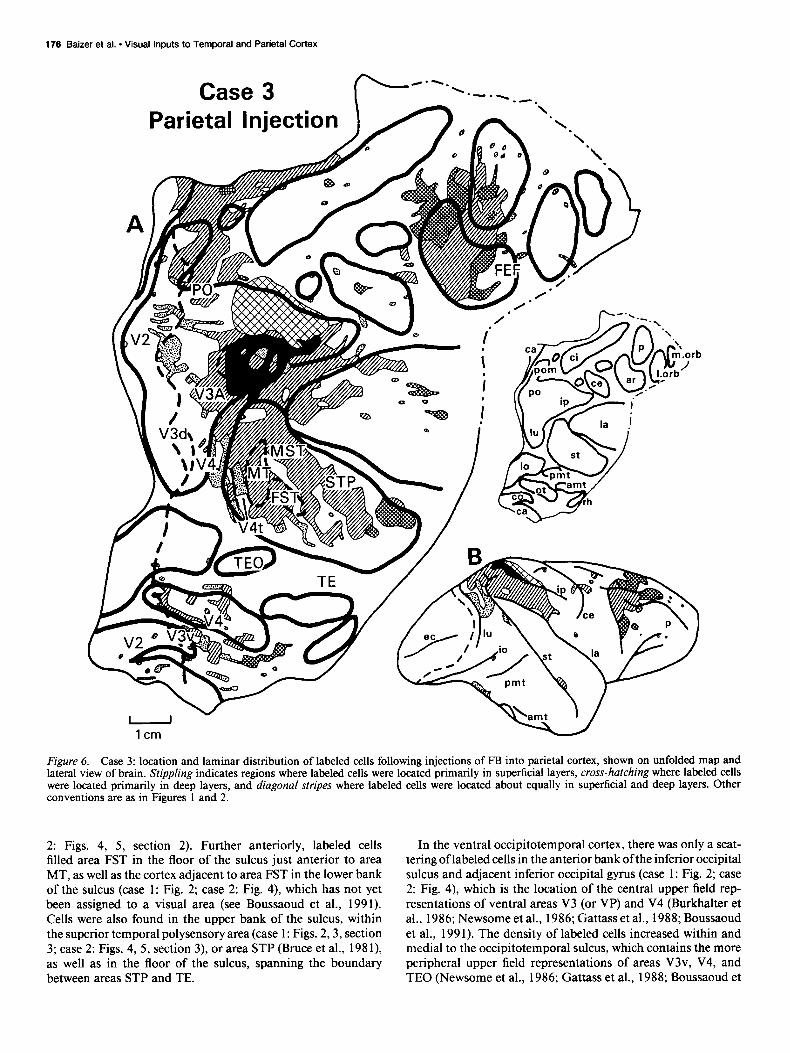
Figure 6. Case 3: location and laminar distribution of labeled cells following injections of FB into parietal cortex, shown on unfolded map and lateral view of brain. Stippling indicates regions where labeled cells were located primarily in superficial layers, cross-hatching where labeled dells were located primarily in deep layers, and diagonal stripes where labeled cells were located about equally in superficial and deep layers. Other conventions are as in Figures 1 and 2.
2: Figs. 4, 5, section 2). Further anteriorly, labeled cells filled area FST in the floor of the sulcus just anterior to area MT, as well as the cortex adjacent to area FST in the lower bank of the sulcus (case 1: Fig. 2; case 2: Fig. 4), which has not yet been assigned to a visual area (see Boussaoud et al., 1991). Cells were also found in the upper bank of the sulcus, within the superior temporal polysensory area (case 1: Figs. 2,3, section 3; case 2: Figs. 4, 5, section 3), or area STP (Bruce et al., 198 l), as well as in the floor of the sulcus, spanning the boundary between areas STP and TE.
In the ventral occipitotemporal cortex, there was only a scat- tering of labeled cells in the anterior bank ofthe inferior occipital sulcus and adjacent inferior occipital gyrus (case 1: Fig. 2; case 2: Fig. 4), which is the location of the central upper field rep- resentations of ventral areas V3 (or VP) and V4 (Burkhalter et al., 1986; Newsome et al., 1986; Gattass et al., 1988; Boussaoud et al., 1991). The density of labeled cells increased within and medial to the occipitotemporal sulcus, which contains the more peripheral upper field representations of areas V3v, V4, and TEO (Newsome et al., 1986; Gattass et al., 1988; Boussaoud et

The Journal of Neuroscience, January 1991, 17(l) 177
al., 1991). We also found cells in the calcarine fissure (case 1: Figs. 2, 3, sections 1, 2; case 2: Figs. 4, 5, sections 1, 2), within the far upper peripheral field representation of area V2 (Gattass et al., 198 1). This emphasis on representations of the peripheral visual field in the ventral regions projecting to the parietal cortex is the same emphasis we observed dorsally in the hemisphere. Further anterior in the ventromedial portion of the hemisphere, there were a few cells on the parahippocampal gyrus at the posterior end of cytoarchitectonic area TF, which is where we and others (Fellernan et al., 1985; Gattass et al., 1988; Bous- saoud et al., 1991) have previously reported preliminary evi- dence for a visual area we termed “VTF” (Boussaoud et al., 199 1). Scattered labeled cells could be followed anteriorly on the parahippocampal gyrus throughout the remainder of area TF and into TH. In all cases, the posterior portion of the pre- subiculum contained a few labeled cells (not illustrated). There were virtually no labeled cells on the lateral surface of the in- ferior temporal gyrus (case 1: Fig. 2; case 2: Fig. 4), in either area TE or the central field representation of area TEO (Desi- mone and Gross, 1979; Boussaoud 1991), nor were there any labeled cells in the entorhinal cortex.
Additional regions that consistently contained labeled cells were the posterior third of the lateral sulcus, the cingulate sulcus and adjacent cingulate gyrus, and the arcuate and principal sulci in the prefrontal cortex, including the frontal eye field (case 1: Figs. 2, 3, section 5; case 2: Figs. 4, 5, section 5).
Cells projecting to inferior temporal cortex The inferior temporal injection sites in cases l-4 included much of area TE, but there was variability in both the size of the injected area and in the extent of area TEO involvement. The injection site in case 1 (Figs. 2, 3) was the smallest of the cases, extending along the inferior temporal gyrus from just anterior to the posterior middle temporal sulcus to just posterior to the anterior middle temporal sulcus. We estimate that there was little or no involvement of area TEO in case 1, but there was some leakage of tracer onto the superficial layers of the superior temporal gyrus, which appeared to result in intrinsic labeling of the adjacent cortex (Fig. 2). In cases 2 (Figs. 4, 5) and 4 (not illustrated), the injection site was considerably more extensive in its anterior-to-posterior extent. Posteriorly, it included the cortex of the posterior middle temporal sulcus, involving area TEO, and anteriorly, it extended to the level of the anterior middle temporal sulcus, that is, almost to the anterior limit of area TE. In case 3 (Fig. 7), the injection site was located primarily anterior to the posterior middle temporal sulcus, that is, within area TE, but one of the injections was placed posterior to the sulcus within the fovea1 representation of area TEO (Boussaoud et al., 199 1). Despite these differences in the size and extent of the injection sites, the distribution of retrograde labeling among the 4 cases was similar.
Beyond the injection sites, labeled cells were found throughout the remainder of the inferior temporal gyrus in all cases, ex- tending anteriorly to include cytoarchitectonic area TG at the tip of the temporal pole and posteriorly to the end of the gyrus, including the remainder of area TEO (case 1: Fig. 2; case 2: Fig. 4). Labeled cells also filled the adjacent lower bank of the su- perior temporal sulcus, which is also contained within cytoar- chitectonic area TE, and continued across the sulcal floor, into the deepest portions of area STP. Posteriorly, there were light accumulations of labeled cells in area FST in the floor of the sulcus in cases 1,3, and 4 (case 1: Fig. 2; case 3: Fig. 7). Medially
Table 2. Area1 distribution of cells projecting to posterior parietal and inferior temporal cortex
Area
Cortical target Areas Areas VIP/LIP TEO/TE
Intermingling of cells
v2 + (P) + (cl v3 + (P) + (4 *
V4 + (P) + (4 **
v4t + (P) + (4 TEO + (P) + (4 *
TE ? + TG + Perirhinal 36 + TF/TH + + *
Presubiculum + + * DP + + *
V3A + PO + MT + MST + FST + + STP + Anterior st + + ** VIP/LIP + ? 7a + FEF + + *
+ indicates the presence of labeled cells in a majority of cases. “c” indicates that the labeled cells were mainly in the central field representation, and “p” indicates that they were mainly in the peripheral field representation. ** indicates a major zone of intermingled labeled cells, and * indicates a minor zone. ? indicates an indeterminate result because the heavy label in the injected region may have masked cells retrogradely labeled with the other tracer. Note that area FST was labeled after both temporal and parietal injections, but that the labeled cells within FST were not intermingled.
in the temporal lobe, labeled cells were found in parahippocam- pal areas TF and TH, and in general, the bulk of the cells were located in more anterior portions of these areas than were the cells labeled after the parietal injections. In all cases, there was heavy labeling medial to the anterior middle temporal sulcus, which extended to the rhinal sulcus into the region identified by Amaral and his colleagues as perirhinal area 36 (Amaral et al., 1987; Insausti et al., 1987). The entorhinal cortex was devoid of label, but all cases showed a scattering of labeled cells in the posterior portion of the presubiculum (case 2: Fig. 5, section 3), which partially overlapped but was more extensive than the portion labeled after the parietal injections.
There were labeled cells in the inferior occipital sulcus, but the extent of the labeled region varied across cases, particularly in areas V2 and V3v. Within this sulcus, area V4 appeared to be the most extensively and consistently labeled area (case 1: Fig. 2; case 2: Fig. 4). In the posterior bank of the sulcus, in cases l-3 but not case 4, there were a few scattered cells within the upper central field representation of area V2, which was identified on the basis of myeloarchitecture (Gattass et al., 198 1; Ungerleider and Desimone, 1986b; Boussaoud et al., 1991). In case 3, there were additional labeled cells in the sulcus just anterior to the border of area V2, within the upper fovea1 field representation ofarea V3v. In contrast to the sparse and variable labeling in ventral V2 and V3, all cases showed dense accu- mulations of labeled cells in the anterior bank of the sulcus, within the upper central field representation of area V4. Anterior

178 Baizer et al. l Visual Inputs to Temporal and Parietal Cortex
Case 3 Temporal Injection
lcm -7
Figure 7. Case 3: locations and laminar distribution of labeled cells following injections of DY into temporal cortex, shown on unfolded map and lateral view of brain. Conventions are as in Figures 1, 2, and 6.
to the sulcus, labeled cells were found in areas V4 and TEO, and, to a lesser extent, in area V3v. The label in these areas was much heavier and more extensive lateral to the occipitotemporal sulcus than medial to it. Thus, in contrast to the results from the parietal injections, the temporal injections appeared to label the central field representations of areas V3v, ventral V4, and TEO more heavily than their peripheral field representations (see Fig. 1).
The labeled region in ventral V4 and TEO could be traced dorsally onto the prelunate gyrus. Labeling was much heavier on the ventral portion of this gyrus, which represents the central
lower field of area V4, than on the dorsal portion, which rep- resents the peripheral lower field (Gattass et al., 1988). Again, this pattern is the opposite pattern of that observed following the parietal injections. In cases 1, 3, and 4 (Figs. 3, 7) but not in case 2 (Fig. 5), the labeled region extended dorsally on the prelunate gyrus into area DP.
Within the caudal superior temporal sulcus, labeled cells were found close to the lip of the posterior bank of the superior temporal sulcus, in areas V4 and V4t. Areas MT and MST were outside the labeled region, but a few cells were seen in area FST.
In contrast to the pattern seen after the parietal injections,

The Journal of Neuroscience, January 1991, 1 f(1) 179
few labeled cells were seen dorsally in other portions of the prestriate cortex. However, in all cases, there were scattered cells in the posterior bank of the lunate sulcus within the central lower field representation of area V2. Cases 1 and 3, but not cases 2 or 4, also had a few labeled cells in dorsal V3.
In the prefrontal cortex, labeled cells were found both in the anterior bank of the arcuate sulcus, within the frontal eye field, and ventral to the principal sulcus (case 1: Figs. 2, 3, section 5; case 2: Figs. 4, 5, section 5). The former labeled region, but not the latter, was contained within the region labeled after the parietal injections.
Comparison of regions projecting to posterior parietal and inferior temporal cortex
A comparison of the distribution of labeled cells following the parietal and temporal injections indicates a remarkable segre- gation of the 2 labeled regions (see Table 2). The parietal in- jections primarily labeled “dorsal stream” areas, such as dorsal prestriate areas V3A and PO and caudal superior temporal sulcal areas MT and MST, whereas the temporal injections primarily labeled “ventral stream” areas, such as area V4. Further, where- as the parietal injections preferentially labeled the peripheral field representations ofareas V2, V3, V4, and TEO, the temporal injections preferentially labeled the central field representations of these areas (see Fig. 1). The major zones of overlapping label appeared to be at the margins of the zones projecting to the parietal and temporal cortex, particularly in portions of the dorsal and ventral parts of area V4, and in portions of the anterior superior temporal sulcus. Minor zones of overlapping label included the frontal eye field and portions of areas V3, DP, TEO, the parahippocampal gyrus, and the presubiculum. A finer analysis of the major zones of overlap will be presented below.
Laminar distribution of labeled cells
Previous studies in the visual cortex of primates have shown that “feedforward” projections (i.e., those from lower-order to higher-order areas) originate mainly from cells in superficial layers and terminate predominantly in layer IV, whereas “feed- back” projections (i.e., those from higher-order to lower-order areas) tend to originate predominantly from cells in deep layers and terminate largely in layers outside of layer IV (e.g., Kuypers et al., 1965; Spatz and Tigges, 1972; Tigges et al., 1973, 1974; Spatz, 1977; Wong-Riley, 1978; Rockland and Pandya, 1979; Wall et al., 1982; Maunsell and Van Essen, 1983a; Weller et al., 1984; Kennedy and Bullier, 1985; Weller and Kaas, 1985; Ungerleider and Desimone, 1986b; Boussaoud et al., 1990). A pattern of projecting cells equally distributed between superficial and deep layers is of indeterminate status. To determine the feedforward or feedback nature of the projections from the var- ious visual areas to the posterior parietal and inferior temporal cortex, we analyzed the laminar distribution of labeled cells.
Because the laminar distributions of labeled cells were so similar across cases 1-4, we have illustrated the distributions for case 3 only. In Figures 6 and 7, the cortex containing labeled cells located primarily in superficial layers (feedforward) is shown with stipple, cortex containing labeled cells nearly equally dis- tributed between the superficial and deep layers (indeterminate) is shown with hatching, and cortex containing labeled cells lo- cated primarily in deep layers (feedback) is shown with cross- hatching.
Following injections into posterior parietal cortex, cells had
a bilaminar distribution in nearly all labeled regions (Fig. 6). Thus, it was not possible from our data to classify most parietal inputs as either feedforward or feedback according to existing schemes. Cells predominating in the superficial layers were seen only in the peripheral field representation of areas V2 (both dorsally and ventrally), V3d, portions of dorsal and ventral V4, and V4t. Cells predominating in the deep layers were seen only in scattered patches in the lateral sulcus, in the rostra1 portion of the upper bank of the superior temporal sulcus (within area STP), and in the principal and arcuate sulci of prefrontal cortex (including parts of the frontal eye field).
Following injections into the inferior temporal cortex, the distribution of labeled cells was bilaminar throughout much of the remainder of areas TE and TEO (Fig. 7). Labeled cells in areas posterior to the injections sites, in dorsal and ventral V2, V3, V4, and V4t, were located predominately in superficial lay- ers, consistent with feedforward input to the inferior temporal cortex. Labeled cells in areas anterior or medial to the injection sites, in TF, TG, and deep within the superior temporal sulcus, were located predominantly in the deep layers, consistent with feedback input to the inferior temporal cortex. Labeled cells within the prefrontal cortex had a bilaminar distribution.
Arrangement of cells in areas projecting to both parietal and temporal cortex As we described in a previous section of the Results, the parietal and temporal injections labeled largely separate regions of the cortex. Even in visual areas that contained cells projecting to both cortical regions, the peripheral field representations tended to project preferentially to the parietal cortex, and the central field representations to the temporal cortex. However, the 2 labeled regions did have zones of overlap, particularly at their margins. One zone of overlap included area V4 and, to a much lesser extent, areas V3 and TEO, especially in their represen- tations of the near periphery. A second zone of overlap was in the lower bank and floor ofthe superior temporal sulcus, anterior to area MT. Other zones included area DP, the arcuate sulcus, the parahippocampal gyrus, and the presubiculum.
That the labeled regions overlapped raised the possibility that there were double-labeled cells, that is, cells projecting to both the parietal and the temporal cortex. In case 1, both tracers were nuclear, and it was therefore not possible to detect double-la- beled cells; however, in cases 24, the parietal tracer FB filled the cytoplasm, whereas the temporal tracer DY filled the nu- cleus, which allowed us to visualize cells projecting to both destinations. Nonetheless, we saw very few double-labeled cells in these cases. Within any cortical area, we rarely found more than 5-l 0 double-labeled cells in a given section. This is evident in Figures 8 and 9, which show representative zones of over- lapping FB- and DY-labeled cells on the prelunate gyrus and in the superior temporal sulcus in case 3 at high magnification. In the sections illustrated, every double-labeled cell we found is marked with an asterisk. In fact, the few double-labeled cells evident from these figures actually overstate their relative pro- portion, as the density of single-labeled cells was too high in these sections to permit marking every one of them. Rather, because heavily labeled areas typically contained hundreds of single-labeled cells in a given section, the FB and DY single- label symbols in the figures indicate relative density. This pau- city of double-labeled cells is consistent with the notion that even in areas of overlap, different cell populations send different visual information into the “dorsal” and “ventral” processing
180 Baker et al. l Visual Inputs to Temporal and Parietal Cortex
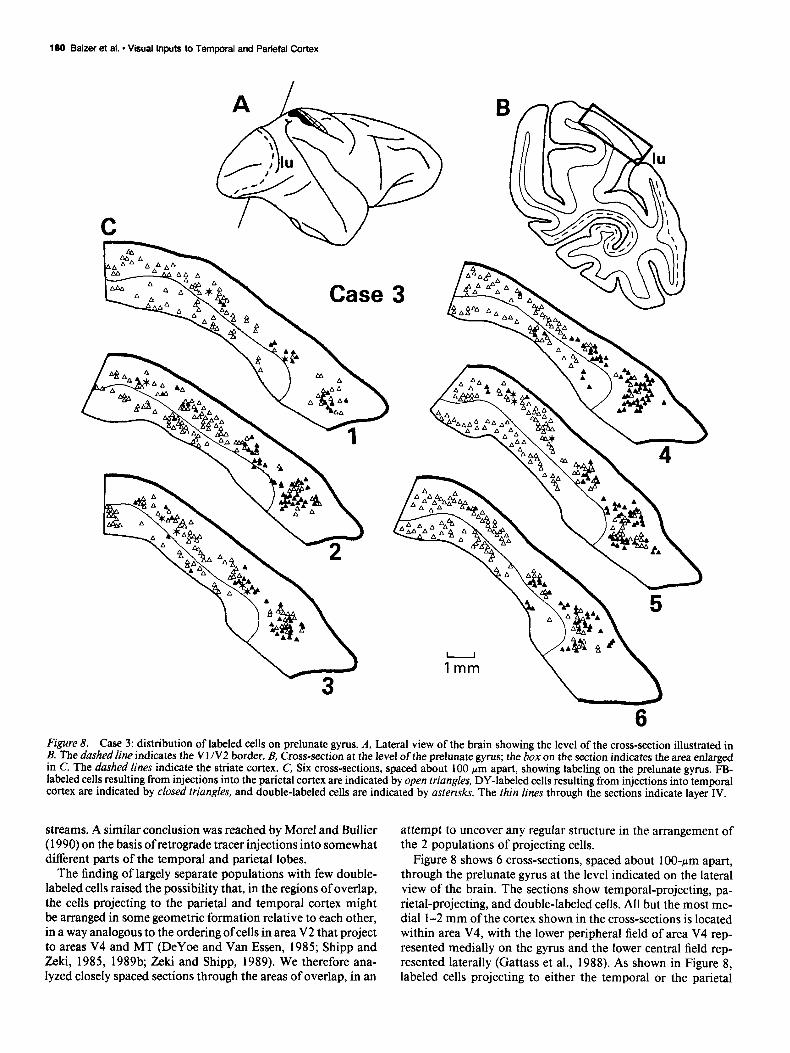
6 Figure 8. Case 3: distribution of labeled cells on prelunate gyrus. A, Lateral view of the brain showing the level of the cross-section illustrated in B. The dashed line indicates the Vl /V2 border. B, Cross-section at the level of the prelunate gyrus; the box on the section indicates the area enlarged in C. The dashed lines indicate the striate cortex. C, Six cross-sections, spaced about 100 hrn apart, showing labeling on the prelunate gyrus. FB- labeled cells resulting from injections into the parietal cortex are indicated by open triangles, DY-labeled cells resulting from injections into temporal cortex are indicated by closed triangles, and double-labeled cells are indicated by asterisks. The thin lines through the sections indicate layer IV.
streams. A similar conclusion was reached by Morel and Bullier (1990) on the basis of retrograde tracer injections into somewhat different parts of the temporal and parietal lobes.
The finding of largely separate populations with few double- labeled cells raised the possibility that, in the regions of overlap, the cells projecting to the parietal and temporal cortex might be arranged in some geometric formation relative to each other, in a way analogous to the ordering of cells in area V2 that project to areas V4 and MT (DeYoe and Van Essen, 1985; Shipp and Z&i, 1985, 1989b; Zeki and Shipp, 1989). We therefore ana- lyzed closely spaced sections through the areas of overlap, in an
attempt to uncover any regular structure in the arrangement of the 2 populations of projecting cells.
Figure 8 shows 6 cross-sections, spaced about 100~pm apart, through the prelunate gyrus at the level indicated on the lateral view of the brain. The sections show temporal-projecting, pa- rietal-projecting, and double-labeled cells. All but the most me- dial 1-2 mm of the cortex shown in the cross-sections is located within area V4, with the lower peripheral field of area V4 rep- resented medially on the gyrus and the lower central field rep- resented laterally (Gattass et al., 1988). As shown in Figure 8, labeled cells projecting to either the temporal or the parietal

The Jcumal of Neuroxienoe. January 1991, 11(l) 181
Figure 9. Case 3: distribution of la- beled cells in depths of superior tem- poral sulcus. A, Lateral view of the brain showing the level of the cross-section illustrated in B. The dashed line indi- cates the VlN2 border. B, Cross-sec- tion at the level of the superior tem- poral sulcus; the box on the section indicates the area enlarged in C. C, Six cross-sections, spaced about 100 rm apart, showing labeling in the superior temporal sulcus. FB-labeled cells re- sulting from injections into the parietal wrtex are indicated by open triangles, DY-labeled cells resulting from tem- poral injections are indicated by closed triangles, and double-labeled cells are. indicated by asterisks. The thin lines through the sections indicate layer IV.
cortex were not evenly distributed across the gyrus, but appeared gross tendency, the 2 populations were largely intermingled, in patches or clumps. Moreover, the medial portion of the gyrus with little evidence of a regular pattern in the labeled zones. (i.e., peripheral field V4) had more cells projecting to the parietal The same conclusion holds for the region of overlap at the cortex than to the temporal cortex, whereas the converse was bottom of the superior temporal sulcus, illustrated in Figure 9. true of the lateral portion (i.e., central field V4). Beyond this As shown, the bottom of the posterior bank of the sulcus had

182 Baizer et al. * Visual Inputs to Temporal and Pariital Cortex
b :*.
l
4 n * a l a
l
I)
0
t #
50pm
Fgure IO. Case 2: photomicrograph showing labeled cells in floor of superior temporal sulcus. Note the random intermingling of FB-labeled cells, resulting from injections into the parietal cortex, with DY-labeled cells, resulting from injections into the temporal cortex. Two double-labeled cells are apparent in the field, one in the bottom center and another above it to the (e/i.
many more cells projecting to the inferior temporal cortex than to the parietal cortex. The floor of the sulcus had about equal numbers of cells projecting to the parietal and temporal cortex (and a few double-labeled cells), and the bottom of the anterior bank had a slight preponderance ofcells projecting to the parietal cortex. As on the prelunate gyrus, the 2 populations appeared patchy and unevenly distributed. but randomly arrayed with respect to each other in the areas of overlap. A photomicrograph demonstrating the intermingling of FB- and DY-labeled cells in the superior temporal sulcus of case 2 is shown in Figure 10.
It still seemed possible that there was some structure to the arrangement of the 2 cell populations that was obscured because ofeither the plane ofsection or the difficulty in precisely aligning sequential sections. Because tangential sections through the cor- tex have proven most useful for revealing such organization in areas VI and V2. we prepared case 5 by physically flattening the cortex and cutting sections that were largely tangential to the pial surface in most of the regions of interest. The injection sites and overall distribution of labeled cells in this case were very similar to those in cases l-4. Representative zones of over- lapping cells on the prelunate gyrus and in the occipitotemporal and superior temporal sulci are shown in Figure I I. The inset in this figure shows the regions from which the 3 high-magni- fication tangential sections were taken. In the section from the prelunate gyrus and adjacent lips of the superior temporal and lunate sulci. which contain visual area V4, the pattern of labeled
cells was very similar to that seen in cross-section in Figure 8. Parietal-projecting cells predominated medially on the gyrus, whereas temporal-projecting cells predominated laterally. Al- though the 2 populations showed some degree of clumping and banding (which was caused, in part, because the section was not perfectly tangential to the cortical layers), the populations ap- peared randomly arrayed with respect to each other in the lim- ited regions of overlap. The section through the occipitotem- poral sulcus and adjacent medial cortex includes area V3v, posteriorly, followed by areas V4, TEO. and, possibly, TE at the anterior edge of the section. In areas V3v, V4, and TEO, the medial cortex contains more peripheral representations of the visual field than the lateral cortex. Laterally, the lateral bank of the occipitotemporal sulcus contained predominantly tem- poral-projecting cells. with a scattering of double-labeled cells. Medially, there were nearly equal proportions of cells projecting to the 2 destinations. As on the prelunate gyrus, the 2 popula- tions showed some clumping and grouping, but there was no clear evidence of a regular relationship.
Finally, the section from the superior temporal sulcus includes cortex that has not yet been assigned to a specific visual area. The cortex shown in Figure I I is located just dorsal to the location of area TEO and anterior to the location of area MT. Because the superior temporal sulcus could not be flattened as well as other areas ofcortex in this case, the section cut unevenly through the layers, which accounts for the bands of cells that

The Journal of Neuroscience, January 1991, 17(l) 183
\ t \ \\ A\\
AA/ L .AAJ
- --
a FB cells
A DY cells 4~ Double-labeled
cells
5mm
lmm
Figure Il. Case 5: arrangement of labeled cells in areas projecting to both the parietal and the temporal cortex. The drawing at center indicates the region of the cortex that was physically flattened and cut tangentially. Dashed boxes indicate the 3 areas that are shown enlarged in A, B, and C. A, The prelunate gyrus and adjacent portions of the lunate and superior temporal sulci; heavy lines indicate the lips of the sulci. B, The lower bank of the superior temporal sulcus. The dot-dashed line in B and C indicates layer 1. C, The occipitotemporal sulcus and adjoining medial cortex. The heuvy lines indicate the lips of the sulcus. m-labeled cells resulting from injections into parietal cortex are indicated by open triangles, DY- labeled cells resulting from injections into temporal cortex are indicated by closed triangles, and double-labeled cells are indicated by asterisks.
184 Baker et al. * Visual Inputs to Temporal and Parietal Cortex
Temporal Injection
B
5mm
Parietal Injection
cam
Y:.->:.T,.. 1 2
-..:.-+.
/ Temporal Injection
..:. st c. :,..:...~.. : ,.; ....,: .;:,,::, '.
&
: ,/A ; .c " .m' : :, 1' ..' :: :. ,.. . : ,, ..?' -
.:.. '.: ..,.', ., :':I.. ,.
3
st ,,.. j. .’
&
,c; : .:..Z::.{ . . .$.!j ,., :::,....:.“ .:
>.: i ::,;: _,.. :: .:. j. :..-:: ;.,. .>:*.>. ,$.::. : :.; y<: ..::;: :‘.:,.y ,,,:,. :: . . . . .., .; :. 3 2mm
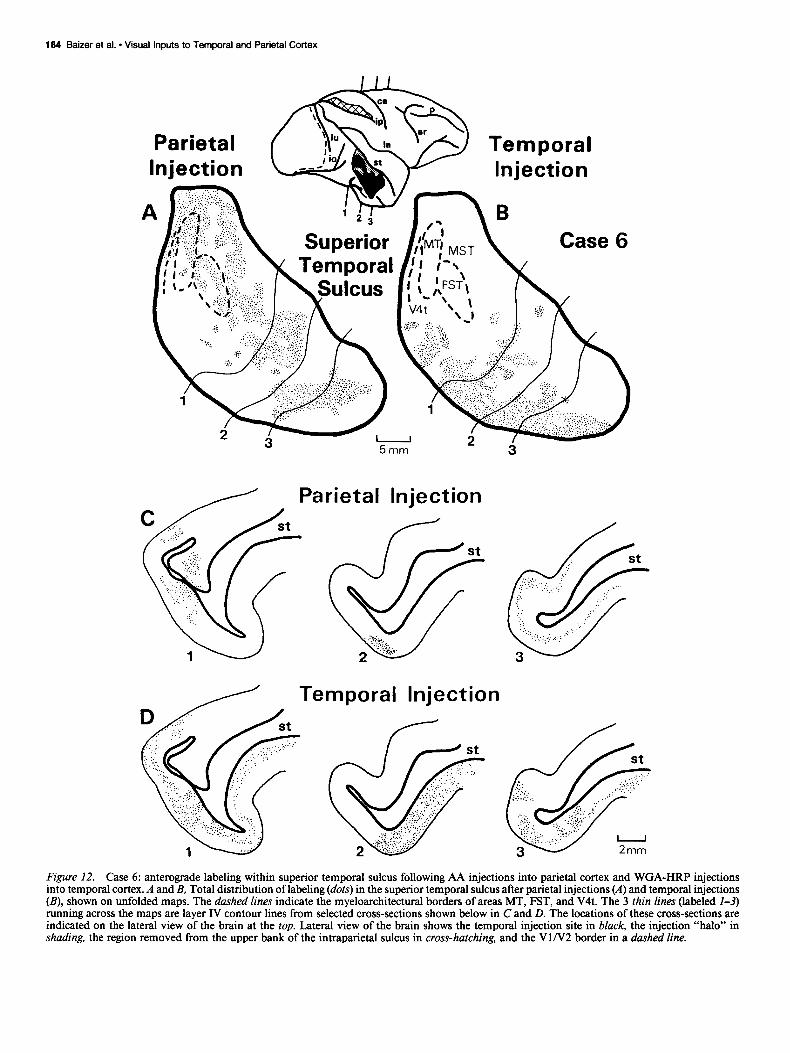
Figure 12. Case 6: anterograde labeling within superior temporal sulcus following AA injections into parietal cortex and WGA-HRP injections into temporal cortex. A and B, Total distribution of labeling (dots) in the superior temporal sulcus after parietal injections (A) and temporal injections (B), shown on unfolded maps. The dashed lines indicate the myeloarchitectural borders of areas MT, FST, and V4t. The 3 thin lines (labeled I-3) running across the maps are layer IV contour lines from selected cross-sections shown below in C and D. The locations of these cross-sections are indicated on the lateral view of the brain at the top. Lateral view of the brain shows the temporal injection site in black, the injection “halo” in shading, the region removed from the upper bank of the intraparietal sulcus in cross-hatching, and the VlN2 border in a dashed line.

The Journal of Neurbscience, January 1991, 1 f(1) 185
can be seen at the medial edge of the section (these are located in layers II/III and V/VI). As in the previous examples, the 2 populations of cells appeared to be largely intermingled.
Convergence of outputs from parietal and temporal cortex
In addition to the inputs to the parietal and temporal cortex, we were also interested in their outputs, specifically in whether the 2 processing streams sent converging projections to the same cortical region. Therefore, in case 6, we utilized WGA-HRP as an anterograde tracer in the temporal cortex and AA in the parietal cortex. The location and extent of the injection sites were very similar to those in the retrograde cases, but the cortical regions containing anterograde label were, in general, more lim- ited in extent than the regions containing dye-labeled cells in the retrograde cases. Because the distribution of cells labeled with WGA-HRP was also more limited than that of cells labeled with the dyes, it appears that fluorescent dyes may be more sensitive tracers than either WGA-HRP or AA.
Although the results from the retrograde cases indicated 2 major regions projecting to both the parietal and the temporal cortex, namely, area V4 and portions of the anterior superior temporal sulcus, the anterograde data from case 6 showed con- verging projections from the parietal and temporal cortex to the superior temporal sulcus only. In V4, the injection of AA into parietal cortex produced anterograde label only in the peripheral field representation, whereas the injection of WGA-HRP into the temporal cortex produced anterograde label only in the cen- tral field representation. As explained above, the limited extent of area V4 labeling from both anterograde tracers, as well as the absence of overlapping label from the 2, may be due to the failure of AA and WGA-HRP to reveal weak backward projec- tions.
The distribution of anterograde label in the superior temporal sulcus is shown in Figure 12. The label from the parietal injec- tion was concentrated in the upper bank, whereas the label from the temporal injection was concentrated in the lower bank, which is the same tendency found in the retrograde cases. Nonetheless, there was overlap of the 2 labels in this case, especially in the floor of the more anterior portions of the sulcus. In the areas of overlap, the labeled terminals from the parietal injection were always heavy in layer IV and thus had the appearance of feed- forward projections (Fig. 12C, sections l-3). The labeled ter- minals from the temporal injection also tended to be concen- trated in layer IV within the areas of overlap (Fig. 120, sections 1, 3), except possibly in the midportions of the sulcus where they had a somewhat more even distribution (Fig. 120, section 2). Thus, much of the region of overlap in the superior temporal sulcus appears to receive feedforward projections from both the parietal and the temporal cortex.
Discussion The present results support the notion of 2 pathways, or “streams,” of information processing in the visual cortex, one that is directed into the posterior parietal cortex, and another directed into the inferior temporal cortex (Ungerleider and Mishkin, 1982). Moreover, the results presented here indicate that these 2 pathways are segregated to a remarkable degree. We will first compare these results with those of previous studies of cortical connections. We will then consider how neuronal properties in the different pathways relate to their parietal or temporal affiliation. Finally, we will focus on the special role of
areas connected with both pathways and their probable partic- ipation in interstream communication.
Projections to posterior parietal cortex
In all cases, the injections were in the lower bank of the intra- parietal sulcus, which includes 2 visual areas that have been termed the ventral intraparietal area, or VIP (Maunsell and Van Essen, 1983a; Ungerleider and Desimone, 1986b) and the lateral intraparietal area, or LIP (Andersen et al., 1985, 1990). These 2 areas largely fall within cytoarchitectonically defined areas POai and POae of Seltzer and Pandya (1980), though some injections were close enough to the cortical surface that cytoar- chitectonic areas 7a and 7b may have been minimally involved as well (see Andersen et al., 1985; Cavada and Goldman-Rakic, 1989). Cells projecting to the parietal cortex were found in pres- triate areas V2, V3, and V4. In area V2, labeled cells were limited to the far peripheral representations of the upper and lower visual field. Likewise, in areas V3 and V4, labeled cells were densest in the peripheral field representations. Cells were also found in dorsal parieto-occipital cortex, including areas PO, V3A, and DP. In the posterior superior temporal sulcus, cells were found within areas MT, MST, and FST. In the more an- terior portions of the sulcus, cells were located predominantly in the upper bank, but also spread across the floor of the sulcus into the lower bank. The upper bank contains area STP, and the lower bank is contained within area TE, with the boundary between the 2 areas somewhere in the floor (Desimone and Gross, 1979; Bruce et al., 1981). In the terminology of Seltzer and Pandya (1978) the labeled region in the anterior portion of the sulcus roughly spanned architectonic areas TAa, TPO, PGa, IPa, and TEa, though the labeled region was not sharply demarcated and did not seem to follow any known area1 bound- aries. Cells were also found ventromedially in the temporal lobe both on the parahippocampal gyrus in area TF and in the pre- subiculum. In the frontal lobe, cells were found in the superior and inferior limbs of the arcuate sulcus, and, more sparsely, in the principal sulcus.
Projections from several visual areas to the intraparietal sul- cus have been described previously. A projection from the pre- lunate portion of area V4 to area LIP is well established (Seltzer and Pandya, 1980; Rockland and Pandya, 198 1; Felleman and Van Essen, 1983; Andersen et al., 1990), as are the projections from area MT to area VIP (Maunsell and Van Essen, 1983a; Ungerleider and Desimone, 1986b) and from area PO to both area VIP and area LIP (Andersen et al., 1990; see also Colby et al., 1988). Recently, Boussaoud et al. (1990) reported projec- tions from areas MST and FST in the superior temporal sulcus to areas VIP and LIP, and several studies have noted a projec- tion from area V3 to the intraparietal sulcus (Burkhalter and Van Essen, 1983; Felleman and Van Essen, 1984; Andersen et al., 1990; Morel and Bullier, 1990). Projections from the pe- ripheral representation of area V2 to the intraparietal sulcus have also been noted in preliminary reports (Ungerleider et al., 1983; Van Essen, 1985).
Do the physiological properties of neurons in areas projecting to the parietal cortex suggest the kind of visual information that reaches the parietal lobe? One likely modality of information in the dorsal pathway is motion, as areas MT, MST, FST, and STP all contain many cells sensitive to direction of motion either in the frontal plane, in depth, or in both (Dubner and Zeki, 1971; Bruce et al., 1981; Van Essen et al., 198 1; Maunsell and Van Essen, 1983b,c; Albright, 1984; Desimone and Ungerleider,

186 Baker et al. - Visual Inputs to Temporal and Parietal Cortex
1986; Saito et al., 1986; Tanaka et al., 1986) and all send projections to the intraparietal sulcus. Cells in some of these areas are also known to be sensitive to binocular disparity (Zeki, 1974; Newsome and Wurtz, 1981; Maunsell and Van Essen, 1983~) and cells in at least area MST appear to play a role in visuomotor control (Komatsu and Wurtz, 1988). All of these sources of information are consistent with a role of the parietal cortex in visuospatial functions.
Projections to inferior temporal cortex The injections in all cases included the lateral surface of area TE and, except possibly for case 1, encroached on the fovea1 representation of area TEO as well (Iwai and Mishkin, 1968, 1969; Desimone and Gross, 1979; Boussaoud et al., 1991). Labeled cells were located throughout the remainder of both area TEO and area TE, including the portions of area TE located within the superior temporal sulcus. Other temporal lobe areas containing labeled cells included area FST at the fundus of the superior temporal sulcus anterior to area MT, area TG at the temporal pole, areas TF and TH on the parahippocampal gyrus, and the presubiculum. In the prestriate cortex, labeled cells were found in areas V4, V4t, DP, and, to a much lesser extent, in the fovea1 representation of area V2 and the central field represen- tations of areas V3d and V3v. In the frontal lobe, a few labeled cells were located in the superior and inferior limbs of the an- terior bank of the arcuate sulcus, that is, within the frontal eye field, and ventral to the principal sulcus. No labeled cells were seen in either dorsal prestriate areas V3A or PO, or in the motion-sensitive areas MT and MST of the superior temporal sulcus.
Previous HRP studies of the projections to area TE showed a more restricted region of input, with labeled cells located in areas V4 and TEO but not in areas V2 or V3 (Desimone et al., 1980; Shiwa, 1987). The difference between those studies and the present one is probably accounted for by the fact that our dye injections encroached on area TEO, whereas the HRP in- jections in the earlier studies were limited to area TE. Consistent with this explanation, several reports have described direct pro- jections from areas V2 and V3 to area TEO (Fenstemaker et al., 1984; Shiwa, 1987; Morel and Bullier, 1990). A further difference may be the greater sensitivity of fluorescent dyes, used in the present study, compared to HRP, especially as employed by Desimone et al. (1980) without tetramethyl benzidine as the chromagen. Yet, even with massive dye injections into the tem- poral cortex, we found only light accumulations of labeled cells in area V3 and still fewer cells in area V2. Finally, our study is in agreement with earlier ones on the absence of projections from more dorsal prestriate areas, including area MT, to the inferior temporal cortex (Desimone et al., 1980; Maunsell and Van Essen, 1983a; Ungerleider and Desimone, 1986b).
The properties of neurons in areas projecting to the inferior temporal cortex are consistent with the role of the temporal lobe in object recognition. Besides area TEO, which was involved in nearly all of the injection sites, the primary source of inputs to area TE from the prestriate cortex is area V4. Cells in area V4 are sensitive to many visual features relevant to object percep- tion, including color, spatial frequency, orientation, length, and width (e.g., Zeki, 1980b; Desimone and Schein, 1987; Youakim and Baizer, 1987; Schein and Desimone, 1990). Moreover, lesions of area V4 produce impairments in both form and color vision (Wild et al., 1985; Heywood and Cowey, 1987; Desimone et al., 1990).
Laminar organization of projections Numerous anatomical studies in primates have demonstrated that cortical projections directed away from the primary visual cortex tend to originate with cells in the supragranular layers and to terminate preferentially in layer IV, whereas projections directed back toward the primary visual cortex tend to originate with cells primarily or exclusively in the infragranular layers and to terminate in layers outside of layer IV (Kuypers et al., 1965; Spatz and Tigges, 1972; Tigges et al., 1973, 1974; Spatz, 1977; Wong-Riley, 1978; Rockland and Pandya, 1979; Wall et al., 1982; Maunsell and Van Essen, 1983a; Weller et al., 1984; Kennedy and Bullier, 1985; Weller and Kaas, 1985; Ungerleider and Desimone, 1986b). The terms “forward” or “feedforward” have been used for the former pattern of projection and the terms “backward” or “feedback” have been used for the latter. Thus, projections from lower-order visual areas to higher-order ones exhibit the feedforward type of laminar pattern, whereas projections from higher-order visual areas to lower-order ones exhibit the feedback type of laminar pattern. In addition to feedforward and feedback connections, Maunsell and Van Essen (1983a) first used the term “intermediate” to describe connec- tions that were not clearly forward or backward, in that either the laminar pattern varied from one patch of label to another within a given area, or the terminals were homogeneously dis- tributed in all layers including layer IV. In one such projection, from area MT to area V4, the cells of origin were mainly in the supragranular layers, but the laminar pattern of terminations varied from one patch of label to another (Maunsell and Van Essen, 1983a; Ungerleider and Desimone, 1986b). Maunsell and Van Essen (1983a) suggested that the intermediate type of lam- inar pattern characterizes connections between areas located at the same hierarchical level. Based on these 3 laminar patterns, the multiple extrastriate visual areas in the macaque can be arranged in a hierarchical order (Maunsell and Van Essen 1983a; Van Essen and Maunsell, 1983; Weller et al., 1984; Ungerleider and Desimone, 1986b; Colby et al., 1988; Andersen et al., 1990).
More recently, we and others have found that many cortical projections originate from both superficial and deep layers, in nearly equal proportions (Fellernan and Van Essen, 1989; Bous- saoud et al., 1990). Some of these bilaminar projections ter- minate predominatly in layer IV, typical of “forward” projec- tions, while others appear to terminate in layers I and VI, typical of “backward” ones. Thus retrograde data in the absence of anterograde data are particularly difficult to evaluate.
In the present study, our retrograde data from inferior tem- poral injections fit the original classification scheme, in that projections from the prestriate cortex to the temporal cortex originated predominantly from supragranular layers, whereas projections from more anterior zones, such as the temporal pole, originated predominantly from infragranular layers. By contrast, most of our retrograde data from parietal injections were am- biguous, in that nearly all labeled regions showed a bilaminar arrangement. Portions of areas V2 (in the peripheral field rep- resentation), V3d, V4t, and V4 contained labeled cells that were located predominantly in superficial layers, consistent with a forward projection to the parietal cortex, but even in these areas, this pattern was not universal.
Recently, Andersen et al. (1990) used both retrograde and anterograde data to examine the hierarchical organization of posterior parietal areas. Their retrograde data, like ours, showed that many of the areas projecting to the parietal cortex have

The Journal of Neuroscience, January 1991, 17(l) 187
their cells of origin in both superficial and deep layers. Their anterograde data suggested, however, that, relative to area LIP, prestriate areas V3, V3A, MT, and V4 are at a lower hierarchical level, areas DP and PO are at the same level, and area STP is at a higher level. These results are consistent with those of the present study.
Areas projecting to both parietal and temporal cortex
One area providing inputs to both pathways was area V4, though there was a tendency for zones in area V4 labeled by the temporal and parietal injections to avoid each other. Labeled cells re- sulting from the parietal injections were located primarily dor- sally on the prelunate gyrus and medially in the occipitotemporal cortex, whereas cells labeled from the temporal injections were located primarily ventral on the prelunate gyrus and laterally in the occipitotemporal cortex. According to the visuotopic map of area V4 of Gattass et al. (1988) the labeled cells projecting to the parietal cortex were located predominantly in the pe- ripheral field representation of area V4, whereas the cells pro- jecting to the temporal cortex were located predominantly in the central visual field representation. Maguire and Baizer (1984) reported a representation of the vertical meridian on the pre- lunate gyms at about the level at which Gattass et al. (1988) placed the dorsal border of area V4. Posterior and medial to the vertical meridian representation was another representation of the lower quadrant (called area PM). From the results of the present study, this area, like area DP, appears to project heavily to the parietal and sparsely to the temporal cortex.
Notwithstanding the partial segregation of temporal and pa- rietal projecting zones in area V4, in any given section, cells projecting to one or the other of the 2 pathways were found in interspersed clumps or patches. Surprisingly, these patches did not form an obvious geometric pattern that we could reconstruct from either coronal or tangential sections. This result is remi- niscent of the result of Andersen et al. (1985) comparing the distribution of cells in area 7a projecting across the callosum with those projecting to the prefrontal cortex. They found the 2 populations of cells to be randomly arranged with respect to each other. This is in contrast to the order found in area V2 for the 2 cell populations projecting to areas MT and V4, which are arrayed in an orderly way that is in register with the cyto- chrome oxidase patterns (DeYoe and Van Essen, 1985; Shipp and Zeki, 1985, 1989b; Zeki and Shipp, 1989).
Although it is easy to imagine how the neuronal properties that have been described in area V4 would contribute to object vision, it is less clear how they might contribute to spatial vision. Yet, the segregation of V4 cells projecting to the parietal and temporal cortex, in conjunction with the paucity of double- labeled cells, suggests that area V4 contains 2 distinct popula- tions of cells, one of which processes information that is indeed useful for spatial vision. This finding is consistent with the re- sults of studies by DeYoe et al. (1988) and Zeki and Shipp (1989) who reported that some of their injections of retrograde tracers in area V4 labeled primarily the thin-stripe regions of area V2, whereas other, nearby injections labeled the interstripe regions. Although there is no reason to believe that the zones in area V4 that receive segregated inputs from the thin and interstripe regions of area V2 are related in any way to the zones that send segregated outputs to the temporal and parietal cortex, the 2 results together suggest a rich functional architecture in area V4, which may be as rich as that in areas V 1 and V2.
Another source of dual inputs to the parietal and temporal
cortex was the cortex of the anterior superior temporal sulcus, primarily in the floor and adjacent portions of both banks. At its most posterior extent, the region included area FST in the floor of the sulcus, though this region tended to be only lightly labeled from the temporal injections. Anteriorly, the dual-pro- jecting region was more extensive, spanning the boundary be- tween areas STP and TE in the floor of the sulcus. In the ter- minology of Seltzer and Pandya (1978) this region included architectonic areas IPa, PGa, and TEa, but the zone of overlap was not sharply delimited and did not follow any known area1 boundaries. Morel and Bullier (1990) have also reported that this portion of the anterior superior temporal sulcus sends pro- jections to both the parietal and the temporal cortex. Interest- ingly, our results from case 6 (Fig. 12) show that layer IV in this part of the sulcus receives converging inputs from both the parietal and the temporal cortex, indicating that this region receives feedforward projections from the 2 systems and sends feedback projections in turn (also see Seltzer and Pandya, 1978). Furthermore, this region at the boundary of areas STP and TE also receives heavy projections from area 7a on the inferior parietal gyrus (Andersen et al., 1990) as well as from areas MST and FST (Boussaoud et al., 1990). Thus, strictly from an ana- tomical point of view, the anterior superior temporal sulcus is in a position to integrate information from many sources, as originally proposed by Jones and Powell (1970).
Connections of central versus peripheral visual field representations
Zeki (1980a) first noted that area V3A in the dorsal prestriate cortex received inputs from the far peripheral field represen- tation of area V 1 but not the central field representation. Later, on the basis of the connections of areas V 1, V2, MT, and V4, Ungerleider and Desimone (1986b) and Ungerleider et al. (1986) proposed that the peripheral field representations of many visual areas send projections “preferentially” into the dorsal pathway. Consistent with this notion, visual area PO, which lies at the junction of the dorsal prestriate and posterior parietal cortex, has a visual field representation with an enlarged representation of the periphery and which receives inputs heavily dominated by the peripheral visual field representation of other visual areas (Colby et al., 1988; see also Covey et al., 1982). The results from the present study also strongly support this principle and, in addition, suggest that the temporal pathway receives pref- erential inputs from the central visual field representations.
These anatomical results would appear to explain the results from a behavioral study of Mishkin and Ungerleider (1982) who found that the peripheral visual field makes an unexpect- edly large contribution to the visuospatial functions of the pos- terior parietal cortex. In that study, monkeys with lesions of the central but not the peripheral field representation of area V 1 were impaired on pattern discrimination, as are monkeys with inferior temporal lesions; by contrast, monkeys with lesions of either central or peripheral representations of area V 1 were about equally impaired on the landmark task, a test of spatial vision that is also sensitive to the effects of posterior parietal lesions (Pohl, 1973).
Although, to our knowledge, there have been no reports of major differences in neuronal properties in the central versus peripheral field representations of prestriate visual areas, this issue has never been explicitly addressed. There is, however, physiological evidence that the central and peripheral visual fields are processed differently in the posterior parietal cortex,
188 Baker et al. - Visual Inputs to Temporal and Parietal Cortex
as compared to the temporal cortex. In the parietal cortex, many receptive fields include the far peripheral visual field, and some bilateral fields even have a “doughnut” shape that excludes the fovea (Motter and Mountcastle, 198 1; Motter et al., 1987). This strong sensitivity to peripheral field stimulation may serve an “alerting” function for orienting attention or the eyes to pe- ripheral stimuli. In fact, the “early” anatomical inputs to dorsal stream areas from peripheral Vl and V2 may reduce neuronal response latencies of parietal neurons to peripheral stimuli, which would facilitate such orientation. In contrast to these parietal properties, neurons in inferior temporal area TE respond more strongly to fovea1 stimuli than to peripheral ones (Gross et al., 1972; Desimone et al., 1984). This fovea1 sensitivity is presum- ably related to the crucial role inferior temporal neurons play in pattern discrimination.
“Magna” versus “parvo” systems
Livingstone and Hubel (1988) have suggested that the dorsal and ventral streams actually derive from the “magno” and “par- vo” systems, respectively. In their view, the magno system un- derlies the perception of depth, motion, figure-ground segre- gation, and “linking operations,” whereas the parvo system underlies the perception of fine pattern and color. This scheme shares some similarities with the dorsal versus ventral scheme, except that it probably attributes more functions to the magno system than are usually attributed to the dorsal stream. Infor- mation in the magno system appears to flow preferentially along a pathway that involves the magnocellular layers of the lateral geniculate nucleus, layers 4Ccu and 4B of the striate cortex, the thick cytochrome oxidase stripes of area V2, and areas V3d and MT. Information in the parvo system flows preferentially along a pathway that involves the parvocellular layers of the lateral geniculate nucleus, layers 4Cp and 2-3 of the striate cortex, the thin stripe and interstripe regions of area V2, and area V4 (for reviews, see DeYoe and Van Essen, 1988; Livingstone and Hu- bel, 1988; Desimone and Ungerleider, 1989). The present results are consistent with this notion of magno and parvo “roots” for the dorsal and ventral streams, insofar as the inferior temporal cortex receives information from area V4, and the posterior parietal cortex receives information from area MT and other areas involved in processing depth and motion. However, we believe it is unlikely that all of the information that reaches the parietal and temporal cortex can be traced back to specific lam- inar systems of the lateral geniculate nucleus. There are nu- merous anatomical interconnections between areas of the mag- no and parvo systems at nearly all levels, including the striate cortex (for references, see DeYoe and Van Essen, 1988; Desi- mone and Ungerleider, 1989). Even area V4, an area typically associated with the parvo system, sends projections to both the parietal and the temporal cortex, albeit not equally. Thus, it seems unlikely that either the parietal or the temporal cortex would be completely deafferented following a lesion of the mag- nocellular or parvocellular layers of the lateral geniculate nu- cleus. Consistent with this, Schiller et al. (1990) have recently found that lesions of neither the magnocellular layers alone nor the parvocellular layers alone impair low spatial frequency stere- opsis or coarse shape discrimination.
References Albright TD (1984) Direction and orientation sensitivity of neurons
in visual area MT of the macaque. J Neurophysiol 52: 1106-l 130. Allman JM, Kaas JH (1971) A representation of the visual field in
the caudal third of the middle temporal gyrus of the owl monkey @lotus trivirgatus). Brain Res 31:85-105.
Amaral DC, Insausti R, Cowan WM (1987) The entorhinal cortex of the monkey: I. Cytoarchitectonic organization. J Comp Neurol 264: 326-355.
Andersen RA (1989) Visual and eye movement functions of the pos- terior parietal cortex. Annu Rev Neurosci 12:377-403.
Andersen RA, Asanuma C, Cowan WM (1985) Callosal and prefrontal associational projecting cell populations in area 7A of the macaque monkey: a study using retrogradely transported fluorescent dyes. J Comp Neurol232:443-455.
Andersen RA, Essick GK, Siegel RM (1987) Neurons of area 7 acti- vated by both visual stimuli and oculomotor behavior. Exp Brain Res 67:316-322.
Andersen RA, Asanuma C, Essick G, Siegel RM (1990) Cortico-cor- tical connections of anatomically and physiologically defined subdi- visions within the inferior parietal lobule. J Comp Neural 296:65- 113.
Baizer JS, Ungerleider LG, Desimone R (1988) Organization of visual projections to parietal and temporal cortex in the macaque. Sot Neu- rosci Abstr 14: 11.
Baylis CC, Rolls ET, Leonard CM (1987) Functional subdivisions of temporal lobe neocortex. J Neurosci 7:330-342.
Boussaoud D, Ungerleider LG, and Desimone R (1990) Pathways for motion analysis: cortical connections of the medial superior tem- poral and fundus of the superior temporal visual areas in the macaque. J Comp Neural 296:462-495.
Boussaoud D, Desimone R, Ungerleider LG (199 1) Visual topography of area TEO in the macaque. J Comp Neurol, in press.
Bruce CJ, Desimone R, Gross CC (198 1) Visual properties of neurons in a polysensory area in superior temporal sulcus of macaque. J Neu- rophysiol 46:369-384.
Bruce CJ, Goldberg ME, Stanton GB, Bushnell MC (1985) Primate frontal eye fields: II. Physiological and anatomical correlates of elec- trically evoked eye movements. J Neurophysiol 54:714-734.
Burkhalter A, Van Essen DC (1983) The connections of the ventral posterior area (VP) in the macaque monkey. Sot Neurosci Abstr 9: 153.
Burkhalter A, Felleman DJ, Newsome WT, Van Essen DC (1986) Anatomical and physiological asymmetries related to visual areas V3 and VP in macaque extrastriate cortex. Vision Res 26:63-80.
Cavada C, Goldman-Rakic PS (1989) Posterior parietal cortex in rhe- sus monkey: I. Parcellation of areas based on distinctive limbic and sensory corticocortical connections. J Comp Neural 287:39342 1.
Colby CL, Gattass R, Olson CR, Gross CC (1988) Topographical organization of cortical afferents to extrastriate visual area PO in the macaque: a dual tracer study. J Comp Neurol 269:3924 13.
Covey ER, Gattass R, Gross CC (1982) A new visual area in the parieto-occipital sulcus of the macaque. Sot Neurosci Abstr 8:68 1.
Cowan WM, Gottleib DI, Hendrickson AE, Price JL, Woolsey TA (1972) The autoradiographic demonstration of axonal connections in the central nervous system. Brain Res 37:2 l-5 1.
Desimone R, Gross CC (1979) Visual areas in the temporal cortex of the macaque. Brain Res 178:363-380.
Desimone R, Schein SJ (1987) Visual properties of neurons in area V4 of the macaque: sensitivity to stimulus form. J Neurophysio157: 835-868.
Desimone R, Ungerleider LG (1986) Multiple visual areas in the caudal superior temporal sulcus of the macaque. J Comp Neural 248: 164-189.
Desimone R, Ungerleider LG (1989) Neural mechanisms of visual processing in monkeys. In: Handbook of neuropsychology, Vol 2 (Boller F, Grafman J, eds), pp 267-299. Amsterdam: Elsevier.
Desimone R, Fleming J, Gross CC (1980) Prestriate afferents to in- ferior temporal cortex: an HRP study. Brain Res 184:41-55.
Desimone R, Albright TD, Gross CC, Bruce C (1984) Stimulus se- lective properties of inferior temporal neurons in the macaque. J Neurosci 4:205 l-2062.
Desimone R, Schein SJ, Moran J, Ungerleider LG (1985) Contour, color, and shape analysis beyond the striate cortex. Vision Res 25: 441-452.
Desimone R, Li L, Lehky S, Ungerleider LG, Mishkin M (1990) Effects of V4 lesions on visual discrimination performance and on responses of neurons in inferior temporal cortex. Sot Neurosci Abstr 16:62 1.
DeYoe EA, Van Essen DC (1985) Segregation of efferent connections
The Journal of Neuroscience, January 1991, 1 f(1) 189
and receptive field properties in visual area V2 ofthe macaque. Nature 317:58-61.
DeYoe EA, Van Essen DC (1988) Concurrent processing streams in monkey visual cortex. Trends Neurosci 11:2 19-226.
DeYoe EA, Felleman DJ, Knierim JJ, Olavarria J, Van Essen DC (1988) Heterogeneous subregions of macaque visual area V4 receive selective projections from V2 thin-stripe and interstripe subregions. Invest Ophthalmol Vis Sci 29: 115.
Dubner R, Zeki S (197 1) Response properties and receptive fields in an anatomically defined region of the superior temporal sulcus in the monkey. Brain Res 35:528-532.
Dulfy FH, Burchfiel JL (197 1) Somatosensory system: organizational hierarchy from single units in monkey area 5. Science 172:273-275.
Felleman DJ, Van Essen DC (1983) The connections of area V4 of macaque monkey extrastriate cortex. Sot Neurosci Abstr 9: 153.
Felleman DJ, Van Essen DC (1984) Cortical connections of area V3 in macaque extrastriate cortex. Sot Neurosci Abstr 10:933.
Felleman DJ, Van Essen DC (1989) Distributed hierarchical process- ing in macaque visual cortex. Sot Neurosci Abstr 15: 16 1.
Felleman DJ, DeYoe EA, Van Essen DC (1985) Two topographically organized visual areas in ventral extrastriate cortex of macaque. Sot Neurosci Abstr 11: 1246.
Felleman DJ, Knierim JJ, Van Essen DC (1986) Multiple topographic and nontopographic subdivisions of the temporal lobe revealed by the connections of area V4 in macaques. Sot Neurosci Abstr 12: 1182.
Fenstemaker SB, Olson CR, Gross CG (1984) Afferent connections of macaque visual areas V4 and TEO. Invest Ophthalmol Vis Sci 25: 213.
Fiorani M Jr, Gattass R, Rosa MGP, Sousa APB (1989) Visual area MT in the Cebus monkey: location, visuotopic organization, and variability. J Comp Neurol 287:98-l 18.
Fitzpatrick D, Lund JS, Blasdel GG (1985) Intrinsic connections of macaque striate cortex: afferent and efferent connections of lamina 4C. J Neurosci 5:3324-3349.
Gallyas F (1979) Silver staining of myelin by means of physical de- velopment. Neurol Res 1:203-209.
Gattass R, Gross CG (198 1) Visual topography ofthe striate projection zone (MT) in posterior superior temporal sulcus of the macaque. J Comp Neurol46:621-638.
Gattass R, Gross CG, Sandell JH (198 1) Visual topography of V2 in the macaque. J Comp Neurol20 1:5 19-540.
Gattass R, Sousa APB, Gross CG (1988) Visuotopic organization and extent of V3 and V4 of the macaque. J Neurosci 8:1831-1845.
Gibson AR, Hansma DI, Houk JC, Robinson FR (1984) A sensitive low artifact TMB procedure for the demonstration of WGA-HRP in the CNS. Brain Res 298:235-24 1.
Gross CG, Rocha-Miranda CE, Bender DB (1972) Visual properties of neurons in inferotemporal cortex of the macaque. J Neurophysiol 35:96-l 11.
Haxby JV, Grady CL, Horwitz B, Schapiro MB, Carson RE, Ungerleider LG. Mishkin M. Herscovitch P. Friedland RP. Raoooort SI (1988) Mapping two visual pathways in man with regionalcerebral‘blood flow (rCBF) as measured by positron emission tomography (PET) and H,150. Sot Neurosci Abstr 14:750.
Heywood CA, Cowey A (1987) On the role of cortical area V4 in the discrimination of hue and pattern in macaque monkeys. J Neurosci 7:2601-2617.
Hikosaka K, Iwai E, Saito H, Tanaka K (1988) Polysensory properties of neurons in the anterior bank of the caudal superior temporal sulcus of the macaque monkey. J Neurophysiol60: 16 15-l 637.
Hubel DH, Livingstone MS (1987) Segregation of form, color and stereopsis in primate area 18. J Neurosci 7:3378-34 15.
Hubel DH, Wiesel TN (1972) Laminar and columnar distribution of geniculo-cortical fibers in the macaque monkey. J Comp Neurol 146: 42 1450.
Insausti R, Amaral DG, Cowan WM (1987) The entorhinal cortex of the monkey: II. Cortical afferents. J Comp Neurol 264:356-395.
Iwai E. Mishkin M (1968) Two visual foci in the temooral lobe of monkeys. In: Neurophysiological basis of learning and behavior (Yoshii N, Buchwald NA, eds), pp l-l 1. Osaka: Osaka UP.
Iwai E, Mishkin M (1969) Further evidence on the locus of the visual area in the temporal lobe of the monkey. Exp Neurol 25:585-594.
Jones EG, Powell TPS (1970) An anatomical study of converging sensory pathways within the cerebral cortex of the monkey. Brain 93: 793-820.
Kennedy H, Bullier J (1985) A double labeling investigation of the afferent connectivity of cortical areas Vl and V2 of the macaque monkey. J Neurosci 5:28 15-2830.
Komatsu H, Wurtz RH (1988) Relation of cortical areas MT and MST to pursuit eye movements. I. Localization and visual properties of neurons. J Neurophysiol 60:580-603.
Kuypers HGJM, Szwarcbart MK, Mishkin M, Rosvold HE (1965) Occipitotemporal corticocortical connections in the rhesus monkey. Exp Neurol 11:245-262.
Livingstone MS, Hubel DH (1984) Anatomy and physiology of a color system in the primate visual cortex. J Neurosci 4:309-356.
Livingstone MS, Hubel DH (1987a) Connections between layer 4B of area 17 and the thick cytochrome oxidase stripes of area 18 in the squirrel monkey. J Neurosci 7:337 l-3377.
Livingstone MS, Hubel DH (1987b) Psychophysical evidence for sep- arate channels for the perception of form, color, movement, and depth. J Neurosci 7:34 16-3468.
Livingstone MS, Hubel DH (1988) Segregation of form, color, move- ment and depth: anatomy, physiology and perception. Science 240: 740-749.
Lund JS (1973) Organization of neurons in the visual cortex, area 17, of the monkey (Mucacu muluttu). J Comp Neurol 147:455496.
Lund JS, Boothe RG (1975) Interlaminar connections and pyramidal neuron organization in the visual cortex, area 17, of the macaque monkey. J Comp Neurol 159:305-334.
Maguire WM, Baizer JS (1984) Visuotopic organization of the pre- lunate gyrus in rhesus monkey. J Neurosci 4: 1690-l 704.
Maunsell JHR, Newsome WT (1987) Visual processing in monkey extrastriate cortex. Annu Rev Neurosci 10:363-40 1.
Maunsell JHR, Van Essen DC (1983a) The connections of the middle temporal visual area (MT) and their relationship to a cortical hier- archy in the macaque monkey. J Neurosci 3:2563-2586.
Maunsell JHR, Van Essen DC (1983b) Functional properties of neu- rons in the middle temporal visual area of the macaque monkey. I. Selectivity for stimulus direction, speed and orientation. J Neuro- physiol 49:1127-l 147.
Maunsell JHR, Van Essen DC (1983~) Functional properties of neu- rons in the middle temporal visual area of the macaque monkey. II. Binocular interactions and sensitivity to binocular disparity. J Neu- rophysiol 49:1148-l 167.
May JG, Andersen RA (1986) Different patterns of corticopontine projections from separate cortical fields within the inferior parietal lobule and dorsal prelunate gyrus of the macaque. Exp Brain Res 63: 265-278.
Mishkin M, Ungerleider LG (1982) Contribution of striate inputs to the visuospatial functions of parieto-preoccipital cortex in monkeys. Behav Brain Res 6157-77.
Morel A, Bullier J (1990) Anatomical segregation of two cortical visual pathways in the macaque monkey. Vis Neurosci 4:555-578.
Motter BC. Mountcastle VB (1981) The functional moperties of the light-sensitive neurons of the posterior parietal cortex studied in wak- ing monkeys: fovea1 sparing and opponent vector organization. J Neurosci 1:3-26.
Motter BC, Steinmetz MA, Duffjl CJ, Mountcastle VB (1987) Func- tional properties of parietal visual neurons: mechanisms of direc- tionality along a single axis. J Neurosci 7: 154-l 76.
Newcombe F, Ratcliff G, Damasio H (1987) Dissociable visual and spatial impairments following right posterior cerebral lesions: clinical, neuropsychological and anatomical evidence. Neuropsychologia 25: 149-161.
Newsome WT, Wurtz RH (198 1) Response properties of single neu- rons in the middle temporal visual area (MT) of alert macaque mon- keys. Sot Neurosci Abstr 71832.
Newsome WT, Maunsell JHR, Van Essen DC (1986) Ventral posterior visual area of the macaque: visual topography and area1 boundaries. J Comp Neuro1252: 139-153.
Pohl W (1973) Dissociation of spatial discrimination deficits following frontal and parietal lesions in monkeys. J Comp Physiol Psycho1 82: 227-239.
Rockland KS, Pandya DN (1979) Laminar origins and terminations of cortical connections of the occipital lobe in the rhesus monkey. Brain Res 179:3-20.
Rockland KS, Pandya DN (198 1) Cortical connections of the occipital lobe in the rhesus monkey: interconnections between areas 17, 18, 19 and the superior temporal sulcus. Brain Res 2 12:249-270.

190 Baker et al. * Visual Inputs to Temporal and Parietal Cortex
Rosene DL, Roy NJ, Davis BJ (1986) A cryoprotection method that Ungerleider LG, Mishkin M (1979) The striate projection zone in the facilitates cutting frozen sections of whole monkey brains for histo- superior temporal sulcus ofh4acaca mulatta: location and topograph- logical and histochemical processing without freezing artifact. J His- tochem Cvtochem 34: 130 l-l 3 15.
ic organization. J Comp Neurol 188:347-366. Unaerleider LG. Mishkin M (1982) Two cortical visual svstems. In:
Saito H, Y&e M, Tanaka K, Hikosaka K, Fukada Y, Iwai E (1986) Integration of direction signals of image motion in the superior tern: poral sulcus of the macaque monkey. J Neurosci 6: 145-l 57.
Sakata H, Takahora Y, Kawarasaki A, Shibutani H (1973) Somato- sensory properties of neurons in the superior parietal cortex (area 5) of the rhesus monkey. Brain Res 64:85-102.
Schein SJ, Desimone R (1990) Spectral properties of V4 neurons in the macaque. J Neurosci 10:3369-3389.
Schiller PH, Logothetis NK, Charles ER (1990) Functions of the col- our-opponent and broad-band channels of the visual system. Nature 343:68-70.
Analysis of visual behavior (Ingle DJ, Goodale MA, Mansfield RJW, eds), pp 549-586. Cambridge, MA: MIT Press.
Ungerleider LG, Gattass R, Sousa APB, Mishkin M (1983) Projections of area V2 in the macaque. Sot Neurosci Abstr 9: 152.
Ungerleider LG, Desimone R, Moran J (1986) Asymmetry of cortical and peripheral field inputs from area V4 into the temporal and parietal lobes of the macaque. Sot Neurosci Abstr 12: 1182.
Van Essen DC (1985) Functional organization of primate visual cor- tex. In: Cerebral cortex, Vol3 (Jones EG, Peters A, eds), pp 259-329. New York: Plenum.
Van Essen DC, Maunsell JHR (1980) Two-dimensional maps of the cerebral cortex. J Comp Neurol 19 1:255-28 1.
Van Essen DC, Maunsell JHR (1983) Hierarchical organization and functional streams in the visual cortex. Trends Neurosci 6:370-375.
Van Essen DC, Z&i SM ( 1978) The topographic organization of rhesus monkey prestriate cortex. J Physiol (Lond) 277:193-226.
Van Essen DC, Maunsell JHR, Bixby JL (198 1) The middle temporal visual area in the macaque: myeloarchitecture, connections, func- tional properties and topographic organization. J Comp Neurol 199: 293-326.
Seltzer B, Pandya DN (1978) Afferent cortical connections and ar- chitectonics of the superior temporal sulcus and surrounding cortex in the rhesus monkey. Brain Res 149: l-24.
Seltzer B, Pandya DN (1980) Converging visual and somatic sensory cortical input to the intraparietal sulcus in the rhesus monkey. Brain Res 192:339-35 1.
Shipp S, Z&i S (1985) Segregation of pathways leading from area V2 to areas V4 and V5 of macaque monkey visual cortex. Nature 3 15: 322-325.
Shipp S, Zeki S (1989a) The organization ofconnections between areas V5 and Vl in macaque monkey visual cortex. Eur J Neurosci 1:309- 332.
Shipp S, Zeki S (1989b) The organization ofconnections between areas V5 and V2 in macaque monkey visual cortex. Eur J Neurosci 1:333- 354.
Shiwa, T (1987) Corticocortical projections to the monkey temporal lobe with particular reference to the visual processing pathways. Arch Ital Biol 125: 139-l 54.
Spatz WB (1977) Topographically organized reciprocal connections between areas 17 and MT (visual area of superior temporal sulcus) in the marmoset Callithrix jacchus. Exp Brain Res 27:559-572.
Spatz WB, Tigges J (1972) Experimental-anatomical studies on the “middle temporal visual area (MT)” in primates. I. Efferent cortico- cortical connections in the marmoset Callithrixjacchus. J Comp Neu- rol 146:45 1464.
Stanton GB, Deng S-Y, Goldberg ME, McMullen NT (1989) Cytoar- chitectural characteristic of the frontal eye fields in macaque monkeys. J Comp Neurol282:415427.
Tanaka M, Weber H, Creutzfeldt OD (1986) Visual properties and spatial distribution of neurones in the visual association area on the prelunate gyrus of the awake monkey. Exp Brain Res 65: 1 l-37.
T&es J, Spatz WB, Tigges M (1973) Reciprocal point-to-point con- nections between parastriate and striate cortex in the squirrel monkey. J Comp Neurol 148:48 1490.
Tigges J, Spatz WB, Tigges M (1974) Efferent cortico-cortical fiber connections of area 18 in the squirrel monkey (Saimiri). J Comp Neurol 158:219-236.
Tootell REH, Silverman MS, DeValois RL, Jacobs GH (1983) Func- tional organization of the second visual area in primates. Science 220~737-739.
Ungerleider LG, Desimone R (1986a) Projections to the superior tem- poral sulcus from the central and peripheral field representations of Vl and V2. J Comp Neurol248:147-163.
Ungerleider LG, Desimone R (1986b) Cortical connections of visual area MT in the macaque. J Comp Neuro1248: 190-222.
Van Essen DC, Newsome WT, Maunsell JHR, Bixby JL (1986) The projections from striate cortex (V 1) to areas V2 and V3 in the macaque monkey: asymmetries, area1 boundaries, and patchy connections. J Comp Neurol 244:45 1480.
Wall JT, Symonds LL, Kaas JH (1982) Cortical and subcortical pro- jections of the middle temporal area (MT) and adjacent cortex in Galagos. J Comp Neurol 2 11: 193-2 14.
Weller RE (1988) Vision within extrageniculate striate systems. In: Progress in brain research, Vol 75 (Hicks PP, Benedek G, eds), pp 293-306. New York: Elsevier.
Weller RE, Kaas JH (1985) Cortical projections of the dorsolateral visual area in owl monkeys: the prestriate relay to inferior temporal cortex. J Comp Neurol 234:35-59.
Weller RE, Wall JT, Kaas JH (1984) Cortical connections of the mid- dle temporal visual area (MT) and the superior temporal sulcus in owl monkeys. J Comp Neurol228:81-104.
Wild, HM, Butler SR, Carden D, Kulikowski JJ (1985) Primate cor- tical area V4 important for colour constancy but not wavelength discrimination. Nature 3 13: 133-l 35.
Wong-Riley M (1978) Reciprocal connections between striate and prestriate cortex in squirrel monkey as demonstrated by combined peroxidase histochemistry and autoradiography. Brain Res 147: 159- 164.
Youakim M, Baizer JS (1987) Response properties of neurons in the prelunate gyrus of the awake macaque monkey. Invest Ophthalmol Vis Sci [Suppl] 28: 126.
Zeki SM (1974) Cells responding to changing image size and disparity in the cortex of the rhesus monkey. J Physiol (Lond) 242:827-841.
Zeki SM (1980a) A direct projection from area Vl to area V3A of rhesus monkey visual cortex. Proc R Sot Lond [Biol] 207:499-506.
Z&i SM (1980b) The representation of colours in the cerebral cortex. Nature 284:412418.
Zeki S, Shipp S (1989) Modular connections between areas V2 and V4 of macaque monkey visual cortex. Eur J Neurosci 1:494-506.