original article expression of cell-cycle regulators is ... · prolactinomas and cell-cycle 3247...
TRANSCRIPT
Int J Clin Exp Pathol 2016;9(3):3245-3255www.ijcep.com /ISSN:1936-2625/IJCEP0021009
Original Article Expression of cell-cycle regulators is associated with invasive behavior and poor prognosis in prolactinomas
Chunhui Liu1,2*, Weiyan Xie1,2*, Dan Wu3, Zhenye Li2, Chuzhong Li1,2, Yazhuo Zhang1,2
1Beijing Neurosurgical Institute, Capital Medical University, Beijing, China; 2Beijing Tiantan Hospital, Capital Medical University, Beijing, China; 3Department of Neurology, Beijing Renhe Hospital, Beijing, China. *Equal con-tributors.
Received December 2, 2015; Accepted February 13, 2016; Epub March 1, 2016; Published March 15, 2016
Abstract: Prolactinomas are the most common pituitary tumors. The mechanisms of cell-cycle regulators underlying their invasive biological behavior and poor prognosis have not yet been fully clarified. We classified 48 human pro-lactinomas as invasive or non-invasive and determined cyclin D1, cyclin E1, p16, p27, Cdk2 and Cdk4 expression by immunohistochemistry analysis of tissue microarray constructs. Then we determined the diagnostic and prognostic value of the cell-cycle regulators expression in human prolactinomas. In this proof of principle study we found that nuclear p16 and p27 expression levels were much lower in invasive prolactinomas compared with non-invasive prolactinomas. Meanwhile, significantly higher cyclin D1 and cyclin E1 expression in invasive prolactinomas com-pared with normal pituitary or non-invasive prolactinomas. No difference was found in Cdk2 or Cdk4 protein levels in invasive or non-invasive prolactinomas. Regarding clinical outcome, the expression ratios of cyclin D1/p16 and cyclin E1/p27 were significantly positively correlated with clinically inferior outcome (P<0.001), while Cdk2 or Cdk4 expression showed no relationship with clinical outcome. Our findings indicate that the expression ratios of cyclin D1/p16 and cyclin E1/p27 are associated with invasion and clinic outcome of prolactinomas. We demonstrate the utility of combined histological analyses of prolactinomas for reliable prediction of tumor invasiveness and recur-rence potential.
Keywords: Cell cycle, prolactinomas, neoplasm invasiveness, tissue array analysis
Introduction
Pituitary tumors, which arise from adenohy-pophyseal cells, are one of the most com- mon intracranial tumors with a prevalence of 1/1,500, with prolactinomas being the most common hormone-secreting pituitary adeno-mas [1-4]. Pituitary tumors are invariably be- nign, but cause significant morbidity through mass effects and/or inappropriate secretion of pituitary hormones. Further, pituitary tumors often invade the sphenoid, cavernous sinus, or the dura mater, and can be aggressive, with a high proliferation rate and short time to postop-erative recurrence [1-4]. Predicting pituitary tumor behavior remains a challenge [6-8]. In pathological studies, increased levels of Ki-67 and proliferating cell nuclear antigen (PCNA), P53 and pituitary transforming tumor gene (PTTG) have been found in invasive prolactino-
mas. However, these markers have not yet been correlated with clinical outcome [9-15].
In cancer, the most common mutations occur in cell cycle regulatory genes, potentially leading to uncontrolled tumor growth and progression. Elucidation of cell cycle pathways involved in carcinogenesis may aid cancer management by increasing diagnostic and prognostic accuracy. Several studies have reported the prognostic value of cell cycle regulators in patients with urothelial, breast and adrenal cancers [16-20].
Furthermore, recent molecular analyses of hu- man pituitary neoplasias have revealed deregu-lation of the cell cycle during pituitary tumori-genesis, as indicated by altered cyclin-depen-dent kinase (CDK) regulation and suppression of Cdk inhibitory mechanisms [21]. Cyclin D1 and cyclin E1 are often overexpressed in pitu-itary tumors and exhibit allelic imbalance in
Prolactinomas and cell-cycle
3246 Int J Clin Exp Pathol 2016;9(3):3245-3255
some tumor samples [22, 23]. Cyclin-dependent kinase inhibitor 2A (CDKN2A or p16INK4a) and cyclin-dependent kinase inhibitor 1B (CDKN1B or p27) are members of a protein family that specifically inhibits cyclin D-dependent kinas-es. Cyclin D1-induced activation of CDKs (and in particular Cdk4) causes phosphorylation of retinoblastoma protein (pRB) and subsequent release of E2F transcription factors, which in- duces expression of genes required for G1/S phase transition [24]. During normal pituitary development, progenitor cell cycle exit is con-trolled by p27Kip1 in differentiated cells [25].
Recent molecular analysis shows that compo-nents of the p16/cyclin D1/Cdk4 or p27/cyclin E1/Cdk2 pathway are frequently altered in pitu-itary adenomas [26-28]. Despite the critical role of cell-cycle deregulation during pituitary tumorigenesis, the prognostic value of cell-cycle regulators and proliferative markers in terms of prolactinomas aggressiveness and recurrence potential remains unclear.
The objective of the present study was to id- entify potentially useful markers of biological behavior in prolactinomas. To identify markers of invasion and clinical outcome in pituitary tumors, we used 48 human prolactinomas carefully classified into invasive and non-inva-sive through radiology using magnetic reso-nance imaging (MRI) and histology alongside the post-surgical outcome of the 48 patients [29-31]. Patient characteristics (age, sex, pre-operative plasma prolactin levels), tumor char-acteristics (size, invasion, pathological classifi-cation), and clinical outcome were assessed from retrospective data with postsurgical fol-low-up. We selected cell cycle regulators includ-ing cyclin D1, cyclin E1, p21, p27, Cdk2 and Cdk4, in an attempt to establish correlations and/or associations with clinical post-surgical outcome.
Patients and methods
Patients
We selected 48 patients who underwent pitu-itary surgery at Beijing Tiantan Hospital from 2008 to 2012 with plasma PRL levels >200 ng/ml and only PRL immunostaining (plurihor-monal prolactin tumors being excluded). Pa- tients include that: 1) Resistant to dopamine; 2) who can’t tolerate dopamine therapy. The dopamine resistance was defined as previously
published [32]. The medical therapy was inter-rupted at least 2 months before surgery. This study were reviewed and approved by ethics committee of Beijing Tiantan Hospital affiliated to Capital Medical University (KY2013-015-02). Tumor size was determined by MRI before surgery. Tumors were classified as microadeno-mas (diameter, <1 cm), macroadenomas (>1 cm and <4 cm), and giant adenomas (>4 cm). Tumor invasion was evaluated from the pre-operative MRI for all patients. Postoperative follow-up time ranged from 2.5 to 7 years (mean: 4.8 years). Patients showing no clinical or hormonal (PRL<30 ng/ml) symptoms and no radiological remnant were considered in remis-sion. Persistent disease was defined as incre-ased plasma levels of prolactin with or without a mass visible by radiology. Tumoral recurrence was defined as radiological evidence of tumor regrowth. Tumor grade was based on the fol-lowing criteria: Invasion was defined as histo-logical and/or radiological (MRI) signs of cav-ernous or sphenoid sinus invasion. Proliferation was considered positive based on the presence of at least two of the following three criteria: Ki-67 (≥3%); Mitoses: n>2/10 HPF; P53: posi-tive (>10 strongly positive nuclei/10 HPF). The five tumor grades were: Grade 1a: non-invasi- ve tumor; Grade 1b: non-invasive proliferative tumor; Grade 2a: invasive tumor; Grade 2b: invasive and proliferative tumor.
Tumor samples and tissue microarray con-struction
Formalin-fixed paraffin-embedded tissue blo- cks were sliced and haematoxylin and eosin stained (H&E) slides were produced. Three core biopsies with a 2.0-mm diameter were selected from the paraffin-embedded tissue. The cores were transferred to TMAs using the Minico- re tissue-arraying instrument (Mitogen, UK). Samples were randomly ordered and anony-mized on the TMA slides. Tissue microarrays were cut into 4 µm sections using a serial microtome. To minimize loss of antigenicity, the microarray slide was processed within one week of cutting.
Immunohistochemistry (IHC) techniques and antibodies
All TMA slides were evaluated in advance using an H&E stain to assess tumor content and qual-ity. The TMAs were placed in the Leica BOND-III

Prolactinomas and cell-cycle
3247 Int J Clin Exp Pathol 2016;9(3):3245-3255
arrayer (Leica Biosystems, Germany), which is a fully automated, random and con-tinuous access slide-staining system that processes IHC tests simultaneously. BondTM Polymer Refine Detection HE (Leica Biosystems, Germany) was used for detection of primary antibodies. Immu- nostains were standardized using appropriate positive and negative controls for each antibody. All TMAs were stained in the same run for each antibody to avoid inter-assay variability. The slides were digitally scanned and expression was examined using Aperio AT2 (Leica Bio- systems, Germany). The fol-lowing antibodies were us- ed: Ki-67 (ab15580, 1/100; Abcam, Cambridge, UK); p53 (ab179477, 1/100; Abcam); Cyclin D1 (ab21699, 1/100; Abcam); Cyclin E1 (ab9517, 1/30; Abcam); p16 (ab54- 210, 1/1500; Abcam); p27 (ab32304, 1/500; Abcam); Cdk2 (ab77671, 1/600; Ab- cam); Cdk4 (ab108357, 1/ 400; Abcam). The optimal titer of primary antibodies was determined based on pre-experiment results. The results were calculated using Aperio AT2 with digital slide viewing software. The per-centage of immunostaining and the staining intensity (0, negative; 1+, weak; 2+, mod-erate; and 3+, strong) were recorded. An H-score was calculated using the follow-ing formula: H-score = (% cells 1+) + 2*(% cells 2+) + 3*(% cells 3+). The maximum H-score was 300, corresp- onding to 100% of cells with strong intensity.
Statistical analysis
Results are presented as means ± SD or median (inter-
Table 1. Patient clinical and pathological characteristics
No of patients
Age at Surgery (years)
SexPreoperative
plasma prolactin levels (g/liter)
Tumorsize Grades
Follow-up time from surgery
(years)/outcome1 48 M 256 Giant 2b 7/persistence2 30 M 359 Macro 2a 7/recurrence3 51 M 187 Giant 2a 7/recurrence4 31 M 320 Giant 2a 6.5/persistence5 44 F 200 Giant 2a 6/recurrence6 23 M 330 Giant 2a 6/persistence7 41 F 258 Giant 2b 4.5/recurrence8 45 M 320 Giant 2a 6/persistence9 45 M 5361 Giant 2a 5.5/persistence10 46 M 252 Macro 2a 4.5/persistence11 31 M 975 Giant 2a 5/persistence12 18 M 3193 Giant 2a 4.5/persistence13 48 M 928 Giant 2b 4.5/recurrence14 48 F 261 Giant 2a 4/persistence15 43 F 160 Giant 2a 4/remission16 40 M 5128 Giant 2a 4/recurrence17 43 M 181 Giant 2a 4/recurrence18 46 F 170 Giant 2a 4/recurrence19 35 M 3705 Giant 2a 4/persistence20 43 M 2849 Gacro 2a 4/persistence21 29 F 233 Gacro 2a 4/remission22 35 F 187 Giant 2a 5/remission23 14 F 541 Giant 2a 2.5/recurrence 24 34 M 440 Micro 1a 3.5/persistence25 40 M 160 Macro 1a 6/remission26 29 F 216 Giant 1a 4/remission27 27 M 230 Giant 1a 4/persistence28 43 F 205 Macro 1b 4/remission29 45 F 197 Macro 1a 5/remission30 58 M 1076 Macro 1a 5/recurrence31 30 F 211 Micro 1a 4/remission32 59 M 899 Macro 1a 5/persistence33 61 F 167 Macro 1a 5/remission34 47 M 1288 Macro 1a 5/recurrence35 33 F 208 Macro 1a 6/remission36 25 F 174 Micro 1a 6/remission37 38 F 230 Macro 1a 3/remission38 31 F 159 Macro 1a 5.5/remission39 26 M 535 Macro 1a 5.5/persistence40 46 F 180 Macro 1a 5.5/recurrence41 47 M 2543 Macro 1a 5.5/recurrence42 33 F 216 Macro 1a 5.5/remission43 49 F 170 Macro 1a 5/remission44 38 M 176 Macro 1a 6/recurrence45 26 F 178 Macro 1a 3/remission46 38 F 189 Macro 1a 7/remission47 62 M 446 Macro 1b 3/persistence48 45 M 188 Micro 1a 2.5/remissionF, female; M, male.
Prolactinomas and cell-cycle
3248 Int J Clin Exp Pathol 2016;9(3):3245-3255
quartile range), depending on data distribution; proportions and frequencies were used for cat-egorical variables. Differences in categorical variables among groups were analyzed by the Chi-squared test. For the comparison of con-tinuous variables one-way ANOVA followed by Newman-Keuls test was used. A P-value of ≤0.05 was considered statistically significant.
Results
Patient and tumor characteristics
Patient clinical features are summarized in Table 1. The study population was composed of 48 patients (22 women and 26 men). The mean age at surgery was 39.3 ± 10.7 years (range 14-62 years) and the mean preoperati- ve plasma prolactin level was 775.7 g/liter (range, 159-5187 g/liter). Based on the MRI data, 4 (8.3%) patients had microadenomas, 23 (47.9%) had macroadenomas and the remaining 21 (43.8%) had giant adenomas. As shown in Table 1, at the end of the follow-up period, 18 patients (37.5%) were in remission, 16 patients (33.3%) had persistent disease, while 14 patients (29.2%) had recurrence. Post-operative follow-up ranged from 2.5-7 years (mean 4.8 years). Fifteen patients with non-invasive tumors (grades 1a and 1b) had gone into remission (15 of 25), 5 had persistent dis-ease, and 5 had recurrent disease. In the in- vasive subgroup (grades 2a and 2b), 3/23 patients were in remission, 11 had persistent cancer, and 9 had recurrent disease. Therefore, 14 patients (29.2%) had tumors that recurred or progressed under treatment, and 34 patients (70.8%) were considered either cured or in remission at the end of follow-up.
Expression of cyclin D1, cyclin E1, P16, P27, Cdk2 and Cdk4 in normal pituitary and inva-sive/non-invasive prolactinomas
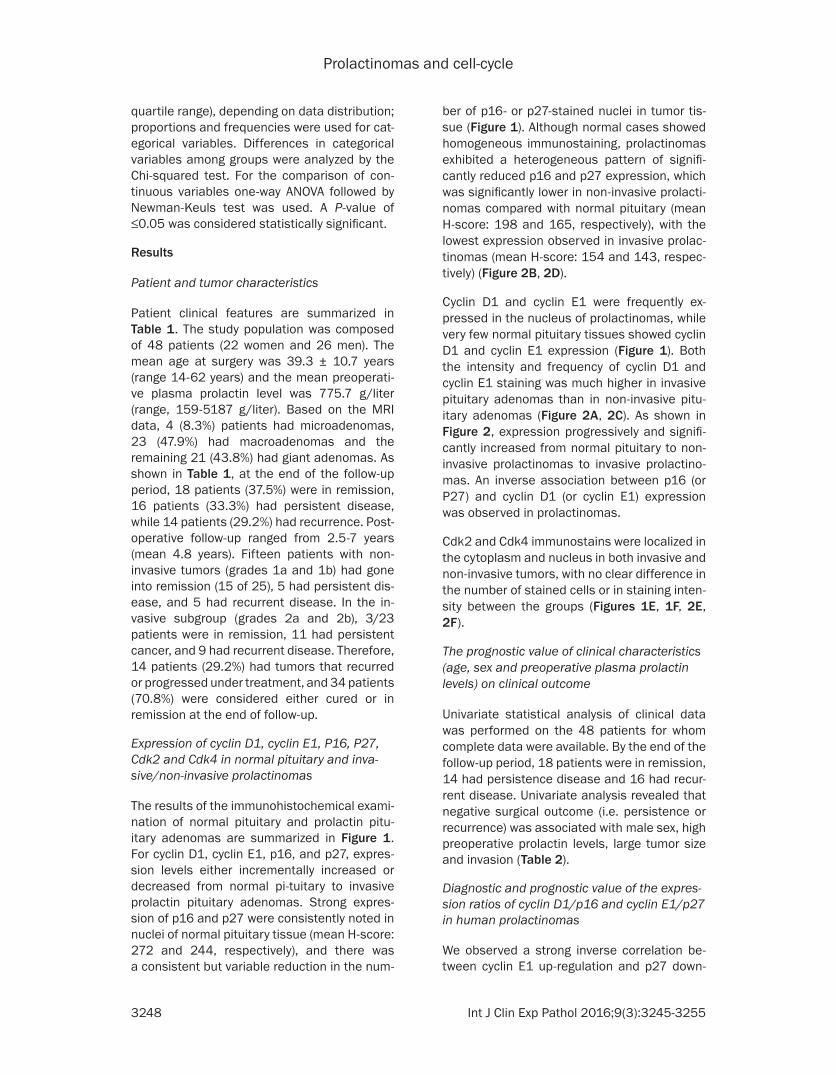
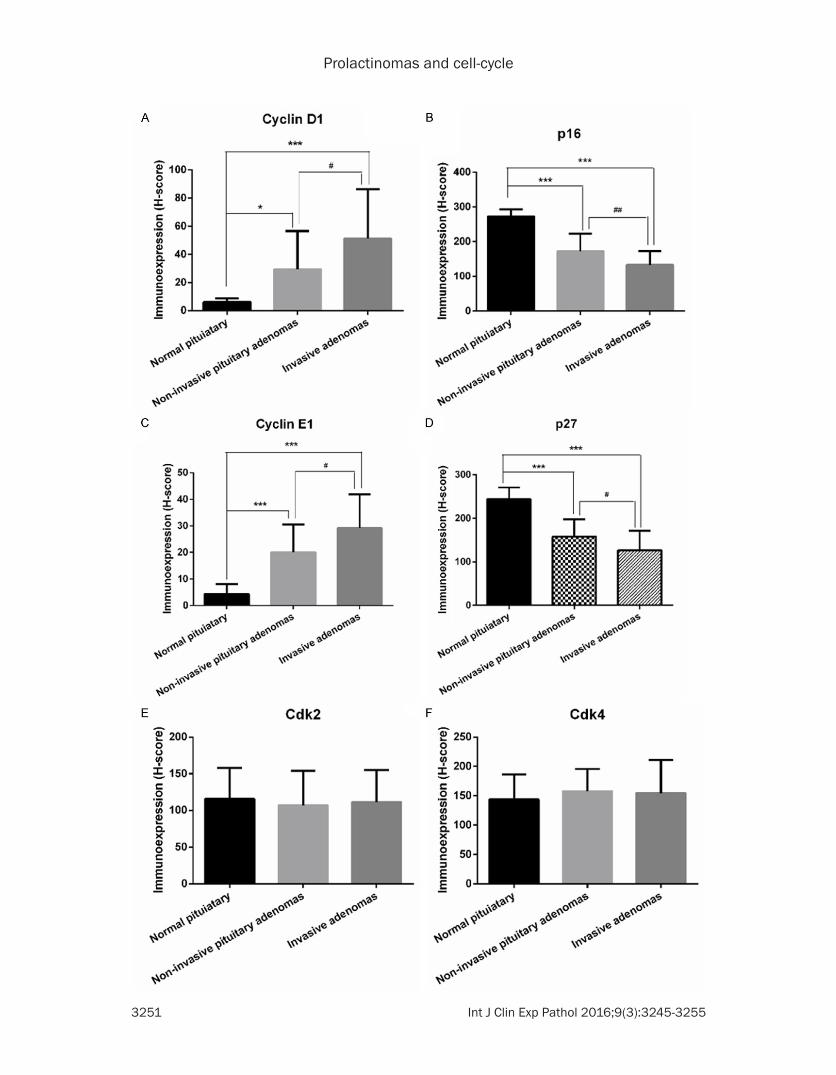
The results of the immunohistochemical exami-nation of normal pituitary and prolactin pitu-itary adenomas are summarized in Figure 1. For cyclin D1, cyclin E1, p16, and p27, expres-sion levels either incrementally increased or decreased from normal pi-tuitary to invasive prolactin pituitary adenomas. Strong expres-sion of p16 and p27 were consistently noted in nuclei of normal pituitary tissue (mean H-score: 272 and 244, respectively), and there was a consistent but variable reduction in the num-
ber of p16- or p27-stained nuclei in tumor tis-sue (Figure 1). Although normal cases showed homogeneous immunostaining, prolactinomas exhibited a heterogeneous pattern of signifi-cantly reduced p16 and p27 expression, which was significantly lower in non-invasive prolacti-nomas compared with normal pituitary (mean H-score: 198 and 165, respectively), with the lowest expression observed in invasive prolac-tinomas (mean H-score: 154 and 143, respec-tively) (Figure 2B, 2D).
Cyclin D1 and cyclin E1 were frequently ex- pressed in the nucleus of prolactinomas, while very few normal pituitary tissues showed cyclin D1 and cyclin E1 expression (Figure 1). Both the intensity and frequency of cyclin D1 and cyclin E1 staining was much higher in invasive pituitary adenomas than in non-invasive pitu-itary adenomas (Figure 2A, 2C). As shown in Figure 2, expression progressively and signifi-cantly increased from normal pituitary to non-invasive prolactinomas to invasive prolactino-mas. An inverse association between p16 (or P27) and cyclin D1 (or cyclin E1) expression was observed in prolactinomas.
Cdk2 and Cdk4 immunostains were localized in the cytoplasm and nucleus in both invasive and non-invasive tumors, with no clear difference in the number of stained cells or in staining inten-sity between the groups (Figures 1E, 1F, 2E, 2F).
The prognostic value of clinical characteristics (age, sex and preoperative plasma prolactin levels) on clinical outcome
Univariate statistical analysis of clinical data was performed on the 48 patients for whom complete data were available. By the end of the follow-up period, 18 patients were in remission, 14 had persistence disease and 16 had recur-rent disease. Univariate analysis revealed that negative surgical outcome (i.e. persistence or recurrence) was associated with male sex, high preoperative prolactin levels, large tumor size and invasion (Table 2).
Diagnostic and prognostic value of the expres-sion ratios of cyclin D1/p16 and cyclin E1/p27 in human prolactinomas
We observed a strong inverse correlation be- tween cyclin E1 up-regulation and p27 down-

Prolactinomas and cell-cycle
3249 Int J Clin Exp Pathol 2016;9(3):3245-3255
Prolactinomas and cell-cycle
3250 Int J Clin Exp Pathol 2016;9(3):3245-3255
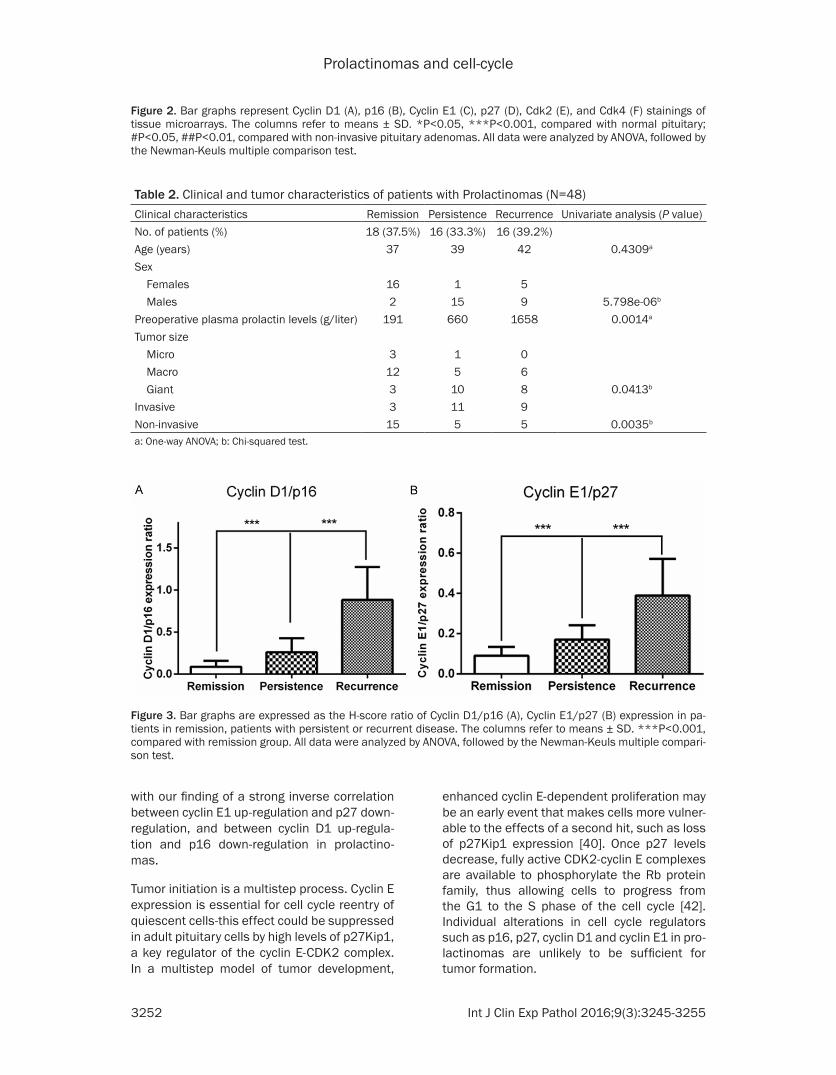
regulation, and between cyclin D1 up-regula-tion and p16 down-regulation in prolactinomas. Figure 3 shows the strong association between p21, p27, cyclin D1 and cyclin E1 expression and clinicopathological features. The expres-sion ratios of cyclin D1/p16 and cyclin E1/p27 were significantly higher in patients with recur-rence than in patients with persistent disease, with the lowest ratio observed in patients in remission (Figure 3A, 3B, P<0.001). No differ-ences were observed in the H-score of Cdk2 and Cdk4 expression in patients in remission, patients with persistent or recurrent disease (Figure 4A, 4B).
Discussion
The present study demonstrates that invasive prolactinomas have significantly higher cyclin D1 and cyclin E1, and lower p16 and p27 expression than normal pituitary or non-inva-sive prolactinomas. We found an inverse asso-ciation between p16 (or p27) and cyclin D1 (or cyclin E1) expression and these expression ratios were significantly positively correlated with clinically inferior outcomes.
Accurate prognostic factors are necessary for robust clinical decision making, yet current prognostic markers of prolactinomas have lim-ited accuracy. Biomarkers such as cell cycle regulators have the potential to unveil unique biological features thereby identifying patients who are at high risk for adverse outcomes [33].
CDKs and their activating subunits, the cyclins, are essential for proper cell cycle regulation in eukaryotes. Under the regulation of promoters (Cyclin D and E) and CDK inhibitors (p16, p21, p27, p57), CDKs control cell cycle progression through G1/S-phase to DNA synthesis. Shariat et al. have shown the prognostic significance of cell cycle regulators in accurately predicting disease-free survival (DFS) and cancer-specific survival (CSS) in urothelial bladder cancer pa- tients [16]. Youssef et al. demonstrated the util-ity of a panel of cell cycle regulators in predict-ing oncologic outcome in patients with squa-mous cell carcinoma of the bladder [34].
Transgenic overexpression or disruption of cell cycle-associated genes has led to pituitary tumor formation in several animal models [35].
Moreover, aberrant cell proliferation underlies pituitary trophic disorders that lead to pituitary hypoplasia, hyperplasia, or adenoma formation [36, 37]. Pituitary tumors acquire genetic and epigenetic alterations in oncogenes and tumor suppressors that result in unrestrained prolif-eration, aberrant neuroendocrine regulatory signals and a disrupted humoral milieu, which is mediated directly or indirectly by dysregulat-ed cyclin dependent kinases (CDKs) [38, 39].
In the pituitary, the cell cycle progresses much slower than in skin or digestive tract cells; most adult pro-opiomelanocortin (POMC) cells have exited the cell cycle, do not express detectable cyclin E1, and express p27Kip1 [25]. These findings are consistent with our finding that cyclin D1 and cyclin E1 are almost undetect-able in the normal pituitary, while p16 and p27 expression levels are relatively high. However, increased expression of cyclins A, B, D and E has been reported in pituitary adenomas rela-tive to normal pituitary tissue and this change was related to tumor size and re-growth. There is evidence supporting a primary role for cyclin E in cancer, suggesting that deregulation of this protein may play a crucial role in altering G1/S transition, thereby contributing to tumor devel-opment. In Cushing’s disease cyclin E is prefer-entially increased in corticotroph adenomas, which may be related to low nuclear p27 levels in these tumors [22]. G1/S transition is the key checkpoint for cell cycle progression and is controlled by cyclin D (in complex with CDK4/6) and cyclin E (in complex with CDK2); cyclin D-CDK4 and cyclin E-CDK2 could be controlled by p16 and p27, respectively [40].
Mice with pituitary-specific cyclin E overexpre- ssion (driven by the POMC promoter) develop pituitary hyperplasia and adenomas. When crossed with p27Kip1 knockout mice, these mice have an increased incidence of pituitary tumors, suggesting synergy between cyclin E and p27Kip1 [41]. These results are consistent
Figure 1. Representative images of p16, p27, Cyclin D1, Cyclin E1, Cdk2, and Cdk4 staining on a tissue microarray: Normal pituitary with low Cyclin D1, high p16, low Cyclin E1, high p27 and moderate Cdk2/Cdk4 expression levels (left panel). Non-invasive pituitary adenomas with moderate Cyclin D1, p16, Cyclin E1, p27, Cdk2 and Cdk4 expres-sion levels (middle panel). Invasive pituitary adenomas with high Cyclin D1, low p16, high Cyclin E1, low p27 and moderate Cdk2/Cdk4 expression levels (right panel). The inset shows the 400x magnification of the original images.
Prolactinomas and cell-cycle
3251 Int J Clin Exp Pathol 2016;9(3):3245-3255
Prolactinomas and cell-cycle
3252 Int J Clin Exp Pathol 2016;9(3):3245-3255
with our finding of a strong inverse correlation between cyclin E1 up-regulation and p27 down-regulation, and between cyclin D1 up-regula-tion and p16 down-regulation in prolactino- mas.
Tumor initiation is a multistep process. Cyclin E expression is essential for cell cycle reentry of quiescent cells-this effect could be suppressed in adult pituitary cells by high levels of p27Kip1, a key regulator of the cyclin E-CDK2 complex. In a multistep model of tumor development,
enhanced cyclin E-dependent proliferation may be an early event that makes cells more vulner-able to the effects of a second hit, such as loss of p27Kip1 expression [40]. Once p27 levels decrease, fully active CDK2-cyclin E complexes are available to phosphorylate the Rb protein family, thus allowing cells to progress from the G1 to the S phase of the cell cycle [42]. Individual alterations in cell cycle regulators such as p16, p27, cyclin D1 and cyclin E1 in pro-lactinomas are unlikely to be sufficient for tumor formation.
Figure 2. Bar graphs represent Cyclin D1 (A), p16 (B), Cyclin E1 (C), p27 (D), Cdk2 (E), and Cdk4 (F) stainings of tissue microarrays. The columns refer to means ± SD. *P<0.05, ***P<0.001, compared with normal pituitary; #P<0.05, ##P<0.01, compared with non-invasive pituitary adenomas. All data were analyzed by ANOVA, followed by the Newman-Keuls multiple comparison test.
Table 2. Clinical and tumor characteristics of patients with Prolactinomas (N=48)Clinical characteristics Remission Persistence Recurrence Univariate analysis (P value)No. of patients (%) 18 (37.5%) 16 (33.3%) 16 (39.2%)Age (years) 37 39 42 0.4309a
Sex Females 16 1 5 Males 2 15 9 5.798e-06b
Preoperative plasma prolactin levels (g/liter) 191 660 1658 0.0014a
Tumor size Micro 3 1 0 Macro 12 5 6 Giant 3 10 8 0.0413b
Invasive 3 11 9Non-invasive 15 5 5 0.0035b
a: One-way ANOVA; b: Chi-squared test.
Figure 3. Bar graphs are expressed as the H-score ratio of Cyclin D1/p16 (A), Cyclin E1/p27 (B) expression in pa-tients in remission, patients with persistent or recurrent disease. The columns refer to means ± SD. ***P<0.001, compared with remission group. All data were analyzed by ANOVA, followed by the Newman-Keuls multiple compari-son test.

Prolactinomas and cell-cycle
3253 Int J Clin Exp Pathol 2016;9(3):3245-3255
Here, we show that a concomitant increase in cyclin D1/cyclin E1 and decrease in p16/p27 is associated with clinically inferior outcomes. The ratios of cyclin E1 to p27, and cyclin D1 to p27 levels may thus regulate proliferation and act as gatekeeper to protect cells from re-entering the cell cycle. These results highlight the role of cell cycle regulators and the impact of their deregulation in prolactinomas. To our knowledge ours is the first study to evaluate the association of p16 and cyclin D1, and p21 and cyclin E1 expression with oncologic outcomes in patients with prolactinomas.
Acknowledgements
This work were supported by the National High Technology Research and Development Pro- gram of China (863 Program) (2014AA020610), the Research Special Fund For Public Welfare Industry of Health (201402008), National Na- tural Science Foundation of China (31200796), Beijing Nova Program (Z131102000413024).
Disclosure of conflict of interest
None.
Address correspondence to: Yazhuo Zhang, Beijing Neurosurgical Institute, Beijing Tiantan Hospital Affiliated to Capital Medical University, 6 Tiantan Xili, Dongcheng District, Beijing 10050, China. Tel: +86-10-67096765; E-mail: [email protected]
References
[1] Daly AF, Rixhon M, Adam C, Dempegioti A, Tichomirowa MA, Beckers A. High prevalence
of pituitary adenomas: a cross-sectional stu- dy in the province of Liege. Belgium. J Clin Endocrinol Metab 2006; 91: 4769-75.
[2] Fernandez A, Karavitaki N, Wass JA. Prevalen-ce of pituitary adenomas: a community-based, cross-sectional study in Banbury. Clin Endo- crinol (Oxf) 2010; 72: 377-82.
[3] Glezer A, Bronstein MD. Prolactinomas. Endocrinol Metab Clin North Am 2015; 44: 71-8.
[4] Ben-Jonathan N, LaPensee CR, LaPensee E. What can we learn from rodents about prolac-tin in humans? Endocr Rev 2008; 29: 1-41.
[5] Meij BP, Lopes MB, Ellegala DB, Alden TD, Laws ER Jr. The long-term significance of mi-croscopic dural invasion in 354 patients with pituitary adenomas treated with transsphenoi-dal surgery. J Neurosurg 2002; 96: 195-208.
[6] Figarella-Branger D, Trouillas J. The new WHO classification of human pituitary tumors: com-ments. Acta Neuropathol 2006; 111: 71-2.
[7] Grossman AB. The 2004 World Health Org- anization classification of pituitary tumors: is it clinically helpful? Acta Neuropathol 2006; 111: 76-7.
[8] Melmed S. Pathogenesis of pituitary tumors. Nat Rev Endocrinol 2011; 7: 257-66.
[9] Hsu DW, Hakim F, Biller BM, Monte S, Zervas NT, Klibanski A, Hedley-Whyte ET. Significance of proliferating cell nuclear antigen index in predicting pituitary adenoma recurrence. J Neurosurg 1993; 78: 753-61.
[10] Jaffrain-Rea ML, Stefano D, Minniti G, Esposito V, Bultrini A, Ferretti E, Santoro A, Faticanti Scucchi L, Gulino A, Cantore G. A critical reap-praisal of MIB-1 labelling index significance in a large series of pituitary tumours: secreting versus non-secreting adenomas. Endocr Relat Cancer 2002; 9: 103-13.
[11] Knosp E, Kitz K, Perneczky A. Proliferation ac-tivity in pituitary adenomas: measurement
Figure 4. The bar graphs are expressed as the H-score of Cdk2 and Cdk4 expression in patients in remission, patients with persistent or recurrent disease. The columns refer to means ± SD. All data were analyzed by ANOVA, followed by the Newman-Keuls multiple comparison test.
Prolactinomas and cell-cycle
3254 Int J Clin Exp Pathol 2016;9(3):3245-3255
by monoclonal antibody Ki-67. Neurosurgery 1989; 25: 927-30.
[12] Levy A, Hall L, Yeudall WA, Lightman SL. p53 gene mutations in pituitary adenomas: rare events. Clin Endocrinol (Oxf) 1994; 41: 809-14.
[13] Daniel L, Trouillas J, Renaud W, Chevallier P, Gouvernet J, Rougon G, Figarella-Branger D. Polysialylated-neural cell adhesion molecule expression in rat pituitary transplantable tu-mors (spontaneous mammotropic transplant-able tumor in Wistar-Furth rats) is related to growth rate and malignancy. Cancer Res 2000; 60: 80-5.
[14] Trouillas J, Daniel L, Guigard MP, Tong S, Gouvernet J, Jouanneau E, Jan M, Perrin G, Fischer G, Tabarin A, Rougon G, Figarella-Branger D. Polysialylated neural cell adhesion molecules expressed in human pituitary tu-mors and related to extrasellar invasion. J Neurosurg 2003; 98: 1084-93.
[15] Zhang X, Horwitz GA, Heaney AP, Nakashima M, Prezant TR, Bronstein MD, Melmed S. Pi-tuitary tumor transforming gene (PTTG) expres-sion in pituitary adenomas. J Clin Endocrinol Metab 1999; 84: 761-7.
[16] Shariat SF, Chade DC, Karakiewicz PI, Ashfaq R, Isbarn H, Fradet Y, Bastian PJ, Nielsen ME, Capitanio U, Jeldres C, Montorsi F, Lerner SP, Sagalowsky AI, Cote RJ, Lotan Y. Combination of multiple molecular markers can improve prognostication in patients with locally ad-vanced and lymph node positive bladder can-cer. J Urol 2010; 183: 68-75.
[17] Chatterjee SJ, Datar R, Youssefzadeh D, George B, Goebell PJ, Stein JP, Young L, Shi SR, Gee C, Groshen S, Skinner DG, Cote RJ. Combined effects of p53, p21, and pRb ex-pression in the progression of bladder transi-tional cell carcinoma. J Clin Oncol 2004; 22: 1007-13.
[18] Zini L, Porpiglia F, Fassnacht M. Contemporary management of adrenocortical carcinoma. Eur Urol 2011; 60: 1055-65.
[19] Duregon E, Volante M, Giorcelli J, Terzolo M, Lalli E, Papotti M. Diagnostic and prognostic role of steroidogenic factor 1 in adrenocortical carcinoma: a validation study focusing on clini-cal and pathologic correlates. Hum Pathol 2013; 44: 822-8.
[20] Jonat W, Arnold N. Is the Ki-67 labelling index ready for clinical use? Ann Oncol 2011; 22: 500-2.
[21] Malumbres M, Barbacid M. To cycle or not to cycle: a critical decision in cancer. Nature Rev Cancer 2001; 1: 222-31.
[22] Jordan S, Lidhar K, Korbonits M, Lowe DG, Grossman AB. Cyclin D and cyclin E expression
in normal and adenomatous pituitary. Eur J Endocrinol 2000; 143: R1-R6.
[23] Hibberts NA, Simpson DJ, Bicknell JE, Broome JC, Hoban PR, Clayton RN, Farrell WE. Analysis of cyclin D1 (CCND1) allelic imbalance and overexpression in sporadic human pituitary tu-mors. Clin Cancer Res 1999; 5: 2133-9.
[24] Harbour JW, Dean DC. The Rb/E2F pathway: expanding roles and emerging paradigms. Genes Devel 2000; 14: 2393-409.
[25] Bilodeau S, Roussel-Gervais A, Drouin J. Distinct developmental roles of cell cycle in-hibitors p57Kip2 and p27Kip1 distinguish pi-tuitary progenitor cell cycle exit from cell cycle reentry of differentiated cells. Mol Cell Biol 2009; 29: 1895-908.
[26] Yoshino A, Katayama Y, Ogino A, Watanabe T, Yachi K, Ohta T, Komine C, Yokoyama T, Fukushima T. Promoter hypermethylation pro-file of cell cycle regulator genes in pituitary ad-enomas. J Neurooncol 2007; 83: 153-62.
[27] Tani Y, Inoshita N, Sugiyama T, Kato M, Yamada S, Shichiri M, Hirata Y. Upregulation of CDKN2A and suppression of cyclin D1 gene expressions in ACTH-secreting pituitary adenomas. Eur J Endocrinol 2010; 163: 523-9.
[28] Muşat M, Morris DG, Korbonits M, Grossman AB. Cyclins and their related proteins in pi- tuitary tumourigenesis. Mol Cell Endocrinol 2010; 326: 25-9.
[29] Gürlek A, Karavitaki N, Ansorge O, Wass JA. What are the markers of aggressiveness in prolactinomas? Changes in cell biology, extra-cellular matrix components, angiogenesis and genetics. Eur J Endocrinol 2007; 156: 143-53.
[30] Knosp E, Steiner E, Kitz K, Matula C. Pituitary adenomas with invasion of the cavernous si-nus space: a magnetic resonance imaging classification compared with surgical findings. Neurosurgery 1993; 33: 610-7.
[31] Raverot G, Vasiljevic A, Jouanneau E, Trouillas J. A prognostic clinicopathologic classification of pituitary endocrine tumors. Endocrinol Me-tab Clin North Am 2015; 44: 11-8.
[32] Delgrange E, Sassolas G, Perrin G, Jan M, Trouillas J. Clinical and histological correla-tions in prolactinomas, with special reference to bromocriptine resistance. Acta Neurochi- rurgica 2005; 147: 751-8.
[33] Karam JA, Lotan Y, Karakiewicz PI, Ashfaq R, Sagalowsky AI, Roehrborn CG, Shariat SF. Use of combined apoptosis biomarkers for predic-tion of bladder cancer recurrence and mortali-ty after radical cystectomy. Lancet Oncol 2007; 8: 128-36.
[34] Youssef R, Kapur P, Shariat SF, Arendt T, Kabbani W, Mosbah A, Abol-Enein H, Ghoneim M, Lotan Y. Prognostic value of apoptotic mark-

Prolactinomas and cell-cycle
3255 Int J Clin Exp Pathol 2016;9(3):3245-3255
ers in squamous cell carcinoma of the urinary bladder. BJU Int 2012; 110: 961-6.
[35] Melmed S. Pituitary tumors. Endocrinol Metab Clin North Am 2015; 44: 1-9.
[36] Farrell WE. Pituitary tumours: Findings from whole genome analyses. Endocr Relat Cancer 2006; 13: 707-16.
[37] Scheithauer BW, Gaffey TA, Lloyd RV, Sebo TJ, Kovacs KT, Horvath E, Yapicier O, Young WF Jr, Meyer FB, Kuroki T, Riehle DL, Laws ER Jr. Pathobiology of pituitary adenomas and carci-nomas. Neurosurgery 2006; 59: 341-53.
[38] Moons DS, Jirawatnotai S, Parlow AF, Gibori G, Kineman RD, Kiyokawa H. Pituitary hypoplasia and lactotroph dysfunction in mice deficient for cyclin-dependent kinase-4. Endocrinology 2002; 143: 3001-8.
[39] Melmed S. Acromegaly pathogenesis and treatment. J Clin Invest 2009; 119: 3189-202.
[40] Galderisi U, Jori FP, Giordano A. Cell cycle regu-lation and neural differentiation. Oncogene 2003; 22: 5208-19
[41] Roussel-Gervais A, Bilodeau S, Vallette S, Berthelet F, Lacroix A, Figarella-Branger D, Brue T, Drouin J. Cooperation between cyclin E and p27 (Kip1) in pituitary tumorigenesis. Mol Endocrinol 2010; 24: 1835-45.
[42] Reed SI. Ratchets and clocks: The cell cycle, ubiquitylation and protein turnover. Nat Rev Mol Cell Biol 2003; 4: 855-864.